PERFORMANCE AUDIT Mt. Lebanon School District · objective, and methodology section of the...
20
PERFORMANCE AUDIT ____________ Mt. Lebanon School District Allegheny County, Pennsylvania ____________ August 2019
Transcript of PERFORMANCE AUDIT Mt. Lebanon School District · objective, and methodology section of the...

PERFORMANCE AUDIT ____________
Mt. Lebanon School District
Allegheny County, Pennsylvania ____________
August 2019

Dr. Timothy J. Steinhauer, Superintendent Mt. Lebanon School District 7 Horsman Drive Pittsburgh, Pennsylvania 15228
Mr. Michael Riemer, Board President Mt. Lebanon School District 7 Horsman Drive Pittsburgh, Pennsylvania 15228
Dear Dr. Steinhauer and Mr. Riemer: We have conducted a performance audit of the Mt. Lebanon School District (District) for the period July 1, 2013 through June 30, 2017, except as otherwise indicated in the audit scope, objective, and methodology section of the report. We evaluated the District’s performance in the following areas as further described in the appendix of this report:
• Social Security Reimbursements • Health Service Reimbursements • Bus Driver Requirements
We also evaluated the application of best practices in the area of school safety. Due to the
sensitive nature of this issue and the need for the results of this review to be confidential, we did not include the results in this report. However, we communicated the results of our review of school safety to District officials, the Pennsylvania Department of Education, and other appropriate officials as deemed necessary.
The audit was conducted pursuant to Sections 402 and 403 of The Fiscal Code (72 P.S. §§
402 and 403), and in accordance with the Government Auditing Standards issued by the Comptroller General of the United States. Those standards require that we plan and perform the audit to obtain sufficient, appropriate evidence to provide a reasonable basis for our findings and conclusions based on our audit objectives. We believe that the evidence obtained provides a reasonable basis for our findings and conclusions based on our audit objectives. Our audit found that the District performed adequately in the areas listed above.

Dr. Timothy J. Steinhauer Mr. Michael Riemer Page 2
We appreciate the District’s cooperation during the course of the audit.
Sincerely,
Eugene A. DePasquale August 9, 2019 Auditor General cc: MT. LEBANON SCHOOL DISTRICT Board of School Directors

Table of Contents Page Background Information ............................................................................................................. 1 Finding ........................................................................................................................................ 11 Status of Prior Audit Findings and Observations ....................................................................... 12 Appendix: Audit Scope, Objectives, and Methodology ............................................................. 13 Distribution List .......................................................................................................................... 16

Mt. Lebanon School District Performance Audit 1
Background Information
School Characteristics 2018-19 School YearA
County Allegheny Total Square Miles 6.6 Number of School
Buildings 10
Total Teachers 378 Total Full or Part-Time Support Staff 226
Total Administrators 25 Total Enrollment for Most Recent School
Year 5,496
Intermediate Unit Number 3
District Vo-Tech School
Parkway West Career &
Technology Center A - Source: Information provided by the District administration and is unaudited.
Mission StatementA
To Provide the Best Education Possible for Each and Every Student.
Financial Information The following pages contain financial information about the Mt. Lebanon School District (District) obtained from annual financial data reported to the Pennsylvania Department of Education (PDE) and available on the PDE’s public website. This information was not audited and is presented for informational purposes only.
Note: General Fund Balance is comprised of the District’s Committed, Assigned and Unassigned Fund Balances.
Note: Total Debt is comprised of Short-Term Borrowing, General Obligation Bonds, Authority Building Obligations, Other Long-Term Debt, Other Post-Employment Benefits, Compensated Absences and Net Pension Liability.
11.8 12.510.3 10.1
13.0
$0
$5
$10
$15
2013 2014 2015 2016 2017
Mill
ions
General Fund BalanceFor Year End June 30
General Fund Balance
130.7162.0 157.6
300.2 322.1
$0
$100
$200
$300
$400
2013 2014 2015 2016 2017
MIL
LIO
NS
TOTAL DEBTF O R Y E A R E N D J U N E 3 0
Debt

Mt. Lebanon School District Performance Audit 2
Financial Information Continued
81.2
83.3 87
.9
90.4 98
.9
79.1 82.7 90
.2
90.0 96
.1
$0
$20
$40
$60
$80
$100
$120
2013 2014 2015 2016 2017
MIL
LIO
NS
Total Revenue and Expenditures
For Year End June 30
Total Revenue Total Expenditures
377.7
640.0
381.4313.2
425.9
$0
$100
$200
$300
$400
$500
$600
$700
2013 2014 2015 2016 2017Th
ousa
nds
Total Charter Tuition Payments
For Year End June 30
Total Charter Tuition Payments
2013 2014 2015 2016 2017$0
$10
$20
$30
$40
$50
$60
$70
$80
65.7
66.5 69
.9
71.4 74
.4
15.0
16.3
17.6
18.0 23
.5
0.5
0.5
0.4
0.5
1.0
0.0
0.0
0.0
0.4
0.0
MIL
LIO
NS
Revenue By SourceFor Year End June 30
Local Revenue State Revenue Federal Revenue Other Revenue
Mt. Lebanon School District Performance Audit 3
Academic Information The graphs on the following pages present School Performance Profile (SPP) scores, Pennsylvania System of School Assessment (PSSA) scores, Keystone Exam results, and 4-Year Cohort Graduation Rates for the District obtained from the PDE’s data files for the 2014-15, 2015-16 and 2016-17 school years.1 These scores are provided in the District’s audit report for informational purposes only, and they were not audited by our Department. Please note that if one of the District’s schools did not receive a score in a particular category and year presented below, the school will not be listed in the corresponding graph.2 Finally, benchmarks noted in the following graphs represent the statewide average of all public school buildings in the Commonwealth that received a score in the category and year noted.3 What is a SPP score? A SPP score serves as a benchmark for schools to reflect on successes, achievements, and yearly growth. The PDE issues a SPP score using a 0-100 scale for all school buildings in the Commonwealth annually, which is calculated based on standardized testing (i.e., PSSA and Keystone exam scores), student improvement, advance course offerings, and attendance and graduation rates. Generally speaking, a SPP score of 70 or above is considered to be a passing rate. The PDE started issuing a SPP score for all public school buildings beginning with the 2012-13 school year. For the 2014-15 school year, the PDE only issued SPP scores for high schools taking the Keystone Exams as scores for elementary and middle schools were put on hold due to changes with PSSA testing.4 The PDE resumed issuing a SPP score for all schools for the 2015-16 school year. What is the Keystone Exam? The Keystone Exam measures student proficiency at the end of specific courses, such as Algebra I, Literature, and Biology. The Keystone Exam was intended to be a graduation requirement starting with the class of 2017, but that requirement has been put on hold until the 2020-21 school year.5 In the meantime, the exam is still given as a standardized assessment and results are included in the calculation of SPP scores. The Keystone Exam is scored using the same four performance levels as the PSSAs, and the goal is to score Proficient or Advanced for each course requiring the test. 1 The PDE is the sole source of academic data presented in this report. All academic data was obtained from the PDE’s publically available website. 2 The PDE’s data does not provide any further information regarding the reason a score was not published for a specific school. However, readers can refer to the PDE’s website for general information regarding the issuance of academic scores. 3 Statewide averages were calculated by our Department based on individual school building scores for all public schools in the Commonwealth, including district schools, charters schools, and cyber charter schools. 4 According to the PDE, SPP scores for elementary and middle schools were put on hold for the 2014-15 school year due to the state’s major overhaul of the PSSA exams to align with PA Core standards and an unprecedented drop in public schools’ PSSA scores that year. Since PSSA scores are an important factor in the SPP calculation, the state decided not to use PSSA scores to calculate a SPP score for elementary and middle schools for the 2014-15 school year. Only high schools using the Keystone Exam as the standardized testing component received a SPP score. 5 Act 39 of 2018, effective July 1, 2018, amended the Public School Code to further delay the use of Keystone Exams as a graduation requirement for an additional year until the 2020-21 school year. See 24 P.S. § 1-121(b)(1).

Mt. Lebanon School District Performance Audit 4
What is the PSSA? The PSSA is an annual, standardized test given across the Commonwealth to students in grades 3 through 8 in core subject areas, including English and Math. The PSSAs help Pennsylvania meet federal and state requirements and inform instructional practices, as well as provide educators, stakeholders, and policymakers with important information about the state’s students and schools. The 2014-15 school year marked the first year that PSSA testing was aligned to the more rigorous PA Core Standards.6 The state uses a grading system with scoring ranges that place an individual student’s performance into one of four performance levels: Below Basic, Basic, Proficient, and Advanced. The state’s goal is for students to score Proficient or Advanced on the exam in each subject area. What is a 4-Year Cohort Graduation Rate? The PDE collects enrollment and graduate data for all Pennsylvania public schools, which is used to calculate graduation rates. Cohort graduation rates are a calculation of the percentage of students who have graduated with a regular high school diploma within a designated number of years since the student first entered high school. The rate is determined for a cohort of students who have all entered high school for the first time during the same school year. Data specific to the 4-year cohort graduation rate is presented in the graph.7
6 The PDE has determined that PSSA scores issued beginning with the 2014-15 school year and after are not comparable to prior years due to restructuring of the exam. 7 The PDE also calculates 5-year and 6-year cohort graduation rates. Please visit the PDE’s website for additional information: http://www.education.pa.gov/Data-and-Statistics/Pages/Cohort-Graduation-Rate-.aspx.

Mt. Lebanon School District Performance Audit 5
2014-15 Academic Data School Scores Compared to Statewide Averages
Mt. Lebanon Senior High School, 92.0
0 10 20 30 40 50 60 70 80 90 100
2014-15 SPP Scores
Statewide Average - 70.8
Mt. Lebanon Senior High School, 91.4
Mt. Lebanon Senior High School, 95.7
0 10 20 30 40 50 60 70 80 90 100
Math
English
2014-15 Keystone % Advanced or Proficient
Statewide English Average - 70.7 Statewide Math Average - 62.4
Mt. Lebanon School District Average, 90.3
Mt. Lebanon School District Average, 72.6
Foster Elementary School, 89.6
Foster Elementary School, 70.8
Hoover Elementary School, 89.6
Hoover Elementary School, 78.2
Howe Elementary School, 91.8
Howe Elementary School, 73.9
Jefferson Elementary School, 89.7
Jefferson Elementary School, 68.8
Jefferson Middle School, 92.9
Jefferson Middle School, 64.8
Lincoln Elementary School, 90.9
Lincoln Elementary School, 77.5
Markham Elementary School, 95.9
Markham Elementary School, 84.6
Mellon Middle School, 89.0
Mellon Middle School, 59.7
Washington Elementary School, 83.1
Washington Elementary School, 75.1
0 10 20 30 40 50 60 70 80 90 100
English
Math
2014-15 PSSA % Advanced or Proficient
Statewide English Average - 60.0 Statewide Math Average - 41.2

Mt. Lebanon School District Performance Audit 6
2015-16 Academic Data School Scores Compared to Statewide Averages
Washington Elementary School, 81.6Mt Lebanon Senior High School, 92.7Mellon Middle School, 77.5Markham Elementary School, 82.6Lincoln Elementary School, 80.5Jefferson Middle School, 85.7Jefferson Elementary School, 93.4Howe Elementary School, 84.3Hoover Elementary School, 82.5Foster Elementary School, 84.3Mt. Lebanon School District Average, 84.5
0 10 20 30 40 50 60 70 80 90 100
2015-16 SPP Scores
Statewide Average - 69.5
Mt. Lebanon Senior High School, 92.0
Mt. Lebanon Senior High School, 94.5
0 10 20 30 40 50 60 70 80 90 100
Math
English
2015-16 Keystone % Advanced or Proficient
Statewide English Average - 74.6 Statewide Math Average - 65.4
Mt. Lebanon School District Performance Audit 7
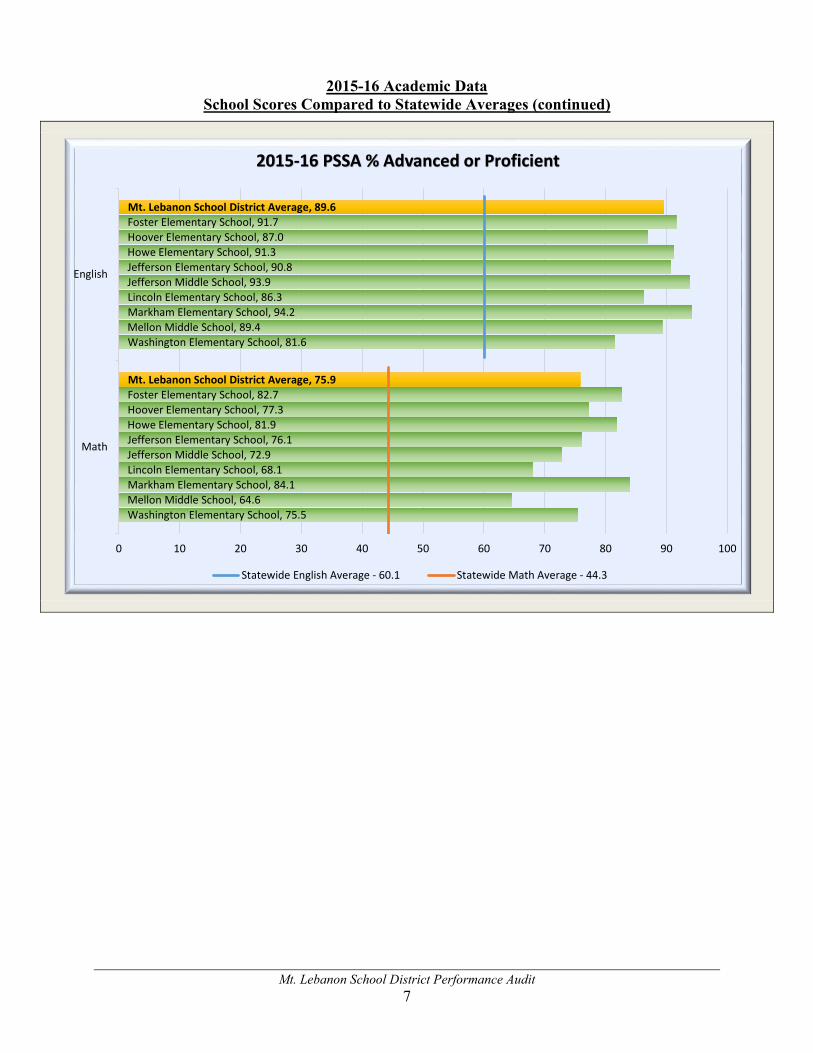
2015-16 Academic Data School Scores Compared to Statewide Averages (continued)
Mt. Lebanon School District Average, 89.6
Mt. Lebanon School District Average, 75.9
Foster Elementary School, 91.7
Foster Elementary School, 82.7
Hoover Elementary School, 87.0
Hoover Elementary School, 77.3
Howe Elementary School, 91.3
Howe Elementary School, 81.9
Jefferson Elementary School, 90.8
Jefferson Elementary School, 76.1
Jefferson Middle School, 93.9
Jefferson Middle School, 72.9
Lincoln Elementary School, 86.3
Lincoln Elementary School, 68.1
Markham Elementary School, 94.2
Markham Elementary School, 84.1
Mellon Middle School, 89.4
Mellon Middle School, 64.6
Washington Elementary School, 81.6
Washington Elementary School, 75.5
0 10 20 30 40 50 60 70 80 90 100
English
Math
2015-16 PSSA % Advanced or Proficient
Statewide English Average - 60.1 Statewide Math Average - 44.3

Mt. Lebanon School District Performance Audit 8
2016-17 Academic Data School Scores Compared to Statewide Averages
Washington Elementary School2, 96.4Mt Lebanon Senior High School, 97.7Mellon Middle School, 72.9Markham Elementary School, 99.3Lincoln Elementary School, 81.6Jefferson Middle School, 94.4Jefferson Elementary School, 96.5Howe Elementary School, 97.3Hoover Elementary School, 87.4Foster Elementary School, 94.5Mt. Lebanon School District Average, 91.8
0 10 20 30 40 50 60 70 80 90 100
2016-17 SPP Scores
Statewide Average - 69.0
Mt. Lebanon Senior High School, 93.3
Mt. Lebanon Senior High School, 96.2
0 10 20 30 40 50 60 70 80 90 100
Math
English
2016-17 Keystone % Advanced or Proficient
Statewide English Average - 69.8 Statewide Math Average - 61.8

Mt. Lebanon School District Performance Audit 9
2016-17 Academic Data School Scores Compared to Statewide Averages (continued)
Mt. Lebanon School District Average, 91.9
Mt. Lebanon School District Average, 78.9
Foster Elementary School, 94.9
Foster Elementary School, 83.8
Hoover Elementary School, 87.7
Hoover Elementary School, 78.1
Howe Elementary School, 95.6
Howe Elementary School, 82.7
Jefferson Elementary School, 90.8
Jefferson Elementary School, 79.3
Jefferson Middle School, 94.9
Jefferson Middle School, 74.0
Lincoln Elementary School, 89.7
Lincoln Elementary School, 75.7
Markham Elementary School, 95.4
Markham Elementary School, 90.7
Mellon Middle School, 87.2
Mellon Middle School, 63.7
Washington Elementary School, 91.0
Washington Elementary School, 82.5
0 10 20 30 40 50 60 70 80 90 100
English
Math
2016-17 PSSA % Advanced or Proficient
Statewide English Average - 61.5 Statewide Math Average - 44.6

Mt. Lebanon School District Performance Audit 10
Graduation Data District Graduation Rates Compared to Statewide Averages
99.1
98.9
97.9
88.4
88.8
89.5
0102030405060708090
100
2014-15 2015-16 2016-17
4-Year Cohort Graduation Rates
District Graduation Rate Statewide Average

Mt. Lebanon School District Performance Audit 11
Finding
or the audited period, our audit of the Mt. Lebanon School District resulted in no findings.
F

Mt. Lebanon School District Performance Audit 12
Status of Prior Audit Findings and Observations
ur prior Limited Procedures Engagement of the Mt. Lebanon School District resulted in no findings or observations.
O

Mt. Lebanon School District Performance Audit 13
Appendix: Audit Scope, Objectives, and Methodology School performance audits allow the Pennsylvania Department of the Auditor General to determine whether state funds, including school subsidies, are being used according to the purposes and guidelines that govern the use of those funds. Additionally, our audits examine the appropriateness of certain administrative and operational practices at each local education agency (LEA). The results of these audits are shared with LEA management, the Governor, the Pennsylvania Department of Education (PDE), and other concerned entities. Our audit, conducted under authority of Sections 402 and 403 of The Fiscal Code,8 is not a substitute for the local annual financial audit required by the Public School Code of 1949, as amended. We conducted our audit in accordance with Government Auditing Standards issued by the Comptroller General of the United States. Those standards require that we plan and perform the audit to obtain sufficient, appropriate evidence to provide a reasonable basis for our findings and conclusions based on our audit objectives. We believe that the evidence obtained provides a reasonable basis for our findings and conclusions based on our audit. Scope Overall, our audit covered the period July 1, 2013 through June 30, 2017. In addition, the scope of each individual audit objective is detailed on the next page. The Mt. Lebanon School District’s (District) management is responsible for establishing and maintaining effective internal controls to provide reasonable assurance that the District is in compliance with certain relevant state laws, regulations, contracts, and administrative procedures (relevant requirements).9 In conducting our audit, we obtained an understanding of the District’s internal controls, including any information technology controls, if applicable, that we considered to be significant within the context of our audit objectives. We assessed whether those controls were properly designed and implemented. Any deficiencies in internal controls that were identified during the conduct of our audit and determined to be significant within the context of our audit objectives are included in this report.
8 72 P.S. §§ 402 and 403. 9 Internal controls are processes designed by management to provide reasonable assurance of achieving objectives in areas such as: effectiveness and efficiency of operations; relevance and reliability of operational and financial information; and compliance with certain relevant state laws, regulations, contracts, and administrative procedures.

Mt. Lebanon School District Performance Audit 14
Objectives/Methodology In order to properly plan our audit and to guide us in selecting objectives, we reviewed pertinent laws and regulations, board meeting minutes, academic performance data, annual financial reports, annual budgets, new or amended policies and procedures, and the independent audit report of the District’s basic financial statements for the fiscal years July 1, 2013 through June 30, 2017. We also determined if the District had key personnel or software vendor changes since the prior audit. Performance audits draw conclusions based on an evaluation of sufficient, appropriate evidence. Evidence is measured against criteria, such as laws, regulations, third-party studies, and best business practices. Our audit focused on the District’s efficiency and effectiveness in the following areas:
Social Security Reimbursements Heath Service Reimbursements Bus Driver Requirements School Safety
As we conducted our audit procedures, we sought to determine answers to the following questions, which served as our audit objectives: Did the District correctly calculate and report Social Security and Medicare wages to the
PDE for District employees, and did the District receive the correct amount of reimbursement from the PDE?10
o To address this objective, we reviewed the Social Security and Medicare data
reported to the PDE by the District for the 2014-15, 2015-16, and 2016-17 school years to determine the accuracy of the District’s reimbursement subsidy. Reconciliations were performed of the PDE-2105 and quarterly IRS-941 forms by verifying the reported data against District payroll reports. The aid ratio for the District was confirmed, and we verified the total revenue received from the Commonwealth to the confirmations of the PDE’s Office of Comptroller Operations. Our review of this objective did not disclose any reportable issues.
Did the District accurately report health service expenses to the PDE? Did the District
receive the correct amount of reimbursement for these health service expenses?11
o To address this objective, we reviewed the health service applications and reconciled the District’s Average Daily Membership (ADM) to the ADM reported on the School Health Annual Reimbursement Request System (SHARRS) reports for the 2013-14, 2014-15, 2015-16, and 2016-17 school years. The total revenue received for health services was verified to the requested amounts on the
10 See 24 P.S. § 8329. 11 See 24 P.S. § 25-2505.1(a), (b), (b.1), and (c).

Mt. Lebanon School District Performance Audit 15
SHARRS reports. Our review of this objective did not disclose any reportable issues.
Did the District ensure that bus drivers transporting District students had the required
driver’s license, physical exam, training, background checks, and clearances12 as outlined in applicable laws?13 Also, did the District have written policies and procedures governing the hiring of new bus drivers that would, when followed, provide reasonable assurance of compliance with applicable laws?
o To address this objective, we randomly selected 10 of the 30 bus drivers transporting District students as of May 14, 2019.14 We reviewed documentation to ensure the District complied with the requirements for bus drivers. We also determined if the District had written policies and procedures governing the hiring of bus drivers and if those procedures, when followed, ensure compliance with bus driver hiring requirements. Our review did not disclose any reportable issues.
Did the District take actions to ensure it provided a safe school environment?15
o To address this objective, we reviewed a variety of documentation including,
safety plans, training schedules, anti-bullying policies, and after action reports, to assess whether the District had implemented basic safety practices.16 Due to the sensitive nature of school safety, the results of our review of this objective area are not described in our audit report. The results of our review of school safety were shared with District officials, the PDE, and other appropriate agencies deemed necessary.
12 Auditors reviewed the required state, federal, and child abuse background clearances from the most reliable sources available, including the FBI, the Pennsylvania State Police, and the Department of Human Services. However, due to the sensitive and confidential nature of this information, we were unable to assess the reliability or completeness of these third-party databases. 13 24 P.S. § 1-111, 23 Pa.C.S. § 6344(a.1), 24 P.S. § 2070.1a et seq., 75 Pa.C.S. §§ 1508.1 and 1509, and 22 Pa. Code Chapter 8. 14 While representative selection is a required factor of audit sampling methodologies, audit sampling methodology was not applied to achieve this test objective; accordingly, the results of this audit procedure are not, and should not be, projected to the population. 15 24 P.S. § 13-1301-A et seq. 16 Basic safety practices evaluated were building security, bullying prevention, visitor procedures, risk and vulnerability assessments, and preparedness.

Mt. Lebanon School District Performance Audit 16
Distribution List This report was initially distributed to the Superintendent of the District, the Board of School Directors, and the following stakeholders: The Honorable Tom W. Wolf Governor Commonwealth of Pennsylvania Harrisburg, PA 17120 The Honorable Pedro A. Rivera Secretary of Education 1010 Harristown Building #2 333 Market Street Harrisburg, PA 17126 The Honorable Joe Torsella State Treasurer Room 129 - Finance Building Harrisburg, PA 17120 Mrs. Danielle Mariano Director Bureau of Budget and Fiscal Management Pennsylvania Department of Education 4th Floor, 333 Market Street Harrisburg, PA 17126 Dr. David Wazeter Research Manager Pennsylvania State Education Association 400 North Third Street - Box 1724 Harrisburg, PA 17105 Mr. Nathan Mains Executive Director Pennsylvania School Boards Association 400 Bent Creek Boulevard Mechanicsburg, PA 17050 This report is a matter of public record and is available online at www.PaAuditor.gov. Media questions about the report can be directed to the Pennsylvania Department of the Auditor General, Office of Communications, 229 Finance Building, Harrisburg, PA 17120; via email to: [email protected].
![[Add your district’s info here]](https://static.fdocuments.net/doc/165x107/56815b95550346895dc99895/add-your-districts-info-here-56b8be62d2a11.jpg)