Performance Assessment Task Cereal Grade 7 Common Core State
18
© 2012 Noyce Foundation Performance Assessment Task Cereal Grade 7 This task challenges a student to use knowledge of proportional reasoning and to use equivalent ratios. A student must be able to convert between representations of rational numbers to compare and order ratios. A student must be able to interpret quantities and the associated units to interpret values in the context of a real-world problem. Common Core State Standards Math - Content Standards Ratios and Proportional Relationships Analyze proportional relationships and use them to solve real-world and mathematical problems. 7.RP.1 Compute unit rates associated with ratios of fractions, including ratios of lengths, areas, and other quantities measured in like or different units. For example, if a person walks ½ mile in each ¼ hour, compute the unit rate as the complex fraction ½ / ¼ miles per hour, equivalently 2 miles per hour. 7.RP.2 Recognize and represent proportional relationships between quantities. a. Decide whether two quantities are in a proportional relationship, e.g., by testing for equivalent ratios in a table or graphing on a coordinate plane and observing whether the graph is a straight line through the origin. b. Identify the constant of proportionality (unit rate) in tables, graphs, equations, diagrams, and verbal descriptions of proportional relationships. c. Represent proportional relationships by equations. For example, if total cost t is proportional to the number n of items purchased at a constant price p, the relationships between the total cost and the number of items can be expressed as t=pn. 7.RP.3 Use proportional relationships to solve multistep ratio and percent problems. Examples: simple interest, tax, markups and markdowns, gratuities and commissions, fees, percent increase and decrease, percent error. The Number System Apply and extend previous understandings of operations with fractions to add, subtract, multiply, and divide rational numbers. 7.NS.2 Apply and extend previous understandings of multiplication and division and of fractions to multiply and divide rational numbers. a. Understand that multiplication is extended from fractions to rational numbers by requiring that operations continue to satisfy the properties of operations, particularly the distributive property, leading to products such as (-1)(-1) = 1 and the rules for multiplying signed numbers. Interpret products of rational numbers by describing real-world contexts. b. Understand that integers can be divided, provided that the divisor is not zero, and every quotient of inters (with non-zero divisor) is a rational number. If p and q are integers, then -(p/q) = -/(-q). Interpret quotients of rational numbers by describing real-world contexts. 7.NS.3 Solve real-world and mathematical problems involving the four operations with rational numbers. Common Core State Standards Math – Standards of Mathematical Practice MP.2 Reason abstractly and quantitatively. Mathematically proficient students make sense of quantities and their relationships in problem situations. They bring two complementary abilities to bear on problems involving quantitative relationships: the ability to decontextualize – to abstract a given situation and represent it symbolically and manipulate the representing symbols as if they have a life of their own, without necessarily attending to their referents – and the ability to contextualize, to pause as needed during the manipulation process in order to probe into the referents for the symbols involved. Quantitative
Transcript of Performance Assessment Task Cereal Grade 7 Common Core State

© 2012 Noyce Foundation
Performance Assessment Task Cereal
Grade 7 This task challenges a student to use knowledge of proportional reasoning and to use equivalent ratios. A student must be able to convert between representations of rational numbers to compare and order ratios. A student must be able to interpret quantities and the associated units to interpret values in the context of a real-world problem.
Common Core State Standards Math - Content Standards Ratios and Proportional Relationships Analyze proportional relationships and use them to solve real-world and mathematical problems. 7.RP.1 Compute unit rates associated with ratios of fractions, including ratios of lengths, areas, and other quantities measured in like or different units. For example, if a person walks ½ mile in each ¼ hour, compute the unit rate as the complex fraction ½ / ¼ miles per hour, equivalently 2 miles per hour. 7.RP.2 Recognize and represent proportional relationships between quantities.
a. Decide whether two quantities are in a proportional relationship, e.g., by testing for equivalent ratios in a table or graphing on a coordinate plane and observing whether the graph is a straight line through the origin.
b. Identify the constant of proportionality (unit rate) in tables, graphs, equations, diagrams, and verbal descriptions of proportional relationships.
c. Represent proportional relationships by equations. For example, if total cost t is proportional to the number n of items purchased at a constant price p, the relationships between the total cost and the number of items can be expressed as t=pn.
7.RP.3 Use proportional relationships to solve multistep ratio and percent problems. Examples: simple interest, tax, markups and markdowns, gratuities and commissions, fees, percent increase and decrease, percent error. The Number System Apply and extend previous understandings of operations with fractions to add, subtract, multiply, and divide rational numbers. 7.NS.2 Apply and extend previous understandings of multiplication and division and of fractions to multiply and divide rational numbers.
a. Understand that multiplication is extended from fractions to rational numbers by requiring that operations continue to satisfy the properties of operations, particularly the distributive property, leading to products such as (-1)(-1) = 1 and the rules for multiplying signed numbers. Interpret products of rational numbers by describing real-world contexts.
b. Understand that integers can be divided, provided that the divisor is not zero, and every quotient of inters (with non-zero divisor) is a rational number. If p and q are integers, then -(p/q) = -/(-q). Interpret quotients of rational numbers by describing real-world contexts.
7.NS.3 Solve real-world and mathematical problems involving the four operations with rational numbers.
Common Core State Standards Math – Standards of Mathematical Practice
MP.2 Reason abstractly and quantitatively. Mathematically proficient students make sense of quantities and their relationships in problem situations. They bring two complementary abilities to bear on problems involving quantitative relationships: the ability to decontextualize – to abstract a given situation and represent it symbolically and manipulate the representing symbols as if they have a life of their own, without necessarily attending to their referents – and the ability to contextualize, to pause as needed during the manipulation process in order to probe into the referents for the symbols involved. Quantitative

© 2012 Noyce Foundation
reasoning entails habits of creating a coherent representation of the problem at hand; considering the units involved; attending to the meaning of quantities, not just how to compute them; and knowing and flexibly using different properties of operations and objects. MP.4 Model with mathematics. Mathematically proficient students can apply the mathematics they know to solve problems arising in everyday life, society, and the workplace. In early grades this might be as simple as writing an addition equation to describe a situation. In middle grades, a student might apply proportional reasoning to plan a school event or analyze a problem in the community. By high school, a student might use geometry to solve a design problem or use a function to describe how one quantity of interest depends on another. Mathematically proficient students who can apply what they know are comfortable making assumptions and approximations to simplify a complicated situation, realizing that these may need revision later. They are able to identify important quantities in a practical situation and map their relationships using such tools as diagrams, two-way tables, graphs, flowcharts, and formulas. They can analyze those relationships mathematically to draw conclusions. They routinely interpret their mathematical results in the context of the situation and reflect on whether the results make sense, possibly improving the model if it has not served its purpose.
Assessment Results
This task was developed by the Mathematics Assessment Resource Service and administered as part of a national, normed math assessment. For comparison purposes, teachers may be interested in the results of the national assessment, including the total points possible for the task, the number of core points, and the percent of students that scored at standard on the task. Related materials, including the scoring rubric, student work, and discussions of student understandings and misconceptions on the task, are included in the task packet.
Grade Level Year Total Points Core Points % At Standard 7 2004 7 3 45%

Seventh Grade – 2004 pg. 17

Seventh Grade – 2004 pg. 18

Seventh Grade – 2004 pg. 19
Looking at Student Work – Cereal This question was quite challenging for many students, so looking at types of strategies used by successful students may clarify some of the teaching implications for this problem and how to look at ratio/rate problems.
Student A solves the problem in the most typical fashion, the approach anticipated by the rubric. The student uses a proportion to solve for the number of grams of cereal in part one. The student divides the denominator into the numerator to compare the size of the ratios using decimal values.
Student A
(c) Noyce Foundation 2012

Seventh Grade – 2004 pg. 20
Another way to think about comparing the ratios is to make the amount of cereal the same for both brands. This involves having students pick a common denominator to represent the amount of the cereal. In reality, the decimal comparison is also a way of using a power of ten for the common denominator. Student B takes the approach of finding the amount of protein for 100 grams of both brands of cereal.
Student B
Finding common denominators for 45 and 100, leads to many choices. Student C changes to 900ths, Student D changes to 225ths, and Student E uses 4500ths. What is different about what each student understands about fractions to arrive at these choices of denominators?
Teacher Notes about the mathematics:
(c) Noyce Foundation 2012

Seventh Grade – 2004 pg. 21
Student C
(c) Noyce Foundation 2012

Seventh Grade – 2004 pg. 22
Notice how Student D also uses equivalent fractions to solve for part one instead of using a proportion.
Student D
Student E
(c) Noyce Foundation 2012

Seventh Grade – 2004 pg. 23
Instead of comparing ratios by making the denominator the same, it is possible to make the amount of protein (or numerators) the same. Students F and Student G think about how much cereal is needed to yield 9 grams of protein. Student G has some great thinking, but struggles with how to formalize the mathematical notations and symbols.
Student F
Student G
(c) Noyce Foundation 2012

Seventh Grade – 2004 pg. 24
Student H compares how much cereal is needed to make 3 grams of protein. Student H
The most common procedure for students was to divide the numerator into the denominator, but not to understand how that calculation helps to solve the problem. Students I and J understand in some way that this makes a unit ratio, how much cereal is needed to make 1 gram of protein. Student I is articulate about the unit ratio. Student J understands the inverse relationship between the sizes of the number to the amount of protein.
(c) Noyce Foundation 2012

Seventh Grade – 2004 pg. 25
Student I
Student J
(c) Noyce Foundation 2012

Seventh Grade – 2004 pg. 26
Student K recognizes that 12 and 100 share a common factor of 4 and uses this information to solve for the amount of cereal in part 1 by making a ratio table.
Student K
Some students do not understand the multiplicative relationship involved in this problem. Student L tries to subtract equal quantities in part 1. Student M tries to add a constant to make things come out evenly.
Student L
Student M
(c) Noyce Foundation 2012

Seventh Grade – 2004 pg. 27
While Student N appears to not be using the multiplicative relationship in part one because he is using subtraction, Student N’s strategy works because he is really thinking about taking away 1/4ths from different size wholes.
Student N
(c) Noyce Foundation 2012

Seventh Grade – 2004 pg. 28
Sometimes students learn procedures, but remember them imprecisely or don’t understand the reasoning behind the procedure. Student O uses cross-multiplying to compare the ratios in part 2. While this procedure can work, Student O does not put the results in the correct order so makes an incorrect comparison. What understanding does the student need about common denominators to help her interpret these results?
Student O
Teacher Notes:
(c) Noyce Foundation 2012
Seventh Grade – 2004 pg. 29
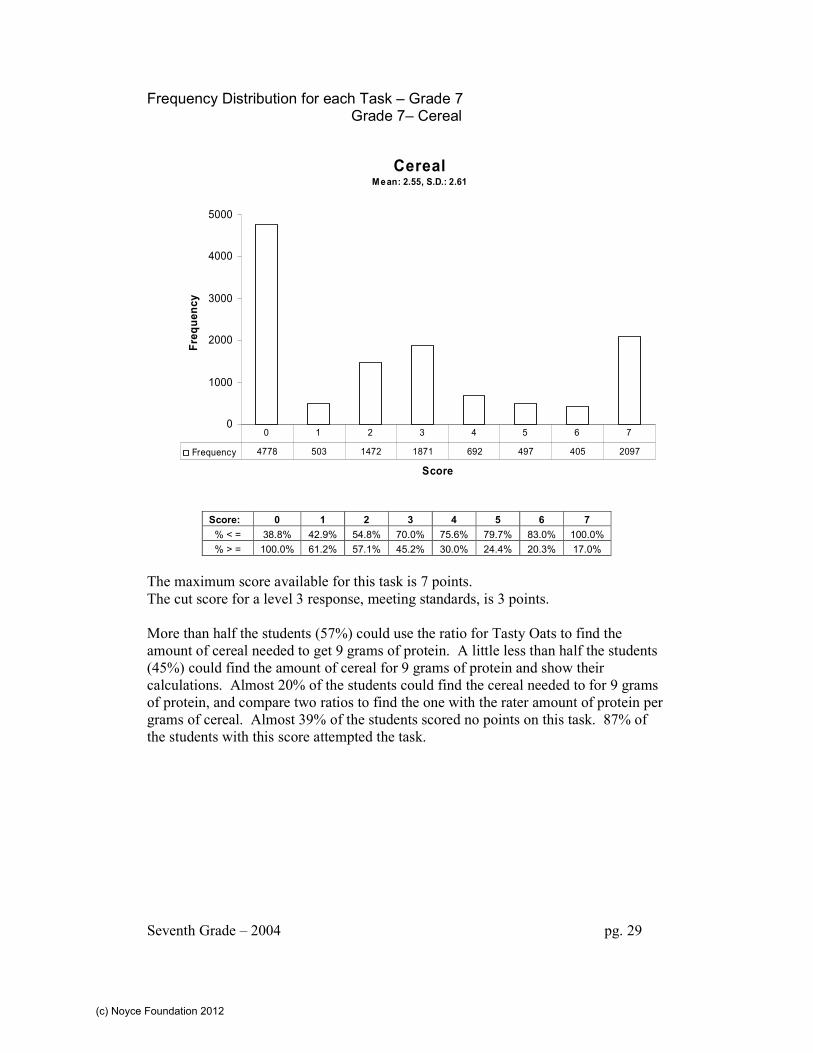
Frequency Distribution for each Task – Grade 7 Grade 7– Cereal
CerealMean: 2.55, S.D.: 2.61
0
1000
2000
3000
4000
5000
Score
Freq
uenc
y
Frequency 4778 503 1472 1871 692 497 405 2097
0 1 2 3 4 5 6 7
Score: 0 1 2 3 4 5 6 7 % < = 38.8% 42.9% 54.8% 70.0% 75.6% 79.7% 83.0% 100.0% % > = 100.0% 61.2% 57.1% 45.2% 30.0% 24.4% 20.3% 17.0%
The maximum score available for this task is 7 points. The cut score for a level 3 response, meeting standards, is 3 points. More than half the students (57%) could use the ratio for Tasty Oats to find the amount of cereal needed to get 9 grams of protein. A little less than half the students (45%) could find the amount of cereal for 9 grams of protein and show their calculations. Almost 20% of the students could find the cereal needed to for 9 grams of protein, and compare two ratios to find the one with the rater amount of protein per grams of cereal. Almost 39% of the students scored no points on this task. 87% of the students with this score attempted the task.
(c) Noyce Foundation 2012

Seventh Grade – 2004 pg. 30
Cereal Points Understandings Misunderstandings
0 87% of the students with this score attempted the problem.
Some students do not understand the multiplicative relationship in using proportions. Students tried to subtract or add to convert from different amounts of cereal and protein. The most common wrong answers in part 1 were 97, 11, and 3.
2 Students could correctly give an answer to the amount of Tasty Oats cereal needed to get 9 grams of protein.
Students did not show their work or left out too many steps to understand what they were thinking.
3 Students could find the amount of cereal for 9 grams of protein and document their process.
Students did not know how to compare ratios. Many students made correct calculations, but couldn’t correctly interpret their results.
4 Students with this score, generally could compare the ratios of protein in part and explain their ideas, but miscalculated the amount of cereal in part 1. Students who could solve part 2 used a variety of strategies including finding common denominators, using a unit rate, making the amount of protein constant and comparing the denominators.
The most common error in part 4 was to divide the numerator into the denominator. While this could lead to a correct answer, most students could not use the inverse relationship between the size of this answer and the cereal with the most protein. To use this strategy successfully, students needed to see that one gram of protein for Tasty Oats equaled 8.333 grams of cereal and one gram of protein for Cornbits required 9 grams of cereal. This may be a problem of dimensional analysis, failure of being able to apply a label to the results of calculation.
7 Students could adjust portions of cereal to achieve a given amount of protein. Students could successfully compare ratios using decimals or other strategies.
Other common errors in part 4, were to use imprecise calculations like trying to compare 90 grams of cereal to 100 grams of cereal. An important concept for working with ratios is to make either the numerator or denominator equal, so the other quantity can be compared.
(c) Noyce Foundation 2012

Seventh Grade – 2004 pg. 31
Based on teacher observations, this is what seventh graders know and are able to do: • Turn fractions into percents • Find units per gram • Find lowest common denominator • Turn information into accurate ratios in fraction form
Areas of difficulty for seventh graders, seventh graders struggled with: • Understanding ratios in a meaningful way • How to use ratios to make a comparison • Understanding how division effects labels in ratio problems
Questions for Reflection on Cereal:
• What opportunities have your students had with fractions this year? • When learning about fractions, do you think they understand the importance of
equivalent fractions and how they are useful to solving problems? • Do your students know how to find common denominators? • What experiences have your students had with solving ratio/proportion
problems? Have they used ratio tables? • Have they been introduced to the idea of unit rates? How could this idea help
them solve this task? • Do students understand that to make a comparison they need to make part of
the ratios constant? Look at your student work. How many of your students could successfully find the solution to part one by: Setting up a proportion?
Using a ratio table?
Finding 1/4 of 12 and 100?
Finding a unit rate?
Other?
In part 2, how many of your students were unsuccessful? Of those, how many calculated 8.333 and 9 but couldn’t correctly label them to make the correct comparison? How many used imprecise comparisons like 90 grams of cereal to 100 grams? How many did not attempt this part of the task? In part 2, look at the successful students. How many of them, tried: Decimals Dividing
numerator by denominator
Percents Finding common denominators
Finding common numerators
Unit Rate
Other
(c) Noyce Foundation 2012

Seventh Grade – 2004 pg. 32
After examining different strategies to achieve the correct solution, what might you want to remember when you work on this unit next year? What are some specific things you would want to emphasize more or add to the unit?
Teacher Notes:
Implications for Instruction: Students need to more practice with proportions in everyday situations. Students need a deeper understanding of equivalency to help them understand how to set up and compare ratios and proportions. Students need practice determining what is the best buy or most and least in a comparison. Perhaps more work on a unit value would make the comparisons easier or more attention to labels might help them to use dimensional analysis to compare items. Students should be given enough problems with ratios to know and choose the most convenient strategy among several: finding the unit rate, using equivalent fractions, making the numerators the same so denominators can be compared, or making the denominators the same so the numerators can be compared. It is not enough for students at this grade level to learn an algorithm, but there must be sense making about why it works and how it should be applied within a context. To often students only experiences with an idea are in mathematical exercises, devoid of context, where the purpose of the procedure is unclear or lacking from using the process. Students should have classroom discussions about strategies and be able to generalize that to make a comparison one of the two quantities must be made the same so that the other values can be compared. Too often students don’t have the opportunity to work with applications for procedures and therefore can’t call up the appropriate tool in a problem-solving situation.
Teacher Notes:
(c) Noyce Foundation 2012