
Performance and flow fields of a supersonic axial turbine ...
35
Performance and flow fields of a supersonic axial turbine at off-design conditions Aki Grönman, Teemu Turunen-Saaresti, Pekka Röyttä, Ahti Jaatinen and Jari Backman Institute of Energy, Lappeenranta University of Technology, P.O. Box 20, FI-53851, Lappeenranta, Finland Abstract The increasing demand of energy efficiency and the utilization of small-scale energy sources require efficient, small, and versatile turbines. Supersonic turbines have a high power density and therefore small size and fewer stages than the subsonic ones. However, the performance of a supersonic turbine can decrease rapidly when operating at off-design conditions. This raises a need for the improvement of the turbine off- design performance. In this paper, a supersonic axial flow turbine is studied numerically to find the causes of efficiency decrement. This paper presents the most throughout study so far about the reasons that lead to the decreased off-design performance with supersonic axial flow turbines and explains the loss sources individually for the stator and the rotor. Three operating conditions are studied, and it is suggested that at the lower than design pressure ratios, the shock losses of the stator decrease while simultaneously the stator secondary losses increase. The high positive incidence at the
Transcript of Performance and flow fields of a supersonic axial turbine ...

Performance and flow fields of a supersonic axial turbine at off-design
conditions
Aki Grönman, Teemu Turunen-Saaresti, Pekka Röyttä, Ahti Jaatinen and Jari Backman
Institute of Energy, Lappeenranta University of Technology, P.O. Box 20, FI-53851,
Lappeenranta, Finland
Abstract
The increasing demand of energy efficiency and the utilization of small-scale energy
sources require efficient, small, and versatile turbines. Supersonic turbines have a high
power density and therefore small size and fewer stages than the subsonic ones.
However, the performance of a supersonic turbine can decrease rapidly when operating
at off-design conditions. This raises a need for the improvement of the turbine off-
design performance. In this paper, a supersonic axial flow turbine is studied numerically
to find the causes of efficiency decrement. This paper presents the most throughout
study so far about the reasons that lead to the decreased off-design performance with
supersonic axial flow turbines and explains the loss sources individually for the stator
and the rotor. Three operating conditions are studied, and it is suggested that at the
lower than design pressure ratios, the shock losses of the stator decrease while
simultaneously the stator secondary losses increase. The high positive incidence at the
lowest modelled pressure ratio, mass flow, and rotational speed caused a significant
decrease in the rotor and stage performance. This highlights the importance of incidence
even in shock driven supersonic turbine flows.
Keywords: axial turbine, supersonic flow, off-design
1 INTRODUCTION
Supersonic turbines are especially suitable for designs where the space is limited and
high power is desired. Supersonic turbine stages are traditionally used in the turbo
pumps of space rockets and in the Curtis stage of industrial steam turbines. Another
application where a supersonic turbine is utilized is the Organic Rankine Cycle (ORC).
ORC power plants are used when utilizing low temperature heat sources, such as
geothermal heat or engine exhaust gases.
Supersonic turbines are usually impulse turbines, and they often operate at lower
efficiencies than subsonic turbines with the same power. Efficiencies lower than 50%
have been reported by Dorney et al. [1], [2]. One reason for the lower efficiencies is the
occurrence of shock waves. Dorney et al. [1] compared two turbine geometries and
concluded that one reason for the efficiency difference was the strength of the shock
system in the stator and rotor.

Yasa et al. [3] performed a study with a transonic axial turbine at several operating
conditions. They found a high increase (4° to 19°) in the positive rotor incidence when
the rotational speed was decreased from the nominal speed to the lowest rotational
speed. Their results also indicate that at the lowest rotational speed (with an
approximately constant pressure ratio), the effect of the incidence becomes more
important than the stator shocks. When the pressure ratio was altered and the rotational
speed was kept constant, the increase in the pressure ratio led to more oblique stator
trailing edge shock waves. The increasing pressure ratio turned the rotor incidence more
positive. With the highest pressure ratio, the loss coefficients of Kacker and Okapuu [4]
predicted high rotor trailing edge shock losses causing a drop in the predicted
efficiency. Yasa et al. [3] also noted that this phenomenon was not detected in the
efficiency measurements, probably because of the total pressure measurement
uncertainty.
In a paper of Woinowsky-Krieger et al. [5], a transonic axial turbine was studied both
experimentally and numerically. They found out that the turbine efficiency was only
mildly affected by the pressure ratio. However, the efficiency had a relatively drastic
drop at speeds below the design speed. They also found an 8 degree increase in the rotor
blade incidence as the turbine speed changed from nominal 100 to 80 per cent.

Snedden et al. [6] studied a single-stage turbine at off-design conditions. Even though
the investigated turbine was a low speed machine, the results are relevant to the current
study since the effect of the incidence seems to be generally similar with or without
shock waves in the flow. They found that the relative rotor outlet flow angle was lower
than the design value at the shroud and higher than the design value at the hub when the
rotor incidence was -5°. The importance of the incidence for the turbine performance
seems to be high, and a high positive incidence can lead to increased total pressure
losses as indicated in a paper of Jouini et al. [7]. They discussed that an incidence
approaching +10° can lead to increased suction surface boundary layer loss production
on the forward part of the blade, thus causing a small rise in the losses. A study of
Benner et al. [8] also indicates that the losses that are caused by a positive incidence
start increasing rapidly approximately at the incidence of +10°.
In a paper of Munday et al. [9], supersonic nozzles were studied at design and off-
design Mach numbers. The shock waves were shown to be turned more towards the
downstream direction when the exit Mach number was increased.
Despite these studies, there is still a clear lack of data that would cover also supersonic
axial turbines that operate at off-design conditions and give detailed information about
the flow fields and causes of efficiency decrement. In a previous study by the authors

with a supersonic axial flow turbine [10], the effect of changing the axial gap between
the stator and the rotor was examined. It was found that the efficiency of the turbine
decreases rapidly when the turbine is operated below the design mass flow, pressure
ratio, and rotational speed. The efficiency drop with the increasing axial gap was also
found to be steeper at the off-design conditions. The main reason for the decreasing
efficiency was concluded to be the increase of total pressure losses at the axial gap. It
was also mentioned that the increased total pressure losses originate most likely from
the increased mixing of shock waves, stator wakes, and the main flow.
The main objective of this study is to find the reasons that cause the degradation of the
turbine efficiency at off-design conditions. The paper starts with an introduction where
the objective of the study is derived. This is followed by the presentation of the used
research methods in Chapter 2. After this, the studied geometries are presented in
Chapter 3. The fourth chapter presents the results that can be divided into two topics. In
the beginning, a transonic turbine cascade is modelled in order to demonstrate the
reliability of the used code with shock waves. In the second part of Chapter 4, the
performance and flow fields of a supersonic turbine stage are studied at three different
operating conditions. This is followed by conclusions and recommendations in Chapter
5.

2 NUMERICAL METHODS
The Navier-Stokes solver Finflo is used in this study. Finflo is a multi-grid solver
developed at the Aalto University School of Science and Technology. It employs the
finite-volume method for spatial discretization and uses a constant specific heat capacity
at constant pressure. The fluid is modelled as an ideal gas, but Finflo is capable of
modelling real gases as well.
Finflo uses Roe's flux difference splitting method [11] for inviscid fluxes and the thin-
layer approximation for viscous fluxes. For the primary flow variables and conservative
turbulent variables, the MUSCL type approach is used, and the DDADI-factorization
[12] is used to integrate the discretized equations in time.
In this study, Chien's k- turbulence model [13] without wall functions has been used.
More detailed information about Finflo and different numerical methods can be found
e.g. in a paper of Siikonen [14].
The interface between the stator and rotor is modelled with the frozen rotor approach
which causes error in the modelling of the stator-rotor interaction. This can be
considered to be the biggest drawback of the chosen modelling approach, but the

relative differences between different operating conditions can be expected to be
comparable. This method has been successfully used and validated with Finflo in
rotating machines previously in compressor studies by Jaatinen [15]. The code has also
been successfully used in supersonic real gas flow modelling on an ORC-turbine nozzle
e.g. by Harinck et al. [16], Turunen-Saaresti et al. [17], and Hoffren et al. [18].
Uniform momentum and total enthalpy distributions are defined as the inlet boundary
conditions, and a constant static pressure distribution is used as the boundary condition
at the outlet. These inlet and outlet boundary conditions are used both in the transonic
cascade and supersonic turbine stage modelling. Where applicable, periodic boundaries
are used in the transonic cascade and cyclic boundaries in the turbine stage modelling.
The used boundary conditions in the modelling of the transonic cascade are presented in
Fig. 1. Additionally, the hub and shroud walls are modelled as solid walls.
During the simulations, the convergence is monitored by following the mass flow
difference between the inlet and outlet, and the mass flow is considered to be converged
when the difference is stabilized. In addition, the L2-norms of density, momentum in all
three directions, and energy residuals are important convergence parameters.

3 STUDIED GEOMETRIES
3.1 Transonic Turbine Cascade
To demonstrate the reliability of the current study, a transonic turbine cascade is
modelled with Finflo. This modelling gives information about the code performance
with shock waves. The results are compared with the baseline geometry of a transonic
turbine profile presented by Sonoda et al. [19].
The numerical model has two calculation blocks - one block covers one flow channel.
The total number of cells is 3014656 and the non-dimensional wall distance is less than
unity in the blade surfaces. The grid is structured with rectangular elements. In the
rounded trailing edge, there is a total of 2048 cells.
Three measurement planes are defined for this study and are schematically shown in
Fig. 1. More detailed information about the setup is available in Sonoda et al. [19].
Measurement planes SS-37 and SS-02 are perpendicular to the suction surface, starting
from suction surface positions x/cax=0.759 and x/cax=0.993, respectively. Measurement
plane 2 downstream the cascade is located at x/cax=1.325. The static pressure along the
blade surface and the total pressure variations at measurement planes SS-37 and SS-02
are taken from the midspan. Otherwise, mass flow averaged values are used. The blade

inlet flow angle 1 is 65° and the isentropic Mach number is 1.2 at measurement plane
2.
Fig. 1 The modelled geometry of transonic turbine cascade with boundary conditions and measurement planes from Sonoda et al. [19].
3.2 Supersonic Turbine
The turbine under investigation is a low reaction supersonic axial turbine without twist
in the rotor blades. The turbine was designed for the turbocharger of a diesel engine.
The main geometrical parameters of the turbine are presented in Table 1. The stator is
designed to have a supersonic absolute outlet velocity with a constant flow angle in the

circumferential direction along the outlet. The flow inside the stator is turned at the
converging section and only accelerated in the diverging section. The absolute flow
angle at the rotor outlet is designed to be axial. The rotor blades have longer axial chord
at the hub than at the shroud (see Fig. 2). It should also be noted that the relative
velocity entering the rotor is subsonic and the rotor blade setting angle is constant with
an incidence of -3°.
Table 1 Supersonic turbine geometry.
Number of stator vanes 20
Number of rotor blades 35
Meanline degree of reaction 0.15
Stator design outlet flow angle from axial direction, 2 (°) 78
Stator design outlet Mach number, M2 1.41
Rotor design inlet flow angle from axial direction, 2 (°) 56.6
Rotor design outlet flow angle from axial direction, 3 (°) 69.1
The geometry of the turbine under investigation is shown in Fig. 2. The inlet boundary
is located 270% of the stator axial chord upstream from the stator leading edge. Position
1 is located slightly downstream from the inlet boundary face. Positions 2 and 3 are
located at the rotor leading and trailing edges, respectively. Position 4 at the diffuser
outlet is situated slightly upstream from the outlet boundary.

Fig. 2 Turbine geometry under investigation [10].
An example of the surface grid is shown in Fig. 3. Every second gridline is invisible for
clarity. The calculation domain has 39 blocks, and there is one block for each stator
channel and one for each rotor channel. Four stator channels and seven rotor channels
are modelled, corresponding to a 1/5 of the real turbine geometry. The tip clearance
(1.9% of brotor), the annular inlet part, and the annular diffuser are also modelled. For the
tip clearance there is an individual calculation block for each blade that has 24x8x56
nodes. The bottom of the calculation block is treated as a rotational solid (blade tip) and
the casing as a solid wall. The non-dimensional wall distance for the design conditions
is less than 3 at the rotor blade surface. The grid is structured with rectangular elements.

Fig. 3 Part of the surface grid, every second gridline is visible for clarity [10].
The modelled operating conditions and characteristics of the grids are presented in
Table 2. The design and medium operating conditions are relatively close to each other,
whereas the third operating condition has a clearly lower mass flow, pressure ratio, and
rotational speed. The values for the design conditions are taken from process
simulations, and for off-design conditions, measured values are used. These
measurements were conducted with the turbine installed in a turbocharger and
connected to a diesel engine. Since only limited pressure and temperature data was
available with acceptable accuracy from the measurements, the transonic cascade
measurements of Sonoda et al. [19] were chosen to be used to demonstrate the
reliability of the used code with shock waves. The pressure ratio at medium conditions
is slightly higher in the modelling than it was in the measurements (4.05), but it is still
believed to give results that represent the real operating conditions.

Table 2 Modelled turbine operating conditions and geometries.
qm (kg/s) N (r/min) Blocks Cells
Design 1.0 qm,des 5.6 31500 39 2 601 984
Medium 0.84 qm,des 4.25 28500 39 2 601 984
Low 0.49 qm,des 2.55 23010 39 2 601 984
A grid independency test is presented in Grönman and Turunen-Saaresti [10]. Although
their study showed that full grid independency was not achieved, it is believed that the
results are comparable since the grid used at different operating conditions is the same
in every case.
4 RESULTS
4.1 Cascade Modelling
The calculated isentropic Mach number along the turbine profile is compared with the
measurements of Sonoda et al. [19] in Fig. 4. At the pressure surface, there is in general
a good accordance between the measurements and the numerical case. At the suction
surface, CFD predicts slightly lower isentropic Mach numbers than the measurements
from the leading edge, until x/cax=0.77. Sonoda et al. [19] reported also nearly similar
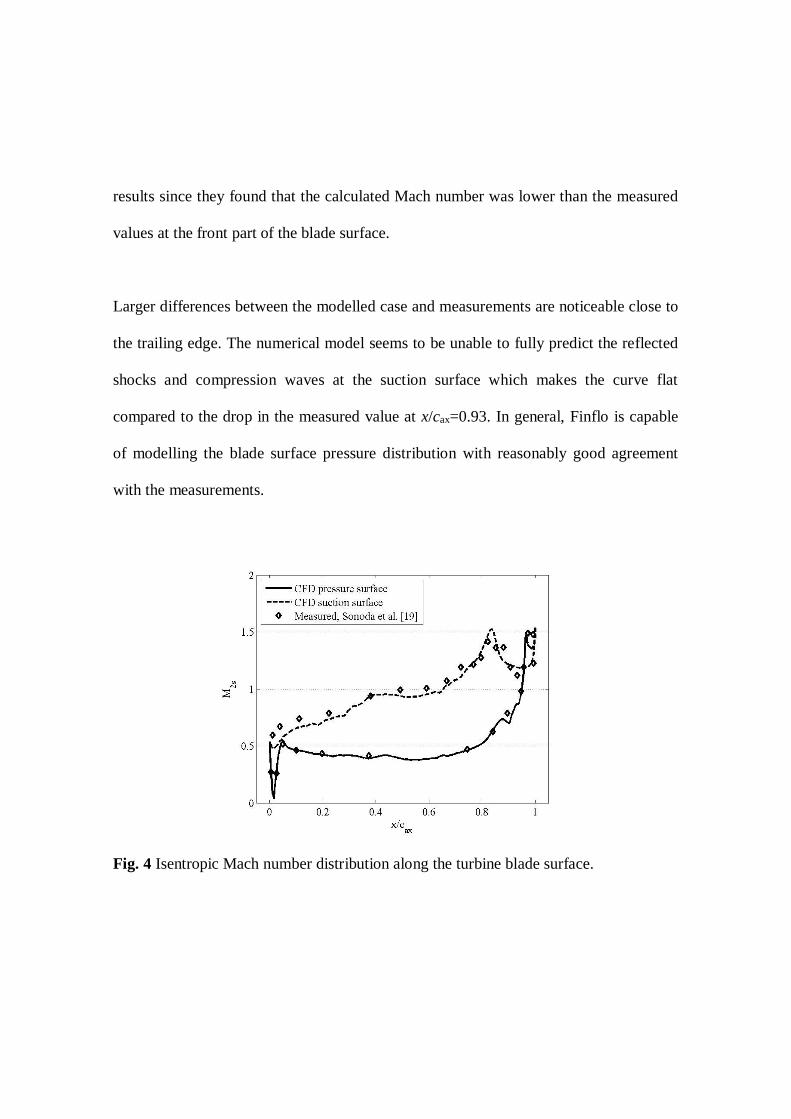
results since they found that the calculated Mach number was lower than the measured
values at the front part of the blade surface.
Larger differences between the modelled case and measurements are noticeable close to
the trailing edge. The numerical model seems to be unable to fully predict the reflected
shocks and compression waves at the suction surface which makes the curve flat
compared to the drop in the measured value at x/cax=0.93. In general, Finflo is capable
of modelling the blade surface pressure distribution with reasonably good agreement
with the measurements.
Fig. 4 Isentropic Mach number distribution along the turbine blade surface.

To study how well Finflo predicts losses in transonic cascade, the losses in the total
pressure are compared with the measurements. The total pressure loss is calculated
using equation
1t
t1pp
. (4.1)
The total pressure loss profile at plane SS-37 is plotted in Fig. 5 (a). Losses are well
predicted between the suction surface and the wake, but the wake is wider than the
measurements indicate. The loss peak from the wake is wider than the measured also at
plane SS-02 in Fig. 5 (b). This indicates that the numerical model is not able to fully
predict the wake flow area with the current grid density. Therefore, it is beneficial to
develop a denser grid in that area in the future models. The losses between the wake and
suction surface are partly underpredicted. This is caused by the weaker than measured
shocks and reflections from the suction surface and their mixing with the main flow.
The effect of the trailing edge shock wave in Fig. 5 is predicted by the CFD simulation
as a high loss area starting from the suction surface. Although the losses are higher than
in the measurements, the position of the trailing edge shock is reasonably well
predicted. Overall, the agreement between the measurements and CFD is reasonably
good. In general, it can be said that the numerical diffusion that is caused by the coarse
grid and upwind method dampens the shock waves which is unphysical. However, the

locations of the shock wave are predicted well and the relative differences can be
considered to be comparable.
(a) (b)
Fig. 5 Total pressure loss profile at planes SS-37 (a) and SS-02 (b).
4.2 Turbine Stage Performance at different operating conditions
The isentropic total-to-static efficiency is used to compare the performance of the
turbine stage at different operating conditions and is defined as
s41t
4t1tsts, TT
TT . (4.2)
The performance of the stator and rotor is evaluated by calculating the stator and rotor
isentropic efficiencies by Equations (4.3) and (4.4), respectively.
s21t
21tstators, TT
TT (4.3)
s32t
3t2trotors, TT
TT (4.4)
All thermodynamic and flow properties are mass flow averaged values, except the static
pressures that are used to calculate the isentropic Mach number distributions. The
efficiencies for the stator, rotor, and full turbine stage are presented in Table 3 for all
three modelled cases. The results show that the turbine performs with the highest
efficiency at a slightly lower rotational speed (28500 rpm) than it was designed for
(31500 rpm). These two elevated efficiency values are still relatively close to each other
when compared to the efficiency at the lowest rotational speed. When the causes for
different stage performance are studied more in detail, it can be seen that the difference
between the design and medium conditions comes from both stator and rotor
performances, whereas the main reason for the poor performance under low conditions
is the decreased rotor performance. It is also interesting to notice that the stator operates
well even under the low operating conditions.

Table 3 Efficiency of different components in the turbine stage.
s,stator s,rotor s,t-s
Design 0.921 0.735 0.721
Medium 0.929 0.742 0.737
Low 0.919 0.693 0.671
4.3 Stator Flow Fields at Different Operating Conditions
To be able to explain the reasons for the differences between the operating conditions
from the previous chapter, it is necessary to look at the flow fields. The spanwise Mach
number distribution at the stator outlet in Fig. 6 is almost similar between the two
highest pressure ratios. As the pressure ratio decreases to the lowest value, the Mach
number becomes relatively low. This is reasonably well in agreement with the changes
in the isentropic Mach numbers that are calculated from total-to-static pressure ratios
over the stator. Isentropic values for Mach numbers are 1.6 for design, 1.5 for medium,
and 1.3 for low operating conditions. Higher Mach numbers lead to higher shock losses
at the design and medium conditions, when compared to low operating conditions. The
amount of losses that originate from the trailing edge shocks is a function of outlet
Mach number [4]. The average stator outlet Mach number for design and medium
operating conditions is 1.5.

Fig. 6 Spanwise stator outlet Mach number distribution at different operating
conditions.
In Fig. 7, the contours of the total pressure loss at 2.7 per cent of stator axial chord
downstream from the stator trailing edge are presented for the design and low operating
conditions. Large areas of increased secondary losses are noticeable especially at the
hub side at low operating conditions downstream of the stator trailing edge. The
explanation for these losses can be found by looking at the isentropic Mach number
distributions at the stator surface in Fig. 8.

(a)
(b)
Fig. 7 Contours of total pressure loss 2.7 per cent of stator axial chord dowstream from
the stator trailing edge, (a) design and (b) low operating conditions.
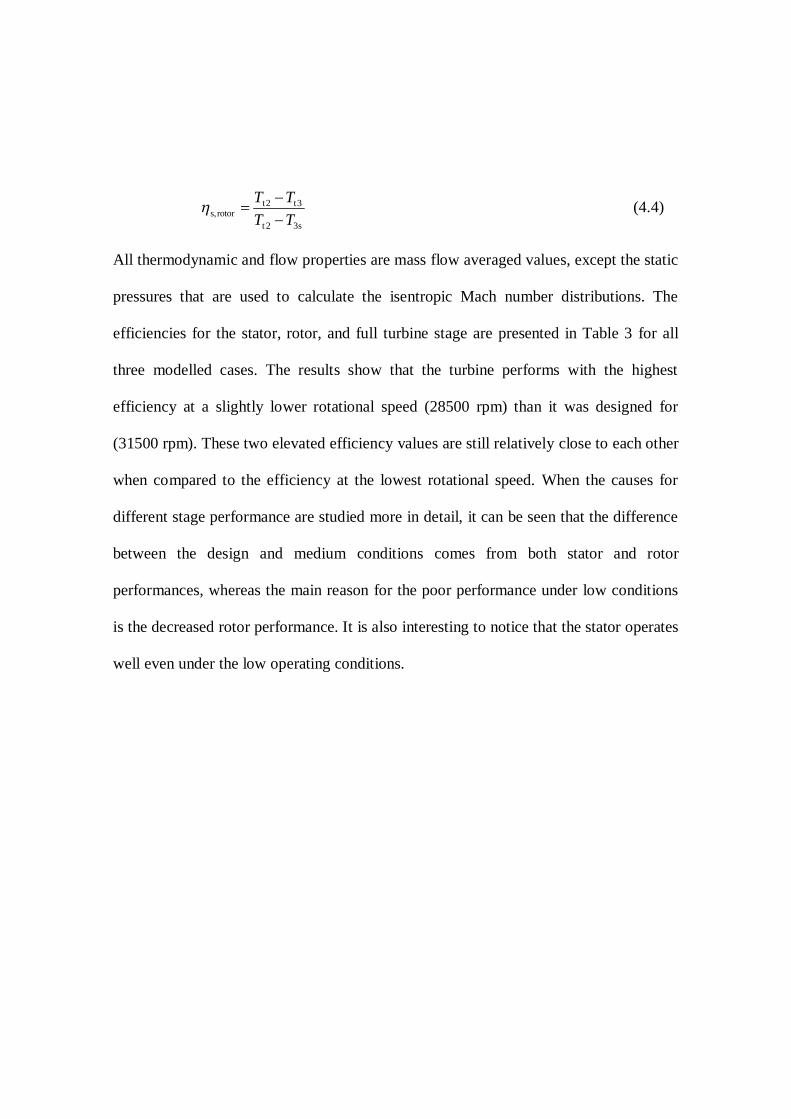
In Fig. 8, the isentropic Mach number distribution at the stator midspan is plotted over
the stator axial length. The shape of the distribution is similar also at the hub and
shroud, and therefore only the midspan is presented here. In general, the isentropic
Mach number is similar between different operating conditions for the majority of the
stator surface, and the differences are located in the supersonic section. The change in
the position of the trailing edge shock is noticeable when the peak in the isentropic
Mach number moves in the upstream direction. The position of the shock peak is at
x/cax=0.87 for the design and x/cax =0.78 for the low flow conditions. Similar behaviour
was also found in papers of Jouini et al. [7], Munday et al. [9], and Yasa et al. [3]. At
the low flow conditions, the loading of the stator is greatly affected by the trailing edge
shock, and the isentropic Mach number at the suction surface stays almost constant
downstream from x/cax=0.85. These results indicate that a more perpendicular shock
wave leads to lower stator loading close to the trailing edge which causes the increase in
the secondary losses shown in Fig. 7.
Fig. 8 Isentropic Mach number distribution at the stator midspan with different
operating conditions.
The efficiency of the stator is almost similar at design and low conditions, but the
secondary losses are more evident at low conditions. This indicates that the decreased

shock losses due to lower pressure ratio are replaced by the increased secondary losses.
These losses are caused by the decreased loading at the stator suction surface due to
more perpendicular trailing edge shock waves. At the design conditions the behaviour is
opposite with higher shock losses and lower secondary losses. The importance of the
shock wave related losses was also mentioned by Dorney et al. [1].
Rough estimations of the boundary layer loss sources are given in Tables 4 and 5 for the
stator and rotor, respectively. The share of losses is calculated based on the assumption
that blade row losses are proportional to U3dA as presented by Harrison [20]. Free-
stream velocities are derived from the inlet stagnation pressure and local static pressure
following Harrison [20]. This causes error in the evaluation of the free-stream velocity
due to relatively high Mach numbers, but the relative values are expected to be
comparable. Table 4 indicates that the boundary layer losses are divided similarly
between the design and medium conditions, but at the low operating conditions, the
percentage of losses at the suction surface decreases and losses at the pressure surface
increase. This is caused by the decreased loading close to the trailing edge due to more
perpendicular trailing edge shock waves. In general, most of the losses are generated at
the suction surface. At the rotor, the differences between the different operating
conditions are negligible as shown in Table 5. Most of the losses originate from the

suction surface, but the share of pressure surface and shroud endwall losses is larger
than in the stator.
Table 4 Percentage of boundary layer losses at the stator surfaces (total losses 100%).
Suction
surface
Pressure
surface
Hub
wall
Shroud
wall
Design 61.0 11.9 13.2 13.8
Medium 60.8 11.8 13.5 14.0
Low 58.4 13.4 13.8 14.3
Table 5 Percentage of boundary layer losses at the rotor surfaces (total losses 100%).
Suction
surface
Pressure
surface
Hub
wall
Shroud
wall
Design 40.1 26.4 13.3 20.2
Medium 39.8 26.5 13.5 20.2
Low 40.0 26.6 13.5 19.9

4.4 Rotor Flow Fields at Different Operating Conditions
In Figs. 9 (a) and (b), the contours of the relative Mach number are plotted at the rotor
outlet for the design and medium conditions. The areas of high Mach number at the
rotor outlet at the design conditions are larger than they are at the medium conditions.
At the low operating conditions in Fig. 9 (c), close unity Mach number areas are
missing because of the lower pressure ratio, but there are low Mach number areas quite
similar to the medium conditions. The areas of low Mach number are predicted at the
suction surface shroud, and they are increasing at the off-design conditions. These areas
are caused by the tip-clearance and secondary flows. The areas of low Mach number are
also noticeable at the suction and pressure surfaces from hub towards the midspan at the
low operating conditions.

(a)
(b)
(c)
Fig. 9 Relative Mach number at the rotor outlet at (a) design, (b) medium, and (c) low
operating conditions.

Rotor incidence in Fig. 10 (a) is positive at the hub and negative closer to the tip. In a
paper of He [21], it was also mentioned that the non-twist rotor blades lead to a negative
incidence near the tip and a positive incidence near the hub. Woinowsky-Krieger et al.
[5] reported that a transonic turbine had an 8 per cent increase in the blade incidence as
the turbine rotational speed changed from 100 to 80 per cent. This is considered to be
qualitatively in accordance with the results presented in Fig. 10 (a). The incidence is
more uniform at the medium conditions than it is at the design, which gives an
explanation for the improved rotor performance. The rotor trailing edge shocks might,
however, cause slightly higher additional losses at the design conditions. The lower
mass flow and rotational speed lead to a more positive incidence, and at low operating
conditions, the incidence stays positive for most of the span. High positive incidence
can lead to increased total pressure losses as indicated in a paper of Jouini et al. [7].
The relative flow angle at the rotor outlet is shown in Fig. 10 (b) along with the blade
setting angle. When comparing the differences between the medium and low conditions,
the largest difference is the relatively large overturning area at low conditions. This was
also noticeable in Fig. 9 (c) when the low Mach number areas from hub towards the
midspan increased. The reason for large overturning is the high positive incidence at the
rotor leading edge. Positive effects of the suppression of overturning at the hub area
were mentioned by Snedden et al. [6]. This explains why the performance of the rotor

decreases at low operating conditions. Yasa et al. [3] found that with a low rotational
speed, the importance of the rotor incidence is higher than the stator exit losses.
(a) (b)
Fig. 10 Incidence at the rotor inlet (a) and relative flow angle at the rotor outlet (b).
5 CONCLUSIONS
This paper presents a throughout study about the reasons that lead to the decreased off-
design performance of a supersonic axial flow turbine. The unique feature of this study
is the explanation of the loss sources individually for the stator and the rotor. The two
most important loss sources in supersonic axial turbine flows were found to be the stator
trailing edge shock waves and the positive rotor incidence.
In the beginning of the study, a transonic cascade was modelled in order to demonstrate
the reliability of the modelling with shock waves. This study showed that a reasonably

good accordance was achieved with the measurements. Especially the isentropic Mach
number distribution along the blade surface was well predicted. Also the trends of total
pressure losses were reasonably well predicted together with the position of the trailing
edge shocks. Although, quantitatively, the losses differed from the measurements, it is
considered to be acceptable since this study concentrates on trends, not on the exact
values.
In the second part of the study, a supersonic low reaction axial turbine was modelled
under the design and two off-design conditions. The performance of the turbine differed
from the design state especially at the low pressure ratio and low rotational speed
conditions. The study showed similar trends in the flow behaviour and loss sources with
the open literature giving verification for the results. Two loss mechanisms were found
to be dominant in the off-design performance of the stator and rotor.
At the stator the decrease in the pressure ratio from the design value decreases shock
wave losses. However, simultaneously the stator secondary losses increase and lead to a
need for the designer to optimise these beneficial and detrimental effects. The reason for
the increased secondary losses is the decreased loading at the suction surface that is
caused by the more perpendicular shock waves from the trailing edge. A rough
estimation of the boundary layer loss sources also indicated that the percentage of losses

decreased at the suction surface and increased at the pressure surface due to the lower
loading.
The performance of the rotor was found to be strongly affected by the incidence. In the
case of the lowest rotor efficiency, the high positive incidence led to a relatively large
area of overturned flow at the rotor outlet. This explains why the performance of the
rotor and the whole stage was lower than it was at the other operating conditions. It also
highlights the importance of avoiding high positive incidences.
These loss sources can be used to explain the slightly better turbine performance at the
medium off-design operating conditions which was attributed to the performance
improvements in stator and rotor equally. The reason for the improved stator
performance was that the decrease in shock losses due to the decreased pressure ratio
overcame a simultaneous increase in secondary losses. With respect to the rotor, the
performance was mainly improved because of the more uniform incidence.
It could be beneficial in the future to study experimentally the performance of a
supersonic turbine at the off-design conditions and also to conduct more numerical
modelling in order to verify the presented observations. In general, higher stage
efficiencies can be achieved at design conditions by redesigning the turbine rotor with

twist. One possible area for future research could be the use of variable stator geometry
in supersonic axial flow turbines that could solve the presented stator trailing edge
shock wave and rotor incidence problems. As a general recommendation for a designer,
special attention should be paid to the position of the stator trailing edge shock waves
and, if possible, a high positive rotor incidence should be avoided.
ACKNOWLEDGEMENTS
Authors would like to thank the Academy of Finland, the Finnish Graduate School in
Computational Fluid Dynamics, and the Finnish Cultural Foundation, South Karelia
Regional Fund.
REFERENCES
[1] Dorney, D. J., Griffin, L. W., and Huber, F. W. A Study of the Effects of Tip
Clearance in a Supersonic Turbine. Journal of Turbomachinery, 2000, 122, 674–
683.
[2] Dorney, D. J., Griffin, L. W., Huber, F., and Sondak, D. L. Unsteady Flow in a
Supersonic Turbine with Variable Specific Heats. Journal of Propulsion and
Power, 2002, 18, 493–496.

[3] Yasa, T., Paniagua, G. and Bussolin, A. Performance Analysis of a Transonic
High-Pressure Turbine. Proc. IMechE, Part A: J. Power and Energy, 2007, 221,
769-778.
[4] Kacker, S. C. and Okapuu, U. A Mean Line Prediction Method for Axial Flow
Turbine Efficiency. Journal of Turbomachinery, 1982, 104, 111–119.
[5] Woinowsky-Krieger, M., Lavoie, J.-P., Vlasic, E. P., and Moustapha, S. H. Off-
Design Performance of a Single-Stage Transonic Turbine. Journal of
Turbomachinery, 1999, 121, 177–183.
[6] Snedden, G., Dunn, D., Ingram, G., and Gregory-Smith, D. The Performance of
a Generic Non-axisymmetric End Wall in a Single Stage Rotating Turbine at On
and Off-Design Conditions. In: Proceedings of ASME Turbo Expo, Glasgow, UK,
2010, paper no. GT2010-22006.
[7] Jouini, D. B. M, Sjolander, S. A. and Moustapha, S. H. Aerodynamic
Performance of a Transonic Turbine Cascade at Off-Design Conditions. Journal of
Turbomachinery, 2001, 123, 510–518.
[8] Benner, M. W., Sjolander, S. A. and Moustapha, S. H. An Empirical Prediction
Method for Secondary Losses in Turbines – Part I: A New Loss Breakdown
Scheme and Penetration Depth Correlation. Journal of Turbomachinery, 2006, 128,
273-280.

[9] Munday, D., Heeb, N., Gutmark, E., Liu, J., and Kailasanath, K. Supersonic Jet
Noice Reduction Technologies for Gas Turbine Engines. Journal of Engineering
for Gas Turbines and Power, 2011, 133, 101201.
[10] Grönman, A. and Turunen-Saaresti, T. Design and Off-Design Performance of a
Supersonic Axial Flow Turbine with Different Stator-Rotor Axial Gaps. Proc.
IMechE, Part A: J. Power and Energy, 2011, 225, 497-503.
[11] Roe, P. L. Approximate Riemann Solvers, Parameter Vectors and Difference
Schemes. Journal of Computational Physics, 1981, 43, 357-372.
[12] Lombard, C. K., Bardina, J., Venkatapathy, E. and Oliger, J. Multi-
Dimensional Formulation of CSCM - An Upwind Flux Difference Eigenvector
Split Method for Compressible Navier-Stokes Equations. In: 6th AIAA
Computational Fluid Dynamics Conference, Danvers, Massachusetts, 13-15 July
1983, AIAA paper no. 83-1895-CP, pp. 649-664.
[13] Chien, K. Y. Predictions of Channel and Boundary-Layer Flows with a Low-
Reynolds-Number Turbulence Model. AIAA Journal, 1982, 20, 33-38.
[14] Siikonen, T. An Application of Roe’s Flux-Difference Splitting for the k-
Turbulence Model. International Journal for Numerical Methods in Fluids, 1995,
21, 1017-1039.

[15] Jaatinen, A. Performance Improvement of Centrifugal Compressor Stage with
Pinched Geometry or Vaned Diffuser. Dissertation, Lappeenranta University of
Technology, Finland, 2009.
[16] Harinck, J., Turunen-Saaresti, T., Colonna, P., Rebay, S. and van Buijtenen, J.
Computational Study of a High-Expansion Ratio Radial Organic Rankine Cycle
Turbine Stator. Journal of Engineering for Gas Turbines and Power, 2010, 132,
054501.
[17] Turunen-Saaresti, T., Tang, J., van Buijtenen, J. and Larjola, J. Experimental
and Numerical Study of Real-Gas Flow in a Supersonic ORC Turbine Nozzle. In:
Proceedings of ASME Turbo Expo, Barcelona, Spain, 2006, paper no. GT2006-
91118.
[18] Hoffren, J., Talonpoika, T., Larjola, J. and Siikonen, T. Numerical Simulation
of Real-Gas Flow in a Supersonic Turbine Nozzle Ring. Journal of Engineering for
Gas Turbines and Power, 2002, 124, 395-403.
[19] Sonoda, T., Arima, T., Olhofer, M., Sendhoff, B., Kost, F., and Giess, P.-A. A
Study of Advanced High-Loaded Transonic Turbine Airfoils. Journal of
Turbomachinery, 2006, 128, 650–657.
[20] Harrison, S. The Influence of Blade Lean on Turbine Losses. Journal of
Turbomachinery, 1992, 114, 184-190.

[21] He, L. Three-Dimensional Unsteady Navier–Stokes Analysis of Stator–Rotor
Interaction in Axial-Flow Turbines. Proc. IMechE, Part A: J. Power and Energy,
2000, 219, 13-22.
APPENDIX 1
Notation A area [m2]
b rotor or channel height (m)
cax axial chord (m)
gax stator-rotor axial gap at hub (m)
i incidence (°)
M Mach number
N rotational speed (r/min)
p pressure (Pa)
qm mass flow (kg/s)
T temperature (K)
U free-stream velocity (m/s)
u friction velocity (m/s)
x axial coordinate (m)
yn normal distance to the wall (m)
y+ non-dimensional wall distance, wn uyy

absolute flow angle from the axial direction (°)
relative flow angle from the axial direction (°)
efficiency
w molecular viscosity on the wall (kg/m/s)
total-to-static pressure ratio
density (kg/m3)
total pressure loss coefficient
Subscripts
des design
s isentropic
t total
1 turbine inlet
2 stator outlet/rotor inlet
3 rotor outlet
4 diffuser outlet
Abbreviations
DDADI Diagonally Dominant Alternating Direction Implicit
MUSCL Monotonic Upwind Schemes for Conservation Laws


