
Performance and emissions optimization of an ethanol...
12
Transcript of Performance and emissions optimization of an ethanol...

Scientia Iranica B (2018) 25(1), 196{207
Sharif University of TechnologyScientia Iranica
Transactions B: Mechanical Engineeringhttp://scientiairanica.sharif.edu
Performance and emissions optimization of anethanol-gasoline fueled SI engine with oxygenenrichment using arti�cial bee colony algorithm
B. Beigzadeh�, A. Reihani, and A. Ojaghi
Biomechatronics and Cognitive Engineering Research Laboratory, School of Mechanical Engineering, Iran University of Science andTechnology, Tehran, Iran.
Received 25 September 2015; received in revised form 28 September 2016; accepted 2 January 2017
KEYWORDSEthanol fueled engine;Alternative fuels;Spark ignition engine;Oxygen enrichedcombustion;Performanceimprovement;Emissions reduction.
Abstract. The use of arti�cial neural network in conjunction with arti�cial bee colonyalgorithm is proposed as a method for performance and emissions optimization of an SIengine. The case study here involves the oxygen enriched combustion of an SI engine fueledwith hydrous ethanol and gasoline. In this study, the engine was considered as a blackbox and its performance and emissions were extracted experimentally at di�erent intakeair oxygen concentrations, hydrous ethanol injection rates, and ethanol concentration inthe hydrous ethanol mixture. Then, the simultaneous injection of hydrous ethanol andoxygen enriched combustion was investigated to maximize the fuel conversion e�ciencyand minimize the CO and NOx emissions. Therefore, an objective function consistingof both the emission and performance parameters was optimized using the Arti�cial BeeColony algorithm. The engine model used in this optimization process was obtained froman Arti�cial Neural Network trained with experimental engine data. For operating speedof 3000 rpm, the optimization results indicated 1.21% improvement in fuel conversione�ciency and 31.11% and 13.94% reduction in CO and NOx emissions, respectively. Atthe speed of 2000 rpm, fuel conversion e�ciency improved by 4.11% and CO emissiondecreased by 18.73%, while NOx concentration increased by 28.35%.© 2018 Sharif University of Technology. All rights reserved.
1. Introduction
Considering the rising trend of energy consumption inrecent years and the limitation of the available energyresources and climate change, it is crucial to controland curb the utilization of energy. Road transportationconsumes a substantial portion of energy in the formof fossil fuels; thus, it is necessary to improve thee�ciency and fuel economy of vehicle engines. In
*. Corresponding author. Tel.: +98 21 77240094;Fax: +98 21 73021587E-mail address: b [email protected] (B. Beigzadeh)
doi: 10.24200/sci.2017.4249
addition, the fossil fuel reserves in the world are limitedand will be used up in the near future. Therefore,the use of alternative fuels seems to be inevitable [1].Alternative fuels such as hydrogen, natural gas, andbiofuels are considered as viable options for the trans-portation industry to help it reduce its dependency onfossil fuels [2].
In addition, current strong restrictions on emis-sions from road transportation along with the growingpublic awareness of the environmental and healthimpacts of exhaust emissions from vehicles have ne-cessitated the use of biofuels such as ethanol [3]. Bio-ethanol is an alternative fuel, which can be producedfrom various kinds of biomass, such as corn, cassava,sugarcane, sugar beet, and red seaweed, making it a

B. Beigzadeh et al./Scientia Iranica, Transactions B: Mechanical Engineering 25 (2018) 196{207 197
desirable alternative fuel. It can contribute to thereduction in greenhouse gases from energy conversionsystems [4]. One of the extensively utilized methods inthis regard is to blend gasoline with ethanol, which hasfew drawbacks, such as the phase separation of ethanol-gasoline blend [5,6]. Recently conducted researcheshave demonstrated that gasoline blended with mid-level hydrous ethanol makes an appropriate fuel forutilization in internal combustion engines [7]. A com-parison between mid-level (0-40% volumetric concen-tration of water) hydrous ethanol-gasoline blend andanhydrous gasoline-ethanol blend can be found in theresearch done by Schifter et al. [6]. Low NOx emissionwas reported using the hydrous ethanol-gasoline blendscompared to the anhydrous ethanol-gasoline blend.Other studies have con�rmed low NOx emissions for60:40 gasoline-ethanol-10% hydrous (E40h) comparedto 60:40 gasoline-anhydrous ethanol (E40) [8]. Theaforementioned results indicate that the water contentof hydrous ethanol lowers the peak temperature andslows the combustion rate, resulting in reduced NOxemissions. The performance and emissions of a blendof water-ethanol (containing 96.2% ethanol) have beencompared with those of gasoline; higher NOx emis-sion was reported for hydrous ethanol [9]. This wasattributed to a faster ame speed, which produceda higher peak pressure and, therefore, a higher peaktemperature in the combustion process. However, thereare some discrepancies in the literature on the e�ect ofethanol on NOx emissions of SI engines [10], and thereare a number of other studies that have demonstrateda reduction in NOx emissions using ethanol gasolineblends [11-14]. This has been attributed to high heatof vaporization of ethanol compared to gasoline, whichdecreases the charge temperature and reduces thermalNOx formation [15].
1.1. Motivation and related worksThe concept of oxygen enrichment of the intake airas a method of enhancing combustion in engines hasbeen investigated for a long time [16,17]. One methodto control the oxygen concentration is to inject thepure oxygen from a gas cylinder into the intake of theengine. Recently, with progress in materials science,the application of permeable membrane to separate air(separate oxygen from nitrogen in the intake air) andget oxygen-enriched intake for engine has been takeninto consideration as an alternative approach. Thepolymer membranes with selectivity and permeabilitycan produce higher oxygen concentrations in the intakeair [18]. By means of membrane separation technology,up to 35% oxygen concentration in the intake air canbe achieved and is reported in the literature [19].By development of practical applications for oxygen-enriching membranes, the results of this paper can beemployed in conventional SI engines.
An e�ective method that can be employed toreduce the overall fuel consumption is the oxygenenrichment of combustion air, which cuts the amountof nitrogen in the ue gas, hence reducing the heat lossthrough the exhaust gas [20]. On the other hand, theoxygen enrichment of the intake air leads to a leanercombustion, which increases the amount of nitrogenoxides in the exhaust gas [21]. However, water contentof ethanol could be employed to e�ectively counteractthe impact of OEC on NOx emissions [22]. It seemsthat the enrichment of oxygen along with some otherparameters (e.g., water content of ethanol, and hydrousethanol injection rate) could be regulated in such acontrolled way that the desired engine output parame-ters are obtained; this is the main focus of this study.This study aims to balance these opposing e�ects, and�nd an optimum condition of engine operation withimproved performance and reduced emissions. Firstly,the e�ect of oxygen enrichment and di�erent ow ratesof hydrous ethanol on engine performance (BSFC,BMEP, fuel conversion e�ciency, volumetric e�ciency,relative air to fuel ratio, brake output torque, andcombustion e�ciency) and emission (CO, CO2, NOx,and HC) is investigated in this study. Secondly, theoptimum values of oxygen concentration, volumetricconcentration of ethanol in the ethanol-water blend,and its ow rate are found to minimize the NOxand CO emissions and the BSFC. The optimizationalgorithm we have used is a swarm intelligence basedone, namely, ABC algorithm, which requires numeroussample data from the system. Therefore, an ANN isutilized as a virtual model for the engine to provide theoptimization process with an estimate of engine per-formance and emissions parameters. Related studiesthat have used ANN to predict engine performance andexhaust emissions include studying the performanceand exhaust emissions of a diesel engine [23]; devel-oping correlation among torque, brake power, BSFC,volumetric e�ciency, and exhaust emissions [24]; andpredicting the engine brake power, torque, and theexhaust emissions [25]. Other related works includethose that have focused on the use of optimizationmethods in engine improvement [26-28]. In this regard,Kesgin has employed the Genetic Algorithm (GA) andneural networks to predict the e�ects of design andoperational parameters on engine e�ciency and NOxemissions of a natural gas engine [26].
1.2. Study procedureThe overall owchart of this study is depicted inFigure 1. The process started by de�ning the designspace and the range of inputs. Then, a representativedata set (including 16 distinct cases) was produced,using which the outputs were obtained experimentallyfor each case. Then, di�erent training algorithms andnetwork architectures were compared to �nd the most

198 B. Beigzadeh et al./Scientia Iranica, Transactions B: Mechanical Engineering 25 (2018) 196{207
Figure 1. Overall owchart of study procedure.
appropriate one to model the behavior of the testedengine. Thereafter, the experimental data were usedto train the selected ANN, which was employed bythe ABC algorithm to obtain the required data for theoptimization process. Finally, the optimum operationcondition was obtained.
2. Experimentation
2.1. The experimental setupA KIA four-cylinder, four-stroke, naturally aspirated,SOHC engine with displacement volume of 1323 ccwas taken as the case study. Tables 1 and 2 listthe general speci�cations of the engine and the fuelproperties, respectively. Torque measurements weredone by means of a 200 kW Schenk-WT eddy-currentdynamometer. Thermocouples were used to obtain the
Table 1. General speci�cations of the tested engine.
Engine type 4-cylinder, in-line, 8-valveDisplacement volume (cc) 1323Bore � stroke (mm) 71� 83:6Valve mechanism SOHCCompression ratio 9.7:1Combustion order 1-3-4-2Maximum torque (Nm/rpm) 120/3000Maximum power (kW/rpm) 47/5500Maximum speed (rpm) 6000
inlet and outlet cooling water temperatures as well asthe temperatures of oil and exhaust gases. The oilpressure was also measured using a pressure probe.The fuel consumption was determined using a laser

B. Beigzadeh et al./Scientia Iranica, Transactions B: Mechanical Engineering 25 (2018) 196{207 199
Figure 2. Schematic diagram of the experimental setup.
Table 2. Gasoline and ethanol characteristics.
Fuel property Gasoline Ethanol
Density (kg/m3) 740 785Lower heating value (MJ/kg) 41.86 25.12Research octane number 85.3 108.6Stoichiometric air-to-fuel ratio 14.7 9Speci�c heat (kJ/kg K) 1.98 2.42
ow meter, and the intake air ow was measuredby a Venturi-type ow meter. The schematic of theexperimental setup is demonstrated in Figure 2. Postcatalyst gas species (O2, CO, CO2, NO, NOx, HC)and stoichiometric ratio were measured using a KIMOKIGAZ 300 STD combustion gas analyzer.
In this study, the intake oxygen concentrationwas increased by introducing pure oxygen from anoxygen cylinder into the intake of the engine to providesustained and stable oxygen gas. Two injection systemswere designed and utilized in order to homogenouslyinject the hydrous ethanol and oxygen into the intakeport at speci�ed ow rates. The ignition timing waskept constant at each speed and load point, and theengine speed was constant throughout each series ofexperiment (at 2000 and 3000 rpm). In addition, theclosed loop air fuel ratio was not used to allow the airfuel ratio to change by implementing OEC and hydrousethanol injection.
2.2. Measurement procedureIn the �rst step, the performance and emission charac-teristics of the engine were extracted using a standardE0 gasoline fuel. Thereafter, series of experiments wereperformed for di�erent conditions of input parametersincluding ethanol concentrations in the water-ethanol
blend, hydrousethanol ow rate, and oxygen owrates. The experiments were designed based on a Box-Behnken sampling algorithm [29]; these conditions arelisted in Table 3. The upper limits for levels of oxygen,water, and ethanol mass ow rates were set by consid-ering the stable operation of the engine; operating theengine with higher levels caused unstable combustionand, in some cases, engine stall under WOT condition.All of the experiments were performed for two di�erentspeeds (i.e., 2000 and 3000 rpm) at WOT. In each case,the injection systems were set to the desired points andthe engine was run for a su�cient time to consumethe remaining fuel of the previous case and reachsteady state operation. Afterwards, variables such asthe output torque, cooling water, oil and exhaust gastemperatures, fuel consumption rate, oil and intakeair pressures, and the concentration of exhaust specieswere recorded.
2.3. Uncertainty analysisA �rst-order uncertainty analysis was performed usingthe constant odds combination method, based on a95% con�dence level, as described by Mo�at [30]. Un-certainty of each measured parameter was calculatedbased on the instrument characteristics and the mea-surement dispersion. The uncertainty of each measuredvariable in each case of experiment is depicted in theerror bars of output parameters.
3. Arti�cial neural network
The ANN is an e�ective method for the predictionof a system's behavior based on the experimentaldata. The performance of the ANN-based predictionsis evaluated by the regression analysis of the networkoutputs (predicted parameters) and the experimental
Table 3. Input parameters in each experimental case.
Case1 2 3 4 5 6 7 8 9 10 11 12 13 14 15 16
Oxygen (ml/s) 0 157.3 368.25 562.3 0 0 0 0 157.3 157.3 368.25 368.25 562.3 562.3 368.25 368.25Ethanol (ml/s) 0 0 0 0 0 0 0.1837 0.3 0 0 0 0 0 0 0.1837 0.3Water (ml/s) 0 0 0 0 0.612 1 0.4286 0.7 0.612 1 0.612 1 0.612 1 0.4286 0.7

200 B. Beigzadeh et al./Scientia Iranica, Transactions B: Mechanical Engineering 25 (2018) 196{207
values [31,32]. The criterion for performance evaluationof the ANN is the absolute fraction of variance, whichis:
R2 = 1�
0BBB@NsPj=1
(aj � POj)2
NsPj=1
(aj)2
1CCCA ; (1)
Mean Error Percentage (MEP):
MEP(%) =1Ns
NsXj=1
����100� (aj � POj)aj
���� ; (2)
and the Root Mean Square Error (RMSE):
RMSE =
vuuut NsPj=1
(aj � POj)2
Ns; (3)
where a is the actual output, PO the predicted output,and Ns the number of points in the data set [31,32].
In this study, an ANN model was employed toestablish a correlation between the input parametersand the engine performance and emissions as theoutput parameters. The general architecture of theANN is a multi-layer perceptron with one hidden layerdemonstrated in Figure 3. Inputs include intake airoxygen concentration, hydrous ethanol ow rate, andthe ethanol concentration in the blend. Outputs of theANN are NOx and CO concentrations in exhaust gasesand �f .
Feed-forward back-propagation algorithm wasused in conjunction with a hyperbolic tangent sigmoid(tansig) activation function for the hidden layer anda linear (purelin) function for the output layer in theANN development process [3]. Four distinct learningalgorithms including the trainbfg, trainscg, trainlm,and trainrp with NoN in the range of 10 to 28neurons [23] were used and compared to select the mostaccurate con�guration of the ANN. From the whole setof experimental data, 70% were set aside for training,15% for validation, and 15% for testing during the ANNdevelopment and optimization.
4. Optimization
In order to obtain the optimum input parameters of theengine, an optimization algorithm (ABC algorithm)was employed to minimize the following objectivefunction:
OF = KE�F +KNENOx +KCECO; (4)
where KE , KN , and KC are weights correspondingto the fuel conversion e�ciency, NOx emission, andCO emission, respectively, and the search space canbe de�ned in terms of the input parameters. Theonly constraints of the optimization problem are thephysical input limitations. The Arti�cial Bee Colony(ABC) algorithm, which has been used in this study,is a swarm intelligence-based algorithm that has shownan acceptable performance in terms of reliability, accu-racy, and convergence speed [33,34]. The ABC has aniterative behavior, so it needs to evaluate the outputof the engine repeatedly. We used ANN as a metamodel to provide ABC with the required data. Eachtime the ABC needed to acquire data from ANN, thenetwork was run �fty times and the outputs averagewas considered as the input to the ABC; it guaranteedthe accuracy and reliability of the network output.
5. Results and discussion
5.1. Performance and emission characteristics5.1.1. Brake torqueFigure 4 indicates the brake torque for each experimen-tal case at 2000 rpm (mid-range speed of the engine)and 3000 rpm (the speed of maximum torque output).The results demonstrate that an increase in the oxygen ow rate leads to a considerable increase in the outputtorque. The increase in the output torque can beattributed to the increase in oxygen percentage in theintake charge, which raises the average temperatureand the mean e�ective pressure in the combustionchamber. Furthermore, it is observed that the watercontent in the hydrous ethanol leads to a decrease inbrake torque, which can be attributed to diminishedIMEP as a result of reduced ame temperature and
Figure 3. The general architecture of the ANN.

B. Beigzadeh et al./Scientia Iranica, Transactions B: Mechanical Engineering 25 (2018) 196{207 201
Figure 4. Measured output torque and the correspondingerror bar.
lower ame propagation speed that necessitates anadvance in spark timing to achieve the maximumtorque. It should be mentioned that this observationis mainly due to the operation under constant ignitiontiming at each rpm and load point, not necessarily theoptimal ignition timing for the case of water injection.
Ethanol has a higher heat of evaporation thangasoline has; this provides cooler and denser fuel-airintake charge, and thus a higher output torque isproduced [35]. It also increases the knock resistanceof the air-fuel mixture. The outcome is equivalentto having a fuel with a higher octane number, whichwill support much larger compression ratios before theonset of ignition [36-40]. When the engine is operatedin knock limited conditions, both water and ethanolcan suppress knock and enable the engine to run withoptimal ignition timing to achieve the maximum torqueand BTE [41].
5.1.2. Fuel conversion e�ciency and BSFCThe fuel conversion e�ciency can be calculated byEq. (5), which demonstrates the ratio of the workproduced per cycle to the amount of fuel energy sup-plied per cycle that can be released in the combustionprocess [42]:
�F =P
_mfQHV: (5)
Figure 5 shows the fuel conversion e�ciency foreach experimental case at engine speeds of 2000 and3000 rpm. The results indicate that with increase inthe intake air oxygen content, the thermal e�ciencyincreases and, consequently, the BSFC diminishes ac-cording to Eq. (6):
BSFC =_mf
P: (6)
Since the air fuel ratio was not closed-loop controlled,oxygen enrichment led to a leaner and more com-plete combustion with higher values of relative air-to-fuel ratio (�). Furthermore, the oxygen enrichment
Figure 5. Fuel conversion e�ciencies in eachexperimental case.
reduced the amount of nitrogen in the exhaust gas,which contributed to lower thermal losses through theexhaust [20]. On the other hand, it was observedthat an increase in the oxygen content resulted in ahigher temperature di�erence between the outlet andinlet cooling waters. This observation was a resultof a higher adiabatic ame temperature of oxygenenriched combustion, which increased the amount ofheat ux to cylinder walls. The value of fuel conversione�ciency is obtained through a balance between theabovementioned factors.
It was observed that the thermal e�ciency hadan increasing trend as the ethanol content increased.Since ethanol had a higher ame speed and lowercombustion temperature, it reduced the amount ofheat loss to cylinder walls and, thus, enhanced thethermal e�ciency [9]. Another e�ect was caused bythe vaporization of fuel, which continued during thecompression stroke. This had two opposing e�ects;�rst, decrease in the temperature of the working charge,which reduced the compression work, and, second,increase in the volume charge, which increased thecompression work. The heat of vaporization of ethanolis higher than that of gasoline, which increases thecooling e�ect and reduces the compression work and,hence, enhances the brake thermal e�ciency [43].
Water content has shown to have a reducing e�ecton thermal e�ciency. It was observed that waterreduced the ame temperature and, hence, the heat ux to cylinder walls. In addition, water absorbedthe heat and lowered the pressure as the charge wascompressed, thereby reducing the work of the com-pression stroke [44]. However, thermal loss throughexhaust gases increases signi�cantly due to the vaporcontent of these gases. In addition, water reduces the ame speed, which necessitates a change in ignitiontiming to optimal combustion phasing and maximumBTE [45,46]. Since the ignition timing was �xed ateach rpm in this work, the combustion phasing wasnot optimum for the case of water injection.

202 B. Beigzadeh et al./Scientia Iranica, Transactions B: Mechanical Engineering 25 (2018) 196{207
Figure 6. Volumetric e�ciencies according toRelation (7).
5.1.3. Volumetric e�ciencyThe volumetric e�ciency for the test engine is calcu-lated by:
�v =2 _ma
�a;iVdN; (7)
where _ma is the mass ow rate of air induced into thecylinder, which is calculated using:
_ma =AEp0pRT0
8<: 2 � 1
24� pp0
� 2 ��pp0
� ( +1)
359=;1=2
:(8)
The e�ect of di�erent input parameters on the vol-umetric e�ciency is depicted in Figure 6. It isshown that the injection of hydrous ethanol resultsin a lower fuel-air mixture temperature in the intakemanifold due to the evaporation of water and ethanol.This increases the charge density and, therefore, thevolumetric e�ciency. The volumetric e�ciencies forCases 1, 5, and 7 at 2000 rpm were 85.8%, 87.44%, and88.50%, respectively. The oxygen enrichment did notshow any considerable e�ect on volumetric e�ciency.
5.1.4. Combustion e�ciencyThe combustion e�ciency is calculated by Eq. (9):
�v =
_ma
Pi;Reactants
ni��h0f;i � P
i;Productsni��h0
f;i
!_mfQHV
:(9)
The combustion e�ciency is calculated for each caseand depicted in Figure 7. For cases in which ethanol isinjected, its heating value is added to the denominatorof Eq. (9). It is observed that with oxygen enrichment,the combustion e�ciency increases, mainly becauseof a leaner and more complete combustion [40]. Forinstance, at 2000 rpm, the combustion e�ciency in
Figure 7. Combustion e�ciency of all cases according toRelation (9).
Case 1 is 90.85%, and through a mid-level oxygen en-richment in Case 3, the combustion e�ciency increasesto 91.31%. However, the use of oxygen enrichmentin some cases results in a lower value of combustione�ciency, as observed in Case 2 with a combustione�ciency of 90.73%. This is due to a higher ametemperature and, thus, a higher fraction of CO, whichis considered as a partly burnt fuel in the exhaust gas.
It was observed that water injection could bee�ectively utilized to counteract the temperature in-creasing e�ect of oxygen. The best values of combus-tion e�ciency were obtained in Case 12 (93.78%) andCase 14 (93.59%) in which both water and oxygen wereinjected.
In this study, the AF ratio was not closed-loopcontrolled; therefore, injection of ethanol into theintake air led to a richer charge, which increasedthe amount of unburnt or partially oxidized HC anddiminished the combustion e�ciency. For instance,combustion e�ciencies of 89.75% and 89.13% wereobtained in Cases 7 and 8, respectively. Contraryto these results, when a closed-loop control system isemployed to maintain stoichiometric combustion, theuse of ethanol as an oxygenated fuel is expected toimprove the combustion e�ciency [47].
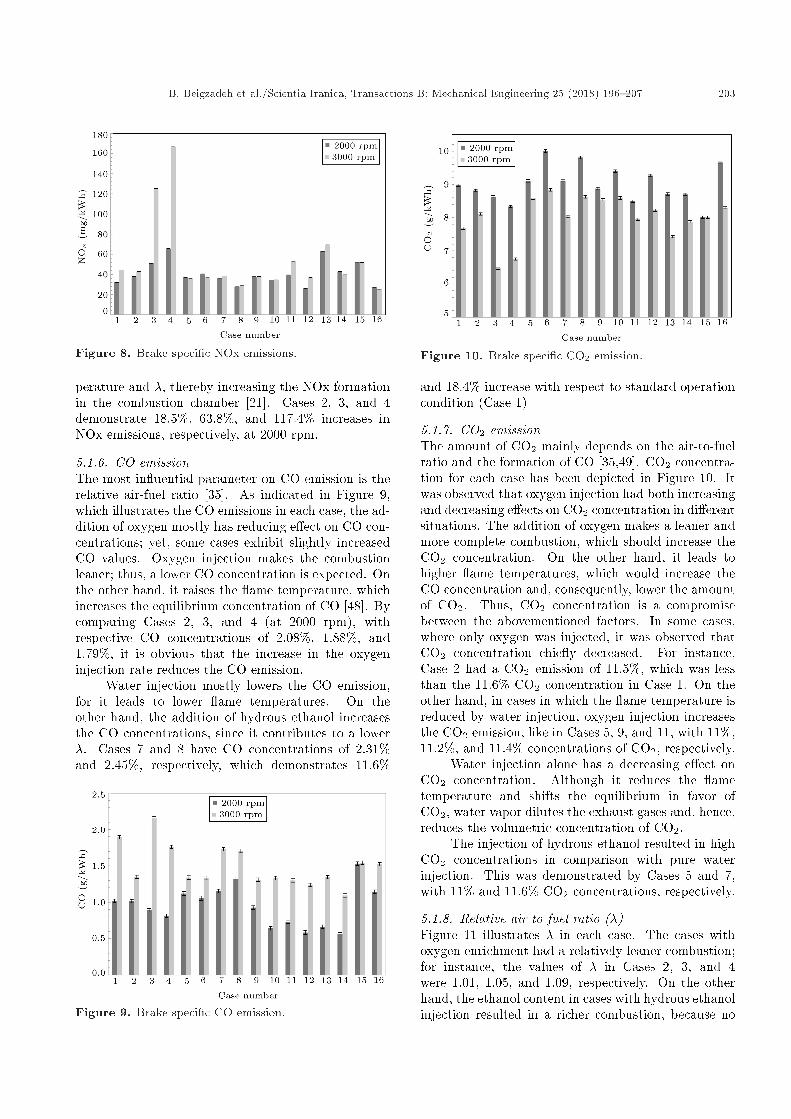
5.1.5. NOx emissionsFigure 8 depicts NOx emissions in di�erent experi-mental cases. The water content in the water-ethanolblend lowers the peak temperature, thereby reducingthe NOx emissions [37]. Cases 5 and 6 (which havewater injection) indicate relative reductions of 10.4%and 25.3% in NOx emissions, respectively. The ethanolcontent itself demonstrated a decrease in NOx emis-sion; this observation is consistent with some of theprevious studies [10-14] and is primarily due to highheat of vaporization of ethanol compared to gasoline,which decreases the charge temperature [15].
The injection of oxygen results in an oxygenenriched combustion, which increases the peak tem-
B. Beigzadeh et al./Scientia Iranica, Transactions B: Mechanical Engineering 25 (2018) 196{207 203
Figure 8. Brake speci�c NOx emissions.
perature and �, thereby increasing the NOx formationin the combustion chamber [21]. Cases 2, 3, and 4demonstrate 18.5%, 63.8%, and 117.4% increases inNOx emissions, respectively, at 2000 rpm.
5.1.6. CO emissionThe most in uential parameter on CO emission is therelative air-fuel ratio [35]. As indicated in Figure 9,which illustrates the CO emissions in each case, the ad-dition of oxygen mostly has reducing e�ect on CO con-centrations; yet, some cases exhibit slightly increasedCO values. Oxygen injection makes the combustionleaner; thus, a lower CO concentration is expected. Onthe other hand, it raises the ame temperature, whichincreases the equilibrium concentration of CO [48]. Bycomparing Cases 2, 3, and 4 (at 2000 rpm), withrespective CO concentrations of 2.08%, 1.88%, and1.79%, it is obvious that the increase in the oxygeninjection rate reduces the CO emission.
Water injection mostly lowers the CO emission,for it leads to lower ame temperatures. On theother hand, the addition of hydrous ethanol increasesthe CO concentrations, since it contributes to a lower�. Cases 7 and 8 have CO concentrations of 2.31%and 2.45%, respectively, which demonstrates 11.6%
Figure 9. Brake speci�c CO emission.
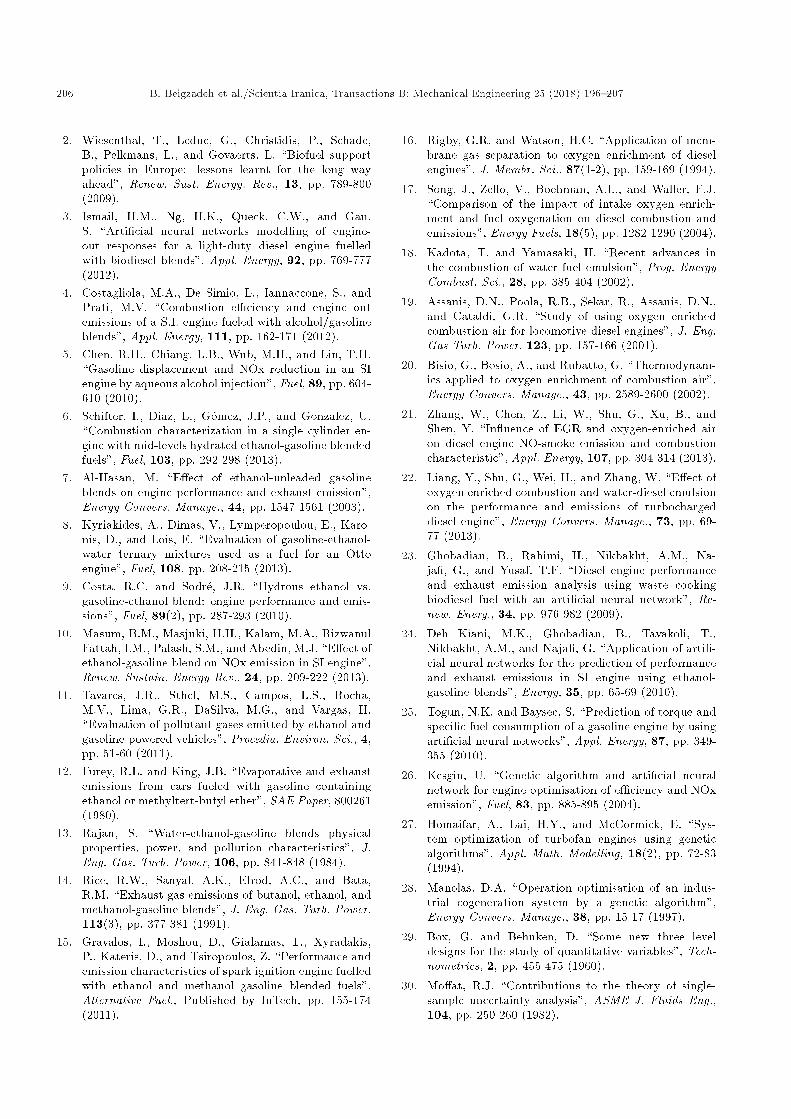
Figure 10. Brake speci�c CO2 emission.
and 18.4% increase with respect to standard operationcondition (Case 1).
5.1.7. CO2 emissionThe amount of CO2 mainly depends on the air-to-fuelratio and the formation of CO [35,49]. CO2 concentra-tion for each case has been depicted in Figure 10. Itwas observed that oxygen injection had both increasingand decreasing e�ects on CO2 concentration in di�erentsituations. The addition of oxygen makes a leaner andmore complete combustion, which should increase theCO2 concentration. On the other hand, it leads tohigher ame temperatures, which would increase theCO concentration and, consequently, lower the amountof CO2. Thus, CO2 concentration is a compromisebetween the abovementioned factors. In some cases,where only oxygen was injected, it was observed thatCO2 concentration chie y decreased. For instance,Case 2 had a CO2 emission of 11.5%, which was lessthan the 11.6% CO2 concentration in Case 1. On theother hand, in cases in which the ame temperature isreduced by water injection, oxygen injection increasesthe CO2 emission, like in Cases 5, 9, and 11, with 11%,11.2%, and 11.4% concentrations of CO2, respectively.
Water injection alone has a decreasing e�ect onCO2 concentration. Although it reduces the ametemperature and shifts the equilibrium in favor ofCO2, water vapor dilutes the exhaust gases and, hence,reduces the volumetric concentration of CO2.
The injection of hydrous ethanol resulted in highCO2 concentrations in comparison with pure waterinjection. This was demonstrated by Cases 5 and 7,with 11% and 11.6% CO2 concentrations, respectively.
5.1.8. Relative air-to-fuel ratio (�)Figure 11 illustrates � in each case. The cases withoxygen enrichment had a relatively leaner combustion;for instance, the values of � in Cases 2, 3, and 4were 1.01, 1.05, and 1.09, respectively. On the otherhand, the ethanol content in cases with hydrous ethanolinjection resulted in a richer combustion, because no

204 B. Beigzadeh et al./Scientia Iranica, Transactions B: Mechanical Engineering 25 (2018) 196{207
Figure 11. Relative air-to-fuel ratio.
feedback was provided for fuel system of the engine inthese cases. The values of � in Cases 7 and 8 were 0.92and 0.88, respectively.
5.2. ANN training and optimization resultsAs can be seen in Table 4, di�erent training algorithmswith di�erent numbers of neurons (as discussed inSection 3) were evaluated based on three criteria (i.e.,Eqs. (1)-(3)). The results showed that the trainingalgorithm trainlm with 24 neurons in hidden layerhad the best performance. Thus, it was chosen as theengine model to be used in the optimization process.The priority of each input parameter in the costfunction (Eq. (4)) could be determined by changingthe corresponding constants KE , KN , and KC . Asit was discussed in the previous sections, reducing theexhaust emissions results in reduction in �f . Here, thementioned constants were selected in a way that nomore than 2% reduction in �f was allowed to obtainreduced exhaust emissions. Then, we chose:
KE = �800; KN = 8; KC = 2: (10)
Then, the optimization process was run for the inputparameters within the ranges listed in Table 5.
The results are tabulated in Table 6; optimizationresults and experiments indicate that at the maximumtorque speed (i.e., 3000 rpm in this case), both theperformance and emissions, are improved, while at amid-range speed, i.e. 2000 rpm, the performance andCO emission are improved at the expense of slightlyincreased NOx emissions.
6. Conclusion
The main objective of this study was to demonstratethe potential of Arti�cial Neural Networks as a meta-heuristic model to predict the behavior of IC engines,and the use of Arti�cial Bee Colony as a swarmintelligence based algorithm to optimize engine per-formance and emissions. As a case study, oxygenenriched combustion was employed to improve theperformance and emissions of an SI engine fueled withgasoline and hydrous ethanol. The engine was testedat di�erent rates of hydrous ethanol injection in intakeport, ethanol concentrations, and intake air oxygenconcentrations. The engine test results demonstratedthat injecting hydrous ethanol in the intake portof an SI engine led to higher volumetric e�ciency,
Table 5. Range of input parameters for optimization.
Parameter Range
Hydrous ethanol ow rate ( _mHE) 0-1.3 ml/sEthanol concentration inthe hydrous ethanol (CE)
0-30 %
Intake air oxygen concentration (CO2) 21-24.25 %
Table 4. Di�erent ANN setups and training algorithms.
Learningalgorithm
trainlm trainrp trainscg trainbfg
NoN R2 MEP(%)
RMSE R2 MEP(%)
RMSE R2 MEP(%)
RMSE R2 MEP(%)
RMSE
10 0.9839 3.6976 27.9901 0.9619 9.9328 66.4089 0.9758 16.1983 58.3485 0.9499 15.3753 60.4912 0.9909 1.9962 18.4177 0.9736 9.592 57.2892 0.9749 15.781 54.8397 0.9315 17.9094 78.236814 0.9854 3.523 27.8613 0.9628 10.8818 63.5825 0.9838 15.2527 43.8606 0.9537 16.39 58.573316 0.9886 2.5121 26.1302 0.9798 9.0384 50.2893 0.9620 15.9552 51.738 0.9806 14.7625 42.63218 0.9905 1.7666 22.7058 0.9576 10.1759 57.8719 0.9811 16.2088 48.384 0.9699 16.454 54.14120 0.9903 2.4607 24.0985 0.9703 9.6016 55.8838 0.9733 16.3098 48.8909 0.9800 16.1211 45.886822 0.9917 2.2028 24.657624 0.9949 1.709 18.729326 0.9933 1.7598 20.385628 0.9484 3.6104 43.502

B. Beigzadeh et al./Scientia Iranica, Transactions B: Mechanical Engineering 25 (2018) 196{207 205
Table 6. Optimization results.
Condition N (rpm) _mHE (ml/s) CE (%) CO2 (%) �f (%) NOx (ppm) CO (%)
Initial 2000 0 0 0 24.53 602 2.073000 0 0 0 24.11 803 3.83
Optimized 2000 0.35 22.5 23.92 25.54 772 1.683000 0.94 12.3 22.36 24.40 691 2.46
slightly higher fuel conversion e�ciency, higher CO,and lower NOx emissions. On the other hand, theoxygen enrichment of intake air did not a�ect thevolumetric e�ciency, substantially increased the fuelconversion e�ciency and NOx emissions, and in mostof cases reduced the CO. The behavior of the enginewas modeled by training a meta-heuristic model (ANN)using the experimental data. This model was thenused in conjunction with an optimization algorithm tooptimize the engine performance and emissions simul-taneously. Both the optimization and experimentalresults demonstrated that at the maximum torquespeed, 3000 rpm in this case, both the performanceand emissions were improved, while at a mid-rangespeed, 2000 rpm, the performance was improved andthe CO emission was reduced at the expense of slightlyincreased NOx emissions.
Nomenclature
SI Spark IgnitionABC Arti�cial Bee ColonyANN Arti�cial Neural Network_mf Mass ow rate of fuel (kg/s)
OEC Oxygen-Enriched CombustionBTE Brake Thermal E�ciencyBSFC Brake Speci�c Fuel Consumption
(g/kWh)QHV Heating Value of fuel (kJ/kg)SOHC Single overhead camshaftP Brake power (kW)�f Fuel conversion e�ciency_ma Mass ow rate of air induced into the
cylinder�a;i Inlet air density (kg/m3)�v Volumetric e�ciencyN Engine speed (rpm)Vd Displacement volume of the cylinder
(m3)
�
=cpcv
�Ratio of speci�c heats
R Gas constant
T0 Temperature upstream of therestriction
p0 Total pressure upstream of therestriction
AE Flow restriction e�ective areap Pressure at the throat of the restriction�c Combustion e�ciency� Relative air-to-fuel ratio_mx Mass ow rate of pollutant x (g/s)ni Number of moles of species i in the
reactants or products per unit mass ofworking uid
�h0f;i Standard enthalpy of formation ofspecies i at ambient temperature
MEP Mean Error PercentageRMSE Root Mean Square ErrorR2 Absolute fraction of varianceNs Number of the points in the data setA Actual outputPO Predicted OutputNoN Number of hidden layer Neuronstrainbfg BFGS quasi-Newton back-propagationtrainscg Scaled conjugate gradient back-
propagationtrainlm Levenberg-Marquardt back-
propagationTrainrp Resilient back-propagationtansig Hyperbolic tangent sigmoidpurelin LinearWOT Wide Open ThrottleCO2 Intake air oxygen concentrationCE Ethanol concentration in the hydrous
ethanol_mHE Hydrous ethanol ow rate
References
1. C�ay, Y., Korkmaz, I., C� i�cek, A., and Kara, F. \Predic-tion of engine performance and exhaust emissions forgasoline and methanol using arti�cial neural network",Energy, 50, pp. 177-186 (2013).
206 B. Beigzadeh et al./Scientia Iranica, Transactions B: Mechanical Engineering 25 (2018) 196{207
2. Wiesenthal, T., Leduc, G., Christidis, P., Schade,B., Pelkmans, L., and Govaerts, L. \Biofuel supportpolicies in Europe: lessons learnt for the long wayahead", Renew. Sust. Energy. Rev., 13, pp. 789-800(2009).
3. Ismail, H.M., Ng, H.K., Queck, C.W., and Gan,S. \Arti�cial neural networks modelling of engine-out responses for a light-duty diesel engine fuelledwith biodiesel blends", Appl. Energy, 92, pp. 769-777(2012).
4. Costagliola, M.A., De Simio, L., Iannaccone, S., andPrati, M.V. \Combustion e�ciency and engine outemissions of a S.I. engine fueled with alcohol/gasolineblends", Appl. Energy, 111, pp. 162-171 (2012).
5. Chen, R.H., Chiang, L.B., Wub, M.H., and Lin, T.H.\Gasoline displacement and NOx reduction in an SIengine by aqueous alcohol injection", Fuel, 89, pp. 604-610 (2010).
6. Schifter, I., Diaz, L., G�omez, J.P., and Gonzalez, U.\Combustion characterization in a single cylinder en-gine with mid-levels hydrated ethanol-gasoline blendedfuels", Fuel, 103, pp. 292-298 (2013).
7. Al-Hasan, M. \E�ect of ethanol-unleaded gasolineblends on engine performance and exhaust emission",Energy Convers. Manage., 44, pp. 1547-1561 (2003).
8. Kyriakides, A., Dimas, V., Lymperopoulou, E., Karo-nis, D., and Lois, E. \Evaluation of gasoline-ethanol-water ternary mixtures used as a fuel for an Ottoengine", Fuel, 108, pp. 208-215 (2013).
9. Costa, R.C. and Sodr�e, J.R. \Hydrous ethanol vs.gasoline-ethanol blend: engine performance and emis-sions", Fuel, 89(2), pp. 287-293 (2010).
10. Masum, B.M., Masjuki, H.H., Kalam, M.A., RizwanulFattah, I.M., Palash, S.M., and Abedin, M.J. \E�ect ofethanol-gasoline blend on NOx emission in SI engine",Renew. Sustain. Energy Rev., 24, pp. 209-222 (2013).
11. Tavares, J.R., Sthel, M.S., Campos, L.S., Rocha,M.V., Lima, G.R., DaSilva, M.G., and Vargas, H.\Evaluation of pollutant gases emitted by ethanol andgasoline powered vehicles", Procedia. Environ. Sci., 4,pp. 51-60 (2011).
12. Furey, R.L. and King, J.B. \Evaporative and exhaustemissions from cars fueled with gasoline containingethanol or methyltert-butyl ether", SAE Paper, 800261(1980).
13. Rajan, S. \Water-ethanol-gasoline blends physicalproperties, power, and pollution characteristics", J.Eng. Gas. Turb. Power, 106, pp. 841-848 (1984).
14. Rice, R.W., Sanyal, A.K., Elrod, A.C., and Bata,R.M. \Exhaust gas emissions of butanol, ethanol, andmethanol-gasoline blends", J. Eng. Gas. Turb. Power,113(3), pp. 377-381 (1991).
15. Gravalos, I., Moshou, D., Gialamas, T., Xyradakis,P., Kateris, D., and Tsiropoulos, Z. \Performance andemission characteristics of spark ignition engine fuelledwith ethanol and methanol gasoline blended fuels",Alternative Fuel., Published by InTech, pp. 155-174(2011).
16. Rigby, G.R. and Watson, H.C. \Application of mem-brane gas separation to oxygen enrichment of dieselengines", J. Membr. Sci., 87(1-2), pp. 159-169 (1994).
17. Song, J., Zello, V., Boehman, A.L., and Waller, F.J.\Comparison of the impact of intake oxygen enrich-ment and fuel oxygenation on diesel combustion andemissions", Energy Fuels, 18(5), pp. 1282-1290 (2004).
18. Kadota, T. and Yamasaki, H. \Recent advances inthe combustion of water fuel emulsion", Prog. EnergyCombust. Sci., 28, pp. 385-404 (2002).
19. Assanis, D.N., Poola, R.B., Sekar, R., Assanis, D.N.,and Cataldi, G.R. \Study of using oxygen enrichedcombustion air for locomotive diesel engines", J. Eng.Gas Turb. Power, 123, pp. 157-166 (2001).
20. Bisio, G., Bosio, A., and Rubatto, G. \Thermodynam-ics applied to oxygen enrichment of combustion air",Energy Convers. Manage., 43, pp. 2589-2600 (2002).
21. Zhang, W., Chen, Z., Li, W., Shu, G., Xu, B., andShen, Y. \In uence of EGR and oxygen-enriched airon diesel engine NO-smoke emission and combustioncharacteristic", Appl. Energy, 107, pp. 304-314 (2013).
22. Liang, Y., Shu, G., Wei, H., and Zhang, W. \E�ect ofoxygen enriched combustion and water-diesel emulsionon the performance and emissions of turbochargeddiesel engine", Energy Convers. Manage., 73, pp. 69-77 (2013).
23. Ghobadian, B., Rahimi, H., Nikbakht, A.M., Na-ja�, G., and Yusaf, T.F. \Diesel engine performanceand exhaust emission analysis using waste cookingbiodiesel fuel with an arti�cial neural network", Re-new. Energ., 34, pp. 976-982 (2009).
24. Deh Kiani, M.K., Ghobadian, B., Tavakoli, T.,Nikbakht, A.M., and Naja�, G. \Application of arti�-cial neural networks for the prediction of performanceand exhaust emissions in SI engine using ethanol-gasoline blends", Energy, 35, pp. 65-69 (2010).
25. Togun, N.K. and Baysec, S. \Prediction of torque andspeci�c fuel consumption of a gasoline engine by usingarti�cial neural networks", Appl. Energy, 87, pp. 349-355 (2010).
26. Kesgin, U. \Genetic algorithm and arti�cial neuralnetwork for engine optimisation of e�ciency and NOxemission", Fuel, 83, pp. 885-895 (2004).
27. Homaifar, A., Lai, H.Y., and McCormick, E. \Sys-tem optimization of turbofan engines using geneticalgorithms", Appl. Math. Modelling, 18(2), pp. 72-83(1994).
28. Manolas, D.A. \Operation optimisation of an indus-trial cogeneration system by a genetic algorithm",Energy Convers. Manage., 38, pp. 15-17 (1997).
29. Box, G. and Behnken, D. \Some new three leveldesigns for the study of quantitative variables", Tech-nometrics, 2, pp. 455-475 (1960).
30. Mo�at, R.J. \Contributions to the theory of single-sample uncertainty analysis", ASME J. Fluids Eng.,104, pp. 250-260 (1982).

B. Beigzadeh et al./Scientia Iranica, Transactions B: Mechanical Engineering 25 (2018) 196{207 207
31. Sayin, C., Ertunc, H.M., Hosoz, M., Kilicaslan, I., andCanakci, M. \Performance and exhaust emissions of agasoline engine using arti�cial neural network", Appl.Therm. Eng., 27, pp. 46-54 (2007).
32. C�ay, Y. \Prediction of a gasoline engine performancewith arti�cial neural network", Fuel, 111, pp. 324-331(2013).
33. Karaboga, D. \An idea based on honey bee swarmfor numerical optimization", Technical Report-TR06,Erciyes University, Computer Engineering Department(2005).
34. Derakhshan, S., Pourmahdavi, M., Abdollahnejad, E.,Reihani, A., and Ojaghi, A. \Shape optimization of acentrifugal pump impeller using arti�cial bee colonyalgorithm", Comput. Fluids, 81, pp. 145-151 (2013).
35. Celik, M.B. \Experimental determination of suitableethanol-gasoline blend rate at high compression ratiofor gasoline engine", Appl. Therm. Eng., 28, pp. 396-404 (2008).
36. Porter, J.C. \Alcohol-water injection for high compres-sion engines", SAE paper no. 500042 (1950).
37. Nicholls, J.E., EI-Messiri, I.A., and Newhali, H.K.\Inlet manifold water injection for control of nitrogenoxides theory and experiment", SAE paper no. 690018(1969).
38. Weatherford, W.D. and Quillian, R.D. \Total coolingof piston engines by direct water injection", SAE paperno. 700886 (1970).
39. Lestz, S.S., Meyer, W.E., and Colony, C.M. \Emissionsfrom a direct-cylinder water injected spark ignitionengine", SAE paper no. 720113 (1972).
40. Nande, A.M., Wallner, T., and Naber, J. \In uenceof water injection on performance and emissions of adirect-injection hydrogen research engine", SAE paperno. 2008-01-2377 (2008).
41. Brusca, S. and Lanzafame, R. \Water injection inIC-SI engines to control detonation and to reducepollutant emissions", SAE Technical Paper, No. 2003-01-1912 (2003).
42. Heywood, J.B., Internal Combustion Engine Funda-mentals, McGraw-Hill (1988).
43. Al-Hasan, M. \E�ect of ethanol-unleaded gasolineblends on engine performance and exhaust emission",Energy Convers. Manage., 44, pp. 1547-1561 (2003).
44. Masumn, B.M., Masjuki, H.H., Kalam, M.A.,Rizwanul Fattah, I.M., Palash, S.M., and Abedin, M.J.\E�ect of ethanol-gasoline blend on NOx emission inSI engine", Renew. Sust. Energy Rev., 24, pp. 209-222(2013).
45. Mazas, A.N., Lacoste, D.A., and Schuller, T. \Ex-perimental and numerical investigation on the laminar ame speed of CH4/O2 mixtures diluted with CO2 andH2O", ASME Turbo Expo, pp. 411-421 (2010).
46. Bouchard, C.L., Taylor, C.F., and Taylor, E.S. \Vari-ables a�ecting ame speed in the otto-cycle engine",SAE Technical Paper No. 370184 (1937).
47. Eyidogan, M., Ozsezen, A.N., Canakci, M., and Turk-can, A. \Impact of alcohol-gasoline fuel blends on theperformance and combustion characteristics of an SIengine", Fuel, 89, pp. 2713-2720 (2010).
48. Flagan, R.C. and Seinfeld, J.H., Fundamentals of AirPollution Engineering, Courier Corporation (2013).
49. Wu, C.W., Chen, R.H., Pu, J.Y., and Lin, T.H.\The in uence of air-fuel ratio on engine performanceand pollutant emission of an SI engine using ethanol-gasoline blended fuels", Atmos. Environ., 38, pp. 7093-100 (2004).
Biographies
Borhan Beigzadeh received his PhD degree in Me-chanical Engineering from Sharif University of Technol-ogy in 2011, working on dynamic walking systems andstudying their correlation with dynamic passive/activemanipulation systems. He then joined Iran Universityof Science and Technology (IUST) in Tehran, wherehe established Biomechatronics and Cognitive Engi-neering Research Laboratory, since then, he has beenan Assistant Professor in the School of MechanicalEngineering. His research interests cover non-lineardynamics and control, robotics, biomechatronics, andcognitive engineering.
Amin Reihani received his BSc degree in Mechan-ical Engineering from Iran University of Science andTechnology in 2014. He received his MSc degree inMechanical Engineering from University of Michigan -Ann Arbor - in 2015 and started PhD in MechanicalEngineering in 2016 at University of Michigan. Hisresearch interests include energy conversion/storage,and sustainability with applications in automotiveengineering.
Ashkan Ojaghi received his BSc degree in Mechanicalengineering from the Iran University of Science andTechnology in 2014 and is currently an MSc studentin the Department of Mechanical Engineering at YorkUniversity, Canada.


