
Performance and DIR Pharmacy Reimbursement - morx.com 415 pm mapc... · 5‐Star Rated plans have...
27
Understanding Pay For Performance and DIR Impact to Pharmacy Reimbursement
-
Upload
vuongxuyen -
Category
Documents
-
view
213 -
download
1
Transcript of Performance and DIR Pharmacy Reimbursement - morx.com 415 pm mapc... · 5‐Star Rated plans have...

Understanding Pay For Performance and DIRImpact to Pharmacy Reimbursement

A Public Service Announcement brought to you by…
Melanie Maxwell, MHPVice President RxSelect Pharmacy Services

Please Don’t Shoot the Messenger…
PBMsPBMs

Why Plans/PBMs Embrace Pay for Performance?
Increased market pressure to control costs and increase profitability.

How Do Plans/PBMs Benefit From Pay for Performance?
Increased Beneficiary Enrollment 5‐Star Rated plans have certain marketing and enrollment advantages over lower rated plans. Members in a low‐rated plan can switch to a 5‐star rated plan at any time throughout the year, not just during open enrollment. CMS star ratings have been shown to influence Medicare beneficiaries’ choice of a plan.
Increased Revenue MA‐PD Plans achieving star ratings of 4 (“above average”) or 5 (“excellent”) receive quality bonus payments, which can potentially represent millions of dollars in revenue.


Let’s Take A Look at Some P4P Contract Examples

Example A: Pay for Performance
Performance Payment – How the Performance Score is Measured
Diabetes PDC Measure Target: 81%
Pharmacy Performance Score
Percentile Ranking
MeasurePerformance
Score
81.27%
=>90% to 100%=>80% to <90%=>70% to < 80%=>60% to < 70%=>50% to <60%=>40% to <50%=>30% to <40%=>20% to <30%=>10% to <20%=> 0% to <10%
10987654321
RASA PDC Measure Target: 85%
Pharmacy Performance Score
Percentile Ranking
MeasurePerformance
Score
83.2%
=>90% to 100%=>80% to <90%=>70% to < 80%=>60% to < 70%=>50% to <60%=>40% to <50%=>30% to <40%=>20% to <30%=>10% to <20%=> 0% to <10%
10987654321
Cholesterol PDC Measure Target: 83%
Pharmacy Performance Score
Percentile Ranking
MeasurePerformance
Score
84.4%
=>90% to 100%=>80% to <90%=>70% to < 80%=>60% to < 70%=>50% to <60%=>40% to <50%=>30% to <40%=>20% to <30%=>10% to <20%=> 0% to <10%
10987654321

Example A: Pay for Performance
Performance Payment – How the Dollars WorkMeasure Measure
Performance Score
# of patients by Measure
Weighted Performance Score
Diabetes 10 40 400
RASA 9 50 450
Cholesterol 10 35 350
Total 125 1200
Overall Performance Score 1200/125 = 9.6
Overall Performance Payment
Pharmacy Overall Performance Score
Overall Performance
Score
MeasurePerformance
Score
9.6
=>9 to 10=>8 to <9=>7 to < 8=>6 to < 7=>5 to <6=>4 to <5=>3 to <4=>2 to <3=>1 to <2
1
$15.14$13.79$12.44$11.09$9.74$0.00$0.00$0.00$0.00$0.00
Performance Payment Calculation
Measure PerformanceScore
$15.14
Multiplied by Patient Count
125
Total Payment Available $1,892.50
Less MTM Payments [$200.00]
Performance Payment Due Pharmacy
$1,692.50

Example B: Pay for PerformanceCommercial and Medicaid Plans (Optional Plan Participation)
Performance Payment – How the Performance Score is Measured• Diabetes PDC• Congestive Heart Failure • Non‐RASA Hypertension• Respiratory PDC
• RASA PDC• Coronary Artery Disease PDC• Breast Cancer PDC• Depression PDC
• Cholesterol PDC• Osteoporosis PDC• Behavioral Health PDC
Each Measure is evaluated individually and then weighted by number of patients by pharmacy.
Pharmacy Performance Score(Each Measure)
PharmacyScore
Measure Target
Percentile Ranking Measure Performance Score
DiabetesCongestive Heart Failure Non‐RASA HypertensionRespiratory RASA Coronary Artery Disease Breast Cancer Depression Cholesterol Osteoporosis Behavioral Health
81.7%66.5%66.6%75%83.2%40%83.2%51.7%84.4%78.4%100%
81%
84%70%85%86%
81%83%
78%
=>90% to 100%=>80% to <90%=>70% to < 80%=>60% to < 70%=>50% to <60%=>40% to <50%=>30% to <40%=>20% to <30%=>10% to <20%=> 0% to <10%
10987654321

Example B: Pay for PerformanceCommercial and Medicaid Plans (Optional Plan Participation)
Performance Payment – How the Dollars WorkMeasure Measure Perf.
Score# of patients by Measure
Weighted Perf. Score
Diabetes 10 40 400
CHF 8 50 400
Non‐RASA 6 35 210
Respiratory 10 30 300
RASA 8 40 320
CAD 2 50 100
Breast Cancer 8 10 80
Depression 2 10 20
Cholesterol 10 50 500
Osteoporosis 6 20 120
Behavioral Health 10 20 200
Total 355 2650
Overall Performance Score 2650/355 = 7.46
Overall Performance Payment
Pharmacy Overall Performance Score
Overall Performance
Score
MeasurePerformance
Score
7.46
=>9 to 10=>8 to <9=>7 to < 8=>6 to < 7=>5 to <6=>4 to <5=>3 to <4=>2 to <3=>1 to <2
1
$11.50$10.45$9.40$8.35$7.30$0.00$0.00$0.00$0.00$0.00
Performance Payment Calculation
Measure PerformanceScore
$9.40
Multiplied by Patient Count
355
Total Payment Available $3,337.00
Less MTM Payments [$200.00]
Performance Payment Due Pharmacy
$3,137.00

Example C: Pay for Performance
A New Type of Network Performance Program has been developed.It contains three components:1. Performance Payment – Performance scores for key adherence measures
2. DIR Fee Reduction – individual pharmacy performance determines level of DIR assessed.
3. Re‐Credentialing and Attestation Requirement – pharmacy must complete re‐credentialing requirements AND complete Medicare program attestations by end of year.
Performance Payments by Reduced DIR Fees

What is DIR?......Direct and Indirect Remuneration
Paraphrased Definition from CMS 42 CFR Section 423.308
• “any and all rebates, subsidies, or other price concessions from any source “Including manufacturers, pharmacies, enrollees, or any other person or entity) that serve to decrease the costs incurred by the Part D sponsor (whether directly or indirectly) for the Part D drug.”
• “-includes price concessions from manufacturers received by subcontractors of Part D sponsors, such as PBM.”
• “May include risk-sharing arrangements, generic dispensing incentive payments made after the point-of-sale.”

What is DIR?......Direct and Indirect Remuneration
The Real Reason Plans (PBMs) like DIR –
When calculating a Plan’s risk share with CMS:• Higher percent of the DIR fee is used to reduce a Plan’s administrative costs instead of being applied directly to drug cost.

Example C: Pay for Performance
Performance Based DIR Fee Reduction – How Performance Scores are Measured
Category Weight
• ACE/ARB• Statin • Diabetes • GAP Therapy (statin)• CMR Completion Rate• % High Risk Meds• Formulary Compliance
20%20%20%25%5%5%5%
Performance Score DIR Fee (% of IngCost Paid)
5 3.5%
4 4.0%
3 4.5%
2 5.0%
1 5.5%
NOTE: DIR Fees are deducted from 835 Remittance Advice….You do not see DIR fees on the adjudicated claim response.

Example C: Pay for Performance
Performance Based DIR Fee Reduction – How the Dollars WorkCategory Weight Pharmacy A
PerformancePharmacy B Performance
• ACE/ARB• Statin • Diabetes • GAP Therapy (statin)• CMR Completion Rate• % High Risk Meds• Formulary Compliance
20%20%20%25%5%5%5%
5555555
1111111
Weighted Average 5 1

Example C: Pay for Performance
Performance Based DIR Fee Reduction – How the Dollars Work
Impact to Reimbursement Esomeprazole 40mg
Pharmacy A Performance
Pharmacy B Performance
Ingredient Cost Paid $229.98 $229.98
Dispense Fee Paid $1.00 $1.00
Patient Copay $10.00 $10.00
Total Amount Paid $220.98 $220.98
DIR Fee $8.05 $12.65
Total Net Reimbursement $212.93 $208.33$4.60 variance on reimbursement
due to performance
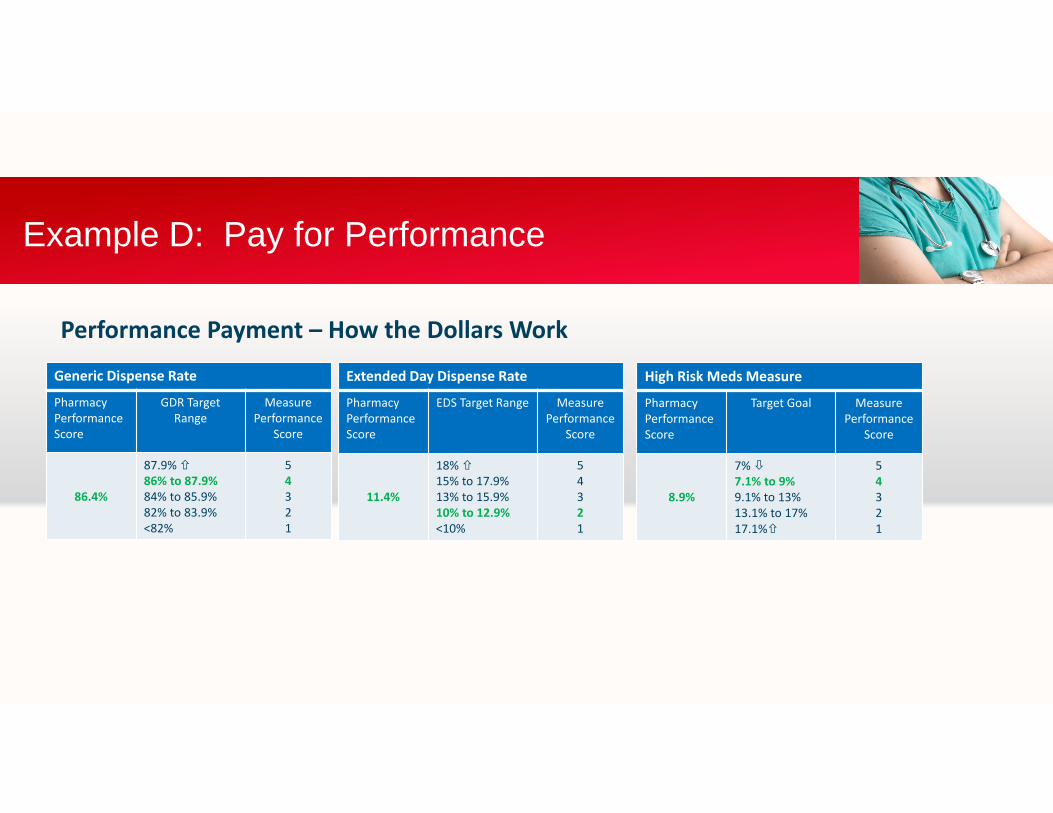
Example D: Pay for Performance
Performance Payment – How the Dollars Work
Generic Dispense Rate
Pharmacy Performance Score
GDR Target Range
MeasurePerformance
Score
86.4%
87.9% 86% to 87.9%84% to 85.9%82% to 83.9%<82%
54321
Extended Day Dispense Rate
Pharmacy Performance Score
EDS Target Range MeasurePerformance
Score
11.4%
18% 15% to 17.9%13% to 15.9%10% to 12.9%<10%
54321
High Risk Meds Measure
Pharmacy Performance Score
Target Goal MeasurePerformance
Score
8.9%
7% 7.1% to 9%9.1% to 13%13.1% to 17%17.1%
54321

Example D: Pay for Performance
Performance Payment – How the Dollars Work• Retro DIR Adjustment• Lump Sum Adjustment on
Remittance Advice
# of patients by Measure
Average Performance
Score Calculation
GDR 4
EDS 2
High Risk Meds 4
Overall Performance
Score3.33
Overall Performance Payment
Pharmacy Overall Performance Score
Average Pharmacy
Performance Range
DIR Fee
3.33
5.04.0 to 4.93.0 to 3.92.0 to 2.91.0 to 1.9
$2.00$2.50$3.00$3.50$4.00
Measurement Period Month DIR Payable
Q1 2016 (Jan‐Mar) June 2016
Q2 2016 (Apr‐Jun) Sept 2016
Q3 2016 (Jul‐Sep) Dec 2016
Q4 2016 (Oct‐Dec) March 2017

If Only……PBMs Were Paid for Performance

If Only……PBMs Were Paid for Performance

THANK YOU!