Performance and Asset Management Branch Multimodal ...
67
4201 E. Arkansas, Suite 262, Denver, CO 80222 P 303.757.9204 F 303.757.9656 www.codot.gov Purpose To report on progress made towards meeting the objectives in Policy Directive (PD) 14 in the areas of Safety, Infrastructure Condition (Asset Management), System Performance, and Maintenance, and review proposed changes. In August 2017, there was a Commission Workshop on the PD 14 System Performance (including Transit) goal area. This month, staff will conduct a workshop on the Safety, Infrastructure Condition, and Maintenance goal areas. Action No action requested this month. Review of current performance and proposed changes to performance measures and objectives for Infrastructure Condition, Maintenance, and Safety goal areas. The Commission will be asked to adopt the proposed updates to PD 14 in October. Background PD 14 provides a framework for development of the Statewide Transportation Plan (SWP) and guides the distribution of resources in the SWP, the Statewide Transportation Improvement Program (STIP), and the annual budget. To better align budget setting with PD 14, the Commission annually reviews the performance of PD 14 objectives to determine if there is a need to modify objectives or realign resources to meet an objective(s). Details Attachment A: 2016 PD 14 Scorecard graphically summarizes the performance of PD 14 objectives for the current and prior year. Since most performance measures generally lag by roughly a year, the current performance year is 2016. Attachment A also includes information on the dedicated funding sources and funding levels associated with each objective. The notes column provides additional background, technical details, and recommended next steps, where applicable. The September Transportation Commission workshop will include a review of highway performance measures for Safety, Infrastructure Condition, and Maintenance. As shown in Chart 1, these performance areas comprise roughly 60% of CDOTs total Budget (excluding Senate Bill 228 transfers). Performance and Asset Management Branch Multimodal Planning Branch 4201 East Arkansas Ave, Suite 262 Denver, CO 80222 MEMORANDUM DATE: September 20, 2017 TO: Transportation Commission FROM: Joshua Laipply, Chief Engineer Debra Perkins-Smith, Director, Division of Transportation Development William Johnson, Performance and Asset Management Branch Manager SUBJECT: Policy Directive 14 Current Performance and Proposed Changes
Transcript of Performance and Asset Management Branch Multimodal ...

4201 E. Arkansas, Suite 262, Denver, CO 80222 P 303.757.9204 F 303.757.9656 www.codot.gov
Purpose To report on progress made towards meeting the objectives in Policy Directive (PD) 14 in the areas of Safety, Infrastructure Condition (Asset Management), System Performance, and Maintenance, and review proposed changes. In August 2017, there was a Commission Workshop on the PD 14 System Performance (including Transit) goal area. This month, staff will conduct a workshop on the Safety, Infrastructure Condition, and Maintenance goal areas. Action No action requested this month. Review of current performance and proposed changes to performance measures and objectives for Infrastructure Condition, Maintenance, and Safety goal areas. The Commission will be asked to adopt the proposed updates to PD 14 in October. Background PD 14 provides a framework for development of the Statewide Transportation Plan (SWP) and guides the distribution of resources in the SWP, the Statewide Transportation Improvement Program (STIP), and the annual budget. To better align budget setting with PD 14, the Commission annually reviews the performance of PD 14 objectives to determine if there is a need to modify objectives or realign resources to meet an objective(s). Details Attachment A: 2016 PD 14 Scorecard graphically summarizes the performance of PD 14 objectives for the current and prior year. Since most performance measures generally lag by roughly a year, the current performance year is 2016. Attachment A also includes information on the dedicated funding sources and funding levels associated with each objective. The notes column provides additional background, technical details, and recommended next steps, where applicable. The September Transportation Commission workshop will include a review of highway performance measures for Safety, Infrastructure Condition, and Maintenance. As shown in Chart 1, these performance areas comprise roughly 60% of CDOTs total Budget (excluding Senate Bill 228 transfers).
Performance and Asset Management Branch Multimodal Planning Branch 4201 East Arkansas Ave, Suite 262 Denver, CO 80222 MEMORANDUM
DATE: September 20, 2017 TO: Transportation Commission FROM: Joshua Laipply, Chief Engineer
Debra Perkins-Smith, Director, Division of Transportation Development William Johnson, Performance and Asset Management Branch Manager
SUBJECT: Policy Directive 14 Current Performance and Proposed Changes

4201 E. Arkansas, Suite 262, Denver, CO 80222 P 303.757.9204 F 303.757.9656 www.codot.gov
Chart 1.
Current performance in these areas are described below. Staff will review proposed changes to performance measures and objectives for Infrastructure Condition. No changes to performance measures and objectives for the Maintenance or Safety goal areas are proposed at this time.
Safety – All Highways: Safety performance data and economic impact of crashes for 2016 is preliminary and will not be finalized until the end of the calendar year (this is due to delayed reporting of some crashes, data incompleteness due to data system upgrade and transition, and 2016 data not being official until late 2017). Performance objectives for fatalities were not met in 2016. Fatalities continue on an upward trend, increasing to 608 in 2016 as compared to a target of 452. The increase in fatalities can largely be explained by an 11% increase in vehicle miles traveled (VMT) between 2013 and 2016. However, the rate of fatalities also increased from 1.085 per 100 million VMT in 2015 to 1.169 in 2016. Objectives were met for serious injuries, with a reduction in the number of serious injuries from 3,209 in 2015 to 2,855 in 2016 (still preliminary). The rate per 100 million VMT also decreased from 6.362 in 2015 to 5.48 in 2016. While the significant increase in fatalities in recent years is concerning, staff are not recommending changes to the performance objective at this time. The current objectives still reflect the statewide and CDOT commitment to Toward Zero Deaths and to Colorado’s 2015-19 Strategic Highway Safety Plan to halve fatalities by 2030 and reduce fatalities to single digits by 2050. While safety targets have not been met, rapid improvements in vehicle technology and CDOT’s plan for connected vehicle and infrastructure technology have the potential to improve vehicle safety in the future. Safety – Bike & Pedestrian: Safety performance data for 2016 is preliminary and will not be finalized until the end of the calendar year. Both the number of bicyclist and pedestrian fatalities and serious injuries involving motorized vehicles increased in 2016. The increase in bike and pedestrian fatalities and serious injuries is likely the result of an increase in VMT and bike/ped activity, as well as possible growth in distracted driving. As with the highway measures, staff is recommending that current objectives be retained despite the increase. Advances in technology have the potential to also improve safety for bicyclists and pedestrians. Additional efforts to improve the safety of bicyclists and pedestrians include implementation of CDOT’s bike/ped policy, Share the Road Campaign, and bicycle-friendly motorist training.

4201 E. Arkansas, Suite 262, Denver, CO 80222 P 303.757.9204 F 303.757.9656 www.codot.gov
Infrastructure Condition: This is our Transportation Asset Management (TAM) program. Performance targets for pavement, culverts, geohazards, and tunnels were achieved in 2016. Bridge, which has seven performance metrics, achieved targets related to structural deficiency and load restriction; however, all other targets were not met. Performance targets for buildings, ITS, road equipment, signals, and walls were not achieved. Staff have evaluated the efficacy of the current performance metrics and targets and are requesting that the Commission refine some targets as described in the Target Refinement section below. Many of the original targets were established before many programs had the data, analysis methodology, and tools we currently have. Proposed changes are discussed in more detail in Attachment B. Maintenance: This is part of our TAM Program. Maintenance has two performance objectives in PD 14: to maintain an overall Maintenance Levels of Service (MLOS) B minus for the statewide system, and to maintain an LOS B grade for snow and ice removal. The snow and ice objective was met, however, the overall MLOS objective was not. The cost of achieving a B minus for MLOS over the next 10 years is $4.07 billion, requiring an average annual budget of $407 million compared to current funding of roughly $273 million. The level of current funding and staff resources limit our ability to achieve the current maintenance performance objectives.
TAM Target Refinement Attachment B: TAM Metric and Target Change Matrix graphically summarizes the proposed changes to Infrastructure Condition performance measures and objectives. In 2013, as staff was developing the first generation of performance measures and objectives, some programs had limited data sets and analysis capabilities that could be used in target setting. To advance the asset management program, staff made a decision to use the best available information to get started in applying asset management principles. Staff now have a few years of experience in asset management, better inventories and condition assessments, more advanced analytical capabilities, and the Asset Investment Management System (AIMS) and is now better able to set realistic targets more closely aligned with fiscal constraint. Staff therefore recommends refining some of the performance measures and targets adopted by the Commission in PD 14. The refinements represent a reduction in overall need from an annual average of $1.09 billion over ten years to an average of $1.05 billion annually over ten years, as shown in Chart 2. While the change seems small, it is important to remember that staff are not making a recommendation to change the targets for CDOT’s largest asset categories: surface treatment, MLOS, or bridge structural deficiency. Chart 2. Updated 9.26.17.

4201 E. Arkansas, Suite 262, Denver, CO 80222 P 303.757.9204 F 303.757.9656 www.codot.gov
The proposed changes to PD 14 for Infrastructure Condition are outlined in Attachment B. A tracked changes version of PD 14 (Attachment C) and a draft resolution (Attachment D) for approval is also attached for consideration. More detailed information on TAM is available in Attachment E. Staff anticipate returning to the Transportation Commission in October for approval of updates to PD 14. Impact of Changes on FY 2018-19 Planning Budget and Future TAM Need Table 1 shows the proposed FY 2018-19 budget and the need to achieve proposed targets. The planning budget is $755 million and the total need is $1.05 billion, leaving a shortfall of $294 million. Table 1.
Next Steps
• Transportation Commission approval of proposed changes to PD 14 • Consideration of PD 14 in development of FY 2019 CDOT Budget
Attachments
• Attachment A: 2016 PD 14 Scorecard • Attachment B: TAM Metric and Target Change Matrix • Attachment C: Draft Updated PD 14 • Attachment D: Draft Resolution • Attachment E: Presentation
Budget Target Results Target Met? Budget Target Results Target Met?
Reduce fatalities by 12 per year from 548 in 2008 to 344 in 2025
452 608 464 547 N/A
Reduce the fatality rate per 100 million VMT by 0.02 per year from 1.03 in 2013 to 0.79 in 2025
0.97 1.169 0.99 1.085 N/A
Reduce the serious injuries by 90 per year from 3,200 in 2013 to 2,120 in 2025
2930 2855 3020 3209 N/A
Reduce the serious injury rate by 0.2 per 100 miliion VMT per year from 6.86 in 2013 to 4.46 in 2025
6.26 5.48 6.46 6.362 N/A
Reduce the economic impact of crashes annually by 1% over the previous calendar year
$4.76 B $4.97 N/A $4.52 B $4.81 B N/A
Reduce the number of bicyclist and pedestrian fatalities involving motorized vehicles, from 67 in 2013 to 47 in 2015
62 100 64 78 N/A
Reduce the number of bicyclist and pedestrian serious injuries involving motorized vehicles from 469 in 2013 to 311 in 2025
430 449 443 482 N/A
N/A
2016 performance data is preliminary and is not final until December 31, 2017.
The increase in bike and pedestrian fatalities and serious injuries is likely the result of an increase in VMT and bike/ped activity, and possible growth in distracted driving.
Recommended next steps - Implement PD 1602.1 as a means to incorporate bicycle and pedestrian accommodation in all that we do. Work to identify High Priority Bicycle Corridors so that bicyclists have a better understanding of which facilities are best for riding. Revamp the Share the Road Campaign by implementing Bicycle-Friendly Motorist training that teaches drivers how to interact with bicyclists on the road. Update Bicycle and Pedestrian Facility Design classes to ensure the latest safety strategies are understood by designers and planners.
N/A N/A
2016 Policy Directive 14 ScorecardRevised August 2017
SafetyAll Highways
Bike & Pedestrian
$97.4 million
FASTER SafetyHSIP
Highway Safety EducationHot Spots
2016 performance data is preliminary and is not final until December 31, 2017. The 2016 economic anlaysis is an estimate at this time. Due to pending 2016 records, an estimate of the economic impact of those estimated crashes was made based upon past years averages).
The increase in fatalities can be largely explained by an 11% increase in VMT between 2013 and 2016.
Because a third of our fatalities involve occupants not wearing seat belts, significant numbers of lives could be saved if Colorado had a primary seat belt law.
Recommended next steps - Continued improvement and application of safety analysis, and more strategic use of safety funding for safety projects. The SHSP identified eight strategic emphasis areas for CDOT, as well as other safety stakeholder agencies, to focus safety improvement efforts. In CDOT's dedicated safety programs, HQ and Regions are collaborating to use state of the art safety analysis techniques to find the most effective locations for crash reduction, and fund those projects in a strategic four-year plan. (SHSP)
$98.7 million
2017 Proposed Metric Changes
PD 14.0 Objectives2016 2015 Dedicated Funding
Sources1 Notes
Attachment A: 2016 PD 14 Scorecard

Budget Target Results Target Met? Budget Target Results Target Met?2017 Proposed Metric
ChangesPD 14.0 Objectives
2016 2015 Dedicated Funding Sources1 Notes
Prevent the spread of congestion by maintaining a Planning Time Index (PTI) of 1.05 or less on 90% or greater of Interstate centerline miles
90% 88.1% 90% 90.7% N/A
Prevent the spread of congestion by maintaining a PTI of 1.16 or less on 90% or greater of National Highway System (NHS) centerline miles, excluding Interstates
90% 82.4% 90% 86.0% N/A
Prevent the spread of congestion by maintaining a PTI of 1.12 or less on 90% or greater of Colorado Freight Corridor centerline miles
90% 85.6% 90% 91.6% N/A
Increase ridership of small urban and rural transit grantees by at least an average of 1.5%, per year, statewide over a five-year period beginning in 2012
22,459,084 N/A N/A 22,127,177 23,333,274 N/A
Maintain or increase the total number of revenue service miles of CDOT-funded regional, inter-regional, and inter-city passenger service over that recorded for 2012
N/A N/A N/A N/A N/A N/A N/A
Maintain the percentage of vehicles in the rural Colorado transit fleet at no less than 65% operating in fair, good, or excellent condition, per Federal Transit Administration Guidelines
65% 68.7% 65% 81%
The 2016 results for percentage of fleet operating in fair, good, or excellent condition reflects data as of August 2017. 2015 results are not considered accurate due to incomplete data, 2015 being the first year grant partners were asked to provide vehicle condition data. Positive performance in 2016 can be attributed to a grant selection process that strategically prioritizes replacing older and higher-mileage vehicles.
Recommended next steps - DTR to continue to encourage rural Colorado transit agencies to update inventory and condition of their fleet annually, according to the Federal Transit Administration (FTA) guidelines on age and mileage of vehicles.
N/A
CDOT completion of a group transit asset management plan, with the involvement and participation of CDOT transit grantees, by December 2017
N/A On Track N/A N/A On Track N/A
Whereas, FTA previously required rural grantees develop their own asset management systems, DOTs are now tasked with developing a single Group Asset Management Plan for all rural providers. All Colorado grantees will be in compliance as CDOT completes the plan in early to mid 2018.
PROPOSED: Eliminate metric.
Infrastructure ConditionTransit
Ridership targets are generated from a compounding 1.5% increase from the base ridership in 2012 of 21,160,595. The target at the end of the five year period, in 2017, is a ridership of 22,795,970, a 7.7% increase from 2012 ridership.
Ridership and revenue service mile results come from the National Transit Database. FY16 ridership data and revenue service miles data is anticipated in late 2017 to early 2018.
Recommend next steps - Divison of Transit and Rail (DTR) worked with the small urban and rural transit grantees to develop a new funding allocation methodology, which will accommodate new transit providers and maximize the ridership achieved with available funding. Additional next steps include the retention of consultant support to assist with revenue service miles data collection, among other tasks.
Transit
$34.5 million
$44.2 millionFTA ProgramsFASTER Transit
Highways
$36.0 million
$42.1 million
As the Colorado population, transportation demand, total crashes and incidents, and vehicle miles traveled (VMT) increase, the travel reliability performance of both Interstate corridors and National Highway System (NHS) corridors continues to decline. However, the rate of travel time performance decline has been mitigated by operational improvements and strategic improvements to capacity. In 2016, CDOT improved travel time reliability in some corridors with the implementation of Tolled Express Lanes, expanded Safety Patrol services, enhanced winter operations coordination, and improved Traffic Incident Management with corridor First Responders.
Recommended next steps-Continue deployment of operational solutions, new technology, targeted capacity improvements, improved signal phase and timing, corridor specific traffic incident management, improved public information, and other strategies to incrementally mitigate the speed at which congestion growths on the interstate and NHS.
System Performance
ITS MaintenanceITS Investments
TSMO Performance Program
Congestion Relief
$42.1 millionFTA ProgramsFASTER Transit
$44.2 million
Attachment A: 2016 PD 14 Scorecard

Budget Target Results Target Met? Budget Target Results Target Met?2017 Proposed Metric
ChangesPD 14.0 Objectives
2016 2015 Dedicated Funding Sources1 Notes
Achieve 80% High/Moderate Drivability Life for Interstates based on condition standards and treatments set for traffic volume categories
80% 94% 80% 91% N/A
Achieve 80% High/Moderate Drivability Life for NHS, excluding Interstates, based on condition standards and treatments set for traffic volume categories
80% 85% 80% 84% N/A
Achieve 80% High/Moderate Drivability Life for the state highway system based on condition standards and treatments set for traffic volume categories
80% 80% 80% 79% N/A
Maintain the percent of NHS total bridge deck area that is not structurally deficient at or above 90%
90.0% 95.5% 90.0% 94.9% N/A
Maintain the percent of state highway total bridge deck area that is not structurally deficient at or above 90%
90.0% 95.1% 90.0% 94.5% N/A
Percentage of bridge crossings over Interstates, U.S. Routes and Colorado state highways with a vertical clearance less than the minimum design requirement of 14 feet-6 inches
0.4% 1.7% 0.4% 2.5%
A bridge with a vertical clearance of less than 14'-6"-- statutory maximum vehicle height--has a high risk of being hit by a tall load or legal load. $4.4 million per year is needed annually beyond FY 2021 to achieve the updated target of 1% by 2026.
N/A
Percentage of bridge crossings over Interstates, U.S. Routes and Colorado state highways with a vertical clearance less than the minimum design requirement of 16 feet-6 inches
4.8% 19.8% 4.8% 20.9%
16'-6" is the minimum clearance used when designing new bridges over a roadway. A bridge with a vertical clearance less than 16'-6" but greater than or equal to 14'-6" has a medium to high risk of being hit by a tall load. $6.9 million per year is needed annually beyond FY 2021 to achieve the updated target of 18% by 2026.
N/A
Percentage of CDOT-owned bridges posted for load
0.0% 0.2% 0.0% 0.1%
Vehicles meeting the legal load limits (as defined in C.R.S. 42-4-502 - 42-4-504) can travel on Colorado Interstates, US and State Highways without an approved permit. Ollder bridges may need to be posted since some of these bridges were not designed for legal loads. Load posted structures impact mobility by restricting both legal and permitted loads. $2.1 million per year is needed annually beyond FY 2021 to achieve the updated target of 0.10% by 2026.
N/A
A structurally deficient bridge is typically one where corrosion or deterioration has resulted in a portion of the bridge being in poor condition; for example, where water leaking through an expansion joint has caused the end of a steel girder to rust. Currently exceeding target and will continue to exceed target through 2026; however, the bridge program has 7 metrics geared towards mitigation of risks (below), and five of those are not achieving their target. (% of CDOT-owned bridges over waterways that are scour critical, % of CDOT-owned bridges posted for load, % of leaking expansion joint by length on CDOT-owned bridges, and % of CDOT-owned bridge deck area that is unsealed or otherwise unprotected.)
Recommended next steps - for the five risk mitigation metrics not achieving their target, staff are working to identify additional strategies that can be implemented with no additional funding. Current strategies include identifying bridges that can easily be repaired or remedied with the most cost-effective treatment.
Although targets were met in 2016, given the current planning budgets, it is anticipated that targets for pavement condition will not be met beginning next year, and will continue to remain below the target through 2026. In 2026 it is anticipated that only 69% of the state highway system will have high or moderate Drivability Life. $302.5 million per year is needed annually beyond FY 2021 to achieve the target by 2026.
Recommended next steps - Staff will work to improve/tighten the link between pavement maintenance and pavement model recommendations, and evaluate the effect of pavement preventive maintenance on DL to identify strategies.
Surface Treatment Program
RAMP Funding
$164.1 million $168.2 million
Colorado Bridge Enterprise
On-System BridgeRAMP Funding
Bridges
$235.9 million
Highways
$235.2 million
Attachment A: 2016 PD 14 Scorecard

Budget Target Results Target Met? Budget Target Results Target Met?2017 Proposed Metric
ChangesPD 14.0 Objectives
2016 2015 Dedicated Funding Sources1 Notes
Percentage of CDOT-owned bridges with a load restriction
3.0% 1.6% 3.0% 2.5%
Permit loads (as defined in the Colorado Bridge Weight Limit Map/CDOT Bridge Rating Manual) are typically heavier and longer than the legal loads and require an approved permit in order to travel on Colorado highways. Ollder bridges may need to be restricted for passage since some of these bridges were not designed for permit loads. Permitted loads have a certain combination of axle weight and spacing that distributes the load in an acceptable combination for crossing over structures. $6.1 million per year is needed annually beyond FY 2021 to achieve the updated target of 0.9% by 2026.
N/A
Percentage expansion joints in poor condition by length on CDOT-owned bridges
15.0% or less
25.3%15.0% or less
18.4%
Leaking expansion joints allow water and deicing chemicals onto superstructure and substructure elements which can accelerate corrosion and lead to early onset of a structural deficiency. Keeping expansion joints sealed slows the rate of bridges dropping into structurally deficient.
N/A
Percentage of CDOT-owned bridge deck area that is unsealed or otherwise unprotected
30.0% or less
44.5%30.0% or less
45.6% Unsealed bridge decks deteriorate faster than sealed bridge decks. N/A
Statewide letter grade (Percent C or better) of CDOT Buildings
$12.9 million 90% 74% $20.8 million 90% 80%Property Allocation
ProgramRAMP Funding
Given the current planning budgets, buildings will not achieve its target between now and 2026. In 2026 the expected performance is 69%. $41.9 million per year is needed annually beyond FY 2021 to achieve the updated target of 85% C or better by 2026.
Recommended next steps – Staff will improve awareness of preventive maintenance as a priority, and determine level of funding needed for building preventive maintenance.
N/A
Average Percent Useful Life of ITS Equipment $21.4 million90%
or lessN/A N/A $27.6 million
90% or less
114%ITS MaintenanceRAMP Funding
Given the current planning budgets, ITS will not achieve its target between now and 2026. In 2026 the expected performance is 209%. $31.5 million per year is needed annually beyond FY 2021 to achieve the target by 2026.
Recommended next steps – Staff to refine inventory by breaking down devices into manageable maintenance pieces that can be tracked individually for cost savings advantages. Staff will also investigate the benefits of preventive maintenance for select devices, and further refine device useful life parameters by tracking asset service life to compare to manufacturer estimates.
N/A
Average Percent Useful Life of Fleet Equipment $18.4 million70%
or less87% $14.0 million
70% or less
90%Road Equipment Program
RAMP Funding
Given the current planning budgets, road equipment will not achieve its target between now and 2026. In 2026 the expected performance is 77%. $24.1 million per year is needed annually beyond FY 2021 to achieve the updated target of 75% by 2026.
Recommended next steps – Saff will communicate the importance of fleet planning and develop regional fleet optimization recommendations, develop a fleet performance measure that reflects cost effectiveness rather than asset life, and monitor implementation of fleet preventive maintenance work orders.
N/A
Fleet
Buildings
ITS
Attachment A: 2016 PD 14 Scorecard

Budget Target Results Target Met? Budget Target Results Target Met?2017 Proposed Metric
ChangesPD 14.0 Objectives
2016 2015 Dedicated Funding Sources1 Notes
Percent of culverts that are in poor condtion (have a rating of 4 or less)
$8.2 million 5% 4.87% $9.6 million 5% 4%Structures On-System
RAMP Funding
Although the target is currently being met, given current planning budgets, it is expected that the target will not be met in the future. In 2026 the expected performance is 7.3%. $12.8 million per year is needed annually beyond FY 2021 to achieve the target by 2026.
Recommended next steps – Staff are undertaking analysis to identify strategies.
N/A
Percent of segments at or above risk grade C $9.2 million 80% 92% $9.1 million 80% 78%Rockfall Mitigation
RAMP Funding
Increased data collection efforts have provided a better picture of actual performance. Current performance results in a $40.5M annual risk from Geohazard events. $27.7 million per year is needed annually beyond FY 2021 to achieve the updated target of 85% risk grade B or above by 2026.
Recommended next steps - Continued improvement in data collection.
PROPOSED: Percent of segments at or above risk grade B
Percentage of network tunnel length with all elements in equal or better condition than 2.5 Weighted Condition Index
$5.2 million 80% 91% $12.4 million 80% 91%Structures On-System
RAMP Funding
Although the target is currently being met, given current planning budgets, it is expected that the target will not be met in the future. In 2026, the expected performance is 52%.$9.2 million per year is needed annually beyond FY 2021 to achieve the updated target of 75% by 2026.
Recommended next steps – Staff are undertaking analysis to identify strategies.
N/A
Percent of intersections with at least one signal assembly beyond 100% useful life.
$5.7 million 15% N/A N/A $1.5 million 15% or less 27% Traffic Signals Program
Given the current planning budgets, signals is expected to achieve the target by 2026.
Recommended next steps – Staff are undertaking analysis to identify strategies.
PROPOSED: Percent of Signal Infrastructure in severe condition (dollar weighted)
Percentage of CDOT-owned walls, by square foot, that are in poor condtion (have a rating of 4 or less)
$2.4 million 1% 4.15% $0.0 miliion 1% 5%Structures On-System
RAMP Funding
Given the current planning budgets, walls is not expected to meet its target between now and 2026. In 2026 the expected performance is 92%. $24.1 million per year is needed annually beyond FY 2021 to achieve the updated target of 2.5% by 2026.
Recommended next steps – Staff are undertaking analysis to identify strategies.
N/A
Maintain a LOS B grade for snow and ice removal
$83.4 million B B $74.3 million B BSnow and Ice ControlSnow and Ice Reserve
N/A
Maintain an overall MLOS B minus grade for the state highway system
$254.4 million B- C+ $251.3 million B- B- Maintenance N/A
1 Additional flexible funding sources with a wide range of eligibility could be used to address multiple objectives. Examples include RPP, STP-M, CMAQ, and TAP
The cost of achieving a B minus for MLOS over the next 10 years is $4.07 billion, requiring an average annual budget of $407 million compared to current funding of roughly $273 million. The level of current funding and staff resources limit our ability to achieve the current maintenance performance objectives.
Maintenance
Traffic Signals
Culverts
Geohazards
Tunnels
Walls
Attachment A: 2016 PD 14 Scorecard

Asset Measure Fiscally Constrained Target
Proposed Fiscally Constrained Target
Aspirational TargetProposed Aspirational
TargetReason for Target Change
Percentage of deck area on structurally deficient CDOT - owned bridges 10% No Change 5% No Change No ChangePercentage of deck area on structurally deficient bridges on the NHS 10% No Change 5% No Change No ChangePercentage of CDOT - owned bridges over waterways that are scour critical 5% No Change 1% No Change No Change
Percentage of bridge crossings over Interstates, U.S. routes and Colorado state highways with a vertical clearance less than the statutory maximum vehicle height of 14 feet - 6 inches
0.40% 1.00% 0.00% No ChangeThe number of bridges with vertical clearance issues is greater than originally projected. Current funding strategy is unable to address issues, so staff recommend adjusting the target.
Percentage of bridge crossings over Interstates, U.S. Routes and Colorado state highways with a vertical clearance less than the minimum design requirement of 16 feet - 6 inches
4.80% 18.00% 2.00% 12.00%The number of bridges with vertical clearance issues is greater than originally projected. Current funding strategy is unable to address issues, so staff recommend adjusting the target.
Percentage of CDOT - owned bridges posted for load 0.00% 0.10% 0.00% No ChangeUpdated inventory found more bridges with lower than desirable conditions. Current funding strategy is unable to address issues, so staff recommend adjusting the target.
Percentage of CDOT - owned bridges with a load restriction 3.00% 0.90% 1.00% 0.00% We are doing better that originally projected, so staff recommend adjusting the target.
Percentage of leaking expansion joint by length on CDOT - owned bridges 15% 26% 5% 15%Updated inventory found more bridges with lower than desirable conditions. Current funding is unable to keep up with the rate of decline, so staff recommend adjusting the target.
Percentage of CDOT - owned bridge deck area that is unsealed or otherwise unprotected
30% 35% 5% 20%Updated inventory found more bridges with lower than desirable conditions. Current funding is unable to keep up with the rate of decline, so staff recommend adjusting the target.
Percentage high - moderate drivability life for Interstates based on condition standards and treatments set for traffic volume categories
80% No Change 90% No Change No Change
Percentage high - moderate drivability life for CDOT - owned NHS, excluding Interstates based on condition standards and treatments set for traffic volume categories
80% No Change 90% No Change No Change
Percentage high - moderate drivability life for the State highway system based on condition standards and treatments set for traffic volume categories
80% No Change 90% No Change No Change
Maintenance Statewide letter grade B- No Change B No Change No Change
Buildings Statewide letter grade 90% C or Better 85% C or Better 100% C or Better 90% C or BetterAnalysis indicates that, given fiscal constraints, the old target is not achievable, so staff recommend adjusting the target.
ITS Average percent useful life 90% No Change 85% No Change No Change
Road Equipment Average percent useful life 70% 75% 50% 70%Analysis indicates that, given fiscal constraints, the old target is not achievable, so staff recommend adjusting the target.
Culvertsa Percent culverts in poor condition (have a culvert rating of 4 or less) 5% No Change 3% No Change Description of performance metric changed for clarification purposes.
Geohazardsb Percent of segments at or above risk grade B 80% 85% 90% 90%Staff recommends adjusting target based on better inventory data. Focusing investment based on the new target will result in a significant reduction in statewide risk exposure.
Tunnels Percent of network tunnel length with all elements in equal or better condition than 2.5 weighted condition index
80% 75% 100% No Change Tunnel condition is worse than originally projected, so staff recommend adjusting the target.
Traffic Signalsc Percent of signal infrastructure in severe condition 15% 2% 0% No ChangeThe new metric and target allows the program to focus on signals with the greatest performance deficiencies as opposed to all signals without regards to performance.
Wallsd Percentage of CDOT - owned walls, by square foot, in poor condition (have a rating of 4 or less)
1% 2.50% 0.50% 1.00%
Descripton of performance metric changed for clarification purposes. Updated inventory found more walls with lower than desirable conditions. Current funding is unable to keep up with the rate of decline, so staff recommend adjusting the target.
a Previous Description: Percent of culverts that are structurally deficient (have a culvert rating of 4 or less)b Previous Metric: Percent of segments at or above risk grade Cc Previous Metric: Percent intersections with at least one signal assembly beyond 100% Useful Lifed Previous Description: Percent of CDOT-owned walls, by square foot, that are structurally deficient (have a rating of 4 or less)
Bridges
Pavement
TAM Metric and Target Change Matrix

Attachment C: Draft Updated PD 14
I. PURPOSE This Policy Directive provides an overall framework for the transportation planning process through which a multimodal, comprehensive Statewide Transportation Plan will be developed and implemented. With limited funding available, the Colorado Department of Transportation (CDOT) has developed a vision for the Statewide Transportation Plan that guides investment for Colorado’s multimodal transportation system and that balances:
• Preservation and maintenance, and incorporation of risk-based asset management, • Efficient system operations and management strategies, • Capacity improvements, and • Incorporation of safety in all areas
Policy Directive 14.0 performance objectives will guide the distribution of resources in the Statewide Transportation Plan, the Statewide Transportation Improvement Program, and the annual budget. This Policy Directive will be revised, as needed, to update performance objectives or incorporate additional goal areas. II. AUTHORITY 23 United States Code (U.S.C.) 134, 135 and 450, PL 112-141 (“Moving Ahead for Progress in the 21st Century” or “MAP-21), and its implementing regulations. § 43-1-106(8)(a), C.R.S. Transportation Commission § 43-1-1103, C.R.S. Transportation planning Transportation Commission Rules Governing the Statewide Transportation Planning Process and Transportation Planning Regions (2 CCR 601-22) III. APPLICABILITY This Policy Directive applies to all CDOT Divisions and Regions involved in implementing the Statewide Transportation Plan in cooperation with CDOT’s planning partners: the 10 rural Transportation Planning Regions and the five Metropolitan Planning Organizations. IV. DEFINITIONS
“Aspirational Objectives” are those objectives, or targets, toward which CDOT may strive if CDOT receives revenues beyond those projected.
COLORADO DEPARTMENT OF TRANSPORTATION
POLICY DIRECTIVE � PROCEDURAL DIRECTIVE
Subject
Policy Guiding Statewide Plan Development 14.0
Effective
Supersedes 02/18/2015
Originating Office Division of Transportation Development
Page 1 of 9

Subject Policy Guiding Statewide Plan Development
Number
14.0 “Drivability Life” is an indication in years of how long a highway will have acceptable driving conditions based on an assessment of smoothness, pavement distress, and safety. Drivability Life implements traffic based highway categories, and associated category drivability condition standards and allowed pavement treatments. Unacceptable driving condition is specific to each traffic based highway category and means drivers must reduce speeds to compensate for poor conditions, navigate around damaged pavement, or endure intolerably rough rides. The Risk-Based Asset Management Plan identifies three categories of Drivability Life: High (greater than 10 years of Drivability Life remaining); Moderate (4-10 years); and Low (3 or fewer years).
“Geohazards” are geologic hazards that affect the transportation system and include debris flow, embankment distress, landslides, rockfall, rockslides, and sink holes.
“National Highway System” (NHS) is a federally designated system of roadways important to the nation's economy, defense, and mobility. The NHS includes Interstate highways as well as other roadways. Not all NHS roadways are part of the state highway system.
“Maintenance Level of Service” (MLOS) is a qualitative measure describing operational conditions on the roadway. Overall maintenance level of service is a combined grade for nine maintenance program areas. For snow and ice control, the LOS B level includes maintaining high levels of mobility as much as possible, and proactive avalanche control.
“Performance Measures” are the ways that direction toward a goal is measured.
“Performance Objectives” are the specific targets for a performance measure that an organization intends to meet to make progress toward a goal.
“Planning Time Index” (PTI) is a measure of travel time reliability. For this performance measure, it is defined as the 95th percentile travel time divided by travel time at free-flow speed. In general terms, it identifies the extra time needed to arrive on-time for a trip 19 times out of 20. For example, for a PTI95 of 1.5, a worker should plan 45 minutes for a trip that takes 30 minutes in free-flow conditions (30 minutes x 1.5 = 45 minutes) to be on-time 19 out of 20 times (which would mean the worker would be late only one of the 20 work days in a month).
“Revenue Service Miles” are the miles of service operated by transit vehicles and available to the general public.
“Serious Injuries” are evident incapacitating injuries which prevent injured persons from walking, driving, or normally continuing the activities they were capable of performing before being injured in traffic crashes.
“Vehicle Miles Traveled” (VMT) is a measurement of miles traveled by vehicles obtained by multiplying the Annual Average Daily Traffic (AADT) count by the length of the roadway segment.
V. POLICY 1. Policy. It shall be the policy of CDOT that the Statewide Transportation Plan and statewide performance objectives stated herein will guide distribution of financial resources to meet or make
Page 2 of 9

Subject Policy Guiding Statewide Plan Development
Number
14.0 progress toward objectives in four goal areas: safety, infrastructure condition, system performance, and maintenance. Financial resources should be directed toward achieving the objectives within the first 10 years of the planning horizon (2016-2025). Projects should be selected to support the goals and objectives and will be included in the Statewide Transportation Improvement Program (STIP). Annual budget decisions will be guided by these performance objectives as well as CDOT’s Risk Based Asset Management Plan. Prior to funding new initiatives, funds should be directed to achieving the objectives in each area while recognizing constraints on some funding sources. Aspirational objectives guide the use of funds received that are above baseline revenue projections. 2. Goals. PD 14.0 goals guide development of the multimodal Statewide Transportation Plan and of performance objectives. The goals are:
• SAFETY – Moving Colorado toward zero deaths by reducing traffic-related deaths and serious injuries by one-half by 2030.
• INFRASTRUCTURE CONDITION – Preserve the transportation infrastructure condition to ensure safety and mobility at a least life cycle cost.
• SYSTEM PERFORMANCE – Improve system reliability and reduce congestion, primarily
through operational strategies and secondarily through the addition of capacity. Support opportunities for mode choice.
• MAINTENANCE – Annually maintain CDOT’s roadways and facilities to minimize the need
for replacement or rehabilitation. PD 14.0 and Statewide Plan Goals are in alignment with the MAP-21 National Goals. For the Statewide Plan, goals are expressed in more public-friendly terms and include: Safety, Mobility (System Performance in 14.0), Economic Vitality (not yet identified in PD 14.0), and Maintaining the System (Infrastructure Condition and Maintenance in PD 14.0). 3. Performance Measures and Objectives. Performance measures describe how statewide success will be evaluated and performance objectives establish statewide achievement levels which are used to direct investment decisions primarily focused on a 10-year planning horizon (2016-2025). Explanations of how the objectives will be measured and budget categories that fund the four goal areas - Maintain, Maximize, Expand, and Pass-Through Funds/Multi-Modal Grants - are listed below with the appropriate goals.
a) HIGHWAY SAFETY: The highway safety objectives (with the exception of the economic impact of crashes objectives) were set after studying trends from 2008 through 2013. Safety measures and objectives apply to all roads in the state. The other safety measures and objectives in this section are subsets of the highway measures and objectives. The budget categories that fund Safety are Maintain, Maximize, and Expand.
(1) All Highways
Page 3 of 9
Subject Policy Guiding Statewide Plan Development
Number
14.0
MEASURES:
• Number of fatalities • Fatalities per vehicle miles traveled (VMT) • Number of serious injuries • Serious injuries per VMTH • Economic impact of crashes
OBJECTIVES:
• Reduce fatalities by 12 per year from 548 in 2008 to 344 in 2025. • Reduce the fatality rate per 100 million VMT by 0.02 per year from 1.03 in
2013 to 0.79 in 2025. • Reduce serious injuries by 90 per year from 3,200 in 2013 to 2,120 in 2025. • Reduce the serious injury rate by 0.2 per 100 million VMT per year from 6.86
in 2013 to 4.46 in 2025. • Reduce the economic impact of crashes annually by 1% over the previous
calendar year.
ASPIRATIONAL OBJECTIVE: • Reduce the fatality rate per 100 million VMT to 0.75 in 2025.
(2) Bike and Pedestrian
MEASURES: • Number of bicyclist and pedestrian fatalities involving motorized vehicles • Number of bicyclist and pedestrian serious injuries involving motorized
vehicles OBJECTIVES:
• Reduce the number of bicyclist and pedestrian fatalities involving motorized vehicles from 67 in 2013 to 47 in 2025.
• Reduce the number of bicyclist and pedestrian serious injuries involving motorized vehicles from 469 in 2013 to 311 in 2025.
b) INFRASTRUCTURE CONDITION: The infrastructure condition objectives for highways and bridges are intended to be achieved or maintained over the first 10 years of the planning horizon (2016-2025). The budget category that funds Infrastructure Condition is Maintain, except for Transit which is funded with Pass-Through Funds/Multi-Modal Grants.
(1) Bridges
MEASURES: • Condition of National Highway System (NHS) bridges • Condition of state highway bridges
Page 4 of 9

Subject Policy Guiding Statewide Plan Development
Number
14.0
• Risk-Based Asset Management Plan measures for bridges (See Appendix A for additional bridge measures.)
OBJECTIVES:
• Maintain the percent of NHS total bridge deck area that is not structurally deficient at or above 90%.
• Maintain the percent of state highway total bridge deck area that is not structurally deficient at or above 90%.
• Meet bridge objectives in the Risk-Based Asset Management Plan. (See Appendix A for additional bridge objectives.)
ASPIRATIONAL OBJECTIVES: • Achieve the percent of NHS total bridge deck area that is not structurally
deficient at or above 95%.
(2) Highways
MEASURES: • Pavement condition of the Interstate System • Pavement condition of the NHS, excluding Interstates • Pavement condition of the state highway system
OBJECTIVES:
• Achieve 80% High/Moderate Drivability Life for Interstates based on condition standards and treatments set for traffic volume categories.
• Achieve 80% High/ Moderate Drivability Life for NHS, excluding Interstates, based on condition standards and treatments set for traffic volume categories.
• Achieve 80% High/Moderate Drivability Life for the state highway system based on condition standards and treatments set for traffic volume categories.
ASPIRATIONAL OBJECTIVES: • Achieve 90% High/Moderate Drivability Life for Interstates based on condition
standards and treatments set for traffic volume categories. • Achieve 90% High/ Moderate Drivability Life for NHS, excluding Interstates,
based on condition standards and treatments set for traffic volume categories.
(3) Other Assets
MEASURE: • Risk-Based Asset Management Plan measures for other assets (See Appendix
A for measures for buildings, Intelligent Transportation Systems (ITS) equipment, roadway fleet, culverts, geohazards, tunnels, traffic signals, and walls.)
OBJECTIVE:
Page 5 of 9

Subject Policy Guiding Statewide Plan Development
Number
14.0
• Meet objectives in the Risk-Based Asset Management Plan (See Appendix A for objectives for buildings, ITS equipment, roadway fleet, culverts, geohazards, tunnels, traffic signals, and walls.)
(4) Transit
MEASURE: • Transit Asset Condition
OBJECTIVES:
• Maintain the percentage of vehicles in the rural Colorado transit fleet to no less than 65% operating in fair, good, or excellent condition, per Federal Transit Administration definitions.
• CDOT completion of a group transit asset management plan, with the involvement and participation of CDOT transit grantees, by December 2017.
ASPIRATIONAL OBJECTIVE:
• Increase the percentage of vehicles in the rural Colorado transit fleet to no less than 70% operating in fair, good, or excellent condition, per Federal Transit Administration definitions.
c) SYSTEM PERFORMANCE: The system performance objectives for Interstates, NHS, and State Highway system are intended to be achieved within the first 10 years (2016-2025) of the planning horizon. The system performance objectives for transit begin in 2012 either for a five-year rolling average or as the baseline year. The budget categories that fund System Performance are Maximize, Expand, and Pass-Through Funds/Multi-Modal Grants.
(1) Interstates, NHS and State Highway system
MEASURES:
• Interstate Performance – Planning Time Index (PTI) • NHS Performance excluding Interstates – PTI • Colorado Freight Corridors Performance – PTI
OBJECTIVES:
• Prevent the spread of congestion by maintaining a PTI of 1.05 or less on 90% or greater of Interstates centerline miles.
• Prevent the spread of congestion by maintaining a PTI of 1.16 or less on 90% or greater of NHS centerline miles, excluding Interstates.
• Prevent the spread of congestion by maintaining a PTI of 1.12 or less on 90% or greater of Colorado Freight Corridor centerline miles.
(2) Transit
Page 6 of 9

Subject Policy Guiding Statewide Plan Development
Number
14.0 MEASURES:
• Transit Utilization – Ridership statewide for small urban and rural “transit grantees”
• Transit Connectivity – Revenue service miles provided
OBJECTIVES: • Increase ridership of small urban and rural transit grantees by at least an average
of 1.5% statewide over a five-year period beginning with 2012. • Maintain or increase the total number of revenue service miles of CDOT-funded
regional, inter-regional, and inter-city passenger service over that recorded for 2012.
ASPIRATIONAL OBJECTIVES:
• Increase ridership of small urban and rural transit grantees by at least an average of 1.7% statewide over a five-year period beginning with 2012.
• Increase the statewide total number of revenue service miles of regional, inter-regional, and inter-city passenger service by at least an average 1.7% over a five-year period beginning with 2012.
d) MAINTENANCE: Maintenance objectives are established based on annual funding levels and measured annually. The budget category that funds Maintenance is Maintain.
MEASURES: • Level of Service (LOS) for snow and ice removal • Overall Maintenance Level of Service (MLOS) for the state highway system
OBJECTIVES:
• Maintain a LOS B grade for snow and ice removal. • Maintain an overall MLOS B minus grade for the state highway system.
ASPIRATIONAL OBJECTIVES:
• Achieve a LOS B+ grade for snow and ice removal. • Achieve an overall Maintenance LOS B grade for the state highway system.
VI. DOCUMENTS REFERENCED IN THIS POLICY DIRECTIVE Appendix “A” Table 4.1 “CDOT RB-AMP Asset Management Metrics and Performance Targets” VII. IMPLEMENTATION PLAN Additional measures and objectives are planned or currently under development. As additional measures and objectives are finalized they will be brought forward for consideration of
Page 7 of 9

Subject Policy Guiding Statewide Plan Development
Number
14.0 incorporation into PD 14.0. This includes measures and objectives in the following areas: Bike and Pedestrian, Truck Freight, Freight Rail, Economic Vitality, and Environmental Sustainability. This Policy Directive will be implemented by the Division of Transportation Development, with the Office of Financial Management and Budget, the Division of Transportation Systems Management & Operations, and the Division of Transit & Rail, and in collaboration with other CDOT Divisions and CDOT Regions. Funds will be directed to budget categories to support accomplishment of the objectives. The Division of Transportation Development will report annually on performance of the transportation system to track progress toward objectives. At a minimum, the Division of Transportation Development will review and update or reaffirm this Policy Directive with each Plan update cycle in collaboration with the Office of Policy and Government Relations, Office of Financial Management and Budget, Division of Transportation Systems Management & Operations, Division of Transit & Rail, and other CDOT Divisions and CDOT Regions. VIII. REVIEW DATE This directive shall be reviewed on or before February 2018. ________________________________ ___________________________ Secretary, Transportation Commission Date of Approval
Page 8 of 9

Subject Policy Guiding Statewide Plan Development
Number
14.0
Page 9 of 9
Appendix “A” CDOT RB-AMP Asset Management Metrics and Performance Targets

Attachment D: Draft Resolution Resolution #TC-17-XX-XX
Adoption of updated Policy Directive 14.0 “Policy Guiding Statewide Plan Development”
WHEREAS, the Colorado Transportation Commission (“the Commission”) has statutory authority pursuant to § 43-1-106(8)(a) C.R.S. to formulate policy concerning transportation systems in compliance with 23 U.S.C. 134, 135, and 450; PL 114-94 (“Fixing America’s Surface Transportation Act” or “FAST Act”) and PL 112-141 (“Moving Ahead for Progress in the 21st Century” or “MAP-21), and their regulations; and to undertake transportation planning under § 43-1-1103, C.R.S.; and
WHEREAS, a statewide plan is part of the state and federally required statewide transportation planning process; and
WHEREAS, Policy Directive 14.0 is the framework for development and implementation of a multimodal comprehensive Statewide Transportation Plan and for distribution of resources to meet or make progress toward objectives; and
WHEREAS, the Commission approved the updated Policy Directive 14.0 in October 2015 in Resolution #TC-15-2-7; and
WHEREAS, Policy Directive 14.0 states that the policy will be brought forward for consideration by the TC as additional measures and objectives are developed; and
WHEREAS, the Commission reviews Policy Directive 14.0 annually to determine if there is a need to modify performance measures or objectives; and
WHEREAS, changes have been proposed to infrastructure condition performance measures or objectives to better align with the cost of achieving performance outcomes, and updated estimates of available revenues, and to eliminate an outdated transit performance measure; and
WHEREAS, over the past several months, the Commission reviewed and concurred with the proposed changes.
NOW THEREFORE BE IT RESOLVED, that the Commission adopts the updated Policy Directive 14.0 “Policy Guiding Statewide Plan Development” as reflected in Attachment A to this resolution.
_________________________ ____________________________
Herman Stockinger, Secretary Date Transportation Commission

Policy Directive 14 ReportingColorado Department of Transportation
Sept. 20, 2017
• Jeff Sudmeier (Multimodal Planning Branch Manager)
• Charles Meyer (State Traffic and Safety Engineer)
• William Johnson (Performance and Asset Management Branch Manager)
• Kyle Lester (Director of Highway Maintenance)
1

CDOT Funding
2

PD-14 Scoreboard: Safety (Highways)Budget Target Results Target Met?
Reduce fatalities by 12 per year from 548 in 2008 to 344 in 2025
452 608 N/A
Reduce the fatality rate per 100 million VMT by 0.02 per year from 1.03 in 2013 to 0.79 in 2025
0.97 1.169 N/A
Reduce the serious injuries by 90 per year from 3,200 in 2013 to 2,120 in 2025
2930 2855 N/A
Reduce the serious injury rate by 0.2 per 100 miliion VMT per year from 6.86 in 2013 to 4.46 in 2025
6.26 5.48 N/A
Reduce the economic impact of crashes annually by 1% over the previous calendar year
$4.76 B $4.97 N/A N/A
SafetyAll Highways
FASTER SafetyHSIP
Highway Safety EducationHot Spots
2016 performance data is preliminary and is not final until December 31, 2017. The 2016 economic anlaysis is an estimate at this time. Due to pending 2016 records, an estimate of the economic impact of those estimated crashes was made based upon past years' averages. The increase in fatalities can be largely explained by an 11% increase in VMT between 2013 and 2016.
Because a third of our fatalities involve occupants not wearing seat belts, significant numbers of lives could be saved if Colorado had a primary seat belt law.
Recommended next steps - Continued improvement and application of safety analysis, and more strategic use of safety funding for safety projects. The Strategic Highway Safety Plan (SHSP) identified eight strategic emphasis areas for CDOT, as well as other safety stakeholder agencies, to focus safety improvement efforts. In CDOT's dedicated safety programs, HQ and Regions are collaborating to use state-of-the-art safety analysis techniques to find the most effective locations for crash reduction, and fund those projects in a strategic four-year plan. (SHSP)
$98.7 million
2017 Proposed Metric Changes
PD 14.0 Objectives
2016Dedicated Funding
Sources1 Notes
3

PD-14 Scoreboard: Safety (Bike & Pedestrian)Budget Target Results Target Met?
Reduce the number of bicyclist and pedestrian fatalities involving motorized vehicles, from 67 in 2013 to 47 in 2015
62 100 N/A
Reduce the number of bicyclist and pedestrian serious injuries involving motorized vehicles from 469 in 2013 to 311 in 2025
430 449 N/A
N/A
2016 performance data is preliminary and is not final until December 31, 2017.
The increase in bike and pedestrian fatalities and serious injuries is likely the result of an increase in VMT and bike/ped activity, and possible growth in distracted driving.
Recommended next steps - Implement PD 1602.1 as a means to incorporate bicycle and pedestrian accommodation in all that we do. Work to identify High Priority Bicycle Corridors so that bicyclists have a better understanding of which facilities are best for riding. Revamp the Share the Road Campaign by implementing Bicycle-Friendly Motorist training that teaches drivers how to interact with bicyclists on the road. Update Bicycle and Pedestrian Facility Design classes to ensure the latest safety strategies are understood by designers and planners.
N/A
SafetyBike & Pedestrian
2017 Proposed Metric Changes
PD 14.0 Objectives
2016Dedicated Funding
Sources1 Notes
4

PD-14 Scoreboard: MaintenanceBudget Target Results Target Met?
Maintain a LOS B grade for snow and ice removal
$83.4 million B BSnow and Ice ControlSnow and Ice Reserve
N/A
Maintain an overall MLOS B minus grade for the state highway system
$254.4 million B- C+ Maintenance N/A
Infrastructure Condition
1 Additional flexible funding sources with a wide range of eligibility could be used to address multiple objectives. Examples include RPP, STP-M, CMAQ, and TAP
The cost of achieving a B minus for MLOS over the next 10 years is $4.07 billion, requiring an average annual budget of $407 million compared to current funding of roughly $273 million. The level of current funding and staff resources limit our ability to achieve the current maintenance performance objectives.
Maintenance
2017 Proposed Metric Changes
PD 14.0 Objectives
2016Dedicated Funding
Sources1 Notes
5

PD-14 Scoreboard: Pavement and Bridges
Budget Target Results Target Met?
Achieve 80% High/Moderate Drivability Life for Interstates based on condition standards and treatments set for traffic volume categories
80% 94% N/A
Achieve 80% High/Moderate Drivability Life for NHS, excluding Interstates, based on condition standards and treatments set for traffic volume categories
80% 85% N/A
Achieve 80% High/Moderate Drivability Life for the state highway system based on condition standards and treatments set for traffic volume categories
80% 80% N/A
Maintain the percent of NHS total bridge deck area that is not structurally deficient at or above 90%
90.0% 95.5% N/A
Maintain the percent of state highway total bridge deck area that is not structurally deficient at or above 90%
90.0% 95.1% N/A
Infrastructure Condition
A structurally deficient bridge is typically one where corrosion or deterioration has resulted in a portion of the bridge being in poor condition; for example, where water leaking through an expansion joint has caused the end of a steel girder to rust. Currently exceeding target and will continue to exceed target through 2026; however, the bridge program has 7 metrics geared towards mitigation of risks (below), and five of those are not achieving their target. (% of CDOT-owned bridges over waterways that are scour critical, % of CDOT-owned bridges posted for load, % of leaking expansion joint by length on CDOT-owned bridges, and % of CDOT-owned bridge deck area that is unsealed or otherwise unprotected.)
Recommended next steps - for the five risk mitigation metrics not achieving their target, staff are working to identify additional strategies that can be implemented with no additional funding. Current strategies include identifying bridges that can easily be repaired or remedied with the most cost-effective treatment.
Although targets were met in 2016, given the current planning budgets, it is anticipated that targets for pavement condition will not be met beginning next year, and will continue to remain below the target through 2026. In 2026 it is anticipated that only 69% of the state highway system will have high or moderate Drivability Life. $302.5 million per year is needed annually beyond FY 2021 to achieve the target by 2026.
Recommended next steps - Staff will work to improve/tighten the link between pavement maintenance and pavement model recommendations, and evaluate the effect of pavement preventive maintenance on DL to identify strategies.
Surface Treatment Program
RAMP Funding
2017 Proposed Metric Changes
PD 14.0 Objectives
2016Dedicated Funding
Sources1 Notes
$164.1 million
Colorado Bridge Enterprise
On-System BridgeRAMP Funding
Bridges
$235.9 million
Highways
6

PD-14 Scoreboard: Bridge RisksBudget Target Results Target Met?
Percentage of bridge crossings over Interstates, U.S. Routes and Colorado state highways with a vertical clearance less than the minimum design requirement of 14 feet-6 inches
0.4% 1.7%
A bridge with a vertical clearance of less than 14'-6"-- statutory maximum vehicle height--has a high risk of being hit by a tall load or legal load. $4.4 million per year is needed annually beyond FY 2021 to achieve the updated target of 1% by 2026.
N/A
Percentage of bridge crossings over Interstates, U.S. Routes and Colorado state highways with a vertical clearance less than the minimum design requirement of 16 feet-6 inches
4.8% 19.8%
16'-6" is the minimum clearance used when designing new bridges over a roadway. A bridge with a vertical clearance less than 16'-6" but greater than or equal to 14'-6" has a medium to high risk of being hit by a tall load. $6.9 million per year is needed annually beyond FY 2021 to achieve the updated target of 18% by 2026.
N/A
Percentage of CDOT-owned bridges posted for load
0.0% 0.2%
Vehicles meeting the legal load limits (as defined in C.R.S. 42-4-502 - 42-4-504) can travel on Colorado Interstates, US and State Highways without an approved permit. Ollder bridges may need to be posted since some of these bridges were not designed for legal loads. Load posted structures impact mobility by restricting both legal and permitted loads. $2.1 million per year is needed annually beyond FY 2021 to achieve the updated target of 0.10% by 2026.
N/A
Percentage of CDOT-owned bridges with a load restriction
3.0% 1.6%
Permit loads (as defined in the Colorado Bridge Weight Limit Map/CDOT Bridge Rating Manual) are typically heavier and longer than the legal loads and require an approved permit in order to travel on Colorado highways. Ollder bridges may need to be restricted for passage since some of these bridges were not designed for permit loads. Permitted loads have a certain combination of axle weight and spacing that distributes the load in an acceptable combination for crossing over structures. $6.1 million per year is needed annually beyond FY 2021 to achieve the updated target of 0.9% by 2026.
N/A
Percentage expansion joints in poor condition by length on CDOT-owned bridges
15.0% or less
25.3%
Leaking expansion joints allow water and deicing chemicals onto superstructure and substructure elements which can accelerate corrosion and lead to early onset of a structural deficiency. Keeping expansion joints sealed slows the rate of bridges dropping into structurally deficient.
N/A
Percentage of CDOT-owned bridge deck area that is unsealed or otherwise unprotected
30.0% or less
44.5%Unsealed bridge decks deteriorate faster than sealed bridge decks.
N/A
Infrastructure Condition
2017 Proposed Metric Changes
PD 14.0 Objectives2016 Dedicated Funding
Sources1 Notes
$164.1 million
Colorado Bridge Enterprise
On-System BridgeRAMP Funding
Bridges
7

PD-14 Scoreboard: Other AssetsBudget Target Results Target Met?
Statewide letter grade (Percent C or better) of CDOT Buildings
$12.9 million 90% 74%Property Allocation
ProgramRAMP Funding
Given the current planning budgets, buildings will not achieve its target between now and 2026. In 2026 the expected performance is 69%. $41.9 million per year is needed annually beyond FY 2021 to achieve the updated target of 85% C or better by 2026.
Recommended next steps – Staff will improve awareness of preventive maintenance as a priority, and determine level of funding needed for building preventive maintenance.
N/A
Average Percent Useful Life of ITS Equipment $21.4 million90%
or lessN/A N/A
ITS MaintenanceRAMP Funding
Given the current planning budgets, ITS will not achieve its target between now and 2026. In 2026 the expected performance is 209%. $31.5 million per year is needed annually beyond FY 2021 to achieve the target by 2026.
Recommended next steps – Staff to refine inventory by breaking down devices into manageable maintenance pieces that can be tracked individually for cost savings advantages. Staff will also investigate the benefits of preventive maintenance for select devices, and further refine device useful life parameters by tracking asset service life to compare to manufacturer estimates.
N/A
Average Percent Useful Life of Fleet Equipment $18.4 million70%
or less87%
Road Equipment ProgramRAMP Funding
Given the current planning budgets, road equipment will not achieve its target between now and 2026. In 2026 the expected performance is 77%. $24.1 million per year is needed annually beyond FY 2021 to achieve the updated target of 75% by 2026.
Recommended next steps – Saff will communicate the importance of fleet planning and develop regional fleet optimization recommendations, develop a fleet performance measure that reflects cost effectiveness rather than asset life, and monitor implementation of fleet preventive maintenance work orders.
N/A
Percent of culverts that are in poor condtion (have a rating of 4 or less)
$8.2 million 5% 4.87%Structures On-System
RAMP Funding
Although the target is currently being met, given current planning budgets, it is expected that the target will not be met in the future. In 2026 the expected performance is 7.3%. $12.8 million per year is needed annually beyond FY 2021 to achieve the target by 2026.
Recommended next steps – Staff are undertaking analysis to identify strategies.
N/A
Infrastructure Condition
Culverts
Fleet
Buildings
ITS
2017 Proposed Metric Changes
PD 14.0 Objectives
2016Dedicated Funding
Sources1 Notes
8

PD-14 Scoreboard: Other Assets (Cont.)Budget Target Results Target Met?
Percent of segments at or above risk grade C $9.2 million 80% 92%Rockfall Mitigation
RAMP Funding
Increased data collection efforts have provided a better picture of actual performance. Current performance results in a $40.5M annual risk from Geohazard events. $27.7 million per year is needed annually beyond FY 2021 to achieve the updated target of 85% risk grade B or above by 2026.
Recommended next steps - Continued improvement in data collection.
PROPOSED: Percent of segments at or above risk grade B
Percentage of network tunnel length with all elements in equal or better condition than 2.5 Weighted Condition Index
$5.2 million 80% 91%Structures On-System
RAMP Funding
Although the target is currently being met, given current planning budgets, it is expected that the target will not be met in the future. In 2026, the expected performance is 52%.$9.2 million per year is needed annually beyond FY 2021 to achieve the updated target of 75% by 2026.
Recommended next steps – Staff are undertaking analysis to identify strategies.
N/A
Percent of intersections with at least one signal assembly beyond 100% useful life.
$5.7 million 15% N/A N/A Traffic Signals Program
Given the current planning budgets, signals is expected to achieve the target by 2026.
Recommended next steps – Staff are undertaking analysis to identify strategies.
PROPOSED: Percent of Signal Infrastructure in severe condition (dollar weighted)
Percentage of CDOT-owned walls, by square foot, that are in poor condtion (have a rating of 4 or less)
$2.4 million 1% 4.15%Structures On-System
RAMP Funding
Given the current planning budgets, walls is not expected to meet its target between now and 2026. In 2026 the expected performance is 92%. $24.1 million per year is needed annually beyond FY 2021 to achieve the updated target of 2.5% by 2026.
Recommended next steps – Staff are undertaking analysis to identify strategies.
N/A
Infrastructure Condition
Traffic Signals
Geohazards
Tunnels
Walls
2017 Proposed Metric Changes
PD 14.0 Objectives
2016Dedicated Funding
Sources1 Notes
9

TAM Metric and Target Change MatrixAsset Measure
Fiscally Constrained Target
Proposed Fiscally Constrained Target
Aspirational TargetProposed Aspirational
TargetReason for Target Change
Percentage of deck area on structurally deficient CDOT - owned bridges 10% No Change 5% No Change No ChangePercentage of deck area on structurally deficient bridges on the NHS 10% No Change 5% No Change No ChangePercentage of CDOT - owned bridges over waterways that are scour critical 5% No Change 1% No Change No Change
Percentage of bridge crossings over Interstates, U.S. routes and Colorado state highways with a vertical clearance less than the statutory maximum vehicle height of 14 feet - 6 inches
0.40% 1.00% 0.00% No Change
The number of bridges with vertical clearance issues is greater than originally projected. Current funding strategy is unable to address issues, so staff recommend adjusting the target.
Percentage of bridge crossings over Interstates, U.S. Routes and Colorado state highways with a vertical clearance less than the minimum design requirement of 16 feet - 6 inches
4.80% 18.00% 2.00% 12.00%
The number of bridges with vertical clearance issues is greater than originally projected. Current funding strategy is unable to address issues, so staff recommend adjusting the target.
Percentage of CDOT - owned bridges posted for load 0.00% 0.10% 0.00% No ChangeUpdated inventory found more bridges with lower than desirable conditions. Current funding strategy is unable to address issues, so staff recommend adjusting the target.
Percentage of CDOT - owned bridges with a load restriction 3.00% 0.90% 1.00% 0.00%We are doing better that originally projected, so staff recommend adjusting the target.
Percentage of leaking expansion joint by length on CDOT - owned bridges 15% 26% 5% 15%
Updated inventory found more bridges with lower than desirable conditions. Current funding is unable to keep up with the rate of decline, so staff recommend adjusting the target.
Percentage of CDOT - owned bridge deck area that is unsealed or otherwise unprotected
30% 35% 5% 20%
Updated inventory found more bridges with lower than desirable conditions. Current funding is unable to keep up with the rate of decline, so staff recommend adjusting the target.
Percentage high - moderate drivability life for Interstates based on condition standards and treatments set for traffic volume categories
80% No Change 90% No Change No Change
Percentage high - moderate drivability life for CDOT - owned NHS, excluding Interstates based on condition standards and treatments set for traffic volume categories
80% No Change 90% No Change No Change
Percentage high - moderate drivability life for the State highway system based on condition standards and treatments set for traffic volume categories
80% No Change 90% No Change No Change
Maintenance Statewide letter grade B- No Change B- No Change No Change
Bridges
Pavement
10

TAM Metric and Target Change Matrix (Continued)
Asset MeasureFiscally Constrained
TargetProposed Fiscally
Constrained TargetAspirational Target
Proposed Aspirational Target
Reason for Target Change
Buildings Statewide letter grade 90% C or Better 85% C or Better 100% C or Better 90% C or BetterAnalysis indicates that, given fiscal constraints, the old target is not achievable, so staff recommend adjusting the target.
ITS Average percent useful life 90% No Change 85% No Change No Change
Road Equipment Average percent useful life 70% 75% 50% 70%Analysis indicates that, given fiscal constraints, the old target is not achievable, so staff recommend adjusting the target.
Culvertsa Percent culverts in poor condition (have a culvert rating of 4 or less) 5% No Change 3% No ChangeDescription of performance metric changed for clarification purposes.
Geohazardsb Percent of segments at or above risk grade B 80% 85% 90% 90%
Staff recommends adjusting target based on better inventory data. Focusing investment based on the new target will result in a significant reduction in statewide risk exposure.
TunnelsPercent of network tunnel length with all elements in equal or better condition than 2.5 weighted condition index
80% 75% 100% No ChangeTunnel condition is worse than originally projected, so staff recommend adjusting the target.
Traffic Signalsc Percent of signal infrastructure in severe condition 15% 2% 0% No ChangeThe new metric and target allows the program to focus on signals with the greatest performance deficiencies as opposed to all signals without regards to performance.
Wallsd Percentage of CDOT - owned walls, by square foot, in poor condition (have a rating of 4 or less)
1% 2.50% 0.50% 1.00%
Descripton of performance metric changed for clarification purposes. Updated inventory found more walls with lower than desirable conditions. Current funding is unable to keep up with the rate of decline, so staff recommend adjusting the target.
a Previous Description: Percent of culverts that are structurally deficient (have a culvert rating of 4 or less)b Previous Metric: Percent of segments at or above risk grade Cc Previous Metric: Percent intersections with at least one signal assembly beyond 100% Useful Life
11

PD-14 Next Steps
• Review revised PD-14 with STAC.• If the Commission supports the refinements, staff will prepare PD-14
for adoption in October.
12

FY19 Asset Management BudgetColorado Department of Transportation
William JohnsonPerformance and Asset Management Branch Manager Sept. 20, 2017
13

TAM Budget-Setting Process
• Asset Investment Management System
• Performance Scenarios
• Planning Budgets
Asset Class FY2013-14 FY2014-15 FY2015-16 FY2016-17* FY2017-18 FY2018-19 FY2019-20 FY2020-21Surface Treatment $238.8 $235.2 $235.9 $252.1 $231.4 $225.4 $222.0 $223.2Bridge, BE & Bridge Fixed Costs $173.9 $168.2 $164.1 $163.2 $155.4 $142.5 $151.2 $155.3MLOS $249.0 $251.3 $254.4 $272.6 $263.5 $272.8 $265.7 $260.7Buildings $11.3 $20.8 $12.9 $21.4 $17.5 $20.2 $17.6 $18.1Culverts $11.5 $9.6 $8.2 $11.9 $9.1 $7.6 $7.5 $8.3Tunnels $7.4 $12.4 $5.2 $10.5 $6.4 $8.4 $10.3 $10.0ITS $21.5 $27.6 $21.4 $24.5 $23.0 $23.5 $29.2 $24.9Road Equipment $20.9 $20.9 $18.4 $26.4 $23.0 $26.8 $22.1 $21.6Geohazards $9.0 $9.1 $9.2 $11.8 $8.5 $8.4 $9.7 $12.3Walls $0.0 $0.0 $2.4 $10.2 $4.6 $4.6 $5.1 $5.5Traffic Signals $0.0 $0.0 $5.7 $16.9 $12.6 $14.8 $14.6 $15.1TOTAL $743.3 $755.1 $738.0 $821.5 $755.0 $755.0 $755.0 $755.0*Adjusted for budget increases per TC
FY14-FY21 Asset Management Planning BudgetsFinal Budgets Planning Budgets
14

TAM Funding
FY2019 Asset Management BudgetNeed to Reach Proposed Fiscally
Constrained Targets
Total Need = $755 Million
Total Need = $1.049 Billion
15

What’s the Problem?
There’s a deficit of $294 million between the FY19 Asset Management Budget and the estimated average yearly cost to reach proposed PD14 targets.
TAM Planning Budget vs. Need
Asset Class FY2018-19 FY2019-20 FY2020-21
Estimated Average Yearly Need to Reach Proposed Target by 2026
(based on FY2020-21 Planning Budget)
Surface Treatment $225.4 $222.0 $223.2 $302.5Bridge and BE $142.5 $151.2 $155.3 $153.4MLOS $272.8 $265.7 $260.7 $407.1Road Equipment $26.8 $22.1 $21.6 $24.1ITS $23.5 $29.2 $24.9 $31.5Geohazards $8.4 $9.7 $12.3 $27.7Buildings $20.2 $17.6 $18.1 $41.9Tunnels $8.4 $10.3 $10.0 $9.2Culverts $7.6 $7.5 $8.3 $12.8Walls $4.6 $5.1 $5.5 $24.1Traffic Signals $14.8 $14.6 $15.1 $15.1TOTAL $755.0 $755.0 $755.0 $1,049.4Note: Bridge estimate includes cost to meet risk targets.Updated 9/22/17
16

Bridge
Annual cost to achieve proposed fiscally constrained target by 2026: $135.9 million. Note: This does not include meeting bridge risks targets – only the goal for structural deficiency. Annual cost to achieve proposed aspirational target by 2026: $160.2 million.
17
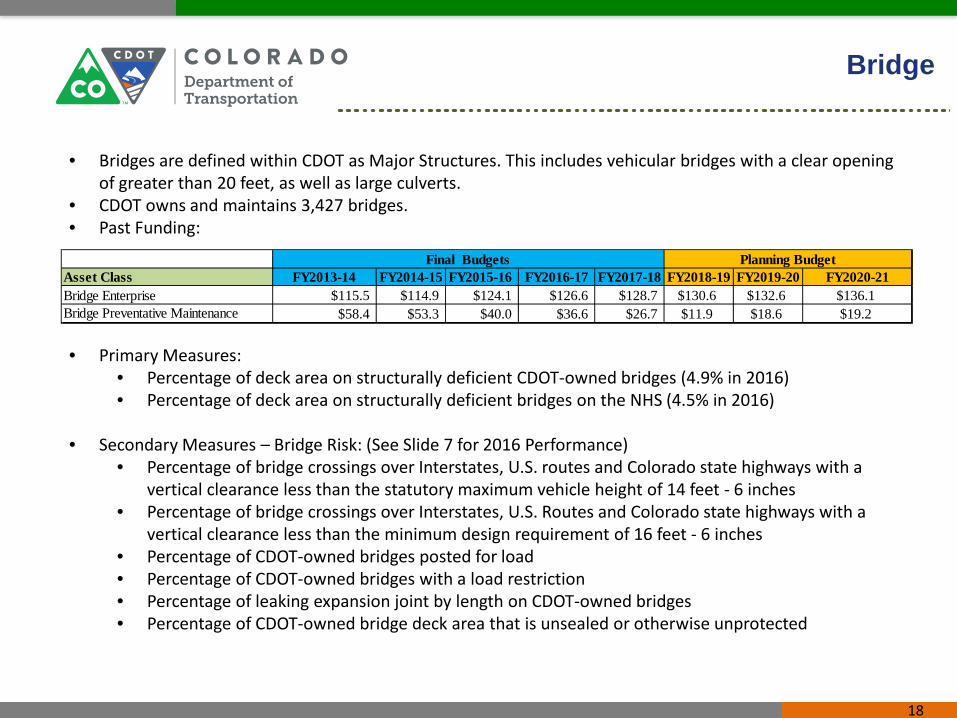
Bridge
• Bridges are defined within CDOT as Major Structures. This includes vehicular bridges with a clear opening of greater than 20 feet, as well as large culverts.
• CDOT owns and maintains 3,427 bridges.• Past Funding:
• Primary Measures:• Percentage of deck area on structurally deficient CDOT-owned bridges (4.9% in 2016)• Percentage of deck area on structurally deficient bridges on the NHS (4.5% in 2016)
• Secondary Measures – Bridge Risk: (See Slide 7 for 2016 Performance)• Percentage of bridge crossings over Interstates, U.S. routes and Colorado state highways with a
vertical clearance less than the statutory maximum vehicle height of 14 feet - 6 inches• Percentage of bridge crossings over Interstates, U.S. Routes and Colorado state highways with a
vertical clearance less than the minimum design requirement of 16 feet - 6 inches• Percentage of CDOT-owned bridges posted for load• Percentage of CDOT-owned bridges with a load restriction• Percentage of leaking expansion joint by length on CDOT-owned bridges• Percentage of CDOT-owned bridge deck area that is unsealed or otherwise unprotected
Asset Class FY2013-14 FY2014-15 FY2015-16 FY2016-17 FY2017-18 FY2018-19 FY2019-20 FY2020-21Bridge Enterprise $115.5 $114.9 $124.1 $126.6 $128.7 $130.6 $132.6 $136.1Bridge Preventative Maintenance $58.4 $53.3 $40.0 $36.6 $26.7 $11.9 $18.6 $19.2
Final Budgets Planning Budget
18

Not Structurally Deficient Bridge:• A Not Structurally Deficient bridge will be
a candidate for preservation actions many times in its service life. Preservation actions slow or temporarily arrest bridge deterioration. Preservation actions include work such as fixing leaking expansion joints and resealing damaged bridge-deck seals.
Structurally Deficient Bridge:• Bridges that do not meet minimum
standards for condition or load-bearing capacity. They also often have one or more damaged or deteriorated structural members, such as a girder, truss or deck.
Bridge
19

Bridge: Risk Mitigation
• Proposed changes to targets:
Asset MeasureFiscally Constrained
TargetProposed Fiscally
Constrained TargetAspirational Target
Proposed Aspirational Target
Reason for Target Change
Percentage of CDOT - owned bridges over waterways that are scour critical
5% No Change 1% No Change No Change
Percentage of bridge crossings over Interstates, U.S. routes and Colorado state highways with a vertical clearance less than the statutory maximum vehicle height of 14 feet - 6 inches
0.40% 1.00% 0.00% No Change
The number of bridges with vertical clearance issues is greater than originally projected. Current funding strategy is unable to address issues, so staff recommend adjusting the target.
Percentage of bridge crossings over Interstates, U.S. Routes and Colorado state highways with a vertical clearance less than the minimum design requirement of 16 feet - 6 inches
4.80% 18.00% 2.00% 12.00%
The number of bridges with vertical clearance issues is greater than originally projected. Current funding strategy is unable to address issues, so staff recommend adjusting the target.
Percentage of CDOT - owned bridges posted for load 0.00% 0.10% 0.00% No Change
Updated inventory found more bridges with lower than desirable conditions. Current funding strategy is unable to address issues, so staff recommend adjusting the target.
Percentage of CDOT - owned bridges with a load restriction 3.00% 0.90% 1.00% 0.00%We are doing better that originally projected, so staff recommend adjusting the target.
Percentage of leaking expansion joint by length on CDOT - owned bridges
15% 26% 5% 15%
Updated inventory found more bridges with lower than desirable conditions. Current funding is unable to keep up with the rate of decline, so staff recommend adjusting the target.
Percentage of CDOT - owned bridge deck area that is unsealed or otherwise unprotected
30% 35% 5% 20%
Updated inventory found more bridges with lower than desirable conditions. Current funding is unable to keep up with the rate of decline, so staff recommend adjusting the target.
Bridges
20

Load-restricted bridges
Scour-critical bridges, which are bridges whose foundations are at risk due to erosion.
Bridges over Interstates, U.S. Routes, and Colorado state highways with vertical clearances lower than 16.5 or 14.5 feet
Bridge: Risk Mitigation
21

Unsealed Bridge Deck Bridges with Leaking Expansion Joints
Bridge: Risk Mitigation
22

Buildings
• CDOT has several types of buildings in its inventory. These include: vehicle storage facilities, maintenance buildings, sand sheds, office and lab facilities in addition to a limited number of employee housing buildings, including houses, duplexes, mobile homes, and mobile home pad sites.
• CDOT owns and maintains 1,257 buildings.• Past Funding:
• Primary Measure – Buildings:• Statewide letter grade – “C” or Better (74% in 2016)
• Current condition:• 74% “C” or better in 2016
• Proposed changes to targets:
Asset Class FY2013-14 FY2014-15 FY2015-16 FY2016-17* FY2017-18 FY2018-19 FY2019-20 FY2020-21Buildings $11.3 $20.8 $12.9 $21.4 $17.5 $20.2 $17.6 $18.1
Final Budgets Planning Budget
Asset MeasureFiscally Constrained
TargetProposed Fiscally
Constrained TargetAspirational Target
Proposed Aspirational Target
Reason for Target Change
Buildings Statewide letter grade 90% C or Better 85% C or Better 100% C or Better 90% C or BetterAnalysis indicates that, given fiscal constraints, the old target is not achievable, so staff recommend adjusting the target.
23

Buildings
Annual cost to achieve proposed fiscally constrained target by 2026: $41.9 million. Annual cost to achieve proposed aspirational target by 2026: $55.9 million.
24

Buildings
“A” rated building “F”rated buildingCDOT uses a weighted scale to rank its buildings from A through F based on structural integrity, location/site functionality and other criteria. The department considers in its ranking how well the building is serving its intended purpose.
25

Buildings
Details of a “C”rated building (KOA P2 Building)
26

Buildings
BEFORE: “D”rated building
After: “B”rated building(New exterior and doors; interior renovation)
27

Culverts
• CDOT defines culverts as minor structures that have a clear opening of less than or equal to 20 feet along the direction of the roadway.
• CDOT owns and maintains 6,005 culverts.• Past Funding:
• Primary Measure – Culverts:• Percent of culverts in “poor condition” (a culvert rating of 4 or less)
• Current condition:• 4.87% in poor condition in 2016
Asset Class FY2013-14 FY2014-15 FY2015-16 FY2016-17* FY2017-18 FY2018-19 FY2019-20 FY2020-21Culverts $11.5 $9.6 $8.2 $11.9 $9.1 $7.6 $7.5 $8.3
Final Budgets Planning Budget
*Adjusted for budget increases per TC
28
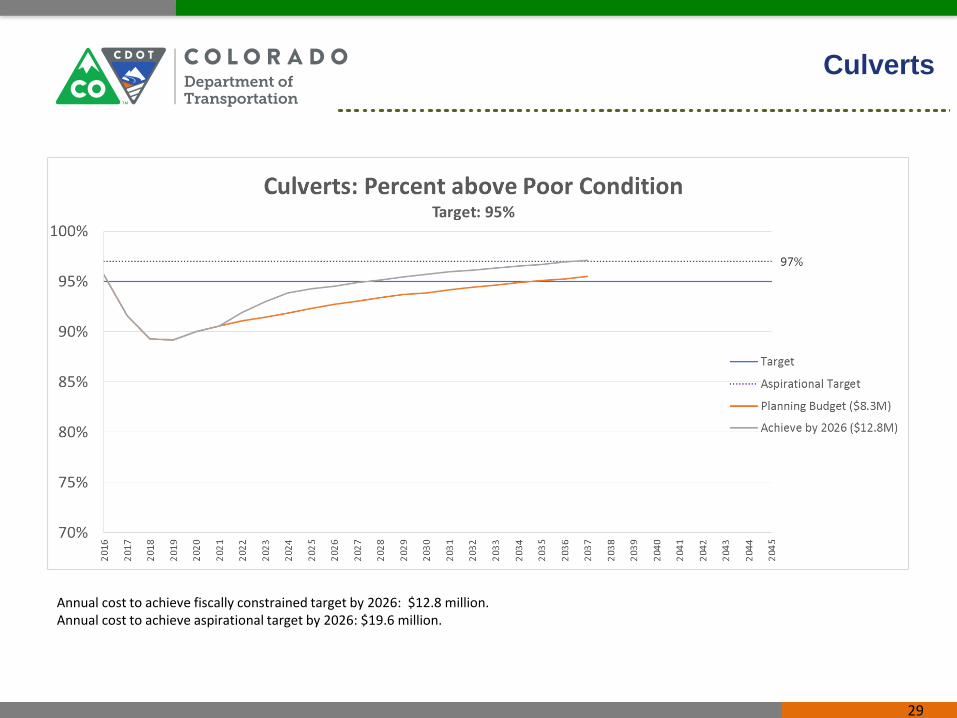
Culverts
Annual cost to achieve fiscally constrained target by 2026: $12.8 million.Annual cost to achieve aspirational target by 2026: $19.6 million.
29

Culvert metric: Percentage above poor condition CMP (Corrugated Metal Pipes)
Culverts
Culverts in GOOD condition generally meet all safety and geometry standards and typically only require preventative maintenance.
CBCs would exhibit no noticeable or noteworthy deficiencies, and CMPs would show smooth symmetrical curvature with insignificant corrosion.
Culverts in Fair condition marginally satisfy safety and geometry standards and either require preventative maintenance or rehabilitation.
CBCs would exhibit cracking with leakage, spalling, and exposed rebar. CMPs would show considerable distortion in one section and significant corrosion.
Culverts in Poor condition do not meet all safety and geometry standards to ensure their safe service. They have exceeded their economically-viable service life and require replacement or major rehabilitation.
CBCs would exhibit large spalls with exposed rebar, heavy scaling, wide cracks, and considerable efflorescence. CMPs would show significant distortion throughout and extensive corrosion.
30

Road Equipment
• CDOT manages a fleet used for road construction, maintenance, and general purpose activities.• CDOT owns and maintains 3,175 statewide fleet equipment units.• Past Funding:
• Primary Measure – Road Equipment:• Average percent useful life
• Current condition:• 87% average percent useful life (2016)
• Proposed changes to targets:
Asset Class FY2013-14 FY2014-15 FY2015-16 FY2016-17* FY2017-18 FY2018-19 FY2019-20 FY2020-21Road Equipment $20.9 $20.9 $18.4 $26.4 $23.0 $26.8 $22.1 $21.6
Final Budgets Planning Budget
Asset MeasureFiscally Constrained
TargetProposed Fiscally
Constrained TargetAspirational Target
Proposed Aspirational Target
Reason for Target Change
Road Equipment Average percent useful life 70% 75% 50% 70%Analysis indicates that, given fiscal constraints, the old target is not achievable, so staff recommend adjusting the target.
31

Road Equipment
Annual cost to achieve proposed fiscally constrained target by 2026: $24.1 million. Annual cost to achieve proposed aspirational target by 2026: $29.2 million.
32

Geohazards
• CDOT manages about 2,300 rockfall mitigation sites statewide.• Past Funding:
• Primary Measure – Geohazards:• Percent of segments at or above risk grade “B”
• Current condition:• Data not yet available
• Proposed changes to targets:
Asset Class FY2013-14 FY2014-15 FY2015-16 FY2016-17* FY2017-18 FY2018-19 FY2019-20 FY2020-21Geohazards $9.0 $9.1 $9.2 $11.8 $8.5 $8.4 $9.7 $12.3
Final Budgets Planning Budget
*Adjusted for budget increases per TC
Asset MeasureFiscally Constrained
TargetProposed Fiscally
Constrained TargetAspirational Target
Proposed Aspirational Target
Reason for Target Change
Geohazardsb Percent of segments at or above risk grade B 80% 85% 90% 90%
Staff recommends adjusting target based on better inventory data. Focusing investment based on the new target will result in a significant reduction in statewide risk exposure.
b Previous Metric: Percent of segments at or above risk grade C
33

Geohazards
Annual cost to achieve proposed fiscally constrained target by 2026: $27.7 million.Annual cost to achieve proposed aspirational target by 2026: $58.6 million.
34
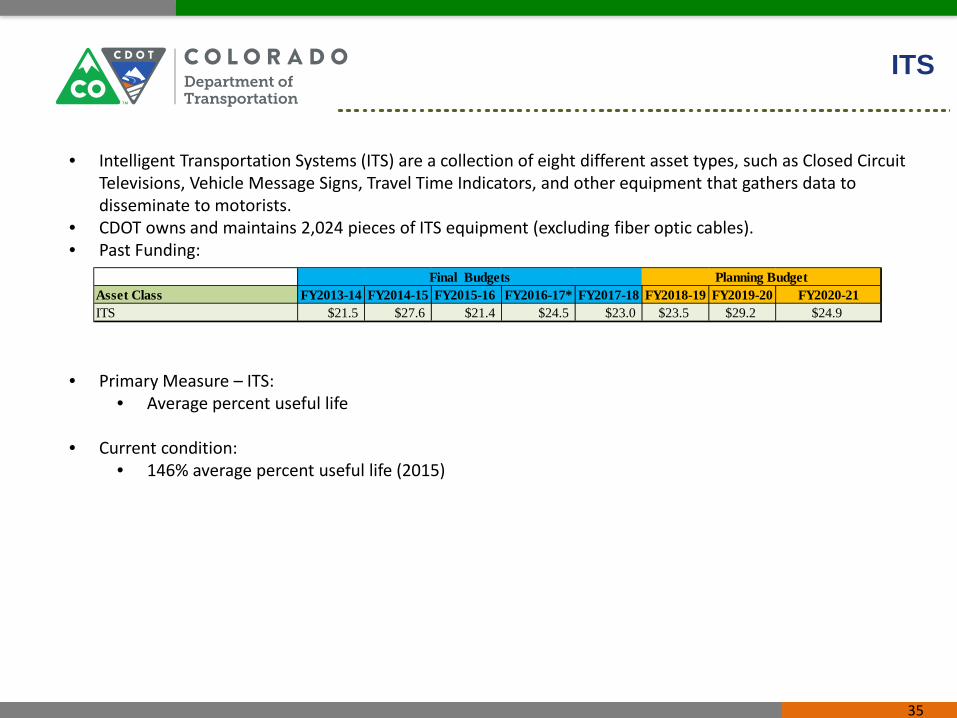
ITS
• Intelligent Transportation Systems (ITS) are a collection of eight different asset types, such as Closed Circuit Televisions, Vehicle Message Signs, Travel Time Indicators, and other equipment that gathers data to disseminate to motorists.
• CDOT owns and maintains 2,024 pieces of ITS equipment (excluding fiber optic cables).• Past Funding:
• Primary Measure – ITS:• Average percent useful life
• Current condition:• 146% average percent useful life (2015)
Asset Class FY2013-14 FY2014-15 FY2015-16 FY2016-17* FY2017-18 FY2018-19 FY2019-20 FY2020-21ITS $21.5 $27.6 $21.4 $24.5 $23.0 $23.5 $29.2 $24.9
Final Budgets Planning Budget
35

ITS
Annual cost to achieve fiscally constrained target by 2026: $31.5 million.Annual cost to achieve aspirational target by 2026: $32.5 million.
36

Pavement
• CDOT’s pavement assets include all paved driving surfaces, whether asphalt or concrete, on the state highway system. Both the main roadway and shoulder are included, as is the pavement substructure.
• CDOT owns and maintains more than 23,000 lane miles of pavement.• Past Funding:
• Primary Measure – Pavement:• Percentage high/moderate drivability life for Interstates based on condition standards and
treatments set for traffic volume categories• Percentage high/moderate drivability life for CDOT-owned NHS, excluding Interstates based on
condition standards and treatments set for traffic volume categories• Percentage high/moderate drivability life for the State highway system based on condition standards
and treatments set for traffic volume categories
• Current condition:• 94% percent high/moderate drivability life for Interstates. (2016)• 85% percentage high/moderate drivability life for CDOT - owned NHS, excluding Interstates. (2016)• 80% percentage high/moderate drivability life for the State highway system. (2016)
Asset Class FY2013-14 FY2014-15 FY2015-16 FY2016-17* FY2017-18 FY2018-19 FY2019-20 FY2020-21Surface Treatment $238.8 $235.2 $235.9 $252.1 $231.4 $225.4 $222.0 $223.2
Final Budgets Planning Budget
37

Pavement
Annual cost to achieve fiscally constrained target by 2026: $302.5 million.Annual cost to achieve aspirational target by 2026: $342.2 million.
38

High Drivability Life: Acceptable driving conditions for more than 10 years.
Low Drivability Life: Fewer than four years of acceptable driving conditions.
Moderate Drivability Life: Four to 10 years of acceptable driving conditions.
39

Signals
• CDOT owns and maintains 1,850 traffic signals statewide.• Past Funding:
• Primary Measure – Signals:• Percent of signal infrastructure in severe condition (dollar weighted)
• Current condition:• 8% of signal infrastructure in severe condition (2016)
• Proposed change to target:
Asset Class FY2013-14 FY2014-15 FY2015-16 FY2016-17* FY2017-18 FY2018-19 FY2019-20 FY2020-21Traffic Signals $0.0 $0.0 $5.7 $16.9 $12.6 $14.8 $14.6 $15.1
Final Budgets Planning Budget
Asset MeasureFiscally Constrained
TargetProposed Fiscally
Constrained TargetAspirational Target
Proposed Aspirational Target
Reason for Target Change
Traffic Signalsc Percent of signal infrastructure in severe condition 15% 2% 0% No Change
The new metric and target allows the program to focus on signals with the greatest performance deficiencies as opposed to all signals without regards to performance.
c Previous Metric: Percent intersections with at least one signal assembly beyond 100% Useful Life
40
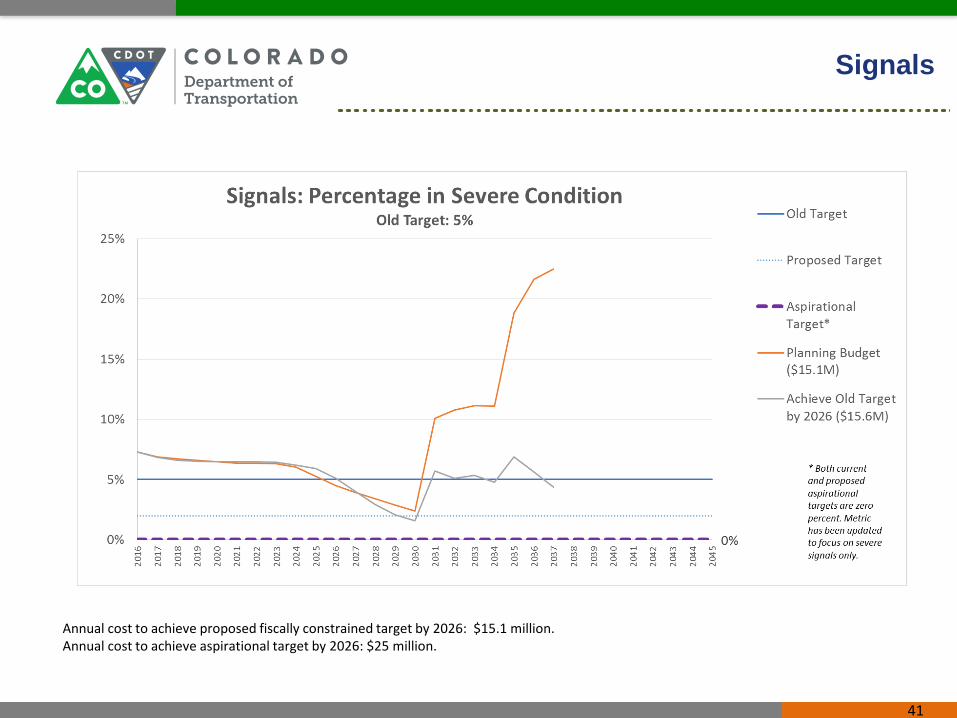
Signals
Annual cost to achieve proposed fiscally constrained target by 2026: $15.1 million.Annual cost to achieve aspirational target by 2026: $25 million.
41

Good Condition Fair Condition Severe ConditionPoor Condition
Signals
The signal is in new or near-new condition. Everything works properly. Preventive maintenance of traffic signal cabinet, structural joints, and foundation base is the key requirement. Examination of the hardware to be sure everything is nominal is the primary preventive maintenance activity for these signals. Age: less than 15 years
The signal infrastructure needs regular preventive maintenance to keep the signal operational. The signal controller is most likely at the end of its useful life. A replacement of the traffic signal cabinet/controller or partial replacement of the signal infrastructure is likely to be needed. Age: 15-25 years
The signal infrastructure is close to the end of its useful design life. Operational failures have increased due to wiring and support hardware problems. Preventive maintenance cannot reasonably extend life much longer. Age: 26-35 years
The signal infrastructure has reached its intended design life and needs replacement. Replacement includes the supporting poles, underground infrastructure and/or span wire, as well as the display hardware and signal cabinet/controller equipment. Age: 36-59 years
42

Tunnels
• CDOT is responsible for tunnel bores throughout the state with a total length of 6.9 miles. Four of these tunnel bores are manned, meaning they have a consistent staff on-site to operate and maintain the facility.
• CDOT owns and maintains 20 tunnel bores statewide.• Past Funding:
• Primary Measure – Tunnels:• Percent of network tunnel length with all elements in equal or better condition than 2.5 weighted
condition index
• Current condition:• 91% (2016)
• Proposed change to target:
Asset Class FY2013-14 FY2014-15 FY2015-16 FY2016-17* FY2017-18 FY2018-19 FY2019-20 FY2020-21Tunnels $7.4 $12.4 $5.2 $10.5 $6.4 $8.4 $10.3 $10.0
Final Budgets Planning Budget
*Adjusted for budget increases per TC
Asset MeasureFiscally Constrained
TargetProposed Fiscally
Constrained TargetAspirational Target
Proposed Aspirational Target
Reason for Target Change
TunnelsPercent of network tunnel length with all elements in equal or better condition than 2.5 weighted condition index
80% 75% 100% No ChangeTunnel condition is worse than originally projected, so staff recommend adjusting the target.
43

Tunnels
Annual cost to achieve proposed fiscally constrained target by 2026: $9.2 million.Annual cost to achieve aspirational target by 2026: $12.6 million.
44

Walls
• The walls asset class includes retaining walls and sound walls.• CDOT’s inventory includes at least 3,555 walls.• Past Funding:
• Primary Measure – Walls:• Percentage of CDOT-owned walls, by square foot, in poor condition (have a rating of 4 or less)
• Current condition:• 4.15% in poor condition in 2016
• Proposed changes to targets:
Asset Class FY2013-14 FY2014-15 FY2015-16 FY2016-17* FY2017-18 FY2018-19 FY2019-20 FY2020-21Walls $0.0 $0.0 $2.4 $10.2 $4.6 $4.6 $5.1 $5.5
Final Budgets Planning Budget
*Adjusted for budget increases per TC
Asset MeasureFiscally Constrained
TargetProposed Fiscally
Constrained TargetAspirational Target
Proposed Aspirational Target
Reason for Target Change
Wallsd Percentage of CDOT - owned walls, by square foot, in poor condition (have a rating of 4 or less)
1% 2.50% 0.50% 1.00%
Descripton of performance metric changed for clarification purposes. Updated inventory found more walls with lower than desirable conditions. Current funding is unable to keep up with the rate of decline, so staff recommend adjusting the target.
d Previous Description: Percent of CDOT-owned walls, by square foot, that are structurally deficient (have a rating of 4 or less)
45

Walls
Annual cost to achieve proposed fiscally constrained target by 2026: $24.1 million.Annual cost to achieve proposed aspirational target by 2026: $31.5 million.
46

Walls
Good Condition Poor Condition
47