archives.hud.govPERFORMANCE AND ACCOUNTABILITY REPORT The FY 2006 Performance and Accountability...
377
Transcript of archives.hud.govPERFORMANCE AND ACCOUNTABILITY REPORT The FY 2006 Performance and Accountability...


PERFORMANCE AND ACCOUNTABILITY REPORT
The FY 2006 Performance and Accountability Report for the U.S. Department of Housing and Urban Development consists of five major components:
• Secretary’s Message
• Section 1, Management Discussion and Analysis
• Section 2, Performance Section
• Section 3, Financial Section
• Section 4, Other Accompanying Information
This report and prior year Performance and Accountability Reports are available at:
www.hud.gov/offices/cfo/reports/cforept.cfm
The following is a list of direct web links to HUD program offices:
Center for Faith-Based and Community Initiatives
www.hud.gov/offices/fbci/index.cfm
Community Planning and Development
www.hud.gov/offices/cpd/
Fair Housing and Equal Opportunity
www.hud.gov/offices/fheo/
Federal Housing Administration www.hud.gov/offices/hsg/hsgabout.cfm
Field Policy and Management www.hud.gov/offices/fpm/
Government National Mortgage Association
www.ginniemae.gov/
Government Sponsored Enterprises
www.hud.gov/offices/hsg/gse/gse.cfm
Healthy Homes and Lead Hazard Control
www.hud.gov/offices/lead/
Multifamily Housing www.hud.gov/offices/hsg/hsgmulti.cfm
Single Family Housing www.hud.gov/offices/hsg/sfh/hsgsingle.cfm
Public and Indian Housing www.hud.gov/offices/pih/
Policy Development and Research www.huduser.org/
2

TABLE OF CONTENTS
GLOSSARY OF ACRONYMS...................................................................................................... 5
MESSAGE FROM SECRETARY JACKSON .............................................................................. 7
SECTION 1. MANAGEMENT’S DISCUSSION AND ANALYSIS ........................................... 9
AN OVERVIEW OF THE PERFORMANCE AND ACCOUNTABILITY REPORT .................................... 10 HUD MAJOR PROGRAM AREAS................................................................................................. 12 DEPARTMENTAL PERFORMANCE HIGHLIGHTS IN FISCAL YEAR 2006........................................ 19
HUD’s Response to Hurricane Disasters.............................................................................. 19 Goal H: Increase Homeownership Opportunities ................................................................ 22 Goal A: Promote Decent Affordable Housing..................................................................... 25 Goal C: Strengthen Communities ........................................................................................ 31 Goal FH: Ensure Equal Opportunity in Housing................................................................. 33 Goal EM: Embrace High Standards of Ethics, Management and Accountability............... 36 Goal FC: Promote Participation of Faith-Based and Community Organizations................ 36 President’s Management Agenda ......................................................................................... 37
RISKS, TRENDS, AND FACTORS AFFECTING GOALS ................................................................... 50 ANALYSIS OF FINANCIAL CONDITION AND RESULT ................................................................... 58 MANAGEMENT ASSURANCES..................................................................................................... 68 IMPROPER PAYMENTS INFORMATION ACT REPORTING .............................................................. 76
SECTION 2. PERFORMANCE INFORMATION ..................................................................... 77
OVERVIEW: STRATEGIC FRAMEWORK AND PERFORMANCE DATA RELIABILITY....................... 78 GOAL H: INCREASE HOMEOWNERSHIP OPPORTUNITIES............................................................ 96
Objective H1: Expand national homeownership opportunities. .......................................... 99 Objective H2: Increase minority homeownership. ............................................................ 113 Objective H3: Make the home-buying process less complicated and less expensive. ...... 122 Objective H4: Fight practices that permit predatory lending............................................. 123 Objective H5: Help HUD-assisted renters become homeowners. ..................................... 124 Objective H6: Keep existing homeowners from losing their homes. ................................ 126
GOAL A: PROMOTE DECENT AFFORDABLE HOUSING ............................................................. 129 Objective A1: Expand access to affordable rental housing. .............................................. 131 Objective A2: Improve the physical quality and management accountability of public and assisted housing................................................................................................. 145 Objective A3: Increase housing opportunities for the elderly and persons with disabilities. .......................................................................................................................... 153 Objective A4: Transition families from HUD-assisted housing to self sufficiency. ......... 156
GOAL C: STRENGTHEN COMMUNITIES.................................................................................... 158 Objective C1: Provide capital and resources to improve economic conditions in distressed communities. ...................................................................................................... 161 Objective C2: Help organizations access the resources they need to make their communities more livable................................................................................................... 169 Objective C3: End chronic homelessness and move homeless families and individuals to permanent housing. ...................................................................................... 175
3

PERFORMANCE AND ACCOUNTABILITY REPORT
Objective C4: Mitigate housing conditions that threaten health........................................ 182 GOAL FH: ENSURE EQUAL OPPORTUNITY IN HOUSING .......................................................... 191
Objective FH1: Provide a fair and efficient administrative process to investigate and resolve complaints of discrimination. .......................................................................... 192 Objective FH2: Improve public awareness of fair housing laws....................................... 195 Objective FH3: Improve housing accessibility for persons with disabilities. ................... 196
GOAL EM: EMBRACE HIGH STANDARDS OF ETHICS, MANAGEMENT, AND ACCOUNTABILITY.................................................................................................................... 197
Objective EM1: Rebuild HUD’s human capital and further diversify its workforce. ....... 200 Objective EM2: Improve HUD’s management, internal controls and systems, and resolve audit issues. ............................................................................................................ 204 Objective EM3: Improve accountability, service delivery, and customer service of HUD and its partners. ......................................................................................................... 220 Objective EM4: Ensure program compliance.................................................................... 224 Objective EM5: Improve internal communications and employee involvement. ............. 233
GOAL FC: PROMOTE PARTICIPATION OF FAITH-BASED AND COMMUNITY ORGANIZATIONS ...................................................................................................................... 235
Objective FC1: Reduce barriers to participation by faith-based and community organizations. ...................................................................................................................... 236 Objective FC2: Conduct outreach and provide technical assistance to faith-based and community organizations to strengthen their capacity to attract partners and secure resources. ................................................................................................................. 237 Objective FC3: Encourage partnerships between faith-based and community organizations and HUD’s traditional grantees.................................................................... 238
SECTION 3. FINANCIAL SECTION ...................................................................................... 239
MESSAGE FROM THE CHIEF FINANCIAL OFFICER ..................................................................... 241 FINANCIAL STATEMENTS ......................................................................................................... 243 NOTES TO FINANCIAL STATEMENTS......................................................................................... 249 CONSOLIDATING FINANCIAL STATEMENTS.............................................................................. 301 REQUIRED SUPPLEMENTARY STEWARDSHIP INFORMATION ..................................................... 326 REQUIRED SUPPLEMENTARY INFORMATION ............................................................................ 332 INDEPENDENT AUDITOR’S REPORT .......................................................................................... 334
Secretary’s Audit Resolution Report to Congress .............................................................. 343 Delinquent Debt Collection ................................................................................................ 347
SECTION 4. OTHER ACCOMPANYING INFORMATION.................................................. 349
MANAGEMENT AND PERFORMANCE CHALLENGES .................................................................. 350 INSPECTOR GENERAL’S SUMMARY OF MANAGEMENT AND PERFORMANCE CHALLENGES ...... 353 IMPROPER PAYMENTS INFORMATION ACT REPORTING DETAILS ............................................. 360 HUD ASSISTED HOUSING UNITS BY PROGRAM ....................................................................... 370 COMPLIANCE STATUS OF FINANCIAL MANAGEMENT SYSTEMS ............................................... 371 ROLE OF PROGRAM EVALUATIONS AND RESEARCH STUDIES IN ASSESSING PROGRAM PERFORMANCE......................................................................................................................... 372
4

Glossary of Acronyms CDBG Community Development Block Grant
CFO Chief Financial Officer
CPD Office of Community Planning and Development
Fannie Mae Federal National Mortgage Association
FFMIA Federal Financial Management Improvement Act
FHA Federal Housing Administration
FMFIA Federal Managers’ Financial Integrity Act of 1982
Freddie Mac Federal Home Loan Mortgage Corporation
FY Fiscal Year
GAO Government Accountability Office
Ginnie Mae Government National Mortgage Association
HUD Department of Housing and Urban Development
OIG Office of Inspector General
OMB Office of Management and Budget
PHA Public Housing Agency
PIH Office of Public and Indian Housing
PMA President’s Management Agenda
5

PERFORMANCE AND ACCOUNTABILITY REPORT
6

Message from Secretary Jackson
November 15, 2006
I am proud and pleased to share with you the Department’s Fiscal Year 2006 Performance and Accountability Report. This report provides information on our program results, management stewardship, and financial condition for the fiscal year ending September 30, 2006. A new major focus for the Department this past year centered on rebuilding the housing and economic infrastructure in the Gulf Coast as a result of the numerous hurricanes in 2005. The devastation particularly affected those who could least afford it and emphasized the role HUD plays in
providing for America’s housing and community development needs both in periods of crisis or stability. The response to these disasters by the entire HUD family is what makes me most proud to serve as the Secretary of this Department.
HUD’s mission is to increase homeownership, support community development, and increase access to affordable housing free from discrimination. In fulfilling this mission, the Department achieved significant program results and notable management improvements during the year, including:
• Developed a revised Strategic Plan that sets forth HUD’s vision, goals, and strategies to continue to advance our mission and remain effective stewards of our citizens’ resources into the next decade;
• Received a “clean” audit opinion on the Department’s consolidated annual financial statements for the seventh consecutive year, with no auditor-reported material internal control weaknesses for the first time ever;
• Continued to be a federal sector leader in eliminating improper payments;
• Allocated $16.7 billion in supplemental Community Development Block Grant (CDBG) disaster funds appropriated by the Congress to assist in the Gulf Coast recovery. The Department continues to provide assistance and oversight to the Gulf Coast States in their development and implementation of plans for the use of those funds;
• Proposed legislative initiatives to improve program results including: the modernization of FHA, giving it the tools needed to perform in today’s housing market; the State and Local Housing Flexibility Act, to provide local public housing authorities with the ability to fashion housing programs that best meet the needs of their local populations; the department-wide consolidation of homeless programs to achieve efficiencies; and revision of the CDBG formula to better target funds to community development needs;
• Increased the minority homeownership rate from 49.2 percent in 2002 to 51.7 percent in 2006. The proportional gain represents approximately 3.48 million additional minority
7

PERFORMANCE AND ACCOUNTABILITY REPORT
homeowners since mid-2002. The continued progress supports the challenging Presidential goal of adding 5.5 million new minority homeowners over a 10-year period ending in 2010;
• Provided rental assistance to approximately 4.8 million families in need, 3.6 million through direct rental assistance and 1.2 million in public housing;
• Continued to assist communities. Since the inception of the CDBG program in 1974, it has awarded more than $116 billion to state and local governments to target their own community development priorities. CDBG allows the communities to prioritize and use the funds to best serve the community with oversight by HUD. The HOME program provides grants to state and local governments to produce affordable housing for low-income families. Since 1992, more than 635 states and local communities have committed to produce more than 743,000 housing units, including almost 300,000 units for first-time homebuyers; and
• Reduced the number of children under the age of 6 with elevated blood lead levels to fewer than 270,000 from in excess of 890,000 in the 1990-to-1994 time period. This number is expected to be reduced to zero by 2010.
The Federal Managers’ Financial Integrity Act (FMFIA) requires that the Secretary report to the President and the Congress on the adequacy of management controls in safeguarding resources. Based on the year-end assurances given by principal agency officials, the Office of Inspector General’s unqualified audit opinion on HUD’s consolidated financial statements, and the lack of any material internal control weakness issues, I assert that HUD’s internal controls and financial systems comply with Sections 2 and 4 of the FMFIA. Further discussion of my assurances can be found in the Financial Management Accountability section of this report.
Additionally, the Federal Financial Management Improvement Act of 1996 requires agencies to implement and maintain financial management systems that are in substantial compliance with OMB Circular A-127 and other Financial System Integration Office requirements, federal accounting standards, and the United States Government Standard General Ledger at the transaction level. This is the second year in which the Department has reported substantial compliance with these requirements. In general, the performance and financial data in this report are complete and reliable, and any data limitations noted in Section 2, Performance Information, or Section 3, Financial Information, are not considered significant to overall information reliability and usefulness.
In closing, the daunting challenges associated with the Gulf Coast recovery will remain with us for many years as we strive to achieve our national goals for increasing homeownership, creating affordable housing opportunities for low-income Americans, supporting the homeless, ensuring equal opportunity in housing markets, and improving communities. The Department will continue to serve as a strong advocate for households and communities in need. I would like to express my appreciation and gratitude both to the HUD staff for its dedication and service to our critically important mission, and to our Congressional and other program partners who work diligently to improve the lives of all of our nation’s citizens.
8

Section 1. Management’s Discussion and Analysis
9

PERFORMANCE AND ACCOUNTABILITY REPORT
An Overview of the Performance and Accountability Report The Department of Housing and Urban Development’s (HUD) Performance and Accountability Report for Fiscal Year (FY) 2006 provides performance and financial information to the Congress, the President, and the American people. The report allows readers to assess HUD’s performance relative to its mission, strategic goals and objectives, and stewardship of the resources entrusted to the Department.
The report is divided into four sections:
Section 1 – Management’s Discussion and Analysis. This section provides a summary of HUD’s FY 2006 results, including actions taken under the President’s Management Agenda to address HUD’s management challenges and high-risk programs, and provides background and other information on these topics:
• HUD’s organization and major programs;
• Performance results highlights for FY 2006;
• Risks, trends, and factors affecting FY 2006 and future goals;
• Analysis of financial condition and results for FY 2006; and
• Management assurances as to the status and effectiveness of the internal controls and financial management systems that support the preparation of the financial statements.
The Management’s Discussion and Analysis is supported and supplemented by detailed information contained in Section 2 (Performance Section), Section 3 (Financial Section), and Section 4 (Other Accompanying Information).
Section 2 – Performance Section. This section provides detailed information on HUD’s progress toward achieving each of the Agency’s strategic goals and objectives in support of its mission for FY 2006. This includes detailed explanations and future plans for the goals and objectives that HUD did and did not achieve.
HUD’s mission is to increase homeownership, support community development, and increase access to affordable housing free from discrimination. The Department pursues this mission through a long-range Strategic Plan and an Annual Performance Plan that support the following strategic goals:
• Goal H: Increase homeownership opportunities;
• Goal A: Promote decent affordable housing;
• Goal C: Strengthen communities;
• Goal FH: Ensure equal opportunity in housing;
• Goal EM: Embrace high standards of ethics, management and accountability; and
• Goal FC: Promote participation of faith-based and community organizations.
Section 3 – Financial Section. This section presents HUD’s consolidated financial statements for FY 2006 along with the independent auditor’s report on those financial statements. This section also contains supplementary information.
10

SECTION 1. MANAGEMENT’S DISCUSSION AND ANALYSIS OVERVIEW OF THE PERFORMANCE AND ACCOUNTABILITY REPORT
Section 4 – Other Accompanying Information. This section includes a statement by the HUD Office of Inspector General (OIG) summarizing what the OIG considers to be the Department’s major management and performance challenges, and progress in addressing those challenges. It also contains more detailed information related to the Improper Payments Information Act and provides descriptions of risk-susceptible programs and corrective action plans to reduce the estimated rate of improper payments.
The Performance and Accountability Report satisfies the reporting requirements of the following legislation:
• Federal Managers’ Financial Integrity Act of 1982;
• Chief Financial Officers Act of 1990;
• Government Performance and Results Act of 1993;
• Government Management Reform Act of 1994;
• Debt Collection Improvement Act of 1996;
• Federal Financial Management Improvement Act of 1996;
• Reports Consolidation Act of 2000; and
• Improper Payments Information Act of 2002.
11
PERFORMANCE AND ACCOUNTABILITY REPORT
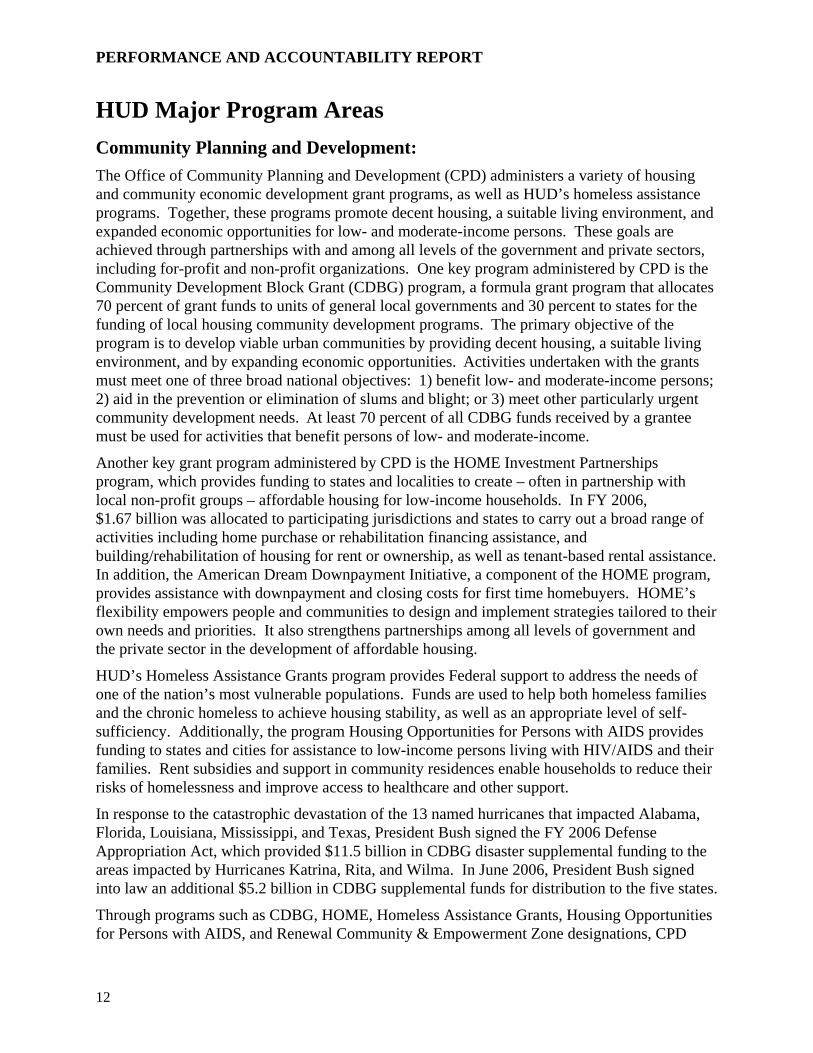
HUD Major Program Areas Community Planning and Development: The Office of Community Planning and Development (CPD) administers a variety of housing and community economic development grant programs, as well as HUD’s homeless assistance programs. Together, these programs promote decent housing, a suitable living environment, and expanded economic opportunities for low- and moderate-income persons. These goals are achieved through partnerships with and among all levels of the government and private sectors, including for-profit and non-profit organizations. One key program administered by CPD is the Community Development Block Grant (CDBG) program, a formula grant program that allocates 70 percent of grant funds to units of general local governments and 30 percent to states for the funding of local housing community development programs. The primary objective of the program is to develop viable urban communities by providing decent housing, a suitable living environment, and by expanding economic opportunities. Activities undertaken with the grants must meet one of three broad national objectives: 1) benefit low- and moderate-income persons; 2) aid in the prevention or elimination of slums and blight; or 3) meet other particularly urgent community development needs. At least 70 percent of all CDBG funds received by a grantee must be used for activities that benefit persons of low- and moderate-income.
Another key grant program administered by CPD is the HOME Investment Partnerships program, which provides funding to states and localities to create – often in partnership with local non-profit groups – affordable housing for low-income households. In FY 2006, $1.67 billion was allocated to participating jurisdictions and states to carry out a broad range of activities including home purchase or rehabilitation financing assistance, and building/rehabilitation of housing for rent or ownership, as well as tenant-based rental assistance. In addition, the American Dream Downpayment Initiative, a component of the HOME program, provides assistance with downpayment and closing costs for first time homebuyers. HOME’s flexibility empowers people and communities to design and implement strategies tailored to their own needs and priorities. It also strengthens partnerships among all levels of government and the private sector in the development of affordable housing.
HUD’s Homeless Assistance Grants program provides Federal support to address the needs of one of the nation’s most vulnerable populations. Funds are used to help both homeless families and the chronic homeless to achieve housing stability, as well as an appropriate level of self-sufficiency. Additionally, the program Housing Opportunities for Persons with AIDS provides funding to states and cities for assistance to low-income persons living with HIV/AIDS and their families. Rent subsidies and support in community residences enable households to reduce their risks of homelessness and improve access to healthcare and other support.
In response to the catastrophic devastation of the 13 named hurricanes that impacted Alabama, Florida, Louisiana, Mississippi, and Texas, President Bush signed the FY 2006 Defense Appropriation Act, which provided $11.5 billion in CDBG disaster supplemental funding to the areas impacted by Hurricanes Katrina, Rita, and Wilma. In June 2006, President Bush signed into law an additional $5.2 billion in CDBG supplemental funds for distribution to the five states.
Through programs such as CDBG, HOME, Homeless Assistance Grants, Housing Opportunities for Persons with AIDS, and Renewal Community & Empowerment Zone designations, CPD
12

SECTION 1. MANAGEMENT’S DISCUSSION AND ANALYSIS MAJOR PROGRAM AREAS
seeks to encourage empowerment of local residents by helping to give them a voice in the future of their neighborhoods, stimulate the creation of community-based organizations, and enhance the management skills of existing organizations so they can achieve greater production capacity. These groups are at the heart of a bottom-up housing and community development strategy.
Office of Fair Housing and Equal Opportunity: The Office of Fair Housing and Equal Opportunity strives to create equal housing opportunities by enforcing the Federal laws that prohibit discrimination in housing on the basis of race, color, religion, sex, national origin, disability, familial status, and age.
Specifically, the Office of Fair Housing and Equal Opportunity implements and enforces the Fair Housing Act and other civil rights laws, including Title VI of the Civil Rights Act of 1964, Section 109 of the Housing and Community Development Act of 1974, Section 504 of the Rehabilitation Act of 1973, Title II of the Americans with Disabilities Act of 1990, the Age Discrimination Act of 1975, Title IX of the Education Amendments Act of 1972, and the Architectural Barriers Act of 1968.
Additionally, the Office of Fair Housing and Equal Opportunity administers Section 3 of the Housing and Urban Development Act of 1968 (12 U.S.C. 1701u), as amended. Section 3 requires that economic opportunities generated by certain HUD financial assistance shall, to the greatest extent feasible, be given to low- and very low-income persons and businesses.
HUD’s Office of Fair Housing and Equal Opportunity also administers two grant programs to assist in reducing incidences of housing discrimination. The Fair Housing Assistance Program provides noncompetitive grants to state and local agencies that administer and enforce fair housing laws that are substantially equivalent to the Fair Housing Act. The Fair Housing Initiatives Program provides funds competitively to private and public entities formulating or carrying out local, regional and national programs that assist in eliminating discriminatory housing practices.
In carrying out its mission, the Office of Fair Housing and Equal Opportunity works with other government agencies on fair housing issues and promotes voluntary fair housing compliance among private industry and community advocacy groups.
Government National Mortgage Association (Ginnie Mae): Through its mortgage-backed securities program, Ginnie Mae, a wholly-owned government corporation within HUD, helps to ensure that mortgage funds are available for low- and moderate-income families served by HUD’s Office of Public and Indian Housing, FHA, the Department of Veterans Affairs, and the Rural Housing Service of the U.S. Department of Agriculture. Ginnie Mae’s Mortgage-Backed Securities Program has been a significant contributor to the growth of the mortgage-backed securities market in the United States, as well as to the expansion of homeownership opportunities for American families by channeling global capital into the nation’s housing markets.
During FY 2006, Ginnie Mae guaranteed $81.7 billion in mortgage-backed securities. Ginnie Mae’s role in the secondary mortgage market provides an important public benefit to Americans seeking to fulfill their dream of homeownership. Cumulatively over the past 38 years, Ginnie Mae has guaranteed the issuance of $2.5 trillion in mortgage-backed securities
13

PERFORMANCE AND ACCOUNTABILITY REPORT
that have provided affordable housing for over 33 million households. In FY 2007, Ginnie Mae is requesting $100.0 billion in new commitment authority and is estimating that over one million more families will have a place to call home. The total amount of Ginnie Mae securities outstanding at the end of FY 2006 was approximately $410.0 billion.
In its effort to provide hurricane relief, on September 8, 2005, Ginnie Mae announced that it would expand its Targeted Lending Initiative to include those census tracts that were declared disaster areas as a result of Hurricane Katrina. The Targeted Lending Initiative provides incentives for lenders to increase loan volumes in traditionally underserved areas by decreasing the guaranty fee Ginnie Mae collects on its mortgage-backed securities, depending on the percentage of eligible loans within each security.
Office of Housing/Federal Housing Administration: The Office of Housing provides vital public services through its nationally administered programs. FHA, the largest housing mortgage insurer in the world, is also located within HUD’s Office of Housing.
Within the Office of Housing are three business areas – Single Family, Multifamily, and Regulatory programs.
HUD’s single family programs include mortgage insurance on loans to purchase new or existing homes, condominiums, manufactured housing, houses needing rehabilitation, and for reverse equity mortgages to elderly homeowners.
HUD’s multifamily programs provide mortgage insurance to HUD approved lenders to facilitate the construction, substantial rehabilitation, purchase and refinancing of multifamily housing projects and healthcare facilities.
HUD’s regulatory programs are designed to protect homeowners, homebuyers, and to regulate real estate transactions.
The Office of Housing administers rental subsidy, homeownership subsidy, and grant programs designed to provide housing to low- and moderate-income persons. One such program is the Section 8 Project-based Rental Assistance Program. Project-based Section 8 assistance differs from the Housing Choice Voucher program (described below in the Public and Indian Housing section) in that the assistance is not provided to individual families, but is instead attached to multifamily housing properties to ensure that these properties remain affordable to low-income families.
In addition, the Office of Housing provides interest-free capital advances to finance the construction, rehabilitation or acquisition of affordable housing with supportive services for the elderly (Section 202) and persons with disabilities (Section 811). The program also provides rental assistance funding to cover the difference between the HUD-approved rent and the tenant’s contribution (usually 30 percent of adjusted income). Recipients do not have to repay the grants as long as the housing remains available for very low-income elderly and persons with disabilities for a period of 40 years.
The FHA provides insurance for mortgages originated by approved lenders to support increased homeownership and affordable rental opportunities across the nation. Through its single family programs, FHA helps low- and moderate-income families including first-time homebuyers,
14

SECTION 1. MANAGEMENT’S DISCUSSION AND ANALYSIS MAJOR PROGRAM AREAS
minorities, and central-city residents, achieve homeownership. By insuring mortgages, FHA makes it much easier for homeowners to borrow the funds they need. Mortgage lenders are more willing to provide mortgage loans because they know that, in the case of a mortgagor default, the federal government will protect them from losses.
Most FHA mortgage loans for homeownership are insured through the Mutual Mortgage Insurance Fund. Other loans for purchasing homes, such as manufactured housing, rehabilitation and acquisition mortgages, and condominiums, are insured through the General Insurance/Special Risk Insurance Fund, as are home equity conversion mortgages for seniors. FHA has expanded its mission since its inception and now provides mortgage insurance to private lenders that finance single-family homes, multifamily projects, healthcare facilities, loans for property improvements, and manufactured homes. Availability of FHA mortgage insurance stabilizes the provision of mortgage credit in the marketplace and encourages the provision of credit to households not served or underserved by the private sector, most notably first time and minority homebuyers. FHA has also expanded its mission to include establishing housing quality standards and demonstrating the financial viability of new mortgage instruments.
In many ways, FHA can be seen as a specialized insurance company that guarantees the payment of mortgages made by private lenders (banks and other mortgage lenders) who make loans to project owners and homebuyers. By eliminating the risk of loss, lenders will provide market rate loans to all eligible purchasers. By collecting mortgage insurance premiums and other fees, FHA is able to be financially self-sustaining, and operate in a financially sound manner. This allows it to pursue its objectives and respond to the needs of its constituency. Since its inception 72 years ago, FHA has provided mortgage insurance to 34.2 million single-family households, and 49,259 multifamily projects containing 5.6 million units of housing. FHA currently has a portfolio of 3.9 million insured single-family mortgages and 12,319 insured multifamily projects.
Finally, the Office of Housing also issues manufactured housing construction and safety standards, administers the Real Estate Settlement Procedures Act, and regulates interstate land sales.
Office of Public and Indian Housing: The aim of the Office of Public and Indian Housing (PIH) is to ensure safe, decent, and affordable housing; create opportunities for residents’ housing self-sufficiency; and ensure fiscal integrity by all program participants.
PIH is responsible for administering and managing a range of programs authorized and funded by Congress under the basic provisions of the U.S. Housing Act of 1937. This Act created the Public Housing program, which provides affordable housing to over 1.2 million households nationwide.
The Section 8 Housing Choice Voucher program is HUD’s largest program that serves approximately two million households through vouchers administered by over 2,400 Public Housing Agencies and other state and local designated entities. With these vouchers, eligible families can seek housing in the private market, and in a neighborhood of their choice. The family generally pays 30 percent of its adjusted income toward the rent while the voucher subsidizes the remaining cost up to a PHA-determined payment standard.
15

PERFORMANCE AND ACCOUNTABILITY REPORT
In addition, public housing capital funds are provided to PHAs to finance capital improvements (developing, rehabilitating, and demolishing units), replace housing, and manage improvements. In FY 2006, the Office of Capital Improvements approved 28 proposals involving approximately $375 million in financing. The financed funds were used for the modernization and development of public housing at 40 PHAs.
Finally, Indian Housing Block Grants and Home Loan Guarantees fund housing development in Indian areas, provide housing assistance to eligible families, and help promote homeownership for Native Americans by providing loan guarantees to private lenders to increase the availability of mortgages and other financing for housing.
Other Mission Support Activities: The HUD Center for Faith-Based and Community Initiatives is one of 10 such centers established by the President in Cabinet level agencies. The goal of the Center is to implement the President’s vision of a compassionate community, where faith-based and community organizations work with government to help the needy in a more effective manner. One of the key principles in this Presidential initiative is that all groups, whether religious or secular, should compete on a level playing field when applying for federal funds. As a result, an important part of the Center’s work is empowering faith-based and community organizations to apply for HUD grants. The Center does not make decisions on awarding grants, nor is there any preference for faith-based organizations. Instead, the Center works to remove unnecessary barriers in order to fully engage these organizations as partners in fulfilling HUD’s mission.
The Office of Healthy Homes and Lead Hazard Control provides funds to state and local governments to develop cost-effective ways to reduce lead-based paint hazards. In addition, the office enforces HUD’s lead-based paint regulations, provides public outreach and technical assistance, and conducts technical studies to help protect children and their families from health and safety hazards in the home.
The Office of Federal Housing Enterprise Oversight is an independent office within HUD that ensures the capital adequacy and the financial safety and soundness of the Federal Home Loan Mortgage Corporation (Freddie Mac) and the Federal National Mortgage Association (Fannie Mae). The Office of Federal Housing Enterprise Oversight is funded through assessments of Fannie Mae and Freddie Mac. The Office of Federal Housing Enterprise Oversight’s operations represent no direct cost to the taxpayer.
Support Organizations: In addition to the program offices described above, HUD has the following support organizations:
The Office of Administration provides support to the Department in the areas of human resources, training, management and planning, administrative and management services, control and management of correspondence, security and emergency planning, and executive scheduling.
The Office of the Chief Financial Officer employs sound financial management practices to help meet the Department’s mission. The Office provides critical support to HUD in the areas of accounting, budget, financial management, and systems.
16

SECTION 1. MANAGEMENT’S DISCUSSION AND ANALYSIS MAJOR PROGRAM AREAS
The Office of the Chief Information Officer provides leadership, vision, and advice to the Secretary and other HUD senior managers on the strategic use of information technology to support core business processes and to achieve mission-critical goals.
The Office of the Chief Procurement Officer awards and administers contracts and purchase orders, and provides vital procurement services to HUD’s program and support offices.
The Office of Congressional and Intergovernmental Relations is responsible for coordinating Congressional and intergovernmental relations activities involving program offices to ensure the effective and accurate presentation of the Department’s views. The Office also is responsible for coordinating the presentation of the Department’s legislative and budget program to the Congress. It also monitors and responds to the HUD-related activities of the Department’s Congressional oversight, authorizing, and appropriations committees.
The Office of Departmental Operations and Coordination performs a broad range of cross-program functions that assist the Secretary and Deputy Secretary with HUD’s continuing management improvement initiatives. The mission of the Office is to directly support the Departmental strategic goal to “embrace high standards of ethics, management, and accountability,” and directly or indirectly support the remaining strategic goals to advance homeownership, affordable housing, stronger communities, fair housing, and participation of faith-based and community organizations.
The Office of Field Policy and Management provides direction and oversight for regional and field office directors. It communicates priorities and policies of the Secretary to these managers and ensures the effective pursuit of the Secretary’s initiatives and special projects.
The Office of General Counsel provides legal opinions, advice, and services with respect to all Departmental programs and activities.
The Office of Inspector General provides independent reviews and objective reporting to the Secretary and the Congress for the purpose of bringing about positive change in the integrity, efficiency, and effectiveness of HUD operations.
The Office of Policy Development and Research is responsible for maintaining current information on housing needs, market conditions, and existing programs, as well as conducting research on priority housing and community development issues. The Office provides reliable and objective program evaluation, data, and analysis to inform policy decisions and improve program results. The Office is committed to involving a greater diversity of perspectives and methods in its research.
The Office of Public Affairs works closely with local and national news media, as well as HUD program and policy contacts, to demonstrate to the public what HUD is doing for them and their communities.
On the following page is an overview of the organizational components of the Department.
17

PERFORMANCE AND ACCOUNTABILITY REPORT
18

SECTION 1. MANAGEMENT’S DISCUSSION AND ANALYSIS DEPARTMENTAL PERFORMANCE HIGHLIGHTS
Departmental Performance Highlights in Fiscal Year 2006 Millions of Americans continued to achieve the American Dream of homeownership or to obtain decent, affordable rental housing through federal funding or services as a direct result of HUD’s mission to increase homeownership, support community development and increase access to affordable housing free from discrimination. The following captioned sections highlight some of HUD’s more significant accomplishments and challenges this year, including a focus on internal management actions designed to improve HUD’s overall program delivery and results. A more detailed discussion and analysis of specific performance against each of HUD’s FY 2006 strategic goals and objectives is provided in Section 2 of this report on “Performance Information.”
HUD’s Response to Hurricane Disasters The summer of 2005 was the worst Atlantic hurricane season ever recorded. There were 28 storms, of which seven were classified as major. Florida and Louisiana were each struck twice by major storms and Mississippi, Alabama, and Texas once. The most catastrophic effects of the season were felt on the Gulf Coast, where a 30-foot storm surge from Hurricane Katrina caused devastating flooding that inundated New Orleans, Louisiana and surrounding parishes, and destroyed most structures on the Mississippi coastline. More than 2,000 lives were lost, and hundreds of thousands of families were displaced from their homes.
HUD mobilized quickly in response to this unatural disaster, and implemented both immediate relieand longer-term recovery actions. Some of the most significant immediate relief actions included:
nprecedented f
• Established the Hurricane Recovery and Response Center – an emergency management division that served as a command post with staff from CFO, Housing, PIH, CPD, Field Policy and Management, General Counsel and Public Affairs. The Hurricane Recovery and Response Center reported directly to the Secretary and was housed at HUD headquarters.
• Established toll-free hotlines for the Department’s various programs to assist the victims of Hurricane Katrina and established a website for information regarding the Department’s efforts and available housing resources.
• Partnered with the Federal Emergency Management Agency and dispatched almost 300 dedicated staff with expertise in manufactured housing, reconstruction, and community planning to the Housing Command Center in Baton Rouge, Louisiana, with provision of additional individuals as needed.
• The Office of Public and Indian Housing, as a partner with the Federal Emergency Management Agency, developed and implemented the Katrina Disaster Housing Assistance Program, providing temporary housing assistance to all HUD-assisted evacuees as well as those who were homeless prior to the disaster.
19

PERFORMANCE AND ACCOUNTABILITY REPORT
• Approved waivers of many regulations in the Department’s programs to ease and expedite access to programs and to provide more flexibility in the use of funds for disaster relief.
• The Office of Fair Housing and Equal Opportunity initiated reviews of trailer units and park sites to evaluate accessibility for evacuees with mobility impairments. The Department made technical
recommendations to the Federal Emergency Management Agency that were adopted, and based on further recommendations, the availability of accessible temporary housing was increased. In addition, HUD staff visited over 60 Disaster Relief Centers and Long-Term Recovery Centers to provide instruction on identifying housing discrimination issues. The Office of Fair Housing and Equal Opportunity also distributed approximately $1.2 million in fair housing partnership funds, which were dedicated to fair housing enforcement and education efforts to address issues related to Hurricanes Katrina and Rita devastation to areas of the Gulf Coast.
The Department has played a major role in recovery efforts in the five Gulf Coast states as well.
• Much of the long-term financial assistance to these states is being made available through two disaster supplemental appropriations to CPD’s CDBG program. These supplemental funds, totaling $16.7 billion, are allocated to homeowners, businesses, non-profit organizations and local governments to stimulate recovery efforts according to the states’ Disaster Action Plans. The states’ uses of funds include: defraying the costs to elevate homes to meet new elevation requirements; providing funds to eligible homeowners whose primary residences were located outside pre-Katrina designated flood zones yet were destroyed or severely damaged; interest-free small business bridge loans; and unmet infrastructure needs.
• Through a partnership with the Internal Revenue Service and co-hosted by Alabama, Louisiana, Mississippi, and Texas communities, CPD conducted 15 workshops to educate citizens on the tax benefits made available through the tax code. The workshops detailed the $8.6 billion in Gulf Opportunity Zone benefits and $1.1 billion in Renewal Community benefits available to stimulate local reinvestment and new investment and provide information on the 26 Gulf Opportunity Zone tax incentive provisions. HUD and Treasury are also working jointly on an additional outreach to promote usage of the Gulf Opportunity Zone incentives and New Markets Tax Credit incentives.
• HUD partnered with the Internal Revenue Service, Katrina Aid Today, H&R Block, and the Houston Housing Authority in the development of an Earned Income Tax Credit demonstration project. The project was designed to ensure that 2,429 HUD-assisted households who relocated to Houston, and likely eligible for the Credit, were offered free tax-preparation services. The Internal Revenue Service extended the income tax filing
20

SECTION 1. MANAGEMENT’S DISCUSSION AND ANALYSIS DEPARTMENTAL PERFORMANCE HIGHLIGHTS
deadline for the Gulf Coast storm evacuees to October 16, 2006. The affected households were provided non-transferable vouchers to obtain free federal and state tax preparation services from H&R Block. A total of 100 households took advantage of the free tax-preparation assistance.
• Through the Department’s Office of Housing as of August 2006, more than 2,000 HUD homes have been repaired and leased to displaced families through utilization of HUD Real Estate Owned properties held off the market. HUD-owned single family properties have been made available for sale to displaced homebuyers at a discount subject to certain conditions. Typically, disaster victims have a one-year period to apply with a lender for a Section 203(h) loan. The Section 203(h) program allows borrowers whose homes were either destroyed or severely damaged to obtain 100 percent mortgage financing for the purchase of a new home anywhere in the country. Additionally, due to the unprecedented extent of destruction caused by the hurricanes, FHA determined that the one-year period that disaster victims could apply for a loan was insufficient and extended the time to apply through September 30, 2007.
FHA has assisted 535 individuals and families purchase new homes, and continues to offer properties from its Real Estate Owned nationwide inventory to hurricane evacuees at special discounts. As of September 30, 2006, 79 properties have been sold to evacuees and 71 transactions are pending at the time of this publication. FHA provide a limited extension of the foreclosure moratorium in that some Mississippi and Louisiana borrowers whose properties were moderately or severely damaged by the hurricanes may be eligible for grant assistance, but have not yet had the opportunity to apply for and receive funds. These grant funds would allow mortgagors to rebuild their homes or, if rebuilding is not feasible, preserve good credit standing by paying off their mortgage debt. As of August 2006, more than 4,000 borrowers living in the disaster-declared areas of Alabama, Florida, Louisiana, Mississippi, and Texas have been assisted through mortgage assistance or foreclosure relief efforts.
• In partnership with the Federal Emergency Management Agency, PIH developed and implemented a comprehensive disaster housing assistance program to convert families from the initial housing response of the Katrina Disaster Housing Assistance Program to the Disaster Voucher Program. In addition, PIH assisted the Housing Authority of New Orleans, whose entire resident population had been evacuated, by getting the housing units ready for reoccupation through repairs and reconstruction.
As a result of the Department’s efforts, over 28,000 families have been assisted, with over 22,000 units leased and more than $173 million in assistance disbursed. HUD approved and funded a $21.8 million grant to the Housing Authority of New Orleans, as well as the Biloxi Mississippi Housing Authority from the Capital Fund Reserve for Emergencies and Natural Disasters to repair and rebuild damaged public housing.
• The Center for Faith-Based and Community Initiatives developed and implemented a communication strategy including the production and distribution of Hurricane Toolkit:
21

PERFORMANCE AND ACCOUNTABILITY REPORT
Recovery After the Storm, an informational guide to federal and local resources available to hurricane victims, and the organizations serving them. This informational guide is available on the internet at http://www.hud.gov/offices/fbci/hurricanetoolkit.pdf
The magnitude of the disasters will keep this recovery in the forefront of the Department for years to come. Efforts to help those affected will continue with an increased emphasis on controls to ensure that funds are used as intended.
Goal H: Increase Homeownership Opportunities Continued expansion of homeownership opportunities remains a top priority for the Department. Homeownership inspires civic responsibility, as homeowners are more likely to vote and get personally involved with local issues. It is advantageous because it contributes to personal asset development, better neighborhoods and schools, and leads to a wider choice of housing types. Homeownership also offers children a stable living environment and influences their personal development in many positive, measurable ways at home and at school.
The importance of this effort and the priority of focusing on performance are reflected in the major legislative proposals to update and strengthen the Federal Housing Administration (FHA) programs. The FHA programs are a vital tool in the Department’s efforts to increase homeownership opportunities for all Americans and are particularly important in assisting first-time and minority homeowners. With the reforms and funding requested for these and HUD’s other housing assistance programs, the Department is on track to meet the Presidential goal of adding 5.5 million new minority homeowners over a 10-year period.
The Department will increase homeownership by raising capital for affordable housing through Ginnie Mae’s mortgage-backed securities program and other direct funding for the American Dream Downpayment Initiative; HOME formula funding; the Housing Counseling Assistance program; better utilization of Homeownership Vouchers provided through Tenant-Based Rental Assistance; expanding the use of the Section 32 Public Housing Homeownership program; supporting the Self-help Homeownership Opportunity Program; continued integration of HUD efforts with the Low-Income Housing Tax Credit program; reducing or eliminating regulatory barriers to the development of new housing; Fair Housing activities and reprioritization with a renewed focus on efficiency and effectiveness; and new Fannie Mae and Freddie Mac performance targets and enhanced oversight.
This strategic goal has six objectives that are composed of 29 performance indicators. Six of these are tracking indicators, and of the remaining 23, 20 were met. The tracking indicators are generally national in scope and provide a good measure of trends in areas where HUD’s span of control is more limited. Detailed information on all of these tracking and performance indicators can be found in Section 2 of this report, and highlights of 2006 results are as follows:
The National Homeownership Picture
The recent trend of rapidly expanding Homeownership has slowed in the third quarter of 2006. However, for the year, the overall trend was slightly upward. The rapid annual home price increases experienced over the last several years slowed, but prices were still high and at a level unaffordable to many.
22

SECTION 1. MANAGEMENT’S DISCUSSION AND ANALYSIS DEPARTMENTAL PERFORMANCE HIGHLIGHTS
• During the third quarter of 2006, the homeownership rate was 69 percent, up 0.2 percentage points from the third quarter of 2005. This translates into 1,058,000 new homeowners during that period.
• The minority homeownership rate increased to 51.7 percent, an increase of 0.5 percent, representing an additional 597,000 minority homeowners from the third quarter of 2005 to the third quarter of 2006.
• The homeownership rate in central cities showed continued strength, advancing by 0.6 percentage points to 54.6 percent from the third quarter of 2005 to the third quarter of 2006.
• The homeownership rate among households with incomes below the national median increased by 0.2 percentage points during the year to 53.0 percent.
HUD’s Contributions to Homeownership
HUD’s program results in support of homeownership during FY 2006 were as follows:
FHA program contributions included:
• FHA endorsed 502,049 single family mortgages for insurance in FY 2006. This was a decrease of 9.6 percent from the FY 2005 level.
• The number of first-time homebuyers among FHA home purchase endorsements increased to 79.3 percent, enabling 248,953 homebuyers to purchase their first home this year.
• Minority households represented 31.7 percent of FHA endorsed first-time homebuyers in FY 2006. This result falls short of meeting the established goal of 35 percent.
• 40.2 percent of all single family mortgages endorsed for insurance by FHA were in underserved communities. This exceeds the goal of 35 percent.
• FHA’s reverse mortgage program has increased significantly over the past six years, from 7,793 insured cases in FY 2001 to 76,375 cases in FY 2006. FHA was the first entity to promote and insure reverse mortgages on a national scale. The program provides eligible homeowners access to the equity in their property with very flexible terms. The loan may provide a lump sum payment, monthly payment, a line of credit or a combination of the above. The financing allows homeowners to stay in their home with no repayment until the property is vacated or sold. The program is limited to homeowners 62 years of age and older and is designed for those with limited income.
• During FY 2006, 90 percent (2,378 of 2,648) of FHA-insurable real estate owned single family properties were sold to owner-occupants. The result meets the goal of 90 percent and represents an increase from the 85.1 percent achieved last year.
• The financial condition of the Mutual Mortgage Insurance Fund of FHA continues to be solid as determined by the capital ratio. The ratio for FY 2006 was 6.82 percent, surpassing the goal of 2.0 percent and building on last year’s rate of 6.02 percent.
While FHA continues to make homeownership possible for families and individuals who are either unserved or underserved by the conventional market, it has faced numerous challenges maintaining the competitiveness of its programs within the mortgage industry. Current statutory barriers, for example, do not allow FHA to effectively compete in today’s housing market.
23

PERFORMANCE AND ACCOUNTABILITY REPORT
Legislation to modernize FHA has been approved by the House of Representatives and is awaiting Senate approval. Passage of this legislation will reduce statutory barriers and increase FHA’s flexibility to respond to changes in the marketplace. This will allow FHA to serve more prospective homebuyers by providing an alternative to sub-prime loans with high interest rates and closing costs, as well as expensive pre-payment penalties.
Community Planning and Development made the following contributions to homeownership:
• Results of the HOME Investment Partnerships program were as follows:
o During FY 2006, participating jurisdictions completed 55,652 new homebuyer units and or directly assisted homebuyer households – 66 percent more than the 2006 goal. The total dollar value disbursed was $723.4 million or $11,329 per homebuyer unit, an increase of 6.9 percent from FY 2005.
o The American Dream Downpayment Initiative assisted 9,096 households in the purchase of their first home, exceeding the goal of 7,500.
o 16,821 homeowner rehabilitation units were completed using HOME funds, exceeding the FY 2006 goal by 7,601 units or 82 percent.
o The number of minority households assisted also exceeded its FY 2006 goal by 8,202 households or 47 percent. The number of households assisted was 25,622.
• During the one-year period ending June 30, 2006, Self-Help Homeownership Opportunity Program grantees completed 1,868 housing units, exceeding the program goal of 1,500 units by 368, or 25 percent.
• In FY 2006, CDBG grantees assisted a total of 139,136 households through homeowner assistance programs, segmented as follows:
o 131,508 households received benefits through owner-occupied housing rehabilitation activities, six percent more than the goal and 6,964 more households than in FY 2005.
o The direct homeownership activities provided assistance to 7,628 households, which was below the goal of 11,452 households. While reviewing the shortfall, improved data analysis identified multiple instances where grantees were improperly reporting homeownership counseling activities as direct homeownership assistance. The FY 2006 goal was incorrectly established because it was based on this inaccurate reporting. The FY 2007 goal has been revised accordingly.
Public and Indian Housing contributions in support of homeownership included:
• The cumulative number of low-income and minority families who have become homeowners through the Housing Choice Voucher/Housing Certificate Fund reached 7,528 households, surpassing the cumulative goal for the end of FY 2006 of 6,000.
• For FY 2006, HUD approved 16 proposals that allowed public housing residents and other low-income individuals to purchase units under the Section 32 Rule. This exceeds this year’s goal of 12 proposals by 33 percent.
• The Indian Home Loan Guarantee program, Section 184, significantly exceeded, by 43 percent, its goal of guaranteeing $120 million in loans to Native Americans.
24

SECTION 1. MANAGEMENT’S DISCUSSION AND ANALYSIS DEPARTMENTAL PERFORMANCE HIGHLIGHTS
Secondary mortgage market institutions, including Ginnie Mae and the two housing government-sponsored enterprises, contributions included:
• Ginnie Mae securitized 91.4 percent of all FHA single family fixed rate loans.
• Fannie Mae and Freddie Mac both surpassed HUD’s target of 52 percent of mortgages purchased or guaranteed to serve low- and moderate-income families, with Fannie Mae achieving 55.1 percent and Freddie Mac 54.0 percent.
Other HUD activities promoting homeownership included:
• FY 2005 data concerning pre-purchase counseling services by HUD-approved agencies shows that 37 percent of clients purchased a home or became mortgage-ready within 90 days, exceeding the goal of 30 percent. Actual data for FY 2006 will be available 90 days after the end of the fiscal year.
• The Office of Real Estate Settlement Procedures Act and Interstate Land Sales responded and closed 1,355 complaints during FY 2006, exceeding the goal by 35 percent.
HUD programs continue to promote higher homeownership rates among underserved populations. HUD and the housing industry remain on pace to meet the President’s long-term goal for 5.5 million additional minority households to become homeowners by 2010.
Goal A: Promote Decent Affordable Housing In addition to promoting homeownership, the Department supports the provision of affordable rental housing for families, elderly families, persons with disability, and more vulnerable populations with special needs. HUD recognizes that homeownership may not be practical for all families, especially those with limited or unstable income. Therefore, the largest component of HUD’s proposed FY 2007 budget continues to promote affordable rental housing for families and individuals in need.
Collectively, HUD programs providing housing assistance continue to greatly reduce the number of American families experiencing worst case housing needs due to severe rent burdens and/or physically inadequate housing. In addition to providing housing stability, other HUD programs seek to foster housing self-sufficiency by linking families in public and assisted housing to services in the community that help them improve their skills, find work, and overcome obstacles to full employment. HUD is also working to increase housing opportunities for the elderly and persons with disabilities.
This strategic goal has four objectives that encompass 25 performance indicators. One of these is a tracking indicator for which data was not available. Of the remaining 24 indicators, HUD met or exceeded 22. The tracking indicator is national in scope and provides a good indication of trends in an area where HUD’s span of control is more limited.
Increased production/maintenance of affordable housing stock was supported by a number of HUD programs this year with the following results:
• The Department endorsed 1,016 new multifamily housing loans with a face value of $5.13 billion to build, repair, or refinance 112,019 units of housing or beds in multifamily housing properties, nursing homes, and assisted living facilities. This exceeded the fiscal year goal.
25

PERFORMANCE AND ACCOUNTABILITY REPORT
• The HOME Investment Partnership program contributed 47,598 rental housing units to the housing stock in FY 2006, exceeding the goal of 21,338 units by 123 percent.
• During FY 2006, the Department and grantees completed the conversion process for 14 projects that provided 392 units of assisted living for the frail elderly. This represents 175 percent of the goal.
Increased Capital for affordable housing finance:
• Ginnie Mae securitized 96.9 percent of eligible FHA multifamily mortgages. This performance exceeded the goal of 90 percent market share. Throughout FY 2006, Ginnie Mae’s multifamily program continued to grow, but at a slower pace than in previous years. Multifamily issuances were $8.0 billion in FY 2006, and the program’s remaining balance has increased from $35.3 billion in FY 2005 to $37.8 billion in FY 2006, an increase of 7.4 percent increase since FY 2005. This demonstrates the appeal of multifamily government-guaranteed loans to investors.
• Fannie Mae and Freddie Mac both greatly exceeded their goals for providing capital for special affordable multifamily housing. During calendar year 2005, Fannie Mae purchased $10.39 billion of qualifying multifamily mortgages, significantly exceeding the goal of $5.49 billion, and Freddie Mac purchased $12.35 billion, greatly exceeding the goal of $3.92 billion.
Direct HUD funding/loan guarantees for housing production:
• During FY 2006, HUD reached initial closing on 315 Section 202 and 811 loans. The Section 202 loans resulted in an additional 6,375 housing units for the elderly and the
Section 811 loans provided an additional 1,677 housing units for persons with disabilities. This exceeds the Department’s goals.
HOPE VI Demolition Grant of $10.9 Million
The 62-unit Cohansey View site was approved for demolition as part of the $10.95 million Bridgeton, New Jersey HOPE VI development. Plans call for the development of 96 new public housing units, 161 affordable and market rate rental units, 6 lease-to-own homeownership units and 104 affordable and market rate homeownership units, creating a total of 367 housing units. The 38-unit Mill Street site received a $674,000 demolition grant.
Completed home from Phase II of Bridgeton HOPE VI
• Through March 31, 2006, the HOPE VI Revitalization program exceeded its redevelopment plans for relocation, unit completion, and occupancy when compared to the FY 2006 annual goal. The HOPE VI program relocated 2,962 households, completed 7,085 new or rehabilitated units, and occupied 8,081 units.
Improvements to rental housing assistance programs continued to be a primary focus for HUD and its housing partners in FY 2006. HUD’s major rental housing assistance programs – public housing, Housing Choice Vouchers, and multifamily project-based assistance – constitute HUD’s largest appropriated funding activity, with $27 billion of annual spending to provide housing to nearly 4.8 million households in FY 2006. Under these programs, assisted households typically pay 30 percent of their income for housing, with HUD funding covering the balance of the stipulated rent or remaining operational costs, in accordance with program
26

SECTION 1. MANAGEMENT’S DISCUSSION AND ANALYSIS DEPARTMENTAL PERFORMANCE HIGHLIGHTS
regulations. The table in Section 4 of this report reflects how many units of housing assistance are available under the major HUD rental assistance programs and certain other HUD housing assistance programs. For example, the 23,325 households assisted with HOME-funded tenant-based rental assistance exceeded the goal of 10,081 by 13,244 households or 131 percent.
Public Housing HUD provides operating subsidies and capital funds for public housing units that serve approximately 1.2 million households. These units are administered by PHAs. Given the significance of the resources and responsibilities entrusted to the PHAs, HUD has established comprehensive remote monitoring systems to assess performance and the need to target on-site monitoring, technical assistance, or other intervention actions to improve performance. The most recent scoring results indicate that most PHAs are performing adequately, as noted below:
• The Public Housing Assessment System assesses the overall performance of PHAs. PHAs can receive a maximum score of 100 based on their physical, financial, and management conditions (30 points each), as well as resident satisfaction (10 points). At the end of FY 2006, the unit-weighted average Public Housing Assessment System score was 85.0, falling short of the goal of 85.8 percent by 0.8 percent.
• Housing agencies with composite scores below 60 points or scores below 18 points for any one component are classified as “troubled”. The number of units managed by “troubled” PHAs was reduced by 31 percent, exceeding the 15 percent reduction target. At the beginning of the fiscal year, 202 PHAs, amounting to 78,475 low-rent units were “troubled”. By the end of September 2006, 24,321 units were no longer troubled following receipt of assistance from the PIH field offices and the Recovery and Prevention Corps.
HUD strives to ensure that its rental assistance is providing decent, safe and sanitary housing in accordance with HUD’s physical condition standards. Working with its PHA program partners, HUD continued to improve the quality of housing supported by its public housing assistance in FY 2006.
Individual PHA project inspection results indicate a PHA’s compliance with HUD’s physical condition standards. The results of project inspections as of September 30, 2006, associated with the current profile of PHA inspection scores, are shown in the following chart.
27

PERFORMANCE AND ACCOUNTABILITY REPORT
Public Housing Project Inspection Profiles *
Fiscal Year 2000 2001 2002 2003 2004 2005 2006
# of Projects 13,569 14,011 14,021 14,142 14,316 14,367 14,570
Project Conditions
Above Standard
22% 33% 38% 38% 38% 37% 36%
Standard 61% 58% 55% 55% 54% 55% 55%
Subtotal: Standard or Above Standard
83% 91% 93% 93% 92% 92% 91%
Sub-Standard 17% 9% 7% 7% 8% 8% 9%
* Under HUD's targeted inspection program, properties are inspected on a rotating basis. The frequency is based on several factors, including size and previous scores. Inspections are more frequent for lower-scoring properties. If a property has not been inspected during the current fiscal year, the previous inspection score is used for that year's profile.
• During FY 2006, 85.8 percent of public housing units were in projects that met or exceeded HUD’s physical condition standards, exceeding the goal of 85.1 percent.
• The Real Estate Assessment Center’s physical inspections identify exigent health and safety or fire safety deficiencies. Exigent health and safety hazards include, but are not limited to: (1) air quality, gas leaks; (2) electrical hazards, exposed wires/open panels; (3) water leaks on or near electrical equipment; (4) emergency/fire exits/blocked/unusable fire escapes; (5) blocked egress/ladders; and (6) carbon monoxide hazards. Fire safety hazards include: (1) window security bars preventing egress; and (2) fire extinguishers expired. In FY 2006, the exigent health and safety hazards defects per troubled property dropped significantly from 9.80 to 4.55 defects per property. This represents a 54 percent decrease in defects per property, greatly exceeding the goal to decrease the defects per property by 10 percent.
• As of the end of FY 2006, 93.6 percent of public housing units had functioning smoke detectors and were in buildings with functioning smoke detection systems. This is vastly higher than the national rate of 75 percent of all housing units.
To better assure PHAs well manage HUD funds to provide decent, safe and affordable housing at a reasonable cost, HUD is changing its program delivery and oversight to a project-based asset management structure that emulates commercial real estate industry practices.
Multifamily Housing Multifamily Housing has oversight responsibility for approximately 30,000 insured or assisted properties with over 2.5 million housing units. Of these units, 1,258,000 are Section 8 assisted units located in 17,839 properties. HUD has outsourced some of its monitoring to state and other agencies under performance-based contract administrator agreements. The performance-based contract administrators review all vouchers prior to payment and perform annual Management and Occupancy Reviews on all assigned properties to ensure owners and management agents are properly applying the occupancy guidelines and income verification processes. In the
28

SECTION 1. MANAGEMENT’S DISCUSSION AND ANALYSIS DEPARTMENTAL PERFORMANCE HIGHLIGHTS
Management and Occupancy Reviews, the performance-based contract administrators also follow up on the most recent physical inspection to ensure that deficiencies noted in that inspection or any exigent health and safety conditions cited, have been satisfactorily corrected.
The results of the FY 2006 physical inspection conducted on the multifamily housing portfolio of 29,722 properties shows that 28,206 met or exceeded HUD’s physical condition standards. This represents 95 percent of the inventory and maintains a very high standard. The remaining 5 percent are under management improvement operating plans to bring those projects up to acceptable standards.
Multifamily Housing Project Inspection Profiles *
Fiscal Year 2000 2001 2002 2003 2004 2005 2006 # of Projects 28,038 28,647 28,898 29,705 30,319 29,254 29,722
Project Conditions (100 point scale)
Exemplary (90-100) 37% 55% 54% 55% 55% 55% 53%
Above Standard (80-89) 24% 25% 25% 25% 25% 26% 26%
Standard (60-79) 26% 14% 15% 15% 15% 15% 17%
Subtotal - Standard or Above (60-100) 87% 94% 94% 95% 95% 96% 95%
Sub-Standard (31-59) 11% 5% 5% 4% 4% 4% 5%
Troubled (0-30) 2% 1% 1% 1% 1% <1% <1%
* Under HUD's targeted inspection program, properties are inspected on a rotating basis. The frequency is based on several factors, including size and previous scores. Inspections are more frequent for lower-scoring properties. If a property has not been inspected during the current fiscal year, the previous inspection score is used for that year's profile.
The Office of Multifamily Housing implemented a new protocol on physical inspection referrals to the Departmental Enforcement Center during FY 2003. The new protocol streamlined procedures and placed an increased focus on enforcing corrective action at properties scoring in the sub-standard range.
During FY 2003, HUD also established more stringent requirements for defining and reporting on exigent or life-threatening health and safety deficiencies. When such deficiencies are detected during HUD’s on-site physical inspections, citations are issued to project owners and agents requiring corrective action and a response to HUD within three business days. During FY 2006, the average number of exigent deficiencies observed per privately owned multifamily property increased by 0.06 to 1.46 per property. This result falls short of the goal of a five percent reduction to fewer than 1.40 deficiencies per multifamily property in FY 2006.
At the end of FY 2006, 93.8 percent of HUD-assisted multifamily units had functioning smoke detectors and were in buildings with functioning smoke detection systems, surpassing the goal of 92.8 percent and substantially above the national average of three quarters of all housing units.
29

PERFORMANCE AND ACCOUNTABILITY REPORT
Housing Choice Vouchers The Housing Choice Voucher Program is HUD’s largest program, with FY 2006 funding in excess of $15 billion to serve approximately 2 million households. The program, which is administered by over 2,400 PHAs, has successfully served millions of low-income families for more than 30 years, and is a main component of the federal government’s efforts to address the need for affordable rental housing through the private housing market.
The program provides low-income participants with the ability to seek privately owned rental housing of their choice, within certain rent parameters and HUD-established housing quality standards. The program has a portability feature that enables families to take their vouchers to other rental markets in pursuit of available jobs and other economic opportunities.
Last year, Congress changed the basis of the Housing Choice Voucher Program funding from a “unit-based” process with program variables that affected the total annual federal funding need, to a “budget-based” process that limits the federal funding to PHAs to a fixed amount. Whereas the prior unit-based process resulted in both escalating annual federal budget needs and large balances of un-utilized funds at the end of the annual funding cycle, the budget-based process has leveled total program funding. This budget-based process is intended to provide PHAs with a steady funding stream and flexibility in the management of the program within the annually computed budget.
However, legislative change is needed to provide PHAs with the flexibility to manage their programs according to local needs and priorities. The Department’s legislative proposal, the State and Local Housing Flexibility Act of 2005, would streamline the program and give more flexibility to PHAs to administer the program to better address local needs within their set annual funding amount.
Under the current funding approach, a certain level of local program reserve is necessary given the many existing variable factors that affect the program funding utilization, such as market conditions, the local voucher acceptance rate, and changes in the tenant income mix being subsidized. While most Housing Choice Vouchers are currently being used to assist low-income families, about four percent of program
ctcal
3
Newly Constructed Housing for Mentally Ill and Homeless
The Briggsdale Apartment complex is a newly constructed 35-unit permanent supportive housing development for mentally ill and other chronically homeless individuals in Columbus, Ohio. The Community Housing Network used a variety of funding to undertake this much needed project, including Community Development Block Grant funds and HOME funds from the City of Columbus and Franklin County; State Housing Finance Agency loans; Low Income Housing Tax Credits; Columbus Housing Authority rent subsidies; and HUD homeless program funds for operations and services.
funding for the first annual budget-based funding cycle in alendar year 2005 was unutilized due to program restrictions on the number of voucher units hat can be leased at the PHA level. Putting a ceiling on the number of leased voucher units is a arry-over from the previous unit-based funding strategy and does not allow PHAs to take dvantage of program efficiencies they achieve under budget-based funding. The Department’s egislative proposal would change the authorizing statutes to provide PHAs greater flexibility to
0

SECTION 1. MANAGEMENT’S DISCUSSION AND ANALYSIS DEPARTMENTAL PERFORMANCE HIGHLIGHTS
use their fixed funding to meet local needs, and the rate of underutilized funding can be further reduced, thus serving more low-income households.
In the interim, increasing PHAs’ utilization of voucher funds remains a key HUD priority. HUD will closely monitor underutilization of funds and will take appropriate action, including possible revisions to future funding allocations to ensure appropriated funds are being used to serve as many families as are authorized to receive vouchers under the program.
Goal C: Strengthen Communities HUD’s strategic goal of strengthening communities is achieved through providing capital and resources to improve economic conditions in distressed communities, and working to help organizations access critical resources to make their communities more livable. Through its varied grant, loan, and subsidy programs, HUD is also striving to move homeless families and individuals into permanent housing, and mitigate housing conditions that threaten health.
This goal has four objectives that are composed of 32 performance indicators. HUD met or exceeded 24 of the 32 indicators, and data were not available for four. More detailed information on these objectives and performance indicators can be found in Section 2 of this report.
Benefits to Low- and Moderate-Income Residents are a mandated goal for CDBG Entitlement communities and states, which are required to spend at least 70 percent of grant funds for housing and community and economic development activities that benefit low- and moderate-income residents. During FY 2006:
• Entitlement communities used 95.1 percent of their CDBG funds for activities that benefit low- and moderate-income persons. This exceeds the goal of 92.0 percent and remains consistent with the FY 2005 actual result of 95.3 percent.
• State grantees used 96.8 percent of their CDBG funds for activities that benefit low- and moderate-income persons. This exceeds the goal of 96.0 percent, and is the same as the FY 2005 level of 96.8 percent.
Addressing Homelessness is a major focus of several HUD grant programs to communities. HUD’s Annual Progress Report data reflects the following significant results in FY 2006:
• For FY 2006, approximately 62.4 percent of formerly homeless persons in HUD-funded transitional housing went into permanent housing, exceeding HUD’s goal of 61 percent. This is an increase from the outcome reported in FY 2005 of 61 percent.
• Of the homeless persons who entered HUD-funded permanent housing, 73.5 percent remained in that housing for at least six months, exceeding HUD’s goal of 70.5 percent. This is an increase from the result reported in FY 2005 of 70 percent, and is reflective of HUD’s emphasis on increasing the number of permanent housing units for the homeless and providing appropriate supportive services.
31

PERFORMANCE AND ACCOUNTABILITY REPORT
• Approximately 17 percent of homeless adults were able to leave HUD-funded projects with employment income in FY 2006, which is the same result as reported in FY 2005.
While there is no method to directly measure the number of chronically homeless individuals, HUD is working with other federal agencies and communities to develop definitions, methods and systems for measuring the extent of chronic homelessness. HUD continued to work with
communities to establish adequate Homeless Management Information Systems to provide data and support analysis regarding the extent of homelessness and the effectiveness of program efforts to address homelessness. Based on the applications received under the 2006 Continuum of Care competition, approximately 408 communities throughout the country have implemented Homeless Management Information Systems, which meet HUD’s goal.
Job Creation and Retention was a continuing focus of community recipients of HUD grant and loan funds and community renewal programs in FY 2006, with the following activity reported:
• 55,967 full-time-equivalent jobs were created or retained with CDBG funds, falling short of the goal of 73,735 jobs.
• The total number of jobs to be created or retained through approved applications for Section 108 Loan Guarantee assistance was 10,166, reflecting a shortfall from the original goal of 11,000 jobs.
• The total renewal community and empowerment zone employment credits claimed by sole proprietors increased 61 percent nationally from 2002 to 2004.
Assuring Healthy Homes is the focus of HUD’s Office of Healthy Homes and Lead Hazard Control, which provides grants to state and local government agencies to control lead and housing-related hazards in privately owned low-income housing, with the following results through the end of FY 2006:
• Reducing asthma triggers is a primary focus of the Healthy Homes Initiative. Under the Healthy Homes Grant Programs, an estimated 1,704 housing units had respiratory hazards mitigated using healthy homes principles in FY 2006.
• The Lead Hazard Control Grant Programs made an estimated 9,638 homes lead safe in FY 2006, which
HUD and “Leadie Eddie” Help Children in Minnesota
In 2006, enforcement settlements in Minneapolis generated funds for the “Leadie Eddie Van” – a mobile clinic used to screen young children for lead poisoning.
Healthy Homes for Healthy Kids
Every year, doctors inform parents that their children have been poisoned by dangerous lead-based paint. Public health officials report an alarming increase in the number of children suffering from asthma triggered by common conditions in their own homes. Dramatically reducing the number of these tragic stories is the focus of an intensive three-year, 30-city campaign announced in April 2006 by Secretary Jackson.
32

SECTION 1. MANAGEMENT’S DISCUSSION AND ANALYSIS DEPARTMENTAL PERFORMANCE HIGHLIGHTS
exceeded the FY 2006 goal of making 9,250 homes lead-safe.
Goal FH: Ensure Equal Opportunity in Housing HUD’s strategic goal of ensuring equal opportunity in housing is achieved through increasing public awareness of fair housing laws, enforcing the Fair Housing Act, and providing more accessible housing options for persons with disabilities. HUD also provides a fair and efficient administrative process to receive, investigate, and resolve housing discrimination complaints.
This goal has three objectives that includes six performance indicators. HUD met or exceeded all six of the indicators. More detailed information on these performance indicators can be found in Section 2 of this report.
Measuring Discrimination and Public Awareness HUD conducts studies to review the nature and extent of housing discrimination and public awareness of fair housing laws. These studies enable HUD’s Office of Fair Housing and Equal Opportunity to target activities to increase awareness and reduce discrimination. Increased public awareness of fair housing laws, more often than not, reduces discriminatory actions. However, prior to a study in FY 2000, no nationally available data existed to estimate the
extent of awareness. The findings of this study supported the conclusion that the public generally has relatively widespread knowledge of certain fair housing protections and prohibitions, while other areas of the fair housing law, such as protections for families with children, are not as familiar. The most recent HUD-sponsored Housing Discrimination Studies report:
FHEO takes time out to help Habitat for Humanity • In over 20 percent of initial rental search inquiries,
and at least 17 percent of initial home purchase inquires, African Americans and Hispanics received adverse treatment compared to non-Hispanic whites. This represents a large decrease in discrimination experienced in the home purchase inquiries of both groups between 1989 and 2000. There has also been a modest decrease in reported discrimination against African Americans seeking to rent homes. Hispanic renters are now more likely to experience discrimination in their housing search than African American renters.
The Office of Fair Housing and Equal Opportunity formed two volunteer groups to assist Habitat for Humanity in the construction of several new homes in a development in the Deanwood Section of northeast Washington, DC. The Habitat for Humanity development in which FHEO volunteers worked is scheduled to be completed in 2008 and will make53 homes available for low-income families.
• Whites were consistently favored over Asians and Pacific Islanders in seeking housing in approximately one in every five rental or sales transactions.
• Whites were consistently favored over American Indians in an average of 28.5 percent rental
33

PERFORMANCE AND ACCOUNTABILITY REPORT
transactions in Minnesota, Montana, and New Mexico, the three states studied.
• The level of discrimination faced by both deaf persons and persons in wheelchairs is substantially greater than the levels of housing discrimination experienced by African Americans and Hispanics (observed in the Chicago housing market).
• Deaf persons experienced consistent adverse treatment relative to hearing persons in 49.5 percent of rental inquiries in the Chicago metropolitan area.
• Wheelchair users experienced consistently adverse treatment relative to non-disabled persons 32.3 percent of rental inquires in the Chicago metropolitan area.
• One in every four persons in a wheelchair was told about fewer units than similarly qualified non-disabled persons. Both wheelchair users and persons with hearing impairments received far less information about the application process than did similarly qualified non-disabled persons.
In February 2006, HUD released the results of a follow-up survey that addresses whether public awareness has increased since 2000. The 2006 study found that there has been very little improvement in knowledge of the Fair Housing Act over the past four years but a substantial increase in support. As with the earlier survey, this study also reveals that most people do not take action when they believe they have experienced discrimination. According to the study, 80 percent of the people that believe they experienced discrimination did nothing about it.
Investigation and Enforcement Activity HUD investigates and resolves complaints of alleged housing discrimination filed by private citizens and interest groups throughout the nation. Through vigilant enforcement efforts, HUD and its grantee partners are transmitting the message that fair housing laws are a key priority and must be adhered to by all. In FY 2006, HUD’s Office of Fair Housing and Equal Opportunity closed 73 percent of fair housing complaints in 100 days, exceeding its goal of closing 60 percent of such complaints.
HUD also provides Fair Housing Assistance Program grants to “substantially equivalent” fair housing agencies. These agencies enforce state fair housing laws or local ordinances that have been certified by HUD as being substantially equivalent to the Fair Housing Act. HUD certified four new Fair Housing Assistance Program agencies in FY 2006 for a total of 104 substantially equivalent agencies.
During FY 2006, Fair Housing Assistance Program grantees closed 51 percent of the fair housing complaints they received within 100 days, exceeding the goal of 50 percent. In FY 2007, HUD will continue to assist these agencies in reducing their aged case backlog through monitoring, training, and technical assistance. Investigators from these grantees will receive training at HUD’s National Fair Housing Training Academy. This training should help develop investigative and writing skills, which will result in improved and more effective enforcement of fair housing laws. This effort will ensure that when a complaint is filed, timely action will be taken. In FY 2006, 796 fair housing professionals attended training on housing discrimination investigative techniques at the National Fair Housing Training Academy. This number exceeded the goal by 50 percent. HUD is committed to vigorous enforcement of the fair housing laws so that all households have equal access to rental and homeownership opportunities.
34

SECTION 1. MANAGEMENT’S DISCUSSION AND ANALYSIS DEPARTMENTAL PERFORMANCE HIGHLIGHTS
Many communities do not have strong state or local legal protections from housing discrimination. HUD’s Fair Housing Initiatives Program provides grant funding to address this shortfall. This program helps independent fair housing groups to educate, reach out, and ensure compliance with the Fair Housing Act. In FY 2006, HUD’s Fair Housing Initiatives Program grantees sponsored 697 public events that reached a total of 250,799 people, far exceeding the projected goal of 160,000 persons.
The Fair Housing Act requires that common areas and some apartments in multifamily housing constructed since 1991 be accessible to persons with disabilities. In FY 2003, HUD launched the Fair Housing Accessibility FIRST (Fair Housing Instruction, Resources, Support, and Technical Guidance) program to provide training and technical guidance to architects, builders, and others on how to design and construct accessible multifamily housing in accordance with the requirements of the Fair Housing Act. BearingPoint, the Accessibility FIRST contractor, completed 11 training sessions that reached 1,185 people. Further, there was an increase in the average number of persons trained, despite reductions in funding and the number of projected events.
Ensuring HUD–Supported Programs are Free of Discrimination The Office of Fair Housing and Equal Opportunity conducts compliance reviews of recipients of HUD federal financial assistance to ensure that their housing and non-housing programs and activities comply with the non-discrimination requirements of Title VI of the Civil Rights Act of 1964, Section 109 of Title I of the Housing and Community Development Act of 1974, and Section 504 of the Rehabilitation Act of 1973. This helps ensure that all HUD funded program assistance is administered in a non-discriminatory manner and to affirmatively further fair housing. Title VI prohibits discrimination based on race, color, or national origin, whereas Section 109 prohibits discrimination on the basis of race, color, national origin, sex, or religion. When HUD finds that an agency is not in compliance, it normally attempts to resolve the matter through voluntary compliance agreement process. During FY 2006, HUD issued Letters of Findings in 11 Section 109 compliance reviews and 60 Title VI compliance reviews, which exceeded the annual target by 25 percent. This outcome represents an increase over last fiscal year.
$1 Million Disability Discrimination Settlement
HUD commended California's Department of Fair Employment and Housing for winning a $1 million disability discrimination settlement against a San Francisco landlord who refused a tenant's request for an accessible parking space. The California Department of Fair Employment and Housing is one of 103 state and local agencies that HUD funds under the Fair Housing Assistance Program.
The Office of Fair Housing and Equal Opportunity also reviews recipients of HUD federal financial assistance to ensure that their housing and housing-related programs and activities comply with the non-discrimination requirements of Section 504 of the Rehabilitation Act of 1973, which prohibits discrimination based on disability. During FY 2006, HUD issued Letters of Findings in 83 Section 504 compliance reviews, surpassing the goal of 80.
35

PERFORMANCE AND ACCOUNTABILITY REPORT
Goal EM: Embrace High Standards of Ethics, Management and Accountability This strategic goal has five objectives that are composed of 34 performance indicators. Of these data were available for 33, and HUD met or exceeded 29. More detailed information on these performance indicators can be found in Section 2 of this report.
HUD’s goal of embracing high standards of ethics, management, and accountability is achieved through rebuilding and better managing its human capital, as well as improving its internal controls and systems. HUD is also committed to improving accountability and service delivery through creating and fostering constructive partnerships with PHAs and other intergovernmental bodies. HUD’s priorities under this goal are largely reflected in specific agreements made by the Department as part of the President’s Management Agenda (PMA), which is designed to improve the efficiency and effectiveness of the federal government and to address significant management deficiencies at individual agencies.
Highlights of HUD’s accomplishments under this strategic goal are incorporated and described in the PMA discussion that follows, and in Section 2 of this report. HUD made substantial progress in improving scores on five of the six initial PMA initiatives and has plans in place to maintain its top scores, or to improve the status scores, on all PMA initiatives. The Department was the first federal agency to meet the President’s goal on two multi-agency initiatives, Faith-Based and Community Initiative and Eliminate Improper Payments Initiative. Gross improper rental assistance payments were reduced from $3.2 billion in FY 2000 to approximately $1.3 billion in FY 2005, a 60 percent reduction. A full discussion of HUD’s improper payments reduction activities can be found in Other Accompanying Information in Section 4.
HUD continued making significant improvements in financial management and reporting. During the year, the Department eliminated its two remaining material weaknesses and received an unqualified audit opinion for FY 2006, as it has for the past seven consecutive years. An unqualified audit opinion indicates that HUD’s principal financial statements present fairly, in all material respects, the financial position of HUD as of September 30, 2006 and its net costs, changes in net position, budgetary resources, and reconciliation of net costs to budgetary obligations for the fiscal years then ended, in conformity with generally accepted accounting principles. Additional information can be found in the Independent Auditor’s Report in Section 3 of this report.
Goal FC: Promote Participation of Faith-Based and Community Organizations This goal has three objectives that are supported by four performance indicators. HUD met or exceeded all four of those indicators. More detailed information on these performance indicators can be found in Section 2 of this report.
HUD is one of several Departments that are leading the government-wide effort to promote participation of faith based and other community organizations by reducing regulatory barriers to program participation by these organizations and providing outreach and technical assistance. The Department has achieved notable success in these efforts and was one of the first to achieve
36

SECTION 1. MANAGEMENT’S DISCUSSION AND ANALYSIS DEPARTMENTAL PERFORMANCE HIGHLIGHTS
the President’s goal for increasing faith based and community organization participation in federal funding opportunities.
HUD’s Center for Faith-Based and Community Initiatives continued its comprehensive outreach and technical assistance plan for faith-based and community organizations, helping more of these organizations apply for HUD’s formula and competitive grants. Approximately 5,000 eligible faith-based and community organizations currently in the Center’s database were kept informed of grant opportunities through periodic email. Faith-based organizations are competing more widely and effectively, as shown in their success in increasing the number of grants from 659 in FY 2002 to 1,111 in FY 2006, a 68 percent increase.
The Center also conducts training sessions across the country to ensure that faith-based and community organizations have equal access to HUD and private funding opportunities. During FY 2006, the Center conducted 95 training sessions, which exceeded their goal of 20.
Additional highlights of HUD’s accomplishments under this strategic goal are described in the discussion on the President’s Management Agenda that follows.
President’s Management Agenda In FY 2002, the Office of Management and Budget (OMB) published the President’s Management Agenda (PMA), as set forth by President George W. Bush, to implement government reform that is citizen-centered, results-oriented, and market-based. The Secretary and Deputy Secretary have emphasized, and HUD’s Strategic and Annual Performance Plans reflect, activities designed to achieve the outcome goals of the PMA.
During FY 2006, these initiatives included:
• Strategic Management of Human Capital,
• Competitive Sourcing,
• Improved Financial Performance,
• Expanded Electronic Government,
• Budget and Performance Integration,
• Improved HUD Management and Performance,
• Increased Faith-Based and Community Organization Participation,
• Eliminate Improper Payments, and
• Credit Program Management.
While the first five of these initiatives are government-wide, the last four were identified by OMB and HUD officials as significant areas for improved performance at the agency level. In order to ensure that the management orientation at HUD remains deeply committed to achieving PMA goals, the Secretary and Deputy Secretary have instituted the following activities to ingrain the PMA into HUD’s normal management processes:
• Incorporated PMA goals in the Department’s Strategic, Annual Performance, and Management Plans.
37

PERFORMANCE AND ACCOUNTABILITY REPORT
• Focused the agenda of the Deputy Secretary’s Executive Management Meetings with HUD’s Assistant Secretaries and other Principal Staff on PMA plans and progress.
• Assigned Assistant Secretaries or equivalent level positions as PMA Initiative Owners with responsibility for planning and acting to achieve PMA goals.
• Developed an annual plan of actions and milestones to reflect where HUD would be “Proud-To-Be” on PMA goals, with quarterly refinements in discussion with OMB.
• Held quarterly meetings with OMB to review and discuss their quarterly scorecards on the status of overall goals and quarterly progress in completing the planned actions.
• Designated a Deputy Secretary’s Special Assistant to conduct regular meetings with PMA Initiative Owners to discuss plans and actions for sustained progress.
• Required progress on PMA action and goals to be critical factors in HUD’s performance evaluations and awards for all managers and supervisors and many staff.
• Communicated PMA criteria, plans, progress, and accomplishments to HUD staff and interested parties through print media, the HUD web site, and satellite broadcasts.
Following is a summary description of HUD’s FY 2006 PMA activities and results to date:
1. Strategic Management of Human Capital. HUD’s Human Capital Plan is structured to accomplish the PMA objectives to reduce the distance between citizens and decision-makers, to increase the performance of employees who provide services to citizens, to make better use of existing flexibilities for acquiring and developing talent and leadership, and to attract and retain the right people, in the right places, and at the right time.
The Department’s five-year Human Capital Management Strategy seeks to ensure that: 1) HUD’s organizational structure is optimized; 2) succession strategies are in place to provide a continuously updated talent pool; 3) performance appraisal plans for all managers and staff ensure accountability for results and a link to the goals and objectives of HUD’s mission; 4) diversity hiring strategies are in place to address under-representation; 5) skills gaps are assessed and corrected; and 6) human capital management accountability systems are in place to support effective management of HUD’s human capital.
In FY 2006, HUD developed and officials approved the Human Capital Vision Plan that includes a Leadership Succession Plan and set targets for leadership bench strength. Noting that, over the next three years, 58 percent of HUD’s work force will be eligible for retirement, the Secretary launched a Department-wide training initiative making every program manager responsible for promoting continuous training and development of HUD employees.
The Department is revamping its performance management system to more clearly define performance expectations for its employees. In FY 2006, HUD tested the new performance system in two of its largest organizations. The new performance system emphasizes development of specific, measurable, attainable, relevant, and time-bound performance standards as a means of developing robust performance management systems. More than 1,200 employees are participating in this test program, and HUD has plans to expand this program during FY 2007. Additionally, to further promote a results-oriented performance
38

SECTION 1. MANAGEMENT’S DISCUSSION AND ANALYSIS DEPARTMENTAL PERFORMANCE HIGHLIGHTS
culture, all HUD senior executives have standards in their performance plans that make them accountable for achieving HUD’s goals and objectives specific to their organization.
HUD also has continued to work on improving its hiring timeline. In FY 2006, the Department met the goal of notifying applicants of the hiring decision within 45 days, and has made progress toward an aggressive goal of a 30-day average hiring process for its senior leadership positions.
Finally, within this initiative, HUD has taken action to improve the knowledge base of its employees and improve the level of service provided to our clients. Action and training plans were developed for closing skill gaps for improved competency among mission critical occupations, the leadership pool, and current managers and supervisors, beginning with the four core business offices (Public and Indian Housing, Community Planning and Development, Fair Housing and Equal Opportunity, and Housing). Skill gaps were also addressed in Human Resources and Information Technology.
2. Competitive Sourcing. Competitive sourcing is a process designed to ensure that the government acquires services at the best value for the taxpayer, regardless of whether the service provider is a public entity (government staff) or private entity (contractor staff). This initiative reflects the Government’s commitment to find the most cost effective way to perform functions that are identified as potentially non-governmental, i.e., able to be performed by commercial entities without jeopardizing delivery of program services to citizens and HUD’s clients. Competitive sourcing can be applied from a potential outsourcing (i.e., taking a government-provided service and moving to a contractor-provided service) or in-sourcing (i.e., taking a current contractor provided service and replacing it with a government-provided service) perspective, with the ultimate goal of achieving savings and improving performance.
Prior to the President’s emphasis on competitive sourcing, HUD had already outsourced many of its services, and accordingly it must carefully consider the impact on program risk of any further outsourcing. The Department’s approved competitive sourcing plan provides for consideration of both “outsourcing” and “in-sourcing” competitions for identified services. Through this process, HUD has the opportunity to implement best business practices that increase productivity, enhance quality and efficiency, and deliver better services at lower cost to the American people.
At the beginning of the year, the Department had completed four competitions, with an anticipated cost savings totaling $4.1 million over a period of five years. The four functions addressed by these competitions included OMB Circular A-127 compliance reviews, Spanish translation services, financial reporting support, and motor pool operations. During this past fiscal year, two additional competitions were completed. One was a complex competition affecting 256 staff-years of effort for the administration of the Office of Multifamily Housing’s Non-Section 8 rental housing assistance contracts and assisted properties. As a result of this competition, HUD stands to realize a savings of $114 million over a five-year period. The pending implementation of this award still presents many challenges in order to comply with federal regulations and to minimize adverse impacts on affected staff. An additional competition for HUD’s training support services was also completed, with anticipated cost savings of $10.9 million over a period of five years.
39

PERFORMANCE AND ACCOUNTABILITY REPORT
The Department continues to explore opportunities for improving the efficiency with which we support our customers. A Business Process Re-engineering contract was awarded to fully document existing processes, streamline operations, and provide preliminary planning for possible competitive sourcing activity in areas such as HUD’s human resources management support functions, correspondence control and tracking, and Internet web site management. Preliminary planning also was conducted for a potential competition on GNMA’s contract oversight function. Competitive sourcing has been integrated as a resource management tool in HUD’s strategic human capital management process, as HUD continues to assess opportunities to use its resources more efficiently, with improved results.
3. Improved Financial Performance. Financial performance is a significant indicator of an agency’s ability to fulfill its mission and meet the needs of the citizens and their government. Adequate control over financial operations enables the agency to: reduce the risk of fraud, waste, and abuse; better assure that services are delivered to the public in a timely and cost effective manner; and provide support for informed budget and program decisions. To these ends, the President has directed this initiative to:
• Improve financial audit results;
• Eliminate material weaknesses and strengthening internal controls;
• Accelerate financial reporting;
• Strengthen funds control and financial systems compliance; and
• Improve the availability of financial data needed to better inform budget and program decision-making.
For FY 2006, the Department:
• Received an unqualified audit opinion on its consolidated financial statements, marking the seventh consecutive year the Department has received an unqualified audit opinion;
• Completed corrective actions to eliminate HUD’s two remaining material weakness issues – pertaining to FHA controls over their program risk analyses and liability estimates – making this the first year since financial audits have been performed under the Chief Financial Officers Act of 1990 that HUD has had no auditor-reported material weakness issues;
• Met accelerated reporting goals by issuing quarterly financial statements within 21 days after the end of each quarter, with issuance of the annual Performance and Accountability Report within 45 days after the end of the fiscal year for the third consecutive year;
• Continued to improve the documentation of funds control processes and plans for all active funded activities, with additional funds control training for HUD staff;
• Completed the Department’s first annual assessment of internal controls over financial reporting – a new federal requirement equivalent to the Sarbanes-Oxley Act requirements for the private sector – resulting in an unqualified assurance that the Department’s controls are designed and operating effectively, with identification of some immaterial areas for improvement;
40

SECTION 1. MANAGEMENT’S DISCUSSION AND ANALYSIS DEPARTMENTAL PERFORMANCE HIGHLIGHTS
• Remediated two non-compliant financial systems by replacing the Loan Accounting System with a compliant Commercial-Off-The-Shelf system and implementing compensating controls associated with the Facilities Integrated Resources Management System;
• Implemented a new general ledger system for Ginnie Mae;
• Automated the business and accounting processes for the Section 236 Interest Reduction Payment Program – a terminated program with over 2,800 active contracts with an estimated remaining obligated balance due of $4.1 billion – enabling electronic processing of approximately $34 million in monthly payments that were paid manually prior to May 1, 2006; and
• Continued to review and clean-up obligated funds balances associated with terminated programs and expired contracts, deobligating over $1.6 billion in excess funding identified in FY 2006.
While only two of HUD’s 41 financial and mixed financial management systems reported compliance deficiencies at the end of FY 2006, and the Department as a whole substantially complies with federal financial management systems requirements, the current financial systems environment is inefficient and costly to maintain. Both FHA and Ginnie Mae have successfully implemented a modern general ledger system for their respective organizations, using the same software application. Building upon that success, the Department has completed requirements for applying that same software application to the remainder of the Department. In FY 2007, the Department will implement its acquisition strategy to procure the systems integrator and hosting services required to support the HUD Integrated Financial Management Improvement Project. This multi-year project will replace HUD’s core financial systems with a solution that integrates and improves financial information processing from all HUD business areas, encompassing 34 existing systems and 71 existing interfaces.
4. Expanded Electronic Government. The PMA stresses the value of electronic government in providing greater services at lower cost, meeting high public demand for electronic government, and enhancing the federal government’s value to the citizen. Electronic government, or E-Government, is more than just implementing web-based technologies and applications. It is conducting business electronically and delivering secure, reliable information and services to our customers, citizens, and business partners with the highest possible quality, at the lowest costs. HUD continued its E-Government transformation to meet public expectations and government performance mandates by increasing access to information and services using the Internet and improving information technology investment planning, as well as implementing a structure for information sharing and management. These E-Government efforts support HUD’s mission and goals by delivering more value to citizens and business partners, promoting innovation, and incorporating best practices and federal-wide solutions. During FY 2006, HUD aggressively pursued electronic government solutions and program enhancements to accomplish these objectives.
This PMA initiative also focuses on more fundamental HUD needs to improve the information technology capital planning process, complete a systems modernization blueprint to guide further development, convert to performance-based information technology
41

PERFORMANCE AND ACCOUNTABILITY REPORT
contracts and strengthen information technology project management to better assure results, and provide a secure systems environment for all platforms and applications.
The mission of the Office of the Chief Information Officer is to provide HUD employees and business partners with the latest information technologies and industry best practices. During FY 2006, HUD implemented a five-year modernization plan called Vision 2010 which will provide a modernized infrastructure that establishes a robust, reliable and secure foundation to support HUD’s programs and business partners well into the future. OMB and Congress recognize the plan as a mission critical program for HUD.
To meet the Vision 2010 objectives, the Department is focusing on the need to rapidly modernize information technology and replace redundant or aging systems. For example, for Single Family Integration, an electronic case binder system was implemented that is decreasing costs and processing times for the loan origination process by over 20 percent.
The Department’s efforts to advance E-Government are producing tangible results, and the Department is being recognized accordingly. During this past year, the Department was honored as a winner of the 2006 Government Computer News Gala Award for outstanding use of information technology. The Office of Public and Indian Housing edged out nearly 150 entries to earn the award for developing a system that is used to reduce improper payments in HUD’s rental assistance programs. The system, Enterprise Income Verification System, automated the income verification process for 4.8 million households that receive HUD rental assistance, and significantly reduced the erroneous payments associated with tenant underreporting of income.
Additional significant progress was made in FHA’s blueprint for financial management systems that is in its third year of a three-year phase. The improved functionality provided in FHA’s Subsidiary Ledger system reduced the number of legacy systems from 19 to 16. Currently, each aging or legacy system requires its own maintenance, development and operational costs. As legacy systems age, their maintenance costs increase. By the end of FY 2007, FHA will perform its financial operations with a smaller number of better-integrated systems, improving the effectiveness and timeliness of information available for financial operations and management.
The Department has participated in OMB’s Electronic Government project initiatives. HUD was the most successful agency in using the new E-Grants portal for submission of competitive grant applications. HUD has taken steps recently to make all of its competitive funding opportunities available on Grants.gov by the end of FY 2007. HUD has also successfully sought to avoid duplication of Electronic Government initiatives in other areas of the federal government.
HUD further demonstrated improvements to Information Technology project management. A central Information Technology Project Management Office was established to provide centralized project management guidance and support. The Office shows that major projects adhere to project cost, schedule and performance goals over 90 percent of the time.
5. Budget and Performance Integration. The Budget and Performance Integration initiative is designed to provide for clear, measurable program outcome goals and indicators to support
42

SECTION 1. MANAGEMENT’S DISCUSSION AND ANALYSIS DEPARTMENTAL PERFORMANCE HIGHLIGHTS
budget and resource allocation decisions based on performance results. OMB developed this initiative and the associated Program Assessment Rating Tool (PART) to better validate that programs have clearly defined and measurable program outcomes, efficiency measures, and marginal cost measures to inform the budget decision-making process.
As of the end of FY 2006, HUD worked with OMB to complete 31 PART assessments covering all of HUD’s major programs and most of its annual budget authority. Of the programs assessed, OMB determined that 18, or 58 percent, were Effective, Moderately Effective, or Adequate. OMB rated the remaining 13 programs, or 42 percent, as either Ineffective or Results Not Demonstrated. The PART results have been used to inform decisions in the President’s Budget requests to the Congress. While HUD ensures all of its programs are executed in the manner authorized and intended by the Congress, not all programs clearly identify measurable outcomes, as defined by OMB in the PART process. HUD is working with OMB to more clearly define expected outcomes for each of its programs and to produce better outcome and efficiency measures that evidence the programs are cost-effective in producing desired results.
Throughout FY 2006, HUD has clearly demonstrated its ongoing efforts to achieve the goals set forth in the President’s Management Agenda. To date, HUD has:
• Improved the integration of budget and performance data in the preparation of its fiscal year budget submissions to OMB – which is a core tenet of the budget and performance integration initiative;
• Developed important legislation proposals – covering the Public Housing, Section 8 Housing Choice Voucher, FHA, CDBG, Homeless Assistance, and Housing Opportunities for Persons with AIDS programs – that will more clearly define and improve the performance outcomes of those programs;
• Advanced the outcome performance of its programs, and made substantial progress in developing improved outcome metrics to measure that progress; and
• Maintained the timely submission of the Department’s budget requests, and corresponding Strategic and Annual Performance Plans, with a clear emphasis on improved budget and performance integration.
6. Improved HUD Management and Performance. This HUD-specific performance indicator was primarily established to address GAO-designated high-risk program areas and material internal control weaknesses not addressed by the other initiatives of the PMA. After the establishment of this HUD-specific initiative, the additional multi-agency PMA initiatives were added, (Eliminating Improper Payments and Credit Program Management), which address some of the issues previously covered by this HUD-specific initiative. Further, since 2002, HUD implemented corrective actions for the remaining issues and has made steady progress on this initiative and on the sub-initiatives that have been targeted annually for improvement. Accordingly, these issues are no longer designated as high-risk management deficiencies.
43

PERFORMANCE AND ACCOUNTABILITY REPORT
Accomplishments under this initiative have included provisions for stronger controls over:
• Compliance with HUD’s physical housing condition standards – exceeding initial program goals for increasing the percentage of public and assisted housing units meeting HUD’s standards;
• HUD’s rental housing assistance payments – leading to a 60 percent reduction in $3.2 billion of improper payments over four years;
• FHA’s Single Family Housing Mortgage Insurance programs – through implementation of the Credit Watch system, the TOTAL automated underwriting process, and numerous other actions; and
• The performance of CDBG grantees – through improved web-based planning and reporting processes and tools.
HUD developed corrective actions, implemented all internal control improvement plans, and achieved all initial performance goals on this initiative. The Department is awaiting GAO’s biennial update of its high-risk program series to confirm that these issues are no longer designated as high-risk management deficiencies, and that no further milestones for this initiative are required.
7. Increased Faith-Based and Community Organization Participation. HUD is one of several departments that are leading the government-wide effort to promote participation of Faith-Based and other Community organizations.
The Department’s objectives for this initiative include:
• Reduce barriers to participation by faith-based and community organizations;
• Conduct outreach and provide technical assistance to faith-based and community organizations to strengthen their capacity to attract partners and secure resources; and
• Encourage partnerships between faith-based and community organizations and HUD’s traditional grantees.
HUD’s effort will strengthen the government’s efforts and results through the increased participation of new organizations with energy, vision, and important mission goals beneficial to American citizens.
The Department expanded data collection efforts to include both formula and non-formula grant programs, especially in connection with the CDBG program. HUD completed two webcasts and 95 grant training sessions in FY 2006 and conducted evaluation of the grant writing training sessions conducted in FY 2005. These sessions explain compliance with all equal treatment regulations.
HUD conducted an evaluation of the possibility of future public or private partnerships in connection with the Initiative for a Competitive Inner City Opportunity Newark project.
In another outreach effort, the Department conducted Unlocking Doors initiatives in eight cities this year. Unlocking Doors is a roundtable forum including housing officials from local governments, businesses, non-profit agencies and faith-based organizations to share information on successful programs, identify obstacles to affordable housing, and determine actions various parties would like to take to improve conditions.
44

SECTION 1. MANAGEMENT’S DISCUSSION AND ANALYSIS DEPARTMENTAL PERFORMANCE HIGHLIGHTS
As part of the Department-wide effort to support victims of hurricanes, HUD also reached out to support and encourage faith-based and community organizations providing housing assistance to evacuees from Hurricanes Katrina and Rita.
8. Eliminate Improper Payments. This initiative implements the Improper Payments Information Act of 2002, which requires federal agencies to annually assess improper payment risks and to measure improper payment levels and report on progress in reducing those levels in programs and activities that may be susceptible to improper payments in excess of $10 million per year. The Act holds agency managers accountable for strengthening financial management controls in order to reduce any significant improper payment levels identified. The specific objectives are to:
• Establish an annual agency-wide risk assessment process that identifies all programs at risk of significant improper payments;
• Provide for annual estimates of improper payment levels in at-risk programs;
• Analyze the causes of improper payments in at-risk programs to serve as the basis for setting reduction goals and corrective action plans; and
• Provide annual reporting of progress and results in attaining improper payment reduction goals.
The Department is fully compliant with the Improper Payments Information Act of 2002, and was the first agency to achieve the President’s goals for eliminating improper payments. Accomplishments to date include:
• Completed the required annual risk assessment on all payment activities for the past three fiscal years. HUD’s risk assessments and improper payment measurements are based on the completed prior-year accounting cycle. For FY 2005, HUD’s payment universe consisted of $58.8 billion in disbursements to support 200 different types of program and administrative activities.
• Measured improper payment levels in 10 program areas that were identified as potentially at-risk of a significant improper payment level, constituting 57 percent of HUD’s total annual disbursements. Only five of those 10 activities were found to have a significant improper payment problem greater than $10 million per year.
• Completed and verified corrective actions to reduce improper payments to an acceptable level in two of the five programs originally determined to be at risk of a significant improper payment level – consisting of payments under the Single Family Acquired Asset Management System and the Public Housing Capital Fund.
• Exceeded goals for reducing improper payment levels for HUD’s other three at-risk program areas – the Public Housing, Tenant-Based Assistance and Project-Based Assistance Programs – which are collectively referred to as HUD’s rental housing assistance programs. In 2000, HUD established a baseline estimate of $2 billion in net annual overpayments attributed to two of three types of improper rental housing assistance program payments pertaining to subsidy determination errors and underreporting of tenant income upon which the subsidies are based. HUD’s initial goal was to reduce that $2 billion net annual overpayment estimate 50 percent by the end of FY 2005. As shown in the following table, HUD exceeded that goal by reducing net annual overpayments by 69 percent.
45

PERFORMANCE AND ACCOUNTABILITY REPORT
Reduction in Improper Payments Due to Subsidy Determination and Income Reporting Errors
Period* Over Payments
Under Payments
Net Over-Payments
Gross Improper Payments
2000 $2,594 $622 $1,972 $3,216 2005 $943 $341 $602 $1,284 Change $1,651 $281 $1,370 $1,932 Reduction 64% 45% 69% 60%
* Amounts shown in millions
The reductions in housing subsidy determination errors resulted from HUD efforts to work with its housing industry partners at public housing agencies and multifamily housing projects through enhanced program guidance, training, oversight, and enforcement. The reduction of erroneous payments due to tenant under-reporting of income were due to: improved income verification efforts by housing program administrators; increased voluntary compliance by tenants due to promotion of the issue; HUD’s initiation of improved computer matching processes for upfront verification of tenant income; and an improved methodology for reviewing income discrepancies identified through computer matching to better determine actual cases of under-reported income impacting subsidy levels.
Adding in the third type of improper rental housing assistance payments, attributed to billing errors, the total gross level of improper payments continued on a slight downward trend, dropping from $1.467 billion in FY 2004 to $1.464 billion in FY 2005. However, the percentage of total payments that were improper dropped from 5.6 percent to 5.4 percent, exceeding HUD’s goal. HUD paid over $27.2 billion in rental housing assistance in FY 2005, representing over 46 percent of all HUD payments.
In FY 2006, HUD implemented its new Enterprise Income Verification System for use by Public Housing Agency program administrators in conducting improved upfront verifications of tenant income. The new verification system will be expanded to the Multifamily Housing Project-Based Assistance Programs in FY 2007. This improved computer matching capability for verifying income has the potential to eliminate the majority of the remaining estimated improper rental housing assistance payments. HUD’s long-range goal is to reduce improper rental assistance payments to less than 2.5 percent of total payments by the end of FY 2008.
In FY 2006, the Department also completed a review of the CDBG Program to demonstrate that this program is at low risk for improper payments. Analysis of monitoring results for the three year period 2003 to 2005 showed that the CDBG Program was below the annual $10 million improper payment threshold to warrant further action and reporting under the Improper Payments Information Act of 2002. Nevertheless, HUD took action to strengthen its CDBG program monitoring policies and practices in FY 2006.
Additional details on HUD’s compliance and performance results under the Improper Payments Information Act of 2002 are provided in Section 4 of this report.
9. Credit Program Management. This initiative addresses the effectiveness of direct and guaranteed loan programs to ensure that HUD’s credit programs are reaching the targeted
46

SECTION 1. MANAGEMENT’S DISCUSSION AND ANALYSIS DEPARTMENTAL PERFORMANCE HIGHLIGHTS
borrowers at an acceptable, manageable risk level. Credit Program Management is applicable to the five largest credit agencies (Agriculture, Education, HUD, SBA, and VA) and Treasury. It covers loan origination (both direct and guaranteed), loan servicing/lender monitoring, and debt collection. This is a new initiative of the President’s Management Agenda. As such, the specific criteria to determine HUD’s credit program effectiveness are still being finalized by HUD and OMB. The preliminary criteria developed to measure achievement of the President’s goal requires that an Agency:
• Establishes, or verifies partner lenders have established, sound lending polices and procedures that are implemented in effective transaction approval processes, loan portfolio management, and loss recovery;
• Establishes, or verifies that partner lenders have established, collateral valuation processes with clear policies and procedures ensuring independence in appraisals and valuations, and adequate monitoring of appraisers’ quality and certification;
• Maintains a reasonable level of risk and productivity of taxpayer cash used in lending programs through effective management information reporting, such as indicators of loan volume, exceptions to underwriting standards, concentrations of credit risk, delinquency and default rates, rating changes, problem loans, and charge-offs, and using such information to improve program results;
• Achieves PART scores of at least 80 on program design for at least 75 percent of its major credit programs, including providing evidence of sufficient public policy outcomes;
• Meets goals to reduce the total cost of servicing and liquidating loans, and improves the rate of debt recovery; and
• Achieves customer satisfaction ratings that meet or exceed industry standards.
The Department has already completed significant actions to reduce the risk of the FHA’s housing mortgage insurance programs under the HUD management and performance initiative of the PMA. HUD and OMB are continuing to jointly develop criteria that are applicable to HUD’s specific credit programs under this new initiative.
PMA Scoring Results
OMB rates the results that each federal Agency achieved using a “traffic light” scoring system of Green, Yellow, and Red, with Green indicating an Agency successfully met OMB’s scoring criteria, Yellow reflecting mixed results, and Red denoting an unsatisfactory result.
The chart on the following page displays the continuous improvements HUD has made in implementing the President’s Management Agenda and achieving results for the American taxpayer. HUD’s Status scorecard was entirely Red in June 2002. By focusing on achieving results, HUD has since earned Status scores of Green on three initiatives and Yellow on four initiatives. HUD plans to attain a Yellow or Green goal score on the Improved Financial Performance initiative in the first quarter of FY 2007, based on eliminating its two remaining auditor-reported material weaknesses. The Credit Program Management initiative cannot achieve a status of Yellow until HUD and OMB jointly develop criteria that are applicable to
47

PERFORMANCE AND ACCOUNTABILITY REPORT
HUD’s specific credit programs. In the interim, HUD is ensuring that its quarterly corrective action plans remain on schedule.
48

SECTION 1. MANAGEMENT’S DISCUSSION AND ANALYSIS DEPARTMENTAL PERFORMANCE HIGHLIGHTS
HUD’s PMA Scoring Progress 2002 – 2006
Status Initiative June 2002 June 2003 June 2004 June 2005 June 2006
Human Capital
Red
Red
Yellow
Yellow
Yellow
Competitive Sourcing
Red
Red
Red
Yellow
Yellow
Improved Financial Performance
Red
Red
Red
Red
Red
Expanded E-Government
Red
Red
Red
Yellow
Green Budget and
Performance Integration
Red
Red
Red
Yellow
Yellow
HUD Management and Performance
Red
Red
Red
Yellow
Yellow Faith-Based and
Community Initiatives
N/A
Yellow
Yellow
Green
Green
Eliminate Improper Payments
N/A
N/A
N/A
Green
Green
Credit Program Management
N/A
N/A
N/A
N/A
Red Denotes an increase in the status score from the previous year.
49

PERFORMANCE AND ACCOUNTABILITY REPORT
Risks, Trends, and Factors Affecting Goals HUD’s annual budget represents only about 1.4 percent of the federal budget,1 4.5 percent of the $770 billion invested in U.S. housing each year,2 and 0.3 percent of the nation’s $12.5 trillion gross domestic product. These small proportions imply that external factors both strongly influence HUD’s mission accomplishment and extend beyond HUD’s span of control. The Department’s successes therefore result from better understanding such factors so the agency can plan for contingencies, form partnerships wisely, and strategically focus and leverage resources, management, and leadership initiative where public benefits will be greatest.
Homeownership
National and regional economic conditions, as well as the actions of many private and public players, exert a critical influence on increasing homeownership and achieving HUD’s specific performance goals for homeownership objectives. External factors affecting the national homeownership picture include population aging and household formation, childbearing and immigration, family incomes and consumer expectations, job availability and job security, real estate and construction costs, financial markets, and operating costs of housing.
The single family housing sector slowed markedly during FY 2006 relative to the record pace of activity during calendar 2005. Seasonally adjusted annual rates for single family building permits declined eight percent through June 2006, while the rates for new and existing home sales declined 14.2 percent at the end of September 2006 compared with a year earlier.3
After a decade of strongly increasing home prices, the affordability of home ownership slowed its downward slide during FY 2006. By September, the median sales price of new homes was 9.7 percent less than a year earlier, while the median existing home price was down 2.2 percent.4 However, median sales prices are sensitive to the distribution of sales across regions. The “housing opportunity index,” calculated by the National Association of Home Builders and Wells Fargo, represents the percentage of houses affordable to a family with median income. The index remained at the historically low level of 40.6 percent in the second quarter of 2006, reflecting deteriorated affordability for family households compared with annual rates of 63.7 percent in 2002 and 2003. In addition, non-family households generally have lower incomes than family households, and thus, face greater affordability challenges
Along with home prices, higher mortgage interest rates also affect the affordability of homeownership for potential homebuyers. Interest rates for 30-year fixed-rate mortgages during FY 2006 averaged 6.4 percent, up from 5.7 percent in FY 2005.5 Average rates have not exceeded six percent since 2002, so the increase counteracts potential benefit of lower homes
1 FY 2005 budget authority, from “Budget of the U.S. Government, Fiscal Year 2007: Historical Tables,” Tables 5.2 and 5.3. Supplemental appropriations for disaster recovery efforts changed the ratios for FY 2006. 2 Residential fixed investment. This and remaining statistics reported in this section, unless otherwise noted, are drawn from “U.S. Housing Market Conditions 2nd Quarter, 2006,” available at http://www.huduser.org/periodicals/ushmc.html. 3 New home sales and median prices are reported by the Census Bureau at http://www.census.gov/const/www/newressalesindex.html, and existing home sales and median prices are reported by the National Association of Realtors at http://www.realtor.org/research.nsf/Pages/EHSdata. 4 Sales price data are not seasonally adjusted. 5 In FY 2006, an average of 0.52 points were paid at closing, compared with 0.62 points in FY 2005.
50
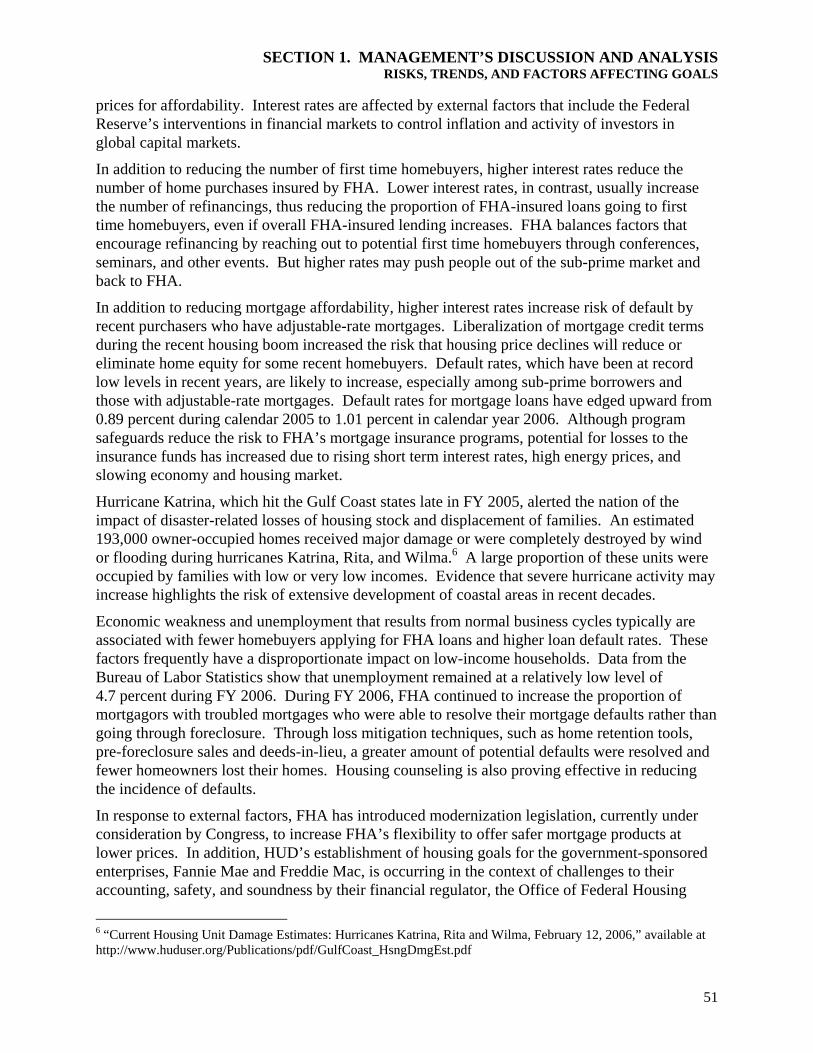
SECTION 1. MANAGEMENT’S DISCUSSION AND ANALYSIS RISKS, TRENDS, AND FACTORS AFFECTING GOALS
prices for affordability. Interest rates are affected by external factors that include the Federal Reserve’s interventions in financial markets to control inflation and activity of investors in global capital markets.
In addition to reducing the number of first time homebuyers, higher interest rates reduce the number of home purchases insured by FHA. Lower interest rates, in contrast, usually increase the number of refinancings, thus reducing the proportion of FHA-insured loans going to first time homebuyers, even if overall FHA-insured lending increases. FHA balances factors that encourage refinancing by reaching out to potential first time homebuyers through conferences, seminars, and other events. But higher rates may push people out of the sub-prime market and back to FHA.
In addition to reducing mortgage affordability, higher interest rates increase risk of default by recent purchasers who have adjustable-rate mortgages. Liberalization of mortgage credit terms during the recent housing boom increased the risk that housing price declines will reduce or eliminate home equity for some recent homebuyers. Default rates, which have been at record low levels in recent years, are likely to increase, especially among sub-prime borrowers and those with adjustable-rate mortgages. Default rates for mortgage loans have edged upward from 0.89 percent during calendar 2005 to 1.01 percent in calendar year 2006. Although program safeguards reduce the risk to FHA’s mortgage insurance programs, potential for losses to the insurance funds has increased due to rising short term interest rates, high energy prices, and slowing economy and housing market.
Hurricane Katrina, which hit the Gulf Coast states late in FY 2005, alerted the nation of the impact of disaster-related losses of housing stock and displacement of families. An estimated 193,000 owner-occupied homes received major damage or were completely destroyed by wind or flooding during hurricanes Katrina, Rita, and Wilma.6 A large proportion of these units were occupied by families with low or very low incomes. Evidence that severe hurricane activity may increase highlights the risk of extensive development of coastal areas in recent decades.
Economic weakness and unemployment that results from normal business cycles typically are associated with fewer homebuyers applying for FHA loans and higher loan default rates. These factors frequently have a disproportionate impact on low-income households. Data from the Bureau of Labor Statistics show that unemployment remained at a relatively low level of 4.7 percent during FY 2006. During FY 2006, FHA continued to increase the proportion of mortgagors with troubled mortgages who were able to resolve their mortgage defaults rather than going through foreclosure. Through loss mitigation techniques, such as home retention tools, pre-foreclosure sales and deeds-in-lieu, a greater amount of potential defaults were resolved and fewer homeowners lost their homes. Housing counseling is also proving effective in reducing the incidence of defaults.
In response to external factors, FHA has introduced modernization legislation, currently under consideration by Congress, to increase FHA’s flexibility to offer safer mortgage products at lower prices. In addition, HUD’s establishment of housing goals for the government-sponsored enterprises, Fannie Mae and Freddie Mac, is occurring in the context of challenges to their accounting, safety, and soundness by their financial regulator, the Office of Federal Housing
6 “Current Housing Unit Damage Estimates: Hurricanes Katrina, Rita and Wilma, February 12, 2006,” available at http://www.huduser.org/Publications/pdf/GulfCoast_HsngDmgEst.pdf
51

PERFORMANCE AND ACCOUNTABILITY REPORT
Enterprise Oversight. HUD published new housing goals for government-sponsored enterprises in November 2004. HUD’s future oversight of the government-sponsored enterprises will incorporate appropriate verification of performance data, and will be tailored to sustain their public purpose while ensuring their ongoing financial stability.
Internal factors, such as improving HUD’s management practices and streamlining business processes, also affect the Department’s ability to provide access to affordable housing and increase homeownership. FHA again increased the capital ratio of its Mutual Mortgage Insurance Fund during FY 2006. This was accomplished through improved management of its portfolio, insurance premiums, and more stringent measures to ensure data integrity, combined with a market-driven reduction of insurance-in-force. The capital ratio has a direct influence on FHA’s ability to provide insurance coverage to homeowners. FHA’s current business practices and initiatives, including FHA modernization legislation, reflect HUD’s emphasis on improving products, reducing risk, and automating business processes.
Affordable Rental Housing
External factors that affect the supply of affordable rental housing include tax policy, local rental markets, building codes and land use regulations, state and local program decisions, and the actions of HUD’s many other partners. Although rental vacancy rates remain above historical averages, local rental markets vary substantially in the availability of housing that extremely low-income renters can afford without HUD program assistance. Median asking rents of new rental units had been declining nationwide through FY 2005, but suddenly increased during FY 2006 – by 6.9 percent during the first quarter and 4.1 percent during the second quarter. Rental vacancy rates continued to decline, reaching 9.6 percent in FY 2006, compared with a peak of 10.4 percent in calendar 2004, and representing roughly 300,000 fewer units available for occupancy. The declining affordability of homeownership, which increases rental housing demand, and extensive conversion of apartments to condominiums, which decreases rental housing supply in many large metropolitan housing markets that had rapid house price increases, are likely to be key factors driving these trends.
In recent years, the largest federal expenditure for increasing the supply of affordable rental housing has been through the Low Income Housing Tax Credit. Equivalent to $5 billion of annual budget authority, the tax credit program, in combination with HUD and other programs, adds slightly more than 100,000 units annually, of which 95 percent qualify for affordability.7 Constraints on federal resources for subsidy payments also affect HUD’s ability to provide access to affordable housing. Substantial increases in voucher costs and utilization have strained HUD’s Section 8 program resources. Changes in unemployment rates, in the cost of developing and maintaining housing, or in personal income – factors over which HUD has little control – all affect housing affordability.
Energy costs are often overlooked as a factor in housing affordability. The Joint Center for Housing Studies reports that 2.5 million households among the poorest quarter of households spent more than 30 percent of their budgets on home energy in 2003 (the date it was last
7 Office of Policy Development and Research (January 2006), “Updating the Low Income Housing Tax Credit Database: Projects Placed in Service Through 2003,” available at http://www.huduser.org/Datasets/lihtc/report9503.pdf
52

SECTION 1. MANAGEMENT’S DISCUSSION AND ANALYSIS RISKS, TRENDS, AND FACTORS AFFECTING GOALS
measured).8 Energy prices have increased sharply since then. Housing “fuels and utilities” prices increased by 25 percent between September 2003 and September 2006, as shown by the Consumer Price Index for urban consumers. Such energy price increases pose a risk for HUD’s public housing and Section 8 programs, which cover utility costs as part of gross rents.
Tenant-paid rents are established as a percentage of income in HUD’s rental assistance programs, so lower incomes necessitate greater subsidies just as higher rents do. For the same reason, tenants who under-reported income, and assisted housing providers who inadequately verified reported income, have over the years caused assisted housing resources to be misdirected to less needy families. The Department has made landmark progress in slashing these erroneous subsidies during the past several years, as noted in the Improper Payments discussion in Section 3 of this report. Following completion of a Harvard study of the operating costs of public housing and subsequent negotiation with PHAs, HUD has implemented regulatory changes to the operating subsidy program, moving to more efficient asset management practices used by private housing providers. The ability to reduce operating costs and retain savings under the new regulations will encourage PHAs to take advantage of financial incentives and strategies for reducing utility consumption. Energy Performance Contracts will be an important tool in a PHA’s toolbox for controlling utility and maintenance costs. Energy Performance Contracting is an innovative financing technique that uses cost savings from reduced energy consumption to repay the cost for installing energy conservation measures. In addition, the Federal Energy Policy Act of 2005 extends the allowable payback period for energy performance contracts from 12 to 20 years. This longer payback period makes these contracts financially more attractive for small and medium size PHAs and can generate funding to incorporate more energy-saving retrofits into any Energy Performance Contract.
External factors also affect the supply of affordable rental housing for the elderly and persons with disabilities. The share of the population who are elderly (65 and older) is projected to increase from 12 percent of the population in 2000 to 20 percent by 2030, with rapid growth beginning around 2010. Other factors include local rental markets, building codes and land use regulations, state and local program decisions, and the actions of HUD’s partners.
The Supreme Court held in 1999 that states must place persons with disabilities in community settings rather than institutions when treatment professionals determine that community placement is appropriate (Olmstead V. L.C. (98-536) 527 U.S. 581 (1999)). As a result of this decision, more persons with disabilities could be moving into communities while the supply of affordable housing remains low.
A wide array of local factors, such as building codes and other regulations, affect the choices builders make in constructing and rehabilitating American homes. While HUD can encourage local communities to improve and enforce building codes and regulations, and can promote private rehabilitation, the Department cannot mandate these changes. Increasing building density and other land use factors also has major impacts on an area’s vulnerability to natural disasters and the magnitude of associated risk. Public awareness of these hazards and ways of reducing them is also important, but often lacking.
8 Joint Center for Housing Studies of Harvard University, “The State of the Nation’s Housing 2006,” page 8.
53
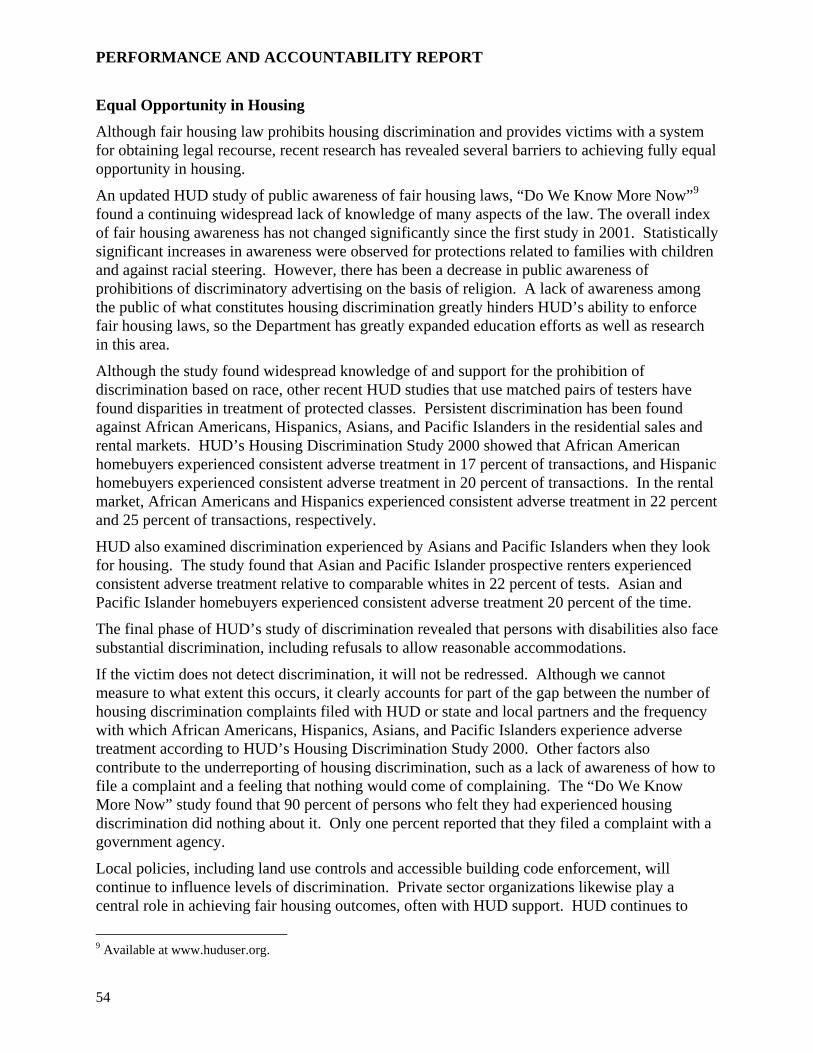
PERFORMANCE AND ACCOUNTABILITY REPORT
Equal Opportunity in Housing
Although fair housing law prohibits housing discrimination and provides victims with a system for obtaining legal recourse, recent research has revealed several barriers to achieving fully equal opportunity in housing.
An updated HUD study of public awareness of fair housing laws, “Do We Know More Now”9
found a continuing widespread lack of knowledge of many aspects of the law. The overall index of fair housing awareness has not changed significantly since the first study in 2001. Statistically significant increases in awareness were observed for protections related to families with children and against racial steering. However, there has been a decrease in public awareness of prohibitions of discriminatory advertising on the basis of religion. A lack of awareness among the public of what constitutes housing discrimination greatly hinders HUD’s ability to enforce fair housing laws, so the Department has greatly expanded education efforts as well as research in this area.
Although the study found widespread knowledge of and support for the prohibition of discrimination based on race, other recent HUD studies that use matched pairs of testers have found disparities in treatment of protected classes. Persistent discrimination has been found against African Americans, Hispanics, Asians, and Pacific Islanders in the residential sales and rental markets. HUD’s Housing Discrimination Study 2000 showed that African American homebuyers experienced consistent adverse treatment in 17 percent of transactions, and Hispanic homebuyers experienced consistent adverse treatment in 20 percent of transactions. In the rental market, African Americans and Hispanics experienced consistent adverse treatment in 22 percent and 25 percent of transactions, respectively.
HUD also examined discrimination experienced by Asians and Pacific Islanders when they look for housing. The study found that Asian and Pacific Islander prospective renters experienced consistent adverse treatment relative to comparable whites in 22 percent of tests. Asian and Pacific Islander homebuyers experienced consistent adverse treatment 20 percent of the time.
The final phase of HUD’s study of discrimination revealed that persons with disabilities also face substantial discrimination, including refusals to allow reasonable accommodations.
If the victim does not detect discrimination, it will not be redressed. Although we cannot measure to what extent this occurs, it clearly accounts for part of the gap between the number of housing discrimination complaints filed with HUD or state and local partners and the frequency with which African Americans, Hispanics, Asians, and Pacific Islanders experience adverse treatment according to HUD’s Housing Discrimination Study 2000. Other factors also contribute to the underreporting of housing discrimination, such as a lack of awareness of how to file a complaint and a feeling that nothing would come of complaining. The “Do We Know More Now” study found that 90 percent of persons who felt they had experienced housing discrimination did nothing about it. Only one percent reported that they filed a complaint with a government agency.
Local policies, including land use controls and accessible building code enforcement, will continue to influence levels of discrimination. Private sector organizations likewise play a central role in achieving fair housing outcomes, often with HUD support. HUD continues to
9 Available at www.huduser.org.
54

SECTION 1. MANAGEMENT’S DISCUSSION AND ANALYSIS RISKS, TRENDS, AND FACTORS AFFECTING GOALS
promote fair housing by investigating, conciliating, and prosecuting discrimination in the private market, while also ensuring non-discrimination in its own programs. FHA, which insures mortgages for low- and moderate-income borrowers, has worked to ensure equal housing opportunities through targeted marketing and outreach activities to unserved and underserved markets. FHA also has taken substantial steps to reduce the predatory lending activity that has had a disproportionate impact on minority households and neighborhoods.
Strengthening Communities
The economy produced 2,180,000 new jobs during FY 2006, according to estimates of the Bureau of Labor Statistics. Numerous metropolitan areas participated in the improvement, with 296 areas gaining jobs and 238 of 367 areas experiencing corresponding decreases in unemployment rates during FY 2006 (as of August). Less information is available about central cities and other older communities that HUD programs may target. To the extent that such communities rely on manufacturing employment, they may be adversely affected by continuing loss of manufacturing jobs. These macroeconomic trends can affect the success of HUD’s partnership efforts.
Hurricane Katrina has posed an unusual challenge for HUD’s goal of strengthening communities, because much of the physical infrastructure, the local economy and community institutions, and household assets of the Gulf Coast were destroyed in one blow. HUD has marshaled a full range of program authority in the service of rebuilding New Orleans and other hurricane-damaged communities. Yet the hurricanes of 2005 reinforced the reality of the risks of disaster, whether of natural or other causes, to the fabric of America’s communities.
Community economic development is often challenged by imbalances in local job markets related to skill gaps or to mismatches between the locations of available jobs and unemployed workers. Many older communities also face fiscal pressures as they struggle to provide quality services and attract employers during a time of declining tax bases. Rural communities often face additional challenges because of the changing structure of the farming industry, under-investment, weak infrastructure, limited services, and few community institutions. Rural labor forces are more narrowly based and are more dispersed.
Communities also have a great deal of flexibility when using HUD funds to address their economic conditions and community needs. Many programs – particularly Community Development Block Grants – may be used for a wide variety of eligible activities at the discretion of the grantee. When communities choose to address job growth for low-income individuals, there are a wide variety of approaches that are difficult to measure. Some communities may support infrastructure to increase business development in certain areas, while others may directly apply funds toward preparing individuals for employment. Thus, the ability of communities to respond with discretion to local conditions also establishes constraints on setting goals and assessing results at a national level. HUD is working closely with state and local partners to enhance local accountability for results without restricting the flexibility provided by HUD’s programs.
Community needs and urban conditions and challenges have evolved substantially over the past several decades. To continue to meet these challenges effectively, on May 25, 2006, HUD provided to Congress the Community Development Block Grant Reform Act of 2006, which included three significant changes to the current CDBG program:
55

PERFORMANCE AND ACCOUNTABILITY REPORT
• Formula Reform: Modifying the three decades old formula so that it more equitably target funds toward today's types of community needs;
• Challenge Grant: Creating a challenge grant that rewards communities who concentrate their investments in distressed neighborhoods and can show the impact of those investments; and
• Performance Measures: Establishing stronger requirements to measure CDBG grantee performance and to hold grantees accountable for meeting their performance goals.
Research into the CDBG program and its impacts have motivated the legislative proposals. A careful study has shown that over time the current formula has lessened in its ability to accurately target funds to the communities that most need them. Other research indicates that concentrated CDBG investment is effective at making neighborhood improvements. In addition, a government-wide effort to show the results that come from federal investment has highlighted the need for statutory reforms to enhance program accountability.
Success in aiding the homeless to become self-sufficient is also affected by a variety of factors beyond HUD’s control. The incidence of homelessness is affected by macroeconomic forces such as unemployment levels, structural factors such as the supply of entry-level jobs, and the availability of low-cost housing. Personal factors such as domestic violence, substance abuse, mental illness, disabilities, and the extent of a person’s educational or job skills also may underlie homelessness. Successful transitions to society from prisons, treatment facilities, or other institutions are now recognized as critical to reductions of chronic homelessness. HUD is promoting the implementation of local Homeless Management Information Systems, which are critical tools for serving the diverse needs of individuals more effectively.
Participation levels by partners in the provision of homeless assistance – including state and local agencies, nonprofit organizations, service providers, housing developers, neighborhood groups, private foundations, the banking community, local businesses, and current and former homeless persons – will substantially determine the success of homeless families and individuals in becoming more self-sufficient. Increasing fiscal strains on state and local governments may reduce their ability to make contributions towards HUD’s objectives. State and local governments also make critical decisions about zoning and the use of funds from programs such as Community Development or HOME block grants, Low-Income Housing Tax Credits, and tax-exempt bonds for rental housing, which may affect the local housing supply.
Economic downturns typically increase unemployment and can hamper self-sufficiency efforts. Recessions tend to affect homeless people and other low-income people disproportionately, because they are usually among the first to be laid-off, and generally have few marketable skills. Recent job creation should make it easier for many low-skilled or inexperienced workers to enter the workforce in the coming years, although much of the growth has been occurring in relatively low-paying service occupations. Jobs continue to grow faster in suburban areas, while families making the transition from welfare are more likely to live in inner-city or rural areas.
Many of the educational, training, and service programs available to help families make the transition to housing self-sufficiency are operated by local recipients of federal funds from agencies other than HUD. Such factors can constrain the Department’s ability to achieve marked success in promoting housing self-sufficiency and homeownership of assisted renters.
56

SECTION 1. MANAGEMENT’S DISCUSSION AND ANALYSIS RISKS, TRENDS, AND FACTORS AFFECTING GOALS
HUD Management Challenges
Improving the efficiency and effectiveness of HUD’s program delivery requires the Department to both sustain operational consistency in completed reforms and implement corrective actions on concerns discussed in the “Management and Performance Challenges” in Section 4 and “Management Assurances” discussions in Section 1 of this report.
To better ensure operational consistency, it is essential that HUD execute its Strategic Five-Year Human Capital Management Plan to address needs identified by recently completed workforce studies and assure mission-critical functions are adequately staffed and performed. Succession planning is critical, since HUD has an aging workforce in which over 58 percent of the employees are eligible to retire within three years. HUD’s workforce planning is adversely impacted when it does not receive sufficient funds to realize its authorized full-time equivalent staffing levels, due to across-the-board budget cuts or the need to fund salary increases that are not provided for in HUD’s annual appropriations. During FY 2006, the Department implemented the HUD Training Strategy to address needs identified by staff through the 2005 Organizational Assessment Survey and the 2006 Workforce Planning Taskforce effort.
To use limited staff and resources more effectively, it also is essential that HUD sustain efforts to refine and strengthen the use of risk-based techniques for monitoring programs. When monitoring reveals significant performance and compliance problems, HUD must act appropriately to address those problems to minimize the risk and further program objectives.
Adequate funding of HUD’s information technology portfolio is a concern. Many of HUD’s critical program and financial management systems are legacy systems dependent on outdated technology that is becoming increasingly difficult and costly to maintain. HUD needs the commitment and funding to modernize these antiquated and limited systems. It is also essential that HUD program managers assume a stronger systems ownership role in assuring that systems requirements and controls over data quality and security are properly established. These efforts will result in improved program delivery and better support for HUD’s mission.
To further reduce improper payments in rental housing subsidy programs, HUD will need continued cooperation of its program partners and tenant groups to strengthen and adhere to internal controls that ensure appropriate subsidy payments go to intended beneficiaries. The Enterprise Income Verification System that HUD implemented during FY 2006 is enabling HUD’s PHA partners to more accurately verify tenant income. Expansion of this verification process to all rental assistance programs will likely eliminate the majority of improper payments in rental assistance attributable to tenant underreporting of income. Statutory changes should also be considered to simplify and standardize subsidy program requirements.
Finally, it is important that HUD continue to improve its acquisitions workforce to assure timely award and proper administration and close out of the heavy volume of contract actions for information technology and other essential administrative and program services that HUD has outsourced. To address this need, the Department has strengthened certification and training standards for government technical representatives, hired additional staff, and installed new leadership in the Office of the Chief Procurement Officer.
57

PERFORMANCE AND ACCOUNTABILITY REPORT
Analysis of Financial Condition and Result This section provides a summary of HUD’s:
• Financial Data
• Analysis of Financial Position
• Analysis of Off-Balance Sheet Risk
Summarized Financial Data (Dollars in Millions)
2006 2005
Total Assets $123,063 $110,569
Total Liabilities $17,323 $18,619
Net Position $105,740 $91,950
FHA Insurance-In-Force $395,777 $416,461
Ginnie Mae Mortgage-Backed Securities Guarantees $409,990 $412,304
Other HUD Program Commitments $71,014 $67,602
Analysis of Financial Position Assets - Major Accounts
Total Assets for FY 2006, as reported in the Consolidated Balance Sheets, are displayed in Chart 1. Total Assets of $123.1 billion are comprised primarily of Fund Balance with Treasury of $81.4 billion (66.1 percent) and Investments of $30.5 billion (24.8 percent).
58

SECTION 1. MANAGEMENT’S DISCUSSION AND ANALYSIS ANALYSIS OF FINANCIAL CONDITION AND RESULT
Composition of HUD Assets - FY06
Fund Balance with Treasury66.1%
Investments24.8%
Loans Receivable and Related Foreclosed Property
8.2%
Accounts Receivable
0.3%
Other Assets and Property, Plant and Equipment
0.6%
Chart 1 – Composition of HUD Assets –FY06
Total Assets increased $12.5 billion (11.3 percent) from $110.6 billion at September 30, 2005 to $123.1 billion at September 30, 2006. The net increase was due primarily to an increase of $13.9 billion (20.6 percent) in Fund Balance with Treasury from $67.5 billion at September 30, 2005 to $81.4 billion at September 30, 2006.
Table 1 presents total assets for FY 2006 and the four preceding years. The changes and trends impacting Total Assets are discussed below.
Total Assets Trend(Dollars in Billions)
$118.4 $123.1$110.6$113.2$120.8
$0
$20
$40
$60
$80
$100
$120
$140
2002 2003 2004 2005 2006
Fiscal Year
Table 1 – Total Assets Trend
Fund Balance with Treasury of $81.4 billion represents HUD’s aggregate amount of funds available to make authorized expenditures and pay liabilities. Fund Balance with Treasury increased due to a net increase of $15.8 billion in funding for the Community Development Block Program (CDBG), offset by a net decrease in funding for Section 8 of $2.2 billion.
Investments of $30.5 billion consist primarily of investments by FHA’s Mutual Mortgage Insurance/Cooperative Management Housing Insurance Fund and by Ginnie Mae, in non-marketable market-based Treasury interest-bearing obligations (i.e., investments not sold in public markets). Compared to last fiscal year, there was an insignificant net decrease in Investments.
59

PERFORMANCE AND ACCOUNTABILITY REPORT
Accounts Receivables of $0.4 billion primarily consists of claims to cash from the public and state and local authorities for bond refunding, Section 8 year-end settlements, sustained audit findings, FHA insurance premiums and foreclosed property proceeds. A 100 percent allowance for loss is established for all delinquent debt 90 days and over.
Loans Receivable and Related Foreclosed Property of $10.0 billion are generated by HUD’s support of construction and rehabilitation of low rent housing, principally for the elderly and disabled under the Section 202/811 program, and FHA credit program receivables. Compared to last fiscal year, there was a decrease in Loan Receivable and investments in Related Foreclosed Property assets of $0.8 billion (7.2 percent).
Remaining assets of $0.7 billion, comprising 0.6 percent of Total Assets, include fixed assets and other assets. Net changes pertaining to remaining asset balances increased by 6.8 percent compared to prior fiscal year.
Assets - Major Programs
Chart 2 presents Total Assets for FY 2006 by major responsibility segment or program.
Housing for Elderly and Disabled
9.9%
All Other7.4%PIH
6.9%
Operating Subsidies
0.8%
Home4.7%
Ginnie Mae10.5%
Section 87.0%
FHA30.3%
CDBG22.5%
Assets by Responsibility Segments
Chart 2 – Assets by Responsibility Segment
60

SECTION 1. MANAGEMENT’S DISCUSSION AND ANALYSIS ANALYSIS OF FINANCIAL CONDITION AND RESULT
Liabilities – Major Accounts
Total Liabilities for FY 2006, as reported in the Consolidated Balance Sheets, are displayed in Chart 3.
Composition of HUD
Loan Guarantees
20.7%
Debt49.1%
Accounts Payable
4.4%
Remaining Liabilities
25.8%
Chart 3 – Composition of HUD Liabilities
Total Liabilities of $17.3 billion consists primarily of debt in the amount of $8.5 billion (49.1 percent), loan guarantee liabilities of $3.6 billion (20.7 percent), accounts payable of $0.8 billion (4.4 percent), and remaining liabilities amounting to $4.4 billion (25.8 percent).
Total Liabilities decreased $1.3 billion, 7.0 percent, from $18.6 billion at September 30, 2005 to $17.3 billion at September 30, 2006. The net decrease in total liabilities was due primarily to decreases of $2.0 billion in Debt and $1.1 billion in Loan Guarantees, offset by a net increase of $1.8 billion in Remaining Liabilities.
Table 2 presents total liabilities for FY 2006 and the four preceding years. A discussion of the changes and trends impacting Total Liabilities is presented in the subsequent paragraphs.
Liabilities Trend(Dollars in Billions)
$28.8 $30.1
$20.5$17.3$18.6
$-
$10
$20
$30
$40
2002 2003 2004 2005 2006Fiscal Year
Table 2 – Liabilities Trend
61

PERFORMANCE AND ACCOUNTABILITY REPORT
Debt includes intra-governmental debt of $7.2 billion and debt held by the public of $1.3 billion. The intra-governmental debt consists of loans from the Treasury, Public Housing Authorities, Tribally Designated Housing Entities, Federal Financing Bank, and debentures issued by FHA in lieu of cash disbursements to pay claims. Debt held by the public consists of new housing authority bonds and FHA debentures issued to the public at par. The $2.0 billion decrease in debt (repayments exceed new borrowings) was primarily due to a $1.3 billion decrease in FHA debt.
Accounts Payable consists primarily of pending grants payments and cash claims for single family properties and multifamily mortgage notes assigned.
Loan Guarantees consist of the liability for loan guarantees related to Credit Reform loans made after October 1, 1991 and the loan loss reserve related to guaranteed loans made before October 1, 1991. The liability for loan guarantees and the loan loss reserve are both comprised of the present value of anticipated cash outflows for defaults such as claim payments, premium refunds, property expense for on-hand properties, and sales expense for sold properties, less anticipated cash inflows such as premium receipts, proceeds from property sales, and principal interest on Secretary-held notes. The decrease in loan guarantees of $1.1 billion was primarily due to an overall decrease guarantees for FHA programs.
Remaining Liabilities of $4.5 billion consist primarily of Insurance Liabilities, Federal Employee and Veteran Benefits, and Other Liabilities. Net changes pertaining to remaining liability balances increased by $1.8 billion, 72.3 percent, as compared to the prior fiscal year.
Liabilities – Major Programs
Chart 4 presents Total Liabilities for FY 2006 by responsibility segment.
Liabilities by Responsibility Segment
FHA76.7%
PIH12.6%
All Other2.5%
Housing for Elderly and Disabled
0.2%
Ginnie Mae5.8%Section 8
0.7%
CDBG, Home, & Operating Subsidies
1.5%
Chart 4 – Liabilities by Responsible Segment
Changes in Net Position
Changes in Unexpended Appropriations, Net Cost of Operations, and Financing Sources combine to determine the Net Position at the end of the year. The elements are further discussed below. Net Position, as reported in the Statements of Changes in Net Position, reflects an increase of $13.8 billion or 15.0 percent from the prior fiscal year. This increase in Net Position
62

SECTION 1. MANAGEMENT’S DISCUSSION AND ANALYSIS ANALYSIS OF FINANCIAL CONDITION AND RESULT
is primarily attributable to a $12.4 billion increase in Unexpended Appropriations and a $1.4 billion increase in Cumulative Results of Operations (Financing Sources in excess oCost of Operations).
Unexpended Appropr
f Net
iations: which increased 23.0 percent from $53.8 billion in FY 2005 to ,
g Sources: As shown in HUD’s Statement of Changes in Net Position, HUD’s financing
sed, A
to
ts,
t Cost for FY 2006 by responsibility segment.
As presented in Table 3, Co m spending of ed jointly
$66.2 billion in FY 2006, represents the accumulation of appropriated funds not yet disbursedand can change as the Fund Balance with Treasury changes. A significant portion of these unexpended funds is attributable to long-term commitments as discussed in the following section.
Financinsources (other than exchange revenues contributing to Net Cost) for FY 2006 totaled $41.0 billion. This amount is comprised primarily of $44.3 billion in Appropriations Uoffset by approximately $3.4 billion in net transfers out. The transfers out consist of new FHsubsidy endorsements, credit subsidy downward re-estimates and the sweep of the General Insurance/Special Risk Insurance liquidating account’s unobligated budgetary resources.
Net Cost of Operations: as reported in the Consolidated Statements of Net Cost, amounts $39.6 billion for FY 2006, and reflects a 1.9 percent decrease as compared to the prior fiscal year. Net Cost of Operations consists of total costs, including direct and indirect program cosas well as general Department costs, offset by program exchange revenues (received in exchange for services provided by HUD).
Table 3 presents HUD’s Total Ne
Net Cost by Responsibility Segment - Fiscal Years 2005 and 2006(Dollars in Billions)
$3.6 $1.9
$3.6$5.1
$3.8 $3.6$1.8
$3.6$5.0
$4.0
($2.1) ($0.8) $0.8
$23.8
($0.7) ($1.1)
$23.4
$0.8
FHA Ginnie Mae PIH Housing Section 8 HOME Op. Subsidies CPD Other
Responsibility Segment
Net
Cos
t of O
pera
tions
FY 2006 FY 2005
Table 3 – Net Cost by Responsibility Segment
st of Operations was primarily a result fro$23.8 billion, 60 percent of Net Cost, in support of the Section 8 program (administerby the Housing, Community Planning and Development, and PIH programs). The current fiscal
63

PERFORMANCE AND ACCOUNTABILITY REPORT
year net cost of $23.8 billion for the Section 8 programs was $0.4 billion, or 1.8 percent, more than the prior fiscal year. Total HUD Net Costs includes FHA net surplus of $2.1 billion, attributable to FHA’s downward re-estimate of the anticipated long-term costs of its insuraprograms.
Net Result
nce
s of Operations
’s Net Cost of Operations and Financing Sources resulted in a
timation
’s Net Results of Operations for FY 2006 and the four preceding years.
Analysis of Off-Balance-Sheet Risk are due primarily to managing FHA’s insurance of
mitments
FY 2006 represents HUD’s commitment to
The combined effect of HUD61.8 percent change in Net Results of Operations of $1.4 billion during FY 2006. The significant year-to-year fluctuation shown in Table 3 is due primarily to the annual re-esof long-term credit program costs, which can be impacted by both program performance and economic forecasts.
Table 4 presents HUD
$4.4
$1.4
$3.6
$1.7
$5.9
2002 2003 2004 2005 2006
Fiscal Year
Net
Res
ults
of O
pera
tions
Net Results of Operations for FY 2002 - 2006 (Dollars in Billions)
Table 4- Net Results of Operations Trend
The financial risks of HUD’s credit activitiesmortgage guarantees and Ginnie Mae’s guarantees of mortgage-backed securities. Financial operations of these entities can be affected by large unanticipated losses from defaults by borrowers and issuers and by an inability to sell the underlying collateral for an amount sufficient to recover all costs incurred.
Contractual and Administrative Com
HUD’s contractual commitments of $72.3 billion inprovide funds in future periods under existing contracts for its grant, loan, and subsidy programs.Administrative Commitments (reservations) of $2.9 billion relate to specific projects for which funds will be provided upon execution of the related contract.
64

SECTION 1. MANAGEMENT’S DISCUSSION AND ANALYSIS ANALYSIS OF FINANCIAL CONDITION AND RESULT
Table 5 presents HUD’s Contractual Commitments for FY 2006 and the four preceding years.
$76.6 $68.7$83.7 $75.0 $72.3
$0
$25
$50
$75
$100
2002 2003 2004 2005 2006
Fiscal Year
Commitments Under HUD's Grants, Subsidy, and Loan Programs
(Dollars in Billions)
Table 5 – Commitments Under HUD’s Grants, Subsidy and Loan Programs
These commitments are primarily funded by a combination of unexpended appropriations and permanent indefinite budget authority, depending on the inception date of the contract. HUD draws on permanent indefinite budget authority to fund the current year’s portion of contracts entered into prior to fiscal year 1988. Since FY 1988, HUD has been appropriated funds in advance for the entire contract term in the initial year, resulting in substantial increases and sustained balances in HUD’s unexpended appropriations.
Total commitments (contractual and administrative) increased $4.0 billion or 5.6 percent during fiscal year 2006. The change is attributable to an increase of $10.7 billion in CDBG, and $0.2 billion in FHA. The increase is offset by a decrease of $4.9 billion in Section 8 commitments, $0.8 billion in PIH, $0.3 billion in Section 202/235/236, and $1.0 billion decrease in All Other commitments.
Table 6 presents HUD’s Section 8 Contractual Commitments for FY 2006 and the four preceding years.
Section 8 Commitments (Dollars in Billions)
$13.5 $11.9
$16.4$9.8
$12.9$10.0
$9.4
$21.3$21.3 $7.6
$0
$10
$20
$30
$40
2002 2003 2004 2005 2006
Fiscal Year
Funded from Unexpended AppropriationsFunded from Permanent Indefinite Appropriations
Table 6 – Section 8 Commitments
65

PERFORMANCE AND ACCOUNTABILITY REPORT
To contain the costs of future Section 8 contract renewals, HUD began converting all expiring contracts to 1-year terms during FY 1996. By changing to 1-year contract terms, HUD effectively reduced the annual budget authority needed from Congress to fund the subsidies while still maintaining the same number of contracts outstanding.
FHA Insurance in Force
FHA’s total insurance-in-force decreased $20 billion or 4.8 percent from $416 billion in FY 2005 to $396 billion in FY 2006. The decrease in FHA’s insurance-in-force was primarily due to the abatement of FHA borrowers refinancing their mortgages and converting them to conventional mortgages. The volume of such refinancing was high in FY 2006 due to the decline in interest rates and appreciation in house prices.
Table 7 presents FHA’s Insurance in Force for FY 2006 and the four preceding years.
FHA Insurance In Force - As of September 30(Dollars in Billions)
$563$490 $469
$396$416
$0
$200
$400
$600
2002 2003 2004 2005 2006
Fiscal Year
Table 7 – FHA’s Insurance in Force at Year End
Ginnie Mae Guarantees
Ginnie Mae financial instruments with off-balance sheet risk include guarantees of Mortgage-Backed Securities and commitments to guaranty. The securities are backed by pools of FHA-insured, Rural Housing Service-insured, and Veterans Affairs-guaranteed mortgage loans. Ginnie Mae is exposed to credit loss in the event of non-performance by other parties to the financial instruments. The total amount of Ginnie Mae guaranteed securities outstanding at September 30, 2006 and 2005, was approximately $410.0 billion and $412.3 billion, respectively. However, Ginnie Mae’s potential loss is considerably less because the FHA and Rural Housing Service insurance and Veterans Affairs guaranty serve to indemnify Ginnie Mae for most losses. Also, as a result of the structure of the security, Ginnie Mae bears no interest rate or liquidity risk.
During the mortgage closing period and prior to granting its guaranty, Ginnie Mae enters into commitments to guaranty Mortgage-Backed Securities. The commitment ends when the Mortgage-Backed Securities are issued or when the commitment period expires. Ginnie Mae’s risks related to outstanding commitments are much less than for outstanding securities due, in part, to Ginnie Mae’s ability to limit commitment authority granted to individual issuers of
66

SECTION 1. MANAGEMENT’S DISCUSSION AND ANALYSIS ANALYSIS OF FINANCIAL CONDITION AND RESULT
Mortgage-Backed Securities. Outstanding commitments as of September 30, 2006 and 2005 were $22.8 billion and $55.1 billion, respectively.
Table 8 presents Ginnie Mae Mortgage-Backed Securities for FY 2006 and the four preceding years.
Ginnie Mae Mortgaged-Backed Securities Outstanding at FY End
(Dollars in Billions)
$474 $453$410$412
$568
$0
$100
$200
$300
$400
$500
$600
2002 2003 2004 2005 2006
Fiscal Year
Table 8 -Ginnie Mae Mortgage-Backed Securities for FY 2006
Generally, Ginnie Mae’s Mortgage-Backed Securities pools are diversified among issuers and geographic areas. No significant geographic concentrations of credit risk exist; however, to a limited extent, securities are concentrated among issuers. In FY 2006 and 2005, Ginnie Mae issued a total of $23.8 billion and $56.6 billion, respectively, in its multi-class securities program. The estimated outstanding balances at September 30, 2006 and 2005, were $198.7 billion and $185.9 billion, respectively. These securities do not subject Ginnie Mae to additional credit risk beyond that assumed under the Mortgage-Backed Securities program.
67

PERFORMANCE AND ACCOUNTABILITY REPORT
Management Assurances FINANCIAL MANAGEMENT ACCOUNTABILITY
Federal Managers’ Financial Integrity Act Reporting
This section covers: Federal Managers’ Financial Integrity Act (FMFIA) Reporting Secretary’s Audit Resolution Report to Congress Delinquent Debt Collection
HUD management is responcontrols and financial manaManagers’ Financial Integreffectiveness of its internal ccompliance with applicable Management’s ResponsibilitHUD can provide reasonablefficiency of operations and September 30, 2006, was opin the design or operations o
In addition, HUD conductedfinancial reporting, which inlaws and regulations, in accA-123. Based on the resultsthat its internal control overeffectively and no material wcontrol over financial repor
Secretary of Housing INTERNAL CONTROL WEA
Section 2 of FMFIA requires deassurance on the effectiveness o
68
FMFIA Assurance Statement
sible for establishing and maintaining effective internal gement systems that meet the objectives of the Federal ity Act of 1982 (FMFIA). HUD conducted an assessment of the ontrol over the effectiveness and efficiency of operations and laws and regulations in accordance with OMB Circular A -123, y for Internal Control. Based on the results of that evaluation, e assurance that its internal control over the effectiveness and compliance with applicable laws and regulations, as of erating effectively and that no material weaknesses were found f the internal controls.
an assessment of the effectiveness of its internal control over cludes safeguarding of assets and compliance with applicable ordance with the requirements of Appendix A of OMB Circular of that evaluation, HUD can provide reasonable assurance financial reporting, as of June 30, 2006, was operating eaknesses were found in the design or operation of the internal
ting.
and Urban Development
KNESS ISSUES partments and agencies to provide an annual statement of f internal controls and report on any identified material internal

SECTION 1. MANAGEMENT’S DISCUSSION AND ANALYSIS MANAGEMENT ASSURANCES
control weaknesses and plans to correct any such weaknesses. FMFIA implementing guidance in OMB Circular A-123 also requires agencies to provide a separate statement of assurance regarding the effectiveness of internal controls over financial reporting. Effective for FY 2006, OMB Circular A-123 defines a material weakness as a reportable condition, or combination of reportable conditions, that results in more than a remote likelihood that a material misstatement of the financial statements or other significant financial reports will not be prevented or detected. For FY 2006, no material internal control weaknesses were identified for the Department. However, HUD continued to make progress in correcting reportable conditions identified in its systems of internal control.
REPORTABLE CONDITIONS
Reportable conditions are internal control deficiencies that represent weaknesses in the design or operation of internal control that could adversely affect the organization’s ability to meet its internal control objectives, if uncorrected. HUD began FY 2006 with 10 reportable conditions. At the end of FY 2006, while significant progress was made on these reportable conditions, HUD management determined that all but one, FHA’s Risk Analysis/Liability Estimation, should remain listed as open conditions requiring further corrective action. The table following this summary provides specific FY 2006 accomplishments and remaining planned actions on each of the reportable conditions.
Reportable Conditions FY 2005 Carry-Over Issues and FY 2006 Status
Carry Over/Issues Reportable Conditions Status at End of
FY 2006 RC1 Performance Measures Open RC3 PHA Monitoring Open RC4 HUD’s Computing Environment Open RC7 Obligation Balances Open
RC13 Resource Management Open RC14 Management Controls Open RC16 Single Audit Act Coverage Open RC17 FHA Risk Analysis & Liability Estimation Closed RC18 Controls Over Rental Housing Assistance Open RC19 Departmental Financial Management Systems Open
69

PERFORMANCE AND ACCOUNTABILITY REPORT
ACTIONS ON REMAINING REPORTABLE CONDITIONS
Reportable Condition/ Problem Statement
FY 2006 Accomplishments Planned Actions
Performance Measures
HUD needs to improve quality controls over performance measure data to ensure data: 1) accuracy, 2) timeliness, 3) estimation, and 4) availability.
Assessed and addressed data availability and quality issues associated with the accelerated issuance of the annual Performance and Accountability Report.
Complete certification of systems not yet certified.
Implement all corrective actions identified during data quality assessments.
Implement clean-up of Section 8 project based assistance data.
Integrate maintenance of data quality control in normal business practices of system sponsors, and address compliance as a critical element in staff performance standards.
Public Housing Authority Monitoring Continued efforts are needed to improve housing authority monitoring to ensure that program funds are expended in compliance with laws and regulations.
Assessed monitoring management and operations of ten field offices during the Quality Management Review (QMR) on-site visits and provided technical assistance.
Completed onsite internal control reviews at three field offices not included in the QMR review process.
Implemented Phase 1 of the web-based application, Consolidated Review Tracking Tool, (CRTT) to be utilized by the field offices to manage monitoring requirements, travel resources, corrective action required and follow-up activities.
PIH participated in the Department’s Compliance and Monitoring Initiative (CMI) training for FY 2006.
Completed comprehensive coordinated reviews of 294 PHAs. Twenty percent of the PHAs that receive 80 percent of the PIH funding were represented. The remaining were determined through the PIH risk assessment model.
Completed an additional 887 limited reviews of PHAs as determined by the risk assessment model.
Maintain existing risk-based monitoring approach for PHAs.
Fully implement all phases of CRTT to track monitoring results not incorporated in FY 2006.
Develop an approach to determine adequate sanctions against PHAs when violations of compliance have been identified.
HUD’s Computing Environment Controls over HUD’s computing environment can be further strengthened to reduce the risks associated with
Developed a disaster recovery plan for HUD’s infrastructure general support systems.
Implemented a compliance review process to ensure conformance with published security baseline configuration standards.
Completed the contingency plan for
Complete planned improvements to the protection of HUD’s Network.
Install intrusion detection system software sensors on all servers.
Complete the risk assessments and business impact analyses
70

SECTION 1. MANAGEMENT’S DISCUSSION AND ANALYSIS MANAGEMENT ASSURANCES
Reportable Condition/ Problem Statement
FY 2006 Accomplishments Planned Actions
safeguarding funds, property, and assets from unauthorized use or misappropriation.
each major HUD application, in accordance with the National Institute of Standards and Technology 800-34 publication.
Completed the Business Impact Analyses for approximately 50 percent of HUD systems.
Completed risk assessments for all HUD major applications.
Continued to perform quarterly reviews of access security data residing in the personnel security database.
Updated HUD’s Data Center security plan to reflect the current operating environment.
Designed a web-based form that initiates the personnel security request.
on each system. Implement Alpha-Five, the
replacement system for the HUD On-Line User Registration System to support administrative workflow, multilevel approvals, self- registration, and reporting on systems access rights.
Implement corrective actions for the HUD Procurement Systems and Small Purchase System noted deficiencies.
Obligation Balances HUD needs to improve controls over the monitoring of obligated balances to determine whether they remain needed and legally valid as of the end of the fiscal year.
Implemented an electronic payment process via electronic Line of Credit Control System.
Finalized written Section 236 internal control procedures.
Deobligated terminated projects in coordination with the Office of Housing, resulting in approximately $300 million in recaptures.
Reconciled Section 236 and Rental Assistance Program/Rent Supplemental Program subsidies.
Corrected end dates on 51 projects (specifically, the 50- year long projects).
Reconciled HUD’s Section 236 inventories.
Reconciled Servicer’s payment schedules with CFO’s payment schedules.
Continue to cleanup backlog of contract and program close-out actions so that unliquidated obligation balances on expired activity can be properly deobligated.
71

PERFORMANCE AND ACCOUNTABILITY REPORT
Reportable Condition/ Problem Statement
FY 2006 Accomplishments Planned Actions
Resource Management
HUD needs to develop a comprehensive strategy to manage its resources and better estimate staffing needs and support its staffing requests.
Implemented specific, measurable, attainable, relevant, and time-bound (SMART) performance standards for over 1,200 HUD employees.
Implemented accountability standards in all Senior Executive Service (SES) performance plans.
Developed a policies and procedures guide for interns entitled, “Recruitment and Retention Plan of Action for Federal Career Interns and Presidential Management Fellows.
Identified HUD positions to be targeted for career patterns.
Established a human resources internal audit program.
Developed/issued strategies to further improve the SES hiring timeline.
Remained in compliance with the Office of Personnel Management’s government-wide 45-day standard for average recruitment time.
Continue to reduce competency gaps in leadership, mission critical occupations, human resources and information technology.
Put “SMART” performance plans in place for the remainder of HUD staff.
Categorize targeted positions into career patterns.
Meet 45-day hiring timeline. Implement “optimum
organization” plans to streamline processes and achieve staff efficiency savings to free-up full time equivalents for core program needs
Management Controls Weaknesses in the Department’s control environment impact HUD’s ability to effectively manage its programs.
Continued participation in the Quality Management Review Program by evaluating field office performance to identify deficiencies and developing corrective solutions. Ten reviews were completed in FY 2006.
Issued A-123 assurance statement on controls over financial reporting.
Update the Departmental Management Control Handbook 1840.1 Rev-3 to reflect OMB Circular A-123 changes that became effective in FY 2006.
Continue to mitigate control weaknesses and other deficiencies.
Single Audit Act Coverage HUD needs to improve its oversight of program participant compliance with the Single Audit Act requirements, and consider central oversight of single audit results.
HUD has established on the Intranet an extensive One Stop web page that promulgates and reinforces all the requirements of the Single Audit Act.
HUD’s Quality Management Review process includes review of staff’s compliance with the Single Audit Act.
Develop a Single Audit Act Module for tracking Single Audit Act audit recommendations.
Integrate the HUD module with OMB-developed solutions to ensure seamless integration.
FHA Risk Analysis & Liability Estimation FHA must incorporate better risk factors and monitoring tools into its single-family insured mortgage program risk
FHA incorporated additional risk factors, including credit scores, into statistical models of claim and prepayment.
Refined assumptions used in the single-family and multifamily cash flow models used to calculate credit subsidy estimates for the FHA budget to
Based on the corrective actions completed in FY 2006, this issue is no longer a reportable condition and is closed.
72

SECTION 1. MANAGEMENT’S DISCUSSION AND ANALYSIS MANAGEMENT ASSURANCES
Reportable Condition/ Problem Statement
FY 2006 Accomplishments Planned Actions
analysis and loan liability estimation process.
address the rapid changes in economic conditions, especially those associated with the housing market. Specifically, new assumptions were added to account for the increased risk associated with borrowers who receive gift letters and borrower credit scores. This has significantly narrowed the gap that has developed over the past few years between projected and actual claim experience, thus making the models more reliable and accurate.
Controls Over Rental Housing Assistance HUD needs to improve in its internal controls over subsidy determinations and payments in its rental housing assistance programs.
Conducted more effective and timely income verifications by using HUD’s Enterprise Income Verification (EIV) System for the public housing and housing voucher programs.
Consolidated all available income match data sources in the EIV System for controlled use by program administrators.
Submitted final installment of information/documents (i.e., PHA security monitoring results, Federal Information Security Management Act/Certification &Accreditation update on modified EIV system, cost-benefit analysis) requested by Health and Human Services to support approval of expanding the Computer Matching Agreement to cover MF Housing programs.
Completed modifications to the EIV system to facilitate expansion of the National Directory of New Hires matching to MF Housing programs, and began registering MF owners/agents for system access.
Execute a Computer Matching Agreement with Health and Human Services to expand the National Directory of New Hires computer-matching program to MF Housing programs, and fully implement the expanded program.
HUD’s Departmental Financial Management Systems
Developed and tested a Contingency plan and Business Resumption Plan that incorporated disaster recovery procedures.
Developed a FHA Subsidiary Ledger risk assessment document in accordance with HUD and National Institute of Standards and Technology guidelines.
Updated the FHA Subsidiary Ledger security plan in accordance with HUD
Enhance controls in FHA’s User Access Request process.
Modify the HUD Information Technology Services contract to include FHA’s Subsidiary Ledger as a mission critical system, and maintain the application at the Data Center in Charleston, West Virginia.
Complete the procurement of a highly qualified systems
73

PERFORMANCE AND ACCOUNTABILITY REPORT
Reportable Condition/ Problem Statement
FY 2006 Accomplishments Planned Actions
and National Institute of Standards and Technology guidelines.
Completed comprehensive functional, business, data, and system security requirements for an integrated financial system for the Department.
integrator and hosting service provider to support HUD’s implementation of a “modern integrated core financial management system”.
Complete the CFO and FHA transition to the integrated core financial system in FY 2009 that includes the integration, interfaces, and replacement of existing systems that do not support the new system or that perform redundant core financial functions.
SYSTEMS NON-CONFORMANCE ISSUES
Section 4 of FMFIA requires the reporting of any material non-conformance with financial management systems requirements established by OMB Circular A-127 and the Federal Financial Management Improvement Act of 1996 (FFMIA), with corresponding remediation plans. Compliance with OMB Circular A-127 is ensured when the system meets the 12 requirements in Section 7 of the OMB Circular. OMB guidelines specify that departments and agencies are substantially compliant with the Federal Financial Management Improvement Act when they can:
• Prepare financial statements and other required financial and budget reports using information generated by the financial management system(s);
• Provide reliable and timely financial information for managing current operations;
• Account for their assets reliably, so that they can be properly protected from loss, misappropriation, or destruction; and
• Do all of the above in a way that is consistent with federal accounting standards and the Standard General Ledger.
A system non-conformance is identified when the system does not comply with one or more required factors. The materiality or significance of the impact of the non-conformance is assessed against the overall capability of the system to consistently generate accurate, uniform, and reliable financial information required by agency management. Section 4 of FMFIA requires the reporting of any material non-conformance with financial management systems requirements established by OMB Circular A-127 and the Federal Financial Management Improvement Act of 1996, with corresponding remediation plans.
Last year, for the first time, HUD reported substantial compliance with OMB Circular A-127 and the Federal Financial Management Improvement Act of 1996, with no material systems non-conformance issues. During FY 2006, HUD identified no new material non-conformance issues and maintained its focus on successfully implementing aggressive, corrective action strategies to
74

SECTION 1. MANAGEMENT’S DISCUSSION AND ANALYSIS MANAGEMENT ASSURANCES
address any carry-over or new non-conformance issues related to Departmental Financial Management Systems.
STATUS OF REMAINING SYSTEMS NON- CONFORMANCE ISSUES
HUD’s continued commitment to improving adherence to federal financial systems requirements was demonstrated by the following FY 2006 results:
• Replacement of the Department’s previously non-compliant legacy Loan Accounting System;
• Completion of corrective action plans to ensure compliance of the Facilities Integrated Resources Management System;
• Continued financial management improvements through the FHA Subsidiary Ledger Project; and
• Completion of an acquisition strategy to provide a modern, fully compliant integrated core financial management system for all of HUD, through the HUD Integrated Financial Management Improvement Project.
A complete listing of HUD’s 41 financial and mixed financial management systems is shown in Appendix 3. All systems are subject to an annual review to ensure they remain compliant. At the end of FY 2005, only two of these systems, the Loan Accounting System and the Facilities Integrated Resources Management System, were deemed non-compliant based on identified non-conformance issues. Based on completed corrective actions, these two systems are now substantially compliant and free of any material non-conformance issues, pending independent verification.
However, based on independent compliance reviews as part of this year’s financial audit, two additional financial systems, the Small Purchase System and the HUD Procurement System, were identified as having several deficiencies or non-conformance issues in need of remediation. Management is reviewing these non-conformance findings to determine if any cost-effective interim actions are possible to improve the operating environment of these legacy systems until the financial management systems modernization initiative is completed through the HUD Integrated Financial Management Improvement Project.
75

PERFORMANCE AND ACCOUNTABILITY REPORT
Improper Payments Information Act Reporting Please see the narrative on Eliminate Improper Payments under the President’s Management Agenda in Section 1, and the Improper Payments Information Act reporting detail in Other Accompanying Information located in Section 4.
76

Section 2. Performance Information
77

PERFORMANCE AND ACCOUNTABILITY REPORT
Overview: Strategic Framework and Performance Data Reliability Reporting on Progress Toward Strategic Goals
This second section of HUD’s FY 2006 Performance and Accountability Report gauges actual performance relating to the program indicators and targets published in the Department’s FY 2006 Annual Performance Plan.10 These performance indicators reflect short-term progress toward the Department’s Strategic Goals and Objectives outlined in the Department’s six-year Strategic Plan published in March 2003 and revised in March 2006. Significant performance results have been highlighted in the Management Discussion and Analysis section of this report.
This year’s Performance Section reflects a continuation of general improvement as in recent years. The data discussions contained in this section provide more detailed accounts of the quality, validity, and source of data for virtually all performance indicators. A summary report card preceding each strategic goal section indicates, in a transparent way, whether each target has been met.
Organization of Strategic Goals and Objectives
The individual FY 2006 performance measurement indicators are being reported against the strategic framework established by the HUD Strategic Plan FY 2003–FY 2008.11 During the reporting period, HUD issued its Strategic Plan FY 2006-2011,12 but the Department’s mission and strategic goals remain the same. The strategic objectives were updated to reflect current and anticipated needs, conditions, and resources. In addition, the Department has refined and specified new means, strategies, and management initiatives that will be used to accomplish its mission.
Budget Resources by Strategic Goal
Following the Strategic Framework is a table displaying budget resources and Full Time Equivalent positions by Strategic Goal.
10Available at www.hud.gov/offices/cfo/reports/2006/app2006.pdf. Appendix B of HUD’s FY 2007 Annual Performance Plan identifies revisions to a limited number of performance indicators or targets; www.hud.gov/offices/cfo/reports/pdf/app2007.pdf 11 Available at www.hud.gov/offices/cfo/reports/03strategic.pdf 12 Available at www.hud.gov/offices/cfo/stratplan.cfm
78

SECTION 2. PERFORMANCE INFORMATION STRATEGIC FRAMEWORK, PERFORMANCE DATA RELIABILITY, AND BUDGET RESOURCES BY GOAL
HUD’S STRATEGIC FRAMEWORK (FY 2003-FY 2006)
Mission: Increase homeownership, support community development, and increase access to affordable housing free from discrimination.
Increase homeownership opportunities
Promote decent affordable housing
Strengthen communities
Pro
gra
mm
ati
c S
tra
teg
ic G
oa
ls
• Expand national homeownership opportunities.
• Increase minority homeownership.
• Make the home-buying process less complicated and less expensive.
• Fight practices that permit predatory lending.
• Help HUD-assisted renters become homeowners.
• Keep existing homeowners from losing their homes.
• Expand access to affordable rental housing.
• Improve the physical quality and management accountability of public and assisted housing.
• Increase housing opportunities for the elderly and persons with disabilities.
• Transition families from HUD-assisted housing to self sufficiency.
• Provide capital and resources to improve economic conditions in distressed communities.
• Help organizations access the resources they need to make their communities more livable.
• End chronic homelessness and move homeless families and individuals to permanent housing.
• Mitigate housing conditions that threaten health.
Ensure equal opportunity in housing
• Provide a fair and efficient administrative process to investigate and resolve complaints of discrimination.
• Improve public awareness of fair housing laws. • Improve housing accessibility for persons with disabilities.
Embrace high standards of ethics, management and accountability
• Rebuild HUD’s human capital and further diversify its workforce. • Improve HUD’s management, internal controls and systems, and resolve audit issues. • Improve accountability, service delivery, and customer service of HUD and its partners. • Ensure program compliance. • Improve internal communications and employee involvement.
Promote participation of faith-based and community organizations
Cro
ss
-Cu
ttin
g S
tra
teg
ic G
oa
ls
• Reduce barriers to participation by faith-based and community organizations. • Conduct outreach and provide technical assistance to faith-based and community organizations
to strengthen their capacity to attract partners and secure resources. • Encourage partnerships between faith-based and community organizations and HUD’s
traditional grantees.
79

PERFORMANCE AND ACCOUNTABILITY REPORT
Discussion of Performance Indicators
The discussion section for each indicator contains a background explanation of the program being assessed, the measure used to gauge performance, the time period being reported, and results when measurable.
As results are presented, a clear statement has been included indicating whether the performance goal has been met or missed. The accompanying analysis explains the results and outcomes, including discussion of external factors as appropriate and feasible. The Department has made a focused effort to make these discussions understandable to the reader. In instances in which HUD failed to achieve a performance goal, an explanation for the performance shortfall and a strategy for improvement are given.
Reliability of Performance Data
HUD has made substantial advances in improving the completeness, accuracy, and reliability of performance data. As a result, the reader can rely on the data reported here to assess the Department’s achievements. In several cases HUD has made and is continuing to make notable improvements to further strengthen the precision, accuracy, and completeness of data elements.
An important part of data reliability is the extent to which limitations are disclosed. HUD has made substantial efforts to reveal limitations of completeness and accuracy in this report. Each performance indicator includes a data discussion, where it is relevant. Additional information about data limitations, validation, and verification is presented in HUD’s Annual Performance Plan – in many cases with greater detail each year.
HUD can assess outcomes of a number of programs only in limited ways because of statutory provisions, potential reporting burdens, and privacy concerns. The Community Development Block Grant program is a prime example. CDBG allows grantees discretion to conduct a broad variety of activities, and there is a necessary balance between assessing their impacts on final customers and creating reporting burdens for our partners. In such cases, the Department is consulting with partners and conducting research on ways to use available data more effectively, including data from external sources such as the U.S. Census Bureau. In point of fact, a focused effort is being conducted to develop superior performance measurement of the CDBG program over the next several years. There are other key areas where improved measurement efforts are underway or being researched. In other cases, performance measures that use survey sampling techniques are being developed. Some of these survey results are reported this year, and others are forthcoming.
External data also come with availability problems, because the cost of data collection prevents survey-based data from being produced on an annual basis for selected areas or small populations, such as individual neighborhoods, that are of interest to HUD. Timeliness is also a weakness of external data sources. This Performance and Accountability Report and the FY 2006 and 2007 Annual Performance Plans reflect the Department’s continuing attempts to help the reader assess data reliability with greater confidence, including efforts to report statistical confidence intervals for measures that rely on sampling. This Performance and Accountability Report has been produced on an accelerated basis and that has increased the challenge of obtaining timely and accurate data.
80

SECTION 2. PERFORMANCE INFORMATION STRATEGIC FRAMEWORK, PERFORMANCE DATA RELIABILITY, AND BUDGET RESOURCES BY GOAL
Use of Evaluations to Improve Strategies
Performance indicators face inherent limitations because their focused nature often prevents them from effectively addressing the issue of attribution. That is, performance measures can show results but may not be well suited for showing that the program, rather than external factors, caused the results. In areas where externalities are significant, the most that can be done with performance measures is to plausibly attribute the outcome to the program by demonstrating a logical connection between the efforts and the results of HUD’s activities.
To address the attribution problem, the Department also relies on program evaluations and is expanding efforts in this area. Evaluations are studies that assess program impacts, sometimes by using control groups, random assignment, econometric modeling, and other methodologies to exclude the effects of external forces. Evaluations also support a longer-term assessment of program performance that annual performance measures cannot capture.
HUD uses evaluation results to improve the Department’s strategies, programs, and policies. For example, a major experimental evaluation conducted in the 1970s was used to develop the Section 8 tenant-based program, a major innovation relative to previous “bricks and mortar” approaches to affordable housing. As a result, the Housing Choice Voucher program now relies on the private market to house more families than public housing does.
In a similar way, current program evaluations are used both to attribute results and to improve program strategies and operations. The ongoing “quality control” studies of rent determination errors in HUD’s housing programs led the Department to undertake the Rental Housing Integrity Improvement Project, which has dramatically reduced the level of improper payments in HUD’s rental assistance programs.
The Performance and Accountability Report also continues to include an Appendix that systematically summarizes FY 2006 research efforts and findings.
81

PERFORMANCE AND ACCOUNTABILITY REPORT
RESOURCES SUPPORTING HUD’S MISSION
Summary of Resources By Strategic Goal Budget Authority (BA) and Salaries and Expenses (S&E) are in thousands of dollars. Full Time Equivalents (FTE) represent the equivalent number of paid positions.
2005Actual
2006Approp.
2007Request
Strategic Goal H: Increase Homeownership Opportunities Discretionary BA $2,766,476 $2,790,014 $2,788,006 FTE 1,067 1,086 1,086 S&E Cost $109,018 $115,974 $120,044
Strategic Goal A: Promote Decent Affordable Housing
Discretionary BA $25,281,038 $26,350,607 $26,748,922 FTE 3,214 3,140 3,112 S&E Cost $331,213 $338,134 $347,131
Strategic Goal C: Strengthen Communities
Discretionary BA $5,257,825 $4,950,055 $4,291,467 FTE 787 800 780 S&E Cost $80,866 $85,888 $86,731
Strategic Goal FH: Ensure Equal Opportunity in Housing Discretionary BA $46,628 $45,940 $45,025 FTE 569 562 550 S&E Cost $57,614 $59,082 $59,881
Strategic Goal EM: Embrace High Standards of Ethics, Management, and Accountability Discretionary BA $2,561,901 $2,567,461 $2,566,687 FTE 3,382 3,293 3,231 S&E Cost $843,625 $781,824 $829,890
Strategic Goal FC: Promote Participation of Faith-Based and Community Organizations Discretionary BA $130,088 $124,301 $75,723 FTE 67 63 60 S&E Cost $7,546 $7,509 $7,454
Total Resources
Total BA $36,043,956 $36,828,377 $36,515,830 FTE 9,086 8,944 8,819 S&E Cost $1,429,882 $1,388,411 $1,451,131
To enhance consistency, supplemental appropriations, rescissions, and offsetting receipts that can vary significantly any given year are not included. FTEs and S&E are not included in the Total Resources for the Inspector General’s office and the Office of Federal Housing Enterprise Oversight (OFHEO) because each has independent budget presentations. Also, a legislative proposal would transfer OFHEO responsibilities in FY 2007. S&E and FTEs for the Working Capital Fund are reflected as part of the overall resources.
82
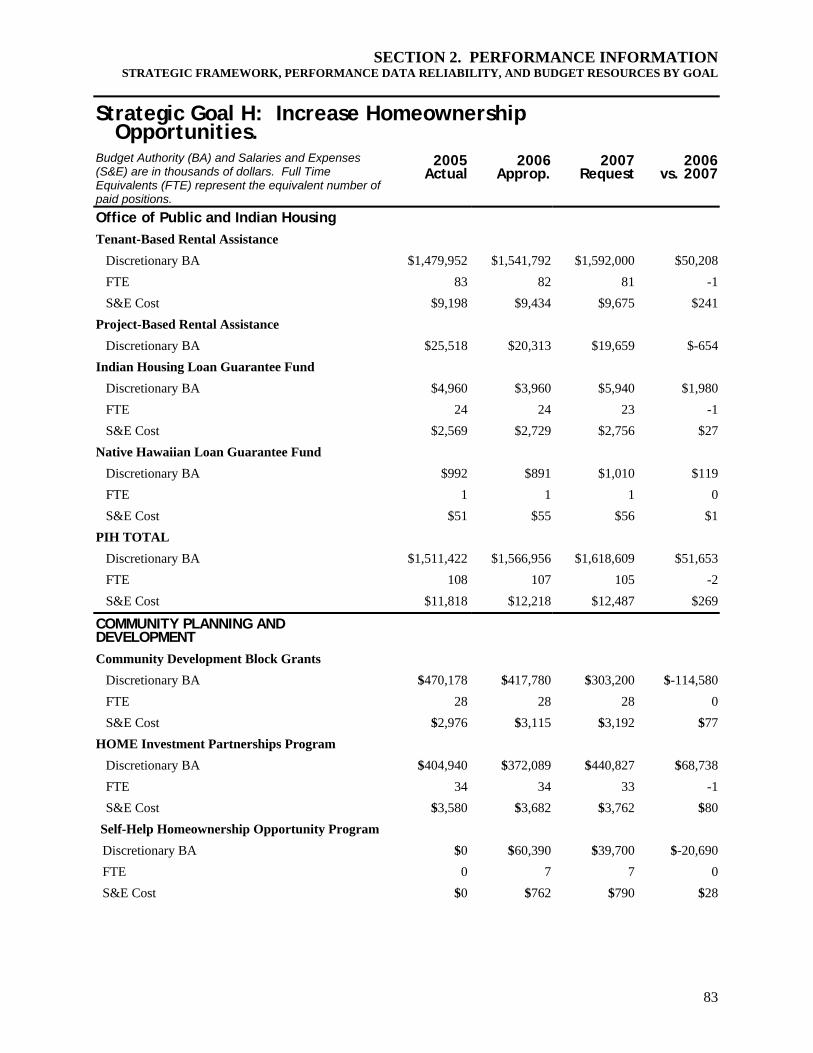
SECTION 2. PERFORMANCE INFORMATION STRATEGIC FRAMEWORK, PERFORMANCE DATA RELIABILITY, AND BUDGET RESOURCES BY GOAL
Strategic Goal H: Increase Homeownership Opportunities. Budget Authority (BA) and Salaries and Expenses (S&E) are in thousands of dollars. Full Time Equivalents (FTE) represent the equivalent number of paid positions.
2005Actual
2006Approp.
2007Request
2006vs. 2007
Office of Public and Indian Housing
Tenant-Based Rental Assistance Discretionary BA $1,479,952 $1,541,792 $1,592,000 $50,208 FTE 83 82 81 -1 S&E Cost $9,198 $9,434 $9,675 $241Project-Based Rental Assistance Discretionary BA $25,518 $20,313 $19,659 $-654Indian Housing Loan Guarantee Fund Discretionary BA $4,960 $3,960 $5,940 $1,980 FTE 24 24 23 -1 S&E Cost $2,569 $2,729 $2,756 $27Native Hawaiian Loan Guarantee Fund Discretionary BA $992 $891 $1,010 $119 FTE 1 1 1 0 S&E Cost $51 $55 $56 $1PIH TOTAL Discretionary BA $1,511,422 $1,566,956 $1,618,609 $51,653 FTE 108 107 105 -2 S&E Cost $11,818 $12,218 $12,487 $269
COMMUNITY PLANNING AND DEVELOPMENT
Community Development Block Grants Discretionary BA $470,178 $417,780 $303,200 $-114,580 FTE 28 28 28 0 S&E Cost $2,976 $3,115 $3,192 $77HOME Investment Partnerships Program Discretionary BA $404,940 $372,089 $440,827 $68,738 FTE 34 34 33 -1 S&E Cost $3,580 $3,682 $3,762 $80Self-Help Homeownership Opportunity Program
Discretionary BA $0 $60,390 $39,700 $-20,690 FTE 0 7 7 0 S&E Cost $0 $762 $790 $28
83

PERFORMANCE AND ACCOUNTABILITY REPORT
Strategic Goal H: Increase Homeownership Opportunities. Budget Authority (BA) and Salaries and Expenses (S&E) are in thousands of dollars. Full Time Equivalents (FTE) represent the equivalent number of paid positions.
2005Actual
2006Approp.
2007Request
2006vs. 2007
CPD TOTAL Discretionary BA $875,118 $850,259 $783,727 $-66,532 FTE 62 69 68 -1 S&E Cost $6,556 $7,559 $7,744 $185
OFFICE OF HOUSING FHA-GI/SRI Discretionary BA $17,203 $18,626 $19,352 $726 FTE 70 71 70 -1 S&E Cost $6,913 $7,338 $7,495 $157FHA-MMI/CHMI Discretionary BA $299,403 $294,579 $299,393 $4,814 FTE 668 661 660 -1 S&E Cost $65,900 $68,295 $70,652 $2,357Housing Counseling Assistance Discretionary BA $31,986 $32,079 $34,530 $2,451 FTE 69 71 76 5 S&E Cost $6,617 $7,283 $8,095 $812Interstate Land Sales (and RESPA) FTE 26 43 43 0 S&E Cost $3,848 $5,381 $5,500 $119HOUSING TOTAL Discretionary BA $348,592 $345,284 $353,275 $7,991 FTE 833 846 849 3 S&E Cost $83,278 $88,297 $91,742 $3,445
GNMA Mortgage-Backed Securities Discretionary BA $5,305 $5,297 $5,297 $0 FTE 34 33 34 +1 S&E Cost $3,799 $4,064 $4,149 $85
OFFICE OF POLICY DEVELOPMENT AND RESEARCH Discretionary BA $26,039 $22,218 $27,098 $4,880 FTE 30 31 30 -1 S&E Cost $3,567 $3,836 $3,922 $86
84

SECTION 2. PERFORMANCE INFORMATION STRATEGIC FRAMEWORK, PERFORMANCE DATA RELIABILITY, AND BUDGET RESOURCES BY GOAL
Strategic Goal H: Increase Homeownership Opportunities. Budget Authority (BA) and Salaries and Expenses (S&E) are in thousands of dollars. Full Time Equivalents (FTE) represent the equivalent number of paid positions.
2005Actual
2006Approp.
2007Request
2006vs. 2007
Total for Strategic Goal H Discretionary BA $2,766,476 $2,790,014 $2,788,006 $-2,008 FTE 1,067 1,086 1,086 0 S&E Cost $109,018 $115,974 $120,044 $4,070
OFFICE OF FEDERAL HOUSING ENTERPRISE OVERSIGHT
FTE 198 251 0 -251 S&E Cost $64,341 $60,000 $0 $-60,000
Strategic Goal A: Promote Decent Affordable Housing. Budget Authority (BA) and Salaries and Expenses (S&E) are in thousands of dollars. Full Time Equivalents (FTE) represent the equivalent number of paid positions.
2005Actual
2006Approp.
2007Request
2006vs. 2007
OFFICE OF PUBLIC AND INDIAN HOUSING Tenant-Based Rental Assistance Discretionary BA $11,839,516 $12,334,336 $12,736,000 $401,664 FTE 588 580 575 -5 S&E Cost $64,385 $66,039 $67,726 $1,687Project-Based Rental Assistance Discretionary BA $204,147 $162,502 $157,274 $-5,228Native American Housing Block Grants Discretionary BA $621,984 $623,700 $625,680 $1,980 FTE 139 139 135 -4 S&E Cost $15,061 $15,586 $15,611 $25Public Housing Operating Fund Discretionary BA $2,438,336 $3,564,000 $3,564,000 $0 FTE 138 137 136 -1 S&E Cost $15,341 $15,680 $16,076 $396Public Housing Capital Fund Discretionary BA $2,579,200 $2,438,964 $2,178,000 $-260,964 FTE 375 366 360 -6 S&E Cost $41,228 $41,631 $42,478 $847
85

PERFORMANCE AND ACCOUNTABILITY REPORT
Strategic Goal A: Promote Decent Affordable Housing. Budget Authority (BA) and Salaries and Expenses (S&E) are in thousands of dollars. Full Time Equivalents (FTE) represent the equivalent number of paid positions.
2005Actual
2006Approp.
2007Request
2006vs. 2007
Revitalization of Severely Distressed Public Housing Discretionary BA $142,826 $99,000 $0 $-99,000 FTE 75 77 77 0 S&E Cost $8,363 $8,951 $9,215 $264Native Hawaiian Housing Block Grant Discretionary BA $0 $8,727 $5,940 $-2,787 FTE 1 1 1 0 S&E Cost $31 $30 $31 $1PIH TOTAL Discretionary BA $17,826,009 $19,231,229 $19,266,894 $35,665 FTE 1,316 1,300 1,284 -16 S&E Cost $144,409 $147,917 $151,137 $3,220
OFFICE OF COMMUNITY PLANNING AND DEVELOPMENT
Community Development Block Grants Discretionary BA $705,267 $626,670 $454,800 $-171,870 FTE 43 43 43 0 S&E Cost $4,468 $4,702 $4,788 $86HOME Investment Partnerships Program Discretionary BA $1,130130 $1,044,849 $1,149,984 $105,135 FTE 89 88 87 -1 S&E Cost $9,339 $9,605 $9,814 $209Housing Opportunities for Persons with AIDS Discretionary BA $227,636 $231,177 $242,481 $11,304 FTE 40 40 40 0 S&E Cost $4,249 $4,400 $4,557 $157Tenant-Based Rental Assistance Discretionary BA $100 $0 $0 $0Project-Based Rental Assistance Discretionary BA $19,740 $36,192 $35,380 $-812Rural Housing and Economic Development Discretionary BA $23,808 $16,830 $0 $-16,830 FTE 15 14 14 0 S&E Cost $1,578 $1,525 $1,579 $54
86

SECTION 2. PERFORMANCE INFORMATION STRATEGIC FRAMEWORK, PERFORMANCE DATA RELIABILITY, AND BUDGET RESOURCES BY GOAL
Strategic Goal A: Promote Decent Affordable Housing. Budget Authority (BA) and Salaries and Expenses (S&E) are in thousands of dollars. Full Time Equivalents (FTE) represent the equivalent number of paid positions.
2005Actual
2006Approp.
2007Request
2006vs. 2007
CPD TOTAL Discretionary BA $2,106,681 $1,955,718 $1,882,645 $-73,073 FTE 187 185 184 -1 S&E Cost $19,634 $20,232 $20,738 $506
OFFICE OF HOUSING Section 202, Housing for the Elderly Discretionary BA $571,660 $568,162 $435,276 $-132,886 FTE 242 239 264 25 S&E Cost $23,256 $24,291 $27,930 $3,639Section 811, Housing for the Disabled Discretionary BA $204,867 $206,167 $104,386 $-101,781 FTE 123 115 130 15 S&E Cost $11,837 $11,689 $13,753 $2,064FHA-GI/SRI Discretionary BA $197,380 $202,213 $205,583 $3,370 FTE 814 783 753 -30 S&E Cost $79,318 $79,665 $79,623 $-42Flexible Subsidy Program FTE 7 7 6 -1 S&E Cost $663 $711 $634 $-77Rent Supplement Program Discretionary BA $0 $7,600 $6,930 $-670 FTE 4 4 5 1 S&E Cost $393 $407 $527 $120Rental Housing Assistance Program (Section 236) Discretionary BA $0 $18,612 $17,820 $-792 FTE 4 16 25 9 S&E Cost $393 $1,626 $2,641 $1,015Project-Based Rental Assistance Discretionary BA $4,350,586 $4,144,805 $4,812,220 $667,415 FTE 404 376 346 -30 S&E Cost $38,933 $38,270 $36,597 $-1,673Housing Counseling Assistance Discretionary BA $9,678 $9,501 $10,020 $519 FTE 21 21 22 1 S&E Cost $2,002 $2,157 $2,349 $192
87

PERFORMANCE AND ACCOUNTABILITY REPORT
Strategic Goal A: Promote Decent Affordable Housing. Budget Authority (BA) and Salaries and Expenses (S&E) are in thousands of dollars. Full Time Equivalents (FTE) represent the equivalent number of paid positions.
2005Actual
2006Approp.
2007Request
2006vs. 2007
HOUSING TOTAL Discretionary BA $5,334,170 $5,157,060 $5,592,236 $435,176 FTE 1,619 1,561 1,551 -10 S&E Cost $156,795 $158,816 $164,054 $5,238
GINNIE MAE Mortgage Backed Securities Discretionary BA $5,304 $5,296 $5,296 $0 FTE 33 33 34 +1 S&E Cost $3,799 $4,064 $4,148 $84
OFFICE OF POLICY DEVELOPMENT AND RESEARCH Research and Technology Discretionary BA $8,874 $1,304 $1,851 $547 FTE 59 61 59 -2 S&E Cost $6,576 $7,105 $7,054 $-51
Total for Strategic Goal A Discretionary BA $25,281,038 $26,350,607 $26,748,922 $398,315 FTE 3,214 3,140 3,112 -28 S&E Cost $331,213 $338,134 $347,131 $8,997
Strategic Goal C: Strengthen Communities. Budget Authority (BA) and Salaries and Expenses (S&E) are in thousands of dollars. Full Time Equivalents (FTE) represent the equivalent number of paid positions.
2005Actual
2006Approp.
2007 Request
2006vs. 2007
OFFICE OF COMMUNITY PLANNING AND DEVELOPMENT
Community Development Block Grants Discretionary BA $3,204,155 $2,844,617 $2,061,760 $-782,857 FTE 192 195 192 -3 S&E Cost $20,238 $21,179 $21,708 $529HOME Investment Partnerships Program Discretionary BA $170,971 $158,153 $172,498 $14,345 FTE 13 13 13 0 S&E Cost $1,401 $1,441 $1,472 $31
88

SECTION 2. PERFORMANCE INFORMATION STRATEGIC FRAMEWORK, PERFORMANCE DATA RELIABILITY, AND BUDGET RESOURCES BY GOAL
Strategic Goal C: Strengthen Communities. Budget Authority (BA) and Salaries and Expenses (S&E) are in thousands of dollars. Full Time Equivalents (FTE) represent the equivalent number of paid positions.
2005Actual
2006Approp.
2007 Request
2006vs. 2007
Homeless Assistance Grants Discretionary BA $1,112,738 $1,189,960 $1,377,783 $187,823 FTE 261 271 266 -5 S&E Cost $27,452 $29,501 $30,052 $551Housing Opportunities for Persons With AIDS Discretionary BA $36,906 $37,480 $39,313 $1,833 FTE 7 7 7 0 S&E Cost $689 $713 $739 $26Brownfields Redevelopment Program Discretionary BA $13,808 $9,900 $0 $-9,900 FTE 7 7 7 0 S&E Cost $736 $762 $790 $28Community Renewals (RC/EZ) Discretionary BA $9,920 $0 $0 $0 FTE 17 17 17 0 S&E Cost $1,788 $1,851 $1,918 $67CPD TOTAL Discretionary BA $4,548,498 $4,240,110 $3,651,354 $-588,756 FTE 497 510 502 -8 S&E Cost $52,304 $55,447 $56,679 $1,232
OFFICE OF HOUSING Section 202, Housing for the Elderly Discretionary BA $60,789 $61,819 $42,780 $-19,039 FTE 26 26 26 0 S&E Cost $2,473 $2,643 $2,745 $102Section 811, Housing for the Disabled Discretionary BA $11,700 $10,741 $6,398 $-4,343 FTE 7 6 8 2 S&E Cost $676 $609 $843 $234FHA-GI/SRI Discretionary BA $34,333 $37,425 $38,167 $742 FTE 145 144 140 -4 S&E Cost $13,797 $14,744 $14,782 $38
89

PERFORMANCE AND ACCOUNTABILITY REPORT
Strategic Goal C: Strengthen Communities. Budget Authority (BA) and Salaries and Expenses (S&E) are in thousands of dollars. Full Time Equivalents (FTE) represent the equivalent number of paid positions.
2005Actual
2006Approp.
2007 Request
2006vs. 2007
FHA-MMI/CHMI Discretionary BA $981 $3,571 $3,132 $-439 FTE 2 7 7 0 S&E Cost $216 $828 $739 $-89Manufactured Home Inspection and Monitor Program Discretionary BA $9,451 $13,000 $16,000 $3,000 FTE 13 11 11 0 S&E Cost $1,400 $1,222 $1,256 $34Project-Based Rental Assistance Discretionary BA $422,411 $407,224 $388,559 $-18,665 FTE 40 37 28 -9 S&E Cost $3,811 $3,760 $2,955 $-805HOUSING TOTAL Discretionary BA $539,666 $533,781 $495,035 $-38,746 FTE 233 231 220 -11 S&E Cost $22,373 $23,806 $23,320 $-486
OFFICE OF POLICY DEVELOPMENT AND RESEARCH Research and Technology Discretionary BA $3,005 $25,684 $30,238 $4,554 FTE 15 16 16 0 S&E Cost $1,783 $1,976 $2,019 $43
LEAD HAZARD CONTROL Discretionary BA $166,656 $150,480 $114,840 $-35,640 FTE 42 43 42 -1 S&E Cost $4,406 $4,659 $4,713 $54
Total for Strategic Goal C Discretionary BA $5,257,825 $4,950,055 $4,291,467 $-658,588 FTE 787 800 780 -20 S&E Cost $80,866 $85,888 $86,731 $843
90

SECTION 2. PERFORMANCE INFORMATION STRATEGIC FRAMEWORK, PERFORMANCE DATA RELIABILITY, AND BUDGET RESOURCES BY GOAL
Strategic Goal FH: Ensure Equal Opportunity in Housing. Budget Authority (BA) and Salaries and Expenses (S&E) are in thousands of dollars. Full Time Equivalents (FTE) represent the equivalent number of paid positions.
2005Actual
2006Approp.
2007Request
2006vs. 2007
OFFICE OF POLICY DEVELOPMENT AND RESEARCH Research and Technology Discretionary BA $500 $400 $475 $75 FTE 2 2 2 0 S&E Cost $238 $233 $237 $4
FAIR HOUSING AND EQUAL OPPORTUNITY Fair Housing Initiatives Program Discretionary BA $19,840 $19,800 $19,800 $0 FTE 24 16 16 0 S&E Cost $2,427 $1,681 $1,741 $60Fair Housing Assistance Program Discretionary BA $26,288 $25,740 $24,750 $-990 FTE 31 19 19 0 S&E Cost $3,136 $1,997 $2,068 $71Other FHEO Programs FTE 512 525 513 -12 S&E Cost $51,813 $55,171 $55,835 $664FHEO TOTAL Discretionary BA $46,128 $45,540 $44,550 $-990 FTE 567 560 548 -12 S&E Cost $57,376 $58,849 $59,644 $795
Total for Strategic Goal FH Discretionary BA $46,628 $45,940 $45,025 $-915 FTE 569 562 550 -12 S&E Cost $57,614 $59,082 $59,881 $799
91

PERFORMANCE AND ACCOUNTABILITY REPORT
Strategic Goal EM: Embrace High Standards of Ethics, Management, and Accountability. Budget Authority (BA) and Salaries and Expenses (S&E) are in thousands of dollars. Full Time Equivalents (FTE) represent the equivalent number of paid positions.
2005Actual
2006 Approp.
2007Request
2006vs. 2007
OFFICE OF PUBLIC AND INDIAN HOUSING Tenant-Based Rental Assistance Discretionary BA $1,479,952 $1,541,792 $1,592,000 $50,208 FTE 158 157 156 -1 S&E Cost $18,396 $18,868 $19,350 $482Project-Based Rental Assistance Discretionary BA $25,518 $20,313 $19,659 $-654PIH TOTAL Discretionary BA $1,505,470 $1,562,105 $1,611,659 $49,554 FTE 158 157 156 -1 S&E Cost $18,396 $18,868 $19,350 $482
OFFICE OF COMMUNITY PLANNING AND DEVELOPMENT Community Development Block Grants Discretionary BA $329,125 $292,446 $212,240 $-80,206 FTE 20 20 20 0 S&E Cost $2,083 $2,180 $2,235 $55HOME Investment Partnerships Program Discretionary BA $151,974 $140,580 $153,331 $12,751 FTE 12 12 12 0 S&E Cost $1,245 $1,281 $1,309 $28Homeless Assistance Grants Discretionary BA $127,773 $136,640 $158,207 $21,567 FTE 30 31 31 0 S&E Cost $3,152 $3,387 $3,451 $64Housing Opportunities for Persons with AIDS Discretionary BA $17,185 $17,453 $18,306 $853 FTE 3 3 3 0 S&E Cost $321 $332 $342 $10CPD TOTAL Discretionary BA $626,057 $587,119 $542,084 $-45,035 FTE 65 66 66 0 S&E Cost $6,801 $7,180 $7,337 $157
92

SECTION 2. PERFORMANCE INFORMATION STRATEGIC FRAMEWORK, PERFORMANCE DATA RELIABILITY, AND BUDGET RESOURCES BY GOAL
Strategic Goal EM: Embrace High Standards of Ethics, Management, and Accountability. Budget Authority (BA) and Salaries and Expenses (S&E) are in thousands of dollars. Full Time Equivalents (FTE) represent the equivalent number of paid positions.
2005Actual
2006 Approp.
2007Request
2006vs. 2007
OFFICE OF HOUSING FHA-GI/SRI Discretionary BA $42,261 $50,715 $52,422 $1,707 FTE 165 196 194 -2 S&E Cost $16,983 $19,980 $20,303 $323FHA-MMI/CHMI Discretionary BA $131,042 $115,274 $111,325 $-3,949 FTE 278 261 250 -11 S&E Cost $28,843 $26,725 $26,271 $-454Project-Based Rental Assistance Discretionary BA $250,352 $246,068 $240,499 $-5,569 FTE 23 22 17 -5 S&E Cost $2,242 $2,272 $1,829 $-443HOUSING TOTAL Discretionary BA $423,656 $412,057 $404,246 $-7,811 FTE 466 479 461 -18 S&E Cost $48,068 $48,977 $48,403 $-574
OFFICE OF POLICY DEVELOPMENT AND RESEARCH Research and Technology Discretionary BA $6,718 $6,180 $8,698 $2,518 FTE 35 35 36 1 S&E Cost $6,773 $6,879 $7,192 $313
OFFICE OF FAIR HOUSING AND EQUAL OPPORTUNITY Other FHEO Programs FTE 57 57 61 4 S&E Cost $5,766 $5,989 $6,639 $650
DEPARTMENTAL EQUAL EMPLOYMENT OPPORTUNITY FTE 24 26 26 0 S&E Cost $2,892 $3,228 $3,334 $106
DEPARTMENTAL MANAGEMENT FTE 185 163 171 8 S&E Cost $23,046 $22,225 $22,707 $482
93

PERFORMANCE AND ACCOUNTABILITY REPORT
Strategic Goal EM: Embrace High Standards of Ethics, Management, and Accountability. Budget Authority (BA) and Salaries and Expenses (S&E) are in thousands of dollars. Full Time Equivalents (FTE) represent the equivalent number of paid positions.
2005Actual
2006 Approp.
2007Request
2006vs. 2007
CHIEF FINANCIAL OFFICER FTE 226 218 215 -3 S&E Cost $36,309 $43,197 $40,407 $-2,790
GENERAL COUNSEL FTE 660 681 673 -8 S&E Cost $77,154 $83,415 $85,337 $1,922
ADMINISTRATION AND STAFF SERVICES FTE 679 640 633 -7 S&E Cost $245,103 $246,719 $250,254 $3,535
FIELD POLICY AND MANAGEMENT FTE 483 424 419 -5 S&E Cost $54,163 $48,488 $49,599 $1,111
WORKING CAPITAL FUND FTE 344 347 314 -33 S&E Cost $319,154 $246,659 $289,331 $42,672
Total for Strategic Goal EM Discretionary BA $2,561,901 $2,567,461 $2,566,687 $-774
FTE 3,382 3,293 3,231 -62 S&E Cost $843,625 $781,824 $829,890 $48,066
OFFICE OF INSPECTOR GENERAL
FTE 637 634 630 -4 S&E Cost $103,037 $104,940 $107,000 $2,060
Strategic Goal FC: Promote Participation of Faith-Based and Community Organizations. Budget Authority (BA) and Salaries and Expenses (S&E) are in thousands of dollars. Full Time Equivalents (FTE) represent the equivalent number of paid positions.
2005Actual
2006Approp.
2007Request
2006 vs.2007
HOUSING FHA-GI/SRI Discretionary BA $0 $0 $274 $274 FTE 0 0 1 1 S&E Cost $0 $0 $106 $106
94
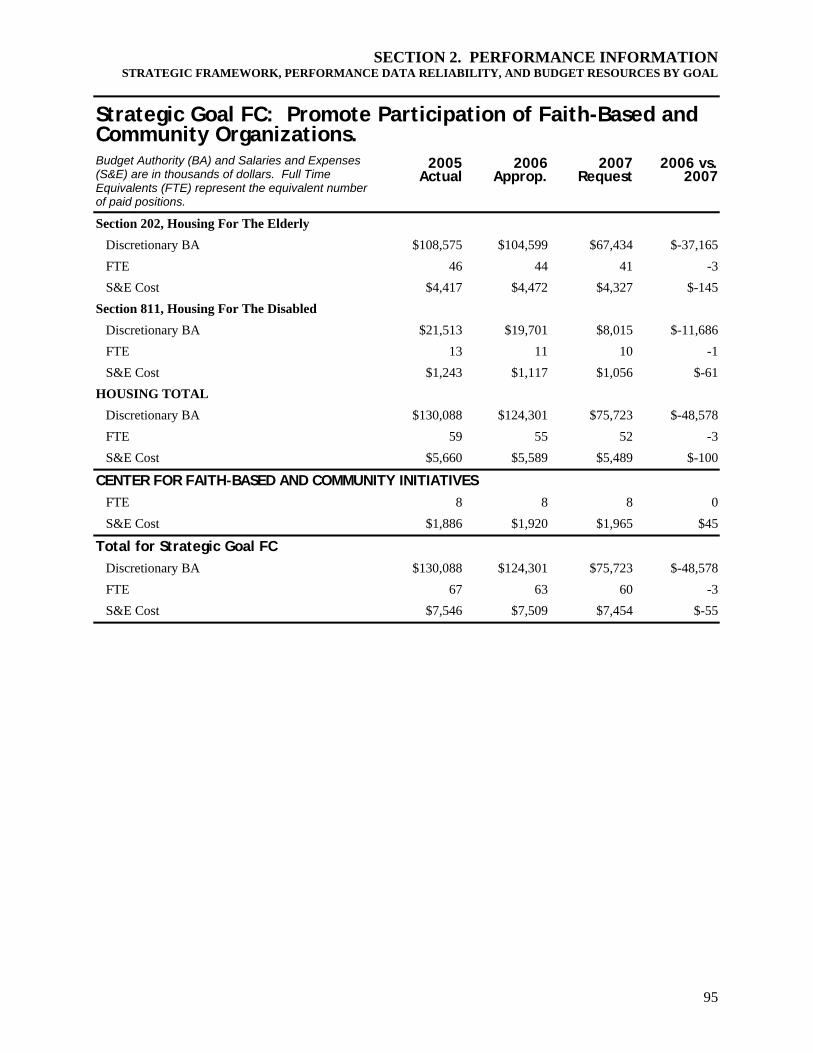
SECTION 2. PERFORMANCE INFORMATION STRATEGIC FRAMEWORK, PERFORMANCE DATA RELIABILITY, AND BUDGET RESOURCES BY GOAL
Strategic Goal FC: Promote Participation of Faith-Based and Community Organizations. Budget Authority (BA) and Salaries and Expenses (S&E) are in thousands of dollars. Full Time Equivalents (FTE) represent the equivalent number of paid positions.
2005Actual
2006Approp.
2007Request
2006 vs.2007
Section 202, Housing For The Elderly Discretionary BA $108,575 $104,599 $67,434 $-37,165 FTE 46 44 41 -3 S&E Cost $4,417 $4,472 $4,327 $-145Section 811, Housing For The Disabled Discretionary BA $21,513 $19,701 $8,015 $-11,686 FTE 13 11 10 -1 S&E Cost $1,243 $1,117 $1,056 $-61HOUSING TOTAL Discretionary BA $130,088 $124,301 $75,723 $-48,578 FTE 59 55 52 -3 S&E Cost $5,660 $5,589 $5,489 $-100
CENTER FOR FAITH-BASED AND COMMUNITY INITIATIVES FTE 8 8 8 0 S&E Cost $1,886 $1,920 $1,965 $45
Total for Strategic Goal FC Discretionary BA $130,088 $124,301 $75,723 $-48,578 FTE 67 63 60 -3 S&E Cost $7,546 $7,509 $7,454 $-55
95

PERFORMANCE AND ACCOUNTABILITY REPORT
96
Goal H: Increase Homeownership Opportunities Strategic Objectives:
H1 Expand national homeownership opportunities.
H2 Increase minority homeownership.
H3 Make the homebuying process less complicated and less expensive.
H4 Fight practices that permit predatory lending.
H5 Help HUD-assisted renters become homeowners.
H6 Keep existing homeowners from losing their homes.
PERFORMANCE REPORT CARD – GOAL H
Performance Indicators FY 2003 Actual
FY 2004 Actual
FY 2005 Actual
FY 2006 Actual
FY 2006 Target
Met or Missed Notes
H1.1 Improve National homeownership opportunities. 68.4% 69.0% 68.8% 69.0% N/A N/A c,d
H1.2 The share of all homebuyers who are first-time homebuyers. 39.1% N/A 38.1% N/A N/A N/A c,e
H1.3 The number of FHA single family mortgage insurance endorsements nationwide. 1,338 997 556 502 N/A N/A c,j
H1.4 The share of first-time homebuyers among FHA home-purchase endorsements is 71 percent. 77.1% 72.8% 79.3% 79.3% 71.0% Met
H1.5 GNMA securitizes at least 90 percent of eligible single family fixed-rate FHA loans. 92.4% 87.3% 92.7% 91.4% 90% Met
H1.6 At least 30 percent of clients receiving pre-purchase counseling will purchase a home or become mortgage-ready within 90 days. 45.0% 42.2% 37.1% 37.1% 30% Met i
H1.7 The number of homebuyers who have been assisted with HOME is maximized. 25,867 30,780 32,307 55,652 33,501 Met
H1.8 The number of homeowners who have used sweat equity to earn assistance with Self-Help Homeownership Opportunity Program funding reaches 1,500. 2,157 1,735 2,277 1.868 1,500 Met f
H1.9 The FHA Mutual Mortgage Insurance Fund meets Congressionally mandated capital reserve targets. 5.21% 5.53% 6.02% 6.82% 2.0% Met
H1.10 The share of FHA-insurable real estate-owned properties that are sold to owner-occupants is 90.0 percent. 61.5% 54.6% 85.1% 89.8% 90.0% Missed
H1.11 HUD will continue to monitor and enforce Fannie Mae’s and Freddie Mac’s performance in meeting or surpassing HUD-defined targets for low-and moderate-income mortgage purchases.
Fannie Mae 51.8% 52.3% 53.4% 55.1% 52.0% Met f
Freddie Mac 50.5% 51.2% 52.5% 54.0% 52.0% Met f

SECTION 2. PERFORMANCE INFORMATION INCREASE HOMEOWNERSHIP OPPORTUNITIES
97
PERFORMANCE REPORT CARD – GOAL H
Performance Indicators FY 2003 Actual
FY 2004 Actual
FY 2005 Actual
FY 2006 Actual
FY 2006 Target
Met or Missed Notes
H1.12 The number of households receiving homeownership assistance and homeowners receiving housing rehabilitation assistance from the Community Development Block Grant, the Indian Housing Block Grant, and the Native Hawaiian Housing Block Grant. N/A 120,690 140,189 145,116 132,417 Met
H2.1 The homeownership rate among targeted households. 49.3 50.9% 51.2% 51.7% N/A N/A c,d
H2.2 The gap in homeownership rates of minority and non-minority households. 25.9% 25.0% 24.6% 24.6% N/A N/A c,d
H2.3 The mortgage disapproval rates of minority applicants. 13.7% 15.4% 16.5% 18.4% N/A N/A c
H2.4 The share of first-time minority homebuyers among FHA home purchase-endorsements is 35 percent. 37.6% 37.2% 34.4% 31.7% 35.0% Missed
H2.5 HUD will continue to monitor and enforce Fannie Mae’s and Freddie Mac’s performance in meeting or surpassing HUD-defined targets for mortgages financing special affordable housing.
Fannie Mae 21.4% 21.2% 23.6% 26.3% 22.0% Met f
Freddie Mac 20.4% 21.4% 23.0% 24.3% 22.0% Met f
H2.6 Minority clients are at least 50 percent of total clients receiving housing counseling in FY 2006. 50.9% 49.6% 58.4% 58.4% 50% Met i
H2.7 Section 184A mortgage financing of $6 million is guaranteed for Native Hawaiian homeowners. N/A N/A $1.7 $0.2 $6.0 Missed k
H2.8 Section 184 mortgage financing of $120 million is guaranteed for Native American homeowners. $27.2 $62.3 $76.8 $172.2 $120.0 Met k
H3.1 Respond to 1,000 inquiries and complaints from consumers and industry regarding the Real Estate Settlement Procedures Act and the home buying and mortgage loan process. 1,000 1,244 1,245 1,355 1,000 Met
H4.1 FHA increases the percentage of at-risk loans that substantively comply with FHA program requirements. 83% 88% 89% 95% 85% Met
H5.1 Increase the cumulative homeownership closings under the homeownership option of the Housing Choice Voucher/Housing Certificate Fund to 6,000 by the end of FY 2006. 1,500 2,052 5,121 7,528 6,000 Met
H5.2 By FY 2006, public housing agencies with Resident Opportunity and Self Sufficiency (ROSS) grants increase by 10 percent the number of public housing residents who receive homeownership supportive services. N/A N/A N/A 88.0% 10.0% Met h
H5.3 HUD works to expand public housing agencies’ use of the Section 32 homeownership program, resulting in the submission of 12 proposals in FY 2006. N/A N/A N/A 16 12 Met
H6.1 Loss mitigation claims are 50 percent of total claims on FHA-insured single-family mortgages. 50.0% 54.2% 59.1% 61.0% 50.0% Met
H6.2 More than 50 percent of total mortgagors seeking help with resolving or preventing mortgage delinquency will successfully avoid foreclosure. 47.1% 60.0% 68.1% 68.1% 50.0% Met i

PERFORMANCE AND ACCOUNTABILITY REPORT
Notes: a Data not available. b No performance goal for this fiscal year. c Tracking indicator. d Third quarter of calendar year (last quarter of fiscal
year; not the entire fiscal year). e Calendar year beginning during the fiscal year shown. f Calendar year ending during the fiscal year shown. g Result too complex to summarize. See indicator. h Baseline newly established. i Result is estimated. j Number is in thousands. k Number reported in millions. l Number reported in billions.
98

SECTION 2. PERFORMANCE INFORMATION INCREASE HOMEOWNERSHIP OPPORTUNITIES
Objective H1: Expand national homeownership opportunities. H1.1: Improve national homeownership opportunities. Background. The overall homeownership rate represents the share of the nation’s households that have achieved the “American dream” outcome – homeownership. Providing expanded opportunities for homeownership to all Americans, with an emphasis on minority families and other disadvantaged groups, is a Presidential priority. Homeownership is recognized for building wealth and encouraging commitment to communities and good citizenship. A significant number of HUD’s programs support increases in the homeownership rate. However, a FY 2006 performance target was not established for this tracking indicator because of the substantial limits in HUD’s span of control relative to economic factors.
O verall Homeow nership Rate( 3 rd quarter )
69.0%68.8%69.0%
68.4%
64%
66%
68%
70%
2003 2004 2005 2006
Program website: http://www.huduser.org/periodicals/ushmc.html
Results, impact, and analysis. The national homeownership rate for all households was 69.0 percent at the end of FY 2006, up 0.2 percentage point from the end of FY 2005, and equivalent to the record third-quarter rate set in 2004. Young married-couple households experienced some of the greatest gains, as their 63.7 percent homeownership rate was up 1.2 percentage points from a year earlier. Central city households, minority households, and female-headed households all experienced homeownership increases of 0.5 percentage point or more compared with the end of FY 2005.
The positive result came as rapid annual home price increases slowed. The median price of a new home sold in September 2006, at $217,100, was 9.7 percent less than the median price a year earlier, while the median existing home, at $220,000, cost 2.3 percent less than the median price a year earlier. However, prices remain financially challenging for many families. The composite affordability index worsened from 112.9 in 2005 to 105.2 during the second quarter of 2006, reflecting a smaller cushion between the median family income and the qualifying income for purchasing the median-priced home.
Each 0.1 percentage point increase in the national homeownership rate translates to about 100,000 new homeowners (if total households remain constant). Such results are well within the scope of HUD program impacts reported through a number of performance indicators. For example, FHA had approximately $395.8 billion of mortgage insurance in force at the end of FY 2006, of which 80.08 percent was supporting homeownership through the Mutual Mortgage Insurance fund. Nevertheless, demographic and economic factors may limit the rate of progress in the near term.
Data discussion. The measure is based on averages of monthly Current Population Survey data for the third quarter (the last quarter of the fiscal year). The Current Population Survey data are
99

PERFORMANCE AND ACCOUNTABILITY REPORT
free of limitations affecting the measure’s reliability. Changes in estimated rates that exceed 0.25 percentage point are statistically significant with 90 percent confidence.
H1.2: The share of all homebuyers who are first time homebuyers. Background. Sustaining the rate of first-time home purchases among homebuyers is a key to increasing homeownership rates. This is a tracking indicator with no numeric target for FY 2006, reflecting the dominant impact of the macro-economy compared with HUD’s limited span of control over the outcome.
Results, impact, and analysis. The most recent available data show that during calendar year 2005, 38.1 percent of homebuyers were first time homebuyers. This reflects a decrease of 1.0 percentage point from the proportion observed in 2003, and a further decline from 2001 results.
The outcome is consistent with the rapid home price appreciation and resulting deterioration of affordability observed since 2001. The “composite affordability index” declined from 128.1 in 2001 to 114.6 in 2005, even while mortgage interest rates bottomed out in mid-2005. The decline in the index implies a smaller cushion between the median family income and the qualifying income needed to purchase the median-priced home. The index fell further during the rest of FY 2006.
Sha r e of Hom e buy e r swho a r e F ir st - T im e Hom e buy e r s
39.1%41.3%
38.1%
35%
45%
2001 2003 2005perc
ent
of h
omeb
uyer
shom ebuyers (of preceding yr ) who arefir st- t im e hom ebuyers
t t l
HUD programs continue to play an important role in mitigating the difficulties of purchasing a first home. Homeownership vouchers and the American Dream Downpayment Initiative, in particular, help households overcome their lack of savings for a downpayment. FHA mortgage insurance assisted 333,000 homebuyers during 2005, including many that lenders might consider uncreditworthy without the FHA endorsement.
Data discussion. This measure uses data from the biennial American Housing Survey. The data represent homeowners who reported, during the (odd) years shown, that they moved during the previous (even) years. This offset allows the data to represent a complete year and avoids seasonal distortions, because odd-year home buyers who moved after they were surveyed would not be represented. Information on first-time status was missing for 4.4 percent of homebuyers surveyed in 2003, so those households are excluded. During 2002, HUD contractors completed a study that verified and validated the American Housing Survey for purposes of mortgage market and housing finance analysis. Researchers assessed the replicability, internal consistency, and reliability of AHS estimates, and found the data generally reliable.
H1.3: The number of FHA single family mortgage insurance endorsements nationwide. Background. This is a tracking indicator. FHA insures mortgages issued by private lenders, increasing access to mortgage capital to increase homeownership opportunities. This indicator tracks FHA’s contribution to the homeownership rate through the annual volume of FHA-insured single family mortgage loans. It is a key component of the Department’s priority outcome of
100

SECTION 2. PERFORMANCE INFORMATION INCREASE HOMEOWNERSHIP OPPORTUNITIES
improving the national homeownership rate and fulfilling the President and Secretary’s commitment to create 5.5 million new minority homeowners by 2010. This indicator has important implications for first-time and minority homeownership in addition to overall homeownership because a significant proportion of FHA participants are first time minority homeowners (see indicators H1.4 and H2.4).
While the number of FHA single family mortgage endorsements is a key measure of HUD’s contribution to homeownership, the actual endorsement rate achieved during FY 2006 continued to be affected by market forces outside of HUD’s control. Balancing the importance of reporting this key measure of HUD’s activity with an appreciation of the substantial role of the market in the final result, the Department decided to track the number of endorsements, but not establish a numeric goal for FY 2006.
Program website: http://www.hud.gov/offices/hsg/sfh/hsgsingle.cfm
Results, impact, and analysis. During FY 2006, FHA endorsed 502,049 single family mortgages for insurance. Although no goal had been established for FY 2006, this result represents a decrease from the level of endorsement activity that took place during FY 2005 (555,717 mortgage insurance endorsements). The decrease in single family endorsement levels from FY 2005 to FY 2006 was largely attributable to increasing mortgage interest rates and a slowing real estate market. Contributing factors include a reduced number of mortgage re-finance transactions, which constitute 22.2 percent of total volume in FY 2006 compared with 28.5 percent in FY 2005.
FHA Single- Family Mortgage Endorsements
1,338
502556
997
500
1,000
1,500
2003 2004 2005 2005
thou
sand
s
FHA also faces strong competition from the sub-prime, non-prime and conventional mortgage markets. While rising interest rates and a slowing real estate market are beyond FHA’s control, a portion of market share has been lost due to structural limitations imposed on FHA by restrictive laws, some dating back to 1934. To address this situation, FHA is taking bold steps to recapture a portion of the market that it has traditionally served, i.e. low to moderate-income homebuyers in need of safe and affordable home financing. Legislation has been approved by the House of Representatives and is awaiting Senate approval. Passage of this legislation will reduce statutory barriers and increase FHA’s flexibility to respond to changes in the marketplace. As a result, FHA will be able to reach more prospective homebuyers and provide an alternative to sub-prime loans with high interest rates, closing costs, and expensive prepayment penalties.
Data discussion. Data for this indicator are drawn from FHA’s Single Family Housing Enterprise Data Warehouse, based on the Computerized Homes Underwriting Management System. There are no data deficiencies affecting this measure. Direct-endorsement lenders enter FHA data into the Computerized Homes Underwriting Management System with monitoring by FHA.
101

PERFORMANCE AND ACCOUNTABILITY REPORT
H1.4: The share of first-time homebuyers among FHA home purchase endorsements is 71 percent. Background. FHA is a major source of mortgage financing for first time buyers as well as for minority and lower income buyers. HUD will help achieve the outcome of increasing the overall homeownership rate, as well as reduce the homeownership gap between whites and minorities, by maximizing FHA endorsements for first time homebuyers. This indicator tracks the share of first time homebuyers among FHA endorsements for home purchases – thus excluding loans made for home improvements. The FY 2006 goal is to ensure that 71 percent of home purchase mortgages endorsed for insurance by FHA are to first-time homebuyers.
Program website: http://www.hud.gov/offices/hsg/sfh/hsgsingle.cfm
Results, impact, and analysis. During FY 2006, 79.3 percent of home purchase endorsements were made to first time homebuyers, exceeding the FY 2006 goal of 71 percent, as well as the 79.0 percent of endorsements to first-time homebuyers achieved in FY 2005. Despite declines in the total level of FHA’s single family business, FHA continues to concentrate business efforts toward first time homebuyers, enabling FHA to meet this goal. FHA will continue its efforts to reach prospective first time homebuyers through participation in conferences, seminars, outreach events, and by working with other organizations within HUD to support the use of Community Development and HOME Investment Partnerships block grant funding for homeownership activities.
FHA Home Purchase Endorsements for First- Time Homebuyers
79.0% 79.3%
72.8%
77.1%
71.0%
65%
70%
75%
80%
2003 2004 2005 2006
perc
ent
of p
urch
aser
s
f ir st- t im e hom ebuyersoutput goal
Data discussion. Data for this performance indicator are drawn from FHA’s Single Family Housing Enterprise Data Warehouse, based on the Computerized Homes Underwriting Management System. FHA data on first time buyers are more accurate than estimates of first time buyers in the conventional market. FHA data are entered by direct endorsement lenders with monitoring by FHA.
H1.5: Ginnie Mae securitizes at least 90 percent of eligible single family fixed-rate FHA loans. Background. Formed by Congress in 1968 as the Government National Mortgage Association, Ginnie Mae is a wholly owned instrumentality of the United States government located within HUD. Section 306(g) of the National Housing Act authorizes Ginnie Mae to facilitate the financing of residential mortgage loans insured or guaranteed by the Federal Housing Administration, the Department of Veterans Affairs, and the Rural Housing Service.
Under the terms of its Mortgage-Backed Securities program, Ginnie Mae guarantees the timely payment of principal and interest on pools of federally-insured or guaranteed mortgages. Ginnie Mae’s obligations are backed by the full faith and credit of the United States. The program has been a significant contributor to the growth of the mortgage-backed securities market in the United States as well as to the expansion of homeownership opportunities for American families. Ginnie Mae’s participation in the capital markets of our nation has provided an efficient link
102
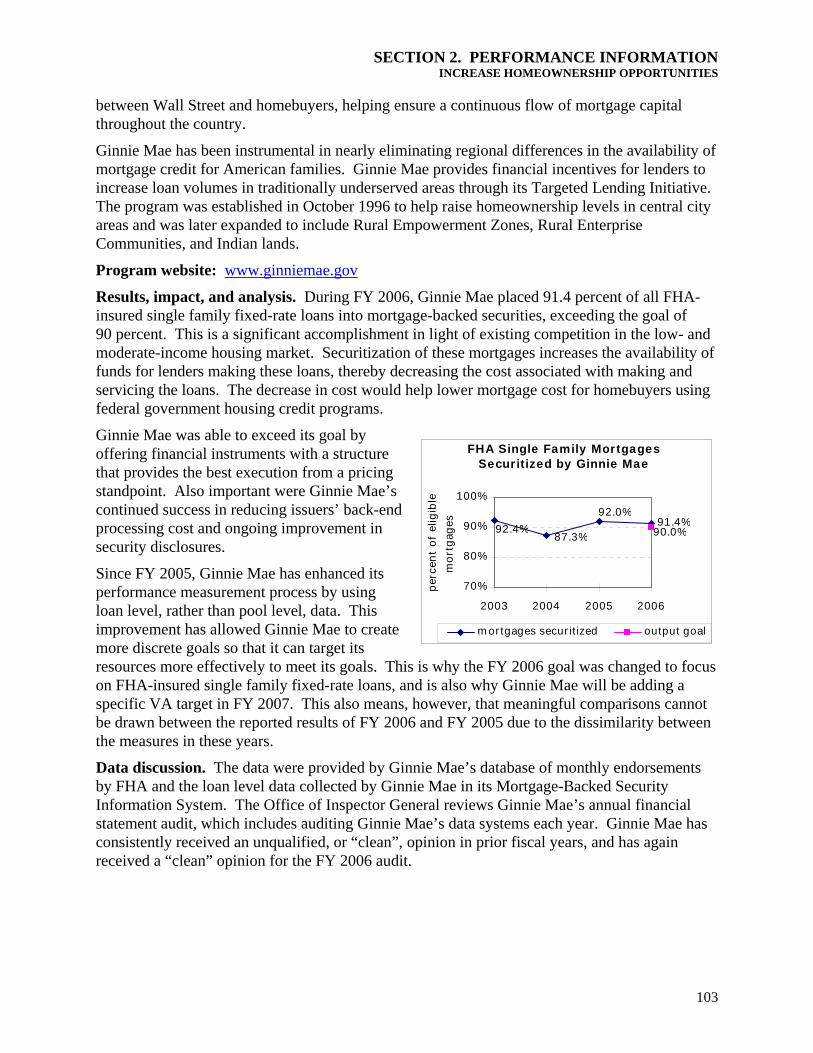
SECTION 2. PERFORMANCE INFORMATION INCREASE HOMEOWNERSHIP OPPORTUNITIES
between Wall Street and homebuyers, helping ensure a continuous flow of mortgage capital throughout the country.
Ginnie Mae has been instrumental in nearly eliminating regional differences in the availability of mortgage credit for American families. Ginnie Mae provides financial incentives for lenders to increase loan volumes in traditionally underserved areas through its Targeted Lending Initiative. The program was established in October 1996 to help raise homeownership levels in central city areas and was later expanded to include Rural Empowerment Zones, Rural Enterprise Communities, and Indian lands.
Program website: www.ginniemae.gov
Results, impact, and analysis. During FY 2006, Ginnie Mae placed 91.4 percent of all FHA-insured single family fixed-rate loans into mortgage-backed securities, exceeding the goal of 90 percent. This is a significant accomplishment in light of existing competition in the low- and moderate-income housing market. Securitization of these mortgages increases the availability of funds for lenders making these loans, thereby decreasing the cost associated with making and servicing the loans. The decrease in cost would help lower mortgage cost for homebuyers using federal government housing credit programs.
Ginnie Mae was able to exceed its goal by offering financial instruments with a structure that provides the best execution from a pricing standpoint. Also important were Ginnie Mae’s continued success in reducing issuers’ back-end processing cost and ongoing improvement in security disclosures.
Since FY 2005, Ginnie Mae has enhanced its performance measurement process by using loan level, rather than pool level, data. This improvement has allowed Ginnie Mae to create more discrete goals so that it can target its resources more effectively to meet its goals. This is why the FY 2006 goal was changed to focus on FHA-insured single family fixed-rate loans, and is also why Ginnie Mae will be adding a specific VA target in FY 2007. This also means, however, that meaningful comparisons cannot be drawn between the reported results of FY 2006 and FY 2005 due to the dissimilarity between the measures in these years.
FHA Single Family Mortgages Securitized by Ginnie Mae
92.4%87.3%
92.0%91.4%
90.0%
70%
80%
90%
100%
2003 2004 2005 2006
perc
ent
of e
ligib
lem
ortg
ages
m or tgages secur it ized output goal
Data discussion. The data were provided by Ginnie Mae’s database of monthly endorsements by FHA and the loan level data collected by Ginnie Mae in its Mortgage-Backed Security Information System. The Office of Inspector General reviews Ginnie Mae’s annual financial statement audit, which includes auditing Ginnie Mae’s data systems each year. Ginnie Mae has consistently received an unqualified, or “clean”, opinion in prior fiscal years, and has again received a “clean” opinion for the FY 2006 audit.
103

PERFORMANCE AND ACCOUNTABILITY REPORT
H1.6: At least 30 percent of clients receiving pre-purchase counseling will purchase a home or become mortgage-ready within 90 days. Background. HUD continues to emphasize the critical role of counseling in the home buying process. Clients tracked through this indicator include those receiving housing counseling for pre-purchase reasons, including clients who are preparing to purchase a home or working to become mortgage-ready. The FY 2006 goal was to ensure that at least 30 percent of clients receiving pre-purchase counseling achieve the outcome goal of purchasing a home or becoming mortgage-ready within 90 days. Depending on the state of the economy and the housing market, demand for various types of counseling rises and falls, and may vary for reasons outside of HUD’s control. The Department is confident, however, that HUD-approved agencies continue to provide quality counseling services that will help clients resolve their housing problems regardless of how many clients are served in a given year. As a result, HUD recently revised this indicator to focus on outcomes associated with clients receiving pre-purchase counseling rather than the number of clients served.
Program website: http://www.hud.gov/offices/hsg/sfh/hcc/hcc_home.cfm
Results, impact, and analysis. Although actual FY 2006 results are not yet available, HUD anticipates 37.1 percent of clients receiving pre-purchase counseling from HUD-approved agencies to purchase a home or become mortgage-ready within 90 days. This projection represents the actual results from FY 2005 and would exceed the FY 2006 goal o30 percent. With increased training and outreach and continuous efforts to improve efficiency and effectiveness there is no reason to anticipate a decrease in program pin FY 2006. The final housing counseling activity data needed to report this measure will become available early in FY 2007. During FY 2005, HUD achieved a success rate of 37 percent of clients served becoming homeowmortgage ready within 90 days. HUD-approved housing counseling agencies are given 90 days following the end of a fiscal year to report the results of counseling activity for that fiscal year and to submit requests to HUD for reimbursement for counseling services provided.
Data discu
f
erformance
ners or
ssion. HUD collects data on clients receiving pre-purchase counseling through the e
a
g
Pre- Counseled HouseholdsW ho Purchased Homes
37.1%45.0% 42.2% 37.1% 30.0%0%
50%
100%
2003 2004 2005 2006
pct
of H
Hs
coun
sele
d
households avoiding foreclosure (new form )
outcom e goal
households avoiding foreclosure (projected)
Housing Counseling System (HCS – F11). The data include the total number of clients, the typof counseling they received, and the results of the counseling. An independent assessment in 2005 showed that the Housing Counseling System performance indicator data passed six-sigmquality tests (fewer than 3.4 errors per million) for validity, completeness, and consistency. A limitation of the data collection instrument is that it does not differentiate the level of counselingiven to each client while the scope and sophistication of counseling may vary significantly. To improve the quality of housing counseling information that is used by HUD, the Department is inthe process of implementing a new automated data collection instrument that will enable it to collect client-level data beginning in FY 2007.
104

SECTION 2. PERFORMANCE INFORMATION INCREASE HOMEOWNERSHIP OPPORTUNITIES
H1.7: The number of homebuyers who have been assisted with HOME is maximized. Background. This indicator tracks the number of homebuyers assisted by the HOME Investment Partnerships program and its American Dream Downpayment Initiative in FY 2006. The output tracked by this indicator shows the potential contribution to be made by the HOME Investment Partnerships program and the American Dream Downpayment Initiative toward increasing the national homeownership rate and the number of minority homeowners, two key Presidential and Secretarial priorities. The HOME Investment Partnerships program gives states and local communities flexibility to meet their housing needs in a variety of ways. Many participating jurisdictions choose to use their funds to promote homeownership, both by helping low-income families to purchase homes and by rehabilitating existing owner-occupied units, reducing the possibility that these homeowners could lose their homes.
The American Dream Downpayment Initiative component of the HOME Investment Partnerships program provides downpayment assistance to expand homeownership. The FY 2007 Annual Performance Plan (see Appendix A) revised the FY 2006 goal for the American Dream Downpayment Initiative from 10,000 units to 7,500 to reflect the dramatic reduction in funding for this Initiative in both FY 2005 and FY 2006.
Program website: http://www.hud.gov/offices/cpd/affordablehousing/programs/home/index.cfm
Results, impact, and analysis. During FY 2006, participating jurisdictions used HOME funds to completed 55,652 new homebuyer units and/or directly assisted homebuyer households, exceeding the goal of 33,501 by 66 percent. The American Dream Downpayment Initiative component contributed 9,096 homebuyer units, which is 21 percent more than the target. In addition, these results are a 72 percent increase (23,345) over the 32,307 households assisted in FY 2005.
Also during FY 2006, participating jurisdictions used HOME funds to complete 16,821 existing homeowner rehabilitation units. This exceeds the FY 2006 goal of 9,220 units by 82 percent or 7,601 units. It also represents a 13 percent increase in completions compared to the FY 2005 level of 1,989 units. The number of minority households assisted also exceeded the revised FY 2006 goal of 17,420 households by 47 percent or 8,202 households, with 25,622 minority households becoming homeowners through HOME assistance in FY 2006.
HOUSEHOLDS ASSISTED THROUGH HOME
FY 2002 FY 2003 FY 2004 FY 2005
FY 2006
FY 2006goal
New Homebuyers, not Down Payment Initiative
23,241 25,867 28,517 23,413 46,556 26,001
New Homebuyers, Down Payment Initiative
NA NA 2,263 8,894 9,096 7,500
Minority Homebuyers Assisted 14,774 15,507 25,622 17,420
Existing-homeowner rehabilitation 10,112 14,832 16,821 9,220
The greatly improved results are due in large part to an aggressive effort by HUD headquarters and field offices to speak directly to participating jurisdictions about performance, and to follow-up with participating jurisdictions that were shown to be lagging in performance or the reporting of their performance to HUD. Consequently, a significant portion of the increase in units
105

PERFORMANCE AND ACCOUNTABILITY REPORT
produced can be attributed to more accurate reporting on activities completed in previous years. As part of this effort, fifteen training conferences focusing on performance measurement were held with grantees over the summer of 2006. Over 3,000 representatives from HUD formula grantees attended. In addition, at least eight on-site one-on-one trainings were conducted with poorly performing HOME participating jurisdictions. HUD issues monthly production reports and a quarterly HOME Program Performance SNAPSHOT to identify these poorly performing participating jurisdictions. The SNAPSHOTs compare the performance of HOME participating jurisdictions to each other for eight factors and assign a performance ranking. The SNAPSHOTs have succeeded in focusing attention on production and the completion of units. The new “Open Activities Report,” as the name indicates, directs participating jurisdictions to their open activities and assists them in completing them. In continuation of this effort, a new performance report, the HOME Dashboard, directed at state and local elected officials and intended to focus their attention on the use of HOME funds in the production of affordable housing in their jurisdictions, will be released in the first quarter of FY 2007.
The accomplishment of this output indicator is affected by several external factors: the level of annual HOME and American Dream Initiative appropriations, the number of new, and inexperienced, participating jurisdictions entering the program, the choices that participating jurisdictions make among their competing housing needs, fiscal conditions affecting State and local government program staffing levels, and general economic conditions affecting the cost and availability of housing and the income levels of potential homebuyers.
Participating jurisdictions disbursed a total of $723.4 million on homebuyer units completed during FY 2006. The per-unit HOME cost of providing a homebuyer unit ($11,329) increased compared to FY 2005 by $738 or 6.9 percent.
Data discussion. Data for the HOME Investment Partnerships program are reported in HUD’s Integrated Disbursement and Information System. During the second quarter of FY 2006, the Department deployed new outcome performance measures in the system, including several new measures for HOME. Data entered by participating jurisdictions in HUD’s Integrated Disbursement and Information System are used to track quarterly performance.
H1.8: The number of homeowners who have used sweat equity to earn assistance with Self-Help Homeownership Opportunity Program funding reaches 1,500. Background. This indicator tracks the number of housing units completed during the period July 1, 2005, to June 30, 2006 by national and regional nonprofit organizations and consortia receiving Self-Help Homeownership Opportunity Program funds. Accomplishments for the fourth quarter of FY 2006 were not available in time for publication of this report. The output tracked by this indicator also contributes toward increasing the national homeownership rate and the number of minority homeowners, two key Presidential and Secretarial priorities. The program assists households who would not otherwise be able to afford their own homes.
Program website: www.hud.gov/offices/cpd/affordablehousing/programs/shop/index.cfm
Results, impact, and analysis. During the one-year period ending June 30, 2006, Self-Help Homeownership Opportunity Program grantees completed 1,868 housing units, exceeding the program goal of 1,500 units by 368, or 25 percent. Because HUD increased the allowable per-unit average investment of Self-Help Homeownership Opportunity Program funds from $10,000 to $15,000 per property for FY 2006, the results represent an 18 percent decrease from the
106

SECTION 2. PERFORMANCE INFORMATION INCREASE HOMEOWNERSHIP OPPORTUNITIES
2,277 units produced in FY 2005. Another 2,000 Self-Help Homeownership Opportunity Program units were under development at the close of the period. The five Self-Help Homeownership Opportunity Program grantees in FY 2006 were Habitat for Humanity, the Housing Assistance Council, Community Frameworks, ACORN Housing Corporation, and PPEP Microbusiness and Housing Development Corp.
The achievement of this output indicator is directly affected by several external factors: the cost and availability of land, the level of Self-Help Homeownership Opportunity Program appropriations, the “pass-through” nature of program funds to local affiliates, the level of sophistication of local organizations in developing and managing self-help housing, and the varying skill levels of the homebuyers and volunteers who work on the construction of the homes. During FY 2006, HUD continued to provide technical assistance upon request to grantees to improve the efficiency and capacity of the program.
Hom e owne r s W ho Com bine d Swe a t Equity w ith SHOP Assista nce
1,500
2,2771,8681,7352,157
0
1,500
3,000
2003 2004 2005 2006
par ticipating hom eownersoutput goal
Data discussion. Reports compiled by Self-Help Homeownership Opportunity Program grantees are used to track performance under this indicator. HUD headquarters staff monitors grantees to ensure that reported accomplishments are accurate.
H1.9: The FHA Mutual Mortgage Insurance Fund meets congressionally mandated capital reserve targets. Background. FHA’s Mutual Mortgage Insurance Fund pays all expenses, including insurance claims, incurred under FHA’s basic single family mortgage insurance program. Tinsurance program and fund are expected to beentirely self-financing from up-front and annuainsurance premiums paid by borrowers obtaining FHA mortgage loans as well as from earnings on fund assets. Because the Department is expected to operate the program in an actuarially sound way, the fund is subject to an annual actuarial review. The review assesses the fund’s current economic value, its capital ratio, and its ability to provide homeownership opportunities while remaining self-sustaining based on current and expected future cash flows. The capital ratio is an important indicator of the fund’s financial soundness and of its continuing ability to make homeownership affordable to renters even when economic downturns increase insurance claims. The economic value is defined as the sum of FHA’s capital resources plus the net present value of expected future cash flows (resulting from premium collections, asset earnings, and insurance claim losses). The capital ratio is the current economic value divided by the unamortized insurance-in-force.
Capital Ratio for FHA Mutual Mortgage I nsurance Fund
5.21% 5.53% 6.02%6.82%
2.00%0%
2%
4%
6%
8%
2003 2004 2005 2006
capital ratio output goal
he l
107

PERFORMANCE AND ACCOUNTABILITY REPORT
Results, impact, and analysis. The fund’s capital ratio was 6.82 percent for FY 2006. The ratio exceeded the FY 2005 result of 6.02 percent by 0.80 percentage points. The congressionally mandated goal of 2 percent was surpassed, as it has been since FY 1995. For FY 2006, the economic value rose by 1.85 percent to $22.7 billion. The capital ratio rose as its denominator – insurance-in-force – decrease 10.0 percent from the FY 2005 level. FHA’s insurance-in-force fell because mortgage refinancing slowed as interest rates began to rise, but also because house price appreciation outpaced income growth, and many potential FHA borrowers turned to risky subprime products to increase housing affordability. The Administration introduced FHA modernization legislation, currently under consideration by Congress, designed to increase FHA’s flexibility to offer these borrowers safer mortgage products at lower prices.
Data discussion. The measure is determined through the annual independent actuarial review of the Mutual Mortgage Insurance fund. The data are generated and solvency is assessed independently. FHA data are entered by direct-endorsement lenders and loan servicers with monitoring by FHA. The results are validated through the audit process.
H1.10: The share of FHA-insurable real-estate-owned properties that are sold to owner-occupants is 90 percent. Background. This indicator is a measure of the Department’s success in achieving the outcomes of expanding homeownership opportunities and helping stabilize neighborhoods. HUD acquires real-estate-owned properties when borrowers with FHA-insured single family mortgage loans cannot resolve their delinquencies, the properties are foreclosed upon and FHA pays mortgage insurance claims to lenders. The real-estate-owned properties held in HUD’s inventory are Department assets and provide a resource for increasing the availability of affordable homes to potential homebuyers. HUD intends to increase sales of its FHA-insurable real–estate-owned homes directly to families who will occupy them rather than to investors. The FY 2006 goal was to ensure that 90 percent of FHA-insurable real-estate-owned property sales are to owner-occupants.
Results, impact, and analysis. During FY 2006, 90 percent (2,378 of 2,648) of FHA-insurable real-estate-owned single family properties were sold to owner-occupants, thus meeting the goal, and exceeding the 85.1 percent (3,708 of 4,356) of FHA-insurable properties sold to owner occupants during FY 2005. The increase in real-estate-owned sales to owner occupants from FY 2005 levels may be attributable to a performance goal related to sales to owner-occupants in FHA’s new Management and Marketing contracts, which provided an opportunity to expand home ownership opportunities. Increased sales of real-estate-owned properties to owner occupants may also have been a result of fewer investors in the national housing market for the past year as interest rates have risen. Furthermore, efforts to increase FHA market share are expected to promote property sales to prospective owner-occupant purchasers.
Real- Estate- O w ned Property Soldto O w ner- O ccupants
85.1% 89.8%
54.6%
61.5%62.2%
54.2%
90.0%
50%
70%
90%
2001 2002 2003 2004 2005 2006
perc
ent
of R
EO s
ales
owner - occupants output goal
108

SECTION 2. PERFORMANCE INFORMATION INCREASE HOMEOWNERSHIP OPPORTUNITIES
Data discussion. The data for this indicator are from FHA’s Single Family Acquired Asset Management System. The data have no limitations affecting the reliability of this measure, and are used as a part of the overall monitoring of FHA’s portfolio and as a component of the internal controls of FHA. This performance indicator considers only properties that are in physical condition acceptable to qualify for FHA insurance at the time of sale. HUD regulations require that properties be sold as-is without repairs. By excluding sales of properties that, on the basis of their physical condition, are not appropriate for owner-occupant purchasers, FHA is able to measure the expansion of homeownership opportunities to this segment of the homebuyer market more effectively. Real-estate-owned data are covered by the Inspector General’s audit.
H1.11: HUD will continue to monitor and enforce Fannie Mae’s and Freddie Mac’s performance in meeting or surpassing HUD-defined targets for low- and moderate-income mortgage purchases. Background. Congress mandated that, as government-sponsored enterprises, the Federal National Mortgage Association (Fannie Mae) and the Federal Home Loan Mortgage Corporation (Freddie Mac) must achieve a number of public purpose goals, one of which ito expand homeownership opportunities for persons of low- and moderate-income. To ensure that this public purpose outcome is achieved, HUD regulations establish an annual performance standard – the low- and moderate-income goal – for mortgages purchased or guaranteed by the government-sponsored enterprises that serve low- and moderate-income families. These are families earning incomes at or below area medians.
Fa nnie Ma e Pe r for m a nce Re la t iv e to Low/ Mod Ta r ge t
55.1%51.8% 53.4%52.3%52.0%
30%
40%
50%
60%
2002 2003 2004 2005
perc
ent
of u
nits
low/ m od m or tgagesoutput goal
s
Beginning in calendar year 2005, HUD increased the low- and moderate-income goal from 50 percent to 52 percent. The low- and moderate-income goal will increase to 53 percent in calendar year 2006, 55 percent in calendar year 2007 and 56 percent in calendar year 2008. HUD also added a low- and moderate-income home purchase subgoal. The low- and moderate-income subgoal for calendar year 2005 was 45 percent; it will rise to 46 percent in calendar year 2006 and 47 percent in calendar years 2007 and 2008.
Fr e ddie Ma c Pe r for m a nce Re la t iv e to Low/ Mod Ta r ge t
51.2% 51.6%50.5%
54.0%52.0%
30%
40%
50%
60%
2002 2003 2004 2005
perc
ent
of u
nits
low/ m od m or tgagesoutput goal
Program website: http://www.hud.gov/offices/hsg/gse/gse.cfm
Results, impact, and analysis. In calendar year 2005, both Fannie Mae and Freddie Mac surpassed HUD’s target of 52 percent. Fannie Mae achieved 55.1 percent and Freddie Mac achieved 54.0 percent. Freddie Mac surpassed the subgoal of 45 percent at 46.8 percent while Fannie Mae fell short at 44.6 percent.
109

PERFORMANCE AND ACCOUNTABILITY REPORT
Although the government-sponsored enterprises may count both multifamily and single family purchases towards the low- and moderate-income target, both Fannie Mae and Freddie Mac achieve the majority of their performance through the purchase of loans on single family owner-occupied housing.
An analysis of the composition of units qualifying as low- and moderate-income purchases in 2005 shows that 836,000 dwelling units, or 66.4 percent of the dwelling units that qualified under Fannie Mae’s low- and moderate-income goal, served low-income families (i.e, families earning 80 percent or less of area median income). Freddie Mac purchased mortgages for 847,000 low-income dwelling units, or 64.5 percent of Freddie Mac’s qualifying purchases serving this market.
With regard to the minority composition of the government-sponsored enterprises’ low- and moderate-income performance, 18.5 percent of all single family dwelling units that qualified under Freddie Mac’s low- and moderate-income goal were for minority borrowers, including 14.3 percent that were for African-American and Hispanic borrowers. The corresponding percentages for Fannie Mae were 21.1 percent minority and 16.7 percent African-American and Hispanic.
Data discussion. The data reported for this goal are based on calendar year performance. There is a one year reporting lag because the government-sponsored enterprises report to HUD in the year following the performance year. In addition, because the government-sponsored enterprises’ quarterly data is confidential and proprietary, the Department is unable to disclose Fannie Mae’s and Freddie Mac’s goal performance for the current calendar year. To ensure the reliability of data, Fannie Mae and Freddie Mac apply various quality control measures to data elements provided to HUD. The Department verifies the data through comparison with independent data sources, replication of Fannie Mae’s and Freddie Mac’s goal performance reports, and reviews of their data quality procedures. Fannie Mae’s and Freddie Mac’s financial reports are verified by independent audits.
H1.12: The number of households receiving homeownership assistance and homeowners receiving housing rehabilitation assistance from the Community Development Block Grant, the Indian Housing Block Grant, and the Native Hawaiian Housing Block Grant. (Previously reported under A.1.2) Background. This indicator tracks homeownership assistance provided through a number of formula block grant and other programs. HUD has several other programs that contribute to homeownership and are discussed as separate indicators. They include the FHA single-family mortgage program, the Self-Help Opportunity Program (SHOP), and the Housing Counseling program.
CDBG: The CDBG program is a flexible block grant program that provides grantees broad discretion in their use of funds. A significant proportion of CDBG funding is used for housing rehabilitation, with a much smaller percentage used for homeownership assistance. For FY 2006, CDBG has separate goals for owner-occupied rehabilitation and assistance directly contributing to homeownership. The FY 2006 goal for owner-occupied rehabilitation is 115,525 households receiving assistance. The goal for direct homeownership assistance is 11,452 households assisted. Actual performance may vary because grantees, rather than HUD,
110

SECTION 2. PERFORMANCE INFORMATION INCREASE HOMEOWNERSHIP OPPORTUNITIES
are responsible for identifying the activities they will carry out each year with their block grant funds.
Indian Housing Block Grant: For FY 2005, HUD reported that the Indian Housing Block Grant program provided 5,455 households with homeownership assistance through housing rehabilitation, new construction, and acquisition. Since that accomplishment was published, updated information has been obtained, and the revised figure for FY 2005 is 7,268 households assisted (78 percent of that represents rehabilitation assistance). The revised accomplishment for FY 2004 is 5,658 households assisted. The revised goal for FY 2006 is to serve 5,350 households with homeownership assistance. Accomplishments vary each year because grantees, not HUD, identify the activities they will carry out each year with their block grant funds.
Native Hawaiian Housing Block Grant: The Department of Hawaiian Home Lands, the sole recipient of the Native Hawaiian Housing Block Grant, projected it would assist 188 households through construction, acquisition, and rehabilitation in FY 2006. The FY 2007 Annual Performance Plan (see Appendix A) revised this projection to 90 households, based on the recipient’s Native Hawaiian Housing Plan.
Program website: http://www.hud.gov/offices/pih/ih/grants/ihbg.cfm
Results, impact, and analysis. CDBG: In FY 2006, CDBG grantees assisted a total of 139,136 households through homeowner assistance programs. The vast majority of these beneficiaries, specifically 131,508 households, received benefits through owner-occupied housing rehabilitation activities. This number is 14 percent above the FY 2006 goal of 115,525 households to be assisted for rehabilitation purposes and also above the FY 2005 actual level of 124,544 households assisted. Housing rehabilitation assisted under the CDBG program ranges from the rehabilitation of major household systems, such as roofing, heating and siding, to small weatherization improvements and emergency repairs.
For CDBG direct homeownership assistance activities, grantees provided 7,628 households with assistance. This is below the FY 2006 goal of 11,452 households projected to receive assistance but slightly above the FY 2005 level of 7,530 households assisted. CDBG homeownership assistance may range from relatively large amounts to provide mortgage write downs to smaller amounts for down payment assistance and/or closing costs.
Indian Housing Block Grant: Recipients of the Indian Housing Block Grant program exceeded the 2006 target by 11 percent, by assisting 5,957 households with homeownership assistance. This accomplishment, 5,957, is about 9 percent more than what was originally reported as the annual accomplishment for FY 2005 (5,455).
The Indian Housing Block Grant has been successful because it allows federally recognized Indian tribes to develop and operate affordable and innovative housing programs based on local needs. Besides building, acquiring, and rehabilitating homes, grant recipients can offer their low-income beneficiaries a range of housing assistance services, such as down payment and mortgage assistance, transitional housing, crime prevention and safety activities, and housing management services. Tribes have the flexibility to use grant funds for whatever eligible activity is needed in their community. Therefore, it is difficult to predict the number of units that will be built, acquired, or rehabilitated in any given year. Targets are based on funding levels and annual trend data.
111

PERFORMANCE AND ACCOUNTABILITY REPORT
The Native Hawaiian Housing Block Grant program built 12 new homeownership units and acquired 11 units, for a total of 23 households assisted. Although this represents only 25 percent of the annual goal, there are more than 100 new units in the construction pipeline and almost 100 rehabilitation projects are expected to be completed within the first quarter of FY 2007. It is expected that an annual target of about 100 will reflect average annual accomplishments over a period of several years. The sole recipient of the Native Hawaiian Block Grant, the Department of Hawaiian Home Lands, reports accomplishments after its fiscal year closes on June 30. In FY 2005, 72 Native Hawaiian households were assisted through new construction, acquisition, or rehabilitation.
Reasons for shortfall/Performance improvement plans. CDBG grantees exceeded the overall homeowner assistance goal due to exceptional performance on the owner-occupied rehabilitation component but fell short on the direct homeownership assistance component. CPD’s data clean up efforts and improved analysis of data reported by CDBG grantees on direct homeownership activities identified the primary factor for the shortfall as multiple instances of grantees reporting homeownership counseling activities as direct homeownership assistance. As a result, the FY 2007 goal for direct homeownership has been reevaluated and revised to 6,840 households.
HOMEOWNERSHIP/HOME REHABILITATION ASSISTANCE
2002 2003 2004
2005 2006 2006 goal
CDBG (homeownership assistance) NA NA NA 7,530 7,628 11,452
CDBG (owner-occupied rehabilitation) NA NA 115,146 124,544 131,508 115,525
Indian Housing Block Grant (homeownership assistance and owner-occupied rehabilitation)
NA 11,984 5,658 7,268 5,957 5,350
Native Hawaiian Housing Block Grant (homeownership assistance and owner-occupied rehabilitation)
NA NA NA 72 23 90
Data discussion. CDBG values in this table are based on historical accomplishments reported by grantees in the Integrated Disbursement and Information System, estimates of future budget outlays, and a three percent reduction due to the impact from inflation. An independent assessment in 2003 showed that the Integrated Disbursement and Information System performance indicator data passed 4-sigma quality tests (99.379% correct) for validity, completeness, and consistency. HUD is aware that housing rehabilitation activities often take different forms depending on the goals and objectives of grantee programs. In some cases, these may focus on emergency repairs and other low cost rehabilitation activities directed toward health and safety issues. However, the vast majority of CDBG-funded homeowner rehabilitation activities have median costs in the neighborhood of $5,000 per unit. Integrated Disbursement Information System version 10.0, which was released in May 2006, will improve this data and will provide the opportunity for expanded analysis in FY 2007. HUD has begun to analyze this data but will be in a better position next year when a full year’s data has been reported.
Indian Housing Block Grant data come from recipients through Annual Performance Reports. The data are captured in the Performance Tracking Databases of each area Office of Native American Programs and then aggregated into a national database at headquarters. Each annual reporting period includes all the grantees’ most recent program accomplishments. Because Indian Housing Block Grant recipients have 60 days after their fiscal year ends to report, recipients whose fiscal years end after June 30 report in the next federal fiscal year. Therefore, accomplishments of the Indian Housing Block Grant program that are reported in this document
112

SECTION 2. PERFORMANCE INFORMATION INCREASE HOMEOWNERSHIP OPPORTUNITIES
will likely require future revisions. The Native Hawaiian Housing Block Grant has a single recipient, the Department of Hawaiian Home Lands, which reports annually.
Objective H2: Increase minority homeownership. H2.1: The homeownership rate among targeted households. Background. Three tracking indicators help HUD understand the degree of progress in promoting homeownership among underserved populations. These are measures of homeownership among racial and ethnic minority households, households with incomes below the area median income, and households in central cities. FY 2006 targets were not established for these indicators because of the current dominant impact of the macroeconomy.
Program website: http://www.huduser.org/periodicals/ushmc.html
Results, impact, and analysis. The homeownership rate for all minorities cwas 51.7 percent in the third quarter of 2006, up0.5 percentage point from the third quarter of 2005, and sustaining a trend of increasing minority homeownership. There were 16,269,000 minority homeowners in the third quarter of 2006, an increase of 597,000 from the third quarter of 2005. The advance accounts for the reduction in the minority homeownership gap during FY 2006.
ombined
This result contributes to continued success of the President’s Minority Homeownership Initiative’s goal of adding 5.5 million new minority homebuyers by 2010. There are 2.95 million net additional minority homeowners since mid-2002, and is an estimated 3.48 million gross additions, if households who left homeownership are not deducted. The nation is ahead of schedule to achieve the goal by either measure.
Homeow nership among Minor ity Households
49.3%50.9%
51.7%51.2%
45%
50%
55%
2003 2004 2005 2006
m inor ity hom eownership
The homeownership rate among households with incomes below the national median was 53.0 percent in the third quarter of 2006, up 0.2 percentage point from a year earlier. The homeownership rate in central cities, at 54.6 percent, was up 0.6 percentage point from the third quarter of 2005.
Homeownership rates have increased for each of these populations in recent years during periods of low mortgage interest rates and innovative mortgage products. HUD’s programs have played a significant supporting role. Minority households represented 31.7 percent of FHA-insured first-time homebuyers in FY 2006. HUD’s strategies to increase minority homeownership include increased outreach and continued enforcement of equal opportunity in housing.
Homeow nership among Households w ith I ncome less than
Median Family I ncome
53.0%52.8%52.7%52.1%
45%
50%
55%
2003 2004 2005 2006
below MFI hom eownership
113

PERFORMANCE AND ACCOUNTABILITY REPORT
HUD’s housing counseling program helps members of minority and other underserved groups to build the knowledge to become homeowners and to sustain their new tenure by meeting the ongoing responsibilities of homeownership. HUD’s largest block grant programs, CDBG and HOME, each have a sizable homeownership component. Homebuyers constitute over 40 percent of the 743,965 households assisted through HOME since its inception in 1992.
Data discussion. The indicator is based on averages of monthly Current Population Survey data for the last quarter of the fiscal year. The data are free of limitations affecting the measure’s reliability. Changes in the estimated minority homeownership rate exceeding 0.53 percentage points are statistically significant with 90 percent confidence. Beginning with 2003 data, minority categories reflect new survey procedures that allow respondents to select more than one race, and this self-reporting may change slightly as respondents grow accustomed to the new approach.
Homeow nership among Central City Households
52.3% 53.2%54.6%54.0%
45%
50%
55%
2003 2004 2005 2006
central city hom eownership (Census revisions)
H2.2: The gap in homeownership rates of minority and non-minority households. Background. This tracking indicator assesses progress for one of HUD’s central objectives, removing homeownership barriers and increasing homeownership among minorities. In 2002, President Bush launched a new initiative to increase the number of minority homeowners by 5.5 million by 2010. Homeownership rates are most susceptible to policy intervention among renters who are marginally creditworthy, discouraged by discrimination, or unaware of the economic benefits of homeownership. This indicator measures the difference in percentage points between the homeownership rate of households who are “non-Hispanic white alone” and the homeownership rate of minority households. No numeric target is established because of the current dominant impact of the macroeconomy.
Program website: http://www.huduser.org/periodicals/ushmc.html
Results, impact, and analysis. During FY 2006, the minority homeownership gap sustained the record low of 24.6 percentage points, reflecting resilience in minority home purchases despite declining affordability. In addition, a new record low quarterly gap of 24.3 percentage points was reached in the third quarter of 2006, giving hope for continued progress.
Gap Betw een W hite and Minority Homeow nership Rates
25.0%24.6%
25.9%
24.6%
20%
25%
30%
2003 2004 2005 2006
perc
enta
ge p
oint
s
d if ference between white and m inor ity ratesFHA is a major source of mortgage financing for minority homebuyers. During FY 2006, 31.7 percent of FHA home purchase
114

SECTION 2. PERFORMANCE INFORMATION INCREASE HOMEOWNERSHIP OPPORTUNITIES
endorsements were for first-time minority homebuyers. FHA efforts to modernize programs and become more competitive with sub-prime lenders will help reduce the homeownership gap between whites and minorities as well as increase the overall homeownership rate.
Data discussion. This indicator is based on fiscal-year averages of quarterly estimates from the Current Population Survey. The survey data have the advantage of being nationally representative, reliable, and widely recognized. This indicator replaces an indicator based on the biennial American Housing Survey, thus allowing timelier and more frequent reporting and greater consistency with HUD’s other homeownership indicators.
H2.3: The mortgage disapproval rates of minority applicants. Background. This is a tracking indicator for minority mortgage disapproval rates, an important early indicator of trends in minority homeownership. Equal access to home loans is critical for decreasing disparities in homeownership. This measure tracks home purchase mortgage disapproval rates of minorities that have had limited access to traditional housing markets – African Americans, Hispanics, Native Americans, and other minorities. A FY 2006 performance goal was not established because of HUD’s limited span of control relative to external factors.
Denial Rates* for Mortgage Applications by Race and Ethnicity Race/Ethnicity of Primary Borrower 2004 2005
Hispanic/Latino 16.3% 18.0% Native American/Alaska Native alone 15.8% 16.9% Asian alone 11.7% 13.7% Black/African American alone 19.6% 21.4% Native Hawaiian/Pacific Islander alone 13.9% 15.2% White alone 9.5% 10.5% Two or more races 12.4% 14.7% Other/Unknown/Missing 17.3% 16.9% Total 12.5% 13.8% All minority** 16.5% 18.4% * Excludes denials at the preapproval stage.
** Includes “two or more races,” but excludes “other/unknown/missing.” Results, impact, and analysis. The most recent data show that during calendar year 2005 mortgage applications continued to be denied at higher rates for minority households than for white alone households. Minority groups experienced denial rates ranging from 13.7 percent to 21.4 percent, and averaged 18.4 percent, compared with 10.5 percent for white alone.
Home loans became harder to obtain as the market processed a record volume of 7.45 million mortgage applications. The overall denial rate increased by 1.3 percentage points from 2004 levels to 13.8 percent in 2005. Yet even the tighter credit affected minorities disproportionately, as the overall minority denial rate increased 1.9 percentage points, compared with 1.0 point for white alone.
The primary causes of disparities in mortgage denial rates among race and ethnic groups are differences in their average disposable income and creditworthiness. In some cases lenders have
115

PERFORMANCE AND ACCOUNTABILITY REPORT
been shown to discriminate against minority applicants by disapproving their mortgages while approving non-minorities who were less creditworthy or had less income. In such cases, HUD can take fair housing enforcement actions. HUD’s Office of Fair Housing and Equal Opportunity is focusing increased attention on addressing the role of discrimination in contributing to mortgage approval disparities.
A primary strategy for addressing the long-standing disparity in mortgage denial rates is to use housing counseling to help potential homebuyers understand their income eligibility and improve their creditworthiness. Homeownership counseling is targeted to groups who are disadvantaged in their familiarity with the homebuying and financing process, thus reducing disparities. The goals that HUD has established for the two largest secondary mortgage market lenders, Fannie Mae and Freddie Mac, also encourage increased lending to minorities.
Data discussion. This indicator uses Home Mortgage Disclosure Act data, which are collected from lenders on a calendar-year basis. Calendar year 2006 data are not yet available. The mortgage applications counted are conforming loans or loans insured by FHA, Veterans Affairs, or Rural Housing Service, and are limited to owner-occupied single family homes purchased in core-based statistical areas. Loan denials at the pre-approval stage are excluded, although new but incomplete data suggest that initially denied or unaccepted pre-approvals may account for at least one percent of all loans. Refinance loans and manufactured housing loans are excluded. The data present a generally reliable picture of mortgage denial disparities, although the 16.9 percent denial rate shown for borrowers with missing race/ethnicity data suggests that such borrowers disproportionately are minority households.
H2.4: The share of first-time minority homebuyers among FHA home purchase-endorsements is 35 percent. Background. FHA is a major source of mortgage financing for minority as well as low-income buyers. Increasing the number of FHA endorsements for minority homebuyers will help achieve the outcome of reducing the homeownership gap between whites and minorities as well as increase the overall homeownership rate. Additionally, this performance indicator directly supports the President and Secretary’s commitment to add 5.5 million minority homebuyers by 2010.
The FY 2007 Annual Performance Plan (see Appendix A) revised the FY 2006 indicator from a tracking indicator to include a target of 35 percent of endorsements to be made to first-time minority homebuyers, consistent with HUD’s Strategic Plan for FY 2006 to 2011.
Program website: http://www.hud.gov/offices/hsg/sfh/hsgsingle.cfm
Results, impact, and analysis. During FY 2006, 31.7 percent of FHA endorsed loans were to first-time minority homebuyers. This result falls short of the goal of 35 percent and represents a 2.7 percentage point decrease from the 34.4 percent of first-time minority endorsements that occurred during FY 2005.
Since FY 2001, FHA has seen first-time minority endorsements decrease from 39.7 percent to 31.7 percent in FY 2006. While FHA market share has diminished, there has been a significant increase in minority borrowing nationwide. Current statutory barriers do not allow FHA to compete effectively for this portion of the market. To address this, FHA is taking steps to increase first-time minority market share. Major legislation to modernize FHA has been
116

SECTION 2. PERFORMANCE INFORMATION INCREASE HOMEOWNERSHIP OPPORTUNITIES
approved by the House of Representatives and is awaiting Senate approval. Passage of this legislation will reduce statutory barriers and increase FHA’s flexibility to respond to changes in the marketplace. As a result, FHA will be able to serve more prospective homebuyers by providing an alternative to sub-prime loans that carry high interest rates and closing costs, as well as expensive pre-payment penalties. This legislation is important because studies have shown that minority borrowers are more susceptible to being placed with higher cost loans by aggressive lenders who target minorities. With FHA currently restricted in its ability to offer products comparable to other lenders, a significant portion of the minority homebuyer market is falling prey to higher cost loans that jeopardize the most common form of wealth building in this country, which is homeownership.
Share of Minority Homebuyers Among FHA Endorsements for
First Time Homebuyers
35.0%
37.6% 37.2%34.4%
31.7%
25%
35%
45%
2003 2004 2005 2006
perc
ent
of f
irst
-tim
e pu
rcha
sers
m inor ity buyers (am ong f irst t im e buyers)output goal
Reasons for shortfall/Performance improvement plans. The inability to meet the FY 2006 goal for first-time minority homebuyers is largely attributable to prospective homebuyers opting to use sub-prime, non-prime and conventional mortgage products to finance their homes. The proliferation of non-traditional loan products provide prospective homebuyers with a variety of products that may appear attractive on the surface, but contain features detrimental to the long-term financial health of the homebuyer. FHA aims to increase its first-time minority endorsements through continued marketing efforts and the aforementioned legislation that will allow FHA to more effectively compete in the first-time minority homebuyer market. If approved, modernization will eliminate the statutory three percent minimum down payment, create a new risk based insurance premium structure that would match premium amounts with the credit profile of the borrower, and increase loan amounts. These changes will assist FHA not only in market competition, but also in effectively meeting the President’s goal of increasing minority homeownership.
Data discussion. The data for this performance indicator originate in the Computerized Homes Underwriting Management System, based on data submitted by direct endorsement lenders, and for convenience are reported from FHA’s Single Family Housing Enterprise Data Warehouse. The data are judged to be reliable for this measure. FHA monitors the quality of data submitted by direct-endorsement lenders.
H2.5: HUD will continue to monitor and enforce Fannie Mae’s and Freddie Mac’s performance in meeting or surpassing HUD-defined targets for mortgages financing special affordable housing. Background. HUD defines performance targets for Fannie Mae and Freddie Mac (two housing government-sponsored enterprises) in several areas, including mortgage purchases for special affordable housing. This target is intended to achieve increased purchases by Fannie Mae and Freddie Mac of mortgages on rental housing and owner-occupied housing that address the unmet needs of very low- and low-income families. As such, the special affordable housing goal supports HUD’s national objectives for expanding both affordable homeownership and the availability of affordable rental housing.
117

PERFORMANCE AND ACCOUNTABILITY REPORT
Mortgages qualify as special affordable if they support dwelling units either for very low-income families (those earning no more than 60 percent of area median income) or for low-income families (those earning no more than 80 percent of area median income) located in low-income areas. Low-income areas are defined as (1) metropolitan census tracts where the median income does not exceed 80 percent of area median income and (2) non-metropolitan census tracts where median income does not exceed 80 percent of the county median income or the statewide metropolitan median income, whichever is greater. Beginning in calendar year 2005, HUD increased the special affordable housing goal from 20 percent to 22 percent. The special affordable housing goal will increase in stages between 2005 and 2008, capping at 27 percent in 2008. HUD also added a home purchase subgoal. The special affordable subgoal for calendar year 2005 was 17 percent; it will remain at this level in 2006 and rise to 18 percent in calendar years 2007 and 2008.
Program website: http://www.hud.gov/offices/hsg/gse/gse.cfm
Results, impact, and analysis. In calendar year 2005, Fannie Mae and Freddie Mac both surpassed the 22 percent target. Fannie Mae achieved 26.3 percent, and Freddie Mac achieved 24.3 percent. Both government-sponsored enterprises surpassed the subgoal of 17 percent, Freddie Mac at 17.7 percent and Fannie Mae at 17.03 percent.
An analysis of the composition of units qualifying under the special affordable housing goal in 2005 shows that, of all the dwelling units that qualified for this goal in 2005 for Fannie Mae, 49.7 percent were one-unit owner-occupied properties (including condominium and cooperative units), 1.3 percent were owner-occupied units in two to four-unit properties, 21.3 percent were rental units in single family (one to four-unit) properties, and 27.7 percent were multifamily rental units. For Freddie Mac the corresponding percentages in 2005 were 56.3 percent one-unit owner-occupied properties, 2.0 percent owner-occupied units in two to four-unit properties, 8.5 percent rental units in single-family properties, and 33.2 percent multifamily rental units.
Fa nnie Ma e Pe r for m a nce Re la t iv e to Spe cia l Af for da ble Ta r ge t
21.4%
26.3%
23.6%21.2%22.0%
15%
20%
25%
30%
2002 2003 2004 2005
perc
ent
of u
nits
special affordable m or tgagesoutput goal
Fr e ddie Ma c Pe r for m a nce Re la t iv e to Spe cia l Af for da ble Ta r ge t
24.3%22.7%
21.4%20.4% 22.0%
10%
15%
20%
25%
2002 2003 2004 2005
perc
ent
of u
nits
special affordable m or tgages
output goal
Data discussion. The data reported for this goal are based on calendar year performance. There is a one-year reporting lag because Fannie Mae and Freddie Mac report to HUD in the year following the performance year. In addition, because the government-sponsored enterprises’ quarterly data is confidential and proprietary, the Department is unable to disclose Fannie Mae and Freddie Mac’s goal performance for the current calendar year. To ensure the reliability of data, Fannie Mae and Freddie Mac apply various quality control measures to data elements provided to HUD. The Department verifies the data through comparison with independent data
118

SECTION 2. PERFORMANCE INFORMATION INCREASE HOMEOWNERSHIP OPPORTUNITIES
sources, replication of Fannie Mae’s and Freddie Mac’s goal performance reports, and reviews of their data quality procedures. Fannie Mae’s and Freddie Mac’s financial reports are verified by independent audits.
H2.6: Minority clients are at least 50 percent of total clients receiving housing counseling in FY 2006. Background. The housing counseling assistance program is an integral part of achieving the outcome of helping to increase the minority homeownership rate. It supports the President and Secretary’s commitment to add 5.5 million homebuyers by 2010. The success of this program is evidenced by the more than doubling of its appropriations from $20 million in FY 2001 to $42 million in FY 2006. In order to specifically target and increase the overall amount of funding benefiting the minority community, the Department is setting aside housing counseling appropriations specifically for counseling in conjunction with the Housing Choice Voucher program, agencies serving colonias, and predatory lending. Clients tracked through this indicator include those receiving various forms of housing counseling including: homebuyer education, pre-purchase, and loss mitigation/default counseling to rental, fair housing, and homeless counseling. Depending on the state of the economy and the housing market, demand for various types of counseling rises and falls, and may vary for reasons outside of HUD’s control. The Department is confident, however, that HUD-approved agencies are providing quality counseling services that will help clients receiving rental or homeless counseling rather than the number of clients served in a given year. As a result, HUD revised this indicator in FY 2006 to focus on ensuring that minorities represent a proportion (at least 50 percent) of families and individuals receiving housing counseling from HUD-approved housing counseling agencies, rather than on targeting a specific number of clients.
Results, impact, and analysis. HUD anticipates that 58.4 percent of all clients receiving HUD-funded housing counseling during FY 2006 will have been minorities, although this is a preliminary estimate pending completion of FY 2006 data reporting and analysis. This projection represents actual results from FY 2005 and significantly exceeds the established FY 2005 minimum goal. Final housing counseling data will become available early in FY 2007. HUD approved counseling agencies are given 90 days after the end of the fiscal year to report the results of counseling activity for that fiscal year and to submit requests to HUD for reimbursement for counseling services provided.
Percentage of Minority Clients Receiving Housing Counseling
50.9% 49.6%
58.4%
50.0%
58.4%
0%
50%
100%
2003 2004 2005 2006
Min
ority
Clie
nts
(Per
cent
age)
m inor ity clients counseledoutcom e goalm inor ity clients counseled (projected)
Data discussion. The data source for this performance indicator is the Housing Counseling System (HCS –F11) based on information submitted through Housing Counseling Agency Fiscal Year Activity Reports (Form HUD-9902). The data include total number of clients, the type of counseling received, and the results of the counseling. An independent assessment in 2005 showed that Housing Counseling System performance indicator data passed six-sigma quality tests (reflecting fewer than 3.4 errors per million) for validity, completeness, and consistency. A
119
PERFORMANCE AND ACCOUNTABILITY REPORT
major limitation of the data for this indicator is that it is difficult for counselors to collect demographic data from individuals participating in group education sessions. The lack of confidentiality and privacy discourages many responses. HUD is working with counselors to encourage them to discreetly collect this information, in an effort to improve reporting rates.
H2.7: Section 184A mortgage financing of $6 million is guaranteed for Native Hawaiian homeowners. Background. This indicator tracks the annual dollar amount of loans guaranteed using the Section 184A Native Hawaiian loan guarantee program. The total number of homes built or acquired is also tracked. The program is for families and individuals eligible to reside on Hawaiian Home Lands – land which is held in trust. Lenders have been hesitant to assume the risk of financing homes on trust land, which cannot be used as collateral. The guarantee alleviates this concern and enables eligible families to more easily obtain mortgage financing to purchase a home. This program directly supports the Department’s strategic goal to increase homeownership opportunities.
The FY 2007 Annual Performance Plan (see Appendix A) revised the FY 2006 indicator to change the program accomplishments counted from housing units to dollars guaranteed.
Results, impact, and analysis. One loan was guaranteed in FY 2006, for a total of $152,158; this falls far short of the $6 million goal. The emphasis on institutional transactions limited the universe of potential borrowers and resulted in one transaction, involving 11 single-family homes first planned for FY 2005. Ten of those loans closed in FY 2005, for a total of approximately $1.7 million. The remaining loan, (for one single-family home) was guaranteed in FY 2006. Despite this setback, the Department estimates that demand for the program by individual Native Hawaiians who are building homes on their homesteads is significant. With the program improvements HUD has initiated, (described below) performance for FY 2007 is projected to increase significantly.
Reasons for shortfall/Performance improvement plans. The initial focus of the program had been on institutional transactions, with the Department of Hawaiian Home Lands serving as the borrower. Reliance on institutional transactions placed programmatic limitations on the Section 184A loan guarantee that marginalized the effectiveness of the program. In May 2006, HUD entered into an agreement with the Department of Hawaiian Home Lands that facilitates a transition that permits individual Native Hawaiians to apply for financing directly with lenders. This action increases the availability of market-based mortgage financing to Native Hawaiians with homestead leases.
The Office of Native American Programs conducted training for bankers and mortgage lenders interested in offering the Section 184A loan guarantee program. The Office of Loan Guarantee is working with the Department of Hawaiian Home Lands to refine policies to make Section 184A guidelines consistent with Hawaiian Homes Commission Act leasing guidelines and restrictions.
Data discussion. The Office of Loan Guarantee compiles data on the dollar amount and the number of loan guarantee certificates issued. The Director of the Office of Loan Guarantee validates the data on a monthly basis. The Public and Indian Housing Budget Office verifies this count.
120

SECTION 2. PERFORMANCE INFORMATION INCREASE HOMEOWNERSHIP OPPORTUNITIES
H2.8: Section 184 mortgage financing of $120 million is guaranteed for Native American homeowners. Background. The Section 184 mortgage guarantee program promotes homeownership among Native Americans. It also supports the President and Secretary’s goal of adding 5.5 million minority homeowners by the end of the decade. Homeownership rates on Indian reservations have been historically low because lenders have been hesitant to assume the risk of providing mortgage financing for trust or restricted land that cannot be used as collateral. This program, along with several others, addresses the high degree of overcrowding in Indian Country and the need to support the outcome goal of expanding homeownership opportunities in Indian Country. The Section 184 program provides a federal loan guarantee as an inducement to lenders. Native Americans who wish to live on tribal lands can then more easily obtain financing to purchase a home. This indicator tracks the annual dollar amount guaranteed by HUD to finance homeownership loans under the Section 184 program.
The FY 2007 Annual Performance Plan (see Appendix A) revised the FY 2006 indicator so that it is based on guaranteeing 1,000 loans at an estimated unit cost of $120,000.
Program website: http://www.hud.gov/offices/pih/ih/homeownership/184
Results, impact, and analysis. In FY 2006, the Section 184 program guaranteed 1,139 loans for a total of $172.2 million, exceeding the goal of $120 million in guaranteed loans by 43 percent. In FY 2005, this program guaranteed 634 loans, totaling $76.8 million. This result reflects a 124 percent increase in the dollar amount of guaranteed loans in just one year. This result strongly supports the key outcome goal of expanding homeownership opportunities. The reporting period includes loans that were guaranteed between October 1, 2005, and September 30, 2006.
Volume of Mortgage Guarantees Through Section 1 8 4
$27.2$62.3
$76.8
$172.2
$120.0
$0
$100
$200
2003 2004 2005 2006
mor
tgag
e vo
lum
e ($
mill
ions
)
volum e of m or tgage guaranteesoutput goal
This accelerated growth rate of the Section 184 program has occurred due in part to on-site training and technical assistance, and marketing and outreach efforts of the Section 184 Team, which is comprised of staff from the Office of Native American Programs’ Office of Loan Guarantee and Office of Native American Programs field office staff (to include cross-marketing efforts with other housing- and Indian-based organizations). In addition, significant progress has been made in working with Ginnie Mae, the Federal Home Loan Bank of Chicago, and State Housing Finance Agencies in opening their portfolios to purchase Section 184 loans. Secondary markets for these products are essential to getting more retail bank participation.
The Department initiated two changes in policy that took effect in FY 2005 that impacted loan production in FY 2006. Through these initiatives, tribes can request and receive approval for an expanded service area for Section 184 loan guarantee activity. Since November 2004, 25 tribes have requested and received approval to offer Section 184 loan guarantees in expanded service areas in 20 states. This initiative could add an additional $20 million in loan activity in FY 2007.
121

PERFORMANCE AND ACCOUNTABILITY REPORT
The second initiative will benefit current and former participants of the Mutual Help program. Current Mutual Help participants will be able to use the Section 184 program to become homeowners through an accelerated conversion process. Former Mutual Help participants who are now homeowners will be able to use Section 184 to access their home’s equity. This initiative has the potential to create $5 to $10 million in new activity in FY 2007.
HUD has also altered the Section 184 training and outreach to emphasize larger projects with tribal entities serving as the borrower rather than individual loans.
Data discussion. The Office of Loan Guarantee compiles data on the number of loan guarantee certificates issued. The director of the Office of Loan Guarantee validates the data on a monthly basis. The Public and Indian Housing Budget Office verifies this count. For the purposes of this indicator, the guarantees are counted when the loans are closed and not when they are approved.
Objective H3: Make the home-buying process less complicated and less expensive. H3.1: Respond to 1,000 inquiries and complaints from consumers and industry regarding the Real Estate Settlement Procedures Act and the home buying and mortgage loan process. Background. The Real Estate Settlement Procedures Act is a consumer protection statute enforced by HUD. This Act helps consumers be better shoppers in the home buying and mortgage loan process by requiring that consumers receive disclosures at various times in the transactions and by prohibiting practices, such as paying kickbacks, that increase the cost of settlement services. The Act also provides consumers with protections relating to the servicing of their loans, including proper escrow account management. The Department currently receives inquiries and complaints from consumers, industry, and other state and federal regulatory agencies by mail, telephone, and e-mail. The FY 2006 goal was to respond to 1,000 of these inquiries and complaints. The Department’s responses to the inquiries and complaints received are a measure of its public assistance and enforcement activities.
Results, impact, and analysis. The Office of Real Estate Settlement Procedures Act and Interstate Land Sales responded to 1,355 complaints during FY 2006. This number reflects the number of formal complaint cases closed and exceeds the goal by 35 percent and also exceeds the 1,245 cases closed in FY 2005. In part, the increase reflects an increased enforcement of the Act through aggressive investigation of complaints.
HUD’s Office of Real Estate Settlement Procedures Act and Interstate Land Sales tracks responses to inquiries and complaints regarding the home buying, home financing, and settlement process, as well as inquiries from industry and state and federal regulators regarding practices that may violate the Act. The office anticipated that by increasing public awareness of enforcement, an increasing number of consumers, industry, and other regulatory agencies would
Response to RESPA Complaints Received
1,355
1,2451,0001,244
1,000
0
1000
2000
2003 2004 2005 2006
com plaints received output goal
122

SECTION 2. PERFORMANCE INFORMATION INCREASE HOMEOWNERSHIP OPPORTUNITIES
file complaints alleging violations of the Act. This increased public awareness has helped bring additional violations of the Act to the attention of the Department, and enabled the Department to provide greater assistance to the public, particularly consumers.
The overall increase in public awareness of enforcement generated 1,525 e-mail and 3,272 telephone consumer and industry inquiries in addition to complaints. These were not included in assessing the office’s performance against its FY 2006 goal because the great majority of these inquiries were less formal than the complaints, which are formally addressed. These additional inquiries and associated workload, however, will be taken into account in setting future Annual Performance Plan goals.
Data discussion. The data are compiled from the Office of Real Estate Settlement Procedures Act’s Case Management System, which maintains an electronic record of complaints and telephone calls received by the Office. In addition, e-mail responses are maintained in Lotus Notes via the Real Estate Settlement Procedures Act e-mailbox. Management reviews this tracking system and e-mail on an ongoing basis.
Objective H4: Fight practices that permit predatory lending. H4.1: FHA increases the percentage of at-risk loans that substantively comply with FHA program requirements. Background. This indicator monitors efforts to reduce fraud and compliance problems in FHA relative to the number of “at risk” single family loans reviewed that do not contain material findings. A material finding is defined as a failure to adhere to FHA program requirements (pertaining to the origination and/or servicing of mortgage loans) such that it materially affects the insurability of the loan. Due to the oversight and enforcement-oriented functions performed by the Quality Assurance Division, and the need to maintain objectivity in the Quality Assurance Division review process, a numeric target cannot be established for this performance measure. FHA has therefore elected to monitor the number of loans reviewed that have material findings as a percentage of loans reviewed as the denominator and loans without material findings as the numerator. The program goal is to have a ratio that exceeds 85 percent.
The FY 2007 Annual Performance Plan (see Appendix A) revised the FY 2006 indicator to better measure the incidence of lender non-compliance with FHA program requirements.
Results, impact, and analysis. Of the 15,724 loans reviewed originated by FHA-approved lenders in FY 2006, 14,866, or 95 percent, were determined to have no material findings, far exceeding the program goal of 85 percent. This outcome indicates that lender monitoring reviews conducted by Quality Assurance Division successfully focuses its monitoring efforts on those lenders that are high and moderate risks, thereby allowing for consistent patterns of risk and material violations to be identified and more effective remedies to be developed. More effective remedies to program violations mean that FHA’s insurance funds remain fiscally sound and in a position to help current homeowners and prospective homebuyers.
FHA’s Quality Assurance Division reviews lenders on the basis of a target methodology that focuses on high early default and claim rates in addition to other risk factors that represent “at risk” loans. Loans that are originated by the lenders are reviewed and then evaluated for material
123

PERFORMANCE AND ACCOUNTABILITY REPORT
findings. Quality Assurance Division reviews of FHA-approved lenders provide the means of data collection for this performance measure.
Data discussion. Loan review and findings data are drawn from the Approval, Review, Recertification Tracking System (AARTS-F51A). Data are generated independently and entered into this system by Quality Assurance Division monitors operating throughout the country, with secondary review and verification by FHA Homeownership Centers. Quality Assurance Division functions and data are included in the annual FHA Financial Statements audit. An independent assessment in FY 2005 showed that the Approval, Review, Recertification Tracking System performance indicator data passed four-sigma quality tests (reflecting fewer than 6,210 errors per million) for validity, completeness, and consistency.
Objective H5: Help HUD-assisted renters become homeowners. H5.1: Increase the cumulative homeownership closings under the homeownership option of the Housing Choice Voucher/Housing Certificate Fund to 6,000 by the end of FY 2006. Background. Increasing homeownership among low-income and minority households is one of the Department’s most important initiatives. The outcomes associated with this effort are increased homeownership and resident transition from the rental program. The homeownership option under the Housing Choice/Housing Certificate Fund voucher program helps accomplish this objective by allowing PHAs to provide voucher assistance to low-income first-time homebuyers for monthly homeownership expenses rather than for monthly rental payments, the most typical use of voucher assistance. This indicator reports on the cumulative number of homeowners assisted with voucher funds.
Results, impact, and analysis. The Department exceeded its goal by helping a cumulative 7,528 households become homeowners through homeownership vouchers. This is an increase of 2,407 homeowners from FY 2005. In FY 2007, the Department plans to significantly expand homeownership voucher utilization through the use of an administrative fee incentive. However, the actual success of this program will continue to be affected by several factors, including PHA capacity, availability of financing for first-time low- and-moderate-income homebuyers, availability of administrative fee appropriations, interest rates, and other market forces.
Households becoming Homeow ners w ith Homeow nership Vouchers
1,500
7,528
5,121
2,052
6000
0
5000
10000
2003 2004 2005 2006hom eownership vouchers (PIC)output goal
Data discussion. Data is reported by PHAs to the Inventory Management System. This system performs automated checks on data ranges and internal consistency to help ensure the accuracy of tenant data. In addition to this data, Moving to Work agencies report homeownership data that is not otherwise been reported via spreadsheet. Scripts have been written to extract the homeownership data from the Inventory Management System and consolidate with the Moving to Work data to produce periodic reports of homeownership closings. Data extractions are given a quality assurance review by the data analysis contractor. These reports are again reviewed for
124

SECTION 2. PERFORMANCE INFORMATION INCREASE HOMEOWNERSHIP OPPORTUNITIES
validity and consistency by a PIH voucher program representative and published on the Internet for access by PHA’s and field offices.
H5.2: By FY 2006, public housing agencies with Resident Opportunity and Self Sufficiency grants increase by 10 percent the number of public housing residents who receive homeownership supportive services. Background. The Resident Opportunity Self Sufficiency program, through the Homeownership Supportive Services grant category, provides funds to PHAs, tribes/tribally designated housing entities, and qualified nonprofit organizations to deliver homeownership training, counseling, and other supportive services to residents of public and Indian housing. The Homeownership Supportive Services grants are designed to build upon other self-sufficiency efforts by providing supportive services to participating residents to support them transitioning from rental housing to homeownership, thereby supporting HUD’s strategic goal to increase homeownership opportunities. This indicator measures the amount of homeownership counseling received by residents in connection with the Resident Opportunity and Self Sufficiency Homeownership Supportive Services grants.
Program website: http://www.hud.gov/offices/pih/programs/ph/ross/
Results, impact, and analysis. In FY 2006, the Department exceeded its goal by increasing the percent of public housing residents who received homeownership counseling by 88 percent from the FY 2005 established baseline of 3,363 residents who received homeownership counseling. A 10 percent goal meant that an additional 336 residents should receive homeownership counseling during FY 2006 (June 30, 2005, to June 30, 2006). The 88 percent increase in FY 2006 means that 2,950 additional residents received homeownership counseling. This success will help the Department further its outcome goal of increasing homeownership opportunities.
Data discussion. Data currently come from reports that Homeownership Supportive Services grantees submit to field offices. Grantees establish their baselines from their approved work plan and report results as of January 31 and July 30 of each grant year. In the future, the Department plans to have grantees report through an Internet-based logic model system. Until such a system is implemented, the program office will continue to collect data independently on grantees in order to track this goal. Data verification is addressed as a function of field office monitoring and program office analysis. As this is a newer indicator, there has not been an independent evaluation to verify data.
H5.3: HUD works to expand public housing agencies’ use of the Section 32 homeownership program, resulting in the submission of 12 proposals in FY 2006. Background: The Quality Housing and Work Responsibility Act permits PHAs, through Section 32 of the U.S. Housing Act of 1937, to make public housing dwelling units and other units available for purchase by low-income families as their principal residence. This indicator tracks HUD’s efforts to expand the use of the Section 32 homeownership program and, thereby, creates progress toward promoting affordable homeownership, a key outcome goal for the Department. Under Section 32, a PHA may:
• Sell all or a portion of a public housing development to eligible public or non-public housing residents,
125
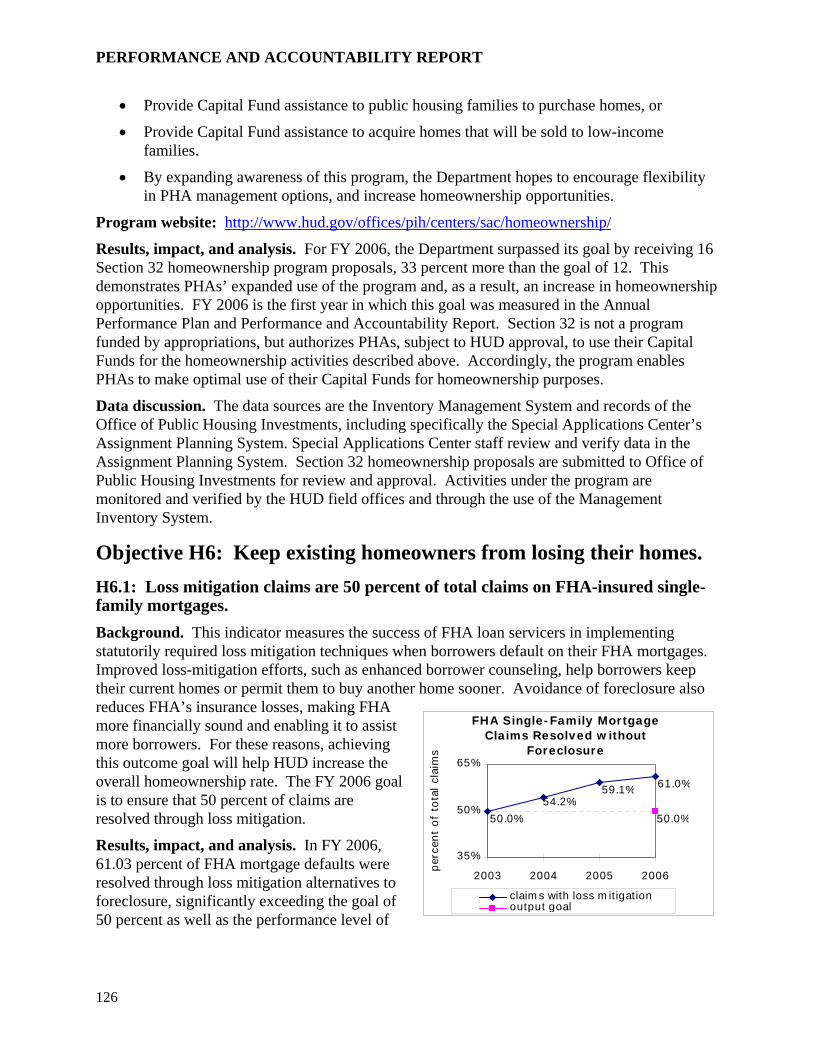
PERFORMANCE AND ACCOUNTABILITY REPORT
• Provide Capital Fund assistance to public housing families to purchase homes, or
• Provide Capital Fund assistance to acquire homes that will be sold to low-income families.
• By expanding awareness of this program, the Department hopes to encourage flexibility in PHA management options, and increase homeownership opportunities.
Program website: http://www.hud.gov/offices/pih/centers/sac/homeownership/
Results, impact, and analysis. For FY 2006, the Department surpassed its goal by receiving 16 Section 32 homeownership program proposals, 33 percent more than the goal of 12. This demonstrates PHAs’ expanded use of the program and, as a result, an increase in homeownership opportunities. FY 2006 is the first year in which this goal was measured in the Annual Performance Plan and Performance and Accountability Report. Section 32 is not a program funded by appropriations, but authorizes PHAs, subject to HUD approval, to use their Capital Funds for the homeownership activities described above. Accordingly, the program enables PHAs to make optimal use of their Capital Funds for homeownership purposes.
Data discussion. The data sources are the Inventory Management System and records of the Office of Public Housing Investments, including specifically the Special Applications Center’s Assignment Planning System. Special Applications Center staff review and verify data in the Assignment Planning System. Section 32 homeownership proposals are submitted to Office of Public Housing Investments for review and approval. Activities under the program are monitored and verified by the HUD field offices and through the use of the Management Inventory System.
Objective H6: Keep existing homeowners from losing their homes. H6.1: Loss mitigation claims are 50 percent of total claims on FHA-insured single-family mortgages. Background. This indicator measures the success of FHA loan servicers in implementing statutorily required loss mitigation techniques when borrowers default on their FHA mortgages. Improved loss-mitigation efforts, such as enhanced borrower counseling, help borrowers keep their current homes or permit them to buy another home sooner. Avoidance of foreclosure also reduces FHA’s insurance losses, making FHA more financially sound and enabling it to assist more borrowers. For these reasons, achieving this outcome goal will help HUD increase the overall homeownership rate. The FY 2006 goal is to ensure that 50 percent of claims are resolved through loss mitigation.
FHA Single- Family Mortgage Claims Resolved w ithout
Foreclosure
50.0%54.2%
59.1% 61.0%
50.0%
35%
50%
65%
2003 2004 2005 2006
perc
ent
of t
otal
cla
ims
claim s with loss m it igationoutput goal
Results, impact, and analysis. In FY 2006, 61.03 percent of FHA mortgage defaults were resolved through loss mitigation alternatives to foreclosure, significantly exceeding the goal of 50 percent as well as the performance level of
126

SECTION 2. PERFORMANCE INFORMATION INCREASE HOMEOWNERSHIP OPPORTUNITIES
59.1 percent achieved in FY 2005. This 1.93 percentage point increase from FY 2005 represents a continuation of the trend of increases.
A borrower can resolve a default (90-day delinquency) in several ways short of foreclosure – for example, by paying down the delinquency (cure), by a pre-foreclosure sale with FHA paying an insurance claim in the amount of the shortfall, or by surrendering a deed in lieu of foreclosure. Loss mitigation actions do not permanently stabilize many borrowers’ financial status. However, about 60 percent of borrowers who received the benefits of loss mitigation actions remain current on their mortgage for at least a 12-month period. This reduction in foreclosure claim expense is a key component of Departmental budget estimates for FY 2007. Our programmatic objective is to sustain the high level of participation in loss mitigation even as the Office of Housing tightens programmatic requirements designed to increase the ultimate success rate of loss mitigation in helping borrowers avoid foreclosure.
Data discussion. The data originate in the Single Family Insurance, CLAIMS subsystem (CLAIMS A43C), and for convenience are reported from FHA’s Single Family Enterprise Data Warehouse, Loss Mitigation table. The resolutions that are counted as loss mitigation are: forbearance agreements, loan modifications, partial claims, pre-foreclosure sales, and deeds-in-lieu of foreclosure. A small and decreasing number of “other” resolutions that were previously counted were excluded beginning in FY 2003. Total claims comprise loss mitigation claims plus conveyance claims. No data limitations are known to affect this indicator. An independent assessment in 2004 showed that the CLAIMS performance indicator data passed six-sigma quality tests (reflecting fewer than 3.4 errors per million) for validity, completeness, and consistency. FHA data are entered by the loan servicers with monitoring by FHA. The results reported for this performance indicator are consistent with those reported in the FHA Management Report for FY 2006. FHA now collects 30- and 60-day default data, which provides better information about typical default patterns and insight towards improving loss mitigation efforts.
H6.2: More than 50 percent of total mortgagors seeking help with resolving or preventing mortgage delinquency will successfully avoid foreclosure. Background: Clients tracked through this indicator include homeowners with mortgages who are at risk of default, or have already defaulted, and are seeking assistance in order to remain in their home and meet the responsibilities of homeownership. The FY 2006 performance goal is to ensure that more than 50 percent of total mortgagors seeking help with resolving or preventing mortgage delinquency successfully avoid foreclosure. By offering alternatives to delinquency and foreclosure, default counseling is a cost-effective way to reduce HUD’s exposure to risk while contributing to the important outcome of aiding growth and stability of families and communities across the country. Moreover, default counseling is increasingly
Counseled HouseholdsW ho Avoided Foreclosure
68.1%60.0%47.1%
68.1%50.0%
0%
50%
100%
2003 2004 2005 2006
pct
of H
Hs
coun
sele
d
households avoiding foreclosure (new form )households avoiding foreclosure (projected)outcom e goal
127

PERFORMANCE AND ACCOUNTABILITY REPORT
important when targeted towards areas with higher unemployment or markets experiencing rapid home price escalation.
Results, impact, and analysis. Results for clients counseled in FY 2006 could not be fully assessed by the date of this publication. HUD anticipates that 68.1 percent of total mortgagors seeking help with resolving or preventing mortgage delinquency will have successfully avoided foreclosure. This projection represents the actual results from FY 2005 and exceeds the FY 2006 goal of 50 percent. These results indicate an improvement in default counseling and loss mitigation tools and techniques, and the increased training of counselors from HUD approved agencies. HUD approved counseling agencies are given 90 days after the end of the fiscal year to report the results of counseling activity for that fiscal year and to submit requests to HUD for reimbursement for counseling services provided.
Data discussion: The data source for this performance indicator is the Housing Counseling System (HCS –F11) based on information submitted through Housing Counseling Agency Fiscal Year Activity Reports (Form HUD-9902). The data include total number of clients, the type of counseling received, and the results of the counseling. An independent assessment in 2005 showed that Housing Counseling System performance indicator data passed six-sigma quality tests (reflecting fewer than 3.4 errors per million) for validity, completeness, and consistency. One limitation of the data is that mortgagors can, and often do, go in and out of default. Consequently, a mortgagor whose counseling outcome was recorded as “reinstated” in a given year could actually result in “foreclosure” in another year. In an effort to further improve its ability to collect detailed information about the families and individuals seeking help with resolving or preventing mortgage delinquency, among other data, the Department is in the process of implementing an automated data collection instrument that will enable it to collect client-level information beginning in FY 2007.
128

SECTION 2. PERFORMANCE INFORMATION PROMOTE DECENT AFFORDABLE HOUSING
Goal A: Promote Decent Affordable Housing Strategic Objectives:
A1 Expand access to affordable rental housing.
A2 Improve the physical quality and management accountability of public and assisted housing.
A3 Increase housing opportunities for the elderly and persons with disabilities.
A4 Transition families from HUD-assisted housing to self sufficiency.
PERFORMANCE REPORT CARD - GOAL A
Performance Indicators FY 2003 Actual
FY 2004 Actual
FY 2005 Actual
FY 2006 Actual
FY 2006 Target
Met or Missed Notes
A1.1 The number of households with worst case housing needs among families with children, the elderly, and persons with disabilities. N/A N/A N/A N/A N/A
a, c
Families with children 1,849 j
Elderly 1,129 j
Persons with disabilities 511 j
A1.2 The net number of years of affordability remaining for all HOME-assisted units is maximized. 62 64 980 1,063 1,000 Met
A1.3 The number of rental assisted households and rental housing units with CDBG, HOME, Housing Opportunities for Persons With AIDS, Indian Housing Block Grant and Native Hawaiian Housing Block Grant. 118,142 143,226 157,763 177,501 126,773 Met
A1.5 FHA endorses at least 1,000 multifamily mortgages. 1,331 1,497 1,017 1,016 1,000 Met
A1.6 Ginnie Mae securitizes at least 90 percent of eligible FHA multifamily mortgages. 91% 92% 91.1% 96.9% 90% Met
A1.7 HUD will complete 80 percent of the initial FY 2006 Mark-to-Market pipeline during the fiscal year, reducing rents and restructuring mortgages where appropriate. 75% 72% 82% 86% 80% Met
A1.8 HUD will continue to monitor and enforce Fannie Mae’s and Freddie Mac’s performance in meeting or surpassing HUD-defined targets for special affordable multifamily mortgage purchases.
Fannie Mae $7.57 $12.23 $7.32 $10.39 $5.49 Met f, l
Freddie Mac $5.22 $8.79 $7.77 $12.35 $3.92 Met f, l
A1.9 At least 70 percent of clients receiving rental or homeless counseling either find suitable housing or receive social service assistance to improve their housing situation. 68.4% 72.9% 75.0% 75% 70% Met I
A1.10 Reduce energy costs associated with HUD program activities. N/A 7 16 21 21 Met
129

PERFORMANCE AND ACCOUNTABILITY REPORT
PERFORMANCE REPORT CARD - GOAL A
Performance Indicators FY 2003 Actual
FY 2004 Actual
FY 2005 Actual
FY 2006 Actual
FY 2006 Target
Met or Missed Notes
A2.1 The share of public housing units that meet HUD established physical standards will be 85.1 percent. 85.9% 85.0%
85.1 %
85.8% 85.1% Met
A2.2 The share of assisted and insured privately-owned multifamily properties that meet HUD established physical standards are maintained at no less than 95 percent. 93.9% 94.4% 96% 95% 95% Met
A2.3 The unit-weighted average Public Housing Assessment Systems (PHAS) score is maintained at the FY 2005 level of 85.8 percent. 87.3 86.9% 85.8% 85.0% 85.8% Missed
A2.4 For households living in assisted and insured privately-owned multifamily properties, the share of properties that meets HUD’s financial management compliance is maintained at no less than 98 percent. 95% 98% 98% 98% 98% Met
A2.5 The HOPE VI Revitalization program for public housing
Relocates 1,400 households. 6,859 4,618 4,702 2,962 1,400 Met d
Demolishes 2,600 units. 7,468 4,919 7,809 2,305 2,600 Met d, i
Completes 6,500 new and rehabilitated units. 8,611 4,132 9,632 7,085 6,500 Met d
Occupies 6,300 units. 7,512 4,210 8,467 8,081 6,300 Met d
Completes 15 projects. N/A N/A N/A 17 15 Met
A2.6 The percent of public housing units under management of troubled housing agencies at the beginning of FY 2006 decreases by 15 percent by the end of the fiscal year. 71.8% 43.5% 33.0% 31.0% 15.0% Met
g
A3.1 Increase the availability of affordable housing for the elderly and persons with disabilities by bringing 250 projects to initial closing under Sections 202 and 811. 334 303 303 315 250 Met
A3.2 The Assisted-Living Conversion program increases the supply of suitable housing for the frail elderly by completing conversion of eight properties in FY 2006. 12 7 16 14 8 Met
A3.3 The number of elderly households living in private assisted housing developments served by a service coordinator is maintained at the FY 2005 level.
111.2 125.3 139.0 139.1 139.0 Met
j
A4.1 By FY 2008, increase the proportion of those who transition from HUD’s public housing and Housing Choice Voucher programs by 20 percent and decrease the proportion of active participants who have been in HUD’s housing assistance programs for 10 years or more by 10 percent.
N/A N/A
N/A N/A
12.8% 19.2%
12.6% 20.9%
12.4% 19.3%
Met Missed
Notes: a Data not available. b No performance goal for this fiscal year. c Tracking indicator. d Third quarter of calendar year (last quarter of fiscal year; not the entire fiscal year). e Calendar year beginning during the fiscal year shown.
f Calendar year ending during the fiscal year shown. g Result too complex to summarize. See indicator. h Baseline newly established. i Result is estimated. j Number is in thousands. k Number reported in millions. l Number reported in billions.
130

SECTION 2. PERFORMANCE INFORMATION PROMOTE DECENT AFFORDABLE HOUSING
Objective A1: Expand access to affordable rental housing. A1.1: The number of households with worst case housing needs among families with children, the elderly, and persons with disabilities. Background. This tracking indicator is a key measure of whether HUD’s array of targeted housing programs and the nation are advancing or losing ground in the fight to ensure decent, safe, and affordable housing for America’s families. The indicator focuses on the elderly, disabled persons, and families with children because they are particularly susceptible to housing problems and are targeted by HUD housing programs. Worst case needs are defined as unassisted renters with very low incomes and a priority housing problem – either severely inadequate housing or, more commonly, severe housing cost burden, meaning total costs exceed 50 percent of monthly income.
Calendar year 2005 data from the American Housing Survey became available during FY 2006, but estimates of worst case needs have not been finalized and released pending completion of HUD’s report to Congress during 2007.
Program website: The 2003 results are reported in “Affordable Housing Needs: A Report to Congress on the Significant Need for Housing,” available at http://www.huduser.org/publications/affhsg/affhsgneed.html .
Results, impact, and analysis. The most recent published tracking data show that in calendar year 2003, 1.85 million families with children had worst case housing needs and 1.13 million elderly households had worst case needs. These estimates do not statistically differ from 2001 levels. For households with disabilities, the data do not support precise estimates, but an estimator showed a significant increase from 2001 levels to 0.51 million households, which is known to be an undercount.
National and regional economic conditions affect worst case needs by changing the number of very low-income renters (that is, households eligible for worst case status if unassisted) and the availability of affordable private-market rental units. Between 2001 and 2003, the number of very low-income renters increased by 5.1 percent, from 14.9 million to 15.7 million. Lack of affordable housing units is a central aspect of the problem: for every 100 very low-income renter households in 2003, only 81.4 rental units were affordable and available, and only 60.5 units of adequate quality were affordable and available.
A substantial portion of HUD’s budget helps program partners meet the affordable housing needs of very low-income renters. Contributing programs include vouchers, project-based Section 8, public housing, HOME Investment Partnerships program, CDBG, Housing Opportunities for Persons With AIDS, homeless programs, multifamily mortgage insurance, and capital advances for supportive housing under Sections 202 and 811. Although recent funding
W orst Case Needsfor Housing Assistance
1,8491,8071,793
1,1291,1821,028
5114073710
1,000
2,000
3,000
1999 2001 2003thou
sand
s of
hou
seho
lds
fam ilies with childrenelder ly householdshouseholds with disabilit ies (est.)
131

PERFORMANCE AND ACCOUNTABILITY REPORT
levels for these programs have not supported expanded coverage, collectively they produce a critical outcome, keeping many of the 5 million households served out of worst case status (see the table “Units/Households Receiving HUD Assistance” in appendix of this report).
Data discussion. The data for this indicator come from the national American Housing Survey, conducted for HUD by the Census Bureau on a biennial basis. Calendar year 2005 data will be published during 2007. Estimates of households containing non-elderly persons with disabilities are based on HUD’s tabulation of households that reported receiving Supplemental Security Income. In preparing the 2003 report, the Office of Policy Development and Research verified the data through comparisons with the American Community Survey and the Survey of Income and Program Participation. Estimates of very low-income renters with severe rent burdens produced with the 2001 Survey of Income and Program Participation data showed 37 percent fewer elderly households, 11 percent fewer families with children, and 2 percent more households with disabilities than did the 2001 American Housing Survey. The report also presents preliminary research about the duration of severe rent burdens from year to year.
A1.2: The net number of years of affordability remaining for all HOME-assisted units is maximized. Background: This indicator tracks the net number of years of affordability produced for low-income households residing in units developed through the investment of the HOME funds. Rental and homebuyer units produced with HOME funds must remain affordable to low-income households for a minimum of five and for as many as 20 years – depending upon the amount of the HOME investment. These restrictions are imposed through covenants running with the land, deed, rent, and other restrictions that HUD may agree to. The net number of years of affordability remaining at any point in time is calculated by multiplying the number of units assisted by the remaining number of years of affordability attached to those units. The greater the number of years a unit remains affordable, the greater the rent stability for low-income households and, as a consequence, the greater the likelihood that their disposable income for non-rent expenses will increase.
The FY 2007 Annual Performance Plan (see Appendix A) revised upward the FY 2006 goal to 1 million units of affordability from 780,000 to reflect higher-than-anticipated number of HOME-assisted units produced in FY 2005.
Program website: www.hud.gov/offices/cpd/affordablehousing/programs/home/index.cfm
Results, impact, and analysis. At the end of FY 2006, the net number of years of affordability remaining for all HOME-assisted units reached 1,062,775, exceeding the goal of one million by 62,775 or 6.3 percent. This also exceeds the net 980,000 unit years of affordability achieved by HOME in FY 2005 by 82,775 or 8.4 percent. The improvement in FY 2006 was a direct function of the large number of HOME-assisted units, both homebuyer and rental, that were placed under HOME affordability restrictions this year.
Data discussion: Data for the HOME Investment Partnerships program are reported in HUD’s Integrated Disbursement and Information System. During the second quarter of FY 2006, the Department deployed new outcome performance measures in the system, including several new measures for HOME. Data entered by participating jurisdictions in HUD’s Integrated Disbursement and Information System are used to track quarterly performance.
132

SECTION 2. PERFORMANCE INFORMATION PROMOTE DECENT AFFORDABLE HOUSING
A1.3: The number of rental households and rental housing units assisted with CDBG, HOME, HOPWA, IHBG, and NHHBG. Background: This indicator tracks the number of households that receive affordable housing assistance through the identified programs in FY 2006. The outputs tracked by this indicator show the contribution of important HUD programs toward increasing the national homeownership rate and the number of minority homeowners, two key Presidential and Secretarial priorities. These programs also help reduce the number of households with worst-case housing needs (very low-income households who pay more than half of their incomes for housing or who live in substandard housing). There are no rental activities to report under the Native Hawaiian Block Grant program.
The HOME Investment Partnerships program is one of HUD’s major affordable housing production programs. The HOME Investment Partnerships program’s block grant structure enables participating state and local governments to build or rehabilitate housing for rent or ownership, provide home purchase or rehabilitation financing assistance to existing homeowners and new homebuyers, and provide tenant-based rental assistance to assist low-income households.
Program website: http://www.hud.gov/offices/cpd/affordablehousing/programs/home/index.cfm
The Community Development Block Grant program is another tool for providing housing assistance, although it is only one of several eligible activities from which Community Development Block Grant grantees may choose. Beginning in FY 2005, CDBG assistance under this indicator was broken down to separate the use of CDBG funds to rehabilitate rental housing from the use of funds for homeowner assistance, i.e., providing homeownership assistance and rehabilitating owner-occupied housing. The number of rental units expected to be assisted through the use of CDBG funds under this indicator in FY 2006 was projected to be 22,408 in the FY 2006 Annual Performance Plan. This number was lower than historical results because at the time the FY 2006 Annual Performance Plan was prepared, CDBG was one of 18 federal community development programs proposed for consolidation. However, grantees with CDBG funds from prior year appropriations that had not yet been expended were expected to generate this level of accomplishment. The vast majority of CDBG housing assistance is devoted to various forms of homeowner assistance and is reflected in goal H1.12.
Program website: http://www.hud.gov/offices/cpd/communitydevelopment/programs/
The Housing Opportunities for Persons with AIDS program provides local and state government and nonprofit organizations with the resources and incentives to develop long-term comprehensive housing strategies for meeting the housing and related supportive service needs of low-income persons living with HIV/AIDS and their families. The program supports the goals of increasing the availability of decent, safe, and affordable housing in America’s communities by providing permanent housing with coordinated supportive services through tenant-based rental assistance, short-term rent, mortgage or utility payments which help maintain the current residence of beneficiaries, and support for community facilities that provide residential care and other needed support.
Program website: http://www.hud.gov/offices/cpd/aidshousing/index.cfm
133

PERFORMANCE AND ACCOUNTABILITY REPORT
The Indian Housing Block Grant program provides housing block grants to federally recognized Indian tribes, or their tribally designated housing entities. These grants meet locally determined, low-income housing needs, including maintaining and rehabilitating existing units (if applicable), providing housing management services, funding crime prevention and safety activities, providing housing counseling services, and/or developing new homeownership and rental units. Indian Housing Block Grant recipients receive funds on the basis of an annual formula allocation.
Program website: http://www.hud.gov/offices/pih/ih/grants/icdbg.cfm
Results, impact, and analysis.
HOME. HOME met its goals for both rental housing production and tenant-based rental assistance in FY 2006. HOME participating jurisdictions completed 47,598 rental housing units in FY 2006, exceeding the goal of 21,338 units by 26,260 units or 123 percent. The FY 2006 performance represents an increase of 13,986 units or 42 percent from the 33,612 units completed in FY 2005. The 23,325 households assisted with HOME-funded tenant-based rental assistance in FY 2006 exceeded the goal of 10,081 by 13,244 households or 131 percent. This represents an increase of 2,771 households or 13 percent compared to FY 2005. (For a discussion of HOME assistance to homebuyers and existing homeowners in FY 2006, see Indicator H1.7.)
Based on completions, the average per-unit HOME cost of producing a rental unit in FY 2006 increased by $849 to $16,887, or approximately five percent, compared to FY 2005 while the annual cost of providing tenant-based rental assistance to a household stood at $2,864 in FY 2006, a decrease of $56 or 2 percent. Participating jurisdictions disbursed approximately $1.394 billion in HOME funds on completed rental projects and committed $85.2 million to tenant-based rental assistance during FY 2006.
The greatly improved results are due in large part to an aggressive effort by HUD headquarters and field offices to speak directly to participating jurisdictions about performance, and to follow-up with participating jurisdictions that were shown to be lagging in performance or the reporting of their performance to HUD. Consequently, a significant portion of the increase in units produced can be attributed to more accurate reporting on activities completed in previous years. As part of this effort, fifteen training conferences focusing on performance measurement were held with grantees over the summer of 2006. Over 3,000 representatives from HUD formula grantees attended. In addition, at least eight on-site one-on-one trainings were conducted with poorly performing HOME participating jurisdictions. HUD issues monthly production reports and a quarterly HOME Program Performance SNAPSHOT to identify these poorly performing participating jurisdictions. The SNAPSHOTs compare the performance of HOME participating jurisdictions to each other for eight factors and assign a performance ranking. The SNAPSHOTs have succeeded in focusing attention on production and the completion of units. The new “Open Activities Report”, as the name indicates, directs participating jurisdictions to their open activities and assists them in completing them. In continuation of this effort, a new performance report, the HOME Dashboard, directed at state and local elected officials and intended to focus their attention on the use of HOME funds in the production of affordable housing in their jurisdictions, will be released in the first quarter of FY 2007.
134

SECTION 2. PERFORMANCE INFORMATION PROMOTE DECENT AFFORDABLE HOUSING
HUD continued its efforts this year to provide training and technical assistance, including web-based assistance, to participating jurisdictions to improve their HOME program performance. For example, a new round of training in FY 2006 under the demand/response system resulted in fifteen course deliveries nationally selected from a menu of twelve HOME training courses and at least eight seminars. In addition a new HOME Certified Specialist course was rolled out in FY 2006 where state and local program staff are trained and tested on their understanding of HOME regulations. Twelve deliveries have taken place and hundreds of state and local HOME program staff has received their certification.
Since grantees have discretion about which housing activities they choose to fund, there may be fluctuations among the individual components of this and other indicators of HOME Program accomplishments from year to year reflecting the emphasis given to one activity over another at the local level. The accomplishment of this output indicator is also affected by several external factors: the level of annual HOME appropriations, the number of new, less experienced, participating jurisdictions entering the program, and general economic conditions affecting the cost and availability of housing and the income levels of program beneficiaries.
Community Development Block Grant. Grantees utilized CDBG funding to rehabilitate 38,178 rental housing units in FY 2006. This achievement exceeded the goal of 22,408 units by 15,770 units and grantees thus achieved 170 percent of the goal. Grantee performance on this goal for FY 2006 also exceeded the FY 2005 actual level of 34,918 units assisted. The FY 2007 goal has been established at 31,726 units, which is in line with historical outcomes. The data was collected via the Integrated Disbursement and Information System and the reporting period was FY 2006 (October 1, 2005 through September 30, 2006). Slightly more than 3 percent of all CDBG disbursements in FY 2006 were dedicated to rental housing rehabilitation efforts, a level consistent with FY 2005 disbursements for the same activities.
HOPWA. The Housing Opportunities for Person With AIDS program demonstrated significant successes during the FY 2006. Program outlays of $310 million exceeded the amount of new funds that were allocated and being obligated during that year, $281 million, demonstrating that existing programs have significant capacity to fully utilize program resources. In the second quarter of FY 2006, the program implemented client outcome measures through revised reporting forms, the Consolidated Annual Performance and Evaluation Report, and Annual Progress Report and made related changes in information technology systems. A comprehensive national training effort was undertaken for all grantees emphasizing implementation steps on assessing long-term permanent housing results for clients. Thirty-four trainings were attended by approximately 614 persons, representing all of the program’s 117 formula, and 85 active competitive grantees. Three more trainings will be held in FY 2007.
Based on data collected from 40 grantees for this FY 2006 program year, the expected output of housing assistance in FY 2006 will benefit 67,000 households. This number is lower than the budget estimate of 71,526, and is attributable to an active effort to improve accuracy of reports through verification efforts along with intensive program training. Future reporting should be set to this new performance baseline and replace the planning tools used in the draft prior year budget requests. The program office has conducted a verification of the data obtained along with clean-up efforts to improve accuracy of these reports. As a result, the FY 2005 data are revised to show that 67,012 households were assisted with housing support, a difference from the planned budget goal of 70,450 households. The revised data also replaced a projection based on
135

PERFORMANCE AND ACCOUNTABILITY REPORT
actual outlays, with grantee verified information. The office evaluated this change and notes that most of the decrease was attributable to reports on the use the short-term component of the program by three of the 202 grantees.
The program office notes that the verification efforts result in almost all grantees updating the data previously submitted in annual reports. This involves significant variations from data collected in the Integrated Disbursement and Information System and some paper report forms. In addition, most of the larger variations appear to come from a subset of grantees, approximately 20 percent of recipients. In the differences shown above, three grantees verified new data that reduced the number by about 5,000 reported households. In FY 2006, the program initiated a significant change in reporting requirements and the tools to be used to include a new focus on client outcomes. This effort, to show the permanent housing results, is expected to enhance grantee programs in evaluating these supportive housing efforts and improve benefits to clients. The new reporting effort was supported by training and management oversight actions that also will support the accurate and effective use of these forms and systems. Further, HUD has contracted to continue support of national data collection and comprehensive data verification efforts. The program also issued new guidance to help grantees better connect clients on recurring short-term assistance to more permanent housing support, see CPD Notice 06-07, Standards for Housing Opportunities for Persons With AIDS Short-term Rent, Mortgage and Utility Payments and Connections to Permanent Housing, August 2006. It is expected that the results of the short-term assistance, when collected in the future, will be evaluated by grantees to help inform program changes to improve responsiveness to client needs as well as fulfill these program reporting requirements.
Indian Housing Block Grant. The Indian Housing Block Grant program came within two percent of reaching its FY 2006 target, by assisting 1,400 households with rental assistance. This accomplishment is about 33 percent more than what was originally reported last year for FY 2005.
The Indian Housing Block Grant has been successful because it allows federally recognized Indian tribes to develop and operate affordable and innovative housing programs based on local needs. Besides building, acquiring, and rehabilitating homes, grant recipients can offer their low-income beneficiaries a range of housing assistance services, such as down payment and mortgage assistance, transitional housing, crime prevention and safety activities, and housing management services. Tribes have the flexibility to use grant funds for whatever eligible activity is needed in their community. Therefore, it is difficult to predict the number of rental units that will be built, acquired, and rehabilitated in any given year. Targets are based on funding levels and annual trend data.
Rental Households/Rental Units Receiving Assistance
2002 2003 2004 2005 2006
2006 goal
CDBG (rental units rehabilitated) NA NA 31,186 34,918 38,178 22,408 HOME (tenant-based assistance) 10,239 10,731 15,479 20,554 23,325 10,081 HOME (rental units completed) 19,076 25,977 23,392 33,612 47,598 21,338 HOPWA 74,964 78,467 70,779 67,012 67,000 71,526 Indian Housing Block Grant NA 2,967 2,390 1,667 1,400 1,420
136
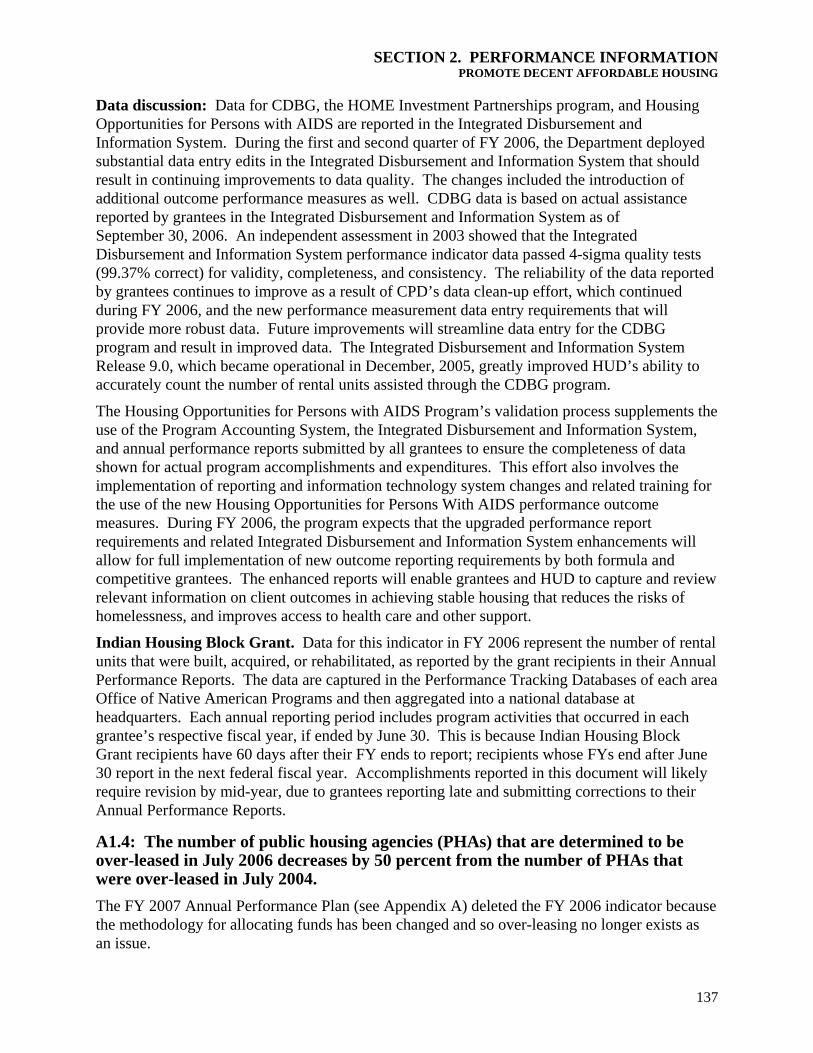
SECTION 2. PERFORMANCE INFORMATION PROMOTE DECENT AFFORDABLE HOUSING
Data discussion: Data for CDBG, the HOME Investment Partnerships program, and Housing Opportunities for Persons with AIDS are reported in the Integrated Disbursement and Information System. During the first and second quarter of FY 2006, the Department deployed substantial data entry edits in the Integrated Disbursement and Information System that should result in continuing improvements to data quality. The changes included the introduction of additional outcome performance measures as well. CDBG data is based on actual assistance reported by grantees in the Integrated Disbursement and Information System as of September 30, 2006. An independent assessment in 2003 showed that the Integrated Disbursement and Information System performance indicator data passed 4-sigma quality tests (99.37% correct) for validity, completeness, and consistency. The reliability of the data reported by grantees continues to improve as a result of CPD’s data clean-up effort, which continued during FY 2006, and the new performance measurement data entry requirements that will provide more robust data. Future improvements will streamline data entry for the CDBG program and result in improved data. The Integrated Disbursement and Information System Release 9.0, which became operational in December, 2005, greatly improved HUD’s ability to accurately count the number of rental units assisted through the CDBG program.
The Housing Opportunities for Persons with AIDS Program’s validation process supplements the use of the Program Accounting System, the Integrated Disbursement and Information System, and annual performance reports submitted by all grantees to ensure the completeness of data shown for actual program accomplishments and expenditures. This effort also involves the implementation of reporting and information technology system changes and related training for the use of the new Housing Opportunities for Persons With AIDS performance outcome measures. During FY 2006, the program expects that the upgraded performance report requirements and related Integrated Disbursement and Information System enhancements will allow for full implementation of new outcome reporting requirements by both formula and competitive grantees. The enhanced reports will enable grantees and HUD to capture and review relevant information on client outcomes in achieving stable housing that reduces the risks of homelessness, and improves access to health care and other support.
Indian Housing Block Grant. Data for this indicator in FY 2006 represent the number of rental units that were built, acquired, or rehabilitated, as reported by the grant recipients in their Annual Performance Reports. The data are captured in the Performance Tracking Databases of each area Office of Native American Programs and then aggregated into a national database at headquarters. Each annual reporting period includes program activities that occurred in each grantee’s respective fiscal year, if ended by June 30. This is because Indian Housing Block Grant recipients have 60 days after their FY ends to report; recipients whose FYs end after June 30 report in the next federal fiscal year. Accomplishments reported in this document will likely require revision by mid-year, due to grantees reporting late and submitting corrections to their Annual Performance Reports.
A1.4: The number of public housing agencies (PHAs) that are determined to be over-leased in July 2006 decreases by 50 percent from the number of PHAs that were over-leased in July 2004. The FY 2007 Annual Performance Plan (see Appendix A) deleted the FY 2006 indicator because the methodology for allocating funds has been changed and so over-leasing no longer exists as an issue.
137

PERFORMANCE AND ACCOUNTABILITY REPORT
A1.5: FHA endorses at least 1,000 multifamily mortgages. Background: FHA multifamily mortgage insurance is vitally important to a number of segments in the housing industry, including small builders, buyers or owners of aging inner-city properties, and nonprofit sponsors. FHA brings stability to the mortgage market for multifamily housing. FHA’s unique and valuable products include insurance that covers both the construction financing and long-term permanent financing of modest-cost rental housing, insurance for assisted living facilities, and a vehicle to help lenders (including those with public purpose missions, such as housing finance agencies) obtain the benefits of Ginnie Mae securitization. FHA also retains a leadership position in the market for high loan-to-value and long-term, fully-amortizing multifamily loans that make rental housing more affordable. The FY 2006 goal was to initially endorse at least 1,000 multifamily loans under HUD’s Basic FHA or Risk Sharing programs. Maintaining FHA multifamily volume will help fulfill the outcome goal of making more decent rental housing available to consumers at a modest cost.
Program website: http://www.hud.gov/offices/hsg/mfh/mfdata.cfm
Results, impact, and analysis. Multifamily Housing exceeded the goal’s target of 1,000 loans. During FY 2006 Multifamily initially endorsed 1,016 loans: 931 under the basic FHA insurance programs, representing 102,766 units, and 85 under risk sharing arrangements with state housing finance agencies, Fannie Mae, and Freddie Mac, representing 9,253 units. These 1,016 loans totaled $5.13 billion and built, repaired or refinanced 112,019 units of housing. This is essentially the same level of activity as FY 2005, when 1,017 loans were initially endorsed.
Despite the anticipated lower level of overall multifamily insurance activity this fiscal year due to uncertain and fluctuating interest rates during the year, essentially the same number of loans was financed as in FY 2005.
Data discussion. The data originates in the Office of Housing’s Multifamily Insurance System, and for convenience are reported from the Real Estate Management System. The data, which are based on a straightforward and easily verifiable count of endorsements completed, ajudged to be reliable for this measure. FHA monitors the quality of data submitted by lenders. An independent assessment in 1999 showed that Real Estate Management System data passed automated tests for validity, completeness, and consistency. A data quality assessment completed for the Real Estate Management System in FY 2001 identified no problems that compromised this measure. An independent assessment in 2003 showed that Multifamily Insurance System performance indicator data passed 3-sigma quality tests (reflecting fewer than 66,807 errors per million) for validity, completeness, and consistency.
FHA Mult ifa m ily Mor tga ge Endor se m e nts
1,3311,497
1,017 1,0161,000
0
500
1000
1500
2003 2004 2005 2006
num
ber
of m
ortg
ages
m ult ifam ily m or tgages endorsedoutput goalre
A1.6: Ginnie Mae securitizes at least 90 percent of eligible FHA multifamily mortgages. Background: Formed by Congress in 1968 as the Government National Mortgage Association, Ginnie Mae is a wholly owned instrumentality of the United States government located within
138

SECTION 2. PERFORMANCE INFORMATION PROMOTE DECENT AFFORDABLE HOUSING
HUD. Section 306(g) of the National Housing Act authorizes Ginnie Mae to facilitate the financing of residential mortgage loans insured or guaranteed by the Federal Housing Administration (FHA), the Department of Veterans Affairs (VA), and the Rural Housing Service (RHS).
Ginnie Mae’s Mortgage-Backed Securities program has been a significant contributor to the growth of the mortgage-backed securities market in the United States as well as to the expansion of homeownership opportunities for American families. This participation by Ginnie Mae in the capital markets of our nation has provided an efficient link between Wall Street and homebuyers. By making Ginnie Mae securities attractive to investors, Ginnie Mae ensures that a continuous flow of capital is available for multifamily lending throughout the country. Under the terms of its Mortgage-Backed Securities program, Ginnie Mae guarantees the timely payment of principal and interest on pools of federally-insured mortgages. Ginnie Mae’s obligations are backed by the full faith and credit of the United States.
When Ginnie Mae was established in 1968, it was given primary responsibility for facilitating an efficient secondary mortgage market for government-insured or -guaranteed mortgages to serve low- and moderate-income homebuyers. Ginnie Mae provides financial incentives for lenders to increase loan volumes in traditionally underserved areas through its Targeted Lending Initiative. The program was established in October, 1996 to help raise homeownership levels in central city areas and was later expanded to include Rural Empowerment Zones, Rural Enterprise Communities, and Indian lands.
Program website: www.ginniemae.gov
Results, impact, and analysis. In FY 2006, Ginnie Mae securitized 96.9 percent of eligible FHA multifamily mortgages, helping to provide millions of low- and moderate-income Americans with affordable housing. This performance exceeded the goal of 90 percent of eligible FHA multifamily mortgages, and reflects a substantial increase over the 91.1 percent achieved in FY 2005. Ginnie Mae’s multifamily program continued to grow through FY 2006, but at a slower pace than in previous years. As a result, multifamily security issuances were $8 billion in FY 2006, a decline of $500 million from FY 2005. However, the program’s remaining principal balance at the end of FY 2006 was $37.8 billion, a $2.5 billion increase over FY 2005. This reflects the appeal of multifamily government-guaranteed securities to investors. Ginnie Mae’s multifamily division exceeded its goal in large part due to the large pipeline of established construction loan projects already underway prior to the current fiscal year. Construction levels for these projects were unaffected by the rise in short-term interest rates experienced over the past 12 months. Continued customer service outreach efforts have had a positive impact on the retention of Ginnie Mae issuers and related securities production.
Eligible FHA Mult ifa m ily Mor tga ge s Se cur it ize d by Ginnie Ma e
96.9%91%92.4%91% 90%
60%
80%
100%
2003 2004 2005 2006perc
ent
of e
ligib
le F
HA
mul
tifam
ily m
ortg
ages
secur it ized m or tgagesoutput goal
Data discussion: This measure is based on a Ginnie Mae database of multifamily loan securities compared with eligible insured mortgages in an FHA multifamily database. Ginnie Mae and FHA data are subject to annual financial statement reviews by the Office of Inspector General,
139

PERFORMANCE AND ACCOUNTABILITY REPORT
which also audits Ginnie Mae’s data systems each year and has consistently given Ginnie Mae an unqualified, or clean, opinion in financial statement audits of prior fiscal years as well as for FY 2006.
A1.7: HUD will complete 80 percent of the initial FY 2006 Mark-to-Market pipeline during the fiscal year, reducing rents and restructuring mortgages where appropriate. Background. The Mark-to-Market program seeks to preserve affordable housing stock by maintaining the long-term physical and financial integrity of such housing and to reduce the Section 8 rental assistance costs and the cost of FHA insurance claims. Under the Mark-to-Market program, the Office of Affordable Housing Preservation analyzes FHA-insured multifamily properties for which Section 8 rents exceed comparable market rents, and reduces Section 8 rents to bring them in line with comparable market rents or levels that preserve financial viability. Properties also are eligible for full debt restructuring that involves a write-down of the existing mortgage in conjunction with the reduced rent levels. This indicator measures completions and closings as a percentage of projects in the pipeline at the beginning of the fiscal year.
Results, impact, and analysis. The Department completed 86 percent of the initial FY 2005 pipeline, thus exceeding the goal. In FY 2006, the Office of Affordable Housing Preservation completed/closed 286 properties under the Mark-to-Market program, resulting in annual Section 8 savings (non-incurrence of cost) of more than $30 million. The Office of Affordable Housing Preservation’s initial active pipeline on October 1, 2005, was 333 assets.
Ma r k - to- Ma r k e t De a ls Com ple te d a s Pe r ce nta ge of FY Pipe line
75% 72%82% 86%
80%
0%
50%
100%
2003 2004 2005 2006perc
enta
ge o
f pi
pelin
e
M2M deals com pleted/ closedoutput goal
Throughout FY 2006, the Office of Affordable Housing Preservation continued efforts to reach out and improve communication and coordination with HUD staff, performance based contract administrators, owners, and industry groups. The purpose was to educate owners, HUD staff, and other stakeholders about the Mark-to-Market program. As a result, 124 new referrals were received into the Mark-to-Market program and 102 properties re-entered the Mark-to-Market program, for a total of 226 referrals for the fiscal year. Under the “Once Eligible, Always Eligible” provision in the statute, any property that was initially eligible for the Mark-to-Market program but failed to close as a full debt restructuring remains eligible to re-enter the program. The Office of Affordable Housing Preservation continues its efforts under the Mark-to-Market program to preserve the affordability and availability of low-income rental housing and reducing long-term project-based Section 8 rental assistance costs. Overall, an average of 24 projects per month were completed/closed and an average of 19 new referrals were received per month. Over 2,900 properties, resulting in Section 8 savings (non-incurrence of cost) of approximately $216 million per year, have been completed/closed under the Mark-to-Market program since FY 2000.
140

SECTION 2. PERFORMANCE INFORMATION PROMOTE DECENT AFFORDABLE HOUSING
Data discussion. This measure uses data from the Mark-to-Market Management Information System. Results are reported on a fiscal year basis. Values reflect status as of September 2006, including revisions to previously-reported results caused by properties re-entering the Mark-to-Market program under the “Once Eligible, Always Eligible” provision. The Office of Affordable Housing Preservation has put into place various data quality checks to ensure that the information stored in the Mark-to-Market Management Information System is reliable and complete. Monthly data integrity meetings are held between the Office of Affordable Housing Preservation’s system manager and its Production Office staff. These meetings focus on timeliness in updating the system as the various milestones of the properties are completed, and reviewing system reports to ensure that dates and data are within established parameters. During the audits of Participating Administrative Entities the performance dates are reviewed against three sources: dates entered into the Mark-to-Market Management Information System; dates recorded in the their final files; and dates shown on supporting documents such as the date the appraisal was completed. For those properties that received a full debt restructuring, staff also examine three separate data sources to be sure all entered data are consistent. The sources include data entered into the Mark-to-Market underwriting model, information reported in the closing dockets, and data entered into the Mark-to-Market Management Information System. The Mark-to-Market system is primarily used to track the milestones completed and final rent determinations for each Mark-to-Market property, enabling the Office of Affordable Housing Preservation to measure performance, estimate savings, and provide budget projections.
A1.8: HUD will continue to monitor and enforce Fannie Mae’s and Freddie Mac’s performance in meeting or surpassing HUD-defined targets for special affordable multifamily mortgage purchases. Background: This indicator tracks the performance of Fannie Mae and Freddie Mac (two housing government-sponsored enterprises) in providing capital for special affordable multifamily housing. The special affordable multifamily housing goal supports HUD’s mission of promoting the creation of new affordable dwelling units by ensuring that both Fannie Mae and Freddie Mac provide market liquidity through multifamily purchase programs targeted to the housing needs of low-income and very low-income families. Fannie Mae and Freddie Mac purchase, guarantee, or acquire interests in multifamily mortgages secured by residential properties that contain at least five dwelling units. When a government-sponsored enterprise acquires a multifamily mortgage, or an interest in such mortgages, it is entitled to count the mortgage towards the calculation of the special affordable multifamily target to the extent that the dwelling units financed by the mortgage meet HUD’s eligibility requirements. Qualifying multifamily mortgages are those that fund dwelling units affordable to families earning incomes not exceeding 60 percent of the area median income, or that are affordable to families earning incomes not exceeding 80 percent of the area median income who are living in low-income areas. Beginning in calendar year 2005, HUD increased the special affordable multifamily goal from $2.11 billion to $3.92 billion for Freddie Mac and from $2.85 billion to $5.49 billion for Fannie Mae.
Program website: http://www.hud.gov/offices/hsg/gse/gse.cfm
141

PERFORMANCE AND ACCOUNTABILITY REPORT
Results, impact, and analysis. In calendar year 2005, both government-sponsored enterprises exceeded the special affordable multifamily goal. Fannie Mae purchased $10.39 billion of qualifying multifamily mortgages, while Freddie Mac purchased $12.35 billion.
Fa nnie Ma e Pe r for m a nce Re la t iv e to Spe cia l Af for da ble Mult ifa m ily
Ta r ge t
$7.57
$10.39
$7.32
$12.23
$5.49
$0
$5
$10
$15
2002 2003 2004 2005
$ bi
llion
special affordable m ult ifam ily volum eoutput goal
Small (5-50 unit) multifamily properties are an important share of the government-sponsored enterprises’ purchases because these properties typically serve lower-income families. In 2004, Fannie Mae’s percentage of qualifying small multifamily properties was 11.9 percent of all its qualifying multifamily purchases. In 2005 the percentage had risen to 15.0 percent. In 2004 Freddie Mac’s qualifying small multifamily purchases were 9.7 percent of all qualifying multifamily purchases. In 2005, the corresponding percentage fell to 3.6 percent.
Data discussion: The data reported for this goal are based on calendar year performance. There is a one-year reporting lag because the government-sponsored enterprises report to HUD in the year following the performance year. In addition, because the government-sponsored enterprises’ quarterly data is confidential and proprietary, the Department is unable to disclose Fannie Mae’s and Freddie Mac’s goal performance for the current calendar year. To ensure the reliability of data, Fannie Mae and Freddie Mac apply various quality control measures to data elements provided to HUD. The Department verifies the data through comparison with independent data sources, replication of Fannie Mae’s and Freddie Mac’s goal performance reports, and reviews of their data quality procedures. Fannie Mae’s and Freddie Mac’s financial reports are verified by independent audits.
Fr e ddie Ma c Pe r for m a nce Re la t iv e to Spe cia l Af for da ble Mult ifa m ily
Ta r ge t
$7.77
$12.35
$8.79
$5.22 $3.92
$0
$5
$10
$15
2002 2003 2004 2005
$ bi
llion
special affordable m ult ifam ily volum eoutput goal
A1.9: At least 70 percent of clients receiving rental or homeless counseling either find suitable housing or receive social service assistance to improve their housing situation. Background: The Department is placing more emphasis on housing counseling, including counseling for homeless clients and families seeking affordable rental housing. The success of this program is evidenced by the more than doubling of its appropriations from $20 million in FY 2001 to $42 million in FY 2006. Depending on the state of the economy and the housing market, demand for various types of counseling rises and falls, and may vary for reasons outside of HUD’s control. The Department is confident, however, that HUD-approved agencies are providing quality counseling services that will help clients successfully resolve their housing problems regardless of how many clients are served in a given year. As a result, HUD revised this indicator in FY 2006 to focus on outcomes associated with clients receiving rental or homeless counseling rather than the number of clients served. The FY 2006 performance goal is
142

SECTION 2. PERFORMANCE INFORMATION PROMOTE DECENT AFFORDABLE HOUSING
to ensure that at least 70 percent of clients receiving rental or homeless counseling either find suitable housing or receive social service assistance to improve their housing situation by the end of the fiscal year.
Program website: http://www.hud.gov/offices/hsg/sfh/hcc/hcc_home.cfm
Results, impact, and analysis. Although actual FY 2006 results are not yet available, HUD anticipates that 75 percent of clients receiving rental or homeless counseling will have either found suitable housing or received social service assistance to improve their housing situation. This projection represents actual results from FY 2005 and exceeds the FY 2006 goal of 70 percent. There is no reason to anticipate a decrease in program pin FY 2006 as efforts to improve program efficiency and effectiveness continue to be made. Actual FY 2006 outcome data will become available early in FY 2007. HUD-approved housing counseling agencies are given 90 days after the end of a fiscal year to report the results of counseling activity for that fiscal year.
Rental/ Homeless Counseled Receive Housing/ Assistance
75.0% 75.0%70.0%72.9%68.4%
0%
50%
100%
2003 2004 2005 2006
pct
of H
Hs
coun
sele
d
output goalclients counseled clients counseled (projected)
erformance
Data discussion: HUD collects data on renters and homeless clients counseled through the Housing Counseling System (HCS-F11). The data include the total number of clients, the type of counseling received and the results of the counseling. An independent assessment in 2005 showed that Housing Counseling System performance indicator data passed six-sigma quality tests (reflecting fewer than 3.4 errors per million) for validity, completeness, and consistency. However, a major limitation of the data collection instrument is that it does not differentiate the level of counseling given to each client, as the quality and level of counseling provided to each client may vary significantly. To improve the quality of housing counseling data, HUD is implementing a new automated data collection instrument that will enable it to collect client-level data beginning in FY 2007.
A1.10: Reduce energy costs associated with HUD program activities. Background. Energy savings are a key policy area for the Department because approximately $4 billion of HUD’s budget is energy-related and savings will help reduce budget costs and keep the inventory of housing affordable. In FY 2002, HUD adopted a 21-point, Department-wide Energy Action Plan in support of the President’s National Energy Policy. A task force was established to identify measures that HUD could take to support these goals, and included every program area with a current or potential role in supporting energy efficiency. The Energy Action Plan is primarily operational, aimed at upgrading the energy efficiency of existing housing using proven energy-efficient products and appliances that can be put to work immediately in HUD programs, through consumer education and outreach, interagency cooperation, market-based incentives, and public-private partnerships. The Action Plan was intended to be fully implemented over a two-year period, with 50 percent of the actions to be implemented in
143

PERFORMANCE AND ACCOUNTABILITY REPORT
FY 2004, and the balance in FY 2005. By the end of FY 2005, 16 of the 21 percent of all actions were completed.
The goal for FY 2006 was to build on this foundation by developing a Phase II Energy Action Plan that includes several tracking indicators to assess actual performance in reducing energy costs associated with HUD program activities.
Program website: www.hud.gov/energy
Results, impact, and analysis. The goal was fully completed in FY 2006. The Office of Policy Development and Research worked with HUD program offices to develop the Phase II Energy Action Plan. The plan was completed and submitted to Congress on August 8, 2006, in compliance with Section 154 of the Energy Policy Act of 2005. The Act required HUD to prepare and submit an integrated energy strategy for public and assisted housing. In addition, HUD completed the implementation of the 21 items in the Phase I Energy Action Plan. The report can be found at www.huduser.org/publications/destech/energyefficiency.html.
A number of accomplishments in FY 2006 are key to increasing energy savings or better measuring reduced energy savings or expenditures. Results reported through the HUD Integrated Reporting System include: 2,050 housing authorities have a current energy audit; field offices participated in 421 energy-related events; 11 HOPE VI projects were monitored for energy efficiency, and another 172 activities were held promoting Energy Star for public housing authorities.
The Department also continued to make energy a policy priority in discretionary grant programs through HUD’s Super Notice of Funding Availability, and conducted the first webcast/satellite broadcast on the points awarded for energy to grant applicants. CPD included reporting of Energy Star-certified units funded through the HOME Investment Partnerships program or CDBG in the Integrated Disbursement and Information System. PIH contracted with a private vendor to provide technical support to PHAs to implement energy performance contracts, continued to develop a utility benchmarking tool that will assists PHAs in managing energy, and operated a Public Housing Energy Conservation Clearinghouse. Regional Energy Coordinators in each of HUD’s ten Regional Offices continued to play a prominent role in leveraging resources for HUD customers and partners, and, working with field offices in conducting training and outreach. The Offices of Policy Development and Research, CPD, Field Policy Management, PIH, and FHA multifamily staff participated in several workshops or served on panels that provided information to customers or grantees, or field offices on the Energy Action Plan, performance contracting in public housing, and energy management in multifamily housing.
Data discussion. HUD’s Integrated Reporting System is utilized to report energy-related activities that are specified in HUD’s Management Plan. Field offices report energy-related outreach activities for Office of Field Policy and Management goals. Field office activities related to PIH Management Plan goals are reported separately. Some HUD regions (Regions IV, VI, and IX) provide quarterly reports to the Energy Task Force on regional activities. Headquarters program offices do not provide regular quarterly reports.
Other data collection and tracking mechanisms utilized by the Department for monitoring energy-related activities include the following:
144
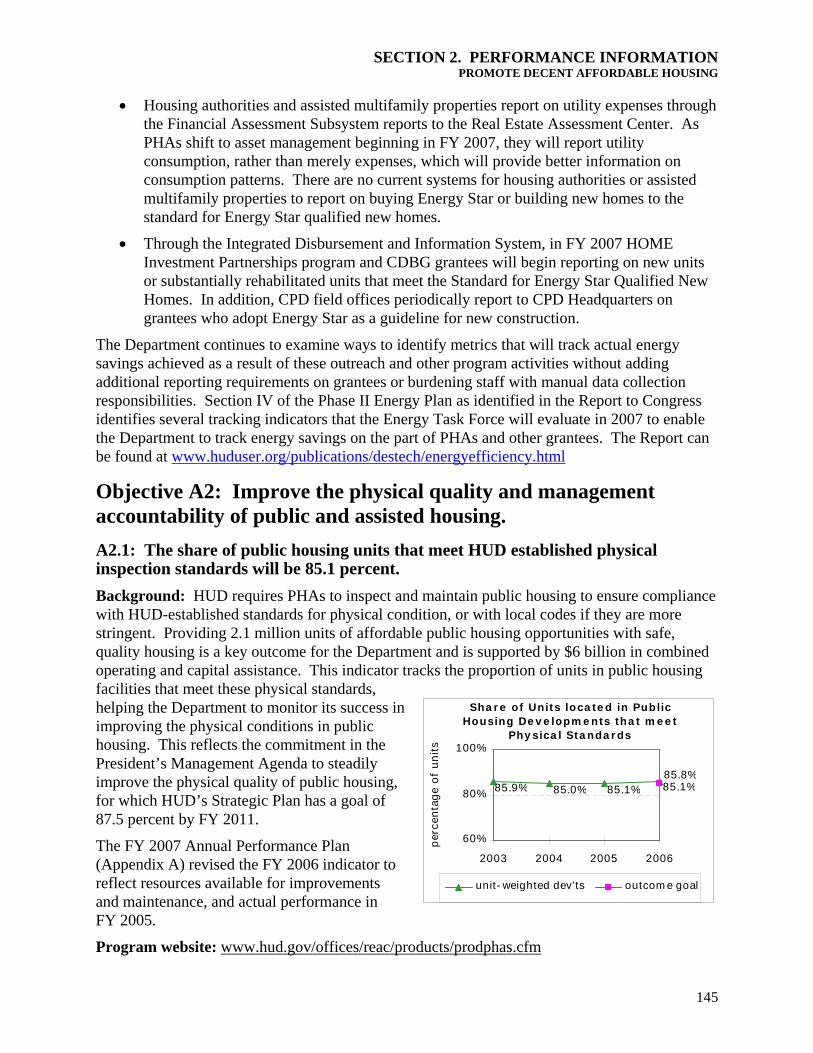
SECTION 2. PERFORMANCE INFORMATION PROMOTE DECENT AFFORDABLE HOUSING
• Housing authorities and assisted multifamily properties report on utility expenses through the Financial Assessment Subsystem reports to the Real Estate Assessment Center. As PHAs shift to asset management beginning in FY 2007, they will report utility consumption, rather than merely expenses, which will provide better information on consumption patterns. There are no current systems for housing authorities or assisted multifamily properties to report on buying Energy Star or building new homes to the standard for Energy Star qualified new homes.
• Through the Integrated Disbursement and Information System, in FY 2007 HOME Investment Partnerships program and CDBG grantees will begin reporting on new units or substantially rehabilitated units that meet the Standard for Energy Star Qualified New Homes. In addition, CPD field offices periodically report to CPD Headquarters on grantees who adopt Energy Star as a guideline for new construction.
The Department continues to examine ways to identify metrics that will track actual energy savings achieved as a result of these outreach and other program activities without adding additional reporting requirements on grantees or burdening staff with manual data collection responsibilities. Section IV of the Phase II Energy Plan as identified in the Report to Congress identifies several tracking indicators that the Energy Task Force will evaluate in 2007 to enable the Department to track energy savings on the part of PHAs and other grantees. The Report can be found at www.huduser.org/publications/destech/energyefficiency.html
Objective A2: Improve the physical quality and management accountability of public and assisted housing. A2.1: The share of public housing units that meet HUD established physical inspection standards will be 85.1 percent. Background: HUD requires PHAs to inspect and maintain public housing to ensure compliance with HUD-established standards for physical condition, or with local codes if they are more stringent. Providing 2.1 million units of affordable public housing opportunities with safe, quality housing is a key outcome for the Department and is supported by $6 billion in combined operating and capital assistance. This indicator tracks the proportion of units in public housing facilities that meet these physical standards, helping the Department to monitor its success in improving the physical conditions in public housing. This reflects the commitment in the President’s Management Agenda to steadily improve the physical quality of public housing, for which HUD’s Strategic Plan has a goal of 87.5 percent by FY 2011.
Sha r e of Units loca te d in Public Housing De v e lopm e nts tha t m e e t
Phy sica l Sta nda r ds
85.9% 85.0% 85.1%85.8%85.1%
60%
80%
100%
2003 2004 2005 2006
perc
enta
ge o
f un
its
unit- weighted dev'ts outcom e goal
The FY 2007 Annual Performance Plan (Appendix A) revised the FY 2006 indicator to reflect resources available for improvements and maintenance, and actual performance in FY 2005.
Program website: www.hud.gov/offices/reac/products/prodphas.cfm
145
PERFORMANCE AND ACCOUNTABILITY REPORT
Results, impact, and analysis. In FY 2006, 90.9 percent of the properties, representing 85.8 percent of public housing units, met or exceeded HUD’s physical condition standards and thus the goal was met. This is a significant improvement from FY 2005 in which 85.1 percent of public housing units met or exceeded HUD’s standards. With this success, the Department is furthering its high priority goal of promoting decent affordable housing.
Data discussion. Data for this indicator are from the Real Estate Assessment Center’s Physical Assessment Subsystem. Inspections at PHAs are conducted by contractors and are based on a statistically valid random sample of selected buildings and dwelling units within a property. Inspections are scored by the Real Estate Assessment Center system at the property level. The results of project inspections are then aggregated at the PHA level into a Public Housing Assessment System Physical Indicator score and reported as one of four components of the Public Housing Assessment System rule scoring process. An independent assessment in 2002 showed that PHAS-PASS performance indicator data passed 4-sigma quality tests (reflecting fewer than 6,210 errors per million) for validity, completeness, and consistency.
A2.2: The share of assisted and insured privately owned multifamily properties that meet HUD-established physical standards are maintained at no less than 95 percent. Background. This performance goal builds on recent successes and exceeds the benchmark established in the President’s Management Agenda, setting a goal that at least 95 percent of assisted multifamily properties will continue to meet HUD-established physical standards. This is a very high performance rate and reflects the important outcome goal of providing healthy, quality, and safe housing for HUD’s multifamily inventory.
Program website: http://www.hud.gov/offices/reac/products/pass/pass_reverse_auction.cfm
Results, impact, and analysis. In FY 2006, as of the latest inspection, 28,206 of 29,722 properties in Multifamily’s portfolio (95 percent) were found to have acceptable physical condition, thereby meeting the goal. The properties in acceptable condition contain approximately 94 percent of the multifamily units. The multifamily program is on a “3-2-1” inspection schedule, so that the higher-performing properties are not re-inspected every year like troubled properties; their scores carry forward until a new inspection is conducted.
Sha r e of Units loca te d in Assiste d Mult ifa m ily De v e lopm e nts tha t
m e e t Phy sica l Sta nda r ds
93.9% 94.4% 96.0% 95.0%95.0%
60%
80%
100%
2003 2004 2005 2006
unit- weighted developm ents (insp.as of 9/ 30)
outcom e goal
For properties that fail to meet physical condition standards, Multifamily Housing has implemented a stringent program to bring them into compliance through certain, consistent, timely follow-up action with severe consequences for failure. Properties scoring below 60 receive immediate attention. Upon the first inspection score below 60, the owner is flagged for non-compliance in HUD’s Active Partners Performance System and referred to the Departmental Enforcement Center. The Departmental Enforcement Center, issues a Notice of Violation, and/or a Notice of Default, and meets with the owner to put the owner on notice that failure to correct the deficiencies will result in severe action. The owner is given 60 days to make
146

SECTION 2. PERFORMANCE INFORMATION PROMOTE DECENT AFFORDABLE HOUSING
necessary repairs to bring the property into compliance. If upon re-inspection, the property again fails to meet standards, severe actions are taken. For those properties that the owner either cannot or will not bring into compliance, the alternatives are to force a change in ownership that can bring the property up to standard, or to sever HUD’s association with the property by abating any subsidies, and/or directing acceleration and foreclosure for insured properties.
Between June 1, 2002, and September 30, 2006, HUD identified 1,254 properties nationally (about 4 percent of its portfolio) judged to be substandard by twice failing Real Estate Assessment Center physical inspection. Of these, 578 were resolved in prior fiscal years. At the beginning of FY 2006, 252 properties were being monitored to assure compliance with Compliance Disposition Enforcement plans and 133 were being actively reviewed to be put under a Compliance Disposition Enforcement plan. During the fiscal year, an additional 121 properties were added by twice failing a Real Estate Assessment Center physical inspection. At the end of the fiscal year, of the 128 under active review for resolution, 137 were brought up to standard condition or removed from HUD’s portfolio, and an additional 54 properties have Compliance Disposition Enforcement Plans active. The remaining 128 properties remain under review and face pending actions, which may include third party inspections, litigation, or bankruptcy proceedings.
Data discussion: Data for this indicator are from the Real Estate Assessment Center’s Physical Assessment Subsystem. For private multifamily properties, results for FY 2006 reflect the most recent inspections available as of September 30, 2006. Under the inspection protocols, a substantial share of properties was not scheduled to receive a new inspection during FY 2006; therefore, earlier scores were carried forward.
A2.3: The unit-weighted average Public Housing Assessment System (PHAS) score is maintained at the FY 2005 level of 85.8 percent. Background: The Public Housing Assessment System scores provide an indication of the quality of the housing stock and the management conditions within which public housing residents live. By improving these scores, HUD is working to further its commitment in the President’s Management Agenda to steadily improve the quality of public housing. The Public Housing Assessment System assesses the performance of PHAs based on their physical and financial condition and their management quality (30 points each), as well as on resident satisfaction (10 points), for a total score of up to 100 points. Housing agencies with composite scores below 60 points or scores below 18 points for any one component are classified as “troubled” agencies.
The 2007 Annual Performance Plan (see Appendix A) revised the FY 2006 indicator. The Department has set the goals for FY 2006 and FY 2007 at the same levels of performance as FY 2005 since the FY 2005 average should account for most, if not all, of the inspection methodology changes. However, since HUD is not certain that the entire impact of these changes took affect in FY 2005, the Department will carefully review the results for FY 2006 and adjust goals for future periods if required.
Program website: www.hud.gov/offices/reac/products/prodphas.cfm
Results, impact, and analysis. By the end of FY 2006, the unit-weighted average Public Housing Assessment System score was 85.0 percent and, thus, the Department did not meet its goal. This is a slight decrease from the level reported in HUD FY 2005 Performance and
147

PERFORMANCE AND ACCOUNTABILITY REPORT
Accountability Report (85.8%), but does not reflect a meaningful change in the overall quality of the Country’s public housing stock, or the management conditions within with each public housing resident lives.
Unit-Weighted Average Public Housing Assessment System Score
FY 2004 FY 2005 FY 2006 FY 2006 Goal
86.9 85.8 85.0 85.8
Reasons for shortfall/Performance improvement plans. The Department is taking several steps that will improve the overall management and unit quality of the nation’s PHAs. These efforts will be reflected in future Performance and Accountability Reports. For instance, HUD is focusing its limited resources on improving PHAs designated as “troubled.” Through assistance from HUD’s Headquarters and field offices and/or receivership, the Department has been successful at turning around most “troubled” PHA in two to three years. Also, HUD’s field offices will continue to conduct targeted reviews of PHAs that are not “troubled” but are at risk of becoming substandard or troubled. These reviews are targeted to one or more specific programs/functions, as a result of the risk assessment process or recent field monitoring and oversight. In addition, HUD has begun implementing an asset-based management model for public housing agencies that manage the vast majority of the public housing stock. This property management technique mirrors the private sector, and will provide PHAs with better information to manage their portfolios and allow HUD to focus resources on the few individual public housing properties with the most problems.
As noted above, the small shortfall can be attributed to a methodology change that resulted in a lack of consistent baseline to calculate the unit-weighted average Public Housing Assessment System score. This indicator consists of the most recent Public Housing Assessment System scores regardless of when there were released, which makes comparative analysis very difficult, if not impossible. As noted in the FY 2007 Annual Performance Plan, the Department is still working to monitor and study this goal to determine if additional changes can be added to establish a stable baseline and improve data quality, collection, and analysis.
Data discussion: The data sources are the Real Estate Assessment Center-Public Housing Assessment System database. Some PHAs were excluded from this analysis. These consisted of agencies designated as “Moving to Work,” “Invalidated,” and “Advisory.” This data is based on independent physical inspections of properties. The Real Estate Assessment Center physical assessment program ensures the proper application and interpretation of the inspection protocol and verifies the accuracy of inspection scores. An independent assessment in 2002 showed that the Public Housing Assessment System database data passed 4-sigma quality tests (reflecting fewer than 6,210 errors per million) for validity, completeness, and consistency.
A2.4: For households living in assisted and insured privately owned multifamily properties; the share of properties that meets HUD’s financial management compliance is maintained at no less than 98 percent. Background: The Real Estate Assessment Center evaluates the financial management of HUD-involved, privately-owned multifamily properties based on generally accepted accounting
148

SECTION 2. PERFORMANCE INFORMATION PROMOTE DECENT AFFORDABLE HOUSING
principles. Through the Center’s Internet based Financial Assessment Subsystem, multifamily owners electronically submit financial information. This is a very high rate of performance that has been achieved in recent years and represents an increase from the previous target of 95 percent. This performance helps to ensure the financial health of units in HUD’s affordable housing inventory and supports the retention of this resource of safe, quality, affordable housing. Data are validated, reviewed, and scored. Multifamily project managers in the field offices are responsible for resolving all compliance issues or findings. The goal is to maintain high compliance and successful resolutions so that at least 98 percent of the properties submitting audited financial statements either have no compliance issues or audit findings, or have such issues or findings closed (resolved) by the end of the fiscal year. Owners not submitting their audited financial statements in a timely manner are referred to the Departmental Enforcement Center.
The FY 2007 Annual Performance Plan (see Appendix A) revised upward the FY 2006 goal to reflect the achievement levels from the past two fiscal years.
Program website: http://www.hud.gov/offices/reac/products/prodmf.cfm#fass-audit
Results, impact, and analysis. In FY 2006, of the 17,981 properties reporting, 14,095, or 78 percent, had no financial compliance findings while a total of 17,681, or 98 percent, were in compliance by the end of the fiscal year meeting the goal of 98 percent. There were a total of 558 owners referred to the Departmental Enforcement Center in FY 2006 due to statements not being filed in a timely manner.
In addition to the FHA insured multifamily properties, the Financial Assessment Salso scores financial statements for other HUD-involved property (i.e., most subsidized uninsured properties). This score is used as only one criterion in the ranking of a field office’s or a project manager’s portfolio. The ranking is done for risk management purposes to focus attention on the weaker properties or properties that have a higher degree of risk.
Subsidized Multifamily Properties w ith All Financial Compliance and
Audit I ssues Resolved
95%98% 98% 98%
98%
80%
90%
100%
2003 2004 2005 2006perc
ent
of p
rope
rtie
s w
ith s
ubm
itted
aud
its
no unresolved f indingsoutput goal
ubsystem
Data discussion: Initial compliance findings are identified by the Real Estate Assessment Center’s Financial Assessment Subsystem. The Real Estate Management System is used for tracking the Office of Multifamily Housing’s corrective actions. The Financial Assessment Subsystem financial assessment is a process validated by the American Institute of Certified Public Accountants. The Real Estate Assessment Center performs Quality Assurance Reviews of the audited financial statements submitted by independent public accountants. These reviews provide assurance that the audited statements are accurate and reliable and that audits are conducted in accordance with government and professional standards. The Financial Assessment Subsystem incorporates extensive data checks and both targeted and random review by independent auditors.
149

PERFORMANCE AND ACCOUNTABILITY REPORT
A2.5: The HOPE VI Revitalization program for public housing relocates 1,400 households, demolishes 2,600 units, completes 6,500 new and rehabilitated units, occupies 6,300 units, and completes 15 projects in FY 2006. Background: The HOPE VI Revitalization program has been HUD’s primary program for redeveloping the worst public housing by demolishing unsustainable developments and rebuilding communities in accordance with community-sensitive principles. This indicator tracks the implementation of HOPE VI redevelopment plans in terms of five key outputs: households relocated to permit redevelopment, units demolished, new and rehabilitated units completed, units occupied, and project completion. Project completion means all units (whether public housing, tax credit, market-rate, or homeownership) proposed in the revitalization plan for the project have been completed, and thus that the overall revitalization effort is largely accomplished. The annual goals reflect planned achievements based on HOPE VI plans submitted to HUD by PHAs. Together, these output goals contribute to the outcome goal of improving the physical quality of public and assisted housing – a commitment in the President’s Management Agenda.
The FY 2007 Annual Performance Plan (see Appendix A) reduced the number of projects to be completed during FY 2006 from 20 to 15 to reflect changed circumstances, including increased construction costs and delays resulting from recent hurricanes.
Program website: www.hud.gov/offices/pih/programs/ph/hope6/about/description.cfm
Results, impact, and analysis. The HOPE VI Revitalization program successfully accomplished four of five program output goals. However, with only three quarters of data, the Department is unable to verify total success in accomplishing all five goals. After only three quarters (July 1, 2005 - March 31, 2006), the HOPE VI Revitalization program exceeded its redevelopment plans for relocation, unit completion, and occupancy when compared to the goals for four quarters of FY 2006. Grantees relocated 2,962 households to permit redevelopment, approximately 112 percent above the goal of 1,400 relocations. Completions of new or rehabilitated units totaled 7,085, which is nine percent more than the 6,500-unit goal. Families occupied 8,081 units, approximately 28 percent over the goal of 6,300 occupied units. In addition, the Department completed 17 projects through the fourth quarter (June 30, 2006) – two more than the target.
Despite the program’s substantial success of completing these goals, HUD is unable to verify success at accomplishing the demolition goal of 2,600 units. After the first three quarters of data, HUD verifies that grantees have demolished 2,305 units – just short of the goal. Though the Department believes this goal was met in FY 2006, the fourth quarter data is not available.
150

SECTION 2. PERFORMANCE INFORMATION PROMOTE DECENT AFFORDABLE HOUSING
HOPE VI Achievements
FY 2004* FY 2005** FY 2006***
FY 2006
goal Households Relocated 4,618 4,702 2,962 1,400 Units Demolished 4,919 7,809 2,305 2,600 Units Completed (Constructing or Rehab) 4,132 9,632 7,085 6,500 Units Occupied 4,210 8,467 8,081 6,300 *For the nine months ended June 30, 2004. **For the 12 months ended June 30, 2005. ***Because the quarterly progress reporting system is not available, the most recent three quarters of data are provided, for the nine months ended March 31, 2006. Based on the 54-month implementation period for HOPE VI grants, since program inception a cumulative total of 63,885 households had been relocated, 78,115 units had been demolished, 50,482 units (new and rehabilitated) had been completed, and 48,012 completed units had been occupied. With approximately $1.74 billion in HOPE VI funds awarded but not yet expended, HUD continues to work closely with grantees to implement the grants in a timely manner and to positively impact the affected communities.
Because HUD only had data for three quarters of FY 2006, the program’s success towards its output goals cannot yet be verified. However, HUD is in the process of establishing a new data collection contract. In next year’s Performance and Accountability Report, HUD plans to have complete data for FY 2006 and FY 2007.
The HOPE VI program office continues to emphasize timeliness and accountability in the implementation of HOPE VI grants in order to achieve its goals. The primary tool for achieving these objectives include vigilant management and monitoring of grants by grant managers, holding PHAs accountable to following their program schedule, extensive use of the quarterly progress reporting system in all aspects of the HOPE VI program, risk assessment of grantees, and a range of programs and policy guidance. As noted above, four of the five annual measures have been accomplished.
Data discussion: Data are judged to be reliable for this measure. The data are submitted quarterly to HUD by PHAs via PIH’s HOPE VI quarterly progress reporting system. Submitted data are reviewed by HUD staff and are verified through grant management activities and site visits. HUD headquarters staff reviews the reports each quarter and compares progress to stated goals and the results of on-site visits by HUD staff and, in some cases, the Army Corps of Engineers. Field staff verifies reports of redevelopment progress through site visits. The system has been subject to routine integrity checks by the system administrator. Although the OIG and the GAO have not audited the system itself, they have used its data in their reviews of the HOPE VI program.
Only three quarters of data (July 1, 2005 through March 31, 2006) are provided because the quarterly progress reporting system has not been available to collect the data for the quarter ending June 30, 2006. This system became unavailable due to a lack of funding. However, Congress has since made funds available, and a process is underway to procure a new contract
151

PERFORMANCE AND ACCOUNTABILITY REPORT
for the system support. While it is possible to use internal information to confirm project completions through June 30, 2006, the program office is not able to collect and verify with accuracy the other data elements for every grant in order to determine the totals for the other key outputs.
HOPE VI Cumulative Achievements
FY 2003 FY 2004* FY 2005** FY 2006*** Achievement Standard****
Households Relocated 51,603 56,221 60,923 63,885 65,713 Units Demolished 63,082 68,001 75,810 78,115 85,532 Units Completed 29,633 33,765 43,397 50,482 85,593 Units Occupied 27,254 31,464 39,931 48,012 85,593 *The FY 2004 cumulative data is as of June 30, 2004, as reported in the FY 2004 PAR. **As of June 30, 2005. ***As of March 31, 2006. ****The Achievement Standard is based on grantees’ planned achievements, taking into consideration Grant Agreement deadlines and factors influencing performance. Standards are: Relocation and demolition should be 100 percent complete for FY 1993-2002 grantees, and 75 percent complete for FY 2003 grantees. Unit completion and occupancy should be 100 percent complete for FY 1993-1999 grantees, and partially completed, based on decreasing percentages, for FY 2000-2003 grantees.
A2.6: The percent of public housing units under management of troubled housing agencies at the beginning of FY 2006 decreases by 15 percent by the end of the fiscal year. Background. PIH and the Real Estate Assessment Center use the Public Housing Assessment System to evaluate the performance of PHAs based on four components: physical condition, management operations, financial condition, and resident satisfaction. Housing agencies with composite scores below 60 percent, or scores below 18 percent in any one component, are classified as “substandard” or “troubled.” This indicator tracks the change in the number of units managed by “troubled” agencies at the beginning of the fiscal year that successfully return to “standard” status by the end of the fiscal year due to intervention by the Department. Through these efforts, HUD is working to ensure that the country’s public housing properties are high quality, kept safe, and managed properly.
Results, impact, and analysis. HUD successfully met this goal. During FY 2006, the number of units managed by “troubled” PHAs was reduced by 31 percent – exceeding the 15 percent target. On October 1, 2005, 202 PHAs, containing 78,475 low-rent units, were assigned to the PIH field offices. By September 30, 2006, 24,321 of those units were no longer “troubled” after receiving assistance from the PIH field offices and the Recovery and Prevention Corps.
Percent of Units in Troubled PHAs that are Returned to Standard Status
during Fiscal Y ear
31.0%33.0%43.5%
71.8%
15.0%0%
50%
100%
2003 2004 2005 2006
perc
ent
of u
nits
in F
Y co
hort
r eduction in FY cohor toutput goal
152

SECTION 2. PERFORMANCE INFORMATION PROMOTE DECENT AFFORDABLE HOUSING
In order to further reduce the inventory of units managed by “troubled” PHAs, the PIH Office of Field Operations will continue to provide effective monitoring of the field offices’ troubled portfolio and quick intervention to recover troubled PHAs. In addition, the Recovery and Prevention Corps will continue supporting the Public Housing field offices by providing technical assistance, training, and consultation services.
Data discussion. The Troubled List is issued monthly and reports the status of troubled PHAs. PHAs will remain on the Troubled List until they receive a passing Public Housing Assessment System score (i.e. are recovered). For purposes of this analysis, the Department only examines data related to low-rent units. To calculate the percent of troubled housing units that are no longer managed by troubled PHAs, the Department compared the PHAs that were listed on the September 2005 report to the PHAs that are shown on the September 2006 list. Those PHAs that were not reported on the September 2006 list are considered recovered. The number of units managed by the recovered PHAs was used to calculate the percentage decrease in units managed by troubled agencies.
Scores from the management operations and financial conditions components are subject to independent audit, and the physical conditions component scores are based on independent inspections of the PHAs’ properties and are verified through HUD’s quality Assurance Program. An independent assessment in June 2006 showed all 10 data elements met the current data quality standard (4 sigma or 6,210 errors per million) and also passed the 6 sigma target (3.4 errors per million).
A2.7: The proportion of Flexible Voucher Program (formerly Housing Choice Voucher Program) funding managed by troubled housing agencies decreases annually by 10 percent. Reporting on this goal was dependent on enactment of the State and Local Housing Flexibility Act of 2005 (S.771, introduced April 14, 2005), which has not yet happened as of this date. The Department has included the goal in the FY 2007 Annual Performance Plan contingent on enactment of pertinent legislation.
Objective A3: Increase housing opportunities for the elderly and persons with disabilities. A3.1: Increase the availability of affordable housing for the elderly and persons with disabilities by bringing 250 projects to initial closing under Sections 202 and 811. Background. HUD provides a substantial number of housing units for populations with special needs each year. The Section 202 program (Supportive Housing for the Elderly ) and the Section 811 program (Supportive Housing for Persons with Disabilities) provide capital advances for multifamily housing for elderly and disabled households. The outcome of this funding is the expansion of quality and affordable housing for very low-income elderly persons and persons with disabilities. These related programs also serve as national models by demonstrating an effective approach to expanding opportunities for independent living, particularly for frail elderly, and the opportunity to achieve significant medical care-related savings. This indicator measures the number of projects each year that reach the initial closing
153
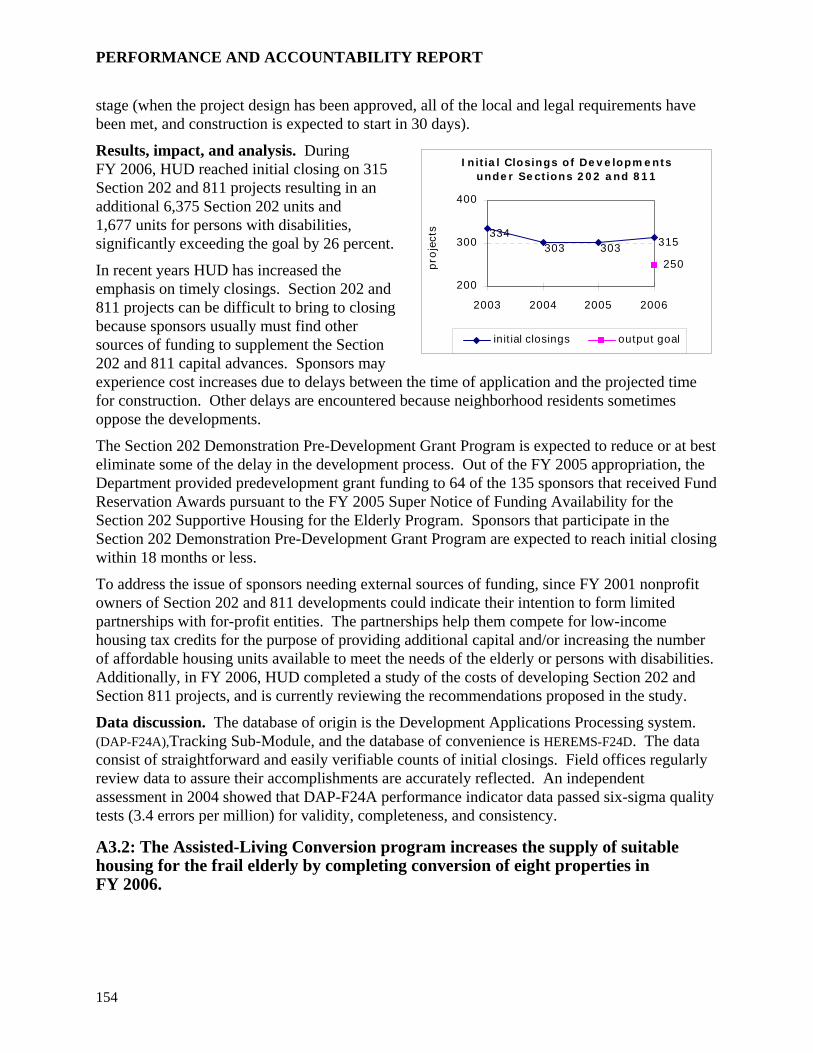
PERFORMANCE AND ACCOUNTABILITY REPORT
stage (when the project design has been approved, all of the local and legal requirements have been met, and construction is expected to start in 30 days).
Results, impact, and analysis. During FY 2006, HUD reached initial closing on 315 Section 202 and 811 projects resulting in an additional 6,375 Section 202 units and 1,677 units for persons with disabilities, significantly exceeding the goal by 26 percent.
In recent years HUD has increased the emphasis on timely closings. Section 202 and 811 projects can be difficult to bring to closing because sponsors usually must find other sources of funding to supplement the Section 202 and 811 capital advances. Sponsors may experience cost increases due to delays between the time of application and the projected time for construction. Other delays are encountered because neighborhood residents sometimes oppose the developments.
I n it ia l Closings of De v e lopm e nts unde r Se ct ions 2 0 2 a nd 8 1 1
250
315303334
303
200
300
400
2003 2004 2005 2006
proj
ects
in it ial closings output goal
The Section 202 Demonstration Pre-Development Grant Program is expected to reduce or at best eliminate some of the delay in the development process. Out of the FY 2005 appropriation, the Department provided predevelopment grant funding to 64 of the 135 sponsors that received Fund Reservation Awards pursuant to the FY 2005 Super Notice of Funding Availability for the Section 202 Supportive Housing for the Elderly Program. Sponsors that participate in the Section 202 Demonstration Pre-Development Grant Program are expected to reach initial closing within 18 months or less.
To address the issue of sponsors needing external sources of funding, since FY 2001 nonprofit owners of Section 202 and 811 developments could indicate their intention to form limited partnerships with for-profit entities. The partnerships help them compete for low-income housing tax credits for the purpose of providing additional capital and/or increasing the number of affordable housing units available to meet the needs of the elderly or persons with disabilities. Additionally, in FY 2006, HUD completed a study of the costs of developing Section 202 and Section 811 projects, and is currently reviewing the recommendations proposed in the study.
Data discussion. The database of origin is the Development Applications Processing system. (DAP-F24A),Tracking Sub-Module, and the database of convenience is HEREMS-F24D. The data consist of straightforward and easily verifiable counts of initial closings. Field offices regularly review data to assure their accomplishments are accurately reflected. An independent assessment in 2004 showed that DAP-F24A performance indicator data passed six-sigma quality tests (3.4 errors per million) for validity, completeness, and consistency.
A3.2: The Assisted-Living Conversion program increases the supply of suitable housing for the frail elderly by completing conversion of eight properties in FY 2006.
154

SECTION 2. PERFORMANCE INFORMATION PROMOTE DECENT AFFORDABLE HOUSING
Background. HUD’s FY 2006 appropriations included funds to convert qualified multifamily projects for the elderly to assisted living. The conversions may involve entire projects or a subset of their units. This funding responds to the projected increase in demand for affordable assisted living accommodations caused by the aging of the baby boomer generation. The conversions are subject to licensing requirements, creating potentially lengthy conversion timetables. The goal was to convert another 8 projects to assisted living by the end of FY 2006.
Section 2 0 2 Elder ly Projects Converted to Assisted Living
411 392377401
16 14
712
8
0
500
1000
2003 2004 2005 2006
num
ber
of u
nits
0
5
10
15
20
num
ber
of p
roje
cts
conver ted units (left scale)conver ted projects (r ight scale)output goal- projects (r ight scale)
Results, impact, and analysis. During FY 2006, the Department successfully accomplished 175 percent of its goal. HUD and the grantees completed the conversion process for 14 projects that provided 392 units of assisted living for the frail elderly. The goal of converting 8 projects was accomplished despite the fact that these properties are difficult to complete because construction is often delayed by unanticipated construction changes, the amount of time needed to get building permits, the need to get additional funds to pay for changes required by the locality and/or increased construction costs.
The FY 2007 Annual Performance Plan does not contain this indicator because the production to date has been at a low level.
Data discussion. This measure is based on the Assisted Living Conversion Program grant database, consisting of annual progress reports submitted by grantees to the field offices. The Office of Housing verifies grantee reports through monitoring.
A3.3: The number of elderly households living in private assisted housing developments served by a service coordinator is maintained at the FY 2005 level. Background. HUD evaluations of the Congregate Housing Service program, HOPE for Elderly Independence, and the Service Coordinator program all verified that service coordinators improve the quality of life of elders by helping them to remain as active and independent as their health permits. To help meet the needs of a growing population that is aging in place, HUD received a significant increase in funding for service coordinators in assisted multifamily housing, from $13 million in FY 1999 to $50 million in FY 2000-FY 2004. Although only $30 million was appropriated in FY 2005, the Department received $51 million in FY 2006 for service coordinators.
At the end of FY 2005, there were more than 139,000 elderly households in units being served in developments with grants for service coordinators. The goal for FY 2006 was to maintain the number of units covered by service coordinators at the FY 2005 level.
Results, impact, and analysis. The Department exceeded its FY 2006 goal by maintaining the number of units covered by services coordinators in FY 2005 and awarding new grants to serve 78 projects an increase of 13,557 households. These new awards plus the previously funded service coordinator grants, which were either extended through appropriated funds or the program was incorporated under the project’s regular operating budget, exceeded the number of
155

PERFORMANCE AND ACCOUNTABILITY REPORT
elderly households living in private assisted housing developments served by a service coordinator that were funded in FY 2005.
Of the $51 million appropriated for FY 2006, approximately $14 million will be used to fund service coordinators in new properties, with the balance renewing existing properties. In future fiscal years, the percentage of the appropriated funds needed to extend the service coordinators in the previously funded projects is expected to increase to the extent that no funds will remain for new coordinators. However, HUD will continue to encourage owners to use residual receipts to leverage federal resources in order to increase the number of service-enhanced units. The Department also will enhance the Service Coordinator program as appropriate on the basis of ongoing program reviews, grantee operations, and Notice of Funding Availability responses. The Department also encourages service coordinators to assist low-income elderly families living near, as well as those residing in, multifamily elderly projects.
Units in Elderly Projectsw ith Service Coordinators
125.3111.2 139.0
139.0139.0
0
50
100
150
2003 2004 2005 2006
units
(10
00s)
units with service coordinators (cum ulative)output goal
Data discussion. This measure uses data for elderly private multifamily projects with service coordinators from the Office of Housing service coordinator grants database.
Objective A4: Transition families from HUD-assisted housing to self sufficiency. A4.1: By FY 2008, increase the proportion of those who transition from HUD’s public housing and Housing Choice Voucher programs by 20 percent and decrease the proportion of active participants who have been in HUD’s housing assistance programs for 10 years or more by 10 percent. Background: HUD’s public and assisted housing programs provide low-income families with transitional housing that affords an opportunity for families to gain housing self-sufficiency. This indicator emphasizes the movement of families to adequate shelter of their own, which allows HUD to serve more families in need of housing assistance. The objective of this indicator is to improve the annual transition proportion from the FY 2003 baseline of 11.1 percent to at least 13.3 percent by FY 2008, and reduce the proportion of households who have been in HUD’s public housing and Housing Choice Voucher programs for 10 years or more from 20.6 percent in FY 2003 to 18.5 percent or less by FY 2008. This reflects the Department’s broader outcome goal of promoting housing self-sufficiency.
The FY 2007 Annual Performance Plan (see Appendix A) revised upward the FY 2006 transition rate from 5 percent to 20 percent to reflect much better performance than forecasted in the first year of monitoring the indicator.
Results, impact, and analysis. In FY 2006, 12.6 percent of program participants were able to leave subsidized rental housing – this is above the interim target of 12.4 percent, and significantly above the 2003 baseline of 11.1 percent.
156
SECTION 2. PERFORMANCE INFORMATION PROMOTE DECENT AFFORDABLE HOUSING
However, during this period HUD found 20.9 percent of active program participants had been in the program for 10 years or more. This represents a slight increase from the 2003 baseline of 20.6 percent. Despite this set-back HUD plans to accomplish the interim goal of reducing the proportion of active participants who have been in the program for 10 years or more to 19.0 percent by FY 2007 (as specified in the FY 2007 Annual Performance Plan). Furthermore, the Department remains committed to meeting its five-year goal of 18.5 percent, (a 20 percent reduction from the FY 2003 baseline of 20.6 percent) by FY 2008.
Reasons for shortfall/Performance improvement plans. Although the Department made progress towards its goal of reducing long-term program dependence in FY 2005, the FY 2006 data show a modest decrease in progress. However, at this stage we cannot say that a one-year increase in long-term participation represents the start of a negative trend in program utilization. This is a reflection of many macro- and micro-economic factors, many of which are beyond HUD’s ability to impact. As an example, current trends in the housing market that include decreased rental vacancy rates, create barriers to a move to unassisted housing for low-income families. Another challenge is that the Department has few tools to help build resources that induce long-term residents to transition to the private market.
The Department will continue to promote enactment of Housing Choice Voucher policy changes; such was those provided by the State and Local Housing Flexibility Act of 2005. By giving PHAs the flexibility to establish their own standards for tenant rent contributions, work requirements, and rent levels, PHAs will establish new policies and tools to promote resident housing self-sufficiency.
Data discussion: HUD uses occupancy data taken from the Inventory Management System database to track and report these measures. PHAs submit these data on each household in their program. Graduation is defined as the proportion of households who were active in the public housing and Housing Choice Voucher programs during the fiscal year and left rental assistance at any point during the year. For the Voucher program, participants who enter the Homeownership component are counted as exiting the “rental assistance” program.
Resident length of stay is based on continuous program participation from the date of program admittance to the end of the fiscal year. The length of stay measure does not accurately capture tenure for the small number of families who transfer between programs because their length of stay restarts at zero.
The Inventory Management System is the most complete data source available on low-income assisted households. However, it is susceptible to the limitations found in all administrative data. Incomplete reporting to the Inventory Management System may introduce some error to these measures. In addition, data are continuously updated into the system. The data have minimal sampling error because they represent a census of assisted households. High reporting rates limit non-response error. However, PHAs that participate in the Moving to Work Demonstration project have not been required to submit household data into the Public and Indian Housing Inventory Management System and are not represented by these data.
157

PERFORMANCE AND ACCOUNTABILITY REPORT
Goal C: Strengthen Communities Strategic Objectives:
C1 Provide capital and resources to improve economic conditions in distressed communities.
C2 Help organizations access the resources they need to make their communities more livable.
C3 End chronic homelessness and move homeless families and individuals to permanent housing.
C4 Mitigate housing conditions that threaten health.
PERFORMANCE REPORT CARD - GOAL C
Performance Indicators FY 2003 Actual
FY 2004 Actual
FY 2005 Actual
FY 2006 Actual
FY 2006 Target
Met or Missed Notes
C1.1 A total of 73,735 jobs will be created or retained through CDBG and 11,000 through Section 108. 108.7 78.8 91.3 66.1 84.7 Missed j
RC, EZ and EC areas achieve community renewal goals in five areas: Employment Credits 61.26 83.45 105.18 N/A 90 N/A a, k
Commercial Revitalization Deductions 273 209 219 259 211 Met k
Businesses per Population 80.2% 89.7% N/A N/A 95% N/A a
Addresses Vacant per Population N/A N/A N/A 280% 280% Met
C1.2
Earned Income Tax Credits Claimed per Pop. N/A N/A 157% N/A 158% N/A a
C1.3 Assist disaster recovery in the Gulf Coast Region. N/A N/A N/A Yes Yes Met g
C1.4 A total of 1,200 jobs will be created through the Rural Housing and Economic Development Program. N/A N/A N/A 2,360 1,200 Met i
C1.5 The Brownfields Development program will support the creation of 3,750 jobs. N/A N/A N/A 1,000 3,750 Missed
C1.6 A total of 4,000 youths will be trained in the construction trades through the Youthbuild program. 4,123 3,896 4,366 4,397 4,000 Met
C2.1 Streamline the Consolidated Plan to make it more results-oriented and useful to communities. N/A N/A
Proposed changes
Changes in place
Changes in place Met
C2.2
At least 35 percent of single family mortgages endorsed for insurance by FHA are in underserved communities. 34.7% 39.4% 41.3% 40.2% 35.0% Met
C2.3
The share of multifamily properties in underserved areas insured by FHA is maintained at 25 percent of initial endorsements. 29.5% 34% 43% 41% 25% Met
C2.4 HUD will continue to monitor and enforce Fannie Mae’s and Freddie Mac’s performance in meeting or surpassing HUD-defined geographic targets for mortgage purchases in underserved areas.
Fannie Mae 32.8% 32.1% 33.5% 41.4% 37% Met f
Freddie Mac 31.0% 32.7% 32.3% 42.3% 37% Met f
158

SECTION 2. PERFORMANCE INFORMATION STRENGTHEN COMMUNITIES
PERFORMANCE REPORT CARD - GOAL C
Performance Indicators FY 2003 Actual
FY 2004 Actual
FY 2005 Actual
FY 2006 Actual
FY 2006 Target
Met or Missed Notes
C2.5 Section 4 funding will stimulate community development activity totaling 10 times the Section 4 investment. N/A N/A 48:1 44:1 10:1 Met
C2.6 The share of CDBG entitlement funds for activities that benefit low- and moderate-income persons remains at or exceeds 92 percent. 94.8% 94.9% 95.3% 95.1% 92.0% Met
C2.7 The share of State CDBG funds for activities that benefit low- and moderate-income persons remains at or exceeds 96 percent. 96.7% 96.4% 96.8% 96.8% 96.0% Met
C3.1 At least 390 functioning CoC Communities will have a functional Homeless Management Information Systems by FY 2006. 75 288 387 408 390 Met
C3.2 The percentage of formerly homeless individuals who remain housed in HUD permanent housing projects for at least 6 months will be 70.5 percent. N/A N/A 70% 73.5% 70.5% Met
C3.3 The percentage of homeless persons who have moved from HUD transitional housing into permanent housing will be at least 61 percent. N/A N/A 61% 62.4% 61% Met
C3.4 The employment rate of persons exiting HUD homeless assistance projects will be at least 17 percent. N/A 45,066 7% 17% 17% Met
C3.5 The number of overcrowded households in Indian country shall be reduced by an additional one percent of the FY 2003 baseline during FY 2006. N/A 4.5% 2,030 1,820 471 Met
C3.6 The percentage of HOPWA clients who maintain housing stability, avoid homelessness and access care increases through the use of annual resources with the goal that this reaches 80 percent by 2008. N/A N/A N/A N/A N/A N/A b, g
C4.1 Reduce the average number of observed exigent deficiencies per property for substandard public housing properties by 10 percent and the overall multifamily housing portfolio by 5 percent. 1.41 1.40 1.40
4.55 1.46
8.82 1.40
Met Missed
C4.2 The share of units that have functioning smoke detectors and are in buildings with functioning smoke detectors will be 92.8 percent or greater for both public and multifamily housing.
91.8% 91.8%
92.8% 93.4%
92.9% 94.0%
93.6% 93.8%
92.8% 92.8%
Met Met
C4.3 The number of children under the age of 6 who have elevated blood lead levels will be less than 270,000 in 2006, according to the Centers for Disease Control and Prevention’s most recent published report. 434,000 N/A N/A
Estimate of under 270,000
Under 270,000 Met a,g,i
C4.4 As part of a 10-year effort to eradicate lead hazards, the Lead Hazard Control Grant program will make 9,250 units lead safe in FY 2006. 9,098 8,811 9,500 9,638 9,250 Met i
C4.5 At least 600 housing units will have a reduction in allergen levels in FY 2006 through interventions using Healthy Homes principles N/A N/A N/A 1,704 600 Met
C4.6 Upon advice from the Consensus Committee, HUD will establish the dispute resolution and installation programs mandated by the Manufactured Housing Improvement Act of 2000 by September 30, 2006. N/A N/A N/A
Not completely established Establish Missed
159

PERFORMANCE AND ACCOUNTABILITY REPORT
Notes: a Data not available. b No performance goal for this fiscal year. c Tracking indicator. d Third quarter of calendar year (last quarter of fiscal year; not the entire fiscal year). e Calendar year beginning during the fiscal year shown. f Calendar year ending during the fiscal year shown. g Result too complex to summarize. See indicator. h Baseline newly established. i Result is estimated. j Number is in thousands. k Number reported in millions. l Number reported in billions.
160

SECTION 2. PERFORMANCE INFORMATION STRENGTHEN COMMUNITIES
Objective C1: Provide capital and resources to improve economic conditions in distressed communities. C1.1: A total of 73,735 jobs will be created or retained through CDBG and 11,000 through Section 108. Background. This measure tracks the number of jobs grantees report as created or retained as a result of using CDBG funds for economic development activities. Such use reflects the CDBG statutory objective of the “development of viable urban communities…by expanding economic opportunities…principally for persons of low and moderate income.” The use of CDBG funds for activities that create or retain jobs also helps achieve the statutory objective of providing “a suitable living environment” principally for low- and moderate-income persons because of the long-term benefits that permanent employment opportunities bring to individuals and communities alike. While grantees continue to use CDBG funds for activities that will create or retain jobs, this goal was revised mid-year, which reduced the goal from 80,000 jobs to 73,735. This reduction was based on the actual FY 2006 CDBG appropriation, which was 10 percent lower than the FY 2005 appropriation, estimated spend-out rates, and a 3 percent reduction for inflation.
Number of Jobs Created or Retained through CDBG
56.0
91.3108.7
78.8 73.7
0
50
100
150
2003 2004 2005 2006
thou
sand
s of
jobs
CDBG jobs createdoutput goal
The Section 108 loan guarantee program is an adjunct to the CDBG program and provides financing to local government for a wide range of community and economic development activities. Section 108 funds are considered to be CDBG funds and must be expended in accordance with all requirements applicable to CDBG funds. A separate goal of 11,000 jobs created or retained was established for the Section 108 program for FY 2006 based on prior year estimates.
Results, impact, and analysis. CDBG grantees reported creating or retaining 55,967 jobs with CDBG assistance during FY 2006, which is 17,768 below the goal of 73,735 jobs. Both the FY 2006 goal and the FY 2006 actual level were below the FY 2005 actual level of 91,287 jobs created or retained. The reporting period was FY 2006, from October 1, 2005, through September 30, 2006. For the Section 108 program, CDBG grantees reported that 10,166 jobs were to be created as a result of projects approved for funding during FY 2006. This result is 834 below the goal of 11,000 jobs.
With regard to the goal for the Section 108 program, the estimate is based upon historical analysis of Section 108 economic development projects. The number is based upon the number of jobs identified to be created or retained by those projects executing Section 108 loan commitments during FY 2006.
Reasons for shortfall/Performance improvement plans. It must be noted that the number of jobs created or retained with CDBG assistance can vary considerably from year to year. One key
161

PERFORMANCE AND ACCOUNTABILITY REPORT
factor contrasts the FY 2005 and FY 2006 actual levels. In FY 2005, a grantee reported outcomes attributable to an innovative activity that assisted in the creation of a substantial number of jobs for a relatively small CDBG investment. The program was not continued by the grantee in FY 2006.
A core element of the CDBG program is the broad flexibility state and local recipients have in choosing among many uses of CDBG funding. This flexibility is reflected in the total amount of CDBG funds used each year over the past five years for economic development activities that has decreased slightly in recent years. Further, grantees disbursed slightly less on economic development activities in FY 2006 in comparison to FY 2005, with such disbursements falling from 8.77 percent to 8.06 percent of all CDBG disbursements.
Several issues should be taken into account in an effort to estimate the number of jobs created or retained as a result of CDBG assistance. First, job creation/retention is frequently the national objective selected by the grantee to be met by an economic development activity but it is not the only national objective that may be met by such an activity. When a different objective is selected, information on jobs created or retained is not required. Second, when assistance is identified as meeting the job creation national objective, there is typically a lag between when the investment is made and when persons are hired for the newly created jobs. The lag between investment and job creation is not generally predictable and varies significantly with the nature and scope of the project. Additionally, each year HUD’s analysis of the data reported by grantees in the Integrated Disbursement and Information System is more thorough, resulting in greater quality control. As a result, HUD is able to identify a greater number of reporting problems and refine criteria as needed. Edits have been added to the Integrated Disbursement and Information System to help eliminate double-counting and reduce incorrect reporting but additional data review by HUD is critical for identifying reporting inaccuracies that cannot be detected electronically.
Data discussion. The data used for this measure are based on information reported by grantees in the Integrated Disbursement and Information System during FY 2006. An independent assessment in 2006 showed that the Integrated Disbursement and Information System performance indicator data passed 4-sigma quality tests (99.379% correct) for validity, completeness, and consistency. While data clean-up efforts continued in FY 2006 and edits to the system have improved data quality, additional guidance will be issued to grantees on reporting on CDBG-assisted activities that create or retain jobs. HUD will also determine what additional changes can be added to improve reporting in this area in the re-engineering of the Integrated Disbursement and Information System, which will streamline data entry. Performance measurement screens were integrated into IDIS in May 2006 and will yield significantly richer data with regard to CDBG-assisted job creation and retention activities beginning in FY 2007.
For the Section 108 loan guarantee program, the FY 2006 actual is based upon an analysis of those projects that received Section 108 commitments during FY 2006 and returned HUD executed funding agreements during FY 2006.
162

SECTION 2. PERFORMANCE INFORMATION STRENGTHEN COMMUNITIES
C1.2: Renewal Communities and Urban Empowerment Zones expand economic opportunity in communities characterized by pervasive poverty, unemployment, and general distress. Background. The Office of Community Renewal (OCR) designates distressed communities to receive important tools for economic and community development. HUD selected these communities competitively based on criteria including poverty, unemployment, household income, crime, general distress, and the quality of locally developed strategic plans. In 2002 HUD designated 40 urban and rural Renewal Communities (RCs) and a third round of eight urban Empowerment Zones (EZs), making a total of 30 urban Empowerment Zones. The designations were authorized by the Community Renewal Tax Relief Act of 2000 (CRTR Act), which authorized all of the Renewal Communities and Empowerment Zones to share in an estimated $11 billion package of tax incentives. The Renewal Communities/ Empowerment Zones designations are set to expire in 2009. HUD’s 65 urban Enterprise Community (EC) designations, designated in 1994, expired December 31, 2004; however, some Enterprise Communities may report additional accomplishments as projects and programs close out.
The FY 2007 Annual Performance Plan (see Appendix A) replaced the measures in the FY 2006 indicator with other measures that are more closely tied to the use of tax incentives and outcomes in terms of economic conditions in the community.
Program website: www.hud.gov/cr
Results, impact, and analysis. The table below reports the Office of Community Renewal FY06 performance measures according to five newly-selected, improved indicators (see Data Discussion). Two output indicators, use of the employment credits by sole proprietors and allocations of commercial revitalization deductions, measure private business decisions. The Office of Community Renewal is reporting an increase of $22 million in employment credits claimed by sole proprietors from 2003 to 2004.13 It is worth noting that sole proprietors are the hardest-to-reach business category targeted by Renewal Communities/ Empowerment Zones tax incentives. The Office of Community Renewal is also reporting a $40 million increase in the amount of commercial revitalization deductions allocated in calendar year 2005. Though the Office of Community Renewal cannot claim to be responsible for the entire increase in either category, increased technical assistance and marketing/outreach activities spearheaded by the Office of Community Renewal have undoubtedly played a role in both.
The other three indicators represent outcomes reflecting community economic conditions. As is the case for many economic development initiatives, those conditions are affected by many factors other than the availability and use of the Renewal Communities/Empowerment Zones tax incentives and implementation of the strategic plans. Data on one of the three indicators for FY 2006 is pending and still not available (see table footnotes).
13 OCR reports all IRS measures in arrears based on availability. For example, tax year 2004 data, covering the calendar year ending in federal FY 2005, are available in federal FY 2006.
163

PERFORMANCE AND ACCOUNTABILITY REPORT
PERFORMANCE MEASURES FY2003 Actual
(in millions)
FY2004 Actual
(in millions)
FY2005 Actual
(in millions)
FY2006 Actual
(in millions)
FY2006 Goal
(in millions)
Amount of Renewal Community and Empowerment Zone employment credits claimed by sole proprietors (CY ending during the FY)
$61.26 $83.45 $105.18 N/A1 $90
Amount of Commercial Revitalization Deductions allocated in RCs (CY ending during the FY)
$273 2 $209 $219 $259 $211
Total businesses in RCEZs per population vs. national average
80.2% 89.7%3 N/A4 N/A5 95%
Total addresses vacant 90 days per population in RCEZs vs. national average
N/A N/A N/A6 280%7 280%
Earned income tax credit claims in RCEZs per population vs. national average
157%8 N/A1 158%
Notes: 1 Data from IRS are available in arrears. See footnote 13 of the narrative. 2 Unusually high CRD allocations for FY 2003 occurred because only in calendar year 2002 IRS allowed unused CRD allocations to be awarded to projects in other RCs within the same state. 3 There are 6.1 businesses per 100 persons in RC/EZs compared to 6.9 per 100 persons nationwide. 4 Data from Dun & Bradstreet were not provided for 2005. 5 Data from Dun & Bradstreet are pending and not yet available for 2006. 6 US Postal Service began reporting vacant address data according to the 2000 census tracts in October 2005. The October 2005 data were used to calculate the FY 2006 percentage. 7 There are 7.6 vacant addresses per 100 persons in RC/EZs compared to 2.7 per 100 persons nationwide. 8 There are 11.5 earned income tax credit claims per 100 persons in RC/EZs compared to 7.4 per 100 persons nationwide. Data discussion. Since 1993, when the Empowerment Zone program was first authorized by the Omnibus Budget Reconciliation Act, it evolved from a grants-based to primarily a tax incentive program. For that reason, and in response to requests from GAO and OMB and a study contracted by HUD’s Office of Policy Development and Research, the Office of Community Renewal is phasing out the three indicators that designees self-report in the Performance Measurement System (PERMS), which were intended to assess the designated Empowerment Zones and Enterprise Communities in terms of their performance relative to the projected outputs outlined in their strategic plans. In place of the old indicators, five new measures have been selected that more closely reflect the utilization and impact of tax incentives on local economic outcomes. The five new measures are listed below:
Amount of Renewal Community and Empowerment Zone Employment Credits claimed by Sole Proprietors (source: Internal Revenue Service)
Amount of Commercial Revitalization Deductions Allocated in Renewal Communities
Total Businesses per Population in Renewal Communities/Empowerment Zones versus National Average
164

SECTION 2. PERFORMANCE INFORMATION STRENGTHEN COMMUNITIES
Total Addresses Vacant 90 Days per Population in Renewal Communities/Empowerment Zones versus National Average
Earned Income Tax Credit Claims per Population in Renewal Communities/Empowerment Zones versus National Average
Validation, verification, improvement of measures. The five new performance measures provide increased validity because they reduce the reliance on data reported by the Renewal Communities and Empowerment Zones, which are hindered by the lack of administrative funding for data collection and other purposes, specifically the Renewal Communities and round III Empowerment Zones. All but one of the new measures rely on data collected by a third party. As long as the Office of Community Renewal receives timely and accurate data from the Internal Revenue Service (IRS), the U.S. Postal Service, and Dun & Bradstreet (through a contractual arrangement), consistent and accurate reporting can be reasonably assured. With the new indicators in place, the Office of Community Renewal will always be reporting in arrears for both measures received from the IRS. The Office of Community Renewal is considering how to handle this time lag for future reporting purposes.
In terms of improvement, the Office of Community Renewal is developing ZIP Code tables that more closely approximate the Renewal Communities/Empowerment Zones areas and updating the Renewal Communities/ Empowerment Zones population figures to improve the accuracy of all the population-based measures. The newest data generally are available by 2000 Census tracts or ZIP Codes, which necessitates the use of conversion algorithms or areas that approximate the designated Renewal Communities and Empowerment Zones. By refining the ZIP Code tables and updating the Renewal Communities/ Empowerment Zones population figures, the Office of Community Renewal will achieve increased accuracy in its performance reporting.
The Office of Community Renewal still considers these measures as prototypes and expects to receive and consider expert comments this year.
C1.3: Assist disaster recovery in the Gulf Coast Region. Background. Congress appropriated a total of $16.7 billion for CDBG in two supplemental appropriations to aid in the recovery of five Gulf Coast States, Louisiana, Mississippi, Texas, Florida, and Alabama. The required state plans for the first supplemental have been submitted and approved and the full $11.5 billion has been obligated. The work done in FY 2006 has set the structure for recovery funds to be expended in FY 2007 and subsequent years, and to report significant results under the FY 2007 Annual Performance Plan as well as through quarterly reporting.
The Disaster Recovery Grant Reporting (DRGR) system is an online tool that maintains disaster grant specific information, and supports the recovery process by tracking cost and performance measures for each grantee’s implementation of recovery and revitalization programs. The Disaster Recovery Grant Reporting system, initially created in 1997, provides an ordered and user-friendly tracking system for grantees to submit and HUD management to evaluate action plans and quarterly performance reports.
The Disaster Recovery Grant Reporting system serves three main objectives and business functions:
165

PERFORMANCE AND ACCOUNTABILITY REPORT
1--Assists HUD to meet congressional reporting expectations;
2--Provides precise, first-rate information that is easy for HUD headquarters, field offices, and grantees to access; and
3-- Provides a straightforward reporting method available via the Internet that is not burdensome for grantees to access with limited system resources.
Grantees are required to submit quarterly reports to HUD in the online Disaster Recovery Grant Reporting system within 30 days after the closing of each quarter, beginning with the first full calendar quarter after the grant is awarded. For the 2006 disaster recovery CDBG appropriations, HUD reports to Congress each quarter with regard to all steps taken to prevent fraud and abuse of funds, including duplication of benefits.
The FY 2007 Annual Performance Plan (see Appendix A) revised the FY 2006 Annual Performance Plan to include this indicator.
Program website:
HUD Disaster Recovery Assistance – www.hud.gov/disarelf.cfm
DRGR website - https://drgr.hud.gov/DRGRWeb/login.do
Results, impact, and analysis. No data were reported during FY 2006. All supplemental funding was allocated to the Gulf Coast states between April and July. By August all $11.5 billion in CDBG grant funds under the first supplemental appropriations were obligated. Implementation efforts are underway at state level and benefits have begun to be distributed to homeowners and local governments. The states will have submitted their first reports in October 2006.
Reasons for shortfall/Performance improvement plans. There will be data to report on in FY 2007.
Data discussion. Data will be extracted from the Disaster Recovery Grant Reporting system.
C1.4: A total of 1,200 jobs will be created through the Rural Housing and Economic Development Program. Background. The purpose of the Rural Housing and Economic Development Program is to support capacity building at the State and local level for rural housing and economic development and to support innovative housing and economic development activities in rural areas. Funds made available under this program are awarded competitively on an annual basis through a selection process conducted by HUD.
The FY 2007 Annual Performance Plan (see Appendix A) revised the FY 2006 Annual Performance Plan to include this indicator. HUD did not originally include an indicator for this program because no funding was requested for FY 2006. The Congress did appropriate $17 million for the program; therefore, HUD amended the FY 2006 Annual Performance Plan to reflect this action.
Program website: http://www.hud.gov/offices/cpd/economicdevelopment/programs/rhed/
Results, impact, and analysis. As a result of data collection for the period of October 1, 2003, through July 30, 2005, of active grantees, 3,736 jobs were created. From the results of data
166

SECTION 2. PERFORMANCE INFORMATION STRENGTHEN COMMUNITIES
collected, it is estimated that approximately 2,360 jobs were created for the 12 month period ending July 30, 2005. This exceeds the goal of 1,200 jobs created through the Rural Housing and Economic Development Program for the last reporting period.
Data discussion. The data collection process is conducted through the CPD field offices. The office of Rural Housing and Economic Development, HUD Headquarters, analyze and report on collected data.
C1.5: The Brownfields Development program will support the creation of 3,750 jobs. Background. The redevelopment of brownfields is a top priority of local governments and presents an important opportunity to reclaim currently unusable land and provide new economic development, job and housing opportunities to improve neighborhoods and add to the economic health of our nation’s communities. The Brownfields Economic Development Initiative grant program was created to stimulate economic and community development activities under Section 108(q) of the Housing and Community Development Act of 1974, as amended. Established in 1998, the Brownfields Economic Development Initiative grant funds are intended principally for the redevelopment of brownfield sites, which are defined as difficult to redevelop because of real or potential environmental contamination. Accordingly, the Brownfields Economic Development Initiative funds combined with Section 108 loan guarantees are used for economic development projects that increase economic opportunity for low-and moderate-income persons or that stimulate or retain businesses or jobs.
The FY 2007 Annual Performance Plan (see Appendix A) revised the FY 2006 Annual Performance Plan to include this indicator. HUD did not originally include an indicator for this program because no funding was requested for FY 2006. The Congress did appropriate $9.9 million in funding for the program and therefore HUD amended the FY 2006 Annual Performance Plan to reflect this action.
Program website: http://www.hud.gov/offices/cpd/economicdevelopment/programs/bedi/
Results, impact, and analysis. Based on estimates determined from this year’s applications for funding, 6 brownfield sites are projected for redevelopment creating an estimated 1,000 new jobs.
Reasons for shortfall/Performance improvement plans. The goal was predicated on a total funding level that was similar to prior years’ amounts. Funding through FY 2004 was approximately $24 million a year. Funding for FY 2005 was a similar amount but a $10 million rescission in FY 2006 resulted in a net available balance of $14.4 million. The appropriation for the Brownfields Economic Development Initiative in FY 2006 was $9.9 million, less than half of historical levels. In addition, the gross demand for grants, and the net, approvable demand from qualified applicants, were both at historically low levels.
Data discussion. The jobs estimate is based on historical costs of job creation in the Brownfields Economic Development Initiative program. This is determined on a ratio of projected jobs to Brownfields Economic Development Initiative grant amounts. Since different types of economic development activities may require modifications to these averages, we also look carefully at the nature and scope of the proposed projects to adjust estimates as appropriate.
167

PERFORMANCE AND ACCOUNTABILITY REPORT
C1.6: A total of 4,000 youths will be trained in the construction trades through the Youthbuild program. Background. HUD did not originally include an indicator for this program because no funding was requested for FY 2006 as a result of the administration’s proposal to transfer the Youthbuild program to the Department of Labor. On September 22, 2006, the Youthbuild Transfer Act was enacted, P.L. 109-281, transferring the Youthbuild program to the Department of Labor, effective for FY 2007. The Congress did appropriate funding for the program and therefore HUD is amending the FY 2006 Annual Performance Plan to reflect this action.
In addition to an overall goal for the number of youths trained, HUD has performance goals for the number and percent of participants earning their high school diploma or equivalency (FY 2006 targets are 1,200 and 42 percent of participants that need a diploma); the number and percent of Youthbuild program graduates placed in employment or education (FY 2006 targets are 1,100 and 78.7 percent of program graduates), and the number and percentage of participants who made literacy and numeracy gains (FY 2006 targets are 3,500 and 87.5 percent of participants).
There are also goals for the number of new units constructed (FY 2006 target is 800 units) and rehabilitated (FY 2006 target is 950 units) because of the importance of these units – which are affordable to low- and very low-income households – to their communities.
Program website: www.HUD.GOV/offices/cpd/economicdevelopment/programs/youthbuild/index.cfm
Results, impact, and analysis. Between July 1, 2005, and June 30, 2006, the actual number of youth trained was 4,397, or 9.9 percent above the goal. As the Youthbuild program has matured, awards are being made to previous grantees. Having established programs and experience running a Youthbuild program, these grantees are more efficient in enrolling students, resulting in a greater number of youth trained.
Accomplishments of Youthbuild FY 2003 FY 2004 FY 2005 FY 2006 FY 2006 goal Persons trained 4,123 3,896 4,366 4,397 4,000
Persons in employment or education
N/A N/A N/A 1,969 1,100
GED 1,260 1,375 1,525 1,528 1,200
Housing units constructed
346 373 876 609 800
Housing units rehabilitated
1,409 1,069 1,089 1,263 950
Literacy & Numeracy goals
1,755 1,327 4,086 7,821 3,500
In addition to the number of youth trained through the Youthbuild program, HUD is able to collect data on other successes. Between July 1, 2005, and June 30, 2006, 1,528 participants achieved high school general equivalency diplomas, 328 above the target of 1,200.
168

SECTION 2. PERFORMANCE INFORMATION STRENGTHEN COMMUNITIES
Approximately 609 units of housing were constructed along with the rehabilitation of 1,263 units or a total of 1,872 units. Overall, the number of housing units made available for habitation exceeded the total of combined target of 1,750 units by 7 percent. A reported 3,998 Youthbuild participants increased their literacy skills and 3,823 participants increased their numeracy skills exceeding the 3,500 target (91 and 87 percent respectively of the participant showing such gains). During the 12-month-period, the number of Youthbuild program graduates placed in employment or education was 1,969 graduates, 869 more than the target amount of 1,100.
Data discussion. The Office of Economic Development, which is responsible for administering the Youthbuild program, has implemented a data collection process to review all active projects each fiscal year. The process allows for a more accurate analysis of the program to determine the performance and impact of the local projects.
Youthbuild grantees provided data on a quarterly basis. Grantees are monitored by their respective field offices for performance and compliance with HUD guidelines.
Objective C2: Help organizations access the resources they need to make their communities more livable. C2.1: Streamline the Consolidated Plan to make it more results-oriented and useful to communities. Background. Communities use the consolidated plan to identify community and neighborhood needs, actions that will address those needs, and measures necessary to gauge their performance. Effective consolidated plans are core instruments for directing the use of $3.7 billion of CDBG formula funding and producing key housing, economic development, infrastructure and other related community strengthening outcomes. The President’s Management Agenda directed HUD to work with local stakeholders to streamline the consolidated plan, making it more results-oriented and useful to communities in assessing their own progress towards addressing the problems of low-income areas. CPD sought to implement this requirement through the Consolidated Plan Improvement Initiative that encouraged the use of the plan as a management tool for tracking results. During FY 2005, HUD made significant progress in achieving this goal through proposed changes in regulations, guidance, and tools that were designed to improve the management of programs, increase accountability, and reduce the burden on grantees.
During FY 2006 HUD planned to implement the proposed regulatory changes to the Consolidated Plan, track the use of the new Consolidated Plan Management Process tool that streamlined the consolidated plan submission process and allow grantees to track results, assess grantee satisfaction with the tool, develop a performance measurement framework for all grantees that could aggregate results at a national or local level, and implement the first phase of the modernization of the Integrated Disbursement and Information System.
Results, impact, and analysis. During FY 2006, the Department began implementing the reformed, results oriented planning and reporting process to fulfill the directive contained in the President’s Management Agenda thus meeting the streamlining goal. HUD established a new website in February 2006 to track use of a new version of the Consolidated Plan Management Plan tool that incorporated changes being made to the final rule and suggestions made by grantees that used previous versions of the tool. The final Consolidated Plan rule was published on February 9, 2006, with an effective date of March 13, 2006, and HUD directed that all plans
169

PERFORMANCE AND ACCOUNTABILITY REPORT
submitted after March 13, 2006, must comply with the new regulatory provisions. A final notice dealing with the new outcome measurement framework that would be able to aggregate results at a national or local level was published in the Federal Register on March 7, 2006. In addition, CPD began implementing the first phase of the modernization of the Integrated Disbursement and Information System.
Data Discussion. CDP field offices review communities consolidated plans using the Grants Management program. The qualitative milestones used for this indicator do not require numerical databases. Assessing performance of such measures may be necessarily limited by subjective judgments. Milestone performance indicators will be supplemented or replaced by quantitative measures as initiatives are implemented and evaluated and data capabilities are enhanced.
C2.2: At least 35 percent of single-family mortgages endorsed for insurance by FHA are in underserved communities. Background. FHA’s role in the mortgage market is to extend homeownership opportunities to families that otherwise might not achieve homeownership. There is substantial evidence that the conventional mortgage market does not serve lower income and minority neighborhoods as well as more affluent and non-minority neighborhoods. FHA lending in disadvantaged neighborhoods increases the homeownership rate. To strengthen this indicator’s focus on outcomes despite variations in the volume of single family endorsements, it was recently revised to ensure that at least 35 percent of all single family mortgages endorsed for insurance by FHA are in underserved areas. An underserved area is defined as a census tract with below average income and/or above average share of minority households. Historically, the non-FHA mortgage market, as demonstrated by high mortgage denial rates and low mortgage origination rates, has under served these neighborhoods.
Program website: http://www.hud.gov/offices/hsg/sfh/hsgsingle.cfm
Results, impact, and analysis. During FY 2006, 40.2 percent (201,780 of 502,049) of all single family mortgages endorsed for insurance by FHA were in underserved communities. This result greatly exceeds the target of 35 percent and illustrates FHA’s continued success in expanding homeownership opportunities, including in historically underserved communities. The high degree of success in providing service to underserved areas shows strong improvement, as evidenced by the increase from 34.7 percent in FY 2003 to the achievement of 40.2 percent in FY 2006. This continued success is attributable to marketing and outreach activities in underserved communities. FHA will continue its efforts to provide safe and affordable home financing options in underserved communities through participation in conferences, seminars, and other outreach events.
Data discussion. This measure uses data from FHA’s Consolidated Single Family Statistical System (F42). This measure may fluctuate when the census tracts constituting underserved areas are redefined using the latest census data. The fluctuations are not expected to substantially reduce the reliability of this national summary measure. An independent assessment completed in 2004 showed that Consolidated Single Family Statistical System performance indicator data passed six-sigma quality tests (reflecting fewer than 3.4 errors per million) for validity, completeness, and consistency. HUD verifies FHA data for underserved communities by comparison with Home Mortgage Disclosure Act data.
170

SECTION 2. PERFORMANCE INFORMATION STRENGTHEN COMMUNITIES
C2.3: The share of multifamily properties in underserved areas insured by FHA is maintained at 25 percent of initial endorsements. Background. This indicator measures the proportion of multifamily properties in “underserved” neighborhoods, as a percentage of all multifamily properties that receive FHA mortgage endorsements. FHA insures loans for new construction and substantial rehabilitation of multifamily rental units under a variety of programs (Sections 220, 221(d)(3), 221(d)(4), 231 and risk-sharing under 542(b) and (c)). FHA also insures mortgages to refinance or purchase existing multifamily properties (Section 223(a)(7) and Section 223(f)). These programs have the outcome of improving the quality and affordability of rental housing, and increasing their availability in underserved neighborhoods will promote revitalization of those neighborhoods.
Program website: http://www.hud.gov/offices/hsg/mfh/mfdata.cfm
Results, impact, and analysis. During FY 2006, 41 percent of HUD’s total level of initial endorsements was in underserved areas, significantly exceeding the FY 2006 goal by 16 percentage points. Specifically, in FY 2006, 420 multifamily properties, with 44,721 units in underserved areas, benefited from new FHA mortgage endorsements totaling $1.75 billion. In large part, this significant accomplishment reflects FHA outreach to underserved areas, both for new construction and substantial rehabilitation as well as refinancing, to contribute to the stock of decent, safe, and sanitary affordable housing. Most refinancing results in rehabilitation and upgrading of properties.
Multifamily Units Endorsed in Underserved Areas by FHA
41.0%43.0%
34%
29.5% 25.0%
15%
35%
2003 2004 2005 2006perc
ent
of m
ultif
amily
in
itial
end
orse
men
ts
underserved areasoutput goal
This measure counts the number of properties in underserved neighborhoods that are initially endorsed by FHA. Grants under Section 202 and Section 811 are excluded from this measure. The measure was revised in FY 2003 to include refinancing activity, which creates similar benefits for underserved areas. Refinanced loans include those restructured under the Mark-to-Market program as well as refinancing in support of repair and rehabilitation. Underserved neighborhoods are defined in metropolitan areas as census tracts either with a minority population of 30 percent and median family income below 120 percent of the metropolitan area median, or with median family income at or below 90 percent of area median (irrespective of minority population percentage). A similar definition of underserved applies to non-metropolitan areas, using counties rather than tracts.
Data discussion. The unit project locations and unit counts used to determine this measure are from FHA’s Real Estate Management System. FHA performs computerized checks of data quality, and FHA staff verifies multifamily mortgage transactions. An independent assessment in 2006 showed that the Real Estate Management System performance indicator data passed six-sigma quality tests (reflecting fewer than 3.4 errors per million) for validity, completeness, and consistency. The tract poverty rates and minority share are from the decennial Census of Population, updated with the American Community Survey. The Census Bureau has rigorous data quality standards, and it is not feasible for HUD to verify Census or Community Survey data independently.
171

PERFORMANCE AND ACCOUNTABILITY REPORT
C2.4: HUD will continue to monitor and enforce Fannie Mae’s and Freddie Mac’s performance in meeting or surpassing HUD-defined geographic targets for mortgage purchases in underserved areas. Background. One of the four defined targets that HUD sets for Fannie Mae and Freddie Mac (two housing government-sponsored enterprises) is intended to increase their purchases of mortgages on housing located in central cities, rural areas, and other areas underserved in terms of mortgage credit. This indicator helps achieve the outcome of expanding homeownership opportunities, especially for minority home purchasers.
HUD research has shown that such areas have high mortgage denial rates and low mortgage origination rates, suggesting difficulty in obtaining access to mortgage credit. Beginning in calendar year 2005, HUD increased the underserved areas goal from 31 percent to 37 percent. The underserved areas goal will increase to 38 percent for calendar years 2006 and 2007 and rise again to 39 percent for calendar year 2008. HUD also added a home purchase subgoal for purchase-money mortgages in underserved areas. The underserved areas subgoal for calendar year 2calendar years 2006 and 2007, and 34 percent in calendar year 2008.
Mortgage purchases
Fa nnie Ma e Pe r for m a nce Re la t iv e to Ge ogr a phic Ta r ge t
32.8% 32.1%
41.4%
33.5% 37.0%
30%
35%
40%
45%
2002 2003 2004 2005pe
rcen
t of
uni
tsm or tgages in underserved areas
output goal
005 was 32 percent; it will rise to 33 percent in
qualify towards this target
r
ce
w.hud.gov/offices/hsg/gse/gse.cfm
as follows: For metropolitan areas, dwelling units count if they are located in census tracts with (1) tract median family income less than oequal to 90 percent of area median income or (2) minority composition of at least 30 percent and tract median family income less than or equal to 120 percent of area medium income. Dwelling units in non-metropolitan areas count if (1) median family income of the census tract is less than or equal to 95 percent of the greater of state or national non-metropolitan median income or if (2) minority concentration of the family income is less than or equal to 120 percent of the greater of state or national non-metropolitan median income.
Program website:
Fr e ddie Ma c Pe r for m a nce Re la t iv e to Ge ogr a phic Ta r ge t
31.0% 32.7%
42.3%
32.3%
37.0%
30%
35%
40%
45%
2002 2003 2004 2005
perc
ent
of u
nits
m or tgages in underserved areas
output goal
nsus tract is at least 30 percent and tract median
http://ww
e and Freddie Mac surpassed Results, impact, and analysis. In calendar year 2005, Fannie MaHUD’s target of 37 percent for mortgage purchases in underserved areas. Fannie Mae achieved a performance of 41.4 percent, while Freddie Mac’s performance was 42.3 percent. Both government-sponsored enterprises surpassed the subgoal of 32 percent, with Freddie Mac achieving 35.5 percent and Fannie Mae achieving 32.6 percent.
172
SECTION 2. PERFORMANCE INFORMATION STRENGTHEN COMMUNITIES
An analysis of the composition of units that qualified to count toward the underserved areas goal in 2005 shows that 1.09 million dwelling units, or 71.1 percent of the dwelling units that qualified towards Fannie Mae’s performance under the goal, were on properties located in high-minority census tracts (i.e., tracts with 30 percent or greater minority population). Freddie Mac purchased mortgages for 1.11 million dwelling units in high-minority census tracts, or 71.3 percent of Freddie Mac’s qualifying purchases serving this market. For both government-sponsored enterprises, these percentages show increases from the 2004 figures that were 65.4 percent for Fannie Mae and 63.7 percent for Freddie Mac.
Data discussion. The data reported under this goal are based on calendar year performance. There is a one-year reporting lag because the government-sponsored enterprises report to HUD in the year following the performance year. In addition, because the government-sponsored enterprises’ quarterly data is confidential and proprietary, the Department is unable to estimate Fannie Mae’s and Freddie Mac’s goal performance for the current calendar year. To ensure the reliability of data, Fannie Mae and Freddie Mac apply various quality control measures to data elements provided to HUD. The Department verifies the data through comparison with independent data sources, replication of Fannie Mae’s and Freddie Mac’s goal performance reports, and reviews of their data quality procedures. Fannie Mae’s and Freddie Mac’s financial reports are verified by independent audits.
C2.5: Section 4 funding will stimulate community development activity totaling 10 times the Section 4 investment. Background. The Section 4 program emerged from a unique and unprecedented partnership initiated in 1991, the National Community Development Initiative, which is a consortium of national foundations, corporations and HUD. Now known as the Living Cities/National Community Development Initiative, the program works through the two largest intermediaries serving the nonprofit community development industry, the Enterprise Foundation and the Local Initiatives Support Corporation. Based on the success of the National Community Development Initiative, Congress directed HUD to join in 1994 for the second round at this early stage of the partnership. In 1997 Congress expanded the Section 4 program for urban and rural capacity building beyond the National Community Development Initiative.
This indicator measures the level of community development activity generated, leveraged or supported by Section 4 funding. Most community development activities are expected to involve real estate development, including housing, economic development and community facilities. The FY 2006 goal is to ensure that the ratio of the total cost of community development activities (net of Section 4 support for that activity) to the investment of Section 4 funding shall equal or exceed 10:1.
Results, impact, and analysis. In FY 2006 Enterprise Community Partners and Local Initiatives Support Corporation were paid $35,956,903 in vouchers by HUD, which stimulated community development totaling $1.586 billion in the areas where Section 4 was implemented. This equates to a 44:1 investment ratio, greatly exceeding the goal of a 10:1 ratio. The community development figure was arrived at using actuals for FY 2006. The vouchers were actual amounts paid from September 2005 through September 2006.
Data discussion. Data were drawn from actual production of affordable housing development in cities where Section 4 funds were awarded. Investment values grew in part due to significant
173

PERFORMANCE AND ACCOUNTABILITY REPORT
appreciation of development costs in urban and rural areas, in particular the cost of land and building acquisition, labor, insurance and some materials.
This is a significant increase from last year, because Local Initiative Support Corporation and Enterprise Community Partners have revised their data collection methods to better reflect program activity.
C2.6: The share of CDBG entitlement funds that benefit low- and moderate-income persons remains at or exceeds 92 percent. Background. HUD did not originally include an indicator for this program because no funding was requested for FY 2006. The Congress did appropriate funding for the program and therefore HUD amended the FY 2006 Annual Performance Plan to reflect this action.
Title I of the Housing and Community Development Act of 1974, as amended, authorizes the CDBG program and establishes low- and moderate-income benefit as the primary objective of the program. Section 101© of Title I directs that at least 70 percent of CDBG funds expended in a 1, 2 or 3 year period selected by the grantee be expended for activities that primarily benefit low- and moderate-income persons. It should be noted that HUD does not have direct control over the percentage of CDBG funds that communities use for activities that benefit low- and moderate-income persons. Therefore, a major focus in monitoring is to ensure the compliance of activities undertaken under this national objective. In addition, HUD has emphasized the importance of targeting the use of CDBG funds for activities that benefit low- and moderate-income persons, including those that are extremely low-income.
Program website: http://www.hud.gov/offices/cpd/communitydevelopment/programs/
Results, impact, and analysis. In FY 2006, 95.1 percent of all CDBG entitlement expenditures were dedicated to activities that principally benefited low- and moderate-ipersons, thereby exceeding the 92 perceThis outcome is consistent with the FY 2005 actual result of 95.3 percent low- and moderateincome benefit. These consistent annual resclearly indicate that CDBG entitlement granteare funding an overwhelming number of activities that benefit their low- and moderate-income populations.
CDBG Entitlement Funds Benefiting Low and Moderate
I ncome Persons
95.3%94.8% 94.9% 95.1%
92%
80%
90%
100%
2003 2004 2005 2006
perc
ent
of C
DBG
En
title
men
t fu
nds
funds with low/ m od benefitoutput goal
ncome nt goal.
-ults
es
Data discussion. The data for this measure are based on information reported by entitlement CDBG grantees in the Integrated Disbursement and Information System. The Integrated Disbursement and Information System data is highly reliable in that grantees must enter national objective information with respect to each activity they are seeking to fund. CPD field staff verifies program data when monitoring grantees and there are no issues with regard to data validity. An independent assessment in 2003 showed that the Integrated Disbursement and Information System performance indicator data passed 4-sigma quality tests (reflecting fewer than 6,210 errors per million) for validity, completeness, and consistency.
174

SECTION 2. PERFORMANCE INFORMATION STRENGTHEN COMMUNITIES
C2.7: The share of State CDBG funds that benefit low- and moderate-income persons remains at or exceeds 96 percent. Background. HUD did not originally include an indicator for this program because no funding was requested for FY 2006. The Congress did appropriate funding for the program and therefore HUD is amending the FY 2006 Annual Performance Plan to reflect this action.
Title I of the Housing and Community Development Act of 1974, as amended, authorizes the CDBG program and establishes low- and moderate-income benefit as the primary objective of the program. Section 101c of Title I directs that at least 70 percent of CDBG funds expended in a 1, 2 or 3 year period selected by the grantee be expended for activities that primarily benefit low- and moderate-income persons. It should be noted that HUD does not have direct control over the percentage of CDBG funds that communities use for activities that benefit low- and moderate-income persons. Therefore, a major focus in monitoring is to ensure the compliance of activities undertaken under this national objective. In addition, HUD has emphasized the importance of targeting the use of CDBG funds for activities that benefit low- and moderate-income persons, including those that are extremely low-income.
Program website: http://www.hud.gov/offices/cpd/communitydevelopment/programs/
Results, impact, and analysis. In the State CDBG program, grantees achieved a low- and moderate-income benefit level of 96.8 percent thereby exceeding the 96 percent goal. This outcome is identical to the FY 2005 performance level of 96.8 percent low- and moderate-income benefit. These consistent results clearly demonstrate the effectiveness of the State CDBG program in serving low- and moderate-income persons in small and rural communities nationwide.
Data discussion. The data for this measure are based on information reported by state CDBG grantees in IDIS. IDIS data is highly reliable in that grantees must enter national objective information with respect to each activity they are seeking to fund. CPD field staff verifies program data when monitoring grantees and there are no issues with regard to data validity. An independent assessment in 2003 showed that IDIS performance indicator data passed 4-sigma quality tests (reflecting fewer than 6,210 errors per million) for validity, completeness, and consistency.
CDBG State Funds Benefiting Low -and Moderate- I ncome Persons
96.8%96.4%96.7% 96.8%96%
80%
90%
100%
2003 2004 2005 2006perc
ent
of C
DBG
Sta
tefu
nds
funds with low/ m od benefitoutput goal
Objective C3: End chronic homelessness and move homeless families and individuals to permanent housing. C3.1: At least 390 functioning Continuum of Care communities will have a functional Homeless Management Information System (HMIS) by FY 2006. Background. This indicator measures the number of Continuum of Care communities that have implemented a Homeless Management Information System. Congress has directed HUD on the need for data and analysis to measure the extent of homelessness and the effectiveness of the
175

PERFORMANCE AND ACCOUNTABILITY REPORT
McKinney-Vento Homeless Assistance Act programs. HUD directed Continuum of Care communities to implement Homeless Management Information Systems, in order to achieve the outcome of improving our understanding of the nature and extent of homelessness at national and local levels, by providing community-level, aggregate information to HUD. The Congressional directive includes developing unduplicated counts of clients served at the local level, analyzing patterns of use of people entering and exiting the homeless assistance system, and evaluating the effectiveness of these systems.
To ensure that all Continuum of Care communities successfully implement a Homeless Management Information System, HUD has undertaken an extensive in-depth training and technical assistance initiative. Between 2001 and 2006, HUD’s Homeless Management Information System Technical Assistance aimed to increase the number of Continuum of Care communities with a functioning system, by focusing resources and efforts on: planning, implementation, system operation and management, and data quality and completeness. In addition to collecting data for other reports, such as the Annual Progress Report, the Continuum of Care can use the data to inform local policy decisions, measure performance, and prioritize resource allocation.
Program website: http://www.hud.gov/offices/cpd/homeless/hmis/; http://www.hmis.info
Results, impact, and analysis. Based on reporting in the 2006 Continuum of Care Homeless Assistance Programs competition, 408 Continuum of Care communities, or 90 percent, reported that they had started entering data in the community’s Homeless Management Information System as of May 25, 2006. This result exceeded the goal for FY 2006 of 390 Continuum of Care communities with a functioning Homeless Management Information System, and represents an increase over the achievement in FY 2005. HUD is working toward capturing more standardized bed coverage information in addition to increasing the number of Continuum of Care communities with a functioning system. The number of communities in the early stages of planning a Homeless Management Information System and selecting software has decreased accordingly between 2004 and 2006.
CoC Communities w ith HMI S
390387288
408
0
150
300
450
2004 2005 2006
CoC
com
mun
ities
output goal (HMIS im plem ented)HMIS im plem ented
Data discussion. Rated questions on the FY 2006 McKinney-Vento Homeless Assistance Act homeless assistance application ask for information about Homeless Management Information Systems. This is the fifth time HUD has collected data on local Homeless Management Information Systems, and the fourth time scoring points have been awarded based on progress in implementing local systems. In conjunction with this reporting, HUD has undertaken technical assistance activities that have provided confidence in the validity of the data. Privacy, confidentiality, and security are significant issues that Continuum of Care communities must overcome when implementing a Homeless Management Information System at the local level. These challenges have been further compounded by the passage of the 2005 Violence Against Women Act, which restricts data collection.
176

SECTION 2. PERFORMANCE INFORMATION STRENGTHEN COMMUNITIES
C3.2: The percentage of formerly homeless individuals who remain housed in HUD permanent housing projects for at least six months will be 70.5 percent. Background. The ultimate goal of homeless assistance is to help homeless families and individuals achieve the outcome of staying in permanent housing and obtaining self-sufficiency. This measure tracks the number of formerly homeless persons who remain in permanent housing for at least six months in beds funded by HUD under the McKinney-Vento Homeless Assistance Act.
In addition, Congress requires that 30 percent oHUD’s homeless assistance funding is alloto permanent housing, and HUD’s programs and policies support this. One of HUD’s programs, Shelter Plus Care, uses funding support housing related expenses, while communities secure an equal level of fundinfor a variety of supportive services. This combination ensures that residents receive the housing and services they need to maintain stable permanent housing and make progress towards self-sufficiency. Other HUD programs that provide permanent housing, including the Supportive Housing Program and the Moderate Rehabilitation/Single Room Occupancy program, help to meet other needs related to homelessness. Many communities are increasing their permanent housing stock as a direct result of the statutory requirement and HUD’s emphasis on permanent housing. This increases the number of available housing units and allows communities to house more formerly homeless persons. This measure will be revised to include those persons who continue to be housed in HUD’s permanent housing units, as well as those who left for other permanent housing.
f cated
to
g
Share of Homeless Persons W ho Remain in Permanent Housing
73.5%
70%
70%
60%
68%70.5%
50%
60%
70%
80%
2002 2003 2004 2005 2006perc
ent
of c
lient
s en
teri
ngpe
rman
ent
hous
ing
clients rem aining 6 m onths orlonger
Program website: http://www.hud.gov/offices/cpd/homeless/programs/index.cfm
Results, impact, and analysis. During FY 2006, HUD exceeded its goal, with 73.5 percent of formerly homeless persons remaining in permanent housing for at least six months. This is an increase from the result reported in FY 2005 of 70 percent. This achievement can be attributed to HUD’s emphasis on increasing the number of permanent housing units available for people who are homeless, and combining these units with appropriate supportive services. HUD emphasizes the goal of reaching permanent housing in national broadcasts, the Notices of Funding Availability, the homeless assistance grant application, and, in 2006, a national meeting with grantees.
Data discussion. Data for this indicator are collected from HUD’s Annual Progress Report, which each homeless assistance project submits at the end of the operating year. This report represents a means of reporting on the outcomes of HUD-funded homeless assistance projects. Field staff monitor grantees on a sample basis to assess quality of data in grantee reports. HUD intends to improve reliability of this measure by developing an electronic Annual Progress Report that will eliminate transaction lag of the paper-based reporting system and increase response rates. Because projects begin annual operations at different times, the data reflect projects that ended their operational year in 2006 and submitted their Annual Progress Reports to HUD by September 30, 2006. Due to the varied operation dates for projects, the data for all
177
PERFORMANCE AND ACCOUNTABILITY REPORT
Annual Progress Report-based indicators represent 33 percent of all projects operating in 2006. An independent assessment in 2004 showed CPD-Annual Progress Report performance indicator data passed six-sigma quality tests (reflecting fewer than 3.4 errors per million) for validity, completeness, and consistency.
C3.3: The percentage of homeless persons who have moved from HUD transitional housing into permanent housing will be at least 61 percent. Background. The ultimate objective of homeless assistance is to help homeless families and individuals achieve the outcome of obtaining permanent housing and self-sufficiency. An important steppingstone toward permanent housing for many homeless persons is the availability of transitional housing with supportive services to stabilize their lives. This measure tracks the number of homeless persons who move from HUD-funded transitional housing projects into permanent housing or other supportive housing. The needs of the homeless subpopulations within a particular community are varied. Some need extensive supportive services while in permanent housing to maintain self-sufficiency. For others, market-rate housing with minimal service is adequate. These projects are funded with several prior years’ appropriations.
Program website: http://www.hud.gov/offices/cpd/homeless/programs/index.cfm
Results, impact, and analysis. In FY 2006, HUD exceeded its goal of 61 percent, with 62.4 percent of homeless persons moving from transitional housing into permanent housing. This is an increase from the outcome reported in FY 2005 of 61 percent. HUD also continues to provide the supportive services necessary to move people who are homeless from transitional housing to permanent housing, allowing more vacancies for homeless persons in need of transitional housing and accompanying supportive services.
Data discussion. Data for this indicator are collected from HUD’s Annual Progress Report, which each homeless assistance project submits at the end of the operating year. This report represents a means of reporting on the outcomes of HUD-funded homeless assistance projects. Field staff monitor grantees on a sample basis to assess quality of data in grantee reports. HUD intends to improve reliability of this measure by developing an electronic Annual Progress Report that will eliminate transaction lag of the paper-based reporting system and increase response rates. Because projects begin annual operations at different times, the data reflect projects that ended their operational year in 2006 and submitted their Annual Progress Reports to HUD by September 30, 2006. Due to the varied operation dates for projects, the data for all Annual Progress Report-based indicators represent 33 percent of all projects operating in 2006. An independent assessment in 2004 showed that CPD-Annual Progress Report performance indicator data passed six-sigma quality tests (reflecting fewer than 3.4 errors per million) for validity, completeness, and consistency.
C3.4: The employment rate of persons exiting HUD homeless assistance projects will be at least 17 percent. Background. Stable employment is a critical step for homeless persons in achieving the outcome of greater self-sufficiency. HUD encourages communities to provide comprehensive housing and services to homeless individuals and families, which can include employment training and job search assistance. This indicator tracks the number of adult clients who become employed while in HUD-funded homeless assistance projects. For example, under the
178

SECTION 2. PERFORMANCE INFORMATION STRENGTHEN COMMUNITIES
Supportive Housing Program, employment assistance combined with case management has allowed many communities to focus their services efforts on achieving improved employment outcomes. This measure helps HUD gauge progress toward the goal of improved employment opportunities for homeless persons.
Program website: http://www.hud.gov/offices/cpd/homeless/index.cfm
Results, impact, and analysis. In FY 2006, HUD achieved its goal, as the number of homeless persons receiving employment income upon exit was 17 percent. This result is the same as reported in FY 2005. HUD will continue to monitor the employment rate in its Annual Progress Report. The percentage of homeless funds used for housing activities is increasing each year compared to the percentage used for supportive services. With limited resources available, HUD’s emphasis on housing activities has achieved efficiencies by encouraging and rewarding Continuum of Care communities that create housing, and seek services such as employment training from mainstream service providers.
Data discussion. Data for this indicator are collected from HUD’s Annual Progress Report, which each homeless assistance project submits at the end of the operating year. This report represents a means of reporting on the outcomes of HUD-funded homeless assistance projects. Field staff monitor grantees on a sample basis to assess quality of data in grantee reports. HUD intends to improve reliability of this measure by developing an electronic Annual Progress Report that will eliminate transaction lag of the paper-based reporting system and increase response rates. Because projects begin annual operations at different times, the data reflect projects that ended their operational year in 2006 and submitted their Annual Progress Reports to HUD by September 30, 2006. Due to the varied operation dates for projects, the data for all Annual Progress Report-based indicators represent 33 percent of all projects operating in 2006. An independent assessment in 2004 showed that CPD-Annual Progress Report performance indicator data passed six-sigma quality tests (reflecting fewer than 3.4 errors per million) for validity, completeness, and consistency.
C3.5: The number of overcrowded households in Indian Country shall be reduced by an additional one percent of the FY 2003 baseline during FY 2006.
The FY 2007 Annual Performance Plan (see Appendix A) revised the FY 2006 goal to reflect that the one percent reduction for FY 2006 will be measured from the baseline established in FY 2003 instead of one percent from the FY 2005 result.
Background. The Department has identified overcrowding in American Indian and Alaska Native households as a national concern. Overcrowding in Indian Country is generally caused by a lack of available affordable housing, and can lead to a range of health and social problems. The Indian Housing Block Grant program is designed to provide more housing and thus relieve overcrowding. This supports the Department’s strategic goals of providing permanent housing to homeless families and mitigating housing conditions that threaten health. During FY 2003, the Office of Native American Programs and several participating tribes developed an estimate of the extent of overcrowding in Indian Country, based partly on Census data. They concluded that an estimated 47,169 households were overcrowded in 2003. The Department’s goal has been to reduce the number of overcrowded households by one percent of this baseline each year.
Program website: http://www.hud.gov/offices/pih/ih/grants/ihbg.cfm
179

PERFORMANCE AND ACCOUNTABILITY REPORT
Results, impact, and analysis. The Department funded the construction of 1,823 new affordable housing units, which significantly exceeds the 471 goal representing one percent of the baseline established in 2003. In the FY 2005 Performance and Accountability Report, the Department reported that 1,902 new affordable housing units were built, but since that accomplishment was published, updated information has been aggregated. The revised figure for FY 2005 is 2,030. The original baseline of 47,169 overcrowded households has been reduced by 9,810 households (almost 21%) to 37,359 overcrowded households between FY 2003-FY 2006.
The Office of Native American Programs is in the process of evaluating its method of measuring this indicator. Although targets have been consistently exceeded, the Office of Native American Programs is concerned that, until the decennial Census is reported, there is no reliable proof that the overall overcrowding situation in Indian Country is lessening. Factors such as population growth may be offsetting the gains made by this program to relieve overall levels of overcrowding.
Data discussion. Data on overcrowding come from the decennial U.S. Census. Data on the number of new housing units built are collected from grantees’ Annual Performance Reports, captured in the Performance Tracking Databases of each area office for Native American programs, and then aggregated into a national database at headquarters. [Thus, accomplishments reported in this document will likely require annual revision as grantees continue reporting and submitting updates to their Annual Performance Reports.] Each annual reporting period includes program activities that occurred from July 1 through June 30; this is because Indian Housing Block Grant recipients have 60 days after their fiscal year ends to report. Recipients whose fiscal year ends on September 30 report in the next fiscal year.
The current measurement method assumes that each new housing unit constructed relieves overcrowding by one household. HUD recognizes this is an imperfect method to measure overcrowding, but a more precise and feasible measurement tool has not yet been identified. It would be cost prohibitive to conduct an annual census, and so the exact number of the new units built that specifically went toward reduction of the overcrowded household percentage cannot be determined. The Office of Native American Programs is consulting and working with tribes to determine a better method of tracking the reduction of overcrowded households. Also, a study is underway to examine the feasibility of alternative measurement methods. A new methodology will likely require revisions to the primary data collection instrument, the Annual Performance Report. A joint tribal/HUD working group, formed in FY 2005, has been analyzing the tribal reporting and planning instruments, and is making recommendations to improve them.
C3.6: The percentage of Housing Opportunities for Persons With AIDS clients who maintain housing stability, avoid homelessness, and access care increases through the use of annual resources with the goal that this reaches 80 percent by 2008. Background. This goal represents an important client outcome indicator to assess the benefits received through Housing Opportunities for Persons With AIDS assistance. It reflects the Department’s priority for providing stable permanent housing assistance to a most vulnerable population, very low-income persons living with HIV or AIDS who face severe risks of homelessness and other challenges due to HIV and poverty. To help reach this program goal, HUD implemented new performance measurement tools in FY 2006. These include establishing a requirement in regulations on reporting annual housing outputs.
180
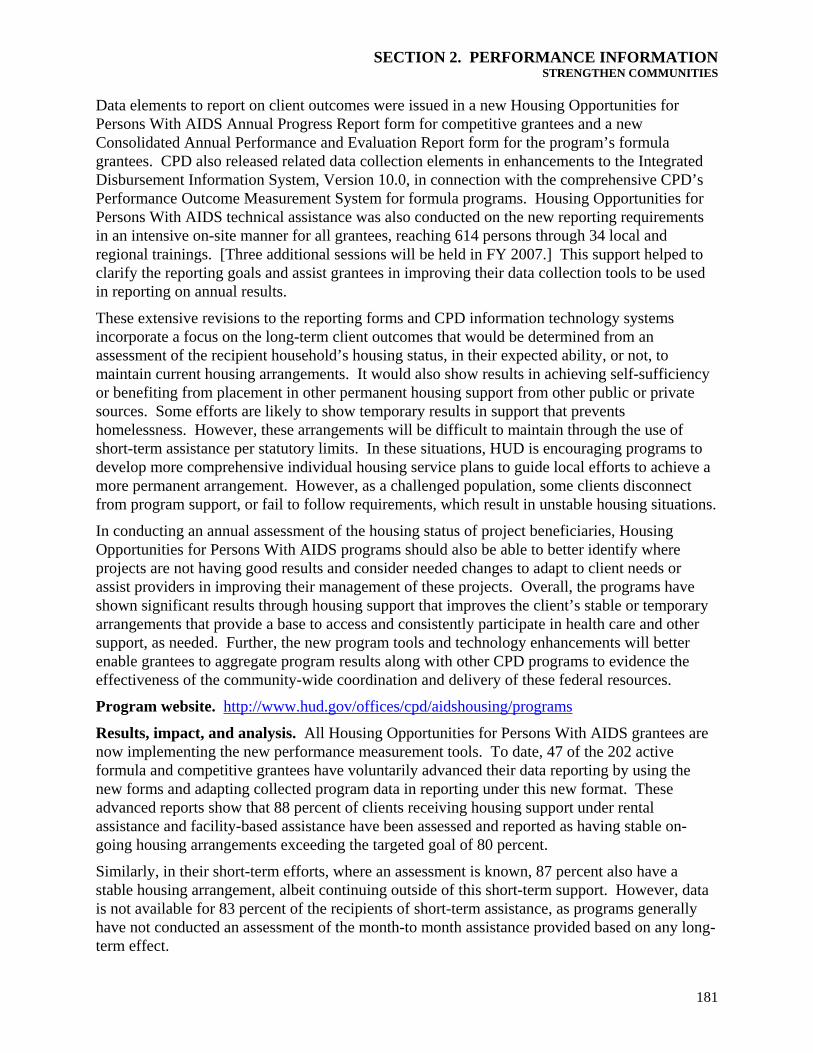
SECTION 2. PERFORMANCE INFORMATION STRENGTHEN COMMUNITIES
Data elements to report on client outcomes were issued in a new Housing Opportunities for Persons With AIDS Annual Progress Report form for competitive grantees and a new Consolidated Annual Performance and Evaluation Report form for the program’s formula grantees. CPD also released related data collection elements in enhancements to the Integrated Disbursement Information System, Version 10.0, in connection with the comprehensive CPD’s Performance Outcome Measurement System for formula programs. Housing Opportunities for Persons With AIDS technical assistance was also conducted on the new reporting requirements in an intensive on-site manner for all grantees, reaching 614 persons through 34 local and regional trainings. [Three additional sessions will be held in FY 2007.] This support helped to clarify the reporting goals and assist grantees in improving their data collection tools to be used in reporting on annual results.
These extensive revisions to the reporting forms and CPD information technology systems incorporate a focus on the long-term client outcomes that would be determined from an assessment of the recipient household’s housing status, in their expected ability, or not, to maintain current housing arrangements. It would also show results in achieving self-sufficiency or benefiting from placement in other permanent housing support from other public or private sources. Some efforts are likely to show temporary results in support that prevents homelessness. However, these arrangements will be difficult to maintain through the use of short-term assistance per statutory limits. In these situations, HUD is encouraging programs to develop more comprehensive individual housing service plans to guide local efforts to achieve a more permanent arrangement. However, as a challenged population, some clients disconnect from program support, or fail to follow requirements, which result in unstable housing situations.
In conducting an annual assessment of the housing status of project beneficiaries, Housing Opportunities for Persons With AIDS programs should also be able to better identify where projects are not having good results and consider needed changes to adapt to client needs or assist providers in improving their management of these projects. Overall, the programs have shown significant results through housing support that improves the client’s stable or temporary arrangements that provide a base to access and consistently participate in health care and other support, as needed. Further, the new program tools and technology enhancements will better enable grantees to aggregate program results along with other CPD programs to evidence the effectiveness of the community-wide coordination and delivery of these federal resources.
Program website. http://www.hud.gov/offices/cpd/aidshousing/programs
Results, impact, and analysis. All Housing Opportunities for Persons With AIDS grantees are now implementing the new performance measurement tools. To date, 47 of the 202 active formula and competitive grantees have voluntarily advanced their data reporting by using the new forms and adapting collected program data in reporting under this new format. These advanced reports show that 88 percent of clients receiving housing support under rental assistance and facility-based assistance have been assessed and reported as having stable on-going housing arrangements exceeding the targeted goal of 80 percent.
Similarly, in their short-term efforts, where an assessment is known, 87 percent also have a stable housing arrangement, albeit continuing outside of this short-term support. However, data is not available for 83 percent of the recipients of short-term assistance, as programs generally have not conducted an assessment of the month-to month assistance provided based on any long-term effect.
181

PERFORMANCE AND ACCOUNTABILITY REPORT
The program office has provided all Housing Opportunities for Persons With AIDS grantees training and guidance on reporting accomplishments of the short-term efforts consistent with the new focus on long-term client outcomes. Continued support will be needed to operate short-term programs to ensure they are working to connect clients to permanent housing support, where needed, as well as in reporting these client outcomes accordingly. However, data suggests that grantees have used the short-term component to continue support over time to a large number of returning clients who have on-going housing needs. The advance data indicates that over half of these clients have returned for additional short-term support, in subsequent program years.
Data discussion. In FY 2006, the Housing Opportunities for Persons With AIDS formula and competitive grantees began using the revised reporting forms, Consolidated Annual Performance and Evaluation Report and Annual Performance Report, to submit annual data on client outcomes. Nationwide data will not be complete until all grantees complete one year under this new format, based on their approved grant cycle in the Consolidated Plan. Based on HUD experience, the program office would also expect that further efforts are needed for verification and evaluation of the data, with corrective actions and technical support to improve the effectiveness of these new efforts in assessing household stability. The main elements of the Housing Opportunities for Persons With AIDS outcome measures have been incorporated into the Integrated Disbursement Information System in FY 2006. Some elements remain pending implementation along with significant changes to enhance and redesign the general functionality and reporting under this information technology system. In addition to the technical assistance provided on the new reporting formats, the program office has issued additional guidance to grantees on administering Housing Opportunities for Persons With AIDS programs, revised regulations, and monitoring tools on this matter. In supporting the assessment of short-term assistance and improving accuracy of reporting data, guidance is also found in CPD notice, CPD 06-07, Standards for HOPWA Short-term Rent, Mortgage and Utility Payments and Connections to Permanent Housing, issued in August 2006. In addition, HUD is collaborating with the Centers for Disease Control in conducting research at three project sites that will provide further insight on program accomplishments or lessons learned.
Objective C4: Mitigate housing conditions that threaten health. C4.1: Reduce the average number of observed exigent deficiencies per property for substandard public housing properties by 10 percent and the overall multifamily housing portfolio by 5 percent. Background. Improving the physical quality of public housing and the HUD-involved privately-owned Multifamily housing is a major outcome goal for the Department, and it is included as a priority in the President’s Management Agenda. The Real Estate Assessment Center conducts physical inspections that identify exigent health and safety or fire safety deficiencies. Exigent health and safety hazards include, but are not limited to: (1) air quality, gas leaks; (2) electrical hazards, exposed wires/open panels; (3) water leaks on or near electrical equipment; (4) emergency/fire exits/blocked/unusable fire escapes; (5) blocked egress/ladders; and (6) carbon monoxide hazards. Fire safety hazards include: (1) window security bars preventing egress; and (2) fire extinguishers expired. (Smoke detectors are excluded from exigent health and safety or fire safety deficiencies for this measure because they are covered in Indicator C4.2.)
182

SECTION 2. PERFORMANCE INFORMATION STRENGTHEN COMMUNITIES
This indicator measures the reductions in exigent health and safety or fire safety deficiencies nationwide as HUD applies its physical inspection protocol, Uniform Property Condition Standards, to properties inspected. The use of physical inspections by the Real Estate Assessment Center has effected a reduction in exigent health and safety hazards. This trend is likely to continue. However, this indicator is based on identification of such conditions when inspected.
In previous years the Department focused on the reductions in exigent health and safety hazards and fire safety hazards for public housing on an overall basis. Due to scarce monitoring resources, the Department is shifting its focus to reduce the defects on the worst case properties. The goal for FY 2006 is to reduce the average number of observed exigent deficiencies per property for substandard public housing properties by 10 percent and for the overall multifamily housing portfolio by 5 percent.
Results, impact, and analysis. For public housing HUD exceeded its goal in FY 2006 by reducing the average defects per property for properties with a Physical Assessment Subsystem score of less than 60 by 54 percent. The substandard properties totaled 676 at the beginning of FY 2006. For those properties the exigent health and safety hazards defects per property were 4.55 compared to 9.80 defects per property in previous years. The overall public housing measurement improved from 1.92 average deficiencies in FY 2005 to 1.80 in FY 2006. This is a result of HUD’s long-term outcome goal to improve the quality and safety of the Nation’s public housing stock.
During FY 2006, the average number of exigent deficiencies observed per privately owned multifamily property increased by 0.06, to 1.46 per property. The result falls short of the goal of a 5 percent reduction in the average number of observed exigent deficiencies per property for the multifamily housing portfolio, or fewer than 1.40 deficiencies per multifamily property in FY 2006.
When life threatening health and safety deficiencies are detected during HUD’s on-site physical inspections, citations are issued to project owners and agents requiring corrective action and response to HUD within three business days. In FY 2006, nationwide, HUD’s field staff continued to assure that 98 percent of these multifamily deficiencies were corrected or mitigated. Many types of defects covered by the process may be attributable to tenant behavior or local risk decisions rather than maintenance issues.
Reasons for shortfall/Performance improvement plans. Under the “3-2-1” protocol for inspection scheduling, lower scoring projects are inspected and acted on every year to motivate greater improvement in physical conditions. Because of the implementation of the 3-2-1 protocol Multifamily Housing expected that the average defects would rise, since the lower scoring properties (those with more defects) would be visited more frequently. The results indicate that the impact of this change on the goal has not been as great as expected, however, there may have been some effect. Additionally, HUD continues to refine the inspection process. Data definitions have been expanded to address increased types of deficiencies.
Multifamily Housing’s failure to meet its goal may be attributable to the changes in the inspection protocol or to the fact that a number of inspections were delayed and as of September 30, 2006, there remained a sizable backlog of inspections pending (some 8,600 properties were awaiting inspection). There were a number of causes for the delays such
183

PERFORMANCE AND ACCOUNTABILITY REPORT
as inspection contract protests which delayed implementation of the reverse auction program, and funding problems for the HUD direct loan, HUD-held and non-insured portfolios which contributed to shrinking the pool of inspectors so that once the reverse auction was implemented, there were too few inspectors to meet the demand. Both HUD and the mortgagees have had difficulties getting timely inspections.
Other than Multifamily Housing’s dependence on appropriations for the inspections of its direct loan portfolio, HUD-held and non-insured properties, the funding issues from FY 2006 have been resolved and funding should not present a problem in FY 2007. Additionally, the Real Estate Assessment Center and Multifamily Housing are working to increase the pool of qualified inspectors through outreach, training and proposed changes in inspector qualification requirements.
Data discussion. Data for this indicator are from the Real Estate Assessment Center’s Physical Assessment Subsystem. The data represent inspections conducted through September 30 of each year. A number of properties do not receive new inspections every year if their scores pass the thresholds under the “3-2-1” inspections every year for public housing and the “3-2-1” schedule for multifamily properties. An independent assessment in 2002 showed that PHAS-PASS performance indicator data passed 4-sigma quality tests (reflecting fewer than 6,210 errors per million) for validity, completeness, and consistency.
C4.2: The share of units that have functioning smoke detectors and are in buildings with functioning smoke detectors will be 92.8 percent or greater for public and multifamily housing. Background. The National Fire Protection Association reports that although smoke alarms cut the chances of dying in a fire by 40 to 50 percent, about one-quarter of U.S. households lack working smoke alarms. HUD is committed to ensuring the safety of its public and multifamily housing by continuously inspecting units for the presence of operating smoke detectors. HUD’s Real Estate Assessment Center’s physical inspections of public and assisted housing include checks of fire safety features including the presence of operational smoke detectors in housing units, common areas, and utility areas of buildings. This indicator measures the share of units that are protected by a fully functional smoke detection system, defined as smoke detectors that are observed to be both present in the unit as well as the building in which the unit is located. Functional smoke detection systems in common areas of a building are critical to overall fire safety.
Public Housing and Multifamily Units w ith Functional Smoke
Detection Systems
91.8%
92.9%
93.6%
92.8%
93.8%94.0%93.4%
91.8% 92.8%
90%
95%
2003 2004 2005 2006
perc
ent
of u
nits
protected units - public housingprotected units - m ult ifam ilyoutput goal
Results, impact, and analysis. The Department exceeded its goal related to the share of units with functional smoke detection systems in public housing and assisted multifamily housing. As of the end of FY 2006, 93.6 percent of public housing units (1,230,063 of 1,151,824) had functioning smoke detectors and were in buildings with functioning smoke detection systems compared to the target of 92.8 percent for public housing and the 92.9 percent achieved in FY 2005. As
184

SECTION 2. PERFORMANCE INFORMATION STRENGTHEN COMMUNITIES
of the end of FY 2006, 93.8 percent of assisted multifamily units had functioning smoke detectors and were in buildings with functioning smoke detection systems, up from 92.9 percent in FY 2005. This represents a .9 percentage point increase for assisted multifamily housing over the previous fiscal year, and exceeds the goal of 92.8 percent.
These results show that the share of HUD-assisted households that are adequately protected with smoke detectors significantly exceeds the three-quarter share of all U.S. households who are protected. The Department’s attention to physical conditions in the housing stock is believed to have motivated improvements in management by housing providers.
Data discussion. Data for this indicator are from the Real Estate Assessment Center’s Physical Assessment Subsystem, based on a sample of units from each project, and weighted to represent the entire stock. For private multifamily properties, results for FY 2006 reflect the most recent inspections available as of September 30, 2006. Properties are inspected at intervals of one, two or three years, depending on the results of the previous inspection, so a substantial share of properties do not receive a new inspection annually. An independent assessment in 2002 showed that HUD’s Physical Assessment Subsystem data passed 4-sigma quality tests (reflecting less than 6,210 errors per million) for validity, completeness, and consistency.
C4.3: The number of children under the age of 6 who have elevated blood lead levels will be less than 270,000 in 2006, according to the Centers for Disease Control and Prevention’s most recent published report. Background. This outcome indicator responds to the President and Secretary’s priority effort to eliminate lead poisoning in children by 2010. Lead poisoning is the number one environmental disease impacting children. Elevated blood lead levels defined as being at or above 10 micrograms per deciliter14 are more common among low-income children, urban children, and those living in older housing. These children, especially those less than three years old, are vulnerable to permanent developmental problems because of the well-documented effect of lead on developing nervous systems. The number of children under the age of 6 who have elevated blood lead levels will be less than 270,000 in 2006.
The FY 2007 Annual Performance Plan (see Appendix A) adjusted the FY 2006 indicator to reflect a shift in the tracking method to using the estimate of elevated blood lead levels to be published by the Centers for Disease Control and Prevention this year.
Program website: www.hud.gov/offices/lead
Results, impact, and analysis. Between 1991-1994 there were 890,000 children under age 6 with elevated blood lead levels. As a result of HUD’s efforts, in partnership with the Centers for Disease Control and Prevention, Environmental Protection Agency, and other agencies, we have achieved a reduction to 310,000 in 1999-2002, and are on target to eliminate childhood lead poisoning as a public health hazard by 2010. This is a substantial reduction that should, by decade’s end, put a totally avoidable epidemic - lead poisoning caused by housing - to an end. At that point, a national effort that ensures the integrity of lead-based paint in homes will avoid the potential for a rebound (as happened with tuberculosis) and keep our children lead safe.
14 www.cdc.gov/mmwr/preview/mmwrhtml/mm5420a5.htm.
185

PERFORMANCE AND ACCOUNTABILITY REPORT
Based on the trends since the 1980s, the estimated number of children under the age of 6 with elevated blood lead levels is under 270,000, thus matching the goal. By 2008, the Centers for Disease Control and Prevention is expected to report the number of lead-poisoned children for 2004.
Furthermore, HUD’s national survey shows that the number of units with lead paint fell from 64 million in 1990 to 38 million in 2000.15 HUD is conducting a follow-on national study (the American Healthy Homes Survey) to develop a mid-decade estimate of the decrease in the number of homes with lead-based paint and with lead-based paint hazards. In short, these HUD and Centers for Disease Control and Prevention data are strong evidence that the strategy to eradicate childhood lead poisoning by 2010 is working, but much remains to be done, including the cooperative efforts by HUD with the Environmental Protection Agency (residential regulatory and public information activities), Centers for Disease Control and Prevention (outreach and strategic planning), the Occupational Safety and Health Administration (workplace regulatory activities), and other federal, state and local agencies.
Data discussion. The National Health and Nutrition Examination Survey, conducted by the Centers for Disease Control and Prevention uses actual physical examinations of a large, nationally representative sample of children to determine blood-lead levels, among other things. This survey, the only national survey of children’s blood lead levels, is regarded as providing the best national estimate of a number of health outcomes, and incorporates a variety of quality control and verification procedures that make it reliable. The Centers for Disease Control and Prevention’s long-term quality control data for blood lead tests validate the survey results. The Childhood Blood Lead Surveillance program, which supports state blood lead surveillance efforts, also includes a validation component.16 HUD does not verify the survey results independently; doing so duplicates the Centers for Disease Control and Prevention’s verification procedures. The survey cannot identify the source of elevated blood lead levels.
C4.4: As part of a 10 year effort to eradicate lead hazards, the Lead Hazard Control Grant program will make 9,250 units lead safe in FY 2006. Background. The Lead Hazard Control Grant program has an aggressive, high priority, outcome goal – elimination of childhood lead poisoning by 2010. Lead hazard control and related treatment efforts are an essential component to eradicating lead poisoning of children. The Office of Healthy Homes and Lead Hazard Control provides grants to state and local government agencies, and to private sector organizations, to control lead and housing-related hazards in privately owned, low-income housing. Exposure to lead can cause permanent damage to the nervous system and a variety of health problems, including reduced intelligence and attention span, hearing loss, stunted growth, reading and learning problems, and behavior difficulties. Lead dust associated with housing is the major pathway by which children are exposed to lead-based paint. See Indicator C4.3. The primary output measure of the program is the number of homes made lead-safe by the grantee.
15 Jacobs, D.E. et al., “The Prevalence of Lead-Based Paint Hazards in U.S. Housing,” Environmental Health Perspectives 110 (A599-A606), 2002; http://ehp.niehs.nih.gov/members/2002/110pA599-A606jacobs/jacobs-full.html. 16 See www.cdc.gov/nceh/lead/surv/surv.htm.
186

SECTION 2. PERFORMANCE INFORMATION STRENGTHEN COMMUNITIES
The FY 2007 Annual Performance Plan (see Appendix A) revised downward the FY 2006 target from 10,366 units to reflect the 31 percent decrease in the number of applications.
Program website: www.hud.gov/offices/lead
Results, impact, and analysis. In FY 2006 the program exceeded its goal by making 9,638 housing units lead-safe. According to HUD’s National Lead-Based Paint survey,17 38 million homes had lead paint in 2000. The Lead Hazard Control Grant program requires grantees to employ certified personnel to cclearance (quality control) lead dust sampleshousing to confirm that it has been made lead-safe. The program has made a significant contribution toward the goal although exfactors in the housing market (e.g., normal rates of renovation) appear to have had a major impact. A rigorous scientific evaluation of the program found that the grant program hazard control methods reduce the blood lead levels of children occupying treated units and also significantly reduce lead dust in treated homes.
ollect in
ternal
18
Est im a te d Housing Units m a de Le a d- Sa fe
9,098 8,8117,500
9,6389,250
0
5,000
10,000
2003 2004 2005 2006
units
units declared lead- safeoutcom e goal
Data discussion. This measure uses the Office of Healthy Homes and Lead Hazard Control administrative data derived from grant agreements, quarterly and final reports collected from grantees by web-based reporting, as well as from monitoring. Reports provide detailed quantitative and qualitative information regarding progress, achievements, and barriers to performance, which are required to maximize grantee performance and to protect the largest number of children possible. The reporting system is supplemented by telephone and written communication, as well as on-site monitoring by HUD field and headquarters staff, and quality assurance checks, including reviewing post-hazard control clearance reports for all units, and reviewing invoice documentation in detail for each grantee at least annually (plus as needed on a targeted basis). The data is considered fully reliable and complete. The collection of data is pursued in a rigorous and scientific manner and through the methods mentioned above, as well as through the results of the quality assurance checks and grantee monitoring efforts. Since the inception of the formalized Quarterly Performance Reporting System, data reporting errors have decreased to a minimal amount. The data are appropriately conservative in that they underreport the number of housing units made lead-safe as a result of public outreach/education programs; leveraging of other funds; federal, state and local enforcement efforts; technical studies; and other HUD rehabilitation housing assistance covered by the HUD Lead Safe Housing Rule for assisted housing.
17 Jacobs, D.E. et al., “The Prevalence of Lead-Based Paint Hazards in U.S. Housing,” Environmental Health Perspectives 110 (A599-A606), 2002; http://ehp.niehs.nih.gov/members/2002/110pA599-A606jacobs/jacobs-full.html. 18 Dixon, S. et al., “Effectiveness of lead-hazard control interventions on dust lead loadings: findings from the evaluation of the HUD Lead-Based Paint Hazard Control Grant Program,” Environmental Research 98 (303-314), 2005.
187

PERFORMANCE AND ACCOUNTABILITY REPORT
C4.5: At least 600 housing units will have a reduction in allergen levels in FY 2006 through interventions using Healthy Homes principles. Background. The Healthy Homes program contributes to the achievement of HUD’s strategic goals by reducing multiple housing-related hazards that result in preventable childhood illnesses and injuries, such as lead poisoning and asthma. This program gives particular emphasis to the mitigation of asthma triggers, such as mold and allergens (associated with debris from pets, dust mites, cockroaches, and rodents). The focus on asthma reflects the widespread occurrence of asthma in children and the heavy costs associated with this disease to both families and society. The target for FY 2006 is to reduce allergen (allergy-inducing substance) levels in at least 600 housing units undergoing construction or rehabilitation interventions using Healthy Homes principles. The long-term goal is to reduce allergen levels in 5,000 units by 2011. Achievement of these goals will provide models for disseminating information about allergen mitigation on a national scale.
Because the Healthy Homes approach is to comprehensively address housing-related hazards that impact the health of residents, particularly children, healthy homes projects also involve inspecting residences and providing physical interventions (such as smoke/carbon monoxide detectors), providing pillow and mattress covers, pest control (through integrated pest management with roach traps and gels), repairs to correct plumbing leaks, moisture incursion through building envelopes, lead hazards, proper ventilation of appliances (such as stoves and furnaces), and dust control (through high efficiency filters and vacuums).
The FY 2007 Annual Performance Plan (see Appendix A) revised the FY 2006 indicator from the output (production) measure of housing units in which interventions occur to the outcome measure of reducing levels of allergens.
Program website: www.hud.gov/offices/lead
Results, impact, and analysis. In FY 2006 the program exceeded its goal by reducing allergen levels in a projected 1,704 housing units based on three quarters of data. Because a principal focus of the Healthy Homes program is the reduction of asthma triggers, the units mitigated for respiratory hazards (allergens from pets, pests, and mold) comprise approximately 76 percent of the projected total of 2,246 units mitigated using Healthy Homes principles in the fiscal year. Healthy Homes grantees focus on mitigating allergens through integrated pest management, cleaning, and other cost-effective measures, including appropriate ventilation and elimination of moisture. Principal outcomes of the projects undertaken in FY 2006 included increased public and industry awareness of healthy homes issues, obtained through training, distribution of healthy homes materials to individuals, organizations, and HUD field offices, and developing and publicizing new technologies and protocols for improving housing.
Data discussion. This measure uses the Office of Healthy Homes and Lead Hazard Control administrative data derived from grant agreements, quarterly and final reports collected from grantees by web-based reporting, and monitoring. HUD requires that these reports provide detailed quantitative and qualitative information regarding progress, achievements, and programmatic challenges to maximize grantee performance and to protect the largest number of children possible. The reporting system is supplemented by telephone and written communication, as well as on-site monitoring by HUD field and headquarters staff, and quality assurance checks, including reviewing post-hazard control results for all units, and reviewing
188

SECTION 2. PERFORMANCE INFORMATION STRENGTHEN COMMUNITIES
invoice documentation in detail for each grantee at least annually (plus as needed on a targeted basis). These data are considered fully reliable and complete. The collection of data is pursued through the methods mentioned above and in a rigorous and scientific manner. Since the inception of the formalized Quarterly Performance Reporting System, data reporting errors are minimal.
C4.6: Upon advice from the Consensus Committee, HUD will establish the dispute resolution and installation programs mandated by the Manufactured Housing Improvement Act of 2000 by September 30, 2006. Background. The Manufactured Housing Improvement Act of 2000 establishes new responsibilities and procedures for the Department with respect to its role in regulating manufactured housing. The Act established the Manufactured Housing Consensus Committee (Consensus Committee) to provide the Secretary with recommendations regarding the program’s standards and regulations.
The Act requires the Consensus Committee to propose model manufactured home installation standards to HUD’s Secretary within 18 months of appointment. The Act requires the Department to establish installation and dispute resolution programs for manufactured homes within five years of the effective date of the Act. These new federal programs are to operate in states that do not have their own programs.
Program website: http://www.hud.gov/offices/hsg/sfh/mhs/mhshome.cfm.
Results, impact, and analysis. HUD’s FY 2006 performance goal was to establish the dispute resolution and installation programs mandated by the Manufactured Housing Improvement Act of 2000 by September 30, 2006. The Department did not fully meet its goals for FY 2006. The proposed rules for Model Manufactured Home Installation Standards, Manufactured Home Installation Program, and Manufactured Housing Dispute Resolution have been published. The final rules for the Model Manufactured Home Installation Standards and the Manufactured Housing Dispute Resolution Program have been completed and will be ready for review by the Office of Management and Budget within the next 30 days. The proposed rule for the Manufactured Home Installation Program was published for public comment on June 14, 2006. The final rule is presently being prepared.
Reasons for shortfall/Performance improvement plans. The Department has worked extensively with the Consensus Committee to develop the rules for the installation and dispute resolution programs. The extensive consultation with the Consensus Committee on what are complex technical and policy issues extended the time necessary for the rulemaking process and involved the Committee’s review and comment on drafts of these rules prior to their submission to OMB. Multiple conference call meetings of the Consensus Committee have been necessary for each rule, which has delayed publication.
Beginning in FY 2004, the program office lost more than 50 percent of its technical and engineering staff. These program engineers were not only involved in the development of the standards and regulations for installation and dispute resolution, but were also involved in additional rules that will revise and update the Department’s Manufactured Home Construction and Safety Standards. Recently restored hiring authority has allowed the program office to replace three of these lost engineers and two program specialists. With these additional
189

PERFORMANCE AND ACCOUNTABILITY REPORT
personnel, the program office expects to establish both new programs in FY 2007 by publication of final rules.
Data discussion. Accomplishments are assessed through weekly reports submitted to the Assistant Secretary for Housing – Federal Housing Commissioner, and are verifiable by consulting the Federal Register.
190

SECTION 2. PERFORMANCE INFORMATION ENSURE EQUAL OPPORTUNITY IN HOUSING
Goal FH: Ensure Equal Opportunity in Housing Strategic Objective:
FH1 Provide a fair and efficient administrative process to investigate and resolve complaints of discrimination.
FH2 Improve public awareness of fair housing laws.
FH3 Improve housing accessibility for persons with disabilities.
PERFORMANCE REPORT CARD - GOAL FH
Performance Indicators FY 2003 Actual
FY 2004 Actual
FY 2005 Actual
FY Actual2006
FY 2006 Target
Met or Missed Notes
FH1.1 Increase the percentage of fair housing complaints closed in 100 days to 60 percent, excluding recommended cause, pattern and practice, and systemic complaints. N/A N/A 77% 73% 60% Met
FH1.2 Increase the percentage of Fair Housing Assistance Program complaints closed in 100 days to 50 percent, excluding recommended cause and systemic complaints. N/A N/A 48% 51% 50% Met
FH1.3 In order to increase the nation’s capacity to provide coordinated enforcement of fair housing laws, certify four new substantially equivalent agencies under the Fair Housing Act. 98 101 103 107 107 Met
FH1.4 By the end of FY 2006, at least 400 investigators will receive training in fair housing investigative techniques through the National Fair Housing Training Academy N/A N/A N/A 796 400 Met
FH2.1 Recipients of Fair Housing Initiatives Program education and outreach grants will hold 200 public events, to include outreach to faith-based and grassroots organizations reaching, at least, 160,000 people. N/A N/A
405 519,000
Met
697 250,799
200 160,000 Met
FH3.1 HUD will conduct 80 Section 504 disability compliance reviews or formal Voluntary Compliance Agreements monitoring reviews of HUD recipients and take appropriate corrective action 75 113 80 83 80 Met
Notes:
h Baseline newly established.
j Number is in thousands. k Number reported in millions.
a Data not available. b No performance goal for this fiscal year. c Tracking indicator. d Third quarter of calendar year (last quarter of fiscal year; not the entire fiscal year). e Calendar year beginning during the fiscal year shown. f Calendar year ending during the fiscal year shown. g Result too complex to summarize. See indicator.
i Result is estimated.
l Number reported in billions.
191

PERFORMANCE AND ACCOUNTABILITY REPORT
Objective FH1: Provide a fair and efficient administrative process to investigate and resolve complaints of discrimination. FH1.1: Increase the percentage of fair housing complaints closed in 100 days to 60 percent, excluding recommended cause, pattern and practice, and systemic complaints. Background. The Fair Housing Act prohibits discrimination in housing based on race, color, religion, sex, national origin, disability, and familial status. The law prohibits discrimination in residential real estate transactions and makes it illegal to coerce, intimidate, threaten, or interfere with people exercising their rights under the Act, or assisting others in exercising their rights. Consequently, the efficiency of complaint processing is an important dimension of the fair housing performance of HUD and its substantially equivalent agencies. Prompt resolution of complaints ensures important outcomes, including that evidence is preserved, witnesses are more readily available, and other victims of discrimination are more likely to file complaints.
This case processing efficiency indicator measures HUD’s ability to process routine fair housing complaints within the statutory timeframe. More specifically, this indicator tracks the percentage of complaints that HUD closed within 100 days during the fiscal year, with the exception of recommended cause, pattern and practice, and systemic complaints. It is important to note that there are instances, such as illness of the complainant or respondent, in which it may not be practical to complete routine complaints within 100 days.
The FY 2007 Annual Performance Plan (see Appendix A) revised the FY 2006 indicator to exclude recommended cause, pattern and practice, and systemic complaints, which are complex in nature and require more than 100 days to complete.
Program website: http://www.hud.gov/offices/fheo/index.cfm
Results, impact, and analysis. In FY 2006 HUD closed 73 percent of its fair housing complaints within 100 days, exceeding the goal of 60 percent. Results for this indicator were calculated by dividing the number of applicable cases closed between October 1, 2005, and September 30, 2006, that had been open 100 days or less, by the total number of applicable cases closed during that time frame. This measure included some recommended cause, pattern and practice, and systemic complaints, and non-complex cases. In previous fiscal years, the Department only measured non-complex fair housing complaints that were closed within 100 days. The previous measure excluded complaints with allegations that fell within the definition of complex. Complex fair housing complaints were those that contained issues alleging discriminatory financing, discriminatory brokerage service, refusal to provide insurance, redlining, steering, failure to meet senior housing exemption criteria, non-compliance with design and construction requirements, and failure to permit a reasonable modification. The HUD Office of Fair Housing and Equal Opportunity modified the indicator in FY 2006 to measure HUD’s ability to process all fair housing complaints within 100 days, but later determined that recommended cause cases, pattern and practice and systemic complaints should be excluded from the measure. This indicator plays an integral role in building and assuring public confidence in HUD’s responsiveness to victims of housing discrimination. The Office of Fair Housing and Equal Opportunity will continue to effectively process fair housing complaints
192

SECTION 2. PERFORMANCE INFORMATION ENSURE EQUAL OPPORTUNITY IN HOUSING
within 100 days while, at the same time, ensuring fair and impartial treatment to all parties involved.
Data discussion. Data are maintained in the Title Eight Automated Paperless Office Tracking System. That system incorporates internal controls to ensure quality assurance.
FH1.2: Increase the percentage of Fair Housing Assistance Program complaints closed in 100 days to 50 percent, excluding recommended cause and systemic complaints. Background. In FY 2006, HUD provided approximately $26 million in funding through the Fair Housing Assistance Program to state and local government agencies that enforce laws that are substantially equivalent to the federal Fair Housing Act. This assistance includes support for complaint processing, training, technical assistance, data and information systems, and other fair housing projects. The program is designed to build coordinated intergovernmental enforcement of fair housing laws and provide incentives for states and localities to assume a greater share of the responsibility for administrating fair housing laws.
The efficiency of these agencies in processing complaints of discrimination is an important factor in assessing the effectiveness of their enforcement efforts. When Fair Housing Assistance Program agencies process complaints in a timely manner, important outcomes occur, including increasing assurance that evidence is preserved, witnesses are more readily available, and victims are more likely to file complaints.
This indicator tracks the percentage of complaints in the Fair Housing Assistance Program inventory that are completed within the statutory timeframe of 100 days. Increasing the percentage of fair housing complaints closed within 100 days by substantially equivalent agencies helps boost the visibility of fair housing laws and increases the public confidence in the fair housing complaint process. The measure includes all types of cases processed by Fair Housing Assistance Program agencies, except recommended cause and systemic complaints that require more than 100 days to process.
The FY 2007 Annual Performance Plan (Appendix A) revised the FY 2006 indicator to exclude recommended cause and systemic complaints, which are complex in nature and normally require more than 100 days to complete.
Program website: http://www.hud.gov/offices/fheo/index.cfm
Results, impact, and analysis. The goal established by this indicator was to increase the percentage of Fair Housing Assistance Program complaints closed within 100 days to 50 percent. In FY 2006, Fair Housing Assistance Program agencies closed 51 percent of its complaints within 100 days, exceeding its goal.
The result plays a key role in assuring public confidence in HUD’s fair housing enforcement efforts. HUD’s Office of Fair Housing and Equal Opportunity will continue to effectively monitor progress of the agencies and provide technical assistance and training in order to ensure continued increases in the percentage of complaints closed within 100 days.
Data discussion. The data are maintained in the Title Eight Automated Paperless Office Tracking System. This system incorporates controls for quality assurance. Results for this indicator were calculated by dividing the number of cases closed between October 1, 2005, and
193

PERFORMANCE AND ACCOUNTABILITY REPORT
September 30, 2006, that were open for 100 days or less, by the total number of cases closed during that time frame, excluding systemic and recommended cause complaints.
FH1.3: In order to increase the nation’s capacity to provide coordinated enforcement of fair housing laws, certify four new substantially equivalent agencies under the Fair Housing Act. Background. HUD provides funding through the Fair Housing Assistance Program to state and local government agencies that enforce state fair housing laws or local ordinances that are substantially equivalent to the federal Fair Housing Act. This assistance includes support for complaint processing, training, technical assistance, data and information systems, and other fair housing projects. The program is designed to build coordinated intergovernmental enforcement of fair housing laws and provide incentives for states and localities to assume a greater share of the responsibility for administrating fair housing laws. This indicator tracks the number of state and local government agencies that have been certified as substantially equivalent during the fiscal year.
Num be r of Substa nt ia lly Equiv a le nt Fa ir Housing Enfor ce m e nt Age ncie s
98 101 103 107107
80
100
120
2003 2004 2005 2006
cert
ified
age
ncie
s
substantially equivalent agenciesoutput goal
Program website: http://www.hud.gov/offices/fheo/partners/FHAP/index.cfm
Results, impact, and analysis. HUD met its FY 2006 target of certifying four new substantially equivalent agencies. This represents a 100 percent increase over the number of agencies certified in FY 2005. The newly certified agencies are Duluth, MN; Cerro Gordo County, IA; Canton, OH; and St. Louis, MO. The certification of these new agencies increases HUD’s capacity to provide coordinated enforcement of fair housing laws nationwide.
Data discussion. Fair Housing Assistance Program administrative data are maintained in the Title Eight Automated Paperless Office Tracking System. This indicator uses a straightforward and easily verifiable count of Fair Housing Assistance Program agencies. Determinations of substantial equivalency are made by the Assistant Secretary for Fair Housing and Equal Opportunity in accordance with the regulations at 24 CFR Part 115.
Background. Beginning in FY 2004, HUD requested and received funds to oversee the establishment of a National Fair Housing Training Academy to provide continuing fair housing education to current professional staff of fair housing enforcement agencies. The Academy was funded at $3.8 million in FY 2006. The Academy improves individual, as well as organizational performance, to more efficiently and effectively respond to complaints of housing discrimination. In FY 2005, HUD trained 781 individuals through the Training Academy, many
FH1.4: By the end of FY 2006, at least 400 investigators will receive training in fair housing investigative techniques through the National Fair Housing Training Academy.
194

SECTION 2. PERFORMANCE INFORMATION ENSURE EQUAL OPPORTUNITY IN HOUSING
of whom will receive full certification in FY 2007. This effort is particularly important to achieve effective fair housing results recognizing the limitation of available resources.
The FY 2007 Annual Performance Plan (see Appendix A) revised the FY 2006 indicator to capture the number of investigators trained instead of the number of investigators receiving full certification. HUD will begin capturing data on full certification beginning in FY 2007.
Program website: http://www.hud.gov/offices/fheo/nfhta.cfm
Results, impact, and analysis. In FY 2006, 796 fair housing professionals attended training at the National Fair Housing Training Academy, exceeding the goal by 99 percent. In addition, 59 attendees completed all five modules and received Certificates of Completion.
Continued training and subsequent certification at the academy ensures nationwide consistency in processing fair housing complaints.
Data discussion. Staff tracking and recordation of online registration ensures accurate enrollment census. Enrollment and certification data will be used to measure and verify improvement of investigative skills.
Objective FH2: Improve public awareness of fair housing laws. FH2.1: Recipients of Fair Housing Initiatives Program education and outreach grants will hold 200 public events, to include outreach to faith-based and grassroots organizations, reaching at least 160,000 people. Background. The Fair Housing Initiatives Program provides grants to public, private, and nonprofit groups to conduct education and outreach activities within particular communities. These activities typically include developing and distributing educational materials and training housing industry professionals on fair housing rights and responsibilities.
Such activities go hand-in-hand with effective enforcement of fair housing laws, as many people in the United States lack awareness of those laws and ways in which to report violations. The 2002 HUD study, “How Much Do We Know?” (www.huduser.org/publications/fairhsg/hmwk.html), examined the public’s awareness of the Fair Housing Act’s prohibitions against housing discrimination. In 2006 HUD conducted a follow-up survey to determine whether public awareness had increased. The study found that there was little improvement in knowledge of the Fair Housing Act over the last four years. The study also found that, as with the earlier study, few people do anything about perceived acts of discrimination. Only 13 percent of potential victims expect that filing a complaint would very likely accomplish good results.
Program website: http://www.hud.gov/offices/fheo/partners/FHIP/fhip.cfm
Results, impact, and analysis. During FY 2006, the Fair Housing Initiatives Program grantees conducted 697 public events that reached 250,799 people. This result represents an increase over the number of events held in FY 2005 by 292 events, or 72 percent more events in FY 2006 than in FY 2005. This result also exceeded the goal for this fiscal year by reaching 91,000 additional persons, or 56.7 percent more than required. This effort reflects the contribution of education and outreach activities conducted by Fair Housing Initiatives Program grantees to the Department’s goal of increasing public awareness of fair housing laws.
195

PERFORMANCE AND ACCOUNTABILITY REPORT
Data discussion. HUD requires Fair Housing Initiatives Program recipients to report their education and outreach activities. HUD tracks the total number of events held and persons reached based on data derived from the quarterly and final reports submitted by the grantees. HUD also requires that Fair Housing Initiatives Program grantees submit copies of items, such as the programs and attendance sheets from education and outreach activities, to verify their activities. The data are reported in HUD’s Integrated Performance Reporting System.
Objective FH3: Improve housing accessibility for persons with disabilities. FH3.1: HUD will conduct 80 Section 504 disability compliance reviews or formal Voluntary Compliance Agreements monitoring reviews of HUD recipients and take appropriate corrective action. Background. The Office of Fair Housing and Equal Opportunity reviews PHAs, providers of HUD-assisted housing, and other HUD gfor compliance with Section 504 of the Rehabilitation Act of 1973, which prohibits discrimination by recipients of HUD federal financial assistance on the basis of disability. As a requirement of the Section 504 creview program accessibility and physical accessibility of HUD-funded housing and non-housing programs and activities are examinedDuring FY 2005, HUD issued letters of finin 80 compliance reviews.
Se ct ion 5 0 4 Fa ir Housing Com plia nce Re v ie ws Com ple te d by
FHEO
8380113
75
0
100
200
2003 2004 2005 2006
com
plet
ed r
evie
ws
com pliance reviews output goal
rantees
ompliance
. dings
The FY 2007 Annual Performance Plan (see Appendix A) adjusted the FY 2006 goal to place emphasis on HUD’s monitoring of voluntary compliance agreements resulting from compliance reviews. This effort ensures the immediate remedy of any discriminatory act found during completed reviews.
Program website: http://www.hud.gov/offices/fheo/index.cfm
Results, impact, and analysis. During FY 2006, HUD issued letters of finding in 83 compliance reviews and monitored 6 voluntary compliance agreements and exceeded the goal. These efforts ensure that appropriate action was being taken to resolve any outstanding discriminatory acts. HUD will continue to ensure that persons with disabilities are provided equal access to HUD-funded housing and other federally assisted programs and activities.
Data discussion. This measure uses data from the Title Eight Automated Paperless Office Tracking System and HUD’s Integrated Performance Reporting System. The database counts the various compliance and monitoring reviews conducted, but does not track the various stages or provide qualitative information about results of the reviews. HUD managers conduct periodic quality assurance reviews of the results.
196

SECTION 2. PERFORMANCE INFORMATION EMBRACE HIGH STANDARDS OF ETHICS, MANAGEMENT, AND ACCOUNTABILITY
Goal EM: Embrace High Standards of Ethics, Management, and Accountability Strategic Objectives:
EM1 Rebuild HUD’s human capital and further diversify its workforce.
EM2 Improve HUD’s management, internal controls and systems, and resolve audit issues.
EM3 Improve accountability, service delivery, and customer service of HUD and its partners.
EM4 Ensure program compliance.
EM5 Improve internal communications and employee involvement.
PERFORMANCE REPORT CARD – GOAL EM
# Performance Indicator FY 2003 Actual
FY 2004 Actual
FY 2005 Actual
FY Actual 2006
FY 2006 Target
Met or Missed Notes
EM1.1 The Resource Estimation and Allocation Process/Total Estimation and Allocation Mechanism/Corrective Action Plan System will complete four milestones in support of strategic human capital management.
Yes Yes 3 3 4 met
3 of 4
EM1.2 HUD will reduce skill gaps by 10 percent in its four core business program offices: Public and Indian Housing; Housing; Community Planning and Development; and Fair Housing and Equal Opportunity.
N/A N/A 1 10% 10% met g
EM1.3 Eighty percent of HUD interns are retained in mission-critical skill positions. N/A N/A 84% Yes Recruit met h
EM2.1 FHA will continue to address financial management and system deficiencies through the phased implementation of an integrated financial system to better support FHA’s business needs, with full completion by December 2006.
Yes Yes Yes No Complete missed g
EM2.2 HUD is proceeding with plans to eliminate non-compliant financial management systems. 4 4 2 2 2 met
EM2.3 HUD financial statements receive unqualified audit opinions, and the preparation and audit of HUD’s financial statements is accelerated.
Yes Yes Yes Yes Yes met
EM2.4 Ensure timely management decisions and final action on audit recommendations by the HUD Office of Inspector General.
Management Decisions (%) 100% 100% 99.5% 100% 99% met
Final Actions 120 33 35 28 17 met
EM2.5 HUD will conduct training on and exercise the Continuity of Operations (COOP) Plan. N/A N/A N/A Yes Yes met
197

PERFORMANCE AND ACCOUNTABILITY REPORT
PERFORMANCE REPORT CARD – GOAL EM
# Performance Indicator FY 2003 Actual
FY 2004 Actual
FY 2005 Actual
FY Actual 2006
FY 2006 Target
Met or Missed Notes
EM2.6 The Accelerated Claim and Asset Disposition demonstration program (Section 601) will exceed the rate of net recovery received through the conveyance program on the sale of single family assets.
70.2% 76.9% 77.4% 76.0% 68% met
EM2.7 HUD will institutionalize the Capability Maturity Model practices on IT projects by the end of FY 2006.
N/A N/A Yes N/A Yes met g
EM2.8 HUD will achieve Information Technology Investment Management Maturity Stage 4 by the end of 2006.
Stage 2 Stage 3 Stage 3 Stage 3 Stage 4 missed
EM2.9 HUD will complete the Enterprise Target Architecture by the end of FY 2006. N/A N/A N/A Target EA Target EA met
EM2.10 HUD will meet IT-related security requirements as follows:
Continue the Certification and Accreditation (C&A) effort to ensure that 100 percent of major applications documented in the Inventory of Automated Systems (IAS) have been certified and accredited;
100.0% 100.0% met
Prioritize and remedy high-priority risks; missed 49% 100%
Ensure 90 percent of HUD employees and contractors will have completed IT Security and Awareness Training.
98.0% 90.0% met
EM2.11 The share of completed CDBG activities for which grantees satisfactorily report accomplishments increases to 94 percent.
96.2% 94.0% met
EM2.12 The Chief Information Officer will perform data quality assessments of data used by HUD’s major systems to report on six Annual Performance Plan performance indicators not previously assessed.
8 6 met
EM3.1 HUD partners become more satisfied with the Department’s performance, operations, and programs.
N/A N/A N/A N/A Increase N/A a
EM3.2 At least 80 percent of key users (including researchers, state and local governments, and private industry) rate PD&R’s work products as valuable.
N/A N/A 87% 94% 80% met
EM3.3 More than 6.0 million files related to housing and community development topics will be downloaded from the Office of Policy Development and Research’s website.
5.9 8.25 6 met
EM3.4 At least 50 percent of HUD’s competitive grant application forms will be available electronically through the Internet.
100% 50% met
EM4.1 The high incidence of program errors and improper payments in HUD’s rental housing assistance programs will be reduced.
15% 30% 67% 71% 50% met g
198

SECTION 2. PERFORMANCE INFORMATION EMBRACE HIGH STANDARDS OF ETHICS, MANAGEMENT, AND ACCOUNTABILITY
PERFORMANCE REPORT CARD – GOAL EM
# Performance Indicator FY 2003 Actual
FY 2004 Actual
FY 2005 Actual
FY Actual 2006
FY 2006 Target
Met or Missed Notes
EM4.2 PHAs will submit accurate tenant characteristics data on 95 percent of the households in accordance with established time frames and 95 percent of the required financial statements on a timely basis.
Tenant Characteristics N/A N/A % 96.8% 95% met
Required financial statements % 90.6 95% missed
EM4.3
20%
A minimum of 20 percent of active Community Planning and Development (CPD) program grantees will be monitored on-site or remotely for compliance with statutory and regulatory requirements.
N/A N/A 21% 23% met
EM4.4 The share of HOME-assisted rental units for which occupancy information is reported shall be at least 90 percent.
90% 91% 92% 93% 90% met
EM4.5 The Departmental Enforcement Center (DEC) will increase the percentage of residents living in acceptable insured and/or assisted multifamily housing to at least 95 percent by taking aggressive civil or administrative enforcement actions. This will be accomplished by closing 87 percent of the physical referral cases in the DEC as of October 1, 2005, by September 30, 2006.
Residents living in acceptable insured and/or assisted multifamily housing. N/A N/A 96% 95% 95% met
Percent of physical referral cases closed. N/A N/A 85% 96.8% 87% met
EM4.6 Conduct 57 compliance reviews or formal Voluntary Compliance Agreement monitoring reviews exclusively and concurrently under Title VI and Section 109 and take appropriate corrective action.
50 93 69 71 57 met
EM4.7 Conduct monitoring and compliance reviews or provide technical assistance under Section 3 to 30 housing authorities and other recipients of HUD financial assistance.
46 66 22 50 30 met
EM4.9 Ensure appropriate use of funds among 100 percent of FHIP and FHAP grantees in compliance with cooperative and grant agreements.
N/A N/A 100% 100% 100% met
EM4.10 Ensure, through cross-program efforts, that training, employment and contracting opportunities are created at all Section 3-covered projects for qualifying low- and very-low-income residents.
N/A N/A 100% N/A Baseline
100% met h
EM5.1 HUD employees continue to become more satisfied with the Department’s performance and work environment.
N/A 12 1% N/A Increase met g
Notes: a Data not available. b No performance goal for this fiscal year. c Tracking indicator. d Third quarter of calendar year (last quarter of fiscal year; not
the entire fiscal year). e Calendar year beginning during the fiscal year shown. f Calendar year ending during the fiscal year shown.
g Result too complex to summarize. See indicator. h Baseline newly established. i Result is estimated. j Number is in thousands. k Number reported in millions. l Number reported in billions.
199

PERFORMANCE AND ACCOUNTABILITY REPORT
Objective EM1: Rebuild HUD’s human capital and further diversify its workforce. EM1.1: The Resource Estimation and Allocation Process/Total Estimation and Allocation Mechanism (REAP/TEAM)/Corrective Action Plan System will complete four milestones in support of strategic human capital management. Background. The Resource Estimation and Allocation Process/Total Estimation and Allocation Mechanism (REAP/TEAM) supports the Department’s effort to estimate, allocate, and validate resources for effective and efficient program administration and management of a workforce that is skilled, knowledgeable, diverse, and effectively meets the current and emerging needs of government and its citizens.
Developed in conjunction with the National Academy of Public Administration, the Resource Estimation and Allocation Process was first implemented by the Department in FY 2001. Together the methodology’s three components, resource estimation, resource allocation, and resource validation, are key tools in allocating staffing resources to improve performance, coordinate policy, performance, and staffing-related budget resources. Resource estimation studies were completed in 2001and updated in 2004, providing staffing baseline data and standards for budget formulation and execution, strategic planning, organization and management analyses and on-going management of staff resources.
HUD developed the Total Estimation and Allocation Mechanism as an automated information system that captures samples of actual workload accomplishments and employee time usage by HUD employees. Employees in Headquarters and field offices record how much time they spend working on the different activities and processes of their jobs during a randomly selected two-week period every quarter. Time and workload reporting enables the validation of the REAP baseline standards or requires their re-evaluation.
The Corrective Action Plan System is used as a means to collect payroll information by office in support of Departmental managerial cost accounting/activity based accounting.
This objective included four milestones, the fourth being added as a mid-year FY 2006 amendment in the FY 2007 Annual Performance Plan:
• Use TEAM data to support the FY 2007 Budget request;
• Conduct training in headquarters and the field on how to use the TEAM reports and the Allocation Module as management tools;
• Use TEAM in the program offices to assess human resource needs in hiring decisions during FY 2006; and
• Integrate the Corrective Action Plan System data into the Total Estimation and Allocation Mechanism reporting.
Results, impact, and analysis. Three of the four milestones were completed. The REAP/TEAM data was used as a key tool in developing and justifying Full Time Equivalent requirements in the FY 2007 Budget request, which was submitted on time to Congress in February 2006. The REAP analyses provided a baseline for estimating staffing requirements throughout the Department and was used throughout the year by managers to assess hiring plans
200

SECTION 2. PERFORMANCE INFORMATION EMBRACE HIGH STANDARDS OF ETHICS, MANAGEMENT, AND ACCOUNTABILITY
and make recommendations for approval or modification. Availability of the data allowed the Department to optimize its FTE usage. The Department was unable to conduct formal training during the year. However, Office of Budget staff conducted one-on-one training on an as needed basis. CAPS data was integrated into TEAM reports during the fourth quarter as a first step in relating costs to TEAM data at an activity level. The data provides management with another perspective in comparing productivity among field offices.
Reasons for shortfall/Performance improvement plans. The formal training planned for TEAM was not conducted due to funding constraints. The training is scheduled for FY 2007, pending the availability of funding.
Data discussion. Data in the two systems are maintained by the Office of the CFO’s Office of Budget. Total Estimation and Allocation Mechanism data are based on random sampling of time usage and actual workload accomplishments from all program areas. Supervisors validate employee data input. Data are maintained by fiscal year.
EM1.2: HUD will reduce skill gaps by 10 percent in its four core business program offices: Public and Indian Housing; Housing; Community Planning and Development; and Fair Housing and Equal Opportunity. Background. As part of HUD’s Strategic Plan and its Strategic Human Capital Management Plan, the Department has been developing a workforce plan for each program office to address mission critical skill gaps to ensure the necessary support of HUD’s program delivery. In FY 2005, HUD established a baseline of existing skill gaps in mission critical occupations for each of the four core program offices: Public and Indian Housing; Housing; Fair Housing and Equal Opportunity; and Community Planning and Development. In an effort to strengthen its human capital and maximize the limited resources available, for FY 2006, each core program office established a 10 percent reduction in mission critical competency gaps to be accomplished through a combination of training and recruitment. Reducing competency gaps within mission critical occupations will strengthen HUD’s human capital and better enable the Department to achieve its mission. Effective management of resources, both human and budgetary, supports the Departmental strategic goal of “Embracing high standards of ethics, management, and accountability.”
Program website: http://www.hud.gov/offices
Results, impact, and analysis. Data are not available to aggregate to the program office level, but the goals for skill gap initiatives targeted per the President’s Management Agenda were met. In June 2005, each of the four core program offices analyzed their mission critical occupations using the appropriate personnel data and respective Workforce Plans developed in cooperation with Logistics Management Incorporated. This data was used to identify the current/projected supply and demand of competency gaps for the mission critical occupations targeted by each office.
Each office used a combination of formal and informal training opportunities to address identified competency gaps. Housing developed and deployed a program to ensure that its Multi-Family/Single Family Appraisers received required job training for required certification. CPD reduced technical skill gaps through training on programs related to community development, grants management and tax incentives, Housing Opportunities for Persons with AIDS and Homeless Assistance. CPD employees played a major role in the Department’s response to the
201

PERFORMANCE AND ACCOUNTABILITY REPORT
Gulf Coast Hurricanes, and used this as an opportunity to provide on-the-job training on Federal Emergency Management Agency programs and the proper use of disaster assistance funds. CPD also addressed skill gaps by staffing 60 mission critical positions, including 4 CPD directors, 4 environmental protection specialists, 23 representatives and specialists, and 1 financial analysts. FHEO’s training of equal opportunity specialists has resulted in an increase in the quality of case file assembly and documentation and faster and more accurate determinations made of fair housing complaints. PIH targeted available resources towards training employees in specialized occupational series resulting in better acquisition management and stronger oversight of housing authorities. The following chart identifies the competencies targeted by each office and the percentage of gap reduction.
Program Office Occupational Series Competency Baseline Gap
(FTE)
Employees Trained
% Gap Closure
1101 Contract Specialist
Contract Management 11 11 100%
Knowledge of Real Estate Law, Leases, Local and State Laws
158 79 50%
Knowledge of Program Requirements and Compliance
129 65 50%
PIH 1101 Public Housing Revitalization Specialist
Knowledge of Government Systems and Processes
4 4 100%
Knowledge of Investigative Techniques & Procedures
84 63 75%
FHEO 360 Equal Opportunity Specialist
Skill in Application of Conciliation and Mediation Techniques
31 19 61%
Knowledge of federal programs related to community development
258 40 16%
Knowledge of issues and programs concerning persons with HIV/AIDS and Homeless
119 160 134% CPD 301 CPD
Specialist
Knowledge of grants management and tax incentive processes for competitions
60 70 117%
Real Estate Valuation, Finance, and Lending Practices
20 5 25%
Housing 1171 Appraisers Underwriting Procedures 20 5 25%
Data discussion. The data source for the reduction percentages was an analysis by the same managers who originally identified the gap in the workforce analysis studies for each of the four
202

SECTION 2. PERFORMANCE INFORMATION EMBRACE HIGH STANDARDS OF ETHICS, MANAGEMENT, AND ACCOUNTABILITY
core program offices. The data represent managers’ perceptions of their staff and may be limited by subjectivity. The data were developed at a strategic level based on the managers’ knowledge of the capability of existing staff assessments, program offices will utilize the methodology developed by the Workforce Planning Task Force. This committee was formed in September 2005 and was tasked by the Deputy Secretary to develop a comprehensive strategic workforce plan to guide the Department’s future human resource requirements.
EM1.3: Eighty percent of HUD interns are retained in mission-critical skill positions. Background. This indicator is directly linked to both the Department’s Strategic Plan and its Strategic Human Capital Management Plan, and is tied to the President’s Management Agenda. This indicator is a key component of an outcome measure of effective succession planning, which will ensure the Department’s employees have the skills and knowledge they need to achieve HUD’s mission and that institutional knowledge is sustained. The HUD Intern Program attracts exceptional individuals as a part of its succession planning efforts to recruit and train a talent pool of qualified professionals to fill mission-critical occupations for the Department’s future operations. The program offers interns professional experiences and formal training opportunities that are tailored to meet their educational and professional goals and interests, and to fill mission-critical skill gaps as senior HUD staff retire. Continued successful implementation of the Intern Program is crucial to maintain a constant flow of promising, talented individuals to support a productive workforce. The Department has priority interest in tracking the retention of all intern hires, because successful, long-term retention of employees from the intern programs will ensure a smooth transition from one generation of HUD employees to the next. The Intern Program includes: a) the Presidential Management Fellows (PMF) Program; b) the Federal Career Intern (FCI) Program; and c) the Legal Honors Intern Program (LHIP).
The FY 2007 Annual Performance Plan (see Appendix A) revised the FY 2006 indicator so that the measurement of intern retention is delayed until FY 2007, and during FY 2006 HUD’s goal was to recruit a substantial number of interns to fill mission critical positions and provide succession planning for the future of the Department.
Results, impact, and analysis. HUD successfully achieved its modified goal to recruit a substantial number of interns to fill mission critical positions and provide succession planning for the future of the Department. In FY 2006 HUD offices prioritized critical positions for Intern recruitment, with an emphasis on closing skill gaps and addressing projected staff losses from retirements. Of the 55 interns hired in FY 2006, 20 selections were made under the Presidential Management Fellow program, 25 under the Federal Career Intern program, and 10 under the Legal Honors Intern program. Interns that successfully complete their programs in FY 2008 will be placed in targeted mission-critical occupations identified by HUD offices using data from the Resource Estimation and Allocation Process and workforce analyses. Retention rates of the interns recruited in FY 2006 will be measured in FY 2007 and FY 2008.
Data discussion. The data were gathered through manual performance reports provided by HUD program offices and data from the National Finance Center. The Deputy Assistant Secretary for Human Resource Management, within the Office of Administration, closely administers the HUD Intern Program. Status reports on intern activities, training, mentoring, and
203

PERFORMANCE AND ACCOUNTABILITY REPORT
rotational assignments are received regularly from HUD program offices. The Training Services staff monitors the completion of individual development plans and is responsible for monitoring and measuring results against the intern program retention and performance goals.
Objective EM2: Improve HUD’s management, internal controls and systems, and resolve audit issues. EM2.1: FHA will continue to address financial management and system deficiencies through the phased implementation of an integrated financial system to better support FHA’s business needs, with full completion by December 2006. Background. The FHA Comptroller developed a Blueprint for Financial Management that provides for a phased implementation of an integrated core financial management system to address financial management and system deficiencies documented by HUD’s Inspector General, FHA and HUD financial statement auditors, OMB examiners, and GAO auditors.
The system will strengthen program controls and address material weaknesses and reportable conditions identified in FHA’s annual financial statement audits and reports to the Congress. The Blueprint for Financial Management also provides corrective action for 14 different FHA systems that were previously non-compliant with federal financial systems requirements.
The FHA Blueprint for an Integrated Financial Management System has the following key objectives:
• Implement the U.S. Government Standard General Ledger and credit reform accounts in the FHA general ledger;
• Implement automated funds control processes using the FHA general ledger;
• Automate FHA’s interface with HUD’s departmental general ledger;
• Produce FHA financial statements and regulatory reports directly from the FHA general ledger;
• Enhance FHA cash accounting and Treasury reconciliation with automated support from the integrated financial management system;
• Enhance FHA contract accounting with automated support from the integrated financial management system; and
• Eliminate manual accounting processes and improve integration of FHA financial and program systems, including daily or real-time funds control for insurance operations.
This systems project has a phased implementation. In Phase I, FHA identified its financial management requirements, defined and built translation software to produce financial transactions in a common format from 19 different automated sources, and acquired a new core financial system that is compliant with the Joint Management Improvement Program. In Phase II, FHA implemented its new financial software to perform central accounting functions of the FHA Comptroller’s office. Phase III, the complete integration of insurance operations with the new financial system, was expected to be completed by December 2006.
Program website: http://hudweb.hud.gov/po/h/fb/sled/mainindex.cfm
204
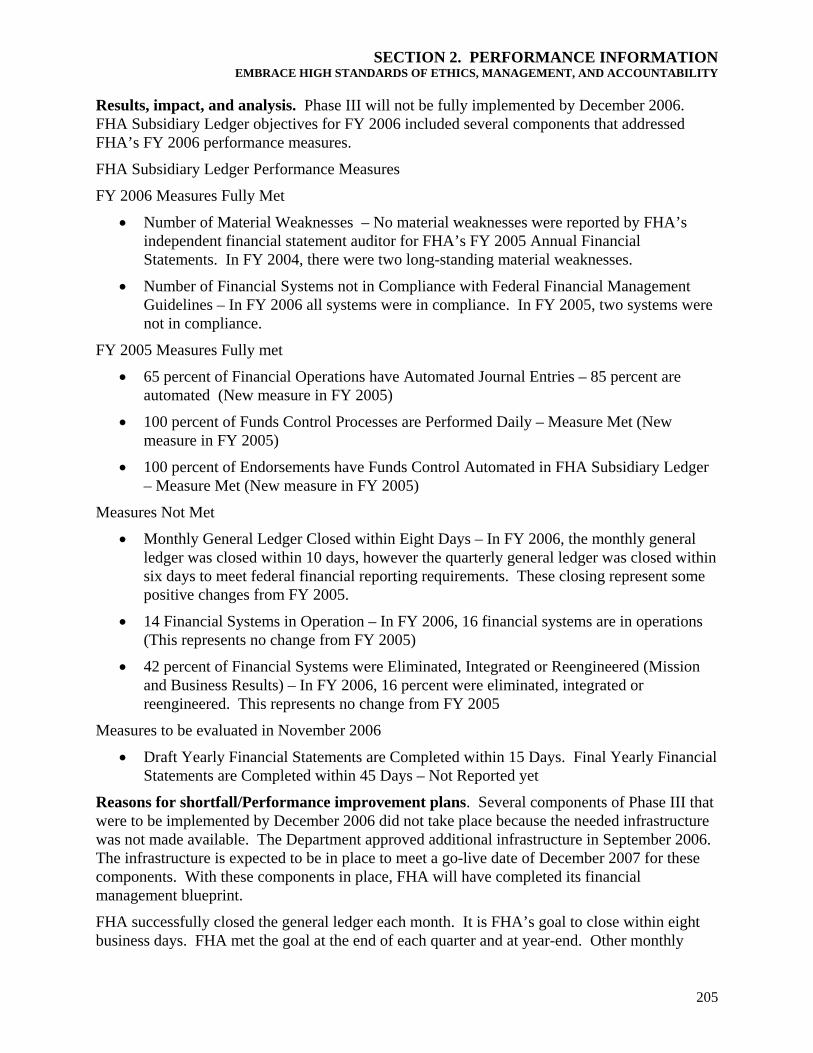
SECTION 2. PERFORMANCE INFORMATION EMBRACE HIGH STANDARDS OF ETHICS, MANAGEMENT, AND ACCOUNTABILITY
Results, impact, and analysis. Phase III will not be fully implemented by December 2006. FHA Subsidiary Ledger objectives for FY 2006 included several components that addressed FHA’s FY 2006 performance measures.
FHA Subsidiary Ledger Performance Measures
FY 2006 Measures Fully Met
• Number of Material Weaknesses – No material weaknesses were reported by FHA’s independent financial statement auditor for FHA’s FY 2005 Annual Financial Statements. In FY 2004, there were two long-standing material weaknesses.
• Number of Financial Systems not in Compliance with Federal Financial Management Guidelines – In FY 2006 all systems were in compliance. In FY 2005, two systems were not in compliance.
FY 2005 Measures Fully met
• 65 percent of Financial Operations have Automated Journal Entries – 85 percent are automated (New measure in FY 2005)
• 100 percent of Funds Control Processes are Performed Daily – Measure Met (New measure in FY 2005)
• 100 percent of Endorsements have Funds Control Automated in FHA Subsidiary Ledger – Measure Met (New measure in FY 2005)
Measures Not Met
• Monthly General Ledger Closed within Eight Days – In FY 2006, the monthly general ledger was closed within 10 days, however the quarterly general ledger was closed within six days to meet federal financial reporting requirements. These closing represent some positive changes from FY 2005.
• 14 Financial Systems in Operation – In FY 2006, 16 financial systems are in operations (This represents no change from FY 2005)
• 42 percent of Financial Systems were Eliminated, Integrated or Reengineered (Mission and Business Results) – In FY 2006, 16 percent were eliminated, integrated or reengineered. This represents no change from FY 2005
Measures to be evaluated in November 2006
• Draft Yearly Financial Statements are Completed within 15 Days. Final Yearly Financial Statements are Completed within 45 Days – Not Reported yet
Reasons for shortfall/Performance improvement plans. Several components of Phase III that were to be implemented by December 2006 did not take place because the needed infrastructure was not made available. The Department approved additional infrastructure in September 2006. The infrastructure is expected to be in place to meet a go-live date of December 2007 for these components. With these components in place, FHA will have completed its financial management blueprint.
FHA successfully closed the general ledger each month. It is FHA’s goal to close within eight business days. FHA met the goal at the end of each quarter and at year-end. Other monthly
205

PERFORMANCE AND ACCOUNTABILITY REPORT
closings were longer. FHA continues to strive to reach this goal through improved month-end processes. For each of the first three quarters of FY 2006, FHA prepared quarterly financial statements and submitted them to the CFO’s office within 15 days. The submission dates were as follows: 1st Quarter – January, 13, 2006, 2nd Quarter – April 14, 2006, 3rd Quarter – July 14, 2006.
Data discussion. Successful performance is assessed by HUD’s Inspector General and reported in the annual audit of FHA’s financial statements. The performance measures for the project are subject to independent assessment and depend on readily verifiable information such as number of findings (material weaknesses and other reportable conditions) eliminated from the auditor’s annual opinion and number of legacy systems replaced. FHA will identify new annual milestones in FY 2007 in anticipation of completing the Financial Management Blueprint.
EM2.2: HUD is proceeding with plans to eliminate non-compliant financial management systems. Background. The Federal Financial Management Improvement Act of 1996 requires federal agencies to implement and maintain financial management systems that comply with federal reporting requirements and accounting standards, and to support the U.S. Government Standard General Ledger at the transaction level. As such, all systems are subject to an annual review to ensure that all remain compliant. At the end of FY 2000, HUD had 67 financial management systems, of which 17 failed criteria for compliance with federal requirements. By the end of FY 2005, the total number of financial management systems dropped to 44, and the Department achieved a significant reduction in the number of non-compliant financial systems from 17 to 2. The two systems were the Loan Accounting System, and the Facilities Integrated Resources Management System, as described below.
Results/Impact and Analysis. The two systems reported as non-compliant at the end of FY 2005 are now substantially compliant with OMB Circular A-127 pending independent verification. Thus, the Department met its goal concerning the two non-compliant systems at the end of FY 2005. The specific actions taken for these two systems are described below. However, during mid-September of FY 2006, two additional systems were determined to be non-compliant based on independent compliance reviews. The Department is developing corrective action plans to address these non-compliant issues in FY 2007. This issue will be further addressed when the FY 2007 Annual Performance Plan is revised.
The Office of the CFO replaced the Loan
lf the
Y 2006.
ice
Accounting System with an A-127 compliant Commercial-Off-The-Shesystem. Implementation began during second quarter of FY 2006 and was completed during fourth quarter of F
In its 2005 Federal Managers’ Financial Integrity Act assurance statement, the Offof Administration reported the Facilities Integrated Resources Management Systemas non-compliant with Section 4 of the Act.While the Office of Administration had
HUD Financial Management Systems that are Non-Compliant with FFMIA
4
024
17
20
5
10
15
20
2002 2003 2004 2005 2006
Info
rmat
ion
Syst
ems
Information SystemsNewly Identified Noncompliant Systems
206

SECTION 2. PERFORMANCE INFORMATION EMBRACE HIGH STANDARDS OF ETHICS, MANAGEMENT, AND ACCOUNTABILITY
compensating controls to periodically reconcile the property inventory maintained in the systwith the various purchasing activities, they did not have adequate internal controls. During FY 2006, the Office of Administration took corrective actions to address systematic internal control deficiencies to better assure that the system maintains a current, accurate and compproperty inventory.
em
lete
At the end of FY 2006, HUD had 41 financial management systems. As a result of an independent review completed in FY 2006, two additional systems were identified as non-compliant. The two systems were the HUD Procurement System and the Small Purchase System. Action plans will be prepared by the Office of the Chief Procurement Officer to remedy the deficiencies noted during the compliance reviews.
The Office of the CFO is in the process of modernizing its financial management systems in accordance with a vision of financial management consistent with modern business practices, customer service, legislation and technology. The overall initiative to implement the financial management vision is the HUD Integrated Financial Management Improvement Project, an enterprise wide initiative that includes a core financial system that provides the major component of a comprehensive source of financial, budget and financial performance information to the Department. A modern and effective core financial system is key to the Department’s ability to obtain an unqualified audit opinion on HUD’s annual financial statements. The system, when implemented, will ensure full OMB compliance, correct identified weaknesses, strengthen financial system data integrity, and improve internal controls. The new system will also integrate/interface with other financial program systems that support the agency’s ability to manage funds and achieve program goals.
Data discussion. The Office of the CFO maintains the financial management systems inventory, with input from systems sponsors and cyclical compliance reviews of systems. The data are reliable for this measure. HUD performs financial management systems compliance reviews on a three-year cycle, or in conjunction with major systems changes, and the Office of the Inspector General also verifies compliance of HUD financial systems as part of its annual financial audit.
EM2.3: HUD financial statements receive unqualified audit opinions, and the preparation and audit of HUD’s financial statements is accelerated. Background. The Department introduced this indicator in order to continue its focus on improving and enhancing HUD’s financial stewardship. An unqualified audit opinion is a strong indicator to OMB, the Congress, and the public on the accuracy and completeness of HUD’s consolidated financial statements, the reliability of the underlying financial management systems and controls over financial reporting, and the strength of HUD’s financial management team. An independent financial statement audit is an important tool to instill confidence in HUD’s financial operations and reporting for the Department’s external stakeholders. Establishing and maintaining this trust requires a long-term commitment to financial integrity, including progress toward eliminating any material internal control weaknesses and reportable conditions identified in the financial statement audit.
HUD received an unqualified audit opinion for six consecutive fiscal years (2000-2005) – an indicator of financial management discipline and stability. HUD’s FY 2006 goals were to: prepare and issue its audited FY 2006 consolidated financial statements by the 45-day deadline of November 15, 2006, with an unqualified audit opinion; continue corrective actions to reduce
207

PERFORMANCE AND ACCOUNTABILITY REPORT
the number of material weakness and reportable condition issues; and continue to meet OMB goals for the preparation of quarterly financial statements within 21 days after the end of the quarter.
Program Website: http://www.hud.gov/offices/cfo/
Results/Impact and Analysis. HUD met its goal of receiving an unqualified audit opinion on its FY 2006 financial statements within 45 days after the end of the fiscal year. The Department has received an unqualified opinion for seven consecutive fiscal years. In addition, all existing material weaknesses have been corrected and for the first time ever, HUD has “no” auditor-reported material weakness issues.
During FY 2006, HUD also continued to meet its goal for accelerating the production of the quarterly financial statements to within 21 days after the end of the quarter, and continued to provide timely financial data for managers to use in making program decisions. HUD will continue to produce the annual and quarterly financial statements within the specified accelerated time frames, and take corrective action to strengthen internal controls to eliminate the six reportable conditions disclosed in the OIG audit of HUD’s FY 2006 consolidated financial statements.
Data discussion. The OIG, along with contracted personnel under their direction, conducts the annual financial statement audit. This audit examines the adequacy of HUD’s financial management systems, the effectiveness of internal controls over financial reporting, and compliance with laws and regulations that could have a material effect on the financial statements. The OIG also identifies material weaknesses and reportable conditions, if applicable, and recommends appropriate corrective actions. OIG audits are independent of HUD management, are performed in accordance with GAO auditing standards, and adhere to the OMB and other guidelines and standards governing the preparation and audit of agency financial statements.
EM2.4: Ensure timely management decisions and final action on audit recommendations by the HUD Office of Inspector General. Background. The annual financial audit conducted by the HUD OIG results in a significant number of recommendations involving recovery of disallowed and questioned costs, opportunities for better use of funds, and improvements to management controls to reduce the risk of fraud, waste and abuse, and improve program performance. The Inspector General Act of 1978, as amended, establishes requirements for the timely resolution and reporting on OIG audit recommendations by agency managers. By statute, agency managers have six months from the date of issuance of an audit report to reach acceptable management decisions with OIG on all audit recommendations. HUD’s goal is to reach acceptable management decisions on 99 percent of OIG audit recommendations within six months of the release of the audit report. This reflects a change from the FY 2006 Annual Performance Plan that stated a goal of 100 percent. This change is intended to ensure that all management decisions reached are sound and represent the best course of action within realistic timeframes.
Additionally, as part of an approved management decision on an audit recommendation, a target date is established for completing final action on that recommendation. Since FY 2004, HUD has tracked the status of these actions and set a goal to reduce the number of outstanding actions by 50 percent per year. The FY 2006 goal for OIG audit recommendations more than 12 months
208

SECTION 2. PERFORMANCE INFORMATION EMBRACE HIGH STANDARDS OF ETHICS, MANAGEMENT, AND ACCOUNTABILITY
overdue was 17, based on a 50 percent reduction from the ending balance of 35 such recommendations at the end of FY 2005.
Results, impact, and analysis. HUD successfully exceeded its timely management decision goal, achieving a decision on 99.76 percent of audit recommendations (860 o862 management decisions were timely). Additionally, of the 35 outstanding action items at the end of FY 2005, HUD ended FY 2006 with just seven audit recommendations more than 12 months overdue; successfully reducing the FY 2005 ending inventory by 28. The FY 2006 goal was to reduce the ending inventory to 17 outstanding audit recommendations. At September 30, 2006, the inventory of action items was seven.
f
In FY 2006, HUD’s goal was to complete the following additional actions:
• Exercise emergency relocation procedures and deploy the Continuity of Operations Program Emergency Relocation Group for at least 10 percent of the offices.
Results, impact, and analysis. In FY 2006, HUD successfully achieved this goal by completing the following actions:
Final Actions on O I GAudit Recommendations that are
Overdue More than 1 2 Months
7
3533
120
170
100
200
2003 2004 2005 2006
activ
e au
dit
reco
mm
enda
tions
overdue recom m endationsoutput goal
Data discussion. HUD’s Audit Resolution and Corrective Action Tracking System is the data source for this indicator. The FY 2006 data are final results and reliable for these measures. The HUD OIG and the Departmental Audit Liaison in the Office of the CFO reconcile and confirm the accuracy of the data.
EM2.5: HUD will conduct training on and exercise the Continuity of Operations Plan. Background. Federal policy requires federal agencies to have a Continuity of Operations plan in place to continue essential functions during a natural disaster or severe emergency situation that renders headquarters building(s) unusable (e.g., hurricanes, bomb threats, acts of terrorism).19 Continuity of Operations planning is a “good business practice” and part of HUD’s fundamental mission as a responsible and reliable public institution.
• Perform quarterly notification testing of all office Continuity of Operations Program notification procedures, and achieve a 95 percent success rate;
• Conduct annual training of the Headquarters Continuity of Operations Program Emergency Initial Relocation Group members, and achieve an 80 percent level for participation; and
• Performed quarterly notification testing of all Headquarters’ office Continuity of Operations Program notification procedures, and achieved a 95 percent success rate;
19 See Presidential Decision Directive 67, dated October 21, 1998, and Federal Preparedness Circular 65.
209

PERFORMANCE AND ACCOUNTABILITY REPORT
• Conducted an annual relocation exercise (Forward Challenge 06) of the Headquarters Continuity of Operations Program Emergency Relocation Group members, and achieved 100 percent level of participation;
• Conducted annual emergency relocation exercises at 52 of the 79 Regions and field offices with Continuity of Operations Program Plans (or 66% of the offices);
Additional FY 2006 accomplishments include:
• Conducted annual Continuity of Operations Program refresher training in Chicago, Illinois with over 100 participants from Headquarters, regions and field offices;
• Conducted two interagency communications exercises (Title Globe) featuring HUD and two non-aligned federal agencies;
• Achieved a milestone of 600 users for the Government Emergency Telecommunication Service cards; and
• Achieved a milestone of over 400 users for the HUD Incident Management System communication device.
In FY 2007, HUD will conduct quarterly emergency notification cascade tests. In addition, HUD will exercise emergency relocation procedures and deploy a team to the Headquarters Emergency Relocation Site for an exercise in May 2007. HUD will implement a comprehensive Contingency Planning Program, and integrate an alternate Emergency Relocation Site in Herndon, Virginia into the Headquarters Continuity of Operations Program Plan.
The impact and results of the tests, training, and exercises are to maintain a state of readiness in the event of a real disaster or emergency situation. Through regular testing and evaluating of the procedures, a level of alert is maintained.
Data discussion. The Office of Security and Emergency Planning maintains a database to document the mandatory reporting of the results of testing and relocation activations. These activities are conducted in accordance with the HUD Continuity of Operations Program Test, Training, and Exercise Plan. HUD maintains a comprehensive Test, Training, and Exercise file with information by office that quarterly emergency notification cascades and annual relocation exercises have been conducted. The information is self-reported by the Headquarters, regions, and field offices, and reviewed by the office heads to ensure accuracy. The data are reliable for this measure. However, the quality of training cannot be judged from the quantitative data. The Office of Security and Emergency Planning will perform an initial evaluation of data quality. GAO and/or the Office of Inspector General will perform independent assessments and validation.
EM2.6: The Accelerated Claim and Asset Disposition demonstration program (Section 601) will exceed the rate of net recovery received through the conveyance program on the sale of Single Family assets. Background. This indicator maximizes the return on sales of real estate assets to the government. Section 601 of the FY 1999 Appropriations Act amended Section 204 of the National Housing Act to provide HUD with greater flexibility for modifying the single family claim and asset disposition process. HUD is conducting a demonstration program to reform the single family claim and asset disposition process, maximizing recoveries on claims paid, and
210

SECTION 2. PERFORMANCE INFORMATION EMBRACE HIGH STANDARDS OF ETHICS, MANAGEMENT, AND ACCOUNTABILITY
support for the Department’s outcome goal of homeownership retention. The legislation enables HUD/FHA to: (1) pay claims upon assignment of mortgages rather than upon conveyance of the properties; (2) take assignment of notes and transfer them to private parties for servicing, foreclosure avoidance, foreclosure, property management and asset disposition; and (3) participate as an equity partner with private entities in asset disposition. FHA has the opportunity to execute various asset disposition strategies as part of the Accelerated Claim and Asset Disposition demonstration, including special servicing, securitizations, whole loan sales, and a combination of whole loan/pipeline sales.
The overall goal of the Accelerated Claim and Asset Disposition demonstration program is to ensure the FHA’s public policy issues are addressed while expediting the disposition of defaulted FHA single family assets and maximizing the return to FHA Insurance Funds. The first demonstration initiative was a sealed bid auction held in October 2002. Claims were paid beginning October 31, 2002. Three subsequent auctions were held September 2003, June 2004, and May 2005. This indicator tracks the rate of recovery on claims under the Section 601 demonstration program against the recovery rate received on the sale of Single Family assets through the conveyance program (sale of real-estate-owned properties).
The FY 2007 Annual Performance Plan (see Appendix A) reworded the FY 2006 indicator to capture the program’s focus on flexible disposition.
Results, impact, and analysis. The average net recovery rate for the Section 601 demonstration program during FY 2006 was 76 percent of unpaid principal balance, exceeding the Conveyance Recovery rate of 68 percent, thus exceeding the goal. An average of 73.8 percent of unpaid principal balance has been achieved across the life of the Demonstration. As the Accelerated Claim and Asset Disposition Demonstration matures and final disposition outcomes are made, the Department anticipates that recoveries from the program will continue to exceed Conveyance Recoveries of 68 percent. Section 601 recoveries as of August 31, 2006, for the four Single Family Sales Initiatives are shown below. The recovery rates reported in the FY 2005 PAR change as the loans continue to re-perform and are disposed out of the Joint Ventures. There were no sales or auctions under the Accelerated Claim and Asset Disposition Demonstration (Section 601) in FY 2006, though monthly settlements did occur for the first nine months of the fiscal year. The Department plans to schedule an Accelerated Claim and Asset Disposition Demonstration (Section 601) sale for FY 2007.
Single Family Note Sales Recoveries Adjusted for Claim Cost as of 8/31/2006
Single Family - Sale I 2002 (assets sold in FY 2003) 70%
Single Family - Sale II 2003 (assets sold in FY 2003) 73%
Single Family - Sale III 2004 (assets sold in FY 2004) 78%
Single Family - Sale IV 2005 (assets sold in FY 2005) 76%
Data discussion. The data source is the Single Family Insurance System – Claims Subsystem, which provides the acquisition cost data for this indicator. FHA’s Single Family Acquired Asset Management System provides the expense detail for the conveyance program (Claims subsystem “type 1” transfer claims) rate of net recovery. FHA’s Subsidiary Ledger provides the Accelerated Claim and Asset Disposition recovery rate on sale of assets (Claims subsystem “type
211

PERFORMANCE AND ACCOUNTABILITY REPORT
2” claims) through its PeopleSoft financial program. For convenience, all data are reported from FHA’s Single Family Housing Enterprise Data Warehouse.
EM2.7: HUD will institutionalize the Capability Maturity Model practices on information technology projects by the end of FY 2006. Background. During FY 2006, HUD built upon the work previously performed under the Software Acquisition-Capability Maturity Model. Additional projects were trained to practice the model at level 2. The Software Acquisition-Capability Maturity Model Level 2 (repeatable) maturity is primarily focused on projects. At this level, repeatable software acquisition project management is established, software acquisition project management processes are documented and followed, organizational policies guide the projects in establishing management processes, and successful practices developed on earlier projects can be repeated.
HUD successfully implemented practices toward achieving a Level 2 designation for six additional systems, and continued to assist projects at Level 2 to advance to Level 3. Successful government and industry organizations involved in software development have adopted proven practices to reduce risk in their software development. HUD has adopted the Carnegie Mellon Capability Maturity Model as a practice to enforce repeatable, defined, optimized and performance measured processes to sustain a successful risk free software development effort. Between FY 2004 and FY 2006, HUD has continued to improve on its adoption of this model and has used third party assessments such as Carnegie Mellon assessors and the GAO auditors to verify the benefits of the adoption. Achieving Capability Maturity Model Level 2 has the outcome of producing information technology savings for the Department by having HUD’s contractors be able to perform work according to defined business practices that are repeatable and translate into high degree of competence. Contractors are certified as having achieved this capability.
By the end of FY 2006, HUD’s goal was to institutionalize the Capability Maturity Model practices on information technology projects. In addition, HUD will assist projects that have implemented Software Acquisition-Capability Maturity Model Level 2 practices toward achieving Level 3 maturity (standard, consistent processes).
Results, impact, and analysis. The Department did achieve the goal of institutionalizing the Capability Maturity Model practices using the existing Carnegie Mellon Capability Maturity Model. This institutionalized practice resulted in 80 percent of all major projects meeting a level 2 or higher CMM guideline.
Data discussion. The Software Acquisition-Capability Maturity Model developed by the Software Engineering Institute for the Army, endorsed by the Government Accountability Office and used by most executive agencies, has sunset. In 2006 the Software Engineering Institute stopped supporting the model and the attendant certifications and assessments needed to continue the practice. HUD and other federal Agencies have established a steering group, which is soliciting the Software Engineering Institute to continue the Software Acquisition Practice. HUD expects a new practice to be promulgated into the CMM-I model by the Software Institute in fiscal year 2007. HUD will review the practice once released and assess adopting the practice again. In the mean time, HUD is increasing the number of contractors certified in the CMM-I performing software development on major projects.
212

SECTION 2. PERFORMANCE INFORMATION EMBRACE HIGH STANDARDS OF ETHICS, MANAGEMENT, AND ACCOUNTABILITY
EM2.8: HUD will achieve Information Technology Investment Management Maturity Stage 4 by the end of 2006. Background. A mature information technology management framework improves the selection and management of HUD’s information technology portfolio by addressing business strategies and workforce needs. It allows HUD to establish controls over investments in order to minimize project failure or excessive cost and schedule overruns; i.e., a mature process will reduce project cost overruns, schedule slippages, and unproductive systems.
The Clinger-Cohen Act requires federal agencies to implement a capital planning and investment control process as the foundation for information technology investment management. HUD follows the Government Accountability Office Information Technology Investment Management Maturity Framework, which consists of five levels of maturity: Stage 1 – Creating investment awareness; Stage 2 – Building an investment foundation; Stage 3 – Developing a complete investment portfolio; Stage 4 – Improving the investment process; and Stage 5 – Leveraging information technology for strategic outcomes.
Achieving Stage 4 by the end of calendar year 2006 requires HUD to define, implement, and conduct the following activities concurrently with the activities for Stages 1, 2, and 3:
• Portfolio Performance Evaluation and Improvement. Comprehensive information technology portfolio performance measurement data are defined and collected using agreed-upon methods. Aggregate performance data and trends are analyzed, and investment practices are developed and implemented.
• Systems and Technology Succession Management. Information technology investments are periodically analyzed for succession and appropriate investments are identified as succession candidates. Interdependency of each investment with other investments in the information technology portfolio is analyzed, and the information technology investment review board makes a succession decision for each candidate information technology investment.
Program website: http://hudweb.hud.gov/po/i/cap/process.cfm
Results, impact, and analysis. In FY 2006 HUD obligated over $303 million on an information technology portfolio of approximately 120 individual projects, which primarily involved maintaining legacy systems and modifications. These systems have been designed, developed, and managed such that HUD is able to timely address changing business needs, emerging departmental requirements (e.g., legislation, regulations, guidance, court orders), and project performance considerations.
In the fall of 2005, HUD did an assessment on its IT Investment Management (ITIM) process against the GAO’s IT Investment Management Maturity Framework, version 1.1 (March 2004). As a result of this assessment HUD was rated at Stage 3. In addition to fulfilling requirements for Stage 3, some key practice areas also met Stages 4 and 5 requirements. The Department is making substantial progress toward achieving the Stage 4 goal targeted for the end of calendar year 2006. This effort will need to be evaluated by outside contractors and will be fully reported on in the FY 2007 Performance and Accountability Report. Over the course of the past year, HUD has continued making strides in strengthening its ITIM processes. Additional maturity was achieved in the areas of succession planning and performance measurement. By applying EA’s
213

PERFORMANCE AND ACCOUNTABILITY REPORT
Strategic Portfolio Review (SPR) recommendations (to the OMB Exhibit 300s) and adhering to the EA Transition Plan (IT Master Schedule), HUD is working at migrating to the EA Target Architecture. To improve the portfolio’s performance, HUD is associating the modernization (Vision 2010) milestones of the EA Transition Plan (IT Master Schedule) with the initiative level performance metrics.
Reasons for shortfall/Performance improvement plans. With the release of GAO’s new ITIM Maturity Framework V1.1, HUD had to reassess, determine, and strengthen ITIM’s maturity level. Currently it is at stage 3. Over the next year, HUD plans to continue to work in progressing toward achieving stage 4 by improving the portfolio performance and maturing the management of the succession of their IT systems. This maturing involves work to implement the EA Transition Plan (IT Master Schedule), aligning succession and system retirements along with modernization goals with initiative level performance metrics. HUD will also follow-up with an independent evaluation of its achievements.
Data discussion. The independent assessment was conducted in fall of 2005 by an outside consultant (Sevatec, Inc.) using the Government Accountability Office (GAO) ITIM Maturity Framework, version 1.1, March 2004). The assessment included the review of HUD’s current Information Technology Investment Management policies, procedures and practices; interviews with key HUD stakeholders; and analysis of historical documents and data.
A previous independent assessment was conducted by an outside consultant (Synthesis Technologies, Inc.) using the 2000 version of the GAO Information Technology Investment Management Maturity Framework from September through mid-December 2003. An additional independent assessment is scheduled for 2007.
EM2.9: HUD will complete the Enterprise Target Architecture by the end of fiscal year 2006. Background. In 2000, HUD established an enterprise target architecture program to promote sound business and information technology decisions through comprehensive understanding of HUD’s complex computing environment. The primary purpose of enterprise target architecture is to inform, guide, and govern the decisions at the enterprise level; especially those related to information technology investments. The enterprise target architecture describes the current and planned design of the Department’s business, information and technology. With enterprise target architecture, HUD identifies its needs and defines the technology needed to support those needs. Across the Department, enterprise target architecture: (1) illustrates the implications of business and information technology decisions; (2) ensures the acquiring technologies adequately support business and information needs; (3) facilitates information sharing among the program offices; (4) promotes a reduction in duplicative system functionality; and (5) highlights opportunities for building greater flexibility into applications.
Before a new application is developed, the enterprise architecture practice helps determine if a similar application already exists which may meet some or all of the identified business needs.
Program website: http://www.hud.gov/offices/cio/ea/newea/index.cfm
Results, impact, and analysis. The Department met the goal of completing the Enterprise Target Architecture. The work done in FY 2006 extends and compliments the achievement in FY 2005. HUD’s EA practice developed performance architecture for major business and IT
214

SECTION 2. PERFORMANCE INFORMATION EMBRACE HIGH STANDARDS OF ETHICS, MANAGEMENT, AND ACCOUNTABILITY
modernization initiatives, and updated technical architecture through the development and approval of enterprise-wide technology standards. In addition, business offices continued development and integration of segment architecture for HUD’s lines of business, business functions and IT services, e.g. Multi-family Housing Finance, Financial Management, and Enterprise Document and Records Management.
The EA Practice is already paying dividends by revealing gaps in performance and identifying opportunities to guide strategic decision-making in IT. Under this initiative, analyses are being conducted that identify opportunities to consolidate systems, eliminate redundant and obsolete systems, and leverage new technologies. For example, HUD’s recently implemented Correspondence Tracking System (CTS) offers a secure web-based solution to fulfill correspondence retrieval, tracking, processing, and reporting and archiving requirements. CTS improves HUD’s correspondence management and Freedom of Information Act (FOIA) business processes, and reduces manual and paper-intensive activities by providing a browser-based user interface, electronic folders, flexible workflows and other innovative features available in enterprise information management systems. CTS provides a single-source for correspondence management services and will allow the Department to retire its legacy Automated Correspondence On-Line Response Network System (ACORN), Correspondence Management System (CMS) and FOIA Management System (FMS).
Through the EA Practice, HUD is pursuing additional cross-program and enterprise-wide initiatives in a strategic, methodical manner to allow the Department to better meet its mission and goals. These cross-program and enterprise-wide investments are resulting in: 1) streamlined operations; 2) standardized applications; 3) upgraded functionality; 4) greater flexibility; and 5) significant cost savings.
Following recent independent assessments, HUD’s EA program was placed in the top four of Federal EA programs by the Office of Management and Budget and in the top two by the Government Accountability Office (GAO). In FY 2007, HUD will continue to develop and maintain its enterprise architecture and support the execution of an enterprise-wide plan to improve the efficiency and effectiveness of business processes and information management.
Data discussion. Enterprise architecture activities are included in HUD’s Information Technology Strategic Plan for FY 2005 – FY 2010. Status reports provide accurate tracking information on planned activities. Program managers regularly review the status reports to ensure that planned actions occur. Additionally, these activities are reported in the PMA. HUD’s Chief Architect regularly reviews the PMA status reports to ensure that planned actions occur and are reported in the PMA process.
215

PERFORMANCE AND ACCOUNTABILITY REPORT
EM2.10: HUD will meet information technology–related security requirements as follows:
• Continue the Certification and Accreditation effort to ensure that 100 percent of major applications documented in the Inventory of Automated Systems have been certified and accredited;
• Prioritize and remedy high-priority risks; and
• Ensure 90 percent of HUD employees and contractors will have completed IT Security and Awareness Training.
Background. The Federal Information Security Management Act establishes certification and accreditation as the government’s primary risk management process. The Act stipulates that each agency information technology system classified as a major application or general support system will undergo certification testing to assess the adequacy of its security controls and will be accredited by a senior agency management official prior to operation. Currently, HUD has designated in its Inventory of Automated Systems seven general support systems, and 146 major applications systems, all of which are in operation and required to be certified and accredited.
In FY 2006, the Information Technology Security Office set out to continue to reduce risks and vulnerabilities and protect HUD’s information systems and resources from unauthorized access, use, and modification. This goal includes the following:
• One-hundred percent remediation of high criticality security weaknesses to support full authorization to operate;
•
• Integration of computer security requirements into HUD’s software development lifecycle model;
• Complete an updated Plan Of Action and Milestones and all reports required by the Federal Information Security Management Act;
• Conduct annual technical computer vulnerability assessments through independent penetration tests; and
Promote enterprise-wide security awareness training through outreach; computer-based training, and multi-media based training.
Program website: http://hudweb.hud.gov/po/i/it/security/secure.cfm
Results, impact, and analysis. The Department made continued significant progress in this priority area and met all but one of its planned activities. In the target area that was missed, the Department still achieved notable progress. Specifically:
• Accomplished one-hundred percent certification and accreditation of all HUD general support systems and major applications;
• Closely coordinated with program offices, system owners, and project managers to integrate computer security requirements into HUD’s software development lifecycle model;
• Reduced reported weaknesses to approximately 49 percent. HUD began the reporting cycle with 4,331 weaknesses reported via the Plan Of Action and Milestones process.
216

SECTION 2. PERFORMANCE INFORMATION EMBRACE HIGH STANDARDS OF ETHICS, MANAGEMENT, AND ACCOUNTABILITY
During the year that count was reduced each quarter, with the total Plan Of Action and Milestones weaknesses at the end of the fourth quarter counted at 2,131. The 51 percent reduction in reported weaknesses is a significant achievement given limitations of staff resources as well as other limiting factors. This effort focused on key problem areas and, therefore, the results will accomplish significant improvements in information technology security for the Department.
• Conducted annual technical computer vulnerability assessments through independent penetration tests, and monthly vulnerability scanning of perimeter security devices; and
• Promoted enterprise-wide security awareness training through outreach, computer-based training, and multi-media. Over 98 percent of HUD computer users completed automated security awareness training, and over 97 percent of HUD employees and contractors completed specialized training in information technology security appropriate to their duty positions.
Reasons for shortfall/Performance improvement plans. The Department did not meet its planned activity of a one hundred percent remediation of high criticality security weaknesses, which is still underway due to delays in implementing necessary controls.
Data discussion. Weaknesses identified through the certification and accreditation process and the status of corrective actions are tracked on a quarterly basis by the Office of Information Technology Security staff in coordination with system owners. If weaknesses are identified, staff will develop corrective action plans with program offices.
EM2.11: The share of completed CDBG activities for which grantees satisfactorily report accomplishments increases to 94 percent. Background. HUD did not originally include an indicator for this program because no funding was requested for FY 2006. The Congress did appropriate funding for the program and therefore HUD amended the FY 2006 Annual Performance Plan to reflect this action.
This indicator tracks the level of reporting of accomplishments for CDBG activities in the Integrated Disbursement and Information System. Grantees use the system to report to HUD on their use of CDBG and other CPD formula program funds (i.e., HOME Investment Partnerships, Emergency Shelter Grants, and Housing Opportunities for People with AIDS). This indicator is important because it reflects a benchmark of the overall quality of the information grantees report, and this data is used to determine whether the performance goals established by HUD in its Annual Performance Plan for the CDBG program have been met.
Program website: http://www.hud.gov/offices/cpd/communitydevelopment/programs/
Results, impact, and analysis. In FY 2006, grantees reported accomplishments for 96.2 percent of completed activities in the Integrated Disbursement and Information System, thereby exceeding the FY 2006 goal of 94 percent. This outcome is relatively consistent with the FY 2005 accomplishment reporting level of 97.3 percent for completed activities.
Data discussion. An independent assessment in 2003 showed that the Integrated Disbursement and Information System performance indicator data passed 4-sigma quality tests (99.379% correct) for validity, completeness, and consistency. The improvement in the reporting of accomplishments for completed CDBG activities is primarily a result of HUD’s ongoing data
217

PERFORMANCE AND ACCOUNTABILITY REPORT
clean-up efforts, as well as edits added to the Integrated Disbursement and Information System that provide greater consistency in reporting and require grantees to enter certain accomplishment data prior to reporting an activity as completed. HUD continues to look for additional improvements that can be made to the Integrated Disbursement and Information System to improve data quality and consistency, as well as the ease of entering data. For FY 2007, the requirement for grantees to implement new performance measurement requirements and enter related data into the Integrated Disbursement and Information System should provide a richer and more complete data set for HUD’s analysis of the CDBG program.
EM2.12: The Chief Information Officer will perform data quality assessments of data used by HUD’s major systems to report on six Annual Performance Plan performance indicators not previously assessed. Background. The Office of the Chief Information Officer partnered with the Office of the Chief Financial Officer and program offices in FY 2000 to launch the Data Quality Improvement Program, an enterprise-wide initiative that is ensuring accurate, complete, consistent, timely and valid data across HUD. HUD is aligning data management priorities with the Department’s mission and program office objectives, resulting in streamlined data management functions across the enterprise. This initiative is enabling the Department, in program areas and in information technology service areas, to develop reliable and useful information systems efficiently and effectively in less time and at a reduced cost.
HUD employs a three-step process to ensure the quality of Annual Performance Plan performance indicator data in its information technology systems: independent assessment, data quality cleanup (scrap and rework) or data quality improvement (defect prevention), and certification. All HUD systems used to support Annual Performance Plan reporting are included in the independent assessment process performed by the Office of the Chief Information Officer. Cleanup recommendations are made to systems owners who are accountable for the data quality cleanup and improvement efforts necessary to correct identified deficiencies and ensure ongoing data quality. As soon as identified data quality corrections and improvements are in place, the system becomes eligible for independent certification by the Office of the Chief Information Officer. The certification process repeats the analyses employed in the assessment to verify that intended improvements have been made and are working as expected.
In the past, the Data Quality Improvement Program has been system-focused with 3 sigma (66,807 errors per million) as the data quality standard and 6 sigma (3.4 errors per million) as the long-range target. The program this year changes from a series of system-focused assessment efforts to a “performance indicator-focused” program, with 4 sigma (6,210 errors per million) as the single, unified data quality standard. Seven different conditions or “triggers” can be met to initiate a data quality assessment of the data underlying the performance indicator, which can include a single HUD system or a number of systems (databases of origin). Using these triggers, the analysis of the FY 2006 Annual Performance Plan revealed 28 performance indicators that have not yet been assessed, as well as two performance indicators that had been assessed but are below 4 sigma and need to be reevaluated. The Data Quality Improvement Program’s two-year plan going forward is to assess all 30 of these performance indicators, achieving six in FY 2006 and half (15) of these during FY 2007.
Program website: http://hudatwork.hud.gov/po/i/edm/resources/resources.cfm
218
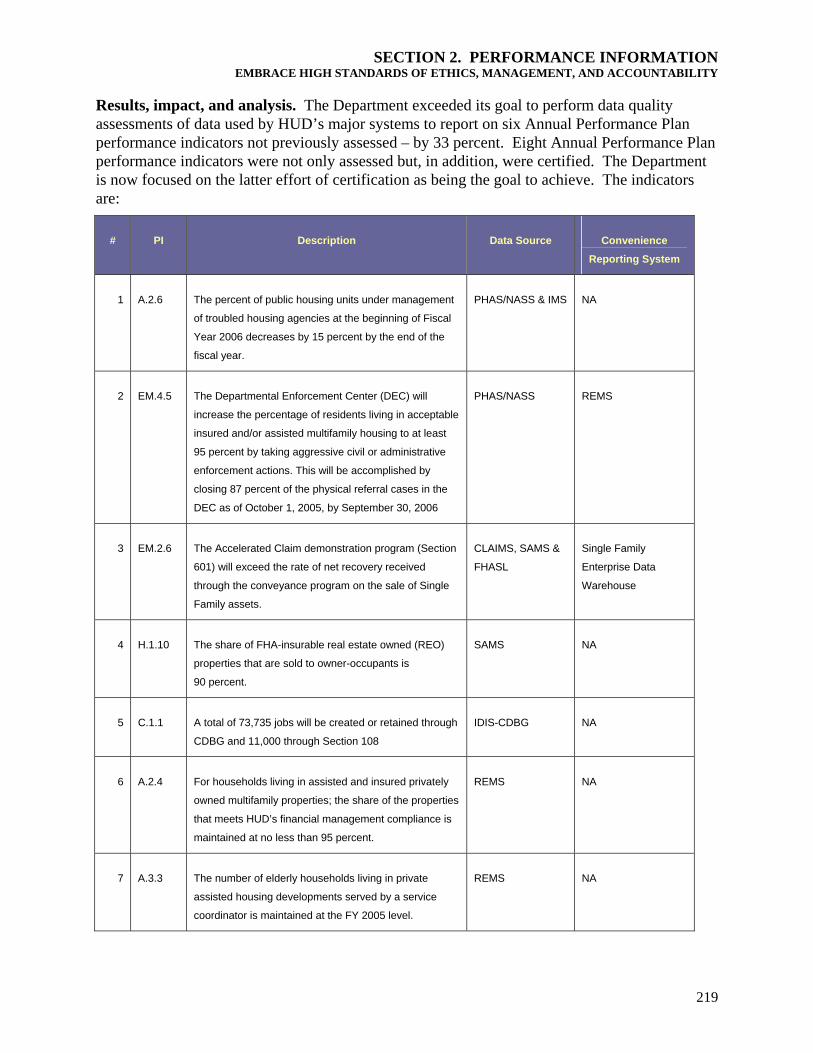
SECTION 2. PERFORMANCE INFORMATION EMBRACE HIGH STANDARDS OF ETHICS, MANAGEMENT, AND ACCOUNTABILITY
Results, impact, and analysis. The Department exceeded its goal to perform data quality assessments of data used by HUD’s major systems to report on six Annual Performance Plan performance indicators not previously assessed – by 33 percent. Eight Annual Performance Plan performance indicators were not only assessed but, in addition, were certified. The Department is now focused on the latter effort of certification as being the goal to achieve. The indicators are:
# PI Description Data Source Convenience
Reporting System
1 A.2.6 The percent of public housing units under management
of troubled housing agencies at the beginning of Fiscal
Year 2006 decreases by 15 percent by the end of the
fiscal year.
PHAS/NASS & IMS NA
2 EM.4.5 The Departmental Enforcement Center (DEC) will
increase the percentage of residents living in acceptable
insured and/or assisted multifamily housing to at least
95 percent by taking aggressive civil or administrative
enforcement actions. This will be accomplished by
closing 87 percent of the physical referral cases in the
DEC as of October 1, 2005, by September 30, 2006
PHAS/NASS REMS
3 EM.2.6 The Accelerated Claim demonstration program (Section
601) will exceed the rate of net recovery received
through the conveyance program on the sale of Single
Family assets.
CLAIMS, SAMS &
FHASL
Single Family
Enterprise Data
Warehouse
4 H.1.10 The share of FHA-insurable real estate owned (REO)
properties that are sold to owner-occupants is
90 percent.
SAMS NA
5 C.1.1 A total of 73,735 jobs will be created or retained through
CDBG and 11,000 through Section 108
IDIS-CDBG NA
6 A.2.4 For households living in assisted and insured privately
owned multifamily properties; the share of the properties
that meets HUD’s financial management compliance is
maintained at no less than 95 percent.
REMS NA
7 A.3.3 The number of elderly households living in private
assisted housing developments served by a service
coordinator is maintained at the FY 2005 level.
REMS NA
219

PERFORMANCE AND ACCOUNTABILITY REPORT
# PI Description Data Source Convenience
Reporting System
8 C.2.3 The share of multifamily properties in underserved
areas insured by FHA is maintained at 25 percent of
initial endorsements.
REMS NA
Data discussion. During fiscal year 2006, the Enterprise Data Management Group transitioned from an assessment-focused team to a certification-focused team. In this role, the group evaluated the new performance indicators and ensured that the supporting systems are certified at HUD’s quality standard.
Results of the data quality assessment and certification efforts are maintained in an Office of Chief Financial Officer’s administrative repository under configuration control. The data source under this indicator is classified as a “manual record-keeping” or paper-based system. System certification is based on verified conformance of critical data elements with applicable business rules for each program. The Office of Chief Financial Officer assessment reports identify the objective criteria for evaluating data quality and the results of the assessment. Some data systems are independently validated by the Government Accountability Office and the Office of Inspector General Audits.
Based on lessons learned during earlier assessments, the OCIO believes that 4 sigma standard is more appropriate, because it will not be feasible in all cases to design the system edits that would enable quickly achieving 6 sigma (reflecting fewer than 3.4 errors per million) data quality. The OCIO has recommended that HUD’s target data quality standard be revised to 4 sigma (99.379% correct).
Objective EM3: Improve accountability, service delivery, and customer service of HUD and its partners. EM3.1: HUD partners become more satisfied with the Department’s performance, operations, and programs. Background. HUD partners are critical to the Department’s overall performance. These partners, which include government, nonprofit, and for-profit entities, provide service delivery for a majority of HUD programs. Increasing their satisfaction with HUD makes them more willing to support HUD and achieve common objectives. During FY 2001, the Office of Policy Development and Research surveyed eight partner groups to assess partner satisfaction with the Department and perceptions of management changes at HUD. The partner groups included community development directors, PHA directors, Fair Housing Assistance Program directors, mayors, multifamily owners, and nonprofit providers. Overall satisfaction by partners varied greatly, with mayors and Fair Housing Assistance Program directors highly satisfied, and PHA directors and multifamily owners less satisfied. The Department’s goal is to observe an increase in satisfaction among partner groups when the 2001 baseline study is replicated.
Results, impact, and analysis. The Office of Policy Development and Research conducted a second stakeholder survey during FY 2005. The overall response rate of 73 percent is
220
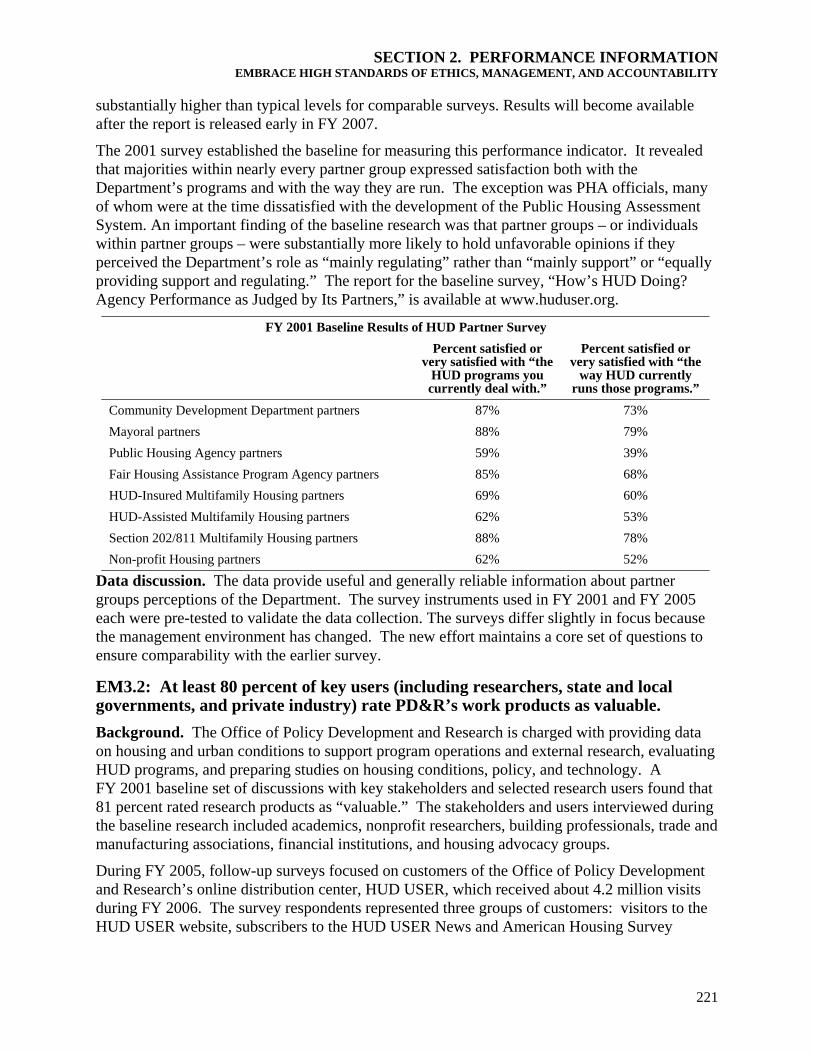
SECTION 2. PERFORMANCE INFORMATION EMBRACE HIGH STANDARDS OF ETHICS, MANAGEMENT, AND ACCOUNTABILITY
substantially higher than typical levels for comparable surveys. Results will become available after the report is released early in FY 2007.
The 2001 survey established the baseline for measuring this performance indicator. It revealed that majorities within nearly every partner group expressed satisfaction both with the Department’s programs and with the way they are run. The exception was PHA officials, many of whom were at the time dissatisfied with the development of the Public Housing Assessment System. An important finding of the baseline research was that partner groups – or individuals within partner groups – were substantially more likely to hold unfavorable opinions if they perceived the Department’s role as “mainly regulating” rather than “mainly support” or “equally providing support and regulating.” The report for the baseline survey, “How’s HUD Doing? Agency Performance as Judged by Its Partners,” is available at www.huduser.org.
FY 2001 Baseline Results of HUD Partner Survey Percent satisfied or
very satisfied with “the HUD programs you currently deal with.”
Percent satisfied or very satisfied with “the
way HUD currently runs those programs.”
Community Development Department partners 87% 73% Mayoral partners 88% 79% Public Housing Agency partners 59% 39% Fair Housing Assistance Program Agency partners 85% 68% HUD-Insured Multifamily Housing partners 69% 60% HUD-Assisted Multifamily Housing partners 62% 53% Section 202/811 Multifamily Housing partners 88% 78% Non-profit Housing partners 62% 52%
Data discussion. The data provide useful and generally reliable information about partner groups perceptions of the Department. The survey instruments used in FY 2001 and FY 2005 each were pre-tested to validate the data collection. The surveys differ slightly in focus because the management environment has changed. The new effort maintains a core set of questions to ensure comparability with the earlier survey.
EM3.2: At least 80 percent of key users (including researchers, state and local governments, and private industry) rate PD&R’s work products as valuable. Background. The Office of Policy Development and Research is charged with providing data on housing and urban conditions to support program operations and external research, evaluating HUD programs, and preparing studies on housing conditions, policy, and technology. A FY 2001 baseline set of discussions with key stakeholders and selected research users found that 81 percent rated research products as “valuable.” The stakeholders and users interviewed during the baseline research included academics, nonprofit researchers, building professionals, trade and manufacturing associations, financial institutions, and housing advocacy groups.
During FY 2005, follow-up surveys focused on customers of the Office of Policy Development and Research’s online distribution center, HUD USER, which received about 4.2 million visits during FY 2006. The survey respondents represented three groups of customers: visitors to the HUD USER website, subscribers to the HUD USER News and American Housing Survey
221

PERFORMANCE AND ACCOUNTABILITY REPORT
listservs, and users of the Regulatory Barriers Clearinghouse listserv and website. Listserv customers generally may be considered key users.
Program website: www.huduser.org
Results, impact, and analysis. Among the FY 2005 survey respondents, 87 percent were highly satisfied or moderately satisfied with the quality of the information available on HUD USER, exceeding the goal of 80 percent finding the information “valuable.” This highly-structured survey of a sample of PD&R customers shows a sustained high level of satisfaction. Satisfaction with the quality of information was even higher among the key users of the listserv groups, reaching 94 percent. Regarding the HUD USER website itself, 84 percent of respondents expressed satisfaction. Sixty percent of these users typically use the information for research. Overall website satisfaction was higher among the key users, reaching 92 percent among News and American Housing Survey listserv respondents and 93 percent among Regulatory Barriers Clearinghouse respondents. The final report, “Assessment of the Office of Policy Development and Research Website,” is available at the link above. Other input showing high levels of satisfaction was obtained in 2001 through informal discussions with a group of key users.
During FY 2006, the Office of Policy Development and Research developed and fully implemented a plan to further strengthen HUD USER operations by addressing research findings and suggestions from the FY 2005 survey respondents. Completed actions included launching a new Verity search engine, clarifying site organization and content with new users in mind, and improving the downloading and ordering processes. These improvements likely contributed to the substantial increase in products downloaded from HUD USER during FY 2006 (see indicator EM.3.3).
The Office of Policy Development and Research’s commitment to meeting the nation’s housing and community development research needs includes finding ways to increase the usefulness of its products and serve a broader audience. To that end, the Office recently contracted with the National Academy of Sciences to evaluate independently its research agenda and operations. The Academy’s evaluation is expected to be completed during FY 2008.
Data discussion. This indicator is measured using periodic customer surveys. The FY 2005 data consist of 10,795 valid responses to the website survey and 1,832 valid responses to the listserv surveys (995 for News and American Housing Survey listservs and 837 for the Regulatory Barriers Clearinghouse listserv). All users between October 7 and December 10, 2004, were asked to participate. To boost the rate of response to the survey, respondents were offered research publications valued at up to $10. An analysis conducted to validate the sample revealed no significant differences between respondents and non-respondents, nor between visitors during the survey period and the rest of the year.
EM3.3: More than 6 million files related to housing and community development topics will be downloaded from the Office of Policy Development and Research’s website. Background. In 1978, the Office of Policy Development and Research established HUD USER, an information resource for housing and community development researchers and policymakers. HUD USER, providing over 1,000 publications and datasets, is one of the principal sources for federal government reports and information on housing policy and programs, building
222
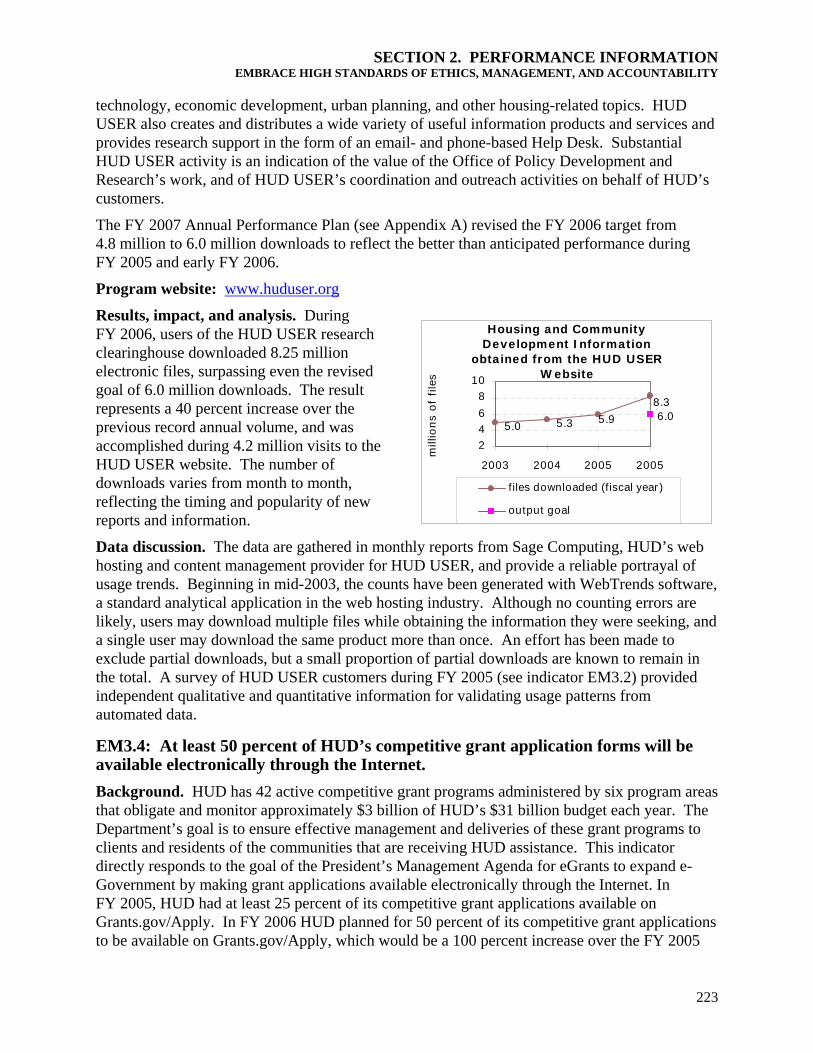
SECTION 2. PERFORMANCE INFORMATION EMBRACE HIGH STANDARDS OF ETHICS, MANAGEMENT, AND ACCOUNTABILITY
technology, economic development, urban planning, and other housing-related topics. HUD USER also creates and distributes a wide variety of useful information products and services and provides research support in the form of an email- and phone-based Help Desk. Substantial HUD USER activity is an indication of the value of the Office of Policy Development and Research’s work, and of HUD USER’s coordination and outreach activities on behalf of HUD’s customers.
The FY 2007 Annual Performance Plan (see Appendix A) revised the FY 2006 target from 4.8 million to 6.0 million downloads to reflect the better than anticipated performance during FY 2005 and early FY 2006.
Program website: www.huduser.org
Results, impact, and analysis. During FY 2006, users of the HUD USER research clearinghouse downloaded 8.25 million electronic files, surpassing even the revised goal of 6.0 million downloads. The result represents a 40 percent increase over the previous record annual volume, and was accomplished during 4.2 million visits to the HUD USER website. The number of downloads varies from month to month, reflecting the timing and popularity of new reports and information.
Data discussion. The data are gathered in monthly reports from Sage Computing, HUD’s web hosting and content management provider for HUD USER, and provide a reliable portrayal of usage trends. Beginning in mid-2003, the counts have been generated with WebTrends software, a standard analytical application in the web hosting industry. Although no counting errors are likely, users may download multiple files while obtaining the information they were seeking, and a single user may download the same product more than once. An effort has been made to exclude partial downloads, but a small proportion of partial downloads are known to remain in the total. A survey of HUD USER customers during FY 2005 (see indicator EM3.2) provided independent qualitative and quantitative information for validating usage patterns from automated data.
EM3.4: At least 50 percent of HUD’s competitive grant application forms will be available electronically through the Internet. Background. HUD has 42 active competitive grant programs administered by six program areas that obligate and monitor approximately $3 billion of HUD’s $31 billion budget each year. The Department’s goal is to ensure effective management and deliveries of these grant programs to clients and residents of the communities that are receiving HUD assistance. This indicator directly responds to the goal of the President’s Management Agenda for eGrants to expand e-Government by making grant applications available electronically through the Internet. In FY 2005, HUD had at least 25 percent of its competitive grant applications available on Grants.gov/Apply. In FY 2006 HUD planned for 50 percent of its competitive grant applications to be available on Grants.gov/Apply, which would be a 100 percent increase over the FY 2005
Housing and Community Development I nformation
obtained from the HUD USER W ebsite
5.95.35.0
8.36.0
2468
10
2003 2004 2005 2005
mill
ions
of
files
f iles downloaded (f iscal year )
output goal
223

PERFORMANCE AND ACCOUNTABILITY REPORT
baseline. This goal measures grantees’ submission of electronic applications via the Grants.gov portal that provides a single point of entry for grant application submissions to the Department.
Program website: www.hud.gov/grants
Results, impact, and analysis. HUD exceeded its goal by ensuring that 41 out of 41 (or 100 percent) of its applicable competitive grant applications are available in electronic format. All competitive grant opportunities, except the Continuum of Care, were posted as electronic application packages at Grants.gov/Apply. The Continuum of Care was exempted because Grants.gov did not have a solution for posting collaborative application packages in FY 2006. In FY 2004, HUD received 100 percent of its competitive funding applications as paper submissions. HUD is providing time and costs saving to the grantees because they do not have to copy and ship multiple applications to HUD Headquarters and field offices.
Data discussion. Office of Departmental Grants Management and Oversight monitors the number of applications made available on Grants.gov/Apply.
EM3.5: The share of FHA mortgage insurance applications initially rejected for improper use of Social Security Numbers is limited to 0.5 percent of submitted applications. The FY 2007 Annual Performance Plan (see Appendix A) deleted the FY 2006 performance indicator due to FHA’s inability to control the number of attempts to use a false Social Security Number for mortgage insurance applications. The Social Security Number validation measures adopted by FHA were designed to reduce identity theft and Social Security Number fraud on mortgage loans that FHA actually endorses rather than reducing or limiting the number of attempts to use false Social Security Numbers.
EM4.1: The high incidence of program errors and improper payments in HUD’s rental housing assistance programs will be reduced. Background. The Improper Payments Information Act of 2002 requires federal agencies to assess improper payment risks and to measure and report on programs and activities that may be susceptible to improper payments totaling in excess of $10 million annually. HUD has addressed eliminating improper payments in its Strategic Plan and Annual Performance Plan. President Bush furthered deemed that, because of the significance of this issue, it should be included as an initiative on the President’s Management Agenda for HUD. As a result of its efforts, HUD is recognized as a federal government leader in reducing improper payments and was the first agency to receive a score of “Green” from OMB on this scorecard item.
Objective EM4: Ensure program compliance.
The rental housing assistance programs (public housing, Housing Choice Vouchers, and project-based assistance programs) constitute HUD’s largest appropriated activity, with $27 billion in annual expenditures. There are three major sources of error in these complex programs:
• Program administrator error: the program administrator’s failure to properly apply income exclusions and deductions and correctly determine income, rent, and subsidy levels;
• Tenant income reporting: the tenant beneficiary’s failure to properly disclose all income sources; and
224

SECTION 2. PERFORMANCE INFORMATION EMBRACE HIGH STANDARDS OF ETHICS, MANAGEMENT, AND ACCOUNTABILITY
• Billing error: errors in the billing and payment of subsidies between third party program administrators and HUD.
HUD’s milestones and actions related to eliminating improper payments are described in detail in Section 4, Other Accompanying Information, of this document. Additionally, in the Section 1 Management Discussion and Analysis, Eliminating Improper Payments is addressed in the President’s Management Agenda section.
In conjunction with OMB, HUD established a goal in FY 2000 for a 50 percent reduction in both the frequency of errors and the $2 billion in net annual overpayments by FY 2005. HUD was also required to annually set goals and report on its progress in reducing gross improper payment levels as a percentage of total program payments. HUD has set aggressive goals and, for FY 2005, the goal for improper payments as a percent of all payments was established at 5.6 percent and for FY 2006 the goal is 5 percent. For reporting purposes, there is a one-year lag in reporting the results of this goal.
Results, impact, and analysis. HUD has surpassed its FY 2005 goal for a 50 percent reduction in net subsidy overpayments with a 69 percent reduction from FY 2000 through FY 2005. HUD also reduced gross improper payments by 60 percent during the same period. In addition, HUD reduced improper payments as a percent of all rental assistance payments to 5.4 percent in FY 2005, exceeding the goal of 5.6 percent. The following table summarizes the reductions in improper payments attributable to program administrator and tenant income-reporting errors based on the FY 2000, FY 2003, FY 2004 and FY 2005 studies:
______________________________________________________________________________
Reductions in Improper Payments Due to Program Administrator and Tenant Income Reporting Errors
(Dollars in billions) Period Percent
of Cases In Error
Over Payments*
Under Payments*
Net Over Payments*
Gross Improper Payments*
2000 60 $2.594 $0.622 $1.972 $3.216
2003 41 $1.087 $0.519 $0.568 $1.606
2004 34 $0.947 $0.306 $0.641 $1.253
2005 37 $0.943 $0.341 $0.602 $1.284
Reduction from 2000 to 2005
23 $1.651 $0.281 $1.370 $1.932
% Reduction from 2000 to 2005
38 64 45 69 60
The reductions from the FY 2000 baseline estimate in program administrator errors resulted from HUD’s efforts to work with its housing industry partners at PHAs and multifamily housing projects through enhanced program guidance, training, oversight, and enforcement. The reduction of erroneous payments due to tenant under-reporting of income is attributable to:
225

PERFORMANCE AND ACCOUNTABILITY REPORT
• Improved income verification efforts by housing program administrators
• Increased voluntary compliance by tenants due to promotion of the issue
• HUD’s initiation of improved computer matching process for upfront verification of tenant income, and
• Improved methodology for reviewing income discrepancies identified through computer matching to better determine actual cases of underreported income impacting subsidy levels.
HUD updated the FY 2003 baseline studies for the third error component, billing error, in FY 2006. Billing errors are discrepancies between the proper subsidy level (based on the actual rent charges) and the amount that HUD is actually billed. The following estimates pertain to FY 2004 and FY 2005 activity:
Results of Billing Error Studies (Year Studied)
Program Subsidies Overpaid* Subsidies Underpaid* Gross Billing Error*
Public Housing (2004)
$35 $14 $49
Section 8 Vouchers (2004)
$50 $22 $72
Project-based Assistance (2005)
$24 $35 $59
Total All Programs $109 $71 $180
* Dollars in millions
HUD’s increased review of program payment vouchers and on-site monitoring of support for these vouchers will lead to reductions in these estimates.
Data discussion. Periodic error measurement studies directed by the Office of Policy Development and Research provide the basis for measuring this indicator. The data are reliable for this measure, assuming availability of funding to cover the cost of the study. The HUD OIG reviews the error measurement methodology and support, as well as management controls over the related program activity, as part of its annual audit of HUD’s financial statements. Both overpayments and underpayments of subsidies adversely affect intended program beneficiaries, since a subsidy overpayment means that less assistance is available for other eligible families and a subsidy underpayment means that a family in need is paying more rent than they should.
EM4.2: PHAs will submit accurate tenant characteristics data on 95 percent of the households in accordance with established time frames and 95 percent of the financial reports. Background. Accurate and timely information about the households participating in HUD’s housing programs are necessary to allow HUD to monitor the effectiveness of the programs, assess agency compliance with regulations, and analyze the impacts of proposed program changes. Several outcome indicators in this Performance and Accountability Report use data about public housing or voucher households that housing agencies submit via the Inventory Management System. This system provides the primary source of data on participation in
226
SECTION 2. PERFORMANCE INFORMATION EMBRACE HIGH STANDARDS OF ETHICS, MANAGEMENT, AND ACCOUNTABILITY
HUD’s public housing and voucher programs, and the HUD field staff uses the data to monitor housing agencies. In addition, the level of reporting is a criterion for various program policies for public housing and voucher initiatives, including the Section Eight Management Assessment Program assessment systems for PHAs. The timely filing of financial statements, required by HUD policies, provides oversight of the financial health of HUD’s program participants to insure that HUD resources are being effectively used. Accordingly, HUD measures the timely submission of these reports. The rates are based on data PHAs submitted to the Inventory Management System through August 31, 2006.
Results/ Impact and analysis. HUD successfully achieved half of this goal with a combined 96.8 percent national tenant characteristics reporting rate (96% for public housing and 97% for the Housing Choice Voucher program). However, HUD missed the goal for financial statements with a combined 90.6 percent reporting rate (87.8% for PHAs administering only Housing Choice Voucher programs and 99% for all other PHAs).
Reasons for shortfall/Performance improvement plans. The only reason HUD did not fully achieve this goal was because 87.8 percent of PHAs that administer only the Housing Choice Voucher program submitted their financial statement on time – 12.2 percent were late. Reporting rates for PHAs that administer Public Housing and Housing Choice Voucher programs have always been excellent because there is an incentive for timely submission: failure to do so adversely affects their overall scoring, which in turn increases regulatory scrutiny. Until recently, no such incentive existed for Housing Choice voucher-only PHAs. However, the Department issued a notice near the end of FY 2006 that stipulates a 10 percent reduction in a PHA’s administrative subsidy for every month that the PHA is late in submitting their financial statement. This sanction will significantly improve reporting rates for any PHA that administers the Housing Choice Voucher program. This improvement will be reflected in the FY 2007 Performance and Accountability Report.
Data discussion. Reporting rates are determined from the standard reports that use the Inventory Management System. Late reporting is identified by automated reports that specify late re-certifications for each housing agency and flag poor reporters. The identification of housing agencies that report poorly is straightforward and easily verifiable. The module verifies the quality of tenant data by performing checks on data ranges and internal consistency. An independent assessment in 2004 showed that Inventory Management System data passed 3-sigma quality tests (reflecting 66,800 defects per million) for validity, completeness, and consistency. In addition, the tenant data and summary statistics are available electronically to housing agencies and field offices for verification, validation, analysis, and monitoring purposes. For financial statements, data are tracked by the Financial Assessment Subsystem.
EM4.3: A minimum of 20 percent of active Community Planning and Development (CPD) program grantees will be monitored on-site or remotely for compliance with statutory and regulatory requirements. Background. CPD grantees are recipients of formula and competitive grants designed to assist communities to build viable neighborhoods, expand homeownership and affordable housing, and provide economic opportunities. Specific goals and beneficiaries are identified for consolidated plans and competitive grant applications.
227

PERFORMANCE AND ACCOUNTABILITY REPORT
This indicator tracks the extent of monitoring activity by HUD field staff to ensure that grantees are appropriately carrying out HUD CPD programs, helping low- and moderate-income families and developing distressed neighborhoods. HUD monitors both active formula and competitive CPD program grantees for compliance. Grantees are monitored on-site and remotely.
Results, impact, and analysis. Community Planning and Development field staff monitored 1,011 grantees, or 23 percent of 4,378 active grantees exceeding the 20 percent target. Grantees are assessed for risk on an annual basis using CPD’s Risk Analysis Notice. Field offices use the results of the risk analysis to identify grantees targeted for monitoring during the fiscal year. Monitoring conforms to both sound quality assurance practices and risk-based principles that focus on weak performers.
Data discussion. CPD field offices report how many grantees were monitored in the Department’s internal tracking system, HUD Integrated Performance Reporting System. Monitoring activities are carried out in compliance with guidelines established in the HUD Monitoring Desk Guide (Training Edition), and CPD Monitoring Handbook. Field supervisors review monitoring activity and reporting by field staff.
EM4.4: The share of HOME-assisted rental units for which occupancy information is reported shall be at least 90 percent. Background. This indicator tracks the reporting by HOME Investment Partnerships program participating jurisdictions into HUD’s Integrated Disbursement and Information System of data describing the households that occupy the assisted rental units. This information helps HUD assess compliance with the HOME Investment Partnerships program-assisted tenant income limits, as well as determine who is benefiting from the program.
Program website: http://www.hud.gov/offices/cpd/affordablehousing/programs/home/index.cfm
Results, impact, and analysis. During FY 2006, 93 percent of rental units had occupancy information reported in the Integrated Disbursement and Information System. This is a one percent increase over the FY 2005 level of 92 percent, and met the FY 2006 goal for maintaining the percentage of rental units for which occupancy information is reported at a minimum of 90 percent.
HUD relies on HOME participating jurisdictions to enter data into the Integrated Disbursement and Information System. HUD will continue to use ongoing data clean-up, intensive follow-up with participating jurisdictions, and the individualized PJ HOME performance “SNAPSHOTs” and “Dashboards” discussed under indicator A1.3 to monitor and improve grantee accountability, and to encourage more complete data entry.
HOME- assisted Rental Units w ith Occupancy I nformation Reported
90%
93%
91% 92% 90%
60%
80%
100%
2003 2004 2005 2006perc
ent
of r
enta
l uni
ts
units with occupancy repor tedoutput goal
Data discussion. Data entered by participating jurisdictions in HUD’s Integrated Disbursement and Information System are used to track performance. Future annual performance plans will continue to track the share of HOME-assisted rental units for which occupancy information is
228

SECTION 2. PERFORMANCE INFORMATION EMBRACE HIGH STANDARDS OF ETHICS, MANAGEMENT, AND ACCOUNTABILITY
reported. CPD field staff verifies program data when monitoring grantees, and grantee reports are subject to independent audits.
An independent assessment was conducted of the data elements for this performance indicator based on the known Validity and Completeness constraints (all elements). All elements scored above 4 sigma (reflecting fewer than 6,210 errors per million) for all quality characteristics assessed – i.e., validity, completeness, and consistency. (Tests conducted 5/28/03).
EM4.5: The Departmental Enforcement Center will maintain the percentage of residents living in acceptable insured and/or assisted multifamily housing to at least 95 percent by taking aggressive civil or administrative enforcement actions. This will be accomplished by closing 87 percent of the physical referral cases in the Departmental Enforcement Center as of October 2005 by September 30, 2006.
Results, impact, and analysis. For FY 2006, the goal of the Departmental Enforcement Center was to maintain the percentage of residents living in acceptable insured and/or assisted multifamily housing at no less than 95 percent by closing 87 percent of the physical referral cases in the inventory as of October 1, 2005. The first measure in the indicator, physical quality, was attained by achieving a 95 percent rate for the properties inspected and essentially meeting the goal based on number of units. The number of residents closely tracks these two measures, and the Department is measuring properties to be consistent with indicator A2.2. The second goal was exceeded. The Departmental Enforcement Center closed 152 of the 157 physical referral cases in its inventory, for a closure rate of 96.8 percent. During FY 2005 the closure rate was 89.5. This represents an increase in the closure rate over of 7.3 percent over last fiscal year.
Background. The Office of General Counsel’s Departmental Enforcement Center has primary responsibility for ensuring that troubled multifamily properties return to full compliance. The Departmental Enforcement Center protects the public interest by excluding sanctioned individuals/entities from participating in government programs nationwide. The efforts of the Departmental Enforcement Center improve the physical condition of the FHA insured housing stock and reduce the regional inventory of troubled properties.
In some instances, the Departmental Enforcement Center recovers significant financial losses. Both the Office of Multifamily Housing and the Real Estate Assessment Center refer troubled properties to the Departmental Enforcement Center. The Real Estate Assessment Center assesses the management risk of multifamily projects based on physical and financial factors. Physically troubled projects typically involve high capital needs backlogs, and deferred or inadequate maintenance. Financially troubled projects can involve mortgage defaults, high vacancy rates, inadequate rent roll, excessive expenses, or fraud in the form of equity skimming.
The Departmental Enforcement Center works closely with the Office of Housing and other HUD program areas to determine appropriate remedies for referrals. Remedies can include the issuance of sanction notices for debarment or suspension. The Departmental Enforcement Center also refers some civil cases to the Department of Justice and criminal matters to the Office of the Inspector General.
Data discussion. The Real Estate Management System draws data from the integrated Assessment Subsystem. The Departmental Enforcement Center Management System produces management reports from the data drawn by the Real Estate Management System. No data problems affect the reliability of this indicator. An independent assessment in 2002 showed that
229

PERFORMANCE AND ACCOUNTABILITY REPORT
the integrated Assessment Subsystem performance indicator data passed 4-sigma quality tests (6,210 errors per million) for validity, completeness, and consistency.
EM4.6: Conduct 57 compliance reviews or formal Voluntary Compliance Agreement monitoring reviews exclusively and concurrently under Title VI and Section 109 and take appropriate corrective action. Background. The Office of Fair Housing and Equal Opportunity reviews PHAs, providers of HUD-assisted housing, and other HUD recipients to determine whether their programs and activities comply with Title VI of the Civil Rights Act of 1964 and Section 109 of Title I of the Housing and Community Development Act of 1974. HUD outlays over $45 billion annually on housing and community development programs. This indicator highlights the Department’s commitment to ensuring fair housing compliance in programs directed by HUD.
Title VI prohibits discrimination on the basis of race, color, or national origin in programs or activities receiving federal financial assistance. Section 109 prohibits discrimination on the basis of race, color, national origin, religion, or sex in any program or activity funded by the Community Development Block Grant program. HUD completes a compliance review by issuing a letter of finding, containing the findings of fact, a finding of compliance or noncompliance, and a description of an appropriate remedy for each violation identified, if any.
The FY 2007 Annual Performance Plan (see Appendix A) adjusted the FY 2006 indicator to place emphasis on HUD’s monitoring of voluntary compliance agreements. This effort ensures immediate remedy of any violations.
Program website: http://www.hud.gov/offices/fheo/index.cfm
Results, impact, and analysis. During FY 2006, HUD issued letters of findings in 11 Section 109 compliance reviews and 60 Title VI compliance reviews, exceeding the annual target by 25 percent. This outcome represents an improvement over last fiscal year despite limited staffing and other resources. In FY 2005, HUD issued letters of findings in 11 Section 109 compliance reviews and 58 Title VI compliance reviews. The Department will continue to review its programs and activities to ensure that they are administered in a non-discriminatory manner.
Data discussion. The data are maintained in the Title Eight Automated Paperless Office Tracking System and HUD’s Integrated Performance Reporting System. The databases count the number of compliance and monitoring reviews conducted. HUD managers provide quality assurance by reviewing the results on an intermittent basis.
EM4.7: Conduct monitoring and compliance reviews or provide technical assistance under Section 3 to 30 housing authorities and other recipients of HUD financial assistance. Background. Section 3 of the Housing and Urban Development Act of 1968 requires that the employment and other economic opportunities generated by federal financial assistance for housing and community development programs shall, to the greatest extent feasible, be directed toward low- and very low-income persons, particularly those who are housing assistance recipients. The Section 3 Program promotes local economic improvement, job training and opportunities, as well as individual self-sufficiency.
230

SECTION 2. PERFORMANCE INFORMATION EMBRACE HIGH STANDARDS OF ETHICS, MANAGEMENT, AND ACCOUNTABILITY
Recipients of funds covered by the law are required to report the number of Section 3 residents receiving employment, training, and contract opportunities each year. HUD provides PHAs and other recipients of HUD federal assistance with technical assistance in implementing methods for achieving the employment, contracting, and other economic objectives of Section 3 and conducts compliance reviews to determine the extent to which they have met these objectives. During FY 2005, HUD conducted 22 monitoring/compliance reviews and technical assistance visits of housing authorities or other recipients of HUD financial assistance.
Program website: http://www.hud.gov/offices/fheo/section3/section3.cfm
Results, impact, and analysis. In FY 2006, the Office of Fair Housing and Equal Opportunity built on the effective activities of previous years and successfully met the goal of conducting monitoring/compliance reviews and technical assistance visits of housing authorities and recipients of HUD financial assistance. During FY 2006, HUD conducted 50 monitoring/compliance reviews and technical assistance, exceeding its annual target of 30 by 67 percent.
HUD examines employment and contract records for evidence of actions taken to train and employ Section 3 residents and to award contracts to Section 3 businesses. The Office of Fair Housing and Equal Opportunity issued 45 monitoring reports that contain findings of compliance or non-compliance and describe recommendations for any identified Section 3 violations. In addition, the office addressed a variety of audiences, conducted workshops, and participated in panel discussions. During these events, staff answered questions and distributed information about the Section 3 Program. The Office of Fair Housing and Equal Opportunity will continue to ensure that recipients of HUD funds are providing more training, employment, and contracting opportunities for low-income and very low-income persons.
Data discussion. Data for this indicator were submitted by each recipient to HUD as a means of reporting on their Section 3 activities during the reviews. On-site or remote monitoring activities and compliance reviews were conducted in compliance with guidelines established in the HUD Section 3 Monitoring Guide. Headquarters supervisors review monitoring activity and reporting by staff. Accomplishments are reported in HUD’s Integrated Performance Reporting System.
EM4.8: Increase the percentage of Section 3 complaints closed in 100 days to 75 percent. The FY 2007 Annual Performance Plan (see Appendix A) deleted the FY 2006 indicator due to the low volume of complaints in the open inventory.
EM4.9: Ensure appropriate use of funds among 100 percent of Fair Housing Initiatives Program and Fair Housing Assistance Program grantees in compliance with cooperative and grant agreements. Background. Agencies funded through the Fair Housing Initiative Program and the Fair Housing Assistance Program provide services to all segments of society in support of ensuring equal opportunity in housing. These programs constitute the only grant programs within HUD’s Office of Fair Housing and Equal Opportunity. These programs were assigned $45.5 million in FY 2006.
231
PERFORMANCE AND ACCOUNTABILITY REPORT
Fair Housing Assistance Program assistance includes support for complaint processing, training, technical assistance, data and information systems, and other fair housing projects. The program is designed to build coordinated intergovernmental enforcement of fair housing laws and provide incentives for states and localities to assume a greater share of the responsibility for administering fair housing laws. The Fair Housing Initiative Program funding enables recipients to carry out activities designed to inform the public about rights and obligations under federal, state, and local laws prohibiting housing discrimination, and to enforce those rights.
Results, impact, and analysis. In FY 2006, HUD monitored 100 percent of its Fair Housing Initiatives Program grant agreements and Fair Housing Assistance Program cooperative agreements to ensure appropriate use of funds. The number of monitoring reviews conducted is based upon the total number of active Fair Housing Initiatives Program grants and the total number of substantially equivalent agencies in the Fair Housing Assistance Program at the beginning of the fiscal year. HUD completed 226 Fair Housing Initiative Program and 156 Fair Housing Assistance Program monitoring reviews. These numbers exceed the total number of open grants and cooperative agreements because, in some instances, agencies were monitored several times throughout the fiscal year to ensure compliance with applicable statutory and regulatory requirements.
HUD is required to monitor all grantees to ensure appropriate program compliance. In FY 2006, there were a total of 169 active Fair Housing Initiatives Program grants and 102 Fair Housing Assistance Program cooperative agreements. The Office of Fair Housing and Equal Opportunity monitored 100 percent of its grantees for appropriate use of funds.
In-depth agency-specific monitoring was conducted on all high-risk grantees. To the extent there were significant issues, concerns, or findings identified during monitoring and technical assistance, HUD required immediate corrective action.
Program website: http://www.hud.gov/offices/fheo/partners/index.cfm
Data discussion. The data are based on the Office of Fair Housing and Equal Opportunity Field Office administrative records. Accomplishments are reported in HUD’s Integrated Performance Reporting System. HUD managers conduct quality assurance reviews to ensure the accuracy of information.
EM4.10: Ensure, through cross-program efforts, that training, employment and contracting opportunities are created at all Section 3-covered projects for qualifying low- and very-low-income residents. Background. Section 3 of the Housing and Urban Development Act of 1968 requires public housing authorities and recipients of HUD funded assistance subject to Section 3 to the greatest extent possible to provide training and employment opportunities to low- and very-low income persons, as well as contracts to Section 3 businesses. The Section 3 Program promotes local economic development, neighborhood economic improvement, job training and opportunities, and individual self-sufficiency. Public housing authorities and recipients are required to submit annual reports on HUD form 60002. The form presents a summary of the Section 3 compliance activities pertaining to training, employment, and contracting. In FY 2006 headquarters staff in HUD’s Office of Fair Housing and Equal Opportunity insured that the 60002 data submitted were recorded properly and analyzed the submissions to identify overall trends, such as the percentage of Section 3 covered new hires that are Section 3 eligible residents and the percentage
232

SECTION 2. PERFORMANCE INFORMATION EMBRACE HIGH STANDARDS OF ETHICS, MANAGEMENT, AND ACCOUNTABILITY
of Section 3 contracts that are awarded to Section 3 businesses. In addition, staff established a baseline percentage of the agencies reporting. An outreach strategy has been developed that focuses on expanding the number of reporting agencies.
Program website: http://www.hud.gov/offices/fheo/section3/section3.cfm
Results, impact, and analysis. FY 2006 was the baseline year to begin measuring the success of the Section 3 program. During the fiscal year, less than 10 percent of the required 5,000 recipient agencies submitted the HUD 60002 report.
Reasons for shortfall/Performance improvement plans. To increase the number of reporting agencies, HUD’s outreach strategy will include: amending the A-133 Compliance Supplement to require independent auditors to verify the submission of the HUD-60002 Report; issuing timely reminder letters or emails informing agencies of their obligation to submit the 60002 report form that includes a brief reference guide; updating the 60002 system to automatically generate a ‘friendly’ reminder; and amending the guidance for PIH and CPD to include verifying submission of the 60002 report.
Data discussion. The HUD 60002 reports are submitted annually, either electronically or manually. These reports are received and then analyzed by HUD Headquarters Section 3 staff. The percentage of agencies reporting is entered in HUD’s Integrated Performance Reporting System.
Objective EM5: Improve internal communications and employee involvement. EM5.1 HUD employees continue to become more satisfied with the Department’s performance and work environment. Background. HUD is moving towards a more customer-oriented workforce and a greater emphasis has been placed on an employee’s ability to interact with customers, both internal and external. Research shows a strong correlation between employee satisfaction and customer satisfaction. HUD uses periodic employee surveys to gauge the staff satisfaction with their work environment, the training and support they receive, and HUD’s performance orientation measured along several dimensions. The last Organizational Assessment Survey was conducted in FY 2005, and the Human Capital Executive Steering Committee reviewed all the dimensions ranked on the 2005 survey and selected two dimensions (Training and Career Development and Leadership and Quality) to increase employee satisfaction. Although the results of the FY 2005 Organizational Assessment Survey did not meet the established goal of a 10 percent increase in employee satisfaction in the four dimensions, HUD remains committed to continuous improvement in all dimensions of the OAS survey. The FY 2006 goal was to analyze the employee survey results, provide recommendations, and develop action plans to further improve employee satisfaction.
Results, impact, and analysis. HUD achieved this goal. After reviewing the results of the 2005 Organizational Assessment Survey, the Human Capital Steering Committee selected Training and Career Development and Leadership and Quality as the primary areas for departmental focus. In FY 2006, HUD focused on actions that will improve employee satisfaction over the FY 2005 Survey results for two selected dimensions: Training and Career Development, and
233

PERFORMANCE AND ACCOUNTABILITY REPORT
Leadership and Quality. An Organizational Assessment Survey Project team was tasked with designing Action Plans to improve employee satisfaction in the dimensions. The Team was composed of 27 members representing 17 headquarters organizations and 6 field offices.
The Training and Career Development Action Plan implemented in FY 2006 provides HUD employees continuous educational and learning opportunities addressing career development. HUD has implemented this aggressive training strategy to close skill gaps in mission critical positions. The Leadership and Quality Action Plan established specific tasks that will improve employee satisfaction once implemented. Additionally, HUD is aligning the employee performance standards to Departmental strategic goals and objectives. Managers and employees are in continuous discussion to identify job performance expectation, and convey the mission, vision, and values of the Department. The Action Plans will continue to be implemented until the survey is re-administered in FY 2007.
Data Discussion. The Organizational Assessment Survey is administered by the Personnel Resources and Development Center of the Office of Personnel Management. These data are nearly free of sampling error because all employees receive the survey, although obtaining sufficient responses has proven challenging. The survey was tested by OPM, with additional pre-testing for HUD. A committee guided development of the survey administration framework and survey design to ensure valid and useful results. In 2004, OPM revised the survey, making it shorter and clarifying some of its dimensions. Therefore, HUD’s Organizational Assessment Survey scores prior to this, as reported in the FY 2005 Annual Performance Plan, were adjusted to fit the revised survey structure.
234

SECTION 2. PERFORMANCE INFORMATION PROMOTE PARTICIPATION OF FAITH-BASED AND COMMUNITY ORGANIZATIONS
Goal FC: Promote Participation of Faith-Based and Community Organizations Strategic Objectives:
FC1 Reduce barriers to participation by faith-based and community organizations.
FC2 Conduct outreach and provide technical assistance to faith-based and community organizations to strengthen their capacity to attract partners and secure resources.
FC3 Encourage partnerships between faith-based and community organizations and HUD’s traditional grantees.
PERFORMANCE REPORT CARD - GOAL FC
# Performance Indicator FY03 Actual
FY04 Actual
FY05 Actual
FY06 Actual
FY06 Goal
Met or Missed
notes
FC1.1 The Center for Faith-Based and Community Initiatives will measure the potentially increased participation by new and past participating faith-based and community organizations in the Department’s FY 2006 SuperNOFA process compared to 2005.
$545 $521 N/A Measure N/A a,g,k
FC2.1 The Center will conduct comprehensive outreach to faith-based and community organizations by attending and participating in at least 50 conferences, workshops, and updating and maintaining an exhaustive data base.
N/A N/A 47 106 50 met
FC2.2 In order to ensure that faith-based and community organizations have equal access to HUD and private funding opportunities, the Center will conduct at least 20 resource training sessions across the country that provide participants with approaches to obtaining funding and strategies for developing coalitions.
69 95 20 met
FC3.1 The Center will work with at least one HUD program office to implement a pilot program to strengthen partnerships between faith-based and community groups and HUD programs.
3 3 1 met
Notes: a Data not available. b No performance goal for this fiscal year. c Tracking indicator. d Third quarter of calendar year (last quarter of fiscal year; not the entire fiscal year). e Calendar year beginning during the fiscal year shown. f Calendar year ending during the fiscal year shown. g Result too complex to summarize. See indicator. h Baseline newly established. i Result is estimated. j Number is in thousands. k Number reported in millions. l Number reported in billions.
235

PERFORMANCE AND ACCOUNTABILITY REPORT
Objective FC1: Reduce barriers to participation by faith-based and community organizations. FC1.1: The Center for Faith-Based and Community Initiatives will measure the potentially increased participation by new and past participating faith-based and community organizations in the Department’s FY 2006 SuperNOFA process compared to 2005. Background. The Center for Faith-Based and Community Initiatives compares currently available fiscal year data against available data from past fiscal years, in order to check for growth against the immediately preceding year and to look for long-term trends. The Center has no involvement in grant decisions and management, but it does conduct outreach to equip faith-based and community organizations for more effective participation in Super Notice of Funding Availability competitions. One way to measure the effectiveness of the Center’s outreach is to look at the number of both first time and repeat awards to faith-based and community organizations in the Super Notice of Funding Availability process. The Center measures this number in fulfillment of its White House mandate to report on results.
There are no numeric targets for this program. Its purpose is to foster the participation of faith-based and community organizations on an equal footing with all other competitive applicants in HUD’s competitively funded programs. Conclusive data are not available until after the conclusion of the current fiscal year and, therefore, final FY 2006 data will be available in FY 2007.
Results, impact, and analysis. While final data for FY 2006 are not currently available, the Center has met its milestone targets for FY 2006. Fiscal Year 2005 final data were likewise not available for the FY 2005 Performance and Accountability Report. The Center can now report that in FY 2005, faith-based and community organizations secured $521 million in competitive funding, a decrease from $545 million in FY 2004 and $532 million in FY 2003. The number of grantees rose, however, from 836 in FY 2004 to 1,111 in FY 2005. Although the total funding to faith-based organizations decreased slightly from $545 million in FY 2004, the percentage of HUD non-entitlement dollars awarded to faith-based organizations increased to 24.3 percent, from 24 percent in FY 2004, whereas the total HUD dollars awarded in 2005 decreased 4.5 percent. Last year’s increase in percentage of overall competitive funding by faith-based and community organizations is attributable to their more effective participation in the Super Notice of Funding Availability application process. The Center will measure in the same way for FY 2006 to determine the level of participation by faith-based and community organizations in FY 2006 competitive funding opportunities.
Data discussion. Data were collected through the program offices using a variety of methods to best collect the most accurate information. The Center is confident that the collection process has become more refined and accurate each year, as program offices are thoroughly familiar with the reporting requirements and the Center has been able to provide longer lead-time for data collection and assembly. Any questions regarding accuracy are referred back to the program office, and when necessary, submitted to the organization in question for final resolution.
236

SECTION 2. PERFORMANCE INFORMATION PROMOTE PARTICIPATION OF FAITH-BASED AND COMMUNITY ORGANIZATIONS
Objective FC2: Conduct outreach and provide technical assistance to faith-based and community organizations to strengthen their capacity to attract partners and secure resources. FC2.1: The Center will conduct comprehensive outreach to faith-based and community organizations by attending and participating in at least 50 conferences, workshops, and updating and maintaining an exhaustive data base. Background. To help nonprofit organizations meet the challenges of securing resources, the Center educates faith-based and community organizations about HUD and other programs. In support of the Center’s outreach goal, the Center continued to work with Faith-Based and Community Initiatives liaisons located in each of HUD’s regional and field offices. The liaisons assist the Center in educating faith-based organizations and community organizations about the Initiative and about HUD and other funding opportunities. The Center continued the use of various media, including mass mailings and web casts, to distribute information. It continued to develop a database with currently approximately 5,000 faith-based and community-based organizations. In addition, Center staff and Faith-Based and Community Initiatives liaisons participated in national, regional, and state conferences across the country, resulting in outreach to a broad range of social service providers, including many of the nation’s largest and most effective providers.
Results, impact, and analysis. The Center met its goal to conduct comprehensive outreach through its Grant Writing Training and its Unlocking Doors Initiative, which included seven sessions in seven cities and participation in the annual conference of the U.S. Conference of Mayors. The Center also updated its database on a regular basis. Results and impacts include wider dissemination of knowledge about regulatory reform and Equal Treatment regulations, successful grant-writing strategies, HUD and other funding opportunities, and the creation of an affordable housing coalition in Raleigh, NC.
Data discussion. The Center tracks the participation of all Faith-Based and Community Initiatives liaisons at conferences and public events by requiring the liaisons to submit event-scheduling forms. Numbers for conference attendance are generated by registration forms, which may be adjusted based on other measures of actual attendance. The Center believes that the numbers for conference and public event attendance are reliable and complete.
FC2.2: In order to ensure that faith-based and community organizations have equal access to HUD and private funding opportunities, the Center will conduct at least 20 resource training sessions across the country that provide participants with approaches to obtaining funding and strategies for developing coalitions. Background. The Center believes that it is important to equip faith-based and community organizations with the knowledge and skills necessary for attaining resources to address the needs of the communities they serve. Accordingly, the Center continues to deliver its two-day, intensive grant writing training session, entitled “The Art & Science of Grant Writing,” which educates faith-based and community organizations about funding sources available from HUD, other government agencies, foundations, and corporate funding streams. HUD staff conducts the training across the country. At the conclusion of the training session, each participant receives a “Certificate of Completion.”
237

PERFORMANCE AND ACCOUNTABILITY REPORT
Program website: www.hud.gov/offices/fbci/4thtraining.cfm
Results, impact, and analysis. The Center for Faith-Based and Community Initiatives has exceeded its goal of 20 trainings for FY 2006. Ninety-five trainings were conducted between April 2006 and September 2006. The evaluations will be reviewed to analyze the impact of the trainings.
Data discussion. Accomplishments will be assessed and documented by HUD’s Center For Faith-Based and Community Initiatives and the Office of Policy Development and Research. Attendances of all training sessions are documented through registration, sign-in sheets, organizational surveys, and evaluation sheets.
Objective FC3: Encourage partnerships between faith-based and community organizations and HUD’s traditional grantees. FC3.1: The Center will work with at least one HUD program office to implement a pilot program to strengthen partnerships between faith-based and community groups and HUD programs. Background. Together with the Office of Public and Indian Housing, the Center For Faith-Based and Community Initiatives developed a concept designed to support PHA case managers and enable PHAs to enlist the services of local faith-based and community organizations in helping public housing residents’ transition into independent housing and achieve personal goals toward self-sufficiency. The NOFA, published in May 2005, allows PHAs to compensate faith-based and community organizations on a per capita, fee-for-service basis each time a faith-based and community organization mentor successfully leads a public housing resident toward an agreed-upon benchmark. These funds were made available to determine if a mentoring demonstration program assistance model improves the results of self-sufficiency type programs for participating residents. This is an 18-month program.
Results, impact, and analysis. PHAs were chosen in Danville, Virginia; Chicago, Illinois, and Philadelphia, Pennsylvania, and the goal was successfully met. The project is underway. There are no project results or impacts for analysis in FY 2006.
Data discussion. Center For Faith-Based and Community Initiatives staff will be maintaining a system for communicating and monitoring the HOPE VI demonstration projects through Public and Indian Housing personnel, PHA directors, and their case management staff. The Center believes the data to be reliable and complete.
238

Section 3. Financial Section
239


SECTION 3. FINANCIAL INFORMATION THE CHIEF FINANCIAL OFFICER’S MESSAGE
Message from the Chief Financial Officer
November 15, 2006 In FY 2006, the Department of Housing and Urban Development continued down the path towards financial management excellence. The Department’s progress is measured by the results and outcomes captured in this annual Performance and Accountability Report. The report tells the story of our successes and challenges in both the financial and program arenas. It serves as the principal publication and report to the Congress and the American people on our program leadership and our stewardship and management of the public funds entrusted to us. I am pleased to report that for the seventh consecutive year, we have received an unqualified or “clean” opinion on the Department’s consolidated financial statements from our independent Office of Inspector General auditors. Furthermore, this is the first time since financial statement audits have been required by the Chief Financial Officers Act of 1990, that HUD can report no auditor-reported material internal control weakness issues. FHA successfully eliminated the two material weakness issues reported last year by strengthening internal controls over their program risk analyses and processes for estimating the liability for loan guarantees. While the financial audit still contains six reportable condition issues, viable corrective action plans are in place and the Department continues to make progress in addressing those issues. This favorable financial audit result affirms our continued commitment to financial and management excellence. Other significant financial management accomplishments in FY 2006 include: • Completion of HUD’s first assessment of the effectiveness of internal controls over financial
reporting, in accordance with the new requirements of Appendix A of OMB Circular A-123. This is the equivalent of the Sarbanes-Oxley Act requirements for the private sector. Based on the results of that evaluation, the Secretary was able to report reasonable assurance that the Department’s internal controls over financial reporting, as of June 30, 2006, were operating effectively, and no material weaknesses were found in the design or operation of the internal controls over financial reporting. Nevertheless, opportunities for improved controls were identified and actions have been initiated.
• Automation of the business and accounting processes for the Section 236 Interest Reduction
Payment Program – a terminated program with over 2,800 active contracts with an estimated remaining obligated balance due of $4.1 billion. The automated process enables HUD to electronically process approximately $34 million in monthly payments that were paid manually prior to May 2006.
• Continuous review and clean-up of obligated fund balances associated with terminated
programs and expired contracts, deobligating over $1.6 billion in excess funding identified in FY 2006.
241

PERFORMANCE AND ACCOUNTABILITY REPORT
• Remediation of two previously non-compliant financial systems, including replacement of the Loan Accounting System with a compliant Commercial-Off-The-Shelf system to better account for a $6 billion loan portfolio. Only two of HUD’s 41 financial and mixed financial management systems reported any financial systems compliance deficiencies at the end of FY 2006, and actions are underway to address those deficiencies.
• Receipt of the highest rating from the Office of Management and Budget on goals for nine
out of nine key federal accounting practices, achieving: 100 percent fund balance with Treasury reconciliation, 100 percent suspense account resolution, 100 percent debt management, 99 percent prompt payment, 99 percent interest management, 96 percent electronic funds transfer, 99 percent individual travel card timeliness, 100 percent central travel card timeliness, and 100 purchase card timeliness. These nine green ratings placed HUD among the top performers in the federal government.
Lastly, I want to congratulate Ginnie Mae for its successful implementation of a new general ledger system this year, using the same software application that FHA used to implement its new general ledger system in 2002. Building upon the success of FHA and Ginnie Mae, the Department has completed requirements for applying that same software application to the remainder of the Department. In FY 2007, the Department will implement its acquisition strategy to procure the systems integrator and hosting services required to support the HUD Integrated Financial Management Improvement Project. This multi-year project will replace HUD’s core financial systems with a solution that integrates and improves financial information processing from all HUD business areas, encompassing 34 existing systems and 71 existing interfaces. HUD’s goal is to have a single general ledger system in place by the end of FY 2009. HUD is committed to maintaining proper stewardship of the resources entrusted to it by the Congress and the American taxpayer. I want to thank the staff of the Office of the Chief Financial Officer, the FHA and Ginnie Mae Comptroller’s Offices, the Office of the Inspector General, and other HUD program and administrative components that are involved in the stewardship of HUD’s funds. Their dedication and effort is essential in providing HUD’s program management team with the budgetary, accounting, financial management systems, auditing, and performance management services necessary to effectively support HUD’s mission and deliver results for the American people.
242

SECTION 3: FINANCIAL INFORMATION FINANCIAL STATEMENTS
Financial Statements The principal financial statements have been prepared to report the financial position and results of operations of HUD, pursuant to the requirements of the Chief Financial Officers Act of 1990 (31 U.S.C. 3515(b)), the Government Management Reform Act of 1994, and OMB Circular A-136, “Financial Reporting Requirements.” While the financial statements have been prepared from HUD’s books and records in accordance with formats prescribed by OMB, the statements are in addition to the financial reports used to monitor and control budgetary resources, which are prepared from the same books and records.
The principal financial statements and notes should be read with the realization that they are for a component of the U.S. Government, a sovereign entity. One implication is that the liabilities reported in the financial statements cannot be liquidated without legislation that provides resources to do so.
The financial statements presented herein are:
The Consolidated Balance Sheets, which present as of September 30, 2006 and 2005 those resources owned or managed by HUD which are available to provide future economic benefits (assets); amounts owed by HUD that will require payments from those resources or future resources (liabilities); and residual amounts retained by HUD comprising the difference (net position).
The Consolidated Statements of Net Cost, which present the net cost of HUD operations for the years ended September 30, 2006 and 2005. HUD’s net cost of operations includes the gross costs incurred by HUD less any exchange revenue earned from HUD activities.
The Consolidated Statements of Changes in Net Position, which present the change in HUD’s net position resulting from the net cost of HUD operations, budgetary financing sources other than exchange revenues, and other financing sources for the years ended September 30, 2006 and 2005.
The Combined Statements of Budgetary Resources, which present the budgetary resources available to HUD during FY 2006 and 2005, the status of these resources at September 30, 2006 and 2005, and the outlay of budgetary resources for the years ended September 30, 2006 and 2005.
The Consolidated Statements of Financing, which reconcile the net cost of operations with the obligation of budgetary resources for the years ended September 30, 2006 and 2005.
The Notes to the Financial Statements provide important disclosures and details related to information reported on the statements.
243

PERFORMANCE AND ACCOUNTABILITY REPORT
Consolidated Balance Sheet As of September 30, 2006 and 2005
(Dollars in Millions) 2006 2005ASSETS Intragovernmental Fund Balance with Treasury (Note 4) $81,395 $67,500 Investments (Note 5) 30,426 30,715 Other Assets (Note 9) 26 28Total Intragovernmental Assets $111,847 $98,243 Investments (Note 5) 98 201 Accounts Receivable (Net) (Note 6) 363 646 Credit Program Receivables and Related Foreclosed Property (Note 7) 10,045 10,818 General Property, Plant, and Equipment (Net) (Note 8) 176 141 Other Assets (Note 9) 534 520TOTAL ASSETS $123,063 $110,569
LIABILITIES Intragovernmental Liabilities Debt (Note 11) $7,249 $8,922 Other Intragovernmental Liabilities (Note 14) 2,670 995Total Intragovernmental Liabilities $9,919 $9,917 Accounts Payable (Note 10) 757 847 Loan Guarantees (Note 7) 3,589 4,678 Debt Held by the Public (Note 11) 1,252 1,542 Federal Employee and Veterans' Benefits (Note 12) 80 82 Loss Reserves (Note 13) 534 539 Other Governmental Liabilities (Note 14) 1,192 1,014TOTAL LIABILITIES $17,323 $18,619
CONTINGENCIES (Note 17) NET POSITION Unexpended Appropriations - Earmarked (Note 18) ($376) Unexpended Appropriations 66,616 $53,828 Cumulative Results of Operations - Earmarked (Note 18) 12,504 Cumulative Results of Operations 26,996 38,122Total Net Position 105,740 91,950Total Liabilities and Net Position $123,063 $110,569 The accompanying notes are an integral part of these statements.
244

SECTION 3: FINANCIAL INFORMATION FINANCIAL STATEMENTS
Consolidated Statement of Net Cost For the Period Ended September 2006 and 2005
(Dollars in Millions) 2006 2005COSTS: Federal Housing Administration Gross Cost ($380) $786 Less: Earned Revenue (1,701) (1,854) Net Program Costs ($2,081) ($1,068)Government National Mortgage Association Gross Cost $60 $81 Less: Earned Revenue (849) (786) Net Program Costs ($789) ($705)Section 8: Gross Cost $23,827 $23,395 Less: Earned Revenue Net Program Costs $23,827 $23,395 Community Development Block Grants: Gross Cost $5,093 $5,025 Less: Earned Revenue Net Program Costs $5,093 $5,025 HOME: Gross Cost $1,853 $1,754 Less: Earned Revenue Net Program Costs $1,853 $1,754 Operating Subsidies:
Gross Cost $3,600 $3,567 Less: Earned Revenue Net Program Costs $3,600 $3,567 Low Rent Public Housing Loans and Grants Gross Cost $3,566 $3,601 Less: Earned Revenue Net Program Costs $3,566 $3,601 Housing for the Elderly and Disabled Gross Cost $1,279 1,370 Less: Earned Revenue (515) (553) Net Program Costs $764 $817 Other: Gross Cost $3,541 $3,784 Less: Earned Revenue (78) (33) Net Program Costs $3,463 $3,751 Costs Not Assigned to Programs: $332 $268 Consolidated: Gross Cost $42,771 $43,631 Less: Earned Revenue (3,143) (3,226)Net Cost of Operations $39,628 $40,405
The accompanying notes are an integral part of these statements.
245
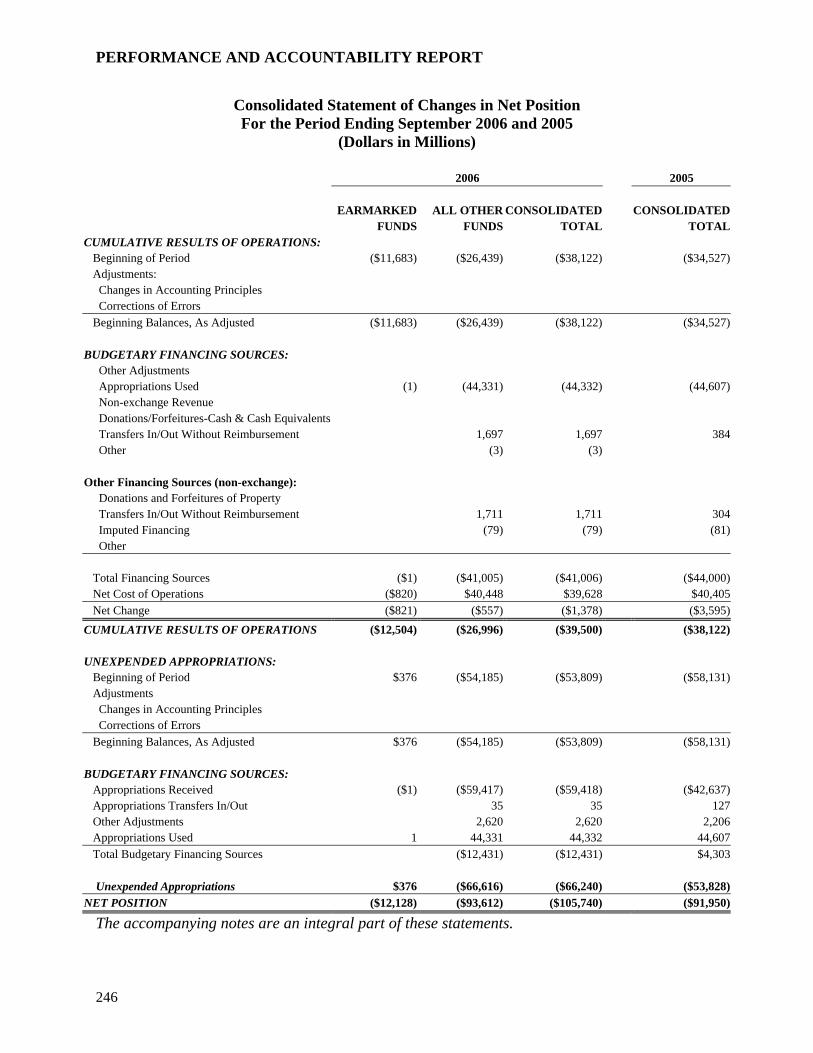
PERFORMANCE AND ACCOUNTABILITY REPORT
Consolidated Statement of Changes in Net Position For the Period Ending September 2006 and 2005
(Dollars in Millions)
2006 2005
EARMARKED ALL OTHER CONSOLIDATED CONSOLIDATEDFUNDS FUNDS TOTAL TOTAL
CUMULATIVE RESULTS OF OPERATIONS: Beginning of Period ($11,683) ($26,439) ($38,122) ($34,527) Adjustments: Changes in Accounting Principles Corrections of Errors Beginning Balances, As Adjusted ($11,683) ($26,439) ($38,122) ($34,527) BUDGETARY FINANCING SOURCES: Other Adjustments Appropriations Used (1) (44,331) (44,332) (44,607) Non-exchange Revenue Donations/Forfeitures-Cash & Cash Equivalents Transfers In/Out Without Reimbursement 1,697 1,697 384 Other (3) (3)
Other Financing Sources (non-exchange): Donations and Forfeitures of Property Transfers In/Out Without Reimbursement 1,711 1,711 304 Imputed Financing (79) (79) (81) Other Total Financing Sources ($1) ($41,005) ($41,006)
($1,378)
($44,000) Net Cost of Operations ($820) $40,448 $39,628 $40,405 Net Change ($821) ($557) ($3,595)CUMULATIVE RESULTS OF OPERATIONS ($12,504) ($26,996) ($39,500) ($38,122) UNEXPENDED APPROPRIATIONS: Beginning of Period $376 ($54,185) ($53,809) ($58,131) Adjustments Changes in Accounting Principles Corrections of Errors Beginning Balances, As Adjusted $376 ($54,185) ($53,809) ($58,131) BUDGETARY FINANCING SOURCES: Appropriations Received ($1) ($59,417) ($59,418) ($42,637) Appropriations Transfers In/Out 35 35 127 Other Adjustments 2,620 2,620 2,206 Appropriations Used 1 44,331 44,332 44,607 Total Budgetary Financing Sources ($12,431) ($12,431) $4,303 Unexpended Appropriations $376 ($66,616) ($66,240) ($53,828)NET POSITION ($12,128) ($93,612) ($105,740) ($91,950)
The accompanying notes are an integral part of these statements.
246

SECTION 3: FINANCIAL INFORMATION FINANCIAL STATEMENTS
Combined Statement of Budgetary Resources For the Period Ended September 2006 and 2005
(Dollars in Millions) 2006 2005
Budgetary
NonBudgetaryCredit Program
Financing Accounts
Budgetary
NonBudgetaryCredit Program
Financing Accounts
Budgetary Resources: Unobligated Balance, Brought Forward $43,381 $6,006 $44,731 $4,723Recoveries of Prior Year Unpaid Obligations 2,040 6 1,996 39Budget Authority Appropriation $59,438 $42,657 Borrowing Authority 19 887 11 1,174 Contract Authority 757 Spending Auth from Offsetting Collections Earned Collected 5,750 11,496 5,243 11,740 Change in Receivable from Fed Sources (52) (46) 12 (86) Change in Unfilled Customer Orders Advance Received (121) 66 W/O Advance from Federal Sources 7 (5) (7) 3 Anticipated Rest of Year w/o Advance Previously Unavailable Expenditure Transfers from Trust Funds Subtotal Budget Authority $65,041 $12,332 $48,739 $12,831 Nonexpenditure Transfers, Net 156 218 Temporarily Not Available Per PL Permanently not available (7,905) (2,186) (8,142) (1,214)Total Budgetary Resources $102,713 $16,158 $87,542 $16,379Status of Budgetary Resources: Obligations Incurred Direct $54,146 $9,000 $44,033 $10,373 Reimbursable 100 120 Subtotal $54,246 $9,000 $44,153 $10,373 Unobligated Balances Apportioned $11,416 $2,146 $7,723 $2,662 Exempt from Apportionment Subtotal $11,416 $2,146 $7,723 $2,662 Unobligated Balances Not Available 37,051 5,012 35,666 3,344Total Status of Budgetary Resources $102,713 $16,158 $87,542 $16,379Change in Obligated Balance Obligated Balance, Net Unpaid Obligations, Brought Forward $69,218 $1,263 $75,539 $1,264 Less: Uncollected Customer Payments from Federal Sources (346) (72) (341) (155) Total Unpaid Obligated Balance, Net $68,872 $1,191 $75,198 $1,109 Obligations Incurred, Net 54,246 9,000 44,153 10,373 Less: Gross Outlays (48,816) (8,881) (48,465) (10,335) Obligated Balance Transferred, Net Actual Transfers, Unpaid Obligations Actual Transfers, Uncollected Customer Payments from Federal Sources Total Unpaid Obligated Balance Transferred, Net Less: Recoveries of Prior Year Unpaid Obligations, Actual (2,040) (6) (1,996) (39) Change in Uncollected Customer Payments from Federal Sources 45 51 (5) 83 Obligated Balance, Net - End of Period Unpaid Obligations 72,608 1,376 69,231 1,263 Less: Uncollected Customer Payments from Federal Sources (301) (21) (346) (72) Total Obligated Balance, Net - End of Period $72,307 $1,355 $68,885 $1,191 Net Outlays Gross Outlays 48,816 8,881 48,465 10,335 Less Offsetting Collections (5,629) (11,496) (5,308) (11,740) Less: Distributed Offsetting Receipts (717) (483) Net Outlays $42,470 ($2,615) $42,674 ($1,406)The accompanying notes are an integral part of these statements.
247

PERFORMANCE AND ACCOUNTABILITY REPORT
Consolidated Statement of Financing For the Year Ended September 2006 and 2005
(Dollars in Millions) 2006 2005Resources Used to Finance Activities: Budgetary Resources Obligated Obligations Incurred $63,246 $54,526Less: Spending Authority from Offsetting Collections & Recoveries (19,075) (19,006)Obligations Net of Offsetting Collections $44,171 $35,520Less: Offsetting Receipts (717) (483)Net Obligations $43,454 $35,037Other Resources Transfers In/Out Without Reimbursement (1,867) (512)Imputed Financing from Costs Absorbed by Others 79 58Other Resources (7) 53 Net Other Resources Used to Finance Activities ($1,795) ($401)Total Resources Used to Finance Activities $41,659 $34,636 Resources Used to Finance Items Not Part of the Net Cost of Operations Change in Budgetary Resources Obligated for Goods Services/Benefits Ordered but not yet Provided (3,665) $6,312
Resources That Fund Expenses from Prior Periods (3,787) (3,162)Budgetary Offsetting Collections and Receipts Not Affecting Net Cost of Operations 14,703 14,262Resources Financing Acquisition of Assets (6,967) (10,103)Other Changes to Net Obligated Resources Not Affecting Net Cost of Operations (355) (501)Total Resources Used to Finance Items Not Part of the Net Cost of Operations (71) $6,808Total Resources Used to Finance the Net Cost of Operations $41,588 $41,444
Generating Resources in the Current Period:
$2
Re-estimates of Credit Subsidy Expense
Components of Net Cost of Operations Not Requiring/
Components Requiring or Generating Resources in Future Periods Increase in Annual Leave Liability $4
406 2,131Exchange Revenue Receivable from the Public (519) (563)Other 5 3 Total Requiring/Generating Resources in Future Periods ($104) $1,573 Components Not Requiring/Generating Resources Depreciation and Amortization $21 $15 Revaluation of Assets or Liabilities (741) (1,338) Other (1,136) (1,289)Total Components of Net Cost of Operations Not Requiring/Generating Resources ($1,856) ($2,612) Total Components of Net Cost of Operations Not Requiring/ Generating Resources in the Current Period ($1,960) ($1,039)
Net Cost of Operations $39,628 $40,405
The accompanying notes are an integral part of these statements.
248

SECTION 3: FINANCIAL INFORMATION NOTES TO FINANCIAL STATEMENTS
Notes to Financial Statements September 30, 2006 and 2005 NOTE 1 - ENTITY AND MISSION
The U.S. Department of Housing and Urban Development (HUD) was created in 1965 to (1) provide housing subsidies for low and moderate income families, (2) provide grants to states and communities for community development activities, (3) provide direct loans and capital advances for construction and rehabilitation of housing projects for the elderly and persons with disabilities, and (4) promote and enforce fair housing and equal housing opportunity. In addition, HUD insures mortgages for single family and multifamily dwellings; insures loans for home improvements and manufactured homes; and facilitates financing for the purchase or refinancing of millions of American homes.
HUD's major programs are as follows:
The Federal Housing Administration (FHA) was established under the National Housing Act of 1934 and became a wholly owned government corporation in 1948 subject to the Government Corporation Control Act, as amended. While FHA was established as a separate Federal entity, it was subsequently merged into HUD in 1965. FHA administers active mortgage insurance programs which are designed to make mortgage financing more accessible to the home-buying public and thereby to develop affordable housing. FHA insures private lenders against loss on mortgages which finance single family homes, multifamily projects, health care facilities, property improvements, and manufactured homes.
The Government National Mortgage Association (Ginnie Mae) was created in 1968 as a wholly owned Government corporation within HUD to administer mortgage support programs that could not be carried out in the private market. Ginnie Mae guarantees the timely payment of principal and interest on mortgage-backed securities issued by approved private mortgage institutions and backed by pools of mortgages insured or guaranteed by FHA, the Rural Housing Service (RHS), the Department of Veterans Affairs (VA) and the HUD Office of Public and Indian Housing (PIH).
The Section 8 Rental Assistance programs assist low- and very low-income families in obtaining decent and safe rental housing. HUD makes up the difference between what a low- and very low-income family can afford and the approved rent for an adequate housing unit with the Housing Choice Voucher (HCV) Program funding cycle that started January 1, 2005 and ended December 31, 2005. As of January 1, 2005, Congress changed the basis of the program funding to PHAs from a “unit-based” process where program variables affected the annual Federal funding amount to a “budget-based” process where annual Federal funding is a fixed amount. Under the budget-based process, PHAs draw the program fund allocated to them on a monthly basis, i.e., one twelve of the annual allocation.
Operating Subsidies are provided to PHAs and Tribally Designated Housing Entities (TDHEs) to help finance the operations and maintenance costs of their housing projects.
The Community Development Block Grant (CDBG) programs provide funds for metropolitan cities, urban counties, and other communities to use for neighborhood revitalization, economic development, and improved community facilities and services. The United States Congress
249

PERFORMANCE AND ACCOUNTABILITY REPORT
appropriated $2 billion in FY 2002 and $783 million in emergency supplemental appropriations in FY 2001 for “Community Development Fund” for emergency expenses to respond to the September 11, 2001 terrorist attacks on the United States. Of the amounts appropriated, $228 million and $111 million was expensed as of September 30, 2006 and 2005, respectively. Any remaining un-obligated balances shall remain available until expended.
The Section 202/811 Supportive Housing for the Elderly and Persons with Disabilities programs, prior to fiscal 1992, provided 40 year loans to nonprofit organizations sponsoring rental housing for the elderly or disabled. During fiscal 1992, the program was converted to a grant program. The grant program provides capital for long-term supportive housing for the elderly (Section 202) and disabled (Section 811).
B. Basis of Accounting
The Low Rent Public Housing Grants program provides grants to PHAs and TDHEs for construction and rehabilitation of low-rent housing. This program is a continuation of the Low Rent Public Housing Loan program which pays principal and interest on long-term loans made to PHAs and TDHEs for construction and rehabilitation of low-rent housing.
The Home Investments Partnerships program provides grants to States, local Governments, and Indian tribes to implement local housing strategies designed to increase home ownership and affordable housing opportunities for low- and very low-income families.
Other Programs not included above consist of other smaller programs which provide grant, subsidy funding, and direct loans to support other HUD objectives such as fair housing and equal opportunity, energy conservation, assistance for the homeless, rehabilitation of housing units, removal of lead hazards, and home ownership. These programs comprise approximately 7.4 percent of HUD's consolidated assets and 6.3 percent of HUD’s consolidated revenues and financing sources for fiscal 2006 and 8.6 percent of HUD's consolidated assets and 7.9 percent of HUD’s consolidated revenues and financing sources for fiscal 2005.
NOTE 2 - SUMMARY OF SIGNIFICANT ACCOUNTING POLICIES
A. Basis of Consolidation
The financial statements include all funds and programs for which HUD is responsible. All significant intra-fund balances and transactions have been eliminated in consolidation. Transfer appropriations are consolidated into the financial statements based on an evaluation of their relationship with HUD.
The financial statements include the accounts and transactions of the Office of Fair Housing and Equal Opportunity (OFHEO), Ginnie Mae, FHA, and HUD's Grant, Subsidy and Loan programs.
The financial statements are presented in accordance with the Office of Management and Budget (OMB) Circular No. A-136, Financial Reporting Requirements and in conformance with the Federal Accounting Standards Advisory Board’s (FASAB) Statements of Federal Financial Accounting Standards (SFFAS).
The financial statements are presented on the accrual basis of accounting. Under this method, HUD recognizes revenues when earned, and expenses when a liability is incurred, without regard to receipt or payment of cash. Generally, procedures for HUD’s major grant and subsidy
250

SECTION 3: FINANCIAL INFORMATION NOTES TO FINANCIAL STATEMENTS
programs require recipients to request periodic disbursement concurrent with incurring eligible costs.
The department’s disbursement policy permits grantees/recipients to request funds to meet immediate cash needs to reimburse themselves for eligible incurred expenses and eligible expenses expected to be received and paid within three days or as subsidies are payable. HUD’s disbursement of funds for these purposes are not considered advance payments, but are viewed as good cash management between the department and the grantees. In the event it is determined that the grantee/recipient did not disburse the funds within the three days time frame, interest earned must be returned to HUD and deposited into one of Treasury's miscellaneous receipt accounts.
C. Use of Estimates
The preparation of the principal financial statements in conformity with Generally Accepted Accounting Principles (GAAP) requires management to make estimates and assumptions that affect the reported amounts of assets and liabilities, the disclosure of contingent assets and liabilities at the date of the financial statements, and the reported amounts of revenues and expenses during the reporting period. Actual results may differ from those estimates.
Amounts reported for net loans receivable and related foreclosed property and the loan guarantee liability represent the Department’s best estimates based on pertinent information available.
To estimate the allowance for subsidy (AFS) associated with loans receivable and related to foreclosed property and the Liability for Loan Guarantees (LLG), the Department uses cash flow model assumptions associated with loan guarantee cases subject to the Federal Credit Reform Act of 1990 (FCRA), as described in Note 7, to estimate the cash flows associated with future loan performance. To make reasonable projections of future loan performance, the Department develops assumptions based on historical data, current and forecasted program and economic assumptions.
Certain programs have higher risks due to increased chances of fraudulent activities perpetrated against the Department. The Department accounts for these risks through the assumptions used in the liabilities for loan guarantee estimates. HUD develops the assumptions based on historical performance and management's judgments about future loan performance.
D. Credit Reform Accounting
The primary purpose of the Federal Credit Reform Act of 1990, which became effective on October 1, 1991, is to more accurately measure the cost of Federal credit programs and to place the cost of such credit programs on a basis equivalent with other Federal spending. OMB Circular A-11, Part 5, Federal Credit Programs defines Loan Guarantee as any guarantee, insurance or other pledge with respect to the payment of all or a part of the principal or interest on any debt obligation of a non-Federal borrower (Issuer) to a non-Federal lender (Investor). FHA practices Credit Reform accounting. In the opinion of Ginnie Mae management, and HUD’s General Counsel, the Federal Credit Reform Act does not apply to Ginnie Mae. Nevertheless, in consultation with the OMB, Ginnie Mae has adopted certain credit reform practices.
The FCRA establishes the use of the program, financing, general fund receipt and capital reserve accounts for loan guarantees committed and direct loans obligated after September 30, 1991
251

PERFORMANCE AND ACCOUNTABILITY REPORT
(Credit Reform). It also establishes the liquidating account for activity relating to any loan guarantees committed and direct loans obligated before October 1, 1991 (pre-Credit Reform). These accounts are classified as either budgetary or non-budgetary in the Combined Statements of Budgetary Resources. The budgetary accounts include the program, capital reserve and liquidating accounts. The non-budgetary accounts consist of the credit reform financing accounts.
The program account is a budget account that receives and obligates appropriations to cover the subsidy cost of a direct loan or loan guarantee and disburses the subsidy cost to the financing account. The program account also receives appropriations for administrative expenses. The financing account is a non-budgetary account that records all of the cash flows resulting from Credit Reform direct loans or loan guarantees. It disburses loans, collects repayments and fees, makes claim payments, holds balances, borrows from U.S. Treasury, earns or pays interest, and receives the subsidy cost payment from the program account.
The general fund receipt account is a budget account used for the receipt of amounts paid from the financing account when there is a negative subsidy from the original estimate or a downward reestimate. In most cases, the receipt account is a general fund receipt account and amounts are not earmarked for the credit program. They are available for appropriations only in the sense that all general fund receipts are available for appropriations. Any assets in this account are non-entity assets and are offset by intragovernmental liabilities. At the beginning of the following fiscal year, the fund balance in the general fund receipt account is transferred to U.S. Treasury general fund. The FHA general fund receipt account of the General Insurance (GI) and Special Risk Insurance (SRI) funds are in this category.
In order to resolve the different requirements between the FCRA and the National Affordable Housing Act of 1990 (NAHA), OMB instructed FHA to create the capital reserve account to retain the Mutual Mortgage Insurance/Cooperative Management Housing Insurance (MMI/CMHI) negative subsidy and subsequent downward reestimates. Specifically, the NAHA required that FHA’s MMI fund achieve a Capital Ratio of 2.0 percent by fiscal year 2000. The Capital Ratio is defined as the ratio of economic net worth (current cash plus the present value of all future net cash flows) of the MMI fund to unamortized insurance in force (the unpaid balance of insured mortgages). Therefore, to ensure that the calculated Capital Ratio reflects the actual strength of the MMI fund, the resources of the capital reserve account, which are considered FHA assets, are included in the calculation of the MMI fund’s economic net worth. At the end of fiscal year 1995, FHA met and has since maintained the Capital Ratio requirement. FHA's actuary estimates the September 30, 2006, Capital Ratio at 6.82 percent. The fiscal year 2005 estimated Capital Ratio was 6.02 percent.
The liquidating account is a budget account that records all cash flows to and from FHA resulting from pre-Credit Reform direct loans or loan guarantees. Liquidating account collections in any year are available only for obligations incurred during that year or to repay debt. Unobligated balances remaining in the GI and SRI liquidating funds at year-end are transferred to the U.S. Treasury’s General Fund. Consequently, in the event that resources in the GI/SRI liquidating account are otherwise insufficient to cover the payments for obligations or commitments, the FCRA provides the GI/SRI liquidating account with permanent indefinite authority to cover any resource shortages.
252

SECTION 3: FINANCIAL INFORMATION NOTES TO FINANCIAL STATEMENTS
E. Operating Revenue and Financing Sources
HUD finances operations principally through appropriations, collection of premiums and fees on its FHA and Ginnie Mae programs, and interest income on its mortgage notes, loans, and investments portfolio.
Appropriations for Grant and Subsidy Programs
HUD receives both annual and multi-year appropriations, and recognizes those appropriations as revenue when related program expenses are incurred. Accordingly, HUD recognizes grant-related revenue and related expenses as recipients perform under the contracts. HUD recognizes subsidy-related revenue and related expenses when the underlying assistance (e.g., provision of a Section 8 rental unit by a housing owner) is provided or upon disbursal of funds to PHAs.
FHA Unearned Premiums
Premiums charged by FHA for single family mortgage insurance provided by its Mutual Mortgage Insurance (MMI) Fund and Cooperative Management Housing Insurance (CMHI) Fund include up-front and annual risk based premiums. Pre-credit reform up-front risk based premiums are recorded as unearned revenue upon collection and are recognized as revenue over the period in which losses and insurance costs are expected to occur. Annual risk-based premiums are recognized as revenue on a straight-line basis throughout the year. FHA's other activities charge periodic insurance premiums over the mortgage insurance term. Premiums on annual installment policies are recognized for the liquidating accounts on a straight-line basis throughout the year.
Premiums associated with Credit Reform loan guarantees are included in the calculation of the Liability for Loan Guarantees (LLG) and not included in the unearned premium amount reported on the Balance Sheet, since the LLG represents the net present value of future cash flows associated with those insurance portfolios.
Ginnie Mae Fees
Fees received for Ginnie Mae’s guaranty of mortgage-backed securities are recognized as earned on an accrual basis. Commitment fees represent income that Ginnie Mae earns for providing approved issuers with authority to pool mortgages into Ginnie Mae mortgage-backed securities. The authority Ginnie Mae provides issuers expires 12 months from issuance for single family issuers and 24 months from issuance for multifamily issuers. Ginnie Mae receives Commitment Fees as issuers request Commitment Authority and recognizes the Commitment Fees as earned as Issuers use their Commitment Authority, with the balance deferred until earned or expired, whichever occurs first. Fees from expired commitment Authority are not returned to issuers.
F. Appropriations and Moneys Received from Other HUD Programs
The National Housing Act of 1990, as amended, provides for appropriations from Congress to finance the operations of GI and SRI funds. For Credit Reform loan guarantees, appropriations to the GI and SRI funds are provided at the beginning of each fiscal year to cover estimated losses on insured loans during the year. For pre-Credit Reform loan guarantees, FHA has permanent indefinite appropriation authority to finance any shortages of resources needed for operations.
253
PERFORMANCE AND ACCOUNTABILITY REPORT
Monies received from other HUD programs, such as interest subsidies and rent supplements, are recorded as revenue for the liquidating accounts when services are rendered. Monies received for the financing accounts are recorded as additions to the LLG or the Allowance for Subsidy when collected.
G. Investments
HUD limits its investments, principally comprised of investments by FHA’s MMI/CMHI Fund and by Ginnie Mae, to non-marketable market-based Treasury interest-bearing obligations (i.e., investments not sold in public markets). The market value and interest rates established for such investments are the same as those for similar Treasury issues, which are publicly marketed.
HUD’s investment decisions are limited by Treasury policy which: (1) only allows investment in Treasury notes, bills, and bonds; and (2) prohibits HUD from engaging in practices that result in “windfall” gains and profits, such as security trading and full scale restructuring of portfolios, in order to take advantage of interest rate fluctuations.
FHA's normal policy is to hold investments in U.S. Government securities to maturity. However, in certain circumstances, FHA may have to liquidate its U.S. Government securities before maturity to finance claim payments.
HUD reports investments in U.S. Government securities at amortized cost. Premiums or discounts are amortized into interest income over the term of the investment. HUD intends to hold investments to maturity, unless needed for operations. No provision is made to record unrealized gains or losses on these securities because, in the majority of cases, they are held to maturity.
The Departments of Veterans Affairs and Housing and Urban Development Appropriations Act of 1999 and Section 601 of the Independent Agencies Act of 1999 provide FHA with new flexibility in reforming its single family claims and property disposition activities. In accordance with these Acts, FHA implemented the Accelerated Claims Disposition Demonstration program (the 601 program) to shorten the claim filing process, obtain higher recoveries from its defaulted guaranteed loans, and support the Office of Housing’s mission of keeping homeowners in their home. To achieve these objectives, FHA transfers assigned mortgage notes to private-sector entities in exchange for cash and equity interest. The servicing and disposition of the mortgage notes are performed by the private-sector entities whose primary mission is dedicated to these types of activity.
With the transfer of assigned mortgage notes under the 601 program, FHA obtains ownership interest in the private-sector entities. This level of ownership interest enables FHA to exercise significant influence over the operating and financial policies of the entities. Accordingly, to comply with the requirement of Opinion No. 18 issued by the Accounting Principles Board (APB 18), FHA uses the equity method of accounting to measure the value of its investments in these entities. The equity method of accounting requires FHA to record its investments in the entities at cost initially. Periodically, the carrying amount of the investments is adjusted for cash distributions to FHA and for FHA’s share of the entities’ earnings or losses.
H. Credit Program Receivables and Related Foreclosed Property
HUD finances mortgages and provides loans to support construction and rehabilitation of low rent housing, principally for the elderly and disabled under the Section 202/811 program. Prior
254

SECTION 3: FINANCIAL INFORMATION NOTES TO FINANCIAL STATEMENTS
to April 1996, mortgages were also assigned to HUD through FHA claims settlement (i.e., Mortgage Notes Assigned (MNAs)). Single family mortgages were assigned to FHA when the mortgagor defaulted due to certain “temporary hardship” conditions beyond the control of the mortgagor, and when, in management's judgment, it is likely that the mortgage could be brought current in the future. FHA’s loans receivable include MNAs, also described as Secretary-held notes, and purchase money mortgages (PMM). Under the requirements of the FCRA, PMM notes are considered to be direct loans while MNA notes are considered to be defaulted guaranteed loans. The PMM loans are generated from the sales on credit of FHA’s foreclosed properties to qualified non-profit organizations. The MNA notes are created when FHA pays the lenders for claims on defaulted guaranteed loans and takes assignment of the defaulted loans for direct collections. In addition, multifamily mortgages are assigned to FHA when lenders file mortgage insurance claims for defaulted notes.
Credit program receivables for direct loan programs and defaulted guaranteed loans assigned for direct collection are valued differently based on the direct loan obligation or loan guarantee commitment date. These valuations are in accordance with the Federal Credit Reform Act of 1990 and SFFAS No. 2, “Accounting for Direct Loans and Loan Guarantees,” as amended by SFFAS No. 18. Those obligated or committed on or after October 1, 1991 (post-Credit Reform) are valued at the net present value of expected cash flows from the related receivables.
Credit program receivables resulting from obligations or commitments prior to October 1, 1991 (pre-Credit Reform) are recorded at the lower of cost or fair value (net realizable value). Fair value is estimated based on the prevailing market interest rates at the date of mortgage assignment. When fair value is less than cost, discounts are recorded and amortized to interest income over the remaining terms of the mortgages or upon sale of the mortgages. Interest is recognized as income when earned. However, when full collection of principal is considered doubtful, the accrual of interest income is suspended and receipts (both interest and principal) are recorded as collections of principal. Pre-Credit Reform loans are reported net of allowance for loss and any unamortized discount. The estimate for the allowance on credit program receivables is based on historical loss rates and recovery rates resulting from asset sales and property recovery rates, net of cost of sales.
Foreclosed property acquired as a result of defaults of loans obligated or loan guarantees committed on or after October 1, 1991, is valued at the net present value of the projected cash flows associated with the property. Foreclosed property acquired as a result in defaulted loans obligated or loan guarantees committed prior to 1992 is valued at net realizable value. The estimate for the allowance for loss related to the net realizable value of foreclosed property is based on historical loss rates and recovery rates resulting from property sales, net of cost of sales.
I. Borrowings
As further discussed in Note 11, several of HUD’s programs have the authority to borrow funds from the U.S. Treasury for program operations. These borrowings, representing unpaid principal balances and future accrued interest is reported as debt in HUD’s consolidated financial statements. The PIH Low Rent Public Housing Loan Program and the Housing for the Elderly or Handicapped fund were financed through borrowings from the Federal Financing Bank or the U.S. Treasury prior to the Department’s conversion of these programs to grant programs. The Department also borrowed funds from the private sector to assist in the construction and
255

PERFORMANCE AND ACCOUNTABILITY REPORT
rehabilitation of low rent housing projects under the PIH Low Rent Public Housing Loan Program. Repayments of these long-term borrowings have terms up to 40 years.
In accordance with Credit Reform accounting, FHA also borrows from the U.S. Treasury when cash is needed in its financing accounts. Usually, the need for cash arises when FHA has to transfer the negative credit subsidy amount related to new loan disbursements, and existing loan modifications from the financing accounts to the general fund receipts account (for cases in GI/SRI funds) or the liquidating account (for cases in MMI/CMHI funds). In some instances, borrowings are also needed to transfer the credit subsidy related to downward reestimates from the GI/SRI financing account to the GI/SRI receipt account or when available cash is less than claim payments due.
J. Liability for Loan Guarantees
The potential future losses related to FHA’s central business of providing mortgage insurance are accounted for as Loan Guarantee Liability in the consolidated balance sheets. As required by SFFAS No. 2, the Loan Guarantee Liability includes the Credit Reform related Liabilities for Loan Guarantees (LLG) and the Loan Loss Reserve (LLR).
HUD records its loan loss reserves for its mortgage insurance programs operated through FHA and its financial guaranty programs operated by Ginnie Mae. FHA loss reserves are recorded for the net present value of estimated future cash flows associated with FHA-insured mortgage loans endorsed before fiscal year 1992. Ginnie Mae establishes reserves for actual and probable defaults of issuers of Ginnie Mae-guaranteed mortgage-backed securities. Such reserves disclosed in the consolidated financial statements are based on management's judgment about historical claim and loss information and current and projected economic factors.
K. Full Cost Reporting
The LLG and LLR are calculated as the present value of anticipated cash outflows for defaults, such as claim payments, premium refunds, property expense for on-hand properties and sale expense for sold properties, less anticipated cash inflows such as premium receipts, proceeds from asset sales and principal and interest on Secretary-held notes acquired from FHA’s claim settlements of defaulted mortgages or pursuant to Section 221 (g)(4) of the National Housing Act.
Beginning in fiscal 1998, SFFAS No. 4 required that full costing of program outputs be included in Federal agency financial statements. Full cost reporting includes direct, indirect, and inter-entity costs. For purposes of the consolidated department financial statements, HUD identified each responsible segment’s share of the program costs or resources provided by HUD or other Federal agencies. These costs are treated as imputed cost for the Statement of Net Cost, and imputed financing for the Statement of Changes in Net Position and the Statement of Financing.
L. Accrued Unfunded Leave and Federal Employees Compensation Act (FECA) Liabilities
Annual leave and compensatory time are accrued as earned and the liability is reduced as leave is taken. The liability at year-end reflects cumulative leave earned but not taken, priced at current wage rates. Earned leave deferred to future periods is to be funded by future appropriations. HUD offsets this unfunded liability by recording future financing sources in the Net Position section of its Consolidated Balance Sheet. Sick leave and other types of leave are expensed as taken.
256

SECTION 3: FINANCIAL INFORMATION NOTES TO FINANCIAL STATEMENTS
HUD also accrues the portion of the estimated liability for disability benefits assigned to the agency under the Federal Employee Compensation Act (FECA), administered and determined by the Department of Labor (DOL). The liability, based on the net present value of estimated future payments based on a study conducted by DOL, was $80 million as of September 30, 2006 and $82 million as of September 30, 2005. Future payments on this liability are to be funded by future appropriations. HUD offsets this unfunded liability by recording future financing sources.
M. Retirement Plans
The majority of HUD’s employees participate in either the Civil Service Retirement System (CSRS) or the Federal Employees Retirement System (FERS). FERS went into effect pursuant to Public Law 99-335 on January 1, 1987. Most employees hired after December 31, 1983, are automatically covered by FERS and Social Security. Employees hired before January 1, 1984, can elect to either join FERS and Social Security or remain in CSRS. HUD expenses its contributions to the retirement plans.
A primary feature of FERS is that it offers a savings plan whereby HUD automatically contributes 1 percent of pay and matches any employee contribution up to 5 percent of an individual’s basic pay. Under CSRS, employees can contribute up to $15,000 of their pay to the savings plan, but there is no corresponding matching by HUD. Although HUD funds a portion of the benefits under FERS relating to its employees and makes the necessary withholdings from them, it has no liability for future payments to employees under these plans, nor does it report CSRS, FERS, or FECA assets, accumulated plan benefits, or unfunded liabilities applicable to its employees retirement plans. These amounts are reported by the Office of Personnel Management (OPM) and are not allocated to the individual employers. HUD’s matching contribution to these retirement plans during fiscal 2006 and 2005 was $81 million and $79 million, respectively.
N. Loss Reserves
HUD records loss reserves for its mortgage insurance programs operated through FHA and its financial guaranty programs operated by Ginnie Mae. FHA loss reserves are recorded for the net present value of estimated future cash flows associated with FHA-insured mortgage loans endorsed before fiscal year 1992. Ginnie Mae establishes reserves for actual and probable defaults of issuers of Ginnie Mae-guaranteed mortgage-backed securities; such reserves are based on management's judgment about historical claim and loss information and current and projected economic factors.
O. Financial Accounting Standards Board Interpretation No. 45, Guarantor’s Accounting and Disclosure Requirements for Guarantees
The Financial Accounting Standards Board (FASB) issued FASB Interpretation No. 45 (FIN 45), Guarantor's Accounting and Disclosure Requirements for Guarantees, Including Indirect Guarantees of Indebtedness of Others, an interpretation of FASB Statements No. 5, 57, and 107, and Rescission of FASB Interpretation No. 34, in November 2002. During 2006, Ginnie Mae changed its methodology for applying FIN 45. This methodology was adopted because management believes it will result in a more systematic approach to the calculation resulting in a more relevant financial presentation. No current period or prior period adjustments were required but future calculations are expected to vary as a result of this adoption. Ginnie Mae has completed an evaluation of its guarantees for disclosures required by FIN 45, and have disclosed
257

PERFORMANCE AND ACCOUNTABILITY REPORT
an asset and liability of $363.7 as of September 30, 2006, and $382.3 million as of September 30, 2005 (i.e., Other Assets and Other Liabilities).
P. Penalty Due to Treasury
NOTE 4 – FUND BALANCE WITH THE U.S. TREASURY
A $50 million penalty was paid by Fannie Mae as part of a settlement with OFHEO regarding Fannie Mae's accounting improprieties uncovered in a special examination. Fannie Mae paid a total penalty of $400 million of which $50 million was directed to OFHEO and $350 million directed to the SEC. The $50 million collected by OFHEO is not for OFHEO's use. A liability Due to Treasury is reported by OFHEO at year-end for the amount of the penalty collected.
OFHEO also collects fees for services provided in response to FOIA requests. These fees also are not available for OFHEO’s use. A liability Due to Treasury is reported by OFHEO at year-end for the amount of fees collected.
NOTE 3 – ENTITY AND NON-ENTITY ASSETS
Non-entity assets consist of assets that belong to other entities but are included in the Department’s consolidated financial statements and are offset by various liabilities to accurately reflect HUD’s net position. The Department’s non-entity assets principally consist of: (1) U.S. deposit of negative credit subsidy in the GI/SRI general fund receipt account, (2) escrow monies collected by FHA that are either deposited at the U.S Treasury, Minority-Owned banks or invested in U.S. Treasury securities, and (3) cash remittances from Section 8 bond refundings deposited in the General Fund of the Treasury.
HUD’s assets as of September 30, 2006 and 2005, were as follows (dollars in millions):
Description 2006 2005Entity Non-Entity Total Entity Non-Entity Total
Intragovernmental Fund Balance with Treasury (Note 4) 80,545$ 850$ 81,395$ 66,118$ 1,382$ 67,500$ Investments (Note 5) 30,421 5 30,426 30,711 4 30,715 Other Assets (Note 9) 26 - 26 28 - 28 Total Intragovernmental Assets 110,992$ 855$ 111,847$ 96,857$ 1,386$ 98,243$ Investments (Note 5) 98 98 201 201 Accounts Receivable (net) (Note 6) 287 76 363 553 93 646 Loan Receivables and Related Foreclosed Property (net) (Note 7) 10,045 - 10,045 10,818 - 10,818 General Property, Plant, and Equipment (net) (Note8) 176 - 176 141 - 141 Other Assets (Note 9) 423 111 534 425 95 520 Total Assets 122,021$ 1,042$ 123,063$ 108,995$ 1,574$ 110,569$
The U.S. Treasury, which, in effect, maintains HUD’s bank accounts, processes substantially all of HUD’s receipts and disbursements. HUD’s fund balances with the U.S. Treasury as of September 30, 2006 and 2005, were as follows (dollars in millions):
258

SECTION 3: FINANCIAL INFORMATION NOTES TO FINANCIAL STATEMENTS
Description 2006 2005
Revolving Funds 14,062$ 12,410$ Appropriated Funds 66,442 53,723 Trust Funds 5 5 Other 886 1,362 Total - Fund Balance 81,395$ 67,500$
The Department’s Fund Balance with Treasury includes receipt accounts established under current Federal Credit Reform legislation and cash collections deposited in restricted accounts that cannot be used by HUD for its programmatic needs. These designated funds established by the Department of Treasury are classified as suspense and/or deposit funds and consist of accounts receivable balances due from the public. A Statement of Budgetary Resources is not prepared for these funds since any cash remittances received by the Department are not defined as a budgetary resource.
In addition to fund balance, contract and investment authority are also a part of HUD’s funding sources. Contract authority permits an agency to incur obligations in advance of an appropriation, offsetting collections, or receipts to make outlays to liquidate the obligations. HUD has permanent indefinite contract authority. Since federal securities are considered the equivalent of cash for budget purposes, investments in them are treated as a change in the mix of assets held, rather than as a purchase of assets.
A primary reason for the increase in HUD’s fund balance with Treasury is appropriations received for hurricane disaster relief efforts as further explained in Note 24.
259

PERFORMANCE AND ACCOUNTABILITY REPORT
HUD’s fund balances with U.S. Treasury as reflected in the entity’s general ledger as of September 30, 2006, were as follows (dollars in millions):
Status of Resources
DescriptionUnobligated Available
Unobligated Unavailable
Obligated Not Yet
Disbursed
Unfilled Customer Orders
Status of Total
Resources Fund BalanceOther
AuthorityTotal
Resources
FHA 2,292$ 27,130$ 2,357$ (5)$ 31,774$ 9,891$ 21,883$ 31,774$ GNMA - 12,442 109 (80) 12,471 4,056 8,415 12,471 Section 8 Rental Assistance 1,087 1,156 16,986 19,229 8,489 10,740 19,229 CDBG 6,237 28 21,413 27,678 27,678 - 27,678 HOME 268 2 5,551 5,821 5,821 - 5,821 Operating Subsidies 1 1 940 942 943 # - 1,885 Public Housing Loans and Grants 405 11 9,610 10,026 8,444 1,582 10,026 Section 202/811 1,157 84 5,385 6,626 6,626 - 6,626 Section 235/236 31 936 5,799 6,766 434 6,332 6,766 All Other 2,084 344 5,835 (30) 8,233 8,223 10 8,233
Total 13,562$ 42,134$ 73,985$ (115)$ 129,566$ 80,605$ 48,962$ 130,509$
Status of Resources Covered by Fund Balance
DescriptionUnobligated Available
Unobligated Unavailable
Obligated Not Yet
Disbursed
Unfilled Customer Orders
Fund Balance
Total Fund Balance
FHA 2,292$ 5,247$ 2,357$ (5)$ 9,891$ 677$ 10,568$ GNMA - 4,028 109 -80 4,057 - 4,057 Section 8 Rental Assistance 834 79 7,576 8,489 12 8,501 CDBG 6,237 28 21,413 27,678 - 27,678 HOME 268 2 5,551 5,821 - 5,821 Operating Subsidies 1 1 940 942 - 942 Public Housing Loans and Grants 405 11 8,028 8,444 - 8,444 Section 202/811 1,157 84 5,385 6,626 - 6,626 Section 235/236 1 3 430 434 - 434 All Other 2,084 336 5,833 (30) 8,223 101 8,324 Total 13,279$ 9,819$ 57,622$ (115)$ 80,605$ 790$ 81,395$
Status of Resources Covered by Other Authority
DescriptionUnobligated Available
Unobligated Unavailable
Obligated Not Yet
Disbursed
Unfilled Customer Orders
Permanent Indefinite Authority
Investment Authority
FHA 21,883$ 21,883$ GNMA 8,415 8,415 Section 8 Rental Assistance 253$ 1,076 9,411$ 10,740$ Public Housing Loans and Grants - - 1,582 1,582 Section 235/236 30 932 5,370 6,332 All Other - 9 1 10 Total 283$ 32,315$ 16,364$ -$ 18,664$ 30,298$
Non-Bugdetary: Suspense, Deposit and
Receipt Accounts
260

SECTION 3: FINANCIAL INFORMATION NOTES TO FINANCIAL STATEMENTS
261
HUD’s fund balances with U.S. Treasury as reflected in the entity’s general ledger as of September 30, 2005, were as follows (dollars in millions):
Status of Resources
DescriptionUnobligated Available
Unobligated Unavailable
Obligated Not Yet
Disbursed
Unfilled Customer Orders
Status of Total
Resources Fund BalanceOther
AuthorityTotal
Resources
FHA 2,726$ 26,766$ 2,330$ (313)$ 31,509$ 9,231$ 22,278$ 31,509$ GNMA - 11,579 121 (78) 11,622 3,711 7,911 11,622 Section 8 Rental Assistance 2,035 76 21,819 23,930 10,689 13,241 23,930 CDBG 1,183 36 10,659 11,878 11,878 11,878 HOME 318 - 5,557 5,875 5,875 5,875 Operating Subsidies - 2 873 875 875 875 Public Housing Loans and Grants 384 17 10,421 10,822 8,683 2,139 10,822 Section 202/811 1,320 17 5,530 6,867 6,867 - 6,867 Section 235/236 257 240 6,818 7,315 367 6,948 7,315 All Other 2,162 276 6,367 (27) 8,778 8,761 17 8,778
Total 10,385$ 39,009$ 70,495$ (418)$ 119,471$ 66,937$ 52,534$ 119,471$
Status of Resources Covered by Fund Balance
DescriptionUnobligated Available
Unobligated Unavailable
Obligated Not Yet
Disbursed
Unfilled Customer Orders
Fund Balance
Total Fund Balance
FHA 2,726$ 4,488$ 2,330$ (313)$ 9,231$ 474$ 9,705$ GNMA - 3,668 121 (78) 3,711 - 3,711 Section 8 Rental Assistance 697 - 9,992 10,689 12 10,701 CDBG 1,183 36 10,659 11,878 11,878 HOME 318 - 5,557 5,875 5,875 Operating Subsidies - 2 873 875 875 Public Housing Loans and Grants 384 17 8,282 8,683 - 8,683 Section 202/811 1,320 17 5,530 6,867 6,867 Section 235/236 1 10 356 367 - 367 All Other 2,162 270 6,356 (27) 8,761 77 8,838 Total 8,791$ 8,508$ 50,056$ (418)$ 66,937$ 563$ 67,500$
Status of Resources Covered by Other Authority
DescriptionUnobligated Available
Unobligated Unavailable
Obligated Not Yet
Disbursed
Unfilled Customer Orders
Permanent Indefinite Authority
Investment Authority
FHA - 22,278$ - - 22,278$ GNMA - 7,911 - - 7,911 Section 8 Rental Assistance 1,338$ 76 11,827$ - 13,241$ ublic Housing Loans and Grants
P - - 2,139 - 2,139
22,345$ 30,189$
Section 235/236 256 230 6,462 - 6,948 All Other - 6 11 - 17 Total 1,594$ 30,501$ 20,439$ -$
Non-Budgetary Funds (Suspense, Deposit and
Receipt Accounts)

PERFORMANCE AND ACCOUNTABILITY REPORT
An immaterial difference exists between HUD’s recorded Fund Balances with the U.S. Treasury and the U.S. Department of Treasury’s records. It is the Department’s practice to adjust its records to agree with Treasury’s balances at the end of the fiscal year. The adjustments are reversed at the beginning of the following fiscal year.
NOTE 5 - INVESTMENTS
The U.S. Government securities are non-marketable intra-governmental securities. Interest rates are established by the U.S. Treasury and during fiscal year 2006 ranged from 0.88 percent to 7.25 percent. During fiscal year 2005 interest rates ranged from 0.88 percent to 13.88 percent. The amortized cost and estimated market value of investments in debt securities as of September 30, 2006 and 2005, were as follows (dollars in millions):
Beginning Balance New Acquisitions
Share of Earnings or Losses
Return of Investments Other Adjustments
Ending Balance
FY 2006 201$ 49$ 15$ (167)$ -$ 98$ FY 2005 122$ 252$ 58$ (231)$ -$ 201$
Cost Par Value
Unamortized Premium
(Discount) Accrued Interest Net InvestmentsUnamortized
Gain Market Value
FY 2006 30,079$ 30,421$ (250)$ 255$ 30,426$ (19)$ 30,407$ FY 2005 30,406$ 30,595$ (189)$ 309$ 30,715$ 511$ 31,226$
Investments in Private-Sector Entities
These investments in private-sector entities are the result of FHA’s participation in the Accelerated Claims Disposition Demonstration program in fiscal years 2006 and 2005 as discussed in Note 2G. The following table presents financial data on FHA’s investments in private-sector entities as of September 30, 2006 and 2005 (dollars in millions):
262

SECTION 3: FINANCIAL INFORMATION NOTES TO FINANCIAL STATEMENTS
The condensed, audited financial information related to these private-sector entities as of
cash HA
e for loss is established for all delinquent accounts 90 days and over.
Section 8 Settlements
Prior to January 1, 2005, the Housing Choice Voucher (HCV) Program’s Section 8 subsidies were disbursed based on estimated amounts due under the contracts. At the end of each year, the actual amount due under the contracts was determined. The excess of subsidies paid to PHAs during the year over the actual amount due was reflected as an accounts receivable in the balance sheet. These receivable amounts were “collected” by offsetting such amounts with subsidies due
the PHAs in subsequent periods. On January 1, 2005, Congress changed the basis of the rogram funding from a “unit-based” process with program variables that affected the total
annual Federal funding need, to a “budget-based” process that limits the Federal funding to PHAs to a fixed amount. Under this “budget-based” process, HUD records an expense for the HCV Program when each monthly allocation of program funds is added to the PHAs letter-of-credit for drawdown and the PHA records a corresponding revenue on its books. A year end settlement process to determine actual amounts due is no longer applicable
Bond Refundings
Many of the Section 8 projects constructed in the late 1970s and early 1980s were financed with tax exempt bonds with maturities ranging from 20 to 40 years. The related Section 8 contracts provided that the subsidies would be based on the difference between what tenants could pay pursuant to a formula, and the total operating costs of the Section 8 project, including debt service. The high interest rates during the construction period resulted in high subsidies. When interest rates came down in the 1980s, HUD was interested in getting the bonds refunded. One
December 31, 2005, and for the period from inception to December 31, 2004, is summarized below (dollars in millions):
2005 2004
Total assets, primarily mortgage loans 422$ 499$
Liabilities 3$ 3$
Partners' capital 419 496
Total liabilities and partners's capital 422$ 499$
Revenues 184$ 235$ Expenses (20) (31) Net Income 164$ 204$
NOTE 6 - ACCOUNTS RECEIVABLE
The department’s accounts receivable represents Section 8 year-end settlements, claims tofrom the public and state and local authorities for bond refundings, sustained audit findings, Finsurance premiums and foreclosed property proceeds. A 100 percent allowanc
top
263

PERFORMANCE AND ACCOUNTABILITY REPORT
method used to account for the savings when bonds are refunded (PHA’s sell a new series of bonds at a lower interest rate, to liquidate the original bonds), is to continue to pay the original amount of the bond debt service to a trustee. The amounts paid in excess of the lower “refunded” debt service and any related financing costs, are considered savings. One-half of these savings are provided to the PHA, the remaining half is returned to HUD. As of September 30, 2006 and 2005, HUD was due $71 million and $90 million, respectively.
Other Receivables
Other receivables include sustained audit findings, refunds of overpayment, FHA insurance premiums and foreclosed property proceeds due from the public.
The following shows accounts receivable as reflected in the Balance Sheet as of September 30, 2006 and 2005, as follows (dollars in millions):
NOTE 7 - DIRECT LOANS AND LOAN GUARANTEES, NON-FEDERAL BORROWERS
HUD reports direct loan obligations or loan guarantee commitments made prior to fiscal 1992 and the resulting direct loans or defaulted guaranteed loans, net of allowance for estimated uncollectable loans or estimated losses.
Direct loan obligations or loan guarantee commitments made after fiscal 1991, and the resulting direct loans or defaulted guaranteed loans, are governed by the Federal Credit Reform Act of 1990 and are recorded as the net present value of the associated cash flows (i.e. interest rate differential, interest subsidies, estimated delinquencies and defaults, fee offsets, and other cash flows). The following is an analysis of loan receivables, loan guarantees, liability for loan guarantees, and the nature and amounts of the subsidy costs associated with the loans and loan guarantees for fiscal 2006 and 2005 were as follows:
y Conversion Mortgage (HECM), the FHA insured reverse mortgage, is used
e
insurance–in-force, FHA estimates a liability of $123 million for the HECM program.
FY 2006 FY 2005
D escription
Gross A ccounts
ReceivableA llow ance
for Loss Tota l
Gross A ccounts
ReceivableA llow ance
for Loss Tota l
Sec tion 8 Settlements 76$ - 76$ 220$ - 220$ Bond Refundings 81 $ O ther Rece ivables:
(10) 71 101 (11)$ 90
FH A P remiums 51 - 51 119 - 119 O ther Receivables 248 (83) 165 300 (83) 217 Tota l 456$ (93)$ 363$ 740$ (94)$ 646$
GI/SRI Home Equitby senior homeowners age 62 and older to convert the equity in their home into monthly streams of income and/or a line of credit to be repaid when they no longer occupy the home. Unlike ordinary home equity loans, a HUD reverse mortgage does not require repayment as long as thhome is the borrower's principal residence. Based on the projected cash flows for all active
264

SECTION 3: FINANCIAL INFORMATION NOTES TO FINANCIAL STATEMENTS
Since the inception of the program, FHA has insured 237,586 HECM loans with a maximum claim amount of $44 billion. Of these 237,586 HECM loans insured by FHA, 177,485 loans witha maximum claim amount of $36 billion are still active. As of the end of fiscal year 2006 the insurance in force of these active loans was $18 billion. The insurance in force for FHA is the outstanding balance on the active loans. The insurance in force includes balance drawnmortgagee; interest accrued on the balance drawn, service charges, and mortgage insurance premium. The maximum claim amount is the dollar ceiling to which the outstanding loan balance can grow before being assigned to FHA.
by the
irect Loan and/or Loan Guarantee Programs:
4. All Other
a) Revolving Fund
b) Flexible Subsidy
c) CDBG, Section 108(b)
d) Indian Housing Loan Guarantee Fund
e) Loan Guarantee Recovery Fund
f) Native Hawaiian Housing Loan Guarantee Fund
g) Title VI Indian Housing Loan Guarantee Fund
A. List of HUD’s D
1. FHA
2. Housing for the Elderly and Disabled
3. Low Rent Public Housing Loan Fund
265

PERFORMANCE AND ACCOUNTABILITY REPORT
B. Direct Loans Obligated Prior to FY 1992 (Allowance for Loss Method) (dollars in millions):
C. Dir ons):
Direct Loan Programs
ect Loans Obligated After FY 1991(dollars in milli
Loans Receivable,
GrossInterest
Receivable
Allowance for Subsidy Cost
(Present Value)Foreclosed Property
Value of Assets Related to Direct
Loans
FHA 1 - (4)$ - (3)$
Direct Loan Programs
Loans Receivable,
GrossInterest
Receivable
Allowance for Subsidy Cost
(Present Value)Foreclosed Property
Value of Assets Related to Direct
Loans
FHA 1 - (3)$ - (2)$
2006
2005
Direct Loan ProgramsLoans Receivable,
Gross Interest ReceivableAllowance for Loan
Losses Foreclosed PropertyValue of Assets Rel
to Direct Loans
FHA 17$ 3$ (7)$ - $ Housing for Elderly and Disabled 5,520 62 (22) 1$ Low Rent Public Housing Loans 1
ated
13 5,561
- - - 1 2 200 3 5,775$
Dire
All Other 675 11 (488) Total 6,213$ 76$ (517)$ $
ct Loan ProgramsLoans Receivable,
Gross Interest ReceivableAllowance for Loan
Losses Foreclosed PropertyValue of Assets Related
to Direct Loans
FHA 17 3$ (7)$ - 13$ Housing for 6,502 70 (19) 7$ 6,560 Low Rent P 1 - - - 1 All Other 6 (502) 2 200 Total 79 (528)$ 9$ 6,774$
2005
$ Elderly and Disabled ublic Housing Loans
694 7,214$ $
2006
266

SECTION 3: FINANCIAL INFORMATION NOTES TO FINANCIAL STATEMENTS
D. Defaulted Guaranteed Loans from Pre-1992 Guarantees (Allowance for Loss Method)(dollars in millions):
2006
Defaulted Guaranteed Loans Receivable, Gross Interest Receivable
Allowance for Loan and Interest Losses
Foreclosed Property, Net
Defaulted Guaranteed Loans Receivable, Net
FHA 2,978$ 135$ (819)$ 14$ 2,308$
Defaulted Guaranteed Loans Receivable, Gross Interest Receivable
Allowance for Loan and Interest Losses
Foreclosed Property, Net
Defaulted Guaranteed Loans Receivable, Net
FHA 2,973$ 140$ (847)$ 25$ 2,291$
2006
2005
E. Defaulted Guaranteed Loans From Post-FY 1991 Guarantees (dollars in millions):
Defaulted Guaranteed
Loans Receivable, Interest
Allowance for Subsidy Cost Foreclosed
rty, Gross
Value of Assets Related to Defaulted
Guaranteed Loans
FHA 917$ $ 48 $ (1,889) $ 2,888 $ 1,964
Defaulted Guaranteed
Loans Receivable,
GrossInterest
Receivable
Allowance for Subsidy Cost
(Present Value)Foreclosed
Property, Gross
Value of Assets Related to Defaulted
Guaranteed Loans
FHA 998$ $ 61 $ (2,096) $ 2,792 $ 1,755
2006
2005
Gross Receivable (Present Value) Prope
2005Total Credit Program Receivables and Related Foreclosed Property, Net $10,045 $10,818
267
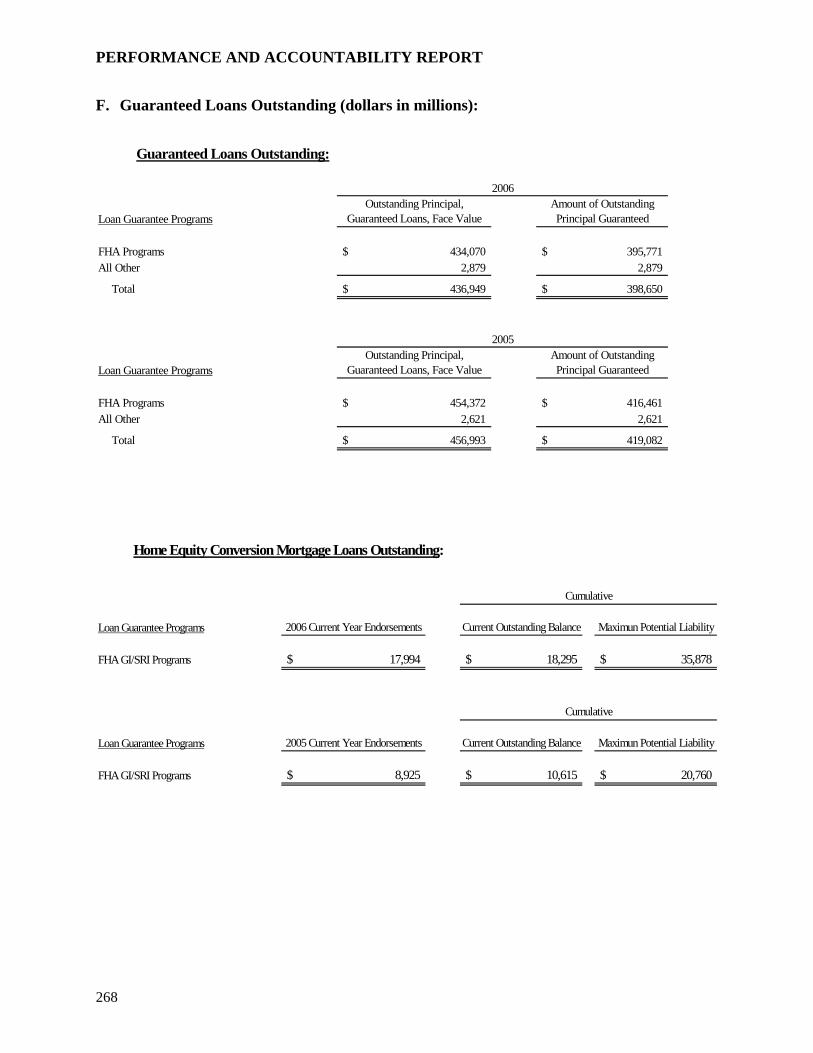
PERFORMANCE AND ACCOUNTABILITY REPORT
F. Guaranteed Loans Outstanding (dollars in millions):
Loan Guarantee ProgramsOutstanding Principal,
Guaranteed Loans, Face ValueAmount of Outstanding Principal Guaranteed
FHA Programs 434,070$ 395,771$ All Other 2,879 2,879
Total 436,949$ 398,650$
Loan Guarantee ProgramsOutstanding Principal,
Guaranteed Loans, Face ValueAmount of Outstanding Principal Guaranteed
FHA Programs 454,372$ 416,461$ All Other 2,621 2,621
Total 456,993$ 419,082$
2006
2005
Guaranteed Loans Outstanding:
Loan Guarantee Programs 2006 Current Year Endorsements Current Outstanding Balance Maximun Potential Liability
FHA GI/SRI Programs 17,994$ 18,295$ 35,878$
Loan Guarantee Programs 2005 Current Year Endorsements Current Outstanding Balance Maximun Potential Liability
FHA GI/SRI Programs 8,925$ 10,615$ 20,760$
Home Equity Conversion Mortgage Loans Outstanding:
Cumulative
Cumulative
268
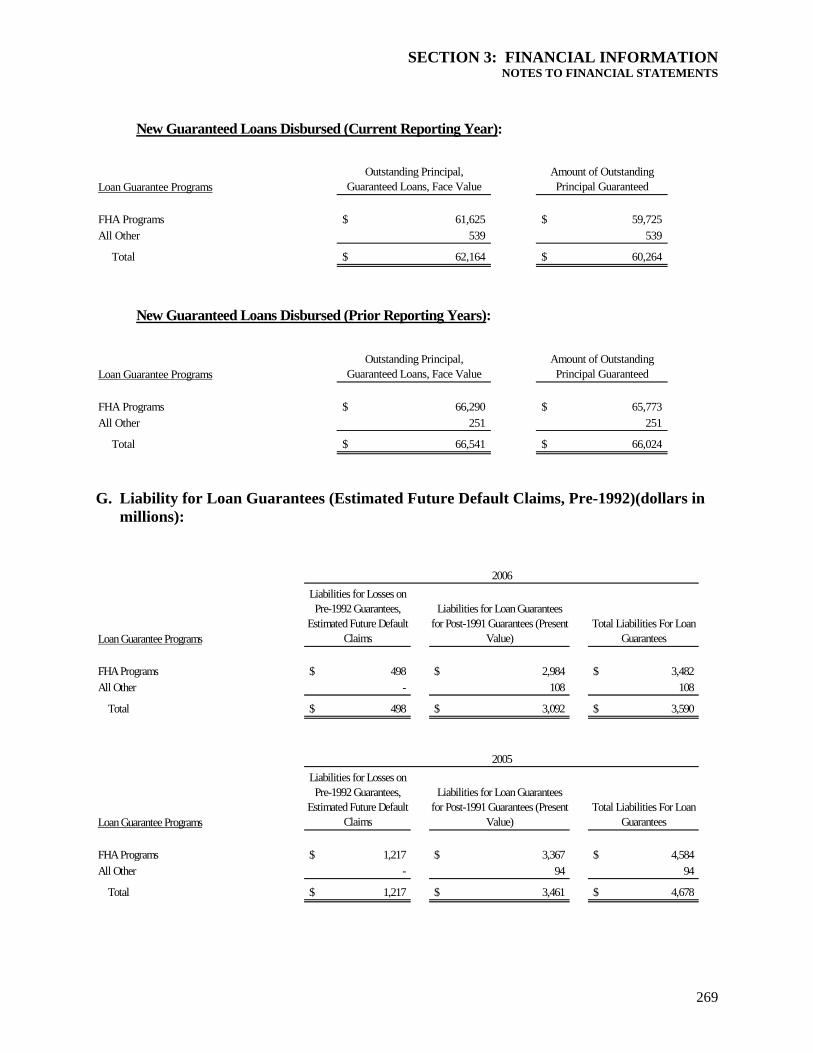
SECTION 3: FINANCIAL INFORMATION NOTES TO FINANCIAL STATEMENTS
G. Liability for Loan Guarantees (Estimated Future Default Claims, Pre-1992)(dollars in
millions):
Loan Guarantee Programs
New Guaranteed Loans Disbursed (Current Reporting Year):
Outstanding Principal, Guaranteed Loans, Face Value
Amount of Outstanding Principal Guaranteed
FHA Programs 61,625$ 59,725$ All Other 539 539
Total 62,164$ 60,264$
Loan Guarantee ProgramsOutstanding Principal,
Guaranteed Loans, Face ValueAmount of Outstanding Principal Guaranteed
FHA Programs 66,290$ 65,773$ All Other 251 251
Total 66,541$ 66,024$
New Guaranteed Loans Disbursed (Prior Reporting Years):
Loan Guarantee Programs
Liabilities for Losses on Pre-1992 Guarantees,
Estimated Future Default Claims
Liabilities for Loan Guarantees for Post-1991 Guarantees (Present
Value)Total Liabilities For Loan
Guarantees
FHA Programs 498$ 2,984$ 3,482$ All Other - 108 108
Total 498$ 3,092$ 3,590$
oan Guarantee ProgramsL
Liabilities for Losses on Pre-1992 Guarantees,
Estimated Future Default Claims
Liabilities for Loan Guarantees for Post-1991 Guarantees (Present
Value)Total Liabilities For Loan
Guarantees
HA Programs 1,217$ 3,367$ 4,584$ All Other - 94 94
Total 1,217$ 3,461$ 4,678$
2006
2005
F
269
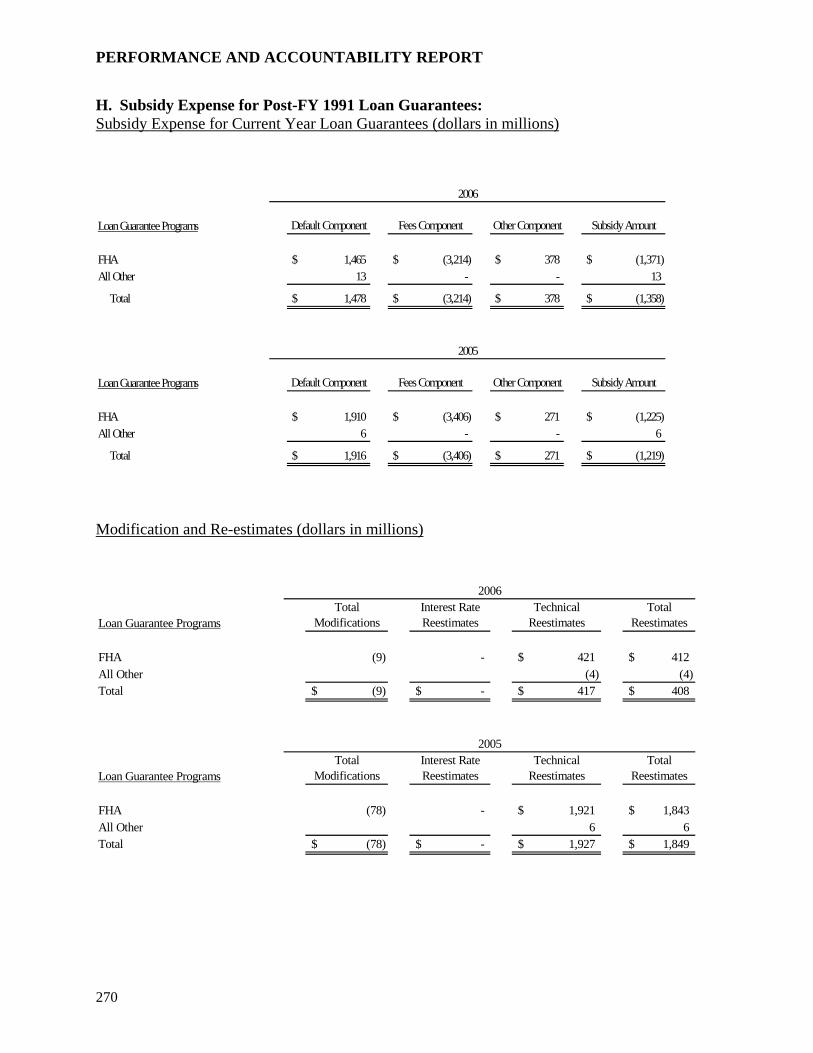
PERFORMANCE AND ACCOUNTABILITY REPORT
H. Subsidy Expense for Post-FY 1991 Loan Guarantees: Subsidy Expense for Current Year Loan Guarantees (dollars in millions)
od ates (dollars in millions)
Loan Guarantee Programs Default Component Fees Component Other Component Subsidy Amount
FHA 1,465$ (3,214)$ 378$ (1,371)$ All Other 13 - - 13
Total 1,478$ (3,214)$ 378$ (1,358)$
Loan Guarantee Programs Default Component Fees Component Other Component Subsidy Amount
FHA 1,910$ (3,406)$ 271$ (1,225)$ All Other 6 - - 6
Total 1,916$ (3,406)$ 271$ (1,219)$
2006
2005
ification and Re-estimM
Loan Guarantee ProgramsTotal
ModificationsInterest Rate Reestimates
Technical Reestimates
Total Reestimates
FHA (9) - 421$ 412$ All Other (4) (4) Total (9)$ -$ 417$ 408$
Loan Guarantee ProgramsTotal
ModificationsInterest Rate Reestimates
Technical Reestimates
Total Reestimates
FHA (78) - 1,921$ 1,843$ All Other 6 6 Total (78)$ -$ 1,927$ 1,849$
2006
2005
270

SECTION 3: FINANCIAL INFORMATION NOTES TO FINANCIAL STATEMENTS
Total Loan Guarantee Subsidy Expense (dollars in millions)
I. Subsidy Rates for Loan Guarantees by Programs and Component: Budget Subsidy Rates for Loans Guarantee for FY 2006
The subsidy rates above pertain only to FY 2006 cohorts. These rates cannot be applied to the guarantees of loans disbursed during the current reporting year to yield the subsidy expense. The subsidy expense for new loan guarantees reported in the current year could result from disbursements of loans from both current year cohorts and prior year(s) cohort. The subsidy expense reported in the current year also includes modifications re-estimates.
Loan Guarantee Programs Current Year Prior YearFHA (959)$ 618$ All Other 9 12 Total (950)$ 630$
Loan Guarantee ProgramInterest Rate Differential Default
Fees and Other Collections Other Total
FHA
FHA 0.00% 1.95% -4.05% 0.36% -1.74%All Other
CDBG, Section 108 (b) 0.00% 2.20% 2.20%
Loan Guarantee Recovery 0.00% 50.00% 50.00%Indian Housing 0.00% 2.42% 2.42%
Natiove Hawaiian Housing 0.00% 2.42% 2.42%
Title VI Indian Housing 0.00% 12.26% 12.26%
271
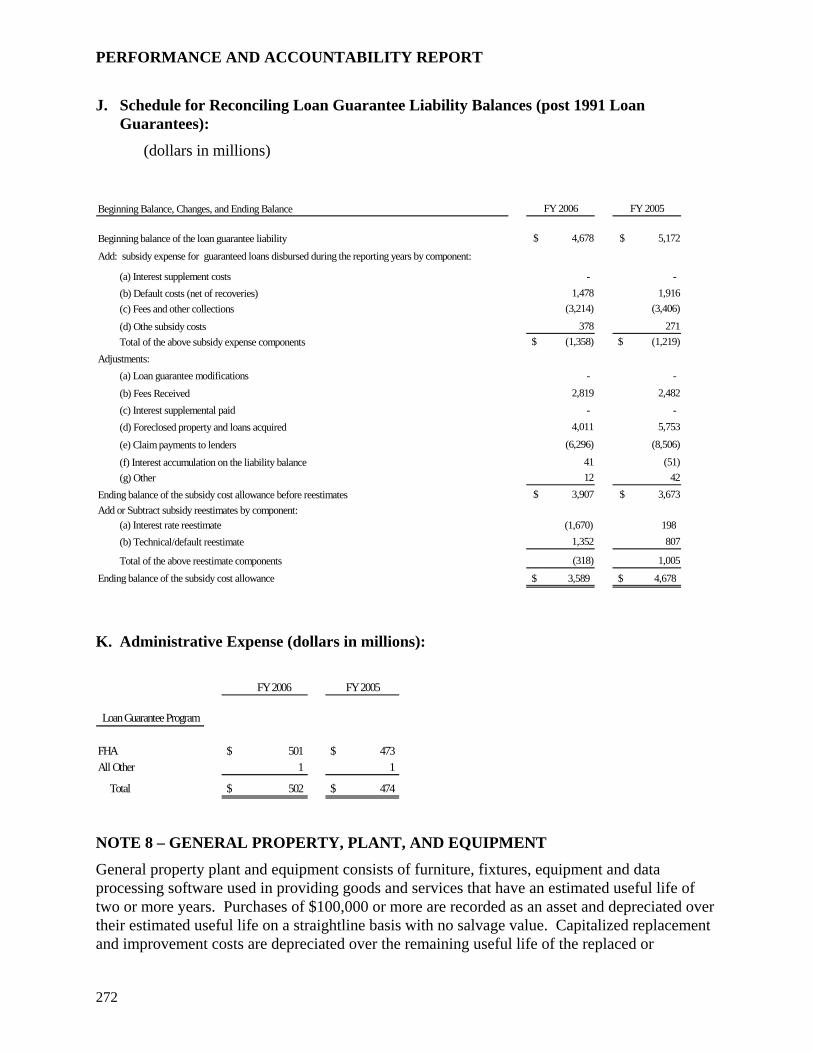
PERFORMANCE AND ACCOUNTABILITY REPORT
J. Schedule for Reconciling Loan Guarantee Liability Balances (post 1991 Loan Guarantees):
(dollars in millions)
NOTE 8 – GENERAL PROPERTY, PLANT, AND EQUIPMENT
General property plant and equipment consists of furniture, fixtures, equipment and data processing software used in providing goods and services that have an estimated useful life of two or more years. Purchases of $100,000 or more are recorded as an asset and depreciated over their estimated useful life on a straightline basis with no salvage value. Capitalized replacement and improvement costs are depreciated over the remaining useful life of the replaced or
4,678 $ 5,172
d:
- - 1,478 1,916
(c) Fees and other collections (3,214) (3,406)
(d) Othe subsidy costs 378 271 Total of the above subsidy expense components $ (1,358) $ (1,219)Adjustments: (a) Loan guarantee modifications - -
(b) Fees Received 2,819 2,482 (c) Interest supplemental paid - - (d) Foreclosed property and loans acquired 4,011 5,753
(e) Claim payments to lenders (6,296) (8,506)
(f) Interest accumulation on the liability balance 41 (51) (g) Other 12 42 Ending balance of the subsidy cost allowance before reestimates $ 3,907 $ 3,673 Add or Subtract subsidy reestimates by component: (a) Interest rate reestimate (1,670) 198 (b) Technical/default reestimate 1,352 807
Total of the above reestimate components (318) 1,005
Beginning Balance, Changes, and Ending Balance FY 2006 FY 2005
B
A
eginning balance of the loan guarantee liability $
d subsidy expense for guaranteed loans disbursed during the reporting years by component:
(a) Interest supplement costs (b) Default costs (net of recoveries)
K. Administrative Expense (dollars in millions):
nding balance of the subsidy cost allowance 3,589$ 4,678$
E
FY 2006 FY 2005
Loan Guarantee Program
FHA 501$ 473$ All Other 1 1
Total 502$ 474$
272

SECTION 3: FINANCIAL INFORMATION NOTES TO FINANCIAL STATEMENTS
improved asset. Generally, the department’s assets are depreciated over a 4-year period be demonstrate
, unless it can d that the estimated useful life is significantly greater than 4 years.
The following shows general property plant and equipment as of September 30, 2006 and 2005, (dollars in millions):
The following shows HUD’s Other Assets as of September 30, 2005 (dollars in millions):
Description FY 2006 FY 2005
Cost
Accum Depr and
AmortizationBook Value Cost
Accum Depr and
AmortizationBook Value
Equipment 31$ (26)$ 5$ 31$ (27)$ 4$ Leasehold Improvements 6 (3) 3 5 (2) 3 Internal Use Software 116 (61) 55 92 (46) 46 Internal Use Software in Development 113 - 113 88 - 88 Total Assets 266$ (90)$ 176$ 216$ (75)$ 141$
NOTE 9 - OTHER ASSETS
The following shows HUD’s Other Assets as of September 30, 2006 (dollars in millions):
Description FHAGinnie Mae
Section 8 Rental
Assistance All Other TotalIntragovernmental Assets: Other Assets - - 26$ 26 Total Intragovernmental Assets - - - 26 26
Mortgagor Reserves for Replacement - Cash 111$ - - - 111$ Advances to the Public 30 - - 2$ 32
Other Assets - 391$ - - 391 391$ - 28$ 560$
Total 141$
Description FHAGinnie Mae
Section 8 Rental
Assistance All Other TotalIntragovernmental Assets: Other Assets - - - 28$ 28 Total Intra ental Assets - - - 28$ 28$
- 95$ 1
4248
governm
Mortgagor Reserves for Replacement - Cash 95$ - - Advances from the Public - - - 1$ Other Assets 2 422$ - - Total 97$ 422$ -$ 29$ 54$
273

PERFORMANCE AND ACCOUNTABILITY REPORT
NOTE 10 – LIABILITIES COVERED AND NOT COVERED BY BUDGETARY RESOURCES
The following shows HUD’s liabilities as of September 30, 2006 and 2005 (dollars in millions):
other liabilities to Accounts Payable in FY 2005.
NOTE 11 - DEBT
Several HUD programs have the authority to borrow funds from the U.S. Treasury for program operations. Additionally, the National Housing Act authorizes FHA, in certain cases, to issue debentures in lieu of cash to pay claims. Also, PHAs and TDHEs borrowed funds from the private sector and from the Federal Financing Bank (FFB) to finance construction and rehabilitation of low rent housing. HUD is repaying these borrowings on behalf of the PHAs and TDHEs.
Description 2006 2005Covered Not-Covered Total Covered Not-Covered Total
Intragovernmental Debt 7,249$ -$ 7,249 8,922$ -$ 8,922$ Other Intragovernmental Liabilities 2,602 68 2,670 977 18 995 Total Intragovernmental Liabilities 9,851$ 68$ 9,919$ 9,899$ 18$ 9,917$ Accounts Payable 757 - 757 847 - 847 Liabilities for Loan Guarantees 3,589 - 3,589 4,678 - 4,678 Debt 1,252 - 1,252 1,542 - 1,542 Federal Employee and Veterans' Benefits - 80 80 - 82 82 Loss Reserves 534 - 534 539 - 539 Other Liabilities 1,111 81 1,192 941 73 1,014 Total Liabilities 17,094$ 229$ 17,323$ 18,446$ 173$ 18,619$
Although not material to merit restatement of FY 2005, OFHEO reclassified $3 million from
274

SECTION 3: FINANCIAL INFORMATION NOTES TO FINANCIAL STATEMENTS
The following shows HUD borrowings, and borrowings by PHAs/TDHEs for which HUD is responsible for repayment, as of September 30, 2006 (dollars in millions):
Description Beginning Balance Net Borrowings Ending Balance
Agency Debt: Held by Government Accounts 1,090$ (99)$ 991$ Held by the Public 1,542 (290) 1,252 Total Agency Debt 2,632$ (389)$ 2,243$
7,832$ (1,574)$ 6,258$
Total Debt 10,464$ (1,963)$ 8,501$
Classification of Debt: Intragovernmental Debt 7,249$ Debt held by the Public 1,252
Total Debt 8,501$
Other Debt: Debt to the U.S. Treasury 7,832$ (1,574)$ 6,258$ Total Other Debt
The following shows HUD borrowings, and borrowings by PHAs/TDHEs for which HUD is responsible for repayment, as of September 30, 2005 (dollars in millions):
Description Beginning Balance Net Borrowings Ending Balance
Agency Debt: Held by Government Accounts 1,183$ (93)$ 1,090$ Held by the Public 1,858 (316) 1,542
8,919$ (1,087)$ 7,832$
the Public 1,542
Total Debt 10,464$
Total Agency Debt 3,041$ (409)$ 2,632$
Other Debt: Debt to the U.S. Treasury Total Other Debt 8,919$ (1,087)$ 7,832$
Total Debt 11,960$ (1,496)$ 10,464$
Classification of Debt: Intragovernmental Debt 8,922$ Debt held by
275

PERFORMANCE AND ACCOUNTABILITY REPORT
Interest paid on borrowings during the year ended September 30, 2006 and 2005 was $1 billioThe purpose of these borrowings is discussed in the following paragraphs.
n.
Borrowings from the U.S. Treasury
HUD is authorized to borrow from the U.S. Treasury to finance Housing for Elderly and Disabled loans. The Treasury borrowings typically have a 15-year term, but may be repaid prior to maturity at HUD’s discretion. However, such borrowings must be repaid in the sequence in which they were borrowed from Treasury. The interest rates on the borrowings are based on Treasury’s 30-year bond yield at the time the notes are issued. Interest is payable on April 30 and October 31. Interest rates ranged from 7.44 percent to 8.18 percent for both fiscal year 2006 and 2005.
In fiscal 2006 and 2005, FHA borrowed $896 million and $1.2 million, respectively, from the U.S. Treasury. The borrowings were needed when FHA initially determined negative credit subsidy amounts related to new loan disbursements or to existing loan modifications. In some instances, borrowings were needed where available cash was less than claim payments due or downward subsidy-estimates. All borrowings were made by FHA’s financing accounts. Negative subsidies were generated primarily by the MMI/CMHI Fund financing account; downward re-estimates have occurred from activity of the FHA’s loan guarantee financing accounts. These borrowings carried interest rates ranging from 2.41 percent to 7.36 percent during fiscal 2006 and from 2.41 percent to 7.34 percent during fiscal year 2005.
orrowings from the Federal Financing Bank (FFB) and the Public
uring the 1960s, 1970s, and 1980s, PHAs obtained loans from the private sector and from the ent and rehabilitation of low rent housing projects. HUD is repaying
t rates range from
.25 percent to 6.0 percent during both fiscal year 2006 and 2005. The borrowings from the FFB s up to 40 years. FFB interest is payable annually on
November 1. Interest rates range from 10.67 percent to 16.18 percent during both fiscal year 2006 and 2005.
Before July 1, 1986, the FFB purchased notes issued by units of general local government and guaranteed by HUD under Section 108. These notes had various maturities and carried interest rates that were one-eighth of one percent above rates on comparable Treasury obligations. The FFB still holds substantially all outstanding notes, and no note purchased by the FFB has ever been declared in default.
Debentures Issued To Claimants
The National Housing Act authorizes FHA, in certain cases, to issue debentures in lieu of cash to settle claims. FHA-issued debentures bear interest at rates established by the U.S. Treasury. Interest rates related to the outstanding debentures ranged from 4.0 percent to 12.88 percent during both FY 2006 and FY 2005. Debentures may be redeemed by lenders prior to maturity to pay mortgage insurance premiums to FHA, or they may be called with the approval of the Secretary of the U. S. Treasury.
B
DFFB to finance developmthese borrowings on behalf of the PHAs, through the Low Rent Public Housing program. Forborrowings from the Public, interest is payable throughout the year. Interes3and the private sector have term
276

SECTION 3: FINANCIAL INFORMATION NOTES TO FINANCIAL STATEMENTS
NOTE 12 – FEDERAL EMPLOYEE and VETERANS’ BENEFITS
HUD also accrues the portion of the estimated liability for disability benefits assigned to the agency under the Federal Employee Compensation Act (FECA), administered and determined by the Department of Labor (DOL). The liability, based on the net present value of estimated future payments based on a study conducted by DOL, was $80 million as of September 30, 2006 and $82 million as of September 30, 2005. Future payments on this liability are to be funded by future appropriations. HUD offsets this unfunded liability by recording future financing sources.
The Department’s Federal Employee and Veterans’ benefit expenses totaled approximately $136 million for fiscal 2006; this amount includes $38 million to be funded by the OPM. Federal Employee and Veterans’ benefit expenses totaled approximately $137 million for fiscal 2005; this amount includes $36 million to be funded by the OPM. Amounts funded by the OPM are charged to expense with a corresponding amount considered as an imputed financing source in the statement of changes in net position.
NOTE 13 - LOSS RESERVES
For fiscal years 2006 and 2005, Ginnie Mae established loss reserves of $534 and $539 million, respectively, which represents probable defaults by issuers of mortgage-backed securities,
rough a provision charged to operations. The reserve is relieved as losses are realized from ers’ portfolios. Ginnie Mae recovers part of its losses through
ment believes that its sses from defaults by issuers of Ginnie Mae guaranteed
f defaulted issuers.
ththe disposal of the defaulted issuservicing fees on the performing portion of the portfolios and the sale of servicing rights which transfers to Ginnie Mae upon the default of the issuer. Ginnie Mae managereserve is adequate to cover probable lomortgage-backed securities.
Ginnie Mae incurs losses when insurance and guarantees do not cover expenses that result from issuer defaults. Such expenses include: (1) unrecoverable losses on individual mortgage defaults because of coverage limitations on mortgage insurance or guarantees, (2) ineligible mortgages included in defaulted Ginnie Mae pools, (3) improper use of proceeds by an issuer, and (4) non-reimbursable administrative expenses and costs incurred to service and liquidate portfolios o
277

PERFORMANCE AND ACCOUNTABILITY REPORT
NOTE 14 - OTHER LIABILITIES
The following shows HUD’s Other Liabilities as of September 30, 2006 (dollars in millions):
Description Non-Current Current TotalIntragovernmental Liabilities FHA Special Receipt Account Liability - 2,486$ 2,4$ Unfunded FECA Liability
8618$ - 18
5 5
103 103
8 2,670
266 - 170 170
21 140 73 73
3
4
Employer Contributions and Payroll Taxes
Miscellaneous Receipts Payable to Treasury
Penalty Due to Treasury - 50 50
Advances to Federal Agencies 8 Total Intragovernmental Liabilities 121$ 2,549$ $ Other Liabilities FHA Other Liabilities - 266$ $ FHA Escrow Funds Related to Mortgage Notes FHA Unearned Premiums 119$ Ginnie Mae Deferred Income - Deferred Credits - 3 Deposit Funds 54 2 56 Accrued Unfunded Annual Leave 75 - 75 Accrued Funded Payroll Benefits - 39 39 Other - FIN 45 364 36 Other 6 - 6 Total Other Liabilities 375$ 3,487$ 3,862$
Special Receipt Account Liability
The special receipt account liability is created from negative subsidy endorsements and downward credit subsidy in the GI/SRI special receipt account.
278

SECTION 3: FINANCIAL INFORMATION NOTES TO FINANCIAL STATEMENTS
The following shows HUD’s Other Liabilities as of September 30, 2005 (dollars in millions): Description Non-Current Current TotalIntragovernmental Liabilities FHA Payable from Unapplied Receipts Recorded by Treasury - - - Special Receipt Account Liability - 771$ 771$ HUD-Section 312 Rehabilitation Program Payable - - - Unfunded FECA Liability 18$ - 18 Employer Contributions and Payroll Taxes - - Miscellaneous Receipts Payable to Treasury 121 - 121 Deposit Funds - - - Other Liabilities - 85 85 Total Intragovernmental Liabilities 139$ 856$ 995$ Other Liabilities FHA Other Liabilities - 226$ 226$ FHA Escrow Funds Related to Mortgage Notes - 170 170 FHA Unearned Premiums (50)$ 27 (23) Ginnie Mae Deffered Income - 77 77 Deferred Credits - 1 1 Deposit Funds 67 2 69 Accrued Unfunded Annual Leave 75 - 75 Accrued Funded Payroll Benefits 36 - 36 Other - FIN 45 - 383 383 Total Other Liabilities 267$ 1,742$ 2,009$
Although not material to merit restatement of FY 2005, OFHEO reclassified $3 million from other liabilities to Accounts Payable in FY 2005.
Description 2006 2005Covered Not-Covered Total Covered Not-Covered Total
Intragovernmental Debt 7,249$ -$ 7,249 8,922$ -$ 8,922$ Other Intragovernmental Liabilities 2,602 68 2,670 977 18 995 Total Intragovernmental Liabilities 9,851$ 68$ 9,919$ 9,899$ 18$ 9,917$ Accounts Payable 757 - 757 847 - 847 Liabilities for Loan Guarantees 3,589 - 3,589 4,678 - 4,678 Debt 1,252 - 1,252 1,542 - 1,542 Federal Employee and Veterans' Benefits - 80 80 - 82 82 Loss Reserves 534 - 534 539 - 539 Other Liabilities 1,111 81 1,192 941 73 1,014 Total Liabilities 17,094$ 229$ 17,323$ 18,446$ 173$ 18,619$
279

PERFORMANCE AND ACCOUNTABILITY REPORT
NOTE 15 – OPERATING LEASES
OFHEO has an occupancy lease with the Office of Thrift Supervision (OTS) at 1700 G Street NW, Washington DC that covers office space and building services which include utilities, security guards, janitorial services, mail delivery, use of the loading dock, garage parking and building operation and maintenance. The initial term of the lease was for five years beginning in 1993, with the option to renew for three 5-year terms. OFHEO has exercised the second of the three option terms.
OFHEO may terminate the lease agreement with OTS in whole or in part. In the event of a termination at OFHEO’s discretion, OFHEO would be required to pay two months rent. If either party ceases to exist or merges with another entity by operation of law, either party may terminate the rental agreement. In the event of termination under this provision, neither party is liable for further costs, fees, damages or other monies due to the termination, except for payments through the date of termination. Due to this termination clause, no deferred rent is established for this lease nor is disclosure of minimum future lease payments required under Financial Accounting Standard Board Statement #13. If OFHEO continues renting up to the expiration date of its current option term ending November 2008, lease payments for fiscal years 2007 and 2008 are estimated to be $4.2 million and $4.4 million, respectively.
In FY 2005, OFHEO obtained additional rental space at 1750 Pennsylvania Avenue NW, Washington DC through a private sector sublessor. The expiration date of the lease is March 30, 2011. If the primary lease would terminate earlier than the expiration date, the sublease would then also terminate. A deferred rent liability is established for this lease.
Under existing commitments, the future minimum lease payments through FY 2011 are as follows:
ber 30, 1750 Penn Ave NW (In Thousands) Fiscal Year Ending Septem
2007 872 907
505 1
2008 2009 944 2010 981 2011
Total Future Minimum Lease Payments 4,209 1 Lease runs through March, 2011.
Total rent expense on the two leases for the years ended September 30, 2006 and 2005 was approximately $4.9 million and $4.4 million, respectively.
NOTE 16 - FINANCIAL INSTRUMENTS WITH OFF-BALANCE SHEET RISK
Some of HUD’s programs, principally those operated through FHA and Ginnie Mae, enter into financial arrangements with off-balance sheet risk in the normal course of their operations.
280

SECTION 3: FINANCIAL INFORMATION NOTES TO FINANCIAL STATEMENTS
A. FHA Mortgage Insurance
Unamortized insurance in force outstanding for FHA’s mortgage insurance programs as of September 30, 2006 and 2005, was $396 billion and $416 billion, respectively and is discussed in Note 7F.
B. Ginnie Mae Mortgage-Backed Securities
Ginnie Mae financial instruments with off-balance sheet risk include guarantees of Mortgage-Backed Securities (MBS) and commitments to guaranty MBS. The securities are backed by pools of FHA-insured, RHS-insured, and VA-guaranteed mortgage loans. Ginnie Mae is exposed to credit loss in the event of non-performance by other parties to the financial instruments. The total amount of Ginnie Mae guaranteed securities outstanding at September 30, 2006 and 2005, was approximately $410.0 billion and $412.3 billion, respectively. However, Ginnie Mae’s potential loss is considerably less because the FHA and RHS insurance and VA guaranty serve to indemnify Ginnie Mae for most losses. Also, as a result of the structure of the security, Ginnie Mae bears no interest rate or liquidity risk.
During the mortgage closing period and prior to granting its guaranty, Ginnie Mae enters into commitments to guaranty MBS. The commitment ends when the MBS are issued or when the commitment period expires. Ginnie Mae’s risks related to outstanding commitments are much less than for outstanding securities due, in part, to Ginnie Mae’s ability to limit commitment authority granted to individual issuers of MBS. Outstanding commitments as of September 30, 2006 and 2005 were $22.8 billion and $55.1 billion, respectively. Generally, Ginnie Mae’s MBS pools are diversified among issuers and geographic areas. No significant geographic concentrations of credit risk exist; however, to a limited extent, securities are concentrated among issuers.
n fiscal 2006 and 2005, Ginnie Mae issued a total of $23.8 billion and $56.6 billion respectively its multi-class securities program. The estimated outstanding balance at September 30, 2006
and 2005, were $198.7 billion and $185.9 billion, respectively. These guaranteed securities do not subject Ginnie Mae to additional credit risk beyond that assumed under the MBS program.
C. Section 108 Loan Guarantees
Under HUD’s Section 108 Loan Guarantee program, recipients of CDBG Entitlement Grant program funds may pledge future grant funds as collateral for loans guaranteed by HUD (these loans were provided from private lenders since July 1, 1986). This Loan Guarantee Program provides entitlement communities with a source of financing for projects that are too large to be financed from annual grants. The amount of loan guarantees outstanding as of September 30, 2006 and 2005, was $2.4 billion and $2.3 billion, respectively. HUD’s management believes its exposure in providing these loan guarantees is limited, since loan repayments can be offset from future CDBG Entitlement Program Funds and, if necessary, other funds provided to the recipient by HUD. HUD has never had a loss under this program since its inception in 1974.
NOTE 17 - CONTINGENCIES
awsuits and Other
s. One group of related cases challenges the legality of actions the Department took in accordance with laws aimed at
Iin
L
HUD is party to a number of claims and tort actions related to lawsuits brought against it concerning the implementation or operation of its various program
281

PERFORMANCE AND ACCOUNTABILITY REPORT
preserving rental housing units for low-income tenants. The cases within this group are in
so
ry to establish a in
6 subsidized projects would be deposited. The Housing and Community Development endment of 1978 authorized the Secretary, subject to approval in appropriation acts, to
ansfer excess rent collections received after 1978 to the Troubled Projects Operating Subsidy p idy Fun . e ions were used for paying tax and utility increases in section 236 projects. The Housing and Community Development Act of 1980 amended the 1978 Act by authorizing the transfer of excess rent c ons regardless of when collected.
All uncommitted balances of excess rental charges from the Rental Housing Assistance Fund as of September 30, 2005, and any collections made during fiscal year 2006 and all subsequent fiscal years, shall be transferred to the Flexible Subsidy Fund, as o ed by section 236(g) of t
Flexible Subsidy
The Flexible Subsidy Fund assists financially tr ubled subsidized proj ts under certain FHA uthorities. The subsidies are intended to prevent potential losses to the FHA fund resulting
and nsurance-in-force and then to those
various stages of the litigation process. The general likelihood of an overall unfavorable outcome, at the group level, has been determined to be probable. The potential loss related to these cases cannot be accurately estimated at this time and, therefore, the Department has not accrued a liability in connection with the cases. Final settlement on a related case occurred during FY 2006 and HUD accrued a liability of $965 thousand in connection with this settlement.
In other unrelated cases where the likelihood of unfavorable outcome is determined to be probable, the Department estimates that the range of losses could be between $5 million and $20 million. HUD has accrued a liability of $5 million in FY 2006 related to these cases.
In addition, HUD has determined that two other cases have a reasonably possible likelihood of unfavorable outcome. The loss for these cases has been estimated at $18.3 million and $12.9 million. HUD has not accrued a liability in connection with these cases and will not dountil the cases are either settled, judgments are finalized, or a determination is made that the likelihood of unfavorable outcome is probable.
NOTE 18 – EARMARKED FUNDS
Earmarked funds are financed by specifically identified revenues and are required by statute to be used for designated activities or purposes.
Rental Housing Assistance Fund
The Housing and Urban Development Act of 1968 authorized the Secretarevolving fund into which rental collections in excess of the established basic rents for unitssection 23Amtrrogram, renamed the Flexible Subs d Prior to that time, coll ct
ollecti
auth rizhe National Housing Act, as amended.
o ecafrom project insolvency and to preserve these projects as a viable source of housing for low moderate-income tenants. Priority was given with Federal iwith mortgages that had been assigned to the Department.
Manufactured Housing Fees Trust Fund
The National Manufactured Housing Construction and Safety Standards Act of 1974, as amended by the Manufactured Housing Improvement Act of 2000, authorizes development and
282

SECTION 3: FINANCIAL INFORMATION NOTES TO FINANCIAL STATEMENTS
enforcement of appropriate standards for the construction, design, and performance of
and will be used to fund the costs of all authorized activities necessary for the consensus committee, HUD, and its agents to carry out all aspects of the manufactured housing legislation. Fees are deposited in a trust fund administered by the Department, a portion of the
ve
nt
manufactured homes to assure their quality, durability, affordability, and safety.
Fees are charged to the manufacturers for each manufactured home transportable section produced
fee receipts are transferred to the salaries and expense account to defray the direct administratiexpenses to the program.
This account also presents activities formerly shown under the Interstate Land Sales accouwhich provides protection to the public with respect to purchases or leases of subdivision lots.
The fee receipts are permanently appropriated and have helped finance a portion of the direct administrative expenses incurred in program operations. Activities are initially financed via transfer from the Manufactured Housing General Fund. At year-end, the transferred funds are returned to the general fund.
Ginnie Mae
Ginnie Mae was created in 1968 through an amendment to the National Housing Act as a wholly-owned government corporation within the Department, and is administered by the Secretary of HUD and the President of Ginnie Mae. As such, Ginnie Mae is a self-financed government corporation and receives no funds from general tax revenues. Operations are financed by a variety of fees, such as guaranty, commitment, new issuer, handling, and transfer servicing fees, which are only to be used for Ginnie Mae’s legislatively authorized mission.
283

PERFORMANCE AND ACCOUNTABILITY REPORT
284
The following shows earmarked funds activity as of September 30, 2006 (dollars in millions):
XCHANGE REVENUE
ental costs and earned revenue separately from between
,1088,414
486
3,142
- - - - - 37 - 534
Other Liabilities 439 4$ 443 Total Liabilities 1,010$ -$ 4$ -$ -$ -$ 1,014$
- - (376)$ - - - (376)$ 12,504
8
GNMA
Rental Housing
AssistanceFlexible Subsidy Eliminations
Total Earmarked
FundsBalance Sheet
Fund Balance w/Treasury 4,056$ 4$ 43$ 5$ - - 4$ Investments 8,414 Accounts Receivable 24 - - 2 Loans Receivable 198 19 General Property, Plant and Equipment 6 Other 392 392 Total Assets 12,892$ 4$ 241$ 5$ -$ -$ 1$
Accounts Payable 37$ Loss Reserves 534$
Unexpended Appropriations Cumulative Results of Operations 11,882$ 4 613 5 - - Total Net Position 11,882 4 237 5 - - 12,12 Total Liabilities and Net Position 12,892$ 4$ 241$ 5$ -$ -$ 13,142$
Statement of Net Cost For the Period Ended
Gross Costs 60$ 11$ (18)$ -$ -$ (10)$ $ Less Earned Revenues (849) (5) (20) - 10 Net Costs (789)$ 6$ (38)$ -$ -$ -$ $
43 (864) (821)
- - - - 1 1 -
mbursement 9 (9) - 20
821
Manufactured Housing Fees Trust Fund
Manufactured Housing Fees Receipt Acct
Statement of Changes in Net Position for the Period Ended
Net Position Beginning of Period 11,093$ 10$ 199$ 5$ -$ -$ 11,307$ -
Appropriations Received - Appropriations UsedTransfers In/Out Without ReiNet Cost of Operations 789 (6) 38 (9) 9 (1) 8 Change in Net Position 789 (6) 38 - - - Net Position End of Period 11,882$ 4$ 237$ 5$ -$ -$ 12,128$
TS AND ENOTE 19 – INTRAGOVERNMENTAL COS
The data below shows HUD’s intragovernmactivity with the public. Intragovernmental transactions are exchange transactions made two reporting entities within the Federal government. Intragovernmental costs are identified by

SECTION 3: FINANCIAL INFORMATION NOTES TO FINANCIAL STATEMENTS
the source of the goods and services; both the buyer and seller are Federal entities. Alsthat there may be instances where the revenue may be classified as non-Federal if
o note the goods or
s
men
t Nat
iona
l
ndia
n an
s and
the
El
Con
solid
atin
g
008 49 23,747 5,063 1,840 3,564 3,387 1,257 3,770 41,763
($380) $60 $23,827 $5,093 $1,853 $3,600 $3,566 $1,279 $3,873 $42,771
Intragovernmental Earned Revenue ($1,522) ($548) $0 $0 $0 $0 $0 $0 ($54) ($2,124)Public Earned Revenue (179) (302) (515) (23) (1,019)
Total Earned Revenue ($1,701) ($850) $0 $0 $0 $0 $0 ($515) ($77) ($3,143)Net Cost of Operations ($2,081) ($790) $23,827 $5,093 $1,853 $3,600 $3,566 $764 $3,796 $39,628
2005
Fede
ral H
ousi
ng
Adm
inis
tratio
n
Gov
ernm
ent N
atio
nal
Mor
tgag
e A
ssoc
iatio
n
Sect
ion
8 R
enta
l A
ssis
tanc
e
Com
mun
ity
Dev
elop
men
t Blo
ck
Gra
nts
Hom
e
Ope
ratin
g Su
bsid
ies
Publ
ican
d In
dian
H
ousi
ngLo
ansa
nd G
rant
s
Hou
sing
for t
he
Elde
rly a
nd D
isab
led
All
Oth
er
Fina
ncia
l Sta
tem
ent
Elim
inat
ions
Con
solid
atin
g
Intragovernmental Costs $532 $0 $65 $23 $20 $12 $176 $115 $204 $1,147 Public Costs 254 81 23,330 5,002 1,735 3,555 3,425 1,255 3,846 42,483 Total Costs $786 $81 $23,395 $5,025 $1,755 $3,567 $3,601 $1,370 $4,050 $43,630
Intragovernmental Earned Revenue ($1,490) ($457) $0 $0 $0 $0 $0 $0 ($9) ($1,956)Public Earned Revenue (363) (329) (553) (24) (1,269)
Total Earned Revenue ($1,853) ($786) $0 $0 $0 $0 $0 ($553) ($33) ($3,225)Net Cost of Operations ($1,067) ($705) $23,395 $5,025 $1,755 $3,567 $3,601 $817 $4,017 $40,405
services are subsequently sold to the public. Public activity involves exchange transactionbetween the reporting entity and a non-Federal entity. The following show HUD’s intragovernmental costs and exchange revenue (dollars in millions):
derly
2006
al H
ousi
ng
Adm
inis
tratio
n
ntg
age
Ass
ocia
tion
Sect
ion
8 R
enta
l A
ssis
tanc
e
Com
mun
ity
Dev
elop
men
t Blo
ck
atin
g Su
bsid
ies
Publ
ic a
nd I
Hou
sing
Lo
Hou
sing
for
and
Dis
able
d
All
Oth
er
Fina
ncia
l Sta
tem
ent
Elim
inat
ions
Fede
r
Gov
erM
or
Gra
nts
Hom
e
Ope
r
Gra
nts
Intragovernmental Costs $534 $11 $80 $30 $13 $36 $179 $22 $103 $1,Public Costs (914) Total Costs
285

PERFORMANCE AND ACCOUNTABILITY REPORT
NOTE 20 - TOTAL COST AND EARNED REVENUE BY BUDGET FUNCTIONAL CLASSIFICATION
The following shows HUD’s total cost and earned revenue by budget functional classification for fiscal 2006 (dollars in millions):
Budget Functional Classification Gross Cost Earned Revenue Net CostIntragovernmental: Commerce and Housing Credit 8$ -$ 8$ Community and Regional Development (50) (50) (100) Income Security 501 (4) 497 Administration of Justice - - - Miscellaneous - - - Total Intragovernmental 459$ (54)$ 405$
With the Public: Commerce and Housing Credit 63$ (3,074)$ (3,011)$ Community and Regional Development 5,382 - 5,382 Income Security 36,818 (14) 36,804 Administration of Justice 48 - 48 Miscellaneous - - - Total with the Public 42,311$ (3,088)$ 39,223$
TOTAL: Commerce and Housing Credit 71$ (3,074)$ (3,003)$ Community and Regional - - - Development 5,332 (50) 5,282 Income Security 37,319 (18) 37,301 Administration of Justice 48 - 48 Miscellaneous - - - TOTAL: 42,770$ (3,142)$ 39,628$
286

SECTION 3: FINANCIAL INFORMATION NOTES TO FINANCIAL STATEMENTS
The following shows HUD’s total cost and earned revenue by budget functional classificatiofiscal 2005 (dollars in millions):
Budget Functional Classification Gross Cost Earned Revenue Net CostIntragovernmental: Commerce and Housing Credit 637$ (1,948)$ (1,311)$
n for
NOTE 21 – NET COSTS of HUD’s CROSS-CUTTING PROGRAMS
This footnote provides a categorization of net costs for two of HUD’s major program areas whose costs were incurred across multiple programs. Section 8 costs are incurred to assist low- and very low- income families in obtaining decent and safe rental housing. In addition, costs incurred under the Other major program represent HUD’s smaller programs. These programs provide assistance to support other HUD objectives such as fair housing and equal opportunity, energy conversation, homeless assistance, housing units rehabilitation, and home ownership.
Community and Regional Development 19 - 19 Income Security 491 (5) 486 Administration of Justice - (4) (4) Miscellaneous - - - Total Intragovernmental 1,147$ (1,957)$ (810)$
With the Public: Commerce and Housing Credit 708$ (1,252)$ (544)$ Community and Regional Development 5,485 - 5,485 Income Security 36,244 (17) 36,227 Administration of Justice 47 - 47 Miscellaneous - - - Total with the Public 42,484$ (1,269)$ 41,215$
TOTAL: Commerce and Housing Credit 1,345$ (3,200)$ (1,855)$ Community and Regional - - Development 5,504 - 5,504 Income Security 36,735 (22) 36,713 Administration of Justice 47 (4) 43 Miscellaneous - - - TOTAL: 43,631$ (3,226)$ 40,405$
287
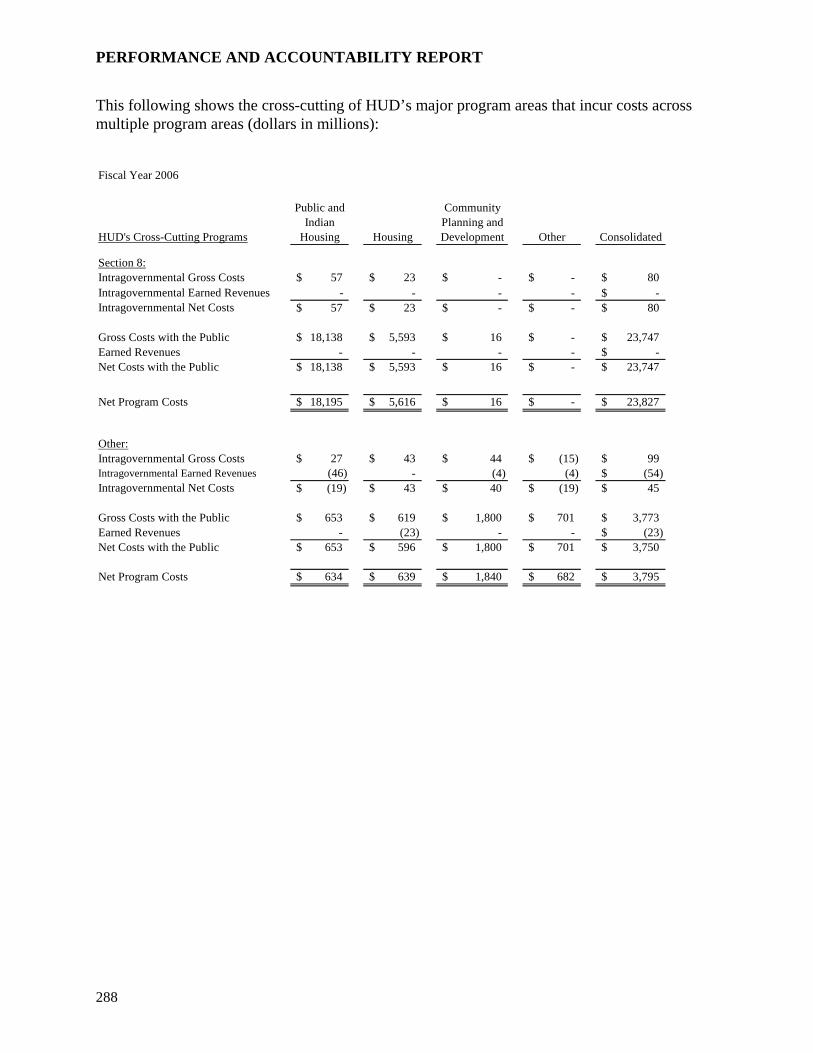
PERFORMANCE AND ACCOUNTABILITY REPORT
This following shows the cross-cutting of HUD’s major program areas that incur costs acrosmultiple program areas
s (dollars in millions):
Fiscal Year 2006
HUD's Cross-Cutting Programs
Public and Indian
Housing Housing
Community Planning and Development Other Consolidated
Section 8:Intragovernmental Gross Costs 57$ 23$ -$ -$ 80$ Intragovernmental Earned Revenues - - - - -$ Intragovernmental Net Costs 57$ 23$ -$ -$ 80$
Gross Costs with the Public 18,138$ 5,593$ 16$ -$ 23,747$ Earned Revenues - - - - -$ Net Costs with the Public 18,138$ 5,593$ 16$ -$ 23,747$
Net Program Costs 18,195$ 5,616$ 16$ -$ 23,827$
Other:Intragovernmental Gross Costs 27$ 43$ 44$ (15)$ 99$ Intragovernmental Earned Revenues (46) - (4) (4) (54)$ Intragovernmental Net Costs (19)$ 43$ 40$ (19)$ 45$
Gross Costs with the Public 653$ 619$ 1,800$ 701$ 3,773$ Earned Revenues - (23) - - (23)$ Net Costs with the Public 653$ 596$ 1,800$ 701$ 3,750$
Net Program Costs 634$ 639$ 1,840$ 682$ 3,795$
288

SECTION 3: FINANCIAL INFORMATION NOTES TO FINANCIAL STATEMENTS
NOTE 22 – FHA NET COSTS
FHA organizes its operations into two overall program types: MMI/CMHI and GI/SRI. These program types are composed of four major funds. The Mutual Mortgage Insurance fund (MMI),
HA's largest fund, provides basic Single Family mortgage insurance and is a mutual insurance share surplus
interest reduction payments who otherwise would not be eligible for mortgage insurance.
Fiscal Year 2005
HUD's Cross-Cutting Programs
Public and Indian
Housing Housing
Community Planning and Development Other Consolidated
Section 8:Intragovernmental Gross Costs 37$ 28$ -$ -$ 65$ Intragovernmental Earned Revenues - - - - -$ Intragovernmental Net Costs 37$ 28$ -$ -$ 65$
Gross Costs with the Public 15,361$ 7,948$ 21$ -$ 23,330$ Earned Revenues - - - - -$ Net Costs with the Public 15,361$ 7,948$ 21$ -$ 23,330$
Net Program Costs 15,398$ 7,976$ 21$ -$ 23,395$
Other:Intragovernmental Gross Costs 31$ 24$ 43$ 106$ 204$ Intragovernmental Earned Revenues (1) (1) (4) (3) (9) Intragovernmental Net Costs 30$ 23$ 39$ 103$ 195$
Gross Costs with the Public 733$ 632$ 1,689$ 794$ 3,848$ Earned Revenues - (24) - - (24)$ Net Costs with the Public 733$ 608$ 1,689$ 794$ 3,824$
Net Program Costs 763$ 631$ 1,728$ 897$ 4,019$
Ffund, whereby mortgagors, upon non-claim termination of their mortgages,premiums paid into the MMI fund that are not required for operating expenses and losses or to build equity. The Cooperative Management Housing Insurance fund (CMHI), another mutual fund, provides mortgage insurance for management-type cooperatives. The General Insurance fund (GI), provides a large number of specialized mortgage insurance activities, including insurance of loans for property improvements, cooperatives, condominiums, housing for the elderly, land development, group practice medical facilities and nonprofit hospitals. The Special Risk Insurance fund (SRI) provides mortgage insurance on behalf of mortgagors eligible for
289

PERFORMANCE AND ACCOUNTABILITY REPORT
The following table shows Net Costs detail for the Federal Housing Administration (dollars in millions):
NOTE 23 – COMMITMENTS UNDER HUD’S GRANT, SUBSIDY, AND LOAN PROGRAMS
A. Contractual Commitments
HUD has entered into extensive long-term contractual commitments under its various grant, subsidy and loan programs. These commitments consist of legally binding agreements the Department has entered into to provide grants, subsidies, or loans. Commitments become liabilities when all actions required for payment under an agreement have occurred. The mechanism for funding subsidy commitments generally differs depending on whether the greements were entered into before or after 1988.
rior to fiscal 1988, HUD’s subsidy programs, primarily the Section 8 program and the Section s, operated under contract authority. Each year, Congress provided HUD the
uthority to enter into multiyear contracts within annual and total contract limitation ceilings. HUD then drew on and continues to draw on permanent indefinite appropriations to fund the current year’s portion of those multiyear contracts. Because of the duration of these contracts (up to 40 years), significant authority exists to draw on the permanent indefinite appropriations. Beginning in fiscal 1988, the Section 8 and the Section 235/236 programs began operating under multiyear budget authority whereby the Congress appropriates the funds “up-front” for the entire contract term in the initial year.
As shown below, appropriations to fund a substantial portion of these commitments will be provided through permanent indefinite authority. These commitments relate primarily to the Section 8 program, and the Section 235/236 rental assistance and interest reduction programs, and are explained in greater detail below.
HUD’s commitment balances are based on the amount of unliquidated obligations recorded in HUD’s accounting records with no provision for changes in future eligibility, and thus are equal to the maximum amounts available under existing agreements and contracts. Unexpended appropriations and cumulative results of operations shown in the Consolidated Balance Sheet
GI/SRI Program
MMI/CMHI Program Total
GI/SRI Program
MMI/CMHI Program Total
CostsIntragovernmental Gross Costs 147$ 387$ 534$ 127$ 405$ 532$ Intragovernmental Earned Revenues (188) (1,334) (1,522) (147) (1,344) (1,491) Intragovernmental Net Costs (41)$ (947)$ (988)$ (20)$ (939)$ (959)$
Gross Costs with the Public (2,049)$ 1,135$ (914)$ (989)$ 1,243$ 254$ Earned Revenues (85) (94) (179) (322) (41) (363) Net Costs with the Public (2,134)$ 1,041$ (1,093)$ (1,311)$ 1,202$ (109)$
Net Program Costs (2,175)$ 94$ (2,081)$ (1,331)$ 263$ (1,068)$
Fiscal Year 2006 Fiscal Year 2005
a
P235/236 programa
290

SECTION 3: FINANCIAL INFORMATION NOTES TO FINANCIAL STATEMENTS
291
comprise funds in the U.S. Treasury available to fund existing commitments that were provided through “up-front” appropriations, and also include permanent indefinite appropriations received in excess of amounts used to fund the pre-1988 subsidy contracts and offsetting collections.
Prior to FY 2004, the Department did not disclose the amount of permanent indefinite authority required to meet its obligations under the PIH Low Rent Public Housing Loan Fund. The Department’s obligations reported on the Statement of Budgetary Resources for this program are the result of liabilities assumed by the agency in repayment of borrowings on behalf of PHAs and IHAs authorized by Public Law 99-272. The amount of funding required for the repayment of principal and interest are financed by the Debt Service Fund and covered by the amount of permanent indefinite appropriations not to exceed $7.2 billion authorized by the Secretary of the Treasury. These balances in HUD’s budget authority were disclosed as a reconciling item between the amount of unexpended appropriations reported in the Consolidated Statement of Financial Position and the obligated balances reported in the Consolidated Statement of Budgetary Resources in prior financial statement audits. Congress converted the PIH Low Rent and Homeownership loan programs to grant programs in 1986.
FHA enters into long-term contracts for both program and administrative services. FHA funds these contractual obligations through appropriations, permanent indefinite authority, and offsetting collections. The appropriated funds are primarily used to support administrative contract expenses, while the permanent indefinite authority and the offsetting collections are used for program services.
The following shows HUD's obligations and contractual commitments under its grant, subsidy, and loan programs as of September 30, 2006 (dollars in millions):
Undelivered Orders
ProgramsUnexpended
Appropriations
PermanentIndefinite or Investment Authority
Offsetting Collection
FHA 180$ 370$ 771$ 1,321$ GNMA - - - - Section 8 Rental Assistance 7,567 9,411 - 16,978 Community Development Block Grants 21,368 - - 21,36 HOME Partnership Investment Program 5,523 - - 5,523 Operating Subsidies 795 - - 795 Low Rent Public Housing Grants and Loans 7,879 1,582 - 9,461 Housing for Elderly and Disabled 5,374 - - 5,37 Section 235/236 429 5,370 - 5,79
Undelivered Orders -
Obligations, Unpaid
8
49
All Other 5,670 2 64 5,736 Total 54,785$ 16,735$ 835$ 72,355$

PERFORMANCE AND ACCOUNTABILITY REPORT
Of the total Section 8 Rental Assistance contractual commitments as of September 30, 2006, $13.1 billion relates to project-based commitments, and $3.9 billion relates to tenant-based ommitments.
The following shows HUD's obligations and contractual commitments under its grant, subsidy, and loan programs as of September 30, 2005 (dollars in millions):
Of the total Section 8 Rental Assistance contractual commitments as of September 30, 2005, $18.2 billion relates to project-based commitments, and $3.6 billion relates to tenant-based commitments. With the exception of the Housing for the Elderly and Disabled and Low Rent
e
d) to obligate all or part of those funds. Administrative
c
Undelivered Orders
ProgramsUnexpended
Appropriations
PermanentIndefinite or Investment Authority
Offsetting Collection
FHA 188$ 364$ 571$ 1,123$ GNMA - - - - Section 8 Rental Assistance 9,989 11,827 - 21,816 Community Development Block Grants 10,635 - - 10,635 HOME Partnership Investment Program 5,546 - - 5,546
759 0,268
d Disabled 5,480 - - 5,480 356 6,462 - 6,818
6,172 11 97 6,280 Total 47,254$ 20,803$ 668$ 68,725$
Undelivered Orders -
Obligations, Unpaid
Operating Subsidies 759 - - Low Rent Public Housing Grants and Loans 8,129 2,139 - 1 Housing for Elderly anSection 235/236All Other
Public Housing Loan Programs (which have been converted to grant programs), Section 235/236, and a portion of “all other” programs, HUD management expects all of the above programs to continue to incur new commitments under authority granted by Congress in future years. However, estimated future commitments under such new authority are not included in thamounts above.
B. Administrative Commitments
In addition to the above contractual commitments, HUD has entered into administrative commitments which are reservations of funds for specific projects (including those for which a contract has not yet been executecommitments become contractual commitments upon contract execution.
292

SECTION 3: FINANCIAL INFORMATION NOTES TO FINANCIAL STATEMENTS
The following shows HUD’s administrative commitments as of September 30, 2006 (dollars in millions):
ProgramsUnexpended
Appropriations
Permanent Indefinite
AppropriationsOffsetting
CollectionsTotal
Reservations
Section 8 Rental Assistance Project-Based 14$ 8$ - $ Community Development Block Grants 1,005 - - 1,005 HOME Partnership Investment Program 234 - - Low Rent Public Housing Grants and Loans 113 - - 11 Housing for Elderly and Disabled 921 - - 92 Section 235/236 - 12 12 All Other 602 - 4$ 606
Total 2,889$ $
Reservations
22
234 31
20 4$ 2,913$
The following shows HUD’s administrative commitments as of September 30, 2005 (dollarsmillions):
in
NOTE 24 – EFFECTS of HURRICANES KATRINA, RITA, and WILMA
Ginnie Mae guarantees to advance payments of principal and interest on Mortgage Backed Securities (MBS) when the issuer of the pooled mortgages behind the MBS’s defaults. Ginnie Mae files the claims for loans defaulted within the defaulted issuers portfolio to FHA, VA, or RHS. Ginnie Mae has not incurred any losses due to date and does not expect any material
ture losses.
ProgramsUnexpended
Appropriations
Permanent Indefinite
AppropriationsOffsetting Collections
Total Reservations
Section 8 Rental Assistance Project-Based 17$ 22$ - 39$ Section 8 Rental Assistance Tenant-Based - 1 - 1 Community Development Block Grants 1,001 - - 1,001 HOME Partnership Investment Program 277 - - 277 Low Rent Public Housing Grants and Loans 148 - - 148 Housing for Elderly and Disabled 415 - - 415 All Other 668 12 4$ 684
Total 2,526$ 35$ 4$ 2,565$
Reservations
fu
293
PERFORMANCE AND ACCOUNTABILITY REPORT
FHA is committed to providing disaster relief to its borrowers. After the hurricane destruction atthe end of fiscal year 2005, borrowers living in disaster-declared areas have been assisted through mortgage assista
nce or foreclosure relief efforts.
as a result of the hurricane destruction. FHA estimated a 62% loss rate for these properties, which is higher than the average loss rate. Based on the above assumptions, the estimated net present value for the single family hurricane cost is $623.3 million.
The multifamily hurricane cost estimate was determined from physical inspections conducted by FHA’s Office of Multifamily Housing Programs of impacted properties. Only properties impacted by Hurricane Katrina were included in the multifamily liability estimate. The claim amount assumed a complete write-off with zero recoveries and zero premiums collected. The Multifamily hurricane cost is estimated to be $63.2 million.
FHA estimated that the net present value for both single family and multifamily hurricane costs would total $686.5 million. This cost is included as part of FHA’s overall $3,482 million Loan Guarantee Liability.
The Department will provide transitional housing assistance to displaced public housing residents, displaced Section 8 participants, displaced families from other HUD assisted programs, and individuals who were homeless in the disaster affected area prior to Katrina.
The effects of Hurricanes Katrina, Rita, and Wilma in 2005 also resulted in increased funding for the Department for assisting in meeting housing needs of those displaced by the disaster. The
llowing shows the status of budgetary resources information for HUDs programs funded to of September 30, 2006 (dollars in millions):
FHA estimated that 11,468 single family claims (including failed loss mitigation actions) with unpaid principal balances totaling $902.6 million would be realized
fosupport disaster relief as
294

SECTION 3: FINANCIAL INFORMATION NOTES TO FINANCIAL STATEMENTS
CDBG
Tenant-Based Rental
Assistance
Prevention of Resident
Displacement TotalBudgetary Resources
Unobligated Balance, beginning of period - - $69 $69Recoveries - - - - Budget Authority $16,673 $390 17,063 Spending Authority from Offsetting Collections - - (26) (26) Total Budgetary Resources $16,673 $390 $43 $17,106
Status of Budgetary Resources
Obligations Incurred $11,417 $132 $36 $11,585Unobligated Balance, available 5,256 258 7 5,521 Unobligated Balance, not available - - - - Total Status of Budgetary Resources $16,673 $390 $43 $17,106
Change in Obligated Balance
OO
bligated Balance, net beginning of period - - $10 $10bligations Incurred $11,417 $132 36 11,585 ross Outlays (80) (110) (45) (235)
Net Outlays 80 110 71 261
Obligations Outlays Unliquidated
Alabama $73 $1 $72Georgia 19 18 1 Louisiana 6,260 91 6,169 Mississippi 5,080 53 5,027 Texas 145 63 82 Other 12 7 5 Total $11,589 $233 $11,356
The data below displays cumulative activity by state from program inception. The major recipients are listed individually and the remaining states are grouped together and listed as "other". The obligations incurred and gross outlays shown above represents fiscal year activity. Dollars are in millions.
GRecoveries - - - - Obligated Balance, net end of period $11,337 $22 $1 $11,360
295
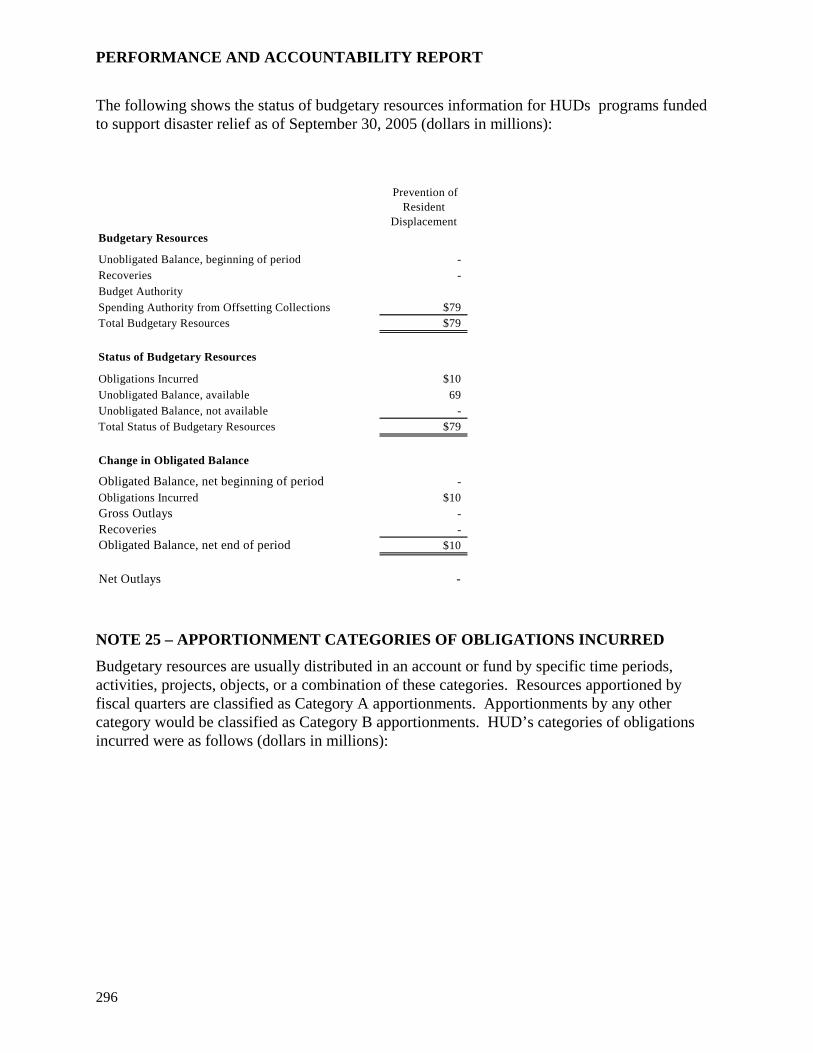
PERFORMANCE AND ACCOUNTABILITY REPORT
The following shows the status of budgetary resources information for HUDs programs fundedto support disaster relief as of September 30, 2005 (dollars in millions):
NOTE 25 – APPORTIONMENT CATEGORIES OF OBLIGATIONS INCURRED
Budgetary resources are usually distributed in an account or fund by specific time periods, activities, projects, objects, or a combination of these categories. Resources apportioned by fiscal quarters are classified as Category A apportionments. Apportionments by any other category would be classified as Category B apportionments. HUD’s categories of obligations incurred were as follows (dollars in millions):
et Outlays -
Prevention of Resident
Displacement Budgetary Resources
Unobligated Balance, beginning of period - Recoveries - Budget Authority Spending Authority from Offsetting Collections $79Total Budgetary Resources $79
Status of Budgetary Resources
Obligations Incurred $10Unobligated Balance, available 69 Unobligated Balance, not available - Total Status of Budgetary Resources $79
Change in Obligated Balance
Obligated Balance, net beginning of period - Obligations Incurred $10Gross Outlays - Recoveries - Obligated Balance, net end of period $10
N
296

SECTION 3: FINANCIAL INFORMATION NOTES TO FINANCIAL STATEMENTS
Exempt Category Category From
A B Apportioment Total2006Direct 1,319$ 61,827$ -$ 63,146$ Reimbursable - 100 - 100
1,319$ 61,927$ -$ 63,246$
2005Direct 1,263$ 53,143$ -$ 54,406$ Reimbursable - 120 - 120
1,263$ 53,263$ -$ 54,526$
NOTE 26 – EXPLANATION OF DIFFERENCES BETWEEN THE STATEMENT OF BUDGETARY RESOURCES AND THE BUDGET OF THE UNITED STATES GOVERNMENT
The President's Budget containing actual FY 2006 data is not available for comparison to the Statement of Budgetary Resources. Actual FY 2006 data will be available in the Analytical Perspectives section of the Budget of the United States Government, fiscal year 2008.
For fiscal year 2005, an extensive analysis to compare HUD’s Statement of Budgetary Resources to the President’s Budget of the United States was performed to identify any differences.
297

PERFORMANCE AND ACCOUNTABILITY REPORT
The following shows the difference between Budgetary Resources reported in the Statement of Budgetary Resources and the President’s Budget for fiscal year 2005 (dollars in millions):
Budgetary Resources
FHA 44,678 44,473 205 1GNMA 11,579 11,579 - Section 8 Rental Assistance 22,286 22,286 - CBDG 6,199 6,160 39 1HOME 2,353 2,353 - Operating Subsidy 2,442 2,441 1 2PIH Loans and Grants 3,614 3,614 - Housing for the Elderly & Disabled 2,735 2,684 51 1All Other 7,810 7,668 142 3Total 103,696 103,258 438
Explanation Notes:1 - The SBR includes expired accounts and the Budget does not.2 - Rounding3 - $16 million is reported in other independent agency section of the budget, $123 million is due to expired accounts reported in the SBR but not in the budget, and the remaining $3 million is due to rounding.
Statement of Budgetary Resources
United States Budget Differences
Explanation Note
298

SECTION 3: FINANCIAL INFORMATION NOTES TO FINANCIAL STATEMENTS
299
The following shows the difference between Obligations Incurred reported in the Statement of Budgetary Resources and the President’s Budget for fiscal year 2005 (dollars in millions):
The following shows the difference between Distributed Offsetting Receipts reported in the Statement of Budgetary Resources and the President’s Budget for fiscal year 2005 (dollars in millions):
perating Subsidy 2,440 2,440 - PIH Loans and Grants 3,212 3,212 - Housing for the Elderly & Disabled 1,397 1,397 - All Other 4,971 4,912 59 3Total 54,513 54,657 (144)
Statement of Budgetary Resources
United States Budget Differences
Explanation NoteObligations Incurred
FHA 15,183 15,183 - GNMA 120 327 (207) 1Section 8 Rental Assistance 20,175 20,175 - CBDG 4,980 4,976 4 2HOMO
E 2,035 2,035 -
Explanation Notes:1 - The difference is the transfer of the negative subsidy to the Reserve Receipt Account.2 - The SBR reports expired accounts and the U. S. Budget does not.3 - $8 million reported in the independent agency section of the U.S. Budget and the remaining is due to espired accounts.
Distributed Offsetting Receipts
FHA 474 474 -
Explanation Notes:
Statement of Budgetary Resources
United States Budget Differences
Explanation Note

PERFORMANCE AND ACCOUNTABILITY REPORT
The following shows the difference between Net Outlays reported in the Statement of BudgetaryResources and the President’s Budget for fiscal year 2005 (dollars in millions):
NOTE 27 - EXPLANATION OF THE RELATIONSHIP BETWEEN LIABILITIES NOT COVERED BY BUDGETARY RESOURCES ON THE BALANCE SHEET AND THE CHANGES IN COMPONENTS REQUIRING OR GENERATING RESOURCES IN FUTURE PERIODS
In FY 2006, the department reported a net increase in unfunded annual leave liability in the amount of $4 million in the Consolidated Statement of Financing. This unfunded leave liability is not covered by budgetary resources at the balance sheet date.
Net Outlays
FHA 572 573 (1) 1GNMA 528 538 (10) 2Section 8 Rental Assistance 23,285 23,285 - CBDG 4,984 4,894 90 HOME 1,718 1,718 - Operating Subsidy 3,572 3,572 - PIH Loans and Grants 3,826 3,826 - Housing for the Elderly & Disabled 280 280 - All Other 4,118 4,112 6 3Total 42,883 42,798 85
Explanation Notes:1 - Rounding2 - The difference is due to the duplicate transfer of the S&E amount, this was corrected on October of 2006.3 - Reported in other independent agency section of the U.S. Budget
Statement of Budgetary Resources
United States Budget Differences
Explanation Note
300

SECTION 3: FINANCIAL INFORMATION CONSOLIDATING FINANCIAL STATEMENTS
Consolidating Financial Statements
301

PERFORMANCE AND ACCOUNTABILITY REPORT
Consolidating Balance Sheet As of September 2006 (Dollars in Millions)
Federal Housing
Administration
Government National
Mortgage Association
Section 8 Rental
Assistance
Community
Development Block Grants Home
Operating Subsidies
ASSETS
Intragovernmental Fund Balance with Treasury (Note 4) $10,568 $4,056 $8,501 $27,678 $5,821 $943 Investments (Note 5) 22,012 8,414 Other Assets (Note 9) 24 7 8 4 10 Total Intragovernmental Assets $32,603 $12,471 $8,508 $27,686 $5,825 $953 Investments (Net) (Note 5) 98 Accounts Receivable (Net) (Note 6) 168 24 164 Credit Program Receivables and Related Foreclosed Property (Net) (Note 7) 4,283 General Property Plant and Equipment (Net) (Note 8) 6
Other Assets (Note 9) 141 391 TOTAL ASSETS $37,293 $12,893 $8,672 $27,686 $5,825 $953 LIABILITIES Intragovernmental Liabilities Accounts Payable (Note 10) 4 Debt (Note 11) $6,258 Other Intragovernmental Liabilities (Note 14) 2,486 $86 $2 1 $2
otal Intragovernmental Liabilities $8,744 $86 $5 $1 $2 T
Accounts Payable (Note 10) 396 37 11 43 28 147 Loan Guarantees Liabilities (Note 7) 3,482 Debt Held by the Public (Note 11) 95 Federal Employee and Veterans' Benefits (Note 12)
Loss Reserves (Note 13) 8 7 3 5
6
534 Other Governmental Liabilities (Note 14) 577 439 9 6 3TOTAL LIABILITIES $13,294 $1,011 $113 $61 $35 $159 N
Unexpended Appr
ET POSITION opriations - Earmarked (Note 18)
Unexpended Appropriations $594 $8,526 $27,625 $5,790 $793 Cumulative Results of Operations - Earmarked $11,882 Cumulative Results of Operations 23,405 33 Total Net Position $23,999 $11,882 $8,559 $27,625 $5,790 $793Total Liabilities and Net Position $37,293 $12,893 $8,672 $27,686 $5,825 $953
Figures may not add to totals because of rounding.
302

SECTION 3: FINANCIAL INFORMATION CONSOLIDATING FINANCIAL STATEMENTS
Consolidating Balance Sheet As of September 200
(continued) 6
(Dollars in Millions)
Public andIndian Housing
Loans andGrants
Housingfor the
Elderly andDisabled All Other
Financial
Statement Eliminations
Consolidating Total
ASSETS Intragovernmental Fund Balance with Treasury (Note 4) $8,444 $6,626 $8,758 $81,395 Investments (Note 5) 30,426 Other Assets (Note 9) 17 (44) 26 Total Intragovernmental Assets $8,461 $6,626 $8,714 $111,847 Investments (Net) (Note 5) 98 Accounts Receivable (Net) (Note 6) 1 6 363 Credit Program Receivables and Related Foreclosed Property (Net) (Note 7) 1 5,561 200 10,045 General Property Plant and Equipment (Net) (Note 8) 169 176
Other Assets (Note 9) 2 534TOTAL ASSETS $8,463 $12,187 $9,091 $123,063 LIABILITIES Intragovernmental Liabilities Accounts Payable (Note 10) ($4) ($0) Debt (Note 11) $991 7,249 Other Intragovernmental Liabilities (Note 14) 1 $1 93 2,670 Total Intragovernmental Liabilities $992 $1 $89 $9,919 Accounts Payable (Note 10) 27 11 57 757 Loan Guarantees Liabilities (Note 7) 108 3,589 Debt Held by the Public (Note 11) 1,156 1,252 Federal Employee and Veterans' Benefits (Note 12) 2 2 55 80
Loss Reserves (Note 13) 534 Other Governmental Liabilities (Note 14) 2 30 121 1,192TOTAL LIABILITIES $2,179 $43 $428 $17,323 NET POSITION Unexpended Appropriations - Earmarked (Note 18) (376) (376)
Unexpended Appropriations $8,316 $6,555 $8,416 $66,616 Cumulative Results of Operations - Earmarked $622 $12,504 Cumulative Results of Operations (2,032) 5,589 1 26,996Total Net Position $6,285 $12,144 $8,662 $105,740Total Liabilities and Net Position $8,463 $12,187 $9,091 $123,063
Figures may not add to totals because of rounding.
303
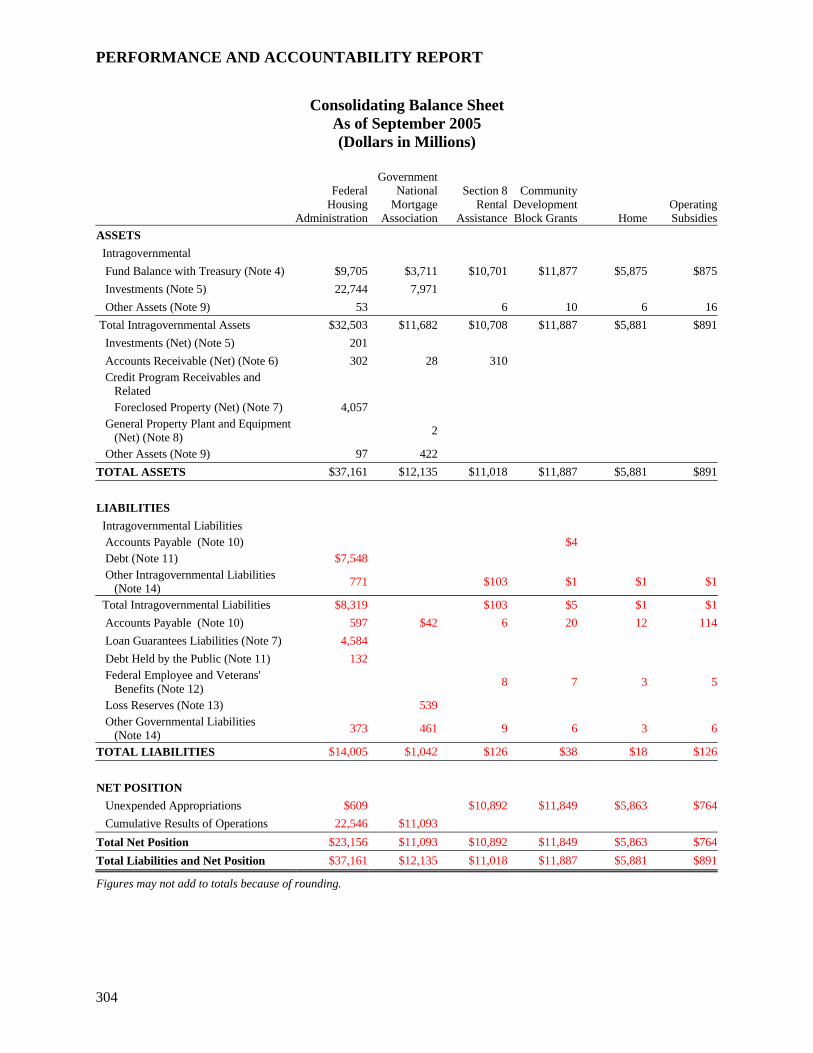
PERFORMANCE AND ACCOUNTABILITY REPORT
Consolidating Balance Sheet As of September 2005 (Dollars in Millions)
FederaHousin
Adminis
Governtionrtgci
ctiRent
sist
HOS
l g
tration
NaMo
Asso
ment al
age ation
Se
As
on 8 al
ance
ComDeveBloc
munity lopment k Grants ome
perating ubsidies
ASSETS Intragovernmental
4) $9,705 $3,711 $10,70 $11,877 $5,875 ) 22,744 7,971 ) 53 6 10 6 16
ts $32,503 11,68 $10,70 $11,887 $5,881
Fund Balance with Treasury (Note 1 $875 Investments (Note 5 Other Assets (Note 9 Total Intragovernmental Asse $ 2 8 $891 Investments (Net) (Note 5) 201
302 28 310
4,057 operty Plant and Equipment 2
97 42TOTAL ASSETS $37,161 $12,135 $11,018 $11,887 $5,881 $891
Accounts Receivable (Net) (Note 6) Credit Program Receivables and Related Foreclosed Property (Net) (Note 7) General Pr (Net) (Note 8) Other Assets (Note 9) 2
LIABILITIES
es ble (Note 10) $4
$7,548 ities 771 $103 $1 $
$8,319 $103 $5 $
Intragovernmental Liabiliti Accounts Paya Debt (Note 11) Other Intragovernmental Liabil (Note 14) 1 $1
Total Intragovernmental Liabilities 1 $1 Accounts Payable (Note 10) Loan Guarantees Liabilities (N
597 $42 6 20 12 114ote 7) 4,584
Debt Held by the Public (Note 11) 132 Veterans' 8 7 3
13) 539 Other Governmental Liabilities 373 461 9 6 3 6
$14,005 $1,042 $126 $38 $18 $126
Federal Employee and 5 Benefits (Note 12) Loss Reserves (Note (Note 14) TOTAL LIABILITIES
NET POSITION
$609 $10,892 $11,849 $5,863 $764ns 22,546
$23,156 $10,892 $11,849 $5,863 $764
Unexpended Appropriations ults of Operatio Cumulative Res $11,093
Total Net Position $11,093 Total Liabilities and Net Position $37,161 12,13 $11,01 $11, $5$ 5 8 887 ,881 $891
Figures may not add to totals because of rounding.
304

SECTION 3: FINANCIAL INFORMATION CONSOLIDATING FINANCIAL STATEMENTS
Consolidating Balance Sheet (continued) As of September 2005 (Dollars in Millions)
IL
Housingfor the
Elderly andDisabled A E
Consolidating Total
Public andndian Housing
oans andGrants ll Other
Financial
Statement liminations
ASSETS Intragovernmental Fund Balance with Treasury (Note 4) $8,683 $6,867 $9,205 $67,500
Other Assets (Note 9)
Investments (Note 5) 30,715
27$8,710
1$6,869
(93)$9,112
28$98,243 Total Intragovernmental Assets
Investments (Net) (Note 5) 201
elated 6,560
ote 9) TOTAL ASSETS $8,712 $13,429 $9,457 $110,569
Accounts Receivable (Net) (Note 6) 1 4 646 Credit Program Receivables and R Foreclosed Property (Net) (Note 7) General Property Plant and Equipment (Net)
1 200 10,818
(Note 8) 139 141
Other Assets (N 1 520
LIABILITIES
es ble (Note 10) ($4)
$1,090 $285 $8,922ities (Note 14)
bilities $1,090 $285 $113 $9,917
Intragovernmental Liabiliti Accounts Paya Debt (Note 11)
Other Intragovernmental Liabil 117 995 Total Intragovernmental Lia Accounts Payable (Note 10) 15 5 36
94 847
Loan Guarantees Liabilities (Note 7)
4,6781,410 1,542
2 2 56 82
Liabilities (Note 14) OTAL LIABILITIES $2,519 $313 $433 $18,619
Debt Held by the Public (Note 11) Federal Employee and Veterans' Benefits (Note 12) Loss Reserves (Note 13) 539 Other Governmental 2 21 133 1,014T NET POSITION Un
expended Appropriations $8,562 $6,830 $8,458 $53,828
rations ( $6,193 $13,116 $9
Cumulative Results of Ope 2,369) 6,286 38,122566Total Net Position ,024 $91,950Total Liabilities and Net Position $1 $9,45 $1$8,712 3,429 7 10,569
Figures may not add to totals because of rounding.
305
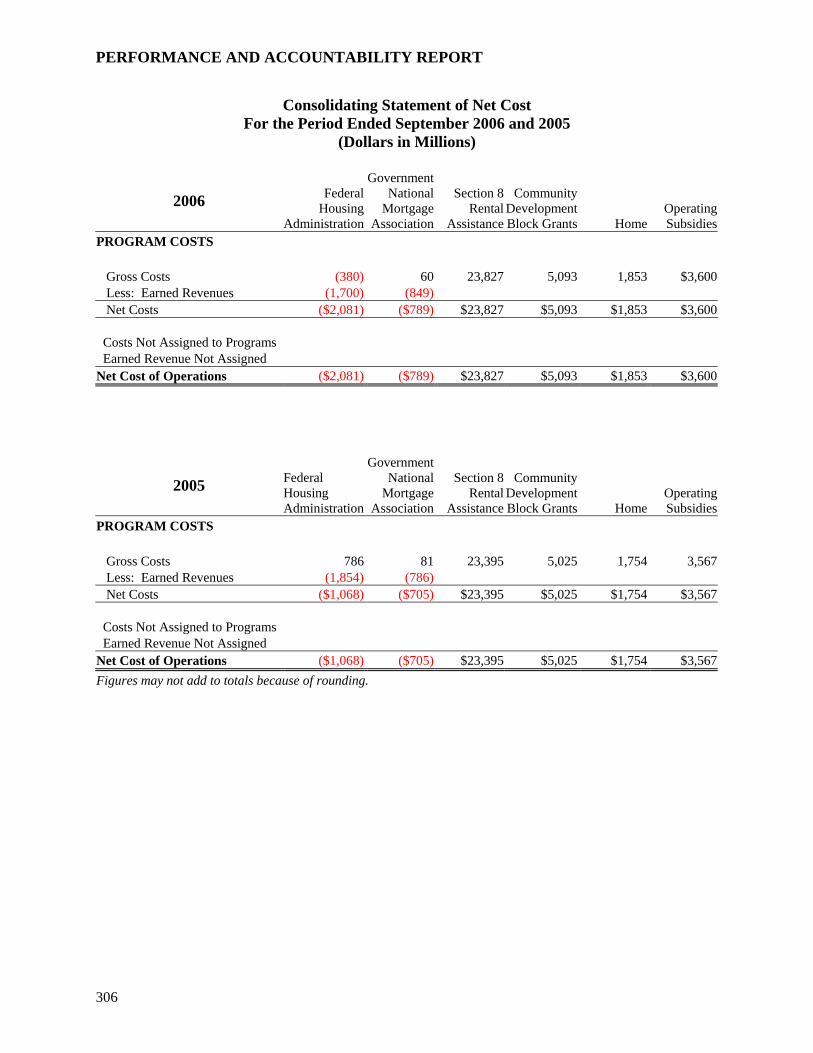
PERFORMANCE AND ACCOUNTABILITY REPORT
Consolidating Statement of Net Cost For the Period Ended September 2006 and 2005
2006 F
A
G
(Dollars in Millions)
overnment National
Mortgage ssociation
ederal Housing
dministration A
S
AOS
M COSTS
ection 8 Rental
ssistanceDB
Community evelopment lock Grants
Home perating ubsidies
PROGRA
23,827 $3ues (1 (
($2,08 ($789) $23,827 $5,0 $1,85 $3,6
Gross Costs (380) 60 5,093 1,853 ,600 Less: Earned Reven ,700) 849) Net Costs 1) 93 3 00 Costs Not Assigned to Programs
($2,081) ($789) $23,827 $5,093 $1,853 $3,600
Earned Revenue Not Assigned Net Cost of Operations
2005 Federal H ng A inistration
Governm
ousidm
ent National
Mortgage ssociation
SeRental
Assistance
Comopment
lock Grants
HomeOperating Subsidies
A
ction 8
munity Devel B
PROGRAM COSTS
81 23,395 5,025 1,754 3,567(1,8 (786)
($1 ($705) $23, $5,025 1,754 3,567
Gross Costs 786 Less: Earned Revenues Net Costs
54) ,068) 395 $ $
Costs Not Assigned to Programs
($1,0 ($705) $23,395 $5,025 $1,754 $3,567
Earned Revenue Not Assigned Net Cost of Operations 68) Figures may not add to totals because of rounding.
306
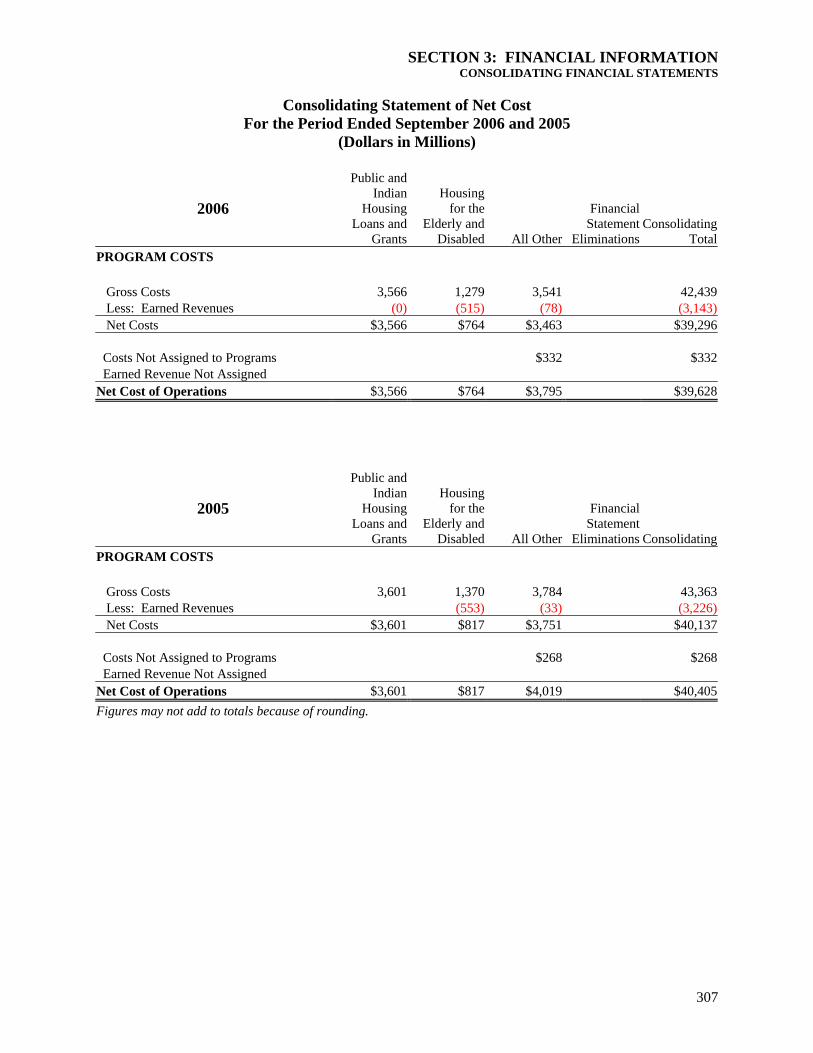
SECTION 3: FINANCIAL INFORMATION CONSOLIDATING FINANCIAL STATEMENTS
Consolidating Statement of Net Cost For the Period Ended September 2006 and 2005
2006
Public and
L ED A E
TS
(Dollars in Millions)
Indian Housingoans and
Grants
Housingfor the
lderly andisabled ll Other
Financial
Statement liminations
Consolidating Total
PROGRAM COS Gross Costs 3,566 1,279 3,541
ues (0) (515) (78) ( Net Costs $3,5 $76 $3 $39,2
42,439 Less: Earned Reven 3,143)
66 4 ,463 96 Costs Not Assigned to Programs $332 $
$3,566 $764 $3,795 $39,628
332 Earned Revenue Not Assigned Net Cost of Operations
2005
PubIndian
HousingLoans and
Grants
Housingfor the
Elderly andDisabled All O
Financial
Statement Elimination onsolidating
PROGRAM COSTS
lic and
ther
s C
1 3
( ($3,601 $817 $3,751 $40
Gross Costs 3,601 ,370
553,784(3
43,3633,2 Less: Earned Revenues
Net Costs ) 3) 26)
,137 Costs Not Assigned to Programs $268
$3,601 $817 $4,019 $40,
$268 Earned Revenue Not Assigned Net Cost of Operations 405 Figures may not add to totals because of rounding.
307

PERFORMANCE AND ACCOUNTABILITY REPORT
Consolidating Statement of Changes in Net Position
Cumulative Results of Operations
For the Period Ending September 2006 (Dollars in Millions)
Fnmtionalr
ty
ts of Period
ederal Housing istration
GoverNa
MoAssoAdmin
ent
tgage iation
SectR
Assisc
ion 8 ental tance
CommuniDevelopment Block Gran Home
Operating Subsidies
Net Position - Beginning - Earmarked Funds ( ,093)
s (22,546) (22,546) ,093)
11 - All Other FundBeginning Balances (11 Adjustments
unting Principles - Earmarked Funds
- All Other Funds eginning Balances, As Adjusted - Earmarked Funds ( ,093) - All Other Funds 546)
Total Beginning Balances, As Adjusted 22,546) ( ,093)
Changes in Acco - All Other Funds Corrections of Errors - Earmarked Funds
B
11(22,( 11
Budgetary Financing Sources: Other Adjustments - Earmarked Funds - All Other Fu Appropriations Used - Earmarked Funds
(1,178) (23 (5,036) (1,82 (3,534)ransfers In/Out Without Reimbursement
ds 731
unds
)
1,69
- Earmarked Funds - All Other Funds (23) Total Financing Sources - Earmarked Funds
nds
- All Other Funds ,697) 9)T - Earmarked Fun - All Other Funds Other Budgetary Financing Sources - Earmarked F
- All Other Funds (163) (57 (24) (65)Other Financing Sources: Transfers In/Out Without Reimbursement - Earmarked Funds - All Other Funds 2 Imputed Financing From Costs Absorbed From Others
- All Other Funds 1,222 (23,860) (5,093) (1,853) (3,600)Total Financing Sources 1,222 (23,860) (5,093) (1,853) (3,600) Net Cost of Operations - Earmarked Funds (789) - All Other Funds (2,081) 23,827 5,093 1,853 3,600 Net Change - Earmarked Funds (789) - All Other Funds (858) (33) Total All Funds - Earmarked Funds (11,882) - All Other Funds (23,405) (33)
Total All Funds (23,405) (11,882) (33)
Figures may not add to totals because of rounding.
308

SECTION 3: FINANCIAL INFORMATION CONSOLIDATING FINANCIAL STATEMENTS
Consolidating (continued)
Cumulative Results of Operations
Statement of Changes in Net PositionFor the Period Ending September 2006
(Dollars in Millions)
d
ngd
Grants
ged
Disabl All Other Eliminations Consol
Total
Public anIndian Housi
Loans an
Housinfor th
Elderly aned
Financial
Statement idating
Net Position - Beginning of Period - Earmarked Funds (590) (11,683)
s 9 )9 )
- All Other Fund 2,36 (6,286 24 (26,439)Beginning Balances 2,36 (6,286 (566) (38,122)Adjustments Changes in Acco
unting Principles
- Earmarked Funds
eginning Balances, As Adjusted - Earmarked Funds (590) (11,683) - All Other Funds 2,369 (6,28 2 (26,439)otal Beginning Balances, As Adjusted 2,369 (6,28 (566) (38,122)
- All Other Funds Corrections of Errors - Earmarked Funds - All Other Funds
B T
6)6)
4
Budgetary Financing Sources: Other Adjustments - Earmarked Funds - All Other Funds Appropriations Used - Earmarked Funds
)imbursement
- Earmarked Funds s
nds )ther Financing Sources:
19 1,711
- All Other Funds (56) (79)otal Financing Sources
- Earmarked Funds (1) (1)
(3,81
(1,231
(1)(4,007)
(1)(44,331) - All Other Funds
Transfers In/Out Without Re9 )
- All Other FundOther Budgetary Fi
1,199 (233)
1,697 nancing Sources
- Earmarked Funds - All Other Fu (85 (37) 427 (3)OTransfers In/Out Without Reimbursement - Earmarked Funds
- All Other Funds Imputed Financing From Costs Absorbed From Others - Earmarked Funds T
- All Other Funds (3,903) (68) (3,851) (41,005)Total Financing Sources (3,903) (68) (3,851) (41,006) Net Cost of Operations - Earmarked Funds (31) (820) - All Other Funds 3,566 764 3,826 40,448 Net Change - Earmarked Funds (32) (821) - All Other Funds (337) 697 (24) (557)Total All Funds - Earmarked Funds (622) (12,504) - All Other Funds 2,032 (5,589) (1) (26,996)Total All Funds 2,032 (5,589) (623) (39,500)Figures may not add to totals because of rounding.
309

PERFORMANCE AND ACCOUNTABILITY REPORT
Conso ued)
lidating Statement of Changes in Net Position (continFor the Period Ending September 2006
(Dollars in Millions)
Unexpended Appropriations
Federal Housing
G
Administration Association
Sec
Assistance Block Grant HomeOSubsidies
ning of Period
overnment National
Mortgage tion 8
Rental D
Community evelopment
s perating
Net Position - Begin - Earmarked Funds
s (11,849) (5,863 (764(609) (10,893) (11,849) (5,863) (764)
- All Other Fund (609) (10,893) ) )Beginning Balances Adjustments
ing Principles ds s
(609) (10,893) (11,849) (5,863) (764)As Adjusted (609) (10,893) (11,849 (5,863) (764)
Changes in Account - Earmarked Fun - All Other Funds Corrections of Error - Earmarked Funds - All Other Funds Beginning Balances, As Adjusted - Earmarked Funds
- All Other Funds Beginning Balances, ) Budgetary Financing Sources
eived s
s ( ( (20,920)
s 24
etc) s
83 2,222
s s 1,178 23,697 5,036 1,829 3,534
Appropriations Rec - Earmarked Fund - All Other Fund 1,281) 23,552) (1,775) (3,600)Appropriations Transfers In/Out - Earmarked Fund
35
- All Other Funds Rescissions,
Other Adjustments (
d
- Earmarked Fun 84 - All Other Funds 18 37
Appropriations Used - Earmarked Fund - All Other Fund Total Financing Sources - Earmarked Funds
2,367 (15,776) 72 (29)ces 2,367 (15,776 72 (29)
- All Other Funds 15
15 Total Financing Sour ) Net Change
- All Other Funds 15 2,367 (15,776 72 (29)
- Earmarked Funds ) Total All Funds - Earmarked Funds
s ( (27 (5(594) (8,526) (27,625 (5,791) (793)
- All Other Fund (594) 8,526) ,625) ,791) (793)Total All Funds ) Figures may not add to totals because of rounding.
310

SECTION 3: FINANCIAL INFORMATION CONSOLIDATING FINANCIAL STATEMENTS
Consolidating Statement of Changes in Net Position (continued) For the Period Ending September 2006
(Dollars in Millions)
Unexpended Appropriations
Indian gdts
Housingedd
C
od
Public and
HousinLoans an
Gran
for thElderly an
Disable All Other
Financial Statement
Eliminations onsolidating
TotalNet Position - Beginning of Peri - Earmarked Funds
s ) ) (8,813) s ) ) (
376 376 - All Other Fund (8,562 (6,830 (54,185)Beginning Balance (8,562 (6,830 8,437) (53,809)Adjustments
les s s
As Adjusted
ds - All Other Funds ) (6,830) (
sted (8,562) (6,830) (8,437) (53,809)
Changes in Accounting Princip - Earmarked Fund - All Other Funds Corrections of Errors
d - Earmarked Fun - All Other Funds Beginning Balances, - Earmarked Fun 376 376
(8,562 8,813) (54,185)Beginning Balances, As AdjuBudgetary Financin
eg Sources ived
ds (1) (1) (3,642) (981) (3,667) (59,4sfers In/Out
(24) 35 Rescissions, etc)
81 2,620
- Earmarked Funds 1
3,8 1,231 4,007 44,331 rces
Appropriations Rec - Earmarked Fun - All Other Funds 17)Appropriations Tran - Earmarked Funds - All Other FundsOther Adjustments ( - Earmarked Funds - All Other Funds 69 26 Appropriations Used
1 - All Other Funds 19Total Financing Sou - Earmarked Funds - All Other Funds 246 275 398 (12,431)
rces 246 275 (12,431)
Total Financing Sou 398 Net Change
d
s 6 5 39
Total All Funds
- Earmarked Fun - All Other Funds 24 27 8 (12,431)
- Earmarked Funds 376 376
(8,316) (6,555) (8,416) (66) (6,555) ( (6
- All Other Funds ,616)Total All Funds (8,316 8,040) 6,240)Figures may not add to totals because of rounding.
311

PERFORMANCE AND ACCOUNTABILITY REPORT
Consolidating Statement of Changes in Net Position For the Period Ending September 2005
(Dollars in Millions)
Cumulative Results of Operat nsio
Federal H
Admi A
Section 8
Assi
Community
HomeOperating
et Position-Beginning of Period
ousing nistration($20,470)
Government National
Mortgage ssociation($10,388)
Rental stance
D
evelopment Block Grants
SubsidiesN Adjustments Changes in Accounting Principles
s As Adjusted ($20 ($10,388)
Corrections of Error Beginning Balances, ,470) Budgetary Financing Sources Appropriations Used ($1,859) ($23,274) ($4,984) ($1,716) ($3,545)
out Reimbursement 576 cing Sources ($121) ($41) ($38) ($22)
rces ement 297
Costs Absorbed by
($1,008) ($23,395) ($5,025) ($1,754) ($3,567)
Transfers In/Out With Other Budgetary Finan Other Financing Sou Transfers In/Out Without Reimburs Imputed Financing fromOthers ($23)
Other Total Financing Sources Net Cost of Operations (1,068)
(2,076)(705) 23,395(705)
5,025 1,754 3,567Net Change Ending Balances ($22,546) ($11,093)
Unexpende ppropriationsd A
g
FedeHous
dministration
ent National
Mortgage ation
Sec
Assistance
Communevelopmlock Grants Home
OperatSubsidies
of Period ($ ($1 ($5,689) ($1
ral ing
A
Governm
Associ
tion 8 Rental
ity ent D
Bing
Net Position-Beginnin ($699) 12,958) 2,011) ,872)Adjustments
g
Changes in Accountin Principles Corrections of Errors
djusted ($6 ($1 ($12,011) ($5,6 ($1,
Beginning Balances, As A 99) 2,958) 89) 872) Budgetary Financing Sources
d ($1,987) ($22,726) ($4,891) ($1,915) ($2,458)Transfers In/Out 1
ts (Rescissions, etc) 81 1,518 70 25 211,859 23,274 4,984 1,716 3,545
$
Appropriations Receive
37 (1) Other Adjustmen Appropriations Used Total Financing Sources $89 $2,066 $162 ($174) 1,107
($609) ($10,892) ($11,849) ($5,863) ($764)
Ending Balances Figures may not add to totals because of rounding.
312

SECTION 3: FINANCIAL INFORMATION CONSOLIDATING FINANCIAL STATEMENTS
Consolidating Statement of Changes in Net Position (continued) For the Period Ending September 2005
(Dollars in Millions)
Cu nsmulative Results of Operatio
Publ
Indian HL
Aeriod $2,710 ($5,872) ($507) ($34,527)
ic andousing
oans andGrants
Housingfor the
Elderly andDisabled ll Other
Financial
Statement Eliminations
Consolidating Total
Net Position-Beginning of PAdjustments
ing Principles rs
lances, As Adjusted $2,710 ($5,872) ($507) ($34,527)
Changes in Account Corrections of Erro Beginning Ba
ources ($3,886) ($1,213) ($4,131) ($44,607)
ut Reimbursement 28 (220) 384ing Sources ($56) ($44) 323
eimbursement Imputed Financing from Costs Absorbed by Others
($3,942) ($1,230) ($4,077) ($44,000)
Budgetary Financing S Appropriations Used Transfers In/Out Witho
ncOther Budgetary Fina
ces
Other Financing Sour
Transfers In/Out Without R
7 304
(58)
(81)Other Total Financing Sources
s 3,601(341) (413) (59) (3,595)
Net Cost of Operation 817 4,019 40,405Net Change Ending Balances $2,369 ($6,286) ($566) ($38,122)
Unex nded Appropriationspe
Public andIndian Housi
Loans andGrants
Housingfor the
Elderly andDisabled All Othe
Financial
Statement inations Consolidatin
g of Period ($8 ($7 ($9 ($
ng
r Elim gNet Position-Beginnin ,647) ,060) ,194) 58,131)Adjustments
g Principles s
djusted ($8,6 ($7,0 ($9,1 (
Changes in Accountin Corrections of Error Beginning Balances, As A 47) 60) 95) $58,131)
inancing Sources d ($3,825) ($1,225) ($3,610) ($42,637)
scissions, etc) 23 242 225 2,206
3,886
Budgetary F Appropriations ReceiveTransfers In/Out (9) 127Other Adjustments (ReAppropriations Used
31 1,213 4,1
$737 44,607
Total Financing Sources $84 $230 $4,303
($8,562) ($6,830) ($8,458) ($53,828)
Ending Balances Figures may not add to totals because of rounding.
313

PERFORMANCE AND ACCOUNTABILITY REPORT
Combining Statement of Budgetary Resources For the Period Ending September 2006
(Dollars in Millions)
Federal Housing
Administration
Government Nation
MortgaA
on en
nity ent
ants H
Public and Indian
Housing Loans &
Housing for the Elderly
al ge
ssociation
SectiR
Assis
8 tal
tance
CommuDevelopmBlock Gr ome
OperatingSubsidies
and DisabledGrants
Budgetary Resources: Unobligated Balance, Brought $23,602 $11,579 $2,111 $ 218 $318 $40 $1,337
97 156 32 2
Appropriation 1,281 11 23,552 2 920 1, 75 3,600 3,64 981
9 1
Earned 2,636 722 8 1,516
3
s
nced Received
Sources
ear w/o
able ers from
Trust Funds
Subtotal $3,871 0 $1,775 $3,600 $3,740 $2,497
1, $2 1 Forward Recoveries of Prior Year
Unpaid Obligations 1, 0 20 42
Budget Authority 0, 7 2 Borrowing Authority 0 Contract Authority Spending Authority from Offsetting Collections Collected 8 Change in Receivable from Fed (55) Sources Change in Unfilled Customer Order Adva W/O Advance from Federal Anticipated for Rest of Y Advance Previously Unavail Expenditure Transf
$736 $23,552 $20,92 Non Expenditure Transfers, Net 156 (24) Temporarily Not Available Per PL
manently not available (151) (83) ) $27,418 ,
PerT
(4,$12,471
720),099 $22
(18) (36077 6
(724) (1,464)$22 063 $2, $3,56 $3,436 $2,413otal Budgetary Resources
Status of Budgetary Resources:
5,028 15,7 100
$5,028 $100 $19,857 $1 798 $1, 07 $3,564 $3,021 $1,172
Obligations Incurred Direct 19,857 98 1,807 3,564 3,021 1,172 Reimbursable Subtotal 5, 8 Unobligated Balances
161 087 237 268
$161 $0 087 $6,237 68
Apportioned 1, 6, 1 405 1,157 Exempt from Apportionment Subtotal $1, $2 $1 $405 $1,157 Unobligated Balances Not Available 22,229 12,371 28 2
otal Status of Budgetary $27,418 $12,471 9 $22,0
1,156 1 11 84
T $2 Resources 2,09 63 $2,077 $3,566 $3,436 $2,413
Figures may not add to totals because of rounding.
314

SECTION 3: FINANCIAL INFORMATION CONSOLIDATING FINANCIAL STATEMENTS
Combining Statement of Budgetary Resources (continued) For the Period Ending September 2006
(Dollars in Millions)
Eliminations Al
4th QtrgT
Federal using ration
Non geta
Other NonBudgetary
CrediProgram
cou
4th QuarterNonBudgetary
Credit am
Budgetary Resources: l Other
Bud
etary otal
HoAdminist
Bud ry Ac
t
nts
ProgrFinancAccou
ing nts Total
Unoblig Recoveries of Pri
ated Balance, Brought Forward $2,8 38 891 $6,006
692 2,040 6 6 2,046
3,676 59,43
Borrowing Authority 19 887 906
m Offsetting Collections
788 5,750 ,470 25 11,496 17,245
Change in Receivable from Fed Sources (52) (46) (98)
(121) (121) 7 7 (5) (5)
w/o Advance
m Trust Funds $4,350 041 2,312 $21 $12,332
12 $43, 1 $5, $115 $49,387or Year Unpaid
Obligations Budget Authority Appropriation 8 59,438 887 Contract Authority Spending Authority fro
Earned Collected 11
(46) Change in Unfilled Customer Orders Advanced Received
Advance from Federal Sources (121)
2 W/O Anticipated for Rest of Year
Previously Unavailable
Expenditure Transfers fro$65, Subtotal $1 $77,373
Non Expenditure Transfer Temporarily Not Av
s, Net 24 15 ailable Per PL
Permanently not available ( 187) (2 6) (10,091)Total Budgetary Resources $16,023 $136 $1 8 $118,871
6 156
(709) (7,905) $7,169 $102,713
2, ,186,15
Status of Budgetary Resources:
bligations Incurred 3, 54,14 8,99 10 9,000
e 100 100 Subtotal $3,901 4,246 991 $10 $9 $63,246
O
Direct 901 6 1 63,146 Reimbursabl
$5 $8, ,000 Unobligated Balances
2, 11,41 2,13 14 2,146 Exempt from Apportionment
$2,100 1,416 $2,131 $14 $2 $13,562
Apportioned 100 6 1 13,562 Subtotal $1 ,146 Unobligated Balances Not Available 1, 37,051 4,900 112 5,012
getary Resources $7,169 $102,713 $16,023 $16,158 $118168 42,063
Total Status of Bud $136 ,871
Figures may not add to totals because of rounding.
315

PERFORMANCE AND ACCOUNTABILITY REPORT
Combining Statement of Budgetary Resources (continued) For the Period Ending September 2006
Public and Indian
Housing Loans &
Grantslance
(Dollars in Millions)
Federal Housing
Administration
Government National
Mortgage Association
Section 8 Rental
Assistance
Community Development Block Grants Home
Operating Subsidies
Housing for the Elderly
and Disabled
Change in Obligated Ba Obligated Balance, Net Unpaid O
bligations, Brought $1,067 $121 $21,819 $10,659 $5,557 $872 $10,421 $5,530
stomer ederal (261) (78)
d $806 $43 $21,819 $10,659 $5,557 $872 $10,4 $5,530
5,028 100 19,857 15,798 1,807 3,564 3,021 1,172 (5,018) (111) (23,534) (5,012) (1,812) (3,496) (3,812) (1,275)
erred,
l Sources d
veries of Prior Year (97) (1,156) (32) (2) (20) (42)
ncollected Customer ources 55 (3)
f
bligations
(207) (
Net -
5,018 111 23,534 5,012 1,812 3,496 3,812 1,275 setting Collections (2 (722) (1
Offsetting (677) (12)
(otals because of roundin
Forward Less: Uncollected Cu Payments from F Sources
Total Unpaid Obligate Balance, Net Obligations Incurred
21
, Net Less: Gross Outlays
Balance Transf
Obligated Net Actual Tra
nsfers, Unpaid Obligations Actual Tran
sfers, Uncollected Customer Payments from Federa
Total Unpaid Obligate Balance Transferred, Net Less: Reco Unpaid Obligations, Actual Change in U Payments from Federal S
Obligated Balance, Net - End o Period
Unpaid O 980 109 16,986 21,413 5,550 940 9,610 5,385 Less: Uncollected Customer Payments from Federal Sources
80)
Total Obligated Balance, End of Period $774 $29 $16,986 $21,413 $5,550 $940 $9,610 $5,385
Net Outlays Gross Outlays Less Off ,636) (88) ,516) Less: Distributed Receipts
Net Outlays Figures may not add to t
$1,706 $611) $23,521 $5,012 $1,812 $3,496 $3,724 ($241)g.
316

SECTION 3: FINANCIAL INFORMATION CONSOLIDATING FINANCIAL STATEMENTS
Combining Statement of Budgetary Resources (continued) For the Period Ending September 2006
(Dollars in Millions)
Eliminations All Other
4th QtrBudgetary
Total
Federal Housing
Administration Non
Budgetary
Other NonBudgetary
Credit Program
Accounts
4th QuarterNonBudgetary
Credit Program
Financing Accounts Total
Change in Obligated Balance Obligated Balance, Net
ard $1 $ $1,2 $1,26 $7ected Customer Payments
urces (7) (346) (52) (20) (72) (418)
bligated Balance, Net $ $1,211 ($20) $1,191 $
Unpaid Obligations, Brought Forw Less: Uncoll
3,172 69,218 63 3 0,481
from Federal So
Total Unpaid O 13,165 $68,872 70,063 Obligations Incurred, Net 3,901 54, 8, 10 9, 63,
(4,747) (48,816) (8,871) (10) (8,881) (57,696)
sfers, Unpaid Obligations Transfers, Uncollected Customer
from Federal Sources
246 991 000 246 Less: Gross Outlays Obligated Balance Transferred, Net Actual Tran
Actual Payments
Total Unpaid Obligated Balance Transferred, Net
Less: Recoveries of Pr Obligations, Actual
ior Year Unpaid (692) ( (6) (6) (2
ents (7 45 46 95
nd of Period 11,634 72,608 1,376 1,376 73,985
ollected Customer Payments
d of $11,620 $72,307 $1,370 ($16) $1,355 $73,662
2,040) ,046)
Change in Uncollected Customer Paym from Federal Sources ) 5 51
Obligated Balance, Net - E Unpaid Obligations Less: Unc from Federal Sources (14) (301) (5) (16) (21) (323)
Total Obligated Balance, Net - En Period
Gross Outlays 4,747 48,816 8,871 10 8,881 57,696 (667) (5,629) (11,470) (25) (11,496) (17,124)
setting Receipts (28) (717) (717) ($ ($ ($ $
Net Outlays Less Offsetting Collections Less: Distributed Off Net Outlays $4,052 $42,470 2,599) 16) 2,615) 39,855 Figures may not add to totals because of rounding.
317

PERFORMANCE AND ACCOUNTABILITY REPORT
Combining Statement of Budgetary Resources For the Period Ended September 2005
(Dollars in Millions)
Federal HousingAd
ministration
Government National
Mortgage Association
Section 8 Rental
Assistance
Community Development Block Grants Home
Operating Subsidies
Public and Indian
Housing Loans &
Grants
Housing for the Elderly
and Disabled
Budgetary Resources: Unobligated Balance, Brought $23,978 $10,841 $2,254 $1,346 $457 $3 $398 $1,664
f Prior Year
ion 1,987 11 22,726 4,891 1,915 2,458 3,825 1,225
2,757 640 2 84 1,059 13
unds $4, $ $2
Forward Recoveries o Unpaid Obligations Budget Authority Appropriat
20 1,454 28 6 2 22 24
Borrowing Authority (9) 20 Contract Authority
m
Spending Authority fro Offsetting Collections Earned
Collected Change in Receivable fromFed Sources Change in Unfilled Customer Orders
Advanced Received W/O Advance from Federal
Sources Anticipated for Rest of Year w/o Advance
Previously Unavailable Expenditure Transfers from Trust F
Subtotal 748 $651 22,726 $4,893 $1,915 ,458 $3,929 $2,284 Non Expenditure Transfers, Net Temporarily Not
208 1
vailable (311) (4,149) (70) (25) (21) (735) (1,237)ary Resources $28,435 $11,699 $22,286 $6,199 $2,353 $2,442 $3,614 $2,735
Available Per PL Permanently not a
Total Budget Status of Budgetary Resources:
$120 $20,175 $4,980 $2,035 $2,440 $3,213 $1,398
Obligations Incurred Direct 4,833 20,175 4,980 2,035 2,440 3,213 1,398 Reimbursable
Subtotal $4,833 120
Unobligated Balances Apportioned 77 0 2,035 1,183 318 384 1,320 Exempt from Apportionment
Subtotal $77 $0 $2,035 $1,183 $318 $0 $384 $1,320 Unobligated Balances Not Available 23,525 11,579 76 36 0 2 17 17
Total Status of Budgetary Resources $28,435 $11,699 $22,286 $6,199 $2,353 $2,442 $3,614 $2,735
Figures may not add to totals because of rounding.
318

SECTION 3: FINANCIAL INFORMATION CONSOLIDATING FINANCIAL STATEMENTS
Combining Statement of Budgetary Resources (continued) For the Period Ended September 2005
(Dollars in Millions)
El
ought Forward $3,791 $44,731 $4,608 $114 $4,723 $49,454
39
Appropriation 11
700 5,243 11,722 18 11,740 16,983
12 (86) (86 (74
e
$5,135 $48,739 $12,810 $22 $12,831 $61,570
iminations All Other
4th Qtr Budgetary
Total
Ad
Federal Housing
ministration Non
Budgetary
Other NonBudgetary
Credit Program
Accounts
4th QuarterNonBudgetary
Credit Program
Financing Accounts Total
Budgetary Resources: Unobligated Balance, Br Recoveries of Prior Year Unpaid Obligations Budget Authority
439 1,996 39 2,035
3,619 42,657 42,657
Borrowing Authority 1,174 1,174 1,185 Contract Authority 757 757 757Spending Authority from Offsetting Collections
Earned Collected
Change in Receivable from Fed Sources ) )
Change in Unfilled Customer Orders Advanced Received
66 66 66
W/O Advance from Federal Sources Anticipated for Rest of Year w/o
(7) (7) (0) 3 3 (4)
Advance
Previously Unavailabl Expenditure Transfers from Trust Funds Subtotal Non Expenditure Transfers, Net 9 218 218 Temporarily Not Available Per PL
ot available (1,593) (8,142) (1,214) (1,214) (9,356) Resources $ $ $1 $136 $1 $
Permanently n Total Budgetary 7,780 87,542 6,243 6,379 103,922 Status of Budgetary Resources:
curred Direct 4,960 44,033 10,352 21 10,373 54,407
Reimbursable 120 120 Subtotal $4,960 $44,153 $10,352 $21 $10,373 $54,526
Obligations In
Unobligated Balances Apportioned 2,407 7,723 2,649 13 2,662 10,385 Exempt from Apportionment Subtotal $2,407 $7,723 $2,649 $13 $2,662 $10,385 Unobligated Balances Not Available 414 35,666 3,242 102 3,344 39,010 Total Status of Budgetary Resources $7,780 $87,542 $16,243 $136 $16,379 $103,922
Figures may not add to totals because of rounding.
319
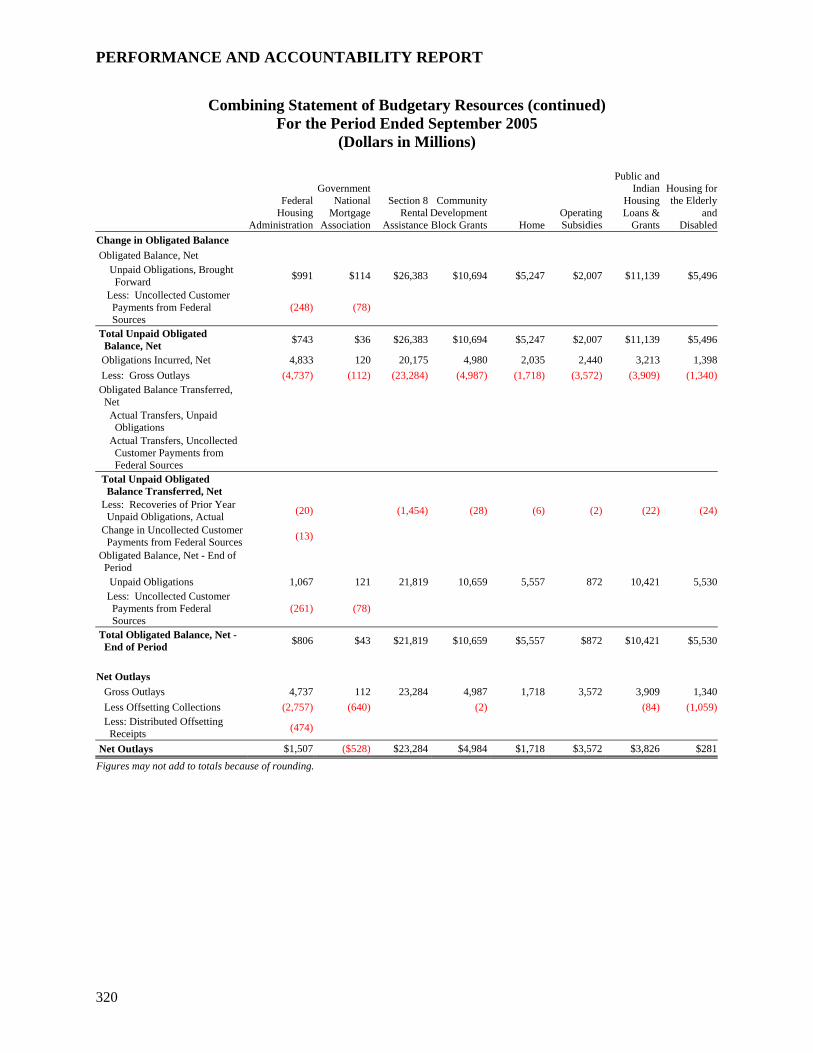
PERFORMANCE AND ACCOUNTABILITY REPORT
Comb ued)
Federal ousing Operating
Subsidies Change in Obligated Balance
ining Statement of Budgetary Resources (continFor the Period Ended September 2005
(Dollars in Millions)
HAdministration
Government National
Mortgage Association
Section 8 Rental
Assistance
Community Development Block Grants Home
Public and Indian
Housing Loans &
Grants
Housing for the Elderly
and Disabled
Obligated Balance, Net Unpaid O
bligations, Brought $991 $114 $26, $10,69 $5,247 $2,007 $11,13 $5,496
stomer ederal (248) (78)
d $743 $36 $26,383 $10,694 $5,247 $2,007 $11,1 $5,496
Forward Less: Uncollected Cu
383 4 9
Payments from F Sources
Total Unpaid Obligate Balance, Net 39
Obligations Incurred, Net Less: Gross Outlays
4,833 120 20,175 4,980 2,035 2,440 3,213 1,398 (4,737) (112) (23,284) (4,987) (1,718) (3,572) (3,909) (1,340)
Balance Transferred,
ncollected ts from
Obligated Net
Actual Transfers, Unpaid Obligations
Actual Transfers, U Customer Paymen Federal Sources
Total Unpaid Obligated Balance Transferred, Net
Less: Recoveries of Prior Year Unpaid Obligations, Actual Change in Unco
(20) (1,454) (28) (6) (2) (22) (24)
llected Customources (13)
Obligated Balance, Net - End of Period
bligations r
ayments from Federal (261)
al Obligated Balance, Net - $43 $21, $10, $5, $872 $10,
er Payments from Federal S
Unpaid O 1,067 121 21,819 10,659 5,557 872 10,421 5,530 Less: Uncollected Custome P Sources Tot
(78)
End of Period $806 819 659 557 421 $5,530
Net Outlays
4,737 112 23,284 4,987 1,718 3,572 3,909 1,340 ections (2,757) (640) (2) (84) (1,059)setting
s (474)
$1, ($ $23, $4, $1,
Gross Outlays Less Offsetting Coll Less: Distributed Off Receipt
Net Outlays 507 528) 284 984 718 $3,572 $3,826 $281 Figures may not add to totals because of ro unding.
320

SECTION 3: FINANCIAL INFORMATION CONSOLIDATING FINANCIAL STATEMENTS
Combining Statement of Budgetary Resources (continued)
lance
For the Period Ended September 2005 (Dollars in Millions)
Eliminations All Other
4th QtrBudgetary
Total
Federal Housing
Administration Non
Budgetary
Other NonBudgetary
Credit Program
Accounts
4th QuarterNonBudgetary
Credit Program
Financing Accounts Total
Change in Obligated Ba Obligated Balance, Net
ard $1 $ $1, $1, $7ected Customer Payments
from Federal Sources (15) (341) (139) (17) (155) (496)
bligated Balance, Net $ $1,125 ($17) 109 $
Unpaid Obligations, Brought Forw Less: Uncoll
3,469 75,539 264 264 6,803
Total Unpaid O 13,454 $75,198 $1, 76,306 Obligations Incurred, Net 4,960 44, 2 5
(4 (48, (10,314) (21) (10,335) (58,
sfers, Unpaid Obligations Transfers, Uncollected Customer
from Federal Sources
erred, Net
153 10,352 1 10,373 4,526 Less: Gross Outlays ,805) 465) 800) Obligated Balance Transferred, Net Actual Tran
Actual Payments
Total Unpaid Obligated Balance Transf
Less: Recoveries of Prior Year Unpaid Obligations, Actual (439) (1,996) (39) (39) (2,035)
(
riod 13,18 69,23 1,263 1,263 70,494
(7) (346) (52) (20) (72) (418)
ated Balance, Net - End of Period $13,1 $68 $1,211 ($20) $1,191 $70,076
Change in Uncollected Customer Payments from Federal Sources Obligated Balance, Net - End of Pe
8 (5) 87 3) 83 78
Unpaid Obligations 5 1 Less: Uncollected Customer Payments
eral Sources from Fed Total Oblig
77 ,885
Less Offsetting Collections (766) (5,308) (11,722) (18) (11,740) (17,049)
ipts (9 (483) (483)$4,029 $42,67 ($1,408) $3 ($1,406) $41,268
Net Outlays Gross Outlays 4,805 48,465 10,314 21 10,335 58,800 Less: Distributed Offsetting Rece )
4 Net Outlays Figures may not add to totals because of rounding.
321

PERFORMANCE AND ACCOUNTABILITY REPORT
Consolidating Statement of Financing For the Year Ended September 2006
(Dollars in Millions)
Fede
ral H
ousi
ng
inis
traA
dmtio
n G
over
nmen
t
Nat
iona
l M
ortg
age
Ass
ocia
tion
Sect
ion
8 R
enta
l A
ss
De
ent
Blo
ck G
rant
s
Ho
ce Activi
ista
nce
Com
mun
ity
velo
pm
Ope
ratin
g Su
bsid
ies
me
Resources Used to Finan ties: Budgetary Resources ObligatedObligations In
$14,018 $100 $19,857 $15,798 $1,807 $3,564
ffsetting Collections & Recoveries (14,108) (725) (1,156) (2) g Collections ($90) ($625) $18,701 $15,766 $1,805 $3,564
curred
Less: Spending Authority from OObligations Net of Offsettin
(32)
Less: Offsetting Receipts Net Obligations
(677) (12) ($767) ($625) 689 $15,766
$18,
$3,564$1,805
s of Property
rsement ($1,692) ($156) s Absorbed by Others 23
($8) ce Activities ($1,669) ($164)
Other Resources Donations & Forfeiture Transfers In/Out Without ReimbuImputed Financing from CostOther Resources Net Other Resources Used to FinanTotal Resources Used to Finance Activities ($2,436) ($789) $18,689 $15 6 $1,805 $3,564,76Resources Used to Finance Items Not Part of the Net Cost of Operations
bligated for s not yet Provided ($124) 837 ($10, $24 (
Prior Per (3,768) (17) Receipts
13,104 12 quisition of Assets (6,
Resources perations (274) 163 57 24 65
Items
Change in Budgetary Resources O Services/Benefits Ordered but
Good $4, 730) $29)
Resources That Fund Expenses from iods Budgetary Offsetting Collections and Not Affecting Net Cost of Operations Resources Financing Ac 994)Other Changes to Net Obligated Not Affecting Net Cost of OTotal Resources Used to Finance Not Part of the Net Cost of Operations $ ,996 3) $48 $36
otal Resources Used to Finance e Net Cost of erations ($492) ($789) $23,685 $5, 93 $1,853 $3,5991,944 $4 ($10,67
0T th OpComponents of Net Cost of Opera ons Not Req g/Gener
Current Period: ti uirin ating Resources in theing Resources in Fut riods Components Requiring or Generat ure Pe
Increase in Annual Leave Liability (Note 2 osal Liability
f Credit Subsidy Expense $
otal Requiring/Generating Resources in Future Periods $415
2) Increase in Environmental/Disp Re-estimates o 415
Exchange Revenue Receivable from the Public ther O
TComponents Not Requiring/Generating Resources Depreciation and Amortization Revaluation of Assets or Liabilities ($744) Other (1,260) $142 Total Components of Net Cost of Operation Not Requiring/Generating Resources ($2,004) $142
Total Components of Net Cost of Operations Not Requiring/Generating Resources in the Current Period ($1,589) $142
Net Cost of Operations ($2,081) ($789) $23,827 $5,093 $1,853 $3,599Figures may not add to totals because of rounding.
322

SECTION 3: FINANCIAL INFORMATION CONSOLIDATING FINANCIAL STATEMENTS
Consolidating Statement of Financing For the Year Ended September 2006
(Dollars in Millions)
ndia
n s
Hou
sing
for t
he
Elde
rly a
nd
Dis
able
d
All
Oth
er
Con
solid
atin
g
Resources Used to Finance Activities:
Publ
ic a
nd I
Hou
ing
Loan
s an
d G
rant
s
Fina
ncia
l St
atem
ent
Elim
inat
ions
Budgetary Resources Obligated $1,172 ,910
Collections & Recoverie ( (1,558) 386) (1($386) ,524 $44,171
Obligations Incurred $3,021 $3 $63,246Less: Spending Authority from Offsetting s 108) (1, 9,075)Obligations Net of Offsetting Collections $2,913 $2Less: Offsetting Receipts (28)
($386) 496(717)
Net Obligations $2,913 $2, $43,454
($19) ($1,867)
Others 56 79 (7
sed to Finance Activities $38 (1,795)
Other Resources Donations & Forfeitures of Property Transfers In/Out Without Reimbursement Imputed Financing from Costs Absorbed byOther Resources Net Other Resources U
)
Total Resources Used to Finance Activities $2, ($386) $2,534 913 $41,659Resources Used to Finance Items Not Part of the Net Cost of Operations Change in Budgetary Resources Obligated for Goods
ovided $818 $107 ,432 (3,665)om Prior Periods (2)
Budgetary Offsetting Collections and Receipts Not Affecting Net Cost of Operations 1,515 72 1Resources Financing Acquisition of Assets (61) (6
Not Affecting Net Cost of Operations 3 174) ources Used to Finance Items N Part of the Net Cost of O $653 $1,658 $1,267 (71)
Services/Benefits Ordered but not yet Pr $1Resources That Fund Expenses fr (3,787)
4,703,967)88
Other Changes to Net Obligated Resources otal Res
(253) 7 ( (355) T ot perations
Total Resources Used to Finance the Net Cost of Operations $3,566 $1,272 $3,801 $41,588Components of NCurrent Period:
et Cost of Operations Not Requiring/Generat our ing Res ces in the
Future Per Components Requiring or Generating Resources in iods Increase in Annual Leave Liability (Note 22) $4
ironmental/Disposal Liability Re-estimates of Credit Subsidy Expense (9) 406
xchange Revenue Receivable from the Public ($510) (8) (519)Other 5 5Total Requiring/Generating Resources in Future Periods ($510) ($8) ($104)
$4Increase in Env
E
Components Not Requiring/Generating Resources Depreciation and Amortization $21 $21 Revaluation of Assets or Liabilities 3 (741) Other (18) (1,136)Total Components of Net Cost of Operation Not Requiring/Generating Resources $3 $3 ($1,856)Total Components of Net Cost of Operations Not Requiring/Generating Resources in the Current Period ($507) ($5) ($1,960)
Net Cost of Operations $3,566 $765 $3,795 $39,628Figures may not add to totals because of rounding.
323

PERFORMANCE AND ACCOUNTABILITY REPORT
Consolidating Statement of Financing For the Year Ended September 2005
(Dollars in Millions)
Federal Housing
Administration
ernment nal g
Sectionenttan
Comm
eHome
Operating Su
Resources Used to Finance Activities:
Gov
NatMo
Asso
iortga e ciation
RAssis
8 al ce
DevBloc
unity lopment k Grants
bsidies
Budgetary Resources Obligated
$15, 5 $20,175 $4,980 $2,035 $2,440fsetting Collections & (14,464) ,454) (31)
$72 8,7 $4, $2,0 $2,438
Obligations Incurred 18 $120Less: Spending Authority from Of (640) (1 (6) (2)Recoveries Obligations Net of Offsetting Collections 1 ($520) $1 21 949 29Less: Offsetting Receipts (474)
$247 721 $4,949 $2,029 $2,43
Net Obligations ($520) $18, 8Other Resources
itures of Property ent ($297) ($208)
Others 23 $23
ces Used to Finance Activities ($274) ($185)
Donations & ForfeTransfers In/Out Without ReimbursemImputed Financing from Costs Absorbed byOther Resources Net Other Resour
($27 70 8,721 $4,949 $2,029 $2,43) ($ 5) $1 8Total Resources Used to Finance Activities Resources Used to Finance Items Not Part of the Net Cost of Operations Change in Budgetary Resources Obligated for Goods
($56) ,553 $35 ($312) $1,107 (3,161)
Affecting 13,158
(10,115) ces Not Affecting Net (398) 121 41 38 22
t Part of the Net ($572) ,675 $76 ($274) $1,129
Services/Benefits Ordered but not yet Provided Resources That Fund Expenses from Prior Periods
$4
Budgetary Offsetting Collections and Receipts Not Net Cost of Operations Resources Financing Acquisition of Assets Other Changes to Net Obligated ResourCost of Operations Total Resources Used to Finance Items NoCost of Operations $4
t Cost of Operations ($598) 395 $5,025 $1,7 $3,5($705) $23, 54 67Total Resources Used to Finance the NeComponents of Net Cost of Operations Not
urrent Period: Requiring/Generating Resources in the CComponents Requiring or Generating Resources in Future Periods
Increase in Annual Leave Liability (Note 22)
$2,150
re Periods $2,150
Increase in Environmental/Disposal Liability Re-estimates of Credit Subsidy Expense Exchange Revenue Receivable from the PublicOther Total Requiring/Generating Resources in Futu
ts Not Requiring/Generating Resources Componen Depreciation and Amortization
($1,337) (1,283)
eration Not g/Generating Resources ($2,619)
Revaluation of Assets or Liabilities Other Total Components of Net Cost of Op RequirinTotal Components of Net Cost of Operations Not Requiring/Generating Resources in the Current Period ($470 )
Net Cost of Operations ($1,068 39 $5,025 $1,754 $3,56) ($705) $23, 5 7Figures may not add to totals because of rounding.
324

SECTION 3: FINANCIAL INFORMATION CONSOLIDATING FINANCIAL STATEMENTS
Consolidating Statement of Financing For the Year Ended September 2005
(Dollars in Millions)
Public andIndian
HousingLoans and
Grants
usinhne
ther
Financial
E nsolida
TResources Used to Finance Activities:
Hofor t
Elderly aDisabl
gedd All O
Stalimi
tement ations
Con
ting otal
Budgetary Resources Obligated $3,21 $1, 8 $4,981 $54,526
rity from Offsetting Collections & Recoveries (106) 3) 1 $3,107 15 ,762
Obligations Incurred 3 39Less: Spending Autho (1,08 (1,2 9) (19,006)Obligations Net of Offsetting Collections $3 $3 $35,520Less: Offsetting Receipts (9
$3,107 ,752 $3) (483)
Net Obligations $315 $3 5,037Other Resources
tures of Property ent ($7) ($512)
Others 58Other Resources $5 1 53
es Used to Finance Activities $5 $52 (4
Donations & ForfeiTransfers In/Out Without ReimbursemImputed Financing from Costs Absorbed by 58
Net Other Resourc 01)Total Resources Used to Finance Activities $3,107 ,804 $320 $3 $34,636Resources Used to Finance Items Not Part of the Net Cost of Operations Change in Budgetary Resources Obligated for Goods
$697 ($69) 312s (1)
ffecting Net Cost of 1,059 45
83 12 (83) (
(286) 44 (84)
$493 23
Services/Benefits Ordered but not yet Provided $357 $6,Resources That Fund Expenses from Prior Period (3,162)
14,262Budgetary Offsetting Collections and Receipts Not AOperations Resources Financing Acquisition of Assets 10,103)Other Changes to Net Obligated Resources Not Affecting Net Cost of Operations (501)
Total Resources Used to Finance Items Not Part of the Net Cost of Operations $1,046 $ 5 $6,808
Total Resources Used to Finance the Net Cost of Operations $3,600 $1, 5 $4,040 $41,44436Components of Net Cost of Operations Not Requiring/Generating Resources in the Current Period: Components Requiring or Generating Resources in Future Periods Increase in Annual Leave Liability (Note 22) $2 $2
ity 0 (19)
ge Revenue Receivable from the Public ($554) (9) (56 3
($554) $1,573
Increase in Environmental/Disposal Liabil 0Re-estimates of Credit Subsidy Expense 2,131Exchan 3)Other 3Total Requiring/Generating Resources in Future Periods ($23)Components Not Requiring/Generating Resources Depreciation and Amortization $15
ation of Assets or Liabilities (1) $1 5 (12)
$5 $2
$15 Revalu (1,338) Other (1,289)Total Components of Net Cost of Operation Not Requiring/Generating Resources $1 ($2,612)
Total Components of Net Cost of Operation Not Requiring/Generating $1 9) 2 Resources in the Current Period ($54 ($ 1) ($1,039)
Net Cost of Operations $3,60 $817 $4,019 $40,4051Figures may not add to totals because of rounding.
325

PERFORMANCE AND ACCOUNTABILITY REPORT
Required Supplementary Stewardship Information This section provides information on UD that do not meet the criteria for
formation required to be reported or audited in HUD’s financial statements but are, nonetheless, important to understand HUD’s operations and financial conditions. The tewardship objective requires that HUD report br c s assoc
with these resources. Such reporting will p us sions and activit s.
ship reporting responsibilities ex the st mad n r ol Propert an C al esear nd
ative immateriality of calc n in th ic of ive costs, most of the amounts r ted belo reflec
nvestments addressed in this section ar ribu to amsisions/departments:
Development (CPD
d Indian Housing (PIH),
earch and
l
PROGRAM
unities by pro g integrated approaches th t provide ent, and expanded economic opportunities for low and
D makes stewardship investments through the following CPD
nts are ided to State and local communities, varie com ty opm tiv wi
ivities are designed to enefit lo and m e persons, t, and meet other urgent community development
ds. State and local communities use the funds as they deem necessary, as long as the use one of these objectives. A portion of the funds supports the of property owned by State and local governments, while other
ment and job training to low and moderate-income persons.
isaster Grants help State and local governments recover from m jor natural disasters. A ac uire, olish physical property.
nt Partnership provides formula grants to States and localities (used th local nonprofit groups) to fund a wide range of activities that build,
le housing for low-income persons.
individuals to ain education, employment skills, and truction tr to become more productive
resources entrusted to Hin
s on the rovide infor
oad outmation th
omes oat will h
f its actionelp report
iated sess ers a
the impact of HUD’s operat ie
HUD’s steward tend to inve ments e by a umbe f HUD programs in Non-Federal Physica y, Hum apit , and R ch aDevelopment. Due to the rel the ulatio s and e appl ation the related administrat epor w t direct program costs only. The i e att table progr administered through the following div
• Community Planning and ),
• Public an
• Policy Development and Res
• Healthy Homes and Lead Hazard Contro
OVERVIEW OF HUD’S MAJOR S
CPD seeks to develop viable comm motin adecent housing, a suitable living environmmoderate-income persons. HUprograms:
• Community Development Block Gra provwhich use these funds to support a wide ty of muni devel ent ac ities thin their jurisdiction. These actaid in the prevention of slums and bli
b w oderate-incomgh
neeof these funds meet at least acquisition or rehabilitationfunds help to provide employ
• D aportion of these funds can be used to q rehabilitate or dem
• Housing Investmeoften in partnership wibuy, and/or rehabilitate affordab
• YouthBuild grants assist youngmeaningful work experience in cons
obtade, enabling them
and self-sufficient.
326

SECTION 3. FINANCIAL INFORMATION REQUIRED SUPPLEMENTARY STEWARDSHIP INFORMATION
PIH ensures safe, decent, an s for residents’ self sufficiency and economic ind ty of all program participants. HUD makes stewardshi he following PIH programs:
The Public Housing Capital Fund provides grants to PHAs to improve the physical conditions and to upgrade the management and operation of existing public housing.
• Neighborhood Network Initiative grants are pro PHAs, to t of public housing residents in distressed public housing units.
upport the acquisition or reh bilitation of PHA-owned property, while to provide education and job training to nts co ities targete
g Block Grants provide funds needed to allow tri al hou organ ation existing units and to begin development of new units to mee critical long
elopment Block Grants provide funds to Indi rganizations cluding decent housing, a suitable living environment, and
low and moderate-incom
Elimination Program s to eli ate elated crimeies. A p rtion of hese fu s is use to
PHAs and thus increase security and prevent crime at tram after fiscal year 2001.
stewardship responsibilities include n to monitor housing needs hous mar onditions, a
g and com nity developm issues.
e follow rog :
nind work experience to students enrolled in a
velopment or a closely relatedcy, or public administration.
ing Technology in Housing is a public/private e velopment and utilization of new nolog in order to ma
ore durable; more energy efficienaintain and less costly to ore comfortab
in. This program links key agencies in the federal government with building, product manufacturing, insurance, finan , and regula
mmunities in a unique partnership focused on technological in vatio the Am rica
ogr eks minate childhood sed by lead-based paint hazards and to address other children’s disease and
nal injury, and carbon mo oxide p isoning, caused b bstandard housing conditions.
d affordable housing, creates opportunitieependence, and assures the fiscal integri
p investments through t
•
vided to support the improvement of the living environmenSome investments s aothers help reside of the mmun d for rehabilitation.
• Indian Housin b sing iz s to maintain t their -term housing needs.
• Indian Community Dev an o to develop viable communities, ineconomic opportunities, principally for e recipients.
• The Public Housing Drug eeks min drug-r and activities in Public and Indian housing communit o t nd dimprove properties owned by the he properties. Congress has terminated funding for this prog
The Office of Policy Development and Research’smaintaining current informatio and ing ket c nd to support and conduct research on priority housin mu ent
HUD makes stewardship investments through th ing p rams
• Community Development Work Study: Colleges and universities throughout the USates use this program to offer financial aid a
ted
full-time graduate program in community de field such as urban planning, public poli
• Partnership for Advanc sector initiativwhich seeks to expand the de tech ies ke American homes stronger, safer, and m
o mt and d m
tory
environmentally friendly; easier t operate; an le and exciting to liveleaders from the home cialco no n in e n housing industry.
The Office of Healthy Homes and Lead Hazard Control pr am se to elilead poisoning cauinjuries, such as asthma, unintentio n o ysu
327

PERFORMANCE AND ACCOUNTABILITY REPORT
• Lead Technical Assistance Division, in support of the departmental lead hazard control program, establishes and coordinates lead-based paint regulations and policy, and supports
o increase
mprove community quality of life and economic ing table summarizes material program
v tional information regarding the following s may be found in Section 2 of this report.
ederal Physical Property
006
(Dollars in millions)
compliance assistance and enforcement. These programs also support technical assistance and the conduct of technical studies and demonstrations to identify innovative methods to create lead-safe housing at reduced cost. In addition, these programs are designed tthe awareness of lead professionals, parents, building owners, housing and public health professionals, and others with respect to lead-based paint and related property-based health issues.
Investments in Non-Federal Physical Property Non-Federal physical property investments support the purchase, construction, or major renovation of physical property owned by state and local governments. These investments support HUD’s strategic goals, which are to increase the availability of decent, safe, and affordable housing in America communities; ivitality; and ensure public trust in HUD. The followin estments in Non-Federal Physical Property. Addiprograms’ contribution to HUD’s goal
Investments in Non-F
FY 2002 - 2
P r o g r a m 2 0 0 2 2 0 0 3 2 0 0 4 2 0 0 5 2 0 0 6
C P D C D B G $ 1 ,2 9 8 $ 1 ,2 0 6 $ 1 ,1 9 3 $ 1 ,1 7 5 $ 1 ,1 7 0 D is a s te r G r a n ts ( 1 ) $ 2 9 $ 7 $ 1 1 4 $ 4 0 $ 2 9 9 H O M E $ 8 $ 3 3 $ 2 6 $ 4 4 $ 3 0
P I H In d ia n C D B G $ 5 1 N /A $ 5 8 $ 7 1 $ 6 8 I n d ia n H o u s in g B lo c k G ra n ts $ 2 9 2 $ 2 9 6 $ 1 7 6 $ 2 1 3 $ 2 9 1 H O P E V I ( 2 ) $ 3 6 7 $ 4 2 7 $ 4 1 1 $ 3 8 6 $ 3 9 1 P u b l ic H o u s in g C a p i ta l F u n d $ 2 ,0 3 6 $ 1 ,9 4 9 $ 1 ,7 5 8 $ 1 ,2 8 9 $ 1 ,3 4 0 D ru g E l im in a t io n P ro g ra m (3 ) $ 0 $ 0 $ 0 $ 0 $ 0T O T A L $ 4 ,0 8 1 $ 3 ,9 1 8 $ 3 ,7 3 6 $ 3 ,2 1 8 $ 3 ,5 8 8
o
imated based on the percentage change between FY 2005 2nd quarter, 3rd quarter and 4th quarter data.
3. Congress terminated funding for the Public Housing Drug Elimination Program after FY 2001.
N tes: 1. Amount reported for FY 2006 represents 9 months of data 2. For FY 2006, HOPE VI’s 3rd and 4th quarter investment amounts and results of investments
were est
328

SECTION 3. FINANCIAL INFORMATION REQUIRED SUPPLEMENTARY STEWARDSHIP INFORMATION
Investment in Human Capital
Human Capital investments support education and training programs that are intended to increase or maintain national economic productive capacity. These investments support HUD’s
d ind rust in
rcon
Investments in Human Capital
strategic goals, which are to promote self-sufficiency and asset development of families anividuals; improve community quality of life and economic vitality; and ensure public t
HUD. The table on the next page summarizes material program investments in Human Capital, fo FY 2002 through 2006. Additional information regarding the following programs’
tributions to HUD’s goals may be found in Section 2 of this report.
FY 2002 - 2006 (Dollars in millions)
INVESTM ENT IN HUM AN CAPITALProgram 2002 2003 2004 2005 2006CPD CDBG $29 $23 $26 $28 $4 Youthbuild $14 $19 $21 $22 $22PIH HOPE VI (2) $51 $56 $53 $39 $26Policy Development and Research Community Devel Work Study (4) $3 $3 $3 $3 $Healthy Homes/Lead Hazard Lead Technical Assistance (5) $7 $1 $0 $0 $0
0
nd results of investments
Results of Human Capital Investme the results of or output
Dev
Notes:
2. For FY 2006, HOPE VI’s 3rd and 4th quarter investment amounts awere estimated based on the percentage change between FY 2005 2nd quarter, 3rd quarter and 4th quarter data.
4. Congress did not fund the Community Development Work Study in FY 2006. 5. Congress did not fund the Lead Technical Assistance program in FY 2006.
nts: The following table presents(number of people trained) of human capital investments made by HUD’s CPD, Policy
elopment and Research, and Healthy Homes and Lead Hazard Control programs:
329

PERFORMANCE AND ACCOUNTABILITY REPORT
Results of Investments in Human Capital Number of People Trained
FY 2002 – 2006 P rogram 2002 2003 2004 2005 2006
DD B G 149,502 172,416 131,653 122,578 79,83outhbuild 2 ,717 4,123 3,508 4,366 3,929
C P C 3 YP IH
0
062
H O P E V I (see table below )
P D & R C om m unity D evel W ork S tudy (4) 99 95 99 108H ealthy H om es/L ead H azard Lead T echnical A ssistance (5) 23 ,501 0 0 0T O T A L 175,819 176,634 135,260 127,052 83,7
HOPE VI Results of Investments in Human Capital: Since the inception of the HOPE VI program in FY 1993, the program has made significant investments in Human Capital related initiatives (i.e., education and training). The following table presents HOPE VI’s key cumulative performance informatio tion.
Key Results of HOPE VI Program Activities FY 2005 and 2006
n for FY 2005 and 2006, since the program’s incep
HOPE VI Service (2)2005
Enrolled2005
Completed%
Completed2006
Enrolled2006
Completed%
CompletedEmployment Preparation, Placement, & Retention 57,424 N/A N/A 68,552 N/A N/AJob Skills Training Programs 22,753 12,448 55% 26,837 14,091 53%High School Equivalent Education 12,843 3,631 28% 14,293 3,907 27%Entrepreneurship Training 2,732 1,214 44% 3,118 1,235 40%Homeownership Counseling 10,969 4,135 38% 13,023 5,692 44%
Investments in Research and Development:
Research and development investments support (a) the search for new knowledge, and (b) the refinement and application of knowledge or ideas, pertaining to development of new or improved products or processes. Research and development investments are intended to increase economic productive capacity or yield other future benefits. As such, these investments support HUD’s strategic goals, which are to increase the availability of decent, safe, and affordable housing in Amer . The following table summarizes HU the following pr
ica communities; and ensure public trust in HUDD’s research and development investments. Additional information regardingograms’ contributions to HUD’s goals may be found in Section II of this report.
330

SECTION 3. FINANCIAL INFORMATION REQUIRED SUPPLEMENTARY STEWARDSHIP INFORMATION
Investments in Research and Development FY 2002 - 2006
(Dollars in millions)
Program 2002 2003 2004 2005 2006Policy Development and Research Partnership for Advancing Technology in Housing $10 $8 $8 $8
H ealthy H omes/Lead H azard
$5
Lead Hazard Control $3 $9 $6 $5 $11TO TAL $13 $17 $14 $13 $16
Results of Investments in Research a he end of fiscal year 2006, Partnership for Advancing Technology in Housing had over 165 updated technology listings in its technology inventory. During FY 2006, the program awarded 10 university-based applied research projects (in partnership with the National Science Foundation), 3 technology development projects, 3 projects providing information to builders and researchers, and 4 projects which requires demonstrations of the use of technologies.
In support of HUD’s lead hazard control initiatives, the Healthy Homes and Lead Hazard Control program has conducted various studies. As indicated in the following table, such studies have contributed to an overall reduction in the per-housing unit cost of lead hazard evaluation and control efforts. These studies have also lead to the identification of the prevalence of related hazards.
ousing Unit Cost of Lead Hazard Evaluation and Control FY 2002 – 2006
nd Development: At t
Per-H
Program 2002 2003 2004 2005 2006H ealthy H o s
4,926
$4,926
me /Lead H azardLead Hazard Control (1) $5,441 $4,827 $4,577 $6,650 $
TO TAL $5,441 $4,827 $4,577 $6,650
Notes:
1. The FY 2006, 4th quarter per-housing unit cost is based on an extrapolation of FY 2006, 1st – 3rd quarter data. The Office of Healthy Homes and Lead Hazard Control anticipates that full year actual data, which becomes available the first week of November 2006, will show that the grant program will exceed its goal of making 9,250 units lead safe. As a result, the Office anticipates a downward adjustment of the unit cost.
331

PERFORMANCE AND ACCOUNTABILITY REPORT
Required Supplementragovernmental Balances
HUD’s Intragovernmental amounts represent transactions with other federal entities included in the government’s annual report. These transactions include assets, liabilities and earned revenues as follows:
September 30, 2006 (dollars in millions):
epartment of Justice - - - 10 10$
847
Trading Partner Accounts Payable Debt Other Total
Department of Treasury 9,892 Other Agencies 27
Total - 7,249$ 2,670$ 9,919$
Intragovernmental Earned Revenues and Related Costs:
Trading Partner Earned Revenue
Department of Treasury 2,075$ Other Agencies 49
Total 2,124$
udget Functional Classification Gross Cost to
Generate Revenue
Commerce and Housing Credit -$ Community and Regional Dev - Income Security -
Total -$
ntary Information I
Intragovernmental Assets:
Trading Partner Fund BalanceAccounts
Receivable Investments Other Assets Total
Department of Treasury 81,395$ -$ 30,426$ -$ 111,821$ Department of Commerce - - - 16$ 16$ D
Total 81,395$ -$ 30,426$ 26$ 111,$
Intragovernmental Liabilities:
-$ 7,249$ 2,643$ $ - 27 -
B
332

SECTION 3. FINANCIAL INFORMATION REQUIRED SUPPLEMENTARY INFORMATION – INTRAGOVERNMENTAL BALANCES
September 30, 2005 (dollars in millions):
Intragovernmental Assets:
Trading Partner Fund BalanceAccounts
Receivable Investments Other Assets Total
Department of Treasury 67,500$ -$ 30,715$ -$ 98,215$ Department of Commerce - - - 11$ 11$ Department of Justice - - - 17 17$
Total 67,500$ -$ 30,715$ 28$ 98,243$
Intragovernmental Liabilities:
Trading Partner Accounts Payable Debt Other Total
Department of Treasury -$ 8,922$ 897$ 9,819$ Other Agencies - - 98 98
Total - 8,922$ 995$ 9,917$
Intragovernmental Earned Revenues and Related Costs:
Trading Partner Earned Revenue
Department of Treasury 1,954$ Other Agencies 2
Total 1,956$
Budget Functional Clas Gross Cost to
Commerce and Housing Credit -$ Community and Regional Dev - Income Security -
Total -$
sification Generate Revenue
333
PERFORMANCE AND ACCOUNTABILITY REPORT
Independent Auditor’s Report ;
U.S. Department of Housing and Urban Development
Washington, D.C. 20410-4500
INDEPENDENT AUDITOR’S REPORT1
To the Secretary, U.S. Department of Housing and Urban Development: In accordance with the Chief Financial Officers (CFO) Act of 1990, the Department has prepared the accompanying consolidated balance sheets of the Department of Housing and Urban Development (HUD) as of September 30, 2006 and 2005 and the related consolidated statements of net cost, changes in net position, and financing and the combined statement of budgetary resources for the fiscal years then ended. We are required by the Chief Financial Officers Act of 1990, as amended by the Government Management Reform Act of 1994 and implemented by Office of Management and Budget (OMB) Bulletin 06-03, Audit Requirements for Federal Financial Statements, to audit HUD’s principal financial statements or select an independent auditor to do so. The objective of our audit was to express an opinion on the fair presentation of these principal financial statements. With respect to the fiscal year 2006 and 2005 financial statements, we did not audit the financial statements of the Federal Housing Administration (FHA) for the periods ending September 30, 2006 and 2005 and the Government National Mortgage Association (Ginnie Mae) for the period ending September 30, 2006, whose statements reflected total assets constituting 41 and 45 percent, respectively, of the related consolidated totals. Other auditors, whose reports have been furnished to us, audited those statements and our opinion on the fiscal year 2006 and 2005 financial statements, insofar as it relates to the amounts included for FHA and Ginnie Mae as of September 30, 2006, is based solely on the reports of the other auditors. In connection with our audit, we also considered HUD’s internal control over financial reporting and tested HUD’s compliance with certain provisions of applicable laws, regulations, contracts, and grant agreements that could have a direct and material effect on its principal financial statements. Pursuant to the Chief Financial Officers Act of 1990, as amended by the Reports Consolidation Act of 2000 and implemented by OMB Circular Number A-136 Financial Reporting
equirements, HUD is required to issue a Performance and Accountability Report that includes, ong other information, HUD’s annual audited financial statements. For fiscal year 2006,
Office of Inspector General
451 7th St., S.W.
Ram
1 This report is supplemented by a separate report issued by HUD-OIG to provide a more detailed discussion of the internal control and compliance issues included in this report and to provide specific recommendations to HUD management. The report is available at the HUD, OIG Internet site at http://www.hud.gov/oig/oigindex.html and is titled: Additional Details to Supplement Our Report on HUD’s Fiscal Years 2006 and 2005 Financial Statements (2007-FO-0003, dated November 14, 2006).
334

SECTION 3. FINANCIAL INFORMATION INDEPENDENT AUDITOR’S REPORT
OMB has directed agencie ability Reports and submit them to the President, OMB and the Congress by November 15, 2006.
In our opinion, based on our audit and the reports of other auditors, the accompanying fiscal years 2006 and 2005 principal financial statements present fairly, in all material respects, the financial position of HUD as of September 30, 2006 and 2005 and its net costs, changes in net position, budgetary resources, and reconciliation of net costs to budgetary obligations for the fiscal years then ended, in conformity with accounting principles generally accepted in the United States of America.
• Reportable conditions in internal controls in fiscal year 2006 related to the need to
− Comply with federal financial management systems requirements; − Continue improvements made in the oversight and monitoring of subsidy
calculations and intermediaries program performance; − Further strengthen controls over HUD’s computing environment,
including the enhancement of controls at FHA around the User Access Request process and managing the FHA Subsidiary Ledger as a mission critical system;
− Improve personnel security practices for access to the Department’s critical financial systems;
− Improve processes for reviewing obligation balances; and − Improve FHA’s funds controls processes.
Most of these control weaknesses were reported in prior efforts to audit HUD’s financial statements and represent long-standing problems. Our findings also include the following instances of non-compliance with applicable laws, regulations, and provisions of contracts and grant agreements that are required to be reported herein under Government Auditing Standards or OMB Bulletin 06-03.
− HUD did not substantially comply with the Federal Financial Management
Improvement Act. In this regard, HUD’s financial management systems did not substantially comply with Federal Financial Management Systems Requirements; and
− FHA and certain of its allotment holders did not have an approved Funds Control Plan.
s to complete their Performance and Account
Opinion on the Fiscal Year 2006 and 2005 Financial Statements
335

PERFORMANCE AND ACCOUNTABILITY REPORT
conducted our audit for the purpose of forming an opi
Consolidating Financial Information
We nion on the consolidated principa D has presented consolidating
and changes in net position, and c ry resources and financing as supplementary informAccounta inancial information is presente ial statements rather than to present the financial position, changes in net position, budgetary
r activities. The consolidating and ired part of the principal financial
5 financial information has been
ts n
d
in which HUD had not complied with applicable laws and
HUD Financial Management Systems Need to Comply with Federal Financial Management System Requirements. As reported in prior years, HUD is not in full compliance with Federal financial management requirements.
l financial statements taken as a whole. HUbalance sheets and related consolidating statements of net costs
ombining statements of budgetaation in its Fiscal Year 2006 Performance and
bility Report. The consolidating and combining fd for purposes of additional analysis of the financ
resources, and net costs of HUD’s majocombining financial information is not a requstatements. The fiscal year 2006 and 200subjected to the auditing procedures applied to the principal financial statements and, in our opinion, is fairly stated, in all material respects, in relation to the financial statements taken as a whole.
In its Fiscal Year 2006 Performance and Accountability Report, HUD presen“Required Supplemental Stewardship Information,” specifically, information oinvestments in non-Federal physical property and human capital. In addition, HUD presents a Management Discussion and Analysis of Operations. This information is not a required part of the basic financial statements but is supplementary information required by the Federal Accounting Standards Advisory Board and OMB Circular Number A-136. We did not audit and do not express an opinion on this information; however, we applied certain limited procedures, which consisted principally of inquiries of management regarding the methods of measurement and presentation of the supplementary information.
Additional details on our findings regarding HUD’s internal controls are summarized below anwere provided in separate reports to HUD management. These additional details also augmenthe discussions of the instances
Required Supplementary Information
tregulations, the information regarding our audit objectives, scope, and methodology, and recommendations to HUD management resulting from our audit. Reportable Conditions:
336

SECTION 3. FINANCIAL INFORMATION INDEPENDENT AUDITOR’S REPORT
Specifically, HUD has not completed development of an adequate integrated financial management system. HUD is required to implement a unified set of financial systems and the financial portions of mixed systems encompassing the software, hardware, personnel, processes (manual and automated), procedures, controls, and data necessary to carry out financial management functions, manage financial operations of the agency, and report on the agency’s financial status to central agencies, Congress, and the public. As currently configured, HUD
l s
ial
HUD Management Must Continue to Improve Oversight and Monitoring of
ubsidy Calculations and Intermediaries’ Program Performance. Since
pro m e foc dinterme 2) verify tenant income made progresbeing r s, includi establish consolidated reviews in order to institutionalize the f Hou nHU s ensive pro m HUD’s interme nsibility to administer assisted
g to HUD
itoring has resulted in a gn c
Howtechnicare achdeterm
Controls over HUD’s Computing Environment Can Be Further Strengthened. HUD’s computing environment, data centers, networks, and servers provide critical support to all facets of the Department’s programs, mortgage insurance, servicing, and administrative operations. In prior years, we reported on various weaknesses with general system controls and controls over
financial management systems do not meet the test of being unified. The federafinancial system integration office defines “unified” as meaning that the systemare planned for and managed together, operated in an integrated fashion, and linked electronically to efficiently and effectively provide agency-wide financsystem support necessary to carry out the agency’s mission and support the agency’s financial management needs.
S1996, we reported on weaknesses with the monitoring of housing assistance
gra delivery and the verification of subsidy payments. Specifically, wuse on the impact these weaknesses had on HUD’s ability to (1) ensure
diaries are correctly calculating housing subsidies and ( and billings for subsidies. During the past several years, HUD hass in correcting this weakness, which in 2005 resulted in this weakness eclassified as a reportable condition. In 2006, HUD continued its progresng taking steps to
Of ice of Public and Indian Housing’s (PIH) efforts in addressing Publicsi g Authorities improper payments and other high-risk elements. However,
D’ continued commitment to the implementation of a comprehential to ensure gra to reduce erroneous payments will be ess
diaries are properly carrying out their respohousing programs according to HUD requirements.
The Department has demonstrated improvements in its internal control structure to address the significant risk that HUD’s intermediaries are not properly carryingout their responsibility to administer assisted housing programs accordinequirements. HUD’s increased and improved monr
si ifi ant decline in improper payment estimates over the last four years. ever, HUD needs to continue to place emphasis on its on-site monitoring and
al assistance to ensure acceptable levels of performance and compliance ieved and periodically assess the accuracy of intermediaries rent inations, tenant income verifications, and billings.
337

PERFORMANCE AND ACCOUNTABILITY REPORT
certain applications, as well as weak security management. These deficiencies increase risks associated with safeguarding funds, property, and assets from waste, loss, unauthorized use, or misappropriation. We evaluated selected
dger
ized
tems’
lems d access to HUD’s financial systems
remains a critical issue. OIG followed up on previously reported personnel security weaknesses and deficiencies and found that deficiencies still exist. HUD Needs to Improve Processes for Reviewing Obligation Balances.
ger
- showed
FHA should improve its funds control processes. HUD Funds Control
ast in
of obligations. Without proper funds control procedures, FHA management cannot ensure that its budgetary resources are effectively managed and obligations and expenditures will not exceed authorized limits of the funds allotted.
information systems general controls of the Department’s computer systems, on which HUD’s financial systems reside. Our review found information systems control weaknesses that could negatively affect the integrity, confidentiality, and availability of computerized data. Further, FHA must enhance the controls around the User Access Request process and manage its Subsidiary Lesystem as a mission critical system at the HUD Information Technology Services Data Center facility.
Weak Personnel Security Practices Continue to Pose Risks of UnauthorAccess to the Department’s Critical Financial Systems. For several years wehave reported that HUD’s personnel security over critical and sensitive sysaccess has been inadequate. Various deficiencies in HUD’s personnel security program were found and recommendations were proposed to correct the probnoted. However, the risk of unauthorize
HUD needs to improve controls over the monitoring of obligation balances to determine whether they remain needed and legally valid as of the end of the fiscalyear. HUD’s procedures for identifying and deobligating funds that are no lonneeded to meet its obligations are not always effective. This has been a longstanding weakness. Our review of the 2006 year-end obligation balances$558.3 million in excess funds that could be recaptured. Although HUD has made some progress in implementing procedures and improving its information systems to ensure accurate data are used, further improvements in financial systems and controls are still needed.
Handbook requires FHA annually to submit an acceptable funds control plan, review open obligations that are over certain threshold limits, and ensure that disbursements do not exceed obligations. FHA and certain of its allotment holders has been operating without an approved Funds Control Plan for the pthree fiscal years, have not reviewed unliquidated obligations annually andcertain instances, authorized expenditures in excess
338

SECTION 3. FINANCIAL INFORMATION INDEPENDENT AUDITOR’S REPORT
t
ct and
t condition addresses how HUD’s financial
anagement systems remain substantially noncompliant with Federal financial
isks e
ain
er
ds D
accounting for its appropriations and other available funds. HUD requires each allotment holder to
erlin and 2005 financial
statements. Their report on FHA’s financial statements, dated October 30, 20062 with
Compliance with Laws and Regulations:
HUD Did Not Substantially Comply with the Federal Financial ManagemenImprovement Act. In its Fiscal Year 2006 Performance and Accountability Report, HUD reports that 2 of its 41 financial management systems do not comply with the requirements of the Federal Financial Management Improvement AOMB Circular A-127, Financial Management Systems. Even though 39 individual systems have been certified as compliant with Federal Financial Management Systems Requirements, collectively and in the aggregate, deficiencies still exist. We report as a reportable condition that HUD Financial Management Systems Needs to Comply with Federal Financial ManagemenSystems Requirements. This reportable mmanagement requirements. We also continue to report as reportable conditions that (1) Controls over HUD’s Computing Environment Can be Further Strengthened, and (2) Weak Personnel Security Practices Continue to Pose Rof Unauthorized Access to the Department’s Critical Financial Systems. Thesreportable conditions discuss how weaknesses with general controls and certapplication controls, and weak security management increase risks associated with safeguarding funds, property, and assets from waste, loss, unauthorized use or misappropriation. In addition, OIG audit reports have disclosed security ovfinancial information was not provided in accordance with OMB Circular A-130 Management of Federal Information Resources, Appendix III and the Federal Information Security Management Act. FHA and certain of its allotment holder did not have an approved FunControl Plan for Fiscal Year 2006 as required by HUD policy. The HUAppropriation Law for Fiscal Year 2003 (Public Law 108-7) requires HUD and its allotment holders maintain an adequate system of
evidence this system of budgetary and accounting control through the submissionof an Annual Funds Control Plan to HUD’s Chief Financial Officer for review and monitoring.
The independent certified public accounting firm of Urbach Kahn and WLLP performed a separate audit of FHA’s fiscal years 2006
includes an unqualified opinion on FHA’s financial statements, along
Werlin LLP’s report on FHA, Audit of Federal Housing Administration Financial Statements for and 2005 (2007-FO-0002, dated November 08, 2006) was incorporated into this report.
2 Urbach Kahn andFiscal Years 2006
Results of the Audit of FHA’s Financial Statements
339

PERFORMANCE AND ACCOUNTABILITY REPORT
discussions of three reportable conditions and one instance of non-compliance with laws, regulations, and provisions of contracts and grant agreements.
The independent public accounting firm of Carmichael, Brasher, Tuvell and Company performed a separate audit of the Ginnie Mae’s financial statemenfiscal years 2006. Carmichael, Brasher, Tuvell and Company’s report on Ginnie Mae’s financial statem 3
ts for
ents, dated November 6, 2006, includes an unqualified opinion on these financial statements. In addition, the audit results indicate there
d innie ssed
ublic Law 109-115, “Departments of Transportation, Treasury, and Housing and nt
D press an opinion on these principal
nancial statements. As part of our audit, we considered HUD’s internal controls incipal
e e
al
An
were no material weaknesses or reportable conditions with Ginnie Mae’s internal controls, or material instances of non-compliance with laws and regulations. For informational purposes, in Note 2 D to the financial statements, HUD makesreference to the Federal Credit Reform Act of 1990, which became effective on October 1, 1991, and notes that in the opinion of Ginnie Mae management, anHUD’s General Counsel, the Federal Credit Reform Act does not apply to GMae’s guarantee programs. In addition, on November 30, 2005, Congress paPUrban Development, the Judiciary, the District of Columbia, and Independeagencies Appropriation Act, 2006.” Section 321 of the law states that no fundsprovided under this title may be used for an audit of Ginnie Mae that makes applicable requirements under the Federal Credit Reform Act of 1990.
The accompanying principal financial statements are the responsibility of HUmanagement. Our responsibility is to exfiover financial reporting for the purpose of expressing our opinion on the prfinancial statements and not to provide assurance on those internal controls. Wconducted our audit in accordance with Government Auditing Standards, and threquirements of OMB Bulletin 06-03, Audit Requirements for Federal FinanciStatements, as amended. These standards require that we plan and perform the audit to obtain reasonable assurance about whether the financial statements are free of material misstatement. An audit includes examining, on a test basis, evidence supporting the amounts and disclosures in the financial statements. audit also includes assessing the accounting principles used and significant estimates made by management, as well as evaluating the overall financial
3 Carmichael, Brasher, Tuvell and Company’s report on Ginnie Mae, Audit of Government National Mortgage Association Financial Statements for Fiscal Years 2006 and 2005 (2007-FO-0001, dated November 7, 2006) was incorporated into this report.
Results of the Audit of Ginnie Mae’s Financial Statements
Objectives, Scope and Methodology
340

SECTION 3. FINANCIAL INFORMATION INDEPENDENT AUDITOR’S REPORT
statement presentation. We believe that our audit provides a reasonable basis for our opinion on the financial statements. We also tested HUD’s compliance with laws, regulations, and provisions of contract and grant agreements that could have a direct and material effect on the financial statements. However, our consideration of HUD’s internal controls and our testing of its compliance with laws, regulations, and provisions of contract and grant agreements were not designed to and did not provide sufficient evidence to express an opinion on such matters and would not necessarily disclose all matters that might be material weaknesses, reportable conditions or noncompliance with laws, regulations, and provisions of contract and grant agreements. Accordingly, we do not express an opinion on HUD’s internal controls or on its compliance with laws, regulations, and provisions of contract and grant agreements.
On October 31, 2006, we provided a draft of the internal control and compliance sections of our report to the CFO and appropriate assistant secretaries and other Departmental officials for review and comment, and requested that the CFO coordinate a Department-wide response. The CFO responded in a memorandum dated November 3, 2006, which is included in its entirety in our separate report. Except for the report’s conclusion on HUD’s compliance with the Federal Financial Management Improvement Act of 1996 (FFMIA) and FHA’s ompliance with Fund Control Plan requirements, the Department generally
led
Agency Comments and Our Evaluation
cagreed with our presentation of findings and recommendations subject to detaicomments included in the memorandum. The Department’s response was considered in preparing the final version of this report.
341

PERFORMANCE AND ACCOUNTABILITY REPORT
This report is intended for the information and use of the management of HUD,OMB, the Government Accountability Office, and the U.S. Congress, and
is not
intended to be, and should not be, used by anyone other than these specified parties. However, this report is a matter of public record and its distribution is not limited. In addition to a separate report detailing the internal control and compliance issues included in this report and providing specific recommendations
to HUD management, we noted other matters involving internal control over financial reporting and its operation that we are reporting to HUD management in a separate “management letter.”
342
SECTION 3. FINANCIAL INFORMATION SECRETARY’S AUDIT RESOLUTION REPORT TO CONGRESS
Secretary’ Congress This informati nd follow-up activ by Section 106information onrecommendatiostatistics on theand statistics o unds be put to better
Audit Resolut
During FY 200 lly plemented 7 he Department also made good progress in reducing its
ventory of significantly overdue final actions, which are those recommendations greater than 2 months overdue. HUD began the year with 35 recommendations greater than 12 months verdue and ended the year with 7, for a net reduction of 28 significantly overdue commendatio
address and pr
Recommenda
The Departmenmilestones) forGeneral.
FY 2006 began g the year, 910 reworkload, and s. FY 2006 ended ns, with no
commendations beyond the statutory period of six months.
Summary of Recommendations Without Management Decisions October 1, 2005 – September 30, 2006
Opening Inventory 271 New Audit Recommendations Requiring Decision 910 Management Decisions Made (832)
s Audit Resolution Report toon on the Department of Housing and Urban Development’s audit resolution aity covers the period October 1, 2005, through September 30, 2006. It is required of the Inspector General Act Amendments (Public Law 100-504), and provides the status of audit recommendations without management decisions and ns with management decisions, but no final action. The report also furnishes total number of audit reports and dollar value of disallowed costs for FY 2006,
n the total number of audit reports and dollar value of recommendations that f use.
ion Highlights
6, the Department achieved 832 approved management decisions and successfu81 recommendations. Tim
in1ore ns. This was a result of a deliberate and concerted Department-wide effort to
event overdue recommendations.
tions Without Management Decisions
t is statutorily required to provide a management decision (an action plan with each audit recommendation within 6 months of report issuance by the Inspector
with a total of 271 recommendations without a management decision. Durincommendations requiring management decisions were added to our active timely management decisions were made on a total of 832 recommendation with 349 recommendations without management decisio
re
Audit Recommendations Awaiting Management Decisions 349 Audit Recommendations Beyond Statutory Period 0
Recommendations With Management Decision But No Final Action Taken
The Department began the year with an inventory of 914 management decisions requiring final action. During the year, 832 additional management decisions were made, the Department
343

PERFORMANCE AND ACCOUNTABILITY REPORT
completed finarecommendatiothe year was 96 ill remain open un
At the beginniprogram officewere more tha35 final action7 final actions erdue. All program offices except one met or xceeded their annual performance goals. The Office of Community Planning and Development
missed its goal by just one recommendation.
Summary of Recommendations With Management Decisions And No Final Action
October 1, 2005 – September 30, 2006
Opening Inventory 914 Management Decisions Made During FY 2006 832
l action on a total of 781 recommendations. The total number of audit ns with management decisions but final actions not yet completed at the end of 5. Of this 965, fifty-four are under active multi-year repayment plans that wtil the collection activities are completed.
ng of FY 2006, the Department established an annual performance goal for each within HUD to reduce the Departmental opening balance of final actions that n 12 months overdue by 50 percent. At the beginning of FY 2006, there were s that were more than 12 months overdue. At the end of FY 2006, there were only that were more than 12 months ov
e
Sub-Total No Final Action at End of Period 1,746
Final Action Taken (781)
Audit Recommendations Reopened During Period
(Without Final Action) 0
Total Audit Recommendations
Requiring Final Actions 9651
1 The Department has 54 recommendations under current repayment plans. These recommendations are considered open and count in the audit inventory until final repayment is made.
Status of Audits With Disallowed Costs
As of October 1, 2006, there were 180 audits with management decisions on which final action had not been taken, with a dollar value of disallowed costs totaling $348 million. During FY 2006, management decisions were made for 108 audits with disallowed costs totaling approximately $73.8 million. The Department had 88 audits in which final action was taken during the fiscal year, with approximately $39 million in recoveries and $72.5 million in write-offs. As of September 30, 2006, there were 200 audit reports with recommendations involving disallowed costs awaiting final action, with an associated value of approximately $310 million.
Note that the Inspector General Act requires reporting at the audit report level versus the individual recommendation level. At the audit report level, total disallowed costs in the report are reported as open until all recommendations in a report are closed. When reporting is done at
344
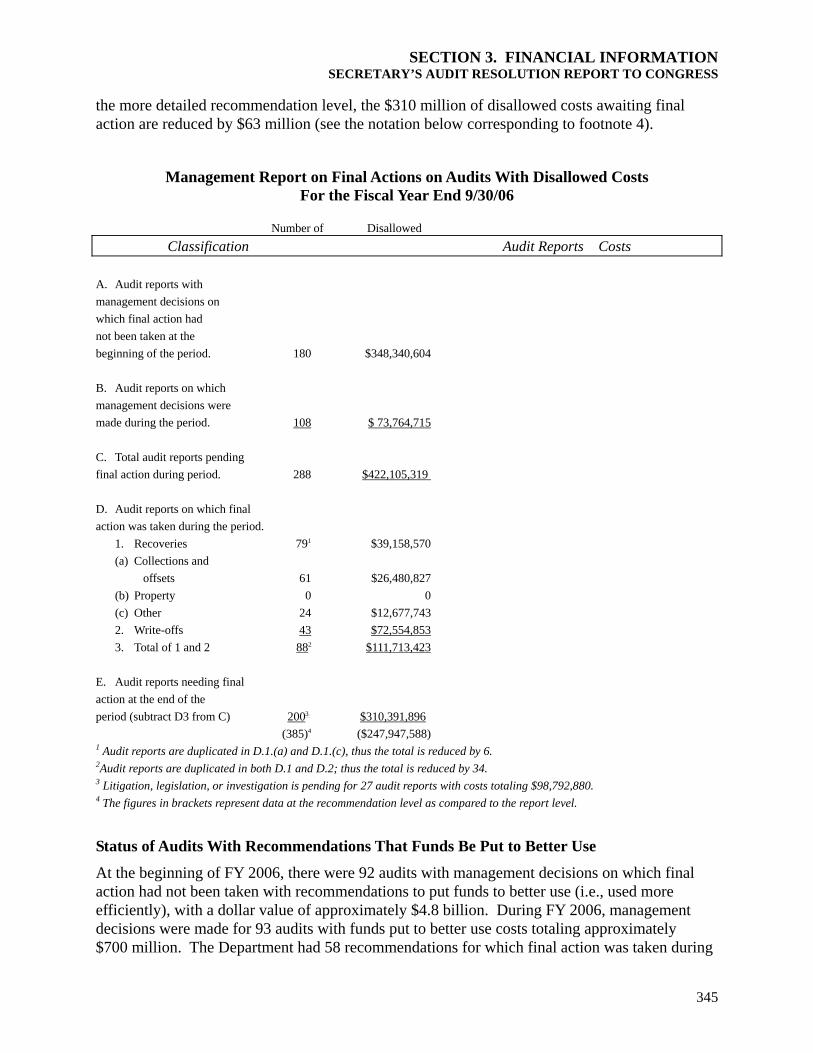
SECTION 3. FINANCIAL INFORMATION SECRETARY’S AUDIT RESOLUTION REPORT TO CONGRESS
the more detailed recommendation level, the $310 million of disallowedaction are reduced by $63 million (see the notation below correspondin
costs awaiting final g to footnote 4).
Management Report on Final Actions on Audits With Disallowed Costs For the Fiscal Year End 9/30/06
Number of Disallowed
Classification Audit Reports Costs A. Audit reports with management decisions on which final action had not been taken at the beginning of the period. 180 $348,340,604 B. Audit reports on which management decisions were made during the period. 108 $ 73,764,715 C. Total audit reports pending final action during period. 288 $422,105,319 D. Audit reports on which final action was taken during the period. 1. Recoveries 791 $39,158,570
(a) Collections and offsets 61 $26,480,827 (b) Property 0 0 (c) Other 24 $12,677,743 2. Write-offs 43 $72,554,853 3. Total of 1 and 2 882 $111,713,423 E. Audit reports naction at the end ofperiod (subtract D3 from C)
eeding final the
2003 $310,391,896 1 Audit reports are duplicated in D.1.(
(385)4 ($247,947,588) y 6.
ed by 34. g for 27 audit reports with costs totaling $ 80.
Th mendation level as compared to the report level.
s Be Put to Better se
t the beginning of FY 2006, there were 92 audits with management decisions on which final used more management
ring
a) and D.1.(c), thus the total is reduced b2Audit reports are duplicated in both D.1 and D.2; thus the total is reduc3 Litigation, legislation, or investigation is pendin 98,792,84 e figures in brackets represent data at the recom
S tus of Audits With Recommendations That Fund Uta
Aaction had not been taken with recommendations to put funds to better use (i.e., efficiently), with a dollar value of approximately $4.8 billion. During FY 2006, decisions were made for 93 audits with funds put to better use costs totaling approximately $700 million. The Department had 58 recommendations for which final action was taken du
345

PERFORMANCE AND ACCOUNTABILITY REPORT
the fiscal year with a dollar value of $2.1 billion, and eight recommendations totaling $344 million that management concluded should not or could not be implemented. At the end othe year, there were 126 audits with recommendations to put funds to better use awaiting final action with an associated value of approximately $3.1 billi
f
on.
is
e
udits With Recommendations That Funds Be Put to Better Use For The Fiscal Year Ended 9/30/06
Note that the Inspector General Act requires reporting at the audit report level versus the individual recommendation level. At the audit report level, total funds put to better use in the report are reported as open until all recommendations in a report are closed. When reporting done at the more detailed recommendation level, the $3.1 billion of funds put to better use costs awaiting final action is reduced by $2.8 billion, leaving an open balance of $329 million (see thnotation below corresponding to footnote 3).
Management Report on Final Action On A
Number of Disallowed sts Classification Audit Reports Co
Am
. Audit reports with anagement decisions on
otbeg 8
ad
which final action had n been taken at the
inning of the period. 92 $4,831,881,10 B. Audit reports on which management decisions were m e during the period. 93 $699,694,473 C. Total audit reports pending final action during period (Total of A and B). 185 $5,531,575,581 D Audit reports on which final a n was taken during the period
Value of recommendations
. ctio
1. implemented (completed) 58 $2,060,716,906
2. Value of recommendations that management concluded should not or could not be implemented 8 $344,460,758 3. Total of 1 and 2 591 $2,405,177,664 E. Audit reports needing final action at the end of the period (Subtract D3 from C). 1262 $3,126,397,917 (123) ($329,094,455) 3
1 Audit reports are duplicated in D.1. and D.2, thus the total is reduced by 7. 2 Litigation, legislation, or investigation is pending for 15 audit reports with costs totaling $303,766,197.3 The figures in brackets represent data at the recommendation level as compared to the report level.
346

SECTION 3. FINANCIAL INFORMATION DELINQUENT DEBT COLLECTION
Delinquent Debt Collection
Fiscal Year Ending
Total Debt (In millions)
Delinquent Debt(In millions)
Delinquent Debt Collections (In millions)
2006* $11,51 $373
*The above totals reflect FY 2006 data from the Third Quarter Treasury Report on Receivables Due from the Treasury Report on Receivables for the Fourth Quarter was not available in time for incorporation
into this report. The vast majority of these totals are comprised of debts from FHA and Housing programs. Less quent debt originates from all other HUD programs. The Housing Financial Operations ork, administers the vast majority of delinquent, eligible debts that HUD refers to the
easury.
a aximizing collections on delinquent ebts using all available collection tools. The Center continues to work closely with systems
contractors and the Department of the Treasury to maintain the systems and processes that assure ance with the Debt Collection Improvement Act of 1996.
UD submitted $24.7 m w delinquent debts to Treasury’s national se for potential offset via the Treasury Offset Program. Cumulatively
2006, a of 14 ($203.1 million owed) had been referred nd offset by the Treasury. This program is a centralized offset program, administered by
agement Service, to collect delinquent debts owed to federal agencies. Y 2006 totaled $9.8 million for the Department. HUD also referred
icing during the year. 2,606 debts ($5 e at cross-servicing at the end of FY 2006. Cross-servicing is the process
easury-Financial Management Service for ry for offset and for
ro g en ey are a s de
nt” letters to delinquent debtors advising em that their debts were past due. These notices provide debtors with the right to establish
l the enforceability of debts through the HUD Board of Contract Appeals or, for federal employees, through an Administrative Law Judge. Debtors who fail to
l rights are referred to Treasury, where they ion eff g offset of federal payments, referral to
nd administrative
uring FY 2006, the Center continued to improve the management of its debt caseload with the assistance of the U.S. Court Systems’ Public Access to Court Electronic Records. This system offers inexpensive, fast, and comprehensive bankruptcy case information on active and recently
2 $689
Public. The
than one percent of delinCenter in Albany, New YDepartment of the Tr
HUD’s Financial Operations Center rem ins committed to md
continued full compli
During FY 2006, H illion of nedelinquent debtor databathrough the end of FY total ,550 debtorsaTreasury’s Financial ManOffset collections during F$21.6 million of new debts to Treasury for cross-serv
7.5 million) werwhereby federal agencies refer delinquent debts to Trcollection. The Act requires that all eligible debts be referred to Treasuc ss-servicin wh th 180 d y linquent.
Overall, HUD mailed a total of 1,710 “Notice of Intethrepayment plans or appea
make payment arrangements or exercise their appeaare subjected to aggressive collect orts, includinplso implemented system enhancements to automate the postirivate collection agencies, and administrative wage garnishment. During FY 2006, the Center
a ng of penalties aosts to delinquent debts. c
D
closed cases, and has allowed HUD to more efficiently handle accounts where the debtor has filed bankruptcy.
During FY 2006, the Center suspended all active collections against debtors located within theFEMA-designated areas for the Hurricane Katrina disaster. Since the debtors are in various
347

PERFORMANCE AND ACCOUNTABILITY REPORT
stages of recovery, the Department is still in the process of re-evaluating the overall dewith respect to the affected debtors.
Among federal agencies, HUD continued to spearhead use of Administrative Wage Garnishment. HUD has authorized the process via the Treasur
bt process
y Cross Servicing Program since r HUD
al
t, the Center plans to expand the program in F
HUD continues to us urate Reporting to respond electronically to consumer disputes that are filed regarding HUD’s credit reporting of
ed to 1,699 credit reporting disputes using this system, and also completed its efforts to t dard, the Metro 2
rmat.
easury’s FedDebt collection system became operational. This online anages debts referred to Treasury by federal agencies. As a result of the
as able to make system nhancements, modify desk procedures and processes and train its staff. While the conversion to
ly presented significant problems relative to file sharing between Treasury hat refer debts to Treasury (including HUD), most issues have been
stem is now rating ntly.
2002. Treasury reported $1.7 million in Administrative Wage Garnishment collections fodebt during FY 2006, with 376 active Wage Garnishment Orders in place at the end of the fiscyear. During FY 2006, the Center developed an internal wage garnishment pilot program that targeted eligible debtors that may have been through the Treasury collection process prior to Treasury’s implementation of the process. The Center’s pilot resulted in collections of $237,500 in FY 2006. Based on the success of this pilo
Y 2007.
e the Electronic On-line Solutions for Complete and Acc
delinquent debts. During FY 2006, the Center respondconvert to the new industry s an
credit-reporting fo
During FY 2006, Trfinancial system mCenter’s involvement with the system implementation, the Center wethe new system initialand federal agencies tresolved and the sy ope more efficie
348

Section 4. Other Accompanying Information
349

PERFORMANCE AND ACCOUNTABILITY REPORT
Management and Performance Challenges Inspector General and HUD Management Perspectives
In accordance with the Reports Consolidation Act of 2000, HUD’s annual Performance and Accountability Report “…shall include a statement prepared by the agency’s inspector general that summarizes what the inspector general considers to be the most serious management and performance challenges facing the agency and briefly assesses the agency’s progress in addressing those challenges.” On October 19, 2006, HUD’s Inspector General provided a statement on five management challenges for inclusion in this FY 2005 Performance and Accountability Report:
1. Department-wide organizational changes;
s directed toward the victims of Hurricanes Katrina, Rita, and Wilma.
ent
t are r of the importance being placed on
ddressing each of these issues, the first four of these five challenges are included in high-isibility initiatives in the President’s Management Agenda, and the fifth challenge,
administering HUD’s hurricane disaster relief efforts, is being carried-out in accordance with OMB guidance on expediting benefits and controlling the risk of fraud, waste, and abuse in hurricane disaster relief efforts. In addition to the progress on these challenges that is summarized below, and in the following Inspector General’s statement, further information on HUD’s specific FY 2006 actions to meet these challenges is provided in the President’s Management Agenda section of this report.
Department-wide Organizational Changes and Human Capital Management – These two challenges are interrelated and are both covered through HUD actions taken and planned under the PMA initiative on “Strategic Management of Human Capital.” HUD has taken significant steps to better utilize existing staff capacity, and to obtain, develop, and maintain the capacity necessary to adequately support HUD’s future mission-critical program delivery. The Department’s five-year Human Capital Management Strategy seeks to ensure that: 1) HUD’s organizational structure is optimized; 2) succession strategies are in place to provide a continuously updated talent pool; 3) performance appraisal plans for all managers and staff ensure accountability for results and a link to the goals and objectives of HUD’s mission; 4) diversity hiring strategies are in place to address under-representation; 5) skills gaps are assessed and corrected; and 6) human capital management accountability systems are in place to support effective management of HUD’s human capital. Additionally, in FY 2006, HUD developed and officials approved the Human Capital vision plan, and developed a Leadership
2. Financial management systems;
3. FHA single-family origination;
4. Public and assisted housing program administration; and
5. Administering program
The full text of the HUD Inspector General’s Management and Performance Challenges statement is presented immediately after the following summary of HUD management’s currperspective on these challenges.
HUD Management’s Perspective
HUD management agrees that the five areas identified in the Inspector General’s statemenchallenges currently facing the Department. As an indicatoav
350

SECTION 4. OTHER ACCOMPANYING INFORMATION MANAGEMENT AND PERFORMANCE CHALLENGES
Succession Plan and set targets for leadership bench strength. Collectively, these actions are better enabling HUD to recruit, develop, manage, and retain a high-performing workforce that is
351
apable of effectively supporting HUD’s program delivery and mission.
During FY 2006, HUD continued to build on the successes generated last year, and again was able to report substantial compliance with the federal financial systems requirements of the Federal Financial Management Improvement Act of 1996 and Section 4 of the Federal Managers’ Financial Integrity Act of 1982. Additionally, HUD was able to report substantial compliance of the Department’s internal control over financial reporting, as required by Appendix A of OMB Circular A-123. HUD’s financial systems supported the preparation and audit of Department-wide consolidated financial statements within 45 days after the end of the fiscal year, with an unqualified audit opinion. With an inventory of 41 total financial systems, the number of non-compliant systems has been reduced from 17 in FY 2003 to only 2 at the end of FY 2005. Those two systems (LAS and FIRMS) are now substantially compliant with OMB Circular A-127 pending independent verification. However, during mid-September of FY 2006, two additional systems, the HUD Procurement System and the Small Purchase System (HPS and SPS) were determined to be non-compliant based on independent compliance reviews. The deficiencies of these systems will be addressed in future years through implementation of the Department’s financial management systems modernization initiative. Until this financial management modernization initiative is brought on-line, the Department is developing interim corrective action plans to address these non-compliant issues for HPS and SPS. HUD is proceeding with plans to develop and implement a modern replacement system through the HUD Integrated Financial Management Improvement Project. The requirements for the new system were completed in FY 2005, and HUD is proceeding with plans for development and implementation of the new system by FY 2008.
FHA Single Family Origination – Risks of the FHA Single-Family Housing Mortgage Insurance Programs have been reduced through actions taken under the HUD Management and Performance initiative of the President’s Management Agenda as acknowledged in the Inspector General’s statement. HUD completed actions include: implementation of an FHA computer system changes to accept a new 30-day delinquency reporting standard; conducted training on enhancements to HUD’s internal controls over processing payments for property management services; implemented the Credit Watch and Appraisal Watch systems that automatically targets appraisers with poor performance records for monitoring and disqualification if they have violated FHA standards; and implemented the Technology Open to Approved Lenders automated underwriting process to provide more consistent, objective evaluations of the credit worthiness of borrowers. Additionally, FHA refined the assumptions used to calculate credit subsidy estimates to account for the increased risk associated with borrowers who receive gift letters and borrower credit scores. With consistent implementation of these and other pending corrective actions initiated by FHA, HUD’s goal is to eliminate the Government Accountability Office’s high-risk program designation on the Single-Family Housing Mortgage Insurance Program area by January 2007.
Public and Assisted Housing Program Administration – HUD set and communicated clear measurable goals and corrective actions for reducing improper rental housing assistance payments and improving public and assisted housing conditions and continues to work collaboratively with the housing industry and local housing program administrators to meet or
c
Financial Management Systems –

PERFORMANCE AND ACCOUNTABILITY REPORT
exceed those goals. HUD is considered a leader within the federal goimproper payments Since FY 2000, estimated improper payments du
vernment in reducing e to program administrator
come have been reduced 60 percent,
onduct
. HUD’s Office of Multifamily Housing and their ntinued to conduct on-site monitoring reviews in
ram administrator performance to reduce improper itions. The implementation of HUD’s new Enterprise ont verification of tenant income, in FY 2006, has the
t estimate.
istory.
oast, where a 30-foot storm surge from Hurricane Katrina ndated New Orleans, Louisiana, and surrounding parishes,
rted
s
tment
rs of many regulations in the Department’s
subsidy determination errors and tenant underreporting of infrom $3.22 billion to $1.28 billion. The percentage of properties meeting HUD’s physical condition standards has increased to 85.8 percent for public housing and 95 percent for assisted multifamily housing. HUD’s Office of Public and Indian Housing modified its overall monitoring strategy for public housing by stratifying Public Housing Authorities (PHAs) into two tiers. Tier 1 is composed of approximately 500 PHAs, which account for more than 80 percent of the funding provided. Tier 2 covers the remaining 3,600 PHAs. HUD will cdetail annual reviews of 20 from Tier 1 and about 175 from Tier 2, concentrating monitoring resources on the PHA’s with the greatest riskPerformance-Based Contract Administrators coFY 2006, directed at improving progpayments and improve housing condIncome Verification System for upfrpotential to eliminate most of the remaining improper paymen
Administering Programs Directed Toward Victims of Hurricanes Katrina and Rita – The summer of 2005 was the worst Atlantic hurricane season ever recorded in United States hThere were 28 storms, of which seven classified as major. Florida and Louisiana were each struck twice by major storms and Mississippi and Texas once. The most catastrophic effects of the season were felt on the Gulf Ccaused devastating flooding that inuand destroyed most structures on the Mississippi coastline. More than 2,000 lives were lost, andhundreds of thousands of families were displaced from their homes.
HUD responded quickly in the wake of this unprecedented natural disaster to help meet thetemporary housing needs of displaced households, assess the impacts on HUD-suppohousing, and plan the long-term recovery of the devastated region. While HUD’s response waimmediate and comprehensive, it also recognized that the enormous amount of relief funds creates the potential for fraud and abuse. To ensure the proper use of funds, the Deparutilized the Disaster Recovery Grant Report system to comply with quarterly Congressional reporting requirements and to aid in the detection and prevention of fraud, abuse, or mismanagement. HUD also approved waiveprograms to ease and expedite access to programs and to provide more flexibility in the use of funds for disaster relief. These activities are subject to HUD’s program monitoring and oversight procedures.
352

SECTION 4. OTHER ACCOMPANYING INFORMATION INSPECTOR GENERAL’S SUMMARY OF MANAGEMENT AND PERFORMANCE CHALLENGES
353
U.S. Department of Housing and Urban Development
Office of Inspector General
451 7th St., S.W. Washington, D.C. 20410-4500
Inspector General’s Summary of Management and Performance Challenges
SUBJECT: Management and Performance Challenges
In accordance with Section 3 of the Reports Consolidation Act of 2000, the Office of Inspector General is submitting its annual statement to you summarizing our current assessment of the most serious management and performance challenges facing the Department of Housing and Urban Development (HUD) in fiscal year 2007 and beyond. Through our audits and investigations, we work with Departmental managers in recommending actions that best address these challenges.
tive
y
ing programs. HUD’s management
g
More details on our efforts in relation to these issues can be found in our audit and investigachapters of our Semiannual Report to the Congress.
The Department’s primary mission is to expand housing opportunities for American
families seeking to better their quality of life. HUD seeks to accomplish this through a wide varietof housing and community development grant, subsidy, and loan programs. Additionally, HUD assists families in obtaining housing by providing Federal Housing Administration (FHA) mortgage insurance for single-family and multifamily properties. HUD relies upon numerous partners for the performance and integrity of a large number of diverse programs. Among these partners are hundreds of cities that manage HUD’s Community Development Block Grant (CDBG) funds, hundreds of public housing authorities that manage assisted housing funds, thousands of HUD-approved lenders that originate and service FHA-insured loans, and hundreds of Ginnie Mae mortgage-backed security issuers that provide mortgage capital.
Achieving HUD’s mission continues to be an ambitious challenge for its limited staff, given
the agency’s diverse mission, the thousands of program intermediaries assisting the Department in this mission, and the millions of beneficiaries in its housproblems have for years kept it on the Government Accountability Office’s (GAO) list of agencieswith high-risk programs. More specifically, HUD must focus improvements on rental housinassistance programs and single-family housing mortgage insurance programs, two areas where financial and programmatic exposure is the greatest. The fact that HUD’s reported management

PERFORMANCE AND ACCOUNTABILITY REPORT
challenges are included as part of the President’s Management Agenda’s government-wide andprogram initiatives is indicative of HUD’s important role in the Federal sector. HUD’s current administration places a high priority on achieving Presidential and Secretarial initiatives as well as correcting weaknesses that put HUD on GAO’s high-risk list.
As of the end of the third quarter of fiscal year 2006, HUD’s President’s Management Agenda scoring status for the nine applicable initiatives consisted of three “green”; four “yelloand two “red” baseline goal scores. Based upon a comprehensive set of standards, an agency i“green” if it meets all of the standards for success, “yellow” if it has achieved some but not all of the criteria and “red” if it has one of a number of serious flaws. HUD’s baseline score for Improved Financial Performance remains at “red” until HUD eliminates its two remaining material weaknesses. However, HUD’s progress indicator is green since HUD has completed its planned actions, including initial discussions with the Office of Management and Budget on expanded uses of financial information for decision making. It is also noteworthy that HUDthe first agency to receive a “green” baseline goal score on the Eliminating Improper Payments initiative and has also achieved “green” baseline goal scores for the E-Government and FaitBased Community initiatives.
w” s
was
h-
ges
o
ttachment
Although the management structure, size, and range of Departmental programs make it
difficult to correct and overcome program weaknesses, HUD is working to address these challenand, as shown by the President’s Management Agenda scoring, has made progress. The Department’s management challenges we are reporting this year include:
Department-wide organizational changes and human capital management,
Financial management systems,
FHA single-family origination,
Public and assisted housing program administration, and
Administering programs directed toward victims of Hurricanes Katrina, Rita and Wilma.
The attachment provides a greater discussion of these challenges and the OIG’s efforts thelp the Department resolve these matters.
A
354

SECTION 4. OTHER ACCOMPANYING INFORMATION INSPECTOR GENERAL’S SUMMARY OF MANAGEMENT AND PERFORMANCE CHALLENGES
HUD Management and Performance Challenges Fiscal Year 2007 and Beyond
Department-wide Organizational Changes l Managementand Human Capita . For many years, one of the Department’s major challe ge its limited staff resources to accomplish its primary mission. In recent years, the Department has contracted out numerous functions essential to the accomplishment of its overall mission, in part due to staffing issues. Many of the weaknesses facing HUD, particularly those concerning HUD’s oversight of program recipients are impacted by HUD’s resource limitations. To operate effectively and hold individuals responsible for performance, HUD needs to know that it has the right number of staff with the proper skills in the right positions. To address its human capital needs and respond to the President’s Management Agenda, HUD developed a comprehensive Five-Year Strategic Human Capital Management Plan that identifies
Mission-focused agency to align employees and work to support HUD’s mission;
primary tool for advancing its human capital capital
anized
of le of
Financ
nges has been to effectively mana
three strategic goals for human capital:
High quality workforce, which recruits, develops, manages, and retains a diverse workforce; and
Effective succession planning to ensure retirees over the next 5 years are succeeded by qualified employees.
The human capital management plan is the Department’stransformation. In line with its strategic plan, HUD has increased its focus on human
management through a variety of initiatives. To address staffing imbalances and other human capital challenges, the Department continues to determine its optimal organizational structure and reduce mission critical skill gaps to ensure HUD is positioned to provide maximum service to its constituents. The Department is also proceeding to develop a vision for the future to address what HUD’s work will be, how HUD should be orgto carry out the work, and the required skills in relation to FTEs and training efforts. HUD continued to implement its Five-Year Strategic Human Capital Management Plan, with the goalenabling it to recruit, develop, manage, and retain a high-performance workforce that is capabeffectiv ly supporting HUD’s mission. e
ial Management Systems. Since FY 1991, OIG has annually reported on the lack of an integrated financial system in compliance with all federal financial management system requirements, including the need to enhance FHA’s management controls over its various insand other financial systems. During the past several years, HUD has made progress implementing anew financial system at FHA and addressing most of the weaknesses that OIG identified, includinitiating a vision statement for a department-wide fully integrated financial system. These improvements enabled OIG to reclassify the weakness in financial management system
urance
ing
355

PERFORMANCE AND ACCOUNTABILITY REPORT
requirements from a material weakness to a reportable condition. The remaining weaknesses notin OIG’s audit of HUD’s FY 2005 financial statements were as follows:
FHA needs to continue progress to integrate their financial management systems.
ed
t of
rt the underlying documents and the actual certification and
ccredi
date. Finally, HUD has ot tested and evaluated all of the technical information security controls for the financial
manFHA Singl
HUD’s ability to prepare financial statements and other financial information requiresextensive compensating procedures.
HUD has limited availability of information to assist management in effectively managing operations on an ongoing basis.
For the past several years, OIG’s financial audits have also reported weaknesses in internal controls and security over HUD’s general data processing operations and specific applications. The effecthese weaknesses is that HUD cannot be reasonably assured that system information will remain confidential, protected from loss, and available to those who need it without interruption. HUD has completed certification and accreditation for all financial management systems and general suppoystems. However, the quality of s
a tation process varied by application. While a number of vulnerabilities were closed, additional vulnerabilities, identified through oversight activities, were not corrected before accreditation. Correction of approximately 85 percent of the vulnerabilities identified on financial management systems within FHA is delayed with no projected resolution n
agement systems categorized as high impact. e Family Origination. FHA’s si
ions of first-time, minority, low-incomengle-family mortgage insurance programs enable
mill , elderly, and other underserved households to realize the benef ages about $339 billion in single-family insured mortga igh-risk portfolio represents a continuing challenge for the D a d HUD to tackling long-standing ma nt practices. HUD has take
o g advisory guidance to Home Equity Conversion Mortgage (HECM) counselors on warning prospective borrowers about mortgage fraud schemes and how
Publishing a final rule that changes HUD’s delinquency-reporting requirement and thereby enabling the Department’s Default Monitoring System to track significant key events between the beginning of a default episode and its resolution.
o Publishing a final rule prohibiting property flipping in HUD’s single-family mortgage insurance programs.
o Providing special expanded loss mitigation authority to lenders to reduce insurance claim losses and assist borrowers that lost homes due to hurricane storm damage in the Gulf region.
its of homeownership. HUD manges. Effective management of this h
ep rtment. The President’s Management Agenda has committenagement problems that expose FHA homebuyers to fraudule
n a number of recent actions to reduce risks including the following: Providin
to avoid becoming victims.
o
356

SECTION 4. OTHER ACCOMPANYING INFORMATION INSPECTOR GENERAL’S SUMMARY OF MANAGEMENT AND PERFORMANCE CHALLENGES
o At our urging and in light of a recent Internal Revenue Service ruling regarding nonprofits that provide sellerwo the mortgaged prope organization.
While GAO and OIG have reported improved monitoring of lender underwriting and default tracking and expanded loss mitigation to help reduce mortgage foreclosures, HUD needs to further strengthen lender accountability and take strong enforcement actions against program abusers that victimize first-time and minority homebuyers. The audit of FHA’s FY 2005 financial statements also reported a need to:
Incorporate better risk factors and monitoring tools into FHA’s single-family insured mortgage program risk analysis and liability estimation process, and
Continue improvement in the review over the credit reform estimation process.
e
nd other lender non-compliance with program requ tly veri e satisfacto al HUD costs. In another audit, we assessed the impact of a recent policy change regarding eligibility for late endorsements and found that HUD’s underlying risk assumption wasinformat
to
funded downpayment assistance, proposing a rule that uld establish specific standards regarding a borrower’s investment in
rty when a gift is provided by a nonprofit
Our internal audits focused on HUD improving its oversight of the claims payment process and thlate endorsement of loans. Our review of HUD's oversight of single-family mortgage insurance claims found documentation omissions a
irements at insurance endorsement. Therefore, we recommended that HUD independenfy th eligibility for insurance of inadequately documented loan files and seek recovery or
ry support for fin
flawed. We recommended that HUD re-evaluate the policy using appropriate and available ion.
In support of HUD and the President’s Management Agenda, OIG’s Strategic Plan for FY 2004 2009 gives priority to detecting and preventing fraud in FHA mortgage lending through targeted audits and investigations. Our audits target lenders with high default rates. Our detailed testing typically focuses on mortgage loans that defaulted and resulted in FHA insurance losses. Results from these audits have noted significant lender underwriting deficiencies, prohibited late endorsed loans, inadequate quality controls, and other operational irregularities. During FY 2006, we completed 33 external audits of FHA-approved mortgage lenders as well as five internal audits of single-family program activities. We recommended monetary recoveries, civil remedies and funds that could be put to better use totaling $259 million. Additionally, our investigative workload in single-family fraud prevention continues to be substantial. Public and Assisted Housing Program Administration. HUD provides housing assistance funds under various grant and subsidy programs to public housing agencies and multifamily project owners. These intermediaries, in turn, provide housing assistance to benefit primarily low-income households. HUD monitors these intermediaries’ administration of the assisted housing programs. Accurate and timely information about households participating in HUD housing programs is necessary to allow HUD to monitor the effectiveness of the program, assess agency compliance with regulations, and analyze the impacts of proposed program changes. The level of reporting is a criterion for housing agencies’ performance in both the Public Housing Assessment System and the
357

PERFORMANCE AND ACCOUNTABILITY REPORT
Section 8 Management Assessment Program. Housing agencies must have a minimum 95 percent reporting rate or be subject to sanctions. HUD ues to present challenges in achieving the intended statutory purposes of the housing assistance funds. The efinancial significant progress in addressing weaknesses iwasAgenda – d has maintained this score.
oper t
03 and imates to include in its FY 2006 Performance and
. To g
ff to
lating subsidy amounts, correctly determining family income, complying with housing quality standards, fully using authorized vouchers, and implementing controls to prevent duplicative and fraudulent housing assistance payments. Our audits identified questioned costs of more than $16 million and reported more than $112 million that could be put to better use. Admin
’s ability to effectively monitor housing agencies and assisted multifamily projects contin
se w aknesses have been reported for a number of years in OIG’s annual audits of HUD’s statements. However, HUD has demonstrated
mpacting the accuracy of payments made under these programs. Most notably, HUD the first agency to receive a “green” baseline goal score on the President’s Management
Eliminating Improper Payments initiative anThe estimate of erroneous payments that HUD reports in its Performance and Accountability Reportrelates to HUD’s inability to ensure or verify the accuracy of subsidy payments being determined and paid to assisted households. HUD has surpassed interim goals for reducing the FY 2000 estimated $2 billion in net annual rental housing assistance overpayments. HUD’s interim goals were for a 15 percent reduction in FY 2003, 30 percent reduction in FY 2004, and 50 percent reduction in FY 2005. These goals were established based on the FY 2000 estimates of imprpayments attributed to both housing administrator errors in subsidy determinations and tenanunderreporting of income upon which benefits are based. Although 60 percent of all subsidy determinations were found to be in error in 2000, that number declined to 41 percent in FY 2003 and 34 Percent in FY 2004. The baseline estimate of gross annual improper payments has been reduced from $3.2 billion in 2000 to $1.6 billion in 20$1.2 billion in 2004. HUD is finalizing updated estAccountability Report. Paralleling HUD efforts, our investigative and audit focus is concentrating on fraudulent practices and the lack of compliance with the Section 8 program statute and requirementscomply with a congressional request, OIG conducted 51 external audits of the Section 8 HousinChoice Voucher program during FY 2006. The OIG also has professional appraisers on staassist in evaluating housing quality requirements as part of our audit efforts. In total, these external audits addressed whether housing agencies are correctly calcu
istering Programs Directed Toward Victims of Hurricanes Katrina, Rita, and Wilma. th of Hurricanes Katrina, Rita, and Wilma, the operations of HUD have been tested in the Gulf Coast area and have created extraordinary challenges fo
In the aftermathoroughly r the residents, HUD ehousing
Congress estimthe Premore than s affected 79 Ginnie Mae issuers, causing Ginnie Mae to assess a $500 million risk of loss to its
mployees, and the business community. The potential losses to HUD and its and community development programs are significant.
ates that damage to residential structures will range from $17 to $33 billion. In sidentially Declared Disaster Areas, HUD’s FHA single-family insurance fund insured
328,000 mortgages having an unpaid principal balance of $23 billion. The hurricane
358

SECTION 4. OTHER ACCOMPANYING INFORMATION INSPECTOR GENERAL’S SUMMARY OF MANAGEMENT AND PERFORMANCE CHALLENGES
investminsuredpercent sus sets of HUD’s pub y structures and housing of almost 120,000 families. The Housing Authority of New Orleans received a
s
HUD’s response to Hurricanes Katrina and Rita falls into three separate categories: (1) use of existing appropriations on the ground just before hurricane impact, (2) new appropriations for hurricane relief, and (3) Federal Emergency Management Agency funds administered by HUD in supp o ing Assistance and Disaster Voucher Programs, which were funded at levels of $79 million and $390 million, respectively. In addition, Congress appropriated $16.7 billion in emergency CDBG funds in two emergency supplemental appropriations. Of this total, $10.4 billion and $5.5 billion have been allocated to the States of Louisiana and Mississippi, respectively. The remaining funds were allocated to the States of Alabama, Florida, and Texas.
Each state was required to submit a plan to HUD outlining how the state intended to spend its supplemental disaster funding. However, the subsequent waivers of CDBG program requirements, while granted by HUD in accordance with the provisions of the supplemental appropriations to facilitate the ease and expediency of funding, may have created vulnerabilities. For example, Mississippi and Louisiana opted to use portions of their overall CDBG funding for
s.
encies.
r
f disaster assistance.
ent portfolio. FHA’s multifamily program in the Presidentially Declared Disaster Areas 528 projects with an amortized principal balance of $3 billion. Of these, 112 or 21
tained more than minor damage, resulting in significant potential losses22. Aslic housing program suffered tremendous damage, affecting both propert
$21.8 million grant from the public housing capital fund reserve for the cost and repair of itpublic housing inventory before a full assessment could be performed. HUD reprogrammed $380 million from existing community planning and development funds for the disaster areas. To expedite the process, HUD issued numerous waivers to streamline its grant programs including the HOME Investment Partnership, Emergency Shelter Grants, and CDBG programs.
ort f mission-critical assignments. HUD is administering the Katrina Disaster Hous
one-time grants to assist homeowners who are not obligated to repair or rebuild their homes, but may choose to use the grant in any legal way to work through their personal recovery situationWe have concerns about how a “compensation” plan that basically reimburses homeowners’losses will spur the rebuilding of now blighted communities.
There are also continuing problems with the execution of data matching among federal agIt took months for OIG to finalize a protocol with the Federal Emergency Management Agencyto use their data for matching purposes to detect potentially fraudulent payments. The problems that we have encountered would be greatly mitigated if the Privacy Act included an exception fopost-disaster data matching, or if alternative legislation required federal agencies to engage in data matching as a routine procedure in their provision o
22 Loss estimates for both the single-family and multifamily programs were being finalized at the time of this letter and are to be included in FHA’s audited FY 2006 financial statements.
359

PERFORMANCE AND ACCOUNTABILITY REPORT
Improper Payments Information Act Reporting Details The Requirements
Under the Improper Payments Information Act of 2002 (IPIA), Public Law 107-300, and Officeof Management and Budget (OMB) implementing guidance in Appendix C of Circular No. A-123, agencies are to annually assess all programs and activities they administer and idthose that may be susceptible to significant improper payments. Where the risk of improper payments is assessed as potentially significant, agencies are required to estimate the annual amount of improper payments and report the estimates along with plans to reduce impropepayments to the President and the Congress. The statute defines a “significant” le
entify
r vel of improper
te to an
, le
scern whether a payment was proper as
steps. The first step is an initial
,
amount of improper payments in any program activity determined to be susceptible to a significant improper payment level. The
payments as annual improper payments exceeding a $10 million dollar threshold.
An “improper payment” is any payment that should not have been made or that was made in anincorrect amount under statutory, contractual, administrative, or other legally applicable requirements. Incorrect amounts are overpayments and underpayments (including inappropriadenials of payment or service). An improper payment includes any payment that was madeineligible recipient or for an ineligible service. Improper payments are also duplicate paymentspayments for services not received, and payments that do not account for credit for applicabdiscounts. Also, when an agency’s review is unable to dia result of insufficient or lack of documentation, this payment must also be considered an error.In addition to identifying substantive errors that might warrant repayment, HUD’s statistical sampling of support for payments also considered “process” errors that increase the risk of substantive payment errors, and process errors are included in HUD’s improper payment estimates.
HUD’s Commitment
The Secretary designated the Chief Financial Officer as the lead official for directing and overseeing HUD actions to address improper payment issues and bring HUD into compliance with requirements of the IPIA and OMB implementing guidance. The Office of the Chief Financial Officer developed a plan for implementing the IPIA and after necessary contract support services were put in place by the Chief Financial Officer and FHA, HUD began to execute the plan in FY 2004. HUD’s plans, goals and results for identifying and reducing improper payments are tracked under the President’s Management Agenda.
HUD’s Process
The HUD process for complying with the IPIA consists of four survey of all program and administrative activities, regardless of size, for potential indicators of significant improper payments. Any program activities identified in the survey and all program activities with annual expenditures in excess of $40 million are subjected to the second stepwhich is a detailed risk assessment. The third step consists of statistical sample testing of payments by independent reviewers to determine the estimated
fourth step is to establish, execute, and monitor corrective action plans for reducing improper payments in the identified at-risk programs.
360

SECTION 4. OTHER ACCOMPANYING INFORMATION IMPROPER PAYMENTS INFORMATION ACT REPORTING DETAILS
Summary of HUD Results to Date
HUD is fully compliant with the requirements of the IPIA and was the first federal agency to achieve the President’s goals for reducing improper payments. HUD’s initial annual assessment of the risk of improper payments was conducted in FY 2004, based on $52.9 billion in payments made in FY 2003 in support of over 200 program and administrative activities.
HUD’s initial assessment identified 10 activities, representing 57 percent of all payments, as potentially “at risk” of a significant improper payment level. Those 10 activities are listed in thefollowing table. Statistical sampling to measure and estimate the actual level of improperpayments in those 10 program activities found that only 5 of the 10 areas actually had a
significant improper payment problem. Corrective actions were subsequently completed to eliminate the significant improper payments in 2 of those 5 areas, pertaining to payments under the Single Family Acquired Asset Management System and the Public Housing Capital Fund.
HUD has exceeded goals for reducing improper payments in the remaining three high-risk program areas – the Public Housing, Tenant-Based Voucher and Project-Based Assistance Programs – collectively referred to as HUD’s rental housing assistance programs. There are three types of payment errors associated with HUD’s rental housing assistance programs, attributable to: 1) subsidy determination errors by program administrators; 2) tenant underreporting of income upon which subsidies are based; and 3) errors in billing and paying subsidies due. HUD has reduced the combined baseline gross improper rental housing assistance
n e
payment estimates of $3.430 billion for all three error components to $1.464 billion, a reductioof 57 percent. Further details on HUD’s efforts to reduce improper rental housing payments arprovided below.
FY 2005 and FY 2006 Testing Activities/Results on Inventory of Programs Assessed as Potentially “At-Risk” of a Significant Improper Payment Level
Inventory of At-Risk Programs Selected for Statistical Sampling
FY 2005 Testing Activity/Results
FY 2006 Testing Activity/Results
FHA PAYMENT SYSTEMS Single Family Acquired Asset Management System
Below Threshold – Based on completed testing of FY 2004 payments – Removed
Not Applicable – No longer considered at risk
Multifamily Property Management System
Not Applicable – Annual payment level also fell below $20 million in FY 2005
Not Applicable – No longer considered at risk
361

PERFORMANCE AND ACCOUNTABILITY REPORT
OTHER HUD PROGRAMS AND ADMINISTRATIVE ACTIVITIES HOME Investment Partnerships: HOME States & Local Governments completed testing of FY 2003 considered at risk
Below Threshold – Based on Not Applicable – No longer
payments - Removed CDBG Economic Development Initiative – Special Projects
Below Threshold – Based on completed testing of FY 2003 payments - Removed
Not Applicable – No longeconsidered at risk
r
Homeless Assistance Grants: Supportive Housing Program
Below Threshold – Based on completed testing of FY 2003 payments - Removed
Not Applicable – No loconsidered at risk
nger
HOPE VI – Revitalization Grants Below Threshold – Based on completed testing of FY 2003
Not Applicable – No longer considered a
payments - Removed t risk
Public Housing Capital Fund Removed – Based on corrective action verification on causes of FY 2003 sample results
Not Applicable – No longeconsidered at risk
r
RENTAL ASSISTANCE PROGRAMS Public Housing Above Threshold – Based on
completed testing of FY 2004 payments
Above Threshold – Based ocompleted testing of FY 200payments
n 5
Tenant-based Vouchers & Mod Rehab Above Threshold – Based on completed testing of FY 2004 payments
Above Threshold – Based ocompleted testing of FYpayments
n 2005
Multifamily Project-based Assistance Above Threshold – Based on Above Threshold – completed testing of FY 2004 payments
Based on completed testing of FY 2005 payments
Results of Annual Risk Assessment Update and Continued Payment Testing
The third annual improper payment risk assessment completed during FY 2006 was based opayment and other relevant activity that occurred during the completed FY 2005 accountingcycle. An inventory of 200 distinct program and administrative activities with total paymen$58.8 billion was identified from all of HUD’s financial management systems. The paymeuniverse consisted of the following general distribution:
n ts of
nt
HUD's Payment Universe
26%
27%
1%
46%
Rental Assistance
FHA
Other Activities Over $40M
Other Activities Under $40M
362

SECTION 4. OTHER ACCOMPANYING INFORMATION IMPROPER PAYMENTS INFORMATION ACT REPORTING DETAILS
HUD’s third risk assessment took into account the results of the second risk assessment and at
’s
, and
n its offices,
m
d HUD payments cover the remainder of the rental cost (or the operating cost, the case of public housing).
Thpro
1 e program ilure to properly apply income rrectly d ent, and sub
or – the tenant beneficiary’s failure to properly disclose all n s upon which subsidies are determined;
ors in the billing and payment of subsidies due between HUD and third and/or housing providers.
00 through 2005, HUD reduccategories of error from $3.22 billion t tion of 60 percent, far exceeding the goal set for FY 2005.
FY 2000 Baseline Error Estimates
considered the outcomes of the statistical sampling reviews of payments in the 10 activities thwere originally identified as potentially susceptible to a significant level of improper payments. HUD’s risk assessment update in FY 2006 did not identify any new activities as being at-risk of a significant improper payment level. Programs that previously tested below the improper payment threshold established by the IPIA were removed from HUD’s at-risk inventory and are not subject to re-testing unless there is significant change in the nature of the activity or HUDinternal control structure.
Rental Housing Assistance Programs
HUD’s various rental housing assistance programs – public housing, tenant-based assistanceproject-based assistance – had previously been assessed as at high risk of significant improper payment levels, and continue to be reported as such, with corresponding error measurement methodologies, corrective action plans, and error reduction goals described below. These programs constituted over $27 billion, or 46 percent, of HUD’s total payments in FY 2005.
Prior to enactment of the IPIA, HUD had already established the Rental Housing Integrity Improvement Project in FY 2001 to reduce an acknowledged improper payment problem irental assistance programs. This project is directed by the responsible HUD program with oversight by the Office of the Chief Financial Officer and statistical sampling support frothe Office of Policy Development and Research. HUD’s rental assistance programs are administered by over 26,000 public housing agencies and multifamily housing owners or management agents on HUD’s behalf. In general, beneficiaries pay 30 percent of their adjusted income as rent, anin
ere are three major components of potential errors and improper payments in these complex grams:
) Program administrator error – thexclusions and deductions and co
administrator’s faetermine income, r sidy levels;
2) Tenant income reporting errtincome sources and amou
3) Billing error – err
and
party program administrators
From 20 ed the gross improper payments for the first 2 of these 3 o $1.28 billion, a reduc
- A baseline measurement of improper payments due to program administrator error and tenant income reporting was established by two studies completed in FY 2000. The FY 2000 studies verified subsidy calculations and income for a representative sample of 2,403 households receiving assistance at 600 projects. For all 3 major program types, the combined FY 2000 baseline estimates reported for both types of error were $3.281 billion in gross improper payments and $2.013 billion in net subsidy overpayments. The FY 2000 baseline estimates were later adjusted to $3.216 billion in gross improper payments and $1.972 billion in net subsidy overpayments to eliminate the impact of those public housing
363

PERFORMANCE AND ACCOUNTABILITY REPORT
programs that had been placed under a block grant approach under the M t
oving To Work oved rror
ym ts (p ator error and tenant income reporting erro 2003, 30 percent in FY 2004 and
ted studies o to up , ates on the program administrator error and same general methodology, sampling procedures, and sample sizes.
The following paragraphs provide details on the FY 2005 rental assistance error measurement
Program Administrator Error
Program, which effectively remfor reducing the net subsidy overpa
hem from consideration for eents for these two componenr) by 15 percent in FY
estimates. HUD set goals rogram administr
50 percent in FY 2005.
In FY 2006, HUD comple f FY 2005 program activity date the FY 2000FY 2003 and FY 2004 estimerror components, using the
tenant income reporting
updates.
- HUD’s gra nt and s in FY 20 on
update of the measure of pro m administrator resubsidy determination errorpayment component since FY 2000, as
05 found a 58.7 percent reducti shown in the following chart:
in this improper
FY 2005 Full Year Estimates strator of Error in Program AdminiIncome, Rent & Subsidy Determinations
FY 2000 Estimate of
Error*
Rental Assistance Programs
Assistance Overpayments
$1,000’s
Assistance Underpayments
$1,000’s
Net Improper Payments $1,000’s
Gross Improper Payments $1,000’s
Gross Improper Payments $1,000’s
Percent Reduction in Gross
Improper Payments
Public Housing
$116,952 $103,5 4 12 $13,440 $220,46 $602,557 *63.4%
Tenant-based $309,600 $14Vouchers & Mod Rehab
6,6 40 $162,960 $456,240 $1,096,535 58.4%
TA
otal PHA dministered
$426,552 $250,152 176,400 $676,704 60.2% $ $1,699,092
Multifamily $157,836 $90,744 $67,092 $248,580 $539,160 Project-based Assistance
53.9%
Total 2005*
$584,388 (+/-$117,130)
$340,844 (+/-$104,134)
$243,544 (+/-$148,872)
$925,232 (+/-$164,206)
$2,238,252 (+/- $271,000)
58.7%
* - Estimates are provided at a 95 percent confidence level.
Th
he significant reduction in this error component is attributed to HUD efforts to work with its ousing industry partners at PHAs and multifamily housing projects through enhanced program
guidance, training, oversight, and enforcement.
Under the Rental Housing Integrity Improvement Project, the Office of Public and Indian Housing initiated on-site Rental Integrity Monitoring reviews focused on the 490 largest PHAs that receive 80 percent of HUD’s public housing and tenant-based voucher program funds. Technical assistance was provided to PHAs with the most significant program deficiencies and follow-up on Rental Integrity Monitoring reviews was conducted to assess program improvements and the need for corrective and enforcement action. The Office of Multifamily Housing has placed nearly all Section 8 Program project-based assistance under Performance-Based Contract Administrators who review 100 percent of monthly vouchers and perform annual on-site management and occupancy reviews at all projects. Twenty percent of the remaining
364

SECTION 4. OTHER ACCOMPANYING INFORMATION IMPROPER PAYMENTS INFORMATION ACT REPORTING DETAILS
project-based assistance contracts still administered by HUD staff or traditional contract administrators also received on-site monitoring reviews in FY 2005.
Tenant Income Reporting Error - HUD estimates that the total error attributable to tenant underreporting of income was $359 million in FY 2005, a decline of 63 percent from the FY 2000 baseline of $978 million. While this is an increase from the FY 2004 estimate of $266 million, this estimate should be regarded as a normal fluctuation as a result of the small sample size and low error rate, rather than an actual increase in error. In addition, the EnterpriseIncome Verification (EIV)
system, which is discussed below, was not implemented in PIH
as made using FY 2005 data so it would not reflect
sult ter
and f
nd
tion, as well as monthly employer information on new hires. n
ultifamily housing. This increased computer matching capability has the
ten
programs until FY 2006. The estimate wimprovements related to this important initiative. EIV is scheduled to be implemented for Multifamily project-based assistance in FY 2007.
HUD believes that the general downward trend in tenant income error will continue as the reof an improved methodology for reviewing income discrepancies identified through compumatching to better determine actual cases of underreported income impacting subsidy levels.The reduction will also be facilitated by: improved income verification efforts by Housing PIH program administrators; increased voluntary compliance by tenants due to promotion of theissue; and HUD’s initiation of improved computer matching processes for upfront verification otenant income.
HUD’s Enterprise Income Verification System has made income data from the National Directory of New Hires available to local PHAs to allow them to conduct more effective atimely income verification for tenants. The National Directory of New Hires, administered by the Department of Health and Human Services, is a central source of all quarterly state wage and unemployment benefit informaHUD consolidated all available income match data sources in the Enterprise Income VerificatioSystem for controlled use by program administrators in all HUD rental housing assistance programs, including mpotential to eliminate the majority of the remaining estimated improper payments attributable to
ant underreporting of income.
Billing Cycle Error – In FY 2005, HUD completed baseline billing error studies in the artment’s public housing, Section 8 vouchers, and project-based assistanDep ce programs, based
r
s
8 vouchers (both tenant-based and project-based), and $100 million al
06 to
on FY 2003 expenditures. Billing errors occur when program administrators submit billings opayment vouchers to HUD for activities and amounts that: deviate from allowable HUD contract terms and conditions; differ from local rent rolls and subsidy determinations; or pertain to allowable subsidies or utility allowances that are not properly remitted to participating landlordor tenants. The baseline estimated gross billing error was $84 million in public housing, $30 million in the Section for the project based assistance. Combined, HUD’s total baseline estimate of improper rentassistance billings was $214 million. A subsequent billing study was performed in FY 20update the FY 2003 expenditure estimates on the rental housing assistance programs and is summarized in the following chart:
365

PERFORMANCE AND ACCOUNTABILITY REPORT
Results of Billing Error Studies (Year Studied)
Program Subsidies
Overpaid* Subsidies
Underpaid* Net Billing
Error Gross Billing
Error*
Public Housing (2004)
$35 $14 $21 $49
Section 8 Vouchers (2004)
$50 $22 $28 $72
Project-based Assistan
$24 $35 ($11) $59 ce (2005)
Total All Programs
$109 $71 $38 $180
* Dollars in millions
T o d n by the program administrator’s tenant file disagreed with the amount billed . T also found pre-paym g ad by rmance Based Contract Administrators that avoid err e ross mpac ad was estimated at $26 million.
Changes to the m which ic hous ou ram ed as the Office of Housing’s enforcement of Project-Based Contract Administrators could reduce the o or b r. In , HUD sed f p chers and on-s ing of support for vouchers is key to reducing this component of improper payments.
enta ce Er ts
he billing err rs consisted primarily of situations where the subsidy eterminatioto HUD
supportedhe study
ent billinoneous paym
justmentsnts, and the g
HUD’s Perfo annual i t of those justments
anner in the publ ing and v cher prog s are fund as well
pportunity fite monitor
illing erro any event ’s increa review o ayment vou
Combined R l Assistan ror Impac – The collective effects of the most recent ponents is summarized in the following chart:
ayment Error (Period)
Public
nce
Vouchers &
n(millions)
Project-
tance (millions)
Total All Rental Assistance Prog(millions)
estimates of improper payments for the three error com
Type of PHousing
aAssist AssistaMod Rehab
ce AssisBased
rams (millions)
Gross Error in Administrator Subsidy Determinations (2005) $220 $456 $249 $925
Error Due to Tenant Underreporting Of Income $109 (2005)
$195 $55 $359
Gross Billing Error (2004/2005)* $49 $72 $59 $180
Total Gross Error $378 $723 $363 $1,464
FY 2005 Program Expense** $27,242 Percent of Improper Payments 5.4 * Billing Error encompass FY 2004 expenditures for PIH and FY 2005 expenditures for Housing. ** Program expense is shown on an accrual rather than a cash basis to better match the error study methodology
366

SECTION 4. OTHER ACCOMPANYING INFORMATION IMPROPER PAYMENTS INFORMATION ACT REPORTING DETAILS
HUD will continue to take aggressive steps to address the causes of improper rental assistance s for els of
payments to ensure that the right benefits go to the right people. Based on the above resultthe three types of rental assistance error, as well as plans to address known causes and levimproper payments, HUD provides the statistical results for FY 2005 and the outlook for improper payment percentages on a combined program basis from FY 2006 – FY 2008, as follows:
Rental Assistance Improper Payment Reduction Outlook FY 2005 – FY 2008
(Dollars shown in billions)
Activity FY 2004 Payments
FY 2004 IP $
FY 2004 IP % Goal/
Actual
FY 2005 Payments
FY 2005 IP $
FY 2005IP % Goal/ Actual
FY 2006 IP % Goal
FY 2007 IP % Goal
FY 2008 IP % Goal
Rental Assistance $26.069 $1.467 6.9 / 5.6 $27.242 $1.464 5.6 / 5.4 5.0 3.0 2.5
Further information on HUD’s efforts to reduce improper rental housing assistance payments is
1, 2001; and assessing the causes of any recovery opportunities
plicate payments limits the potential of improper payments;
• Established contract “Close Out” procedures to reduce the exposure to outstanding financial items related to the contract; and
provided in Indicator EM.4.1 in Section 2 of this report.
Recovery Auditing Activity
In addition to the requirements of the IPIA, Section 831 of the Defense Authorization Act of 2002, and OMB guidance, require agencies that enter into contracts with a total value in excess of $500 million in a fiscal year to carry out a cost-effective program for identifying errors made in paying contractors and for recovering amounts improperly paid to contractors. HUD acquired the services of an outside recovery-audit service provider to assist in: surveying HUD’s procurement and contract payment environment for vulnerabilities and opportunities for recovery-auditing; applying recovery-auditing techniques to the universe of HUD contracts completed subsequent to Octoberidentified, with recommendations for improved controls to avoid improper payments.
The recovery-audit service provider found that “the procedures and systems in place at HUD provide strong controls for processing accurate transactions.” The identified strengths cited in the final report include the following:
• Procurement and management of contracts provide a high degree of oversight by both HUD and contractor;
• Contract structure limits the risk to transaction error;
• Transaction approval by the HUD Government Technical Representative reduces errors on aper transaction basis;
• System controls applicable to du
367

PERFORMANCE AND ACCOUNTABILITY REPORT
• The Ginnie Mae pro innie Mae in reducing overpayments made to contractors.
The universe of contract activity covered by ry audit ect includ a value of $2.27 billion. Sixte the larger and le contracts
alue of $206.6 million were subjected to a more detailed review. The initial recovery s indicated recov otential of less t 46,000 (0.02 percent). Follow-up by the
Office co ed that the paym in question w t improper o
service p ith respect to the overall volume of s and dollar amount disbursed by HUD annually, the results of the project
indicated the procedures and systems in place at provide stron trols for proc accurate contract payment transactions.” Pursuit of an on-going recovery auditing program at
ed not to be cost-beneficial or necessary.
Section 57 assessment and initial annual risk assessments found these CDBG
HU ent activity in the m rioas identified through risk-based mo ent(GMP). The risk analysis process h sh cted fmonitoring based on pre-set Depar cri tee d acc sk
ring based on their ranking. Field offices performed on-site s and identified im payments as part of their reviews.
ata were compiled by the field offices and entered into the GMP system. yzed the data and extrapolated to the annual funds disbursed for determine the total estim proper paym
riod, as follows:
gram third party review has proven beneficial to G
HUD’s recove ing proj ed 568 contracts withwith a v
en of more vulnerab
audit resultHUD Contracting erroneous.
ery pnfirm
han $ents ere no r
The recovery-audit contract transaction
rovider concluded that, “W
HUD g con essing
HUD was determin
Other HUD Program and Administrative Activities
Prior to enactment of the Improper Payments Information Act, the Office of Management and Budget requested agency input on improper payments in select programs, including the CDBG Entitlement and State/Small Cities Programs, through Section 57 of OMB Circular No. A-11. HUD’s originalprograms to be at low risk of improper payments not warranting reporting. However, OMB subsequently revised its guidance to clarify that agencies should report on the former Section 57 programs until they can document a minimum of two consecutive years of improper payments that are less than $10 million annually, as the basis for a request for OMB relief from annual reporting. In compliance with this requirement, HUD developed and applied a systematic method to document that the CDBG program has not had a significant improper payment level for the past three consecutive years.
D reviewed improper paym CDBG progra
ich granteesteria. Gran
for the pe
ould be seles were ranke
d FY 2003-2005, Process or on-site ording to ri
nitoring efforts under the Grants Managem determined wtmental risk
and selected for on-site monitomonitoring of higher risk grantee properImproper payments dCPD headquarters staff analfiscal years 2003 to 2005 to ated annual CDBG im ent level for the three-year pe
368

SECTION 4. OTHER ACCOMPANYING INFORMATION IMPROPER PAYMENTS INFORMATION ACT REPORTING DETAILS
CDBG Improper Payments Based on GMP System for FY 2003 through FY 2005
Fiscal Year
Total CDBG Dollar Amount Monitored
Total CDBG Program Dollars
Disbursed
Improper Payments Detected on Monitoring
Improper Payments Extrapolated to the
Population 2003 $2,075,218,153 $4,923,710,000 $2,025,487 $4,805,717 2004 $1,906,042,598 $4,869,633,000 $3,116,223 $7,961,450 2005 $4,388,208 $1,780,311,308 $4 $1,616,704 ,832,286,000
Since HUD’s analysis determined that the CDBG Program is below the annual $10 million thre req m of relieffurther annual re n t to ang rog isk s.
shold for uired repporting o
orting, th this p
e Depart ent has a, subjec
requested a ch
OMB’s approvalram r
from rogram are e in p statu
369

PERFORMANCE AND ACCOUNTABILITY REPORT
HUD Assisted Housing Units by Program HUD Assisted Units/Households
FY 2003 FY 2004 FY 2005 FY 2006Section 8 Low Income Rental Assistance Program:
Tenant-based assistance a/ 2,051,967 2,087,344 2,056,430 2,084,917Project-based assistance 1,319,632 1,309,427 1,306,740 1,287,529Total Section 8 3,371,599 3,396,771 3,363,170 3,372,446 Public Housing Program 1,206,721 1,188,649 1,177,337 b/ 1,172,204
0 Sub-total 4,578,320 4,585,420 4,540,507 4,544,65Housing for the Elderly Sec. 202 70,026 75,227 82,359 86,056Housing for the Disabled Sec. 811 20,379 21,646 23,243 25,22Tenant-based 811 14,447 14,447 14,739 14,634Sub-total 104,852
7
111,320 120,341 125,917Other Assistance Programs Homeownership Assistance Program (Section 235) 10,195 8,447 6,699 5,57Rental Housing Assistance Program (Section 236) 368,900 346,802 322,083 318,561Rent Supplement 18,107 17,290 17,239 16,619Sub-total 397,202 372,539 346,021 340,753
3
Less estimated number of households receiving more than one form of assistance (double count) (217,250) (217,250) (217,250) (217,250)
Total, Public and Assisted Housing a/ 4,863,124 4,852,029 4,789,619 4,794,070 HOME Tenant-Based Assistance 10,731 15,479 20,554 23,325HOME Rental Units Completed 25,977 23,392 33,612 47,59HOME Homebuyer Units Completed 25,867 30,780 32,307 55,652HOME Existing Homeowners Completed 10,705 10,112 14,832 16,821HOME Total Households
8
73,280 79,763 101,305 143,396
CDBG Households 184,611 159,703 166,992 177,314Self Help Homeownership Opportunity Program New Homebuyers 2,157 1,735 2,277 1,
Housing Opportunities for Person With AIDS Households 78,467 70,779 70,325 67,012Indian Housing Block Grant Households 6,097 7,712 6,505 6,505Rural Housing & Economic Development 6,065 NA NA NANative Hawaiian Homeland Block Grant Households N/A N/A 72 23TOTAL of HOME, CDBG, Self Help Homeownership Opportunit
868 c/
y Program, Housing Opportunities for Persons With AIDS, Indian Housing Block Grant, Rural Housing and Economic Development, Native Hawaii
350,677 319,692 347,476 396,118 an Homeland
lock Grant, Households Served B a/ In FY 2003 and FY 2004, the number of contracted units are displayed. FY 2005 and FY 2006 figures
represent HUD's estimate of funded units. Funded units are the number of units leased during a snapshot in FY 2004 with increases for new tenant protection vouchers in FY 2005 and FY 2006. Disaster assistance vouchers are not included.
b/ This figure has been revised due to data verification efforts. c/ This number is for the period July 1, 2005, to June 30, 2006. Fourth quarter data were not available in time for
publication of the PAR. N/A - Not Available
370

SECTION 4. OTHER ACCOMPANYING INFORMATION COMPLIANCE STATUS OF FINANCIAL MANAGEMENT SYSTEMS
Compliance Status of Financial Management Systems Financial Management STOT 1
TOTAL Non-compliant: 2 Office of Administ
ystem tes as of Sep mber 30, 2006 AL: 4
ration (2) D67A cilities s
(FIRMP162 UD Int ur
System (HIHRTS) Office of Chief Procurement Officer (2)
Fa Integrated Resource Management System H
S)* egrated Human Reso ces Training
A35 HUD Procurement System (HPS) *** P035 Small Purchase System (SPS)*** Office of Chief Financial Officer (14) A21 Loan Accounting System (LAS)* A39 HUD Consolidated Financial Statement
System (HCFSS) (Hyperion) A65A Section 235 Automated Validation and
Editing (SAVE) A67 Line of Credit Control System (LOCCS) A75 HUD Central Accounting and Program
System (HUDCAPS) A91 Consolidated Cost and FTE Files (CCFF) A96 Program Accounting System (PAS) D08 Bond Payment System (BONDMAPPER) D21 Departmental Accounts Receivable
Tracking/Collection System (DARTS) D61 EZBudget Budget Formulation System
(EZB) D65A Section 8 Budget Outlay Support System
(BOSS) D91A Total Estimation and Allocation Mechanism
– Resource Estimation and Allocation Process (TEAM-REAP)
H18 Integrated Automated Travel System (IATS) P001 HUD Travel Management System (HTMS) Community Planning and Development (2) C04 Integrated Disbursement & Information
System (IDIS) C38 Special Needs Assistance Program (SNAPS) * Compliant, pending independent verification ** New system *** Non-compliant
sing (19)Hou A43 Sin rance Sys
C Sin rance Clai (CLAIM
A80B Single Family Premium Collection System-Periodic (SFPCS-P)
A80D Distributive Shares and Refund Subsystem (DSRS)
A80N Single Family Mortgage Notes (SFMN) A80R Single Family Premium Collection System-
Upfront (SFPCS-U) A80S Single Family Acquired Asset Management
System (SAMS) D64A SF Housing Enterprise Data Warehouse
(SFHEDW) F12 Home Equity Conversion Mortgages
(HECM) F17 Computerized Home Underwriting
Management System (CHUMS) F42D SF Default Monitoring Subsystem (SFDMS) F47 Multifamily Insurance (MFIS) F51 Institution Master File (IMF) F71 Debt Collection & Assets Management
System-Title I Notes (DCAMS) F72 Title I Insurance and Claims (TIIS) F75 Multifamily Insurance and Claims (MFIC) F87 Tenant Rental Assistance Certification
System* (TRACS) P013 FHA Subsidiary Ledger (FHA-SL) P057 Multifamily Delinquency and Default
Reporting (MDDR) Government National Mortgage Association (1)
gle Family Insu tem (SFIS) A43 gle Family Insu
S) ms Subsystem
P237 Ginnie Mae Finance and Accounting
System** (GFAS) Public and Indian Housing (1) P113 Inventory Management System (IMS) Inactive Systems: B09 Default Management System (GNMA),
B16 MACOLA Accounting Software System (GNMA) Reclassified as non-financial management system: P181
Enterprise Income Verification System (PIH), and P106 Tenant Assessment Subsystem (PIH)
371

PERFORMANCE AND ACCOUNTABILITY REPORT
Role of Program Evaluations and Research Studies in Assessing Program
ach year, HUD completes a number of program eval d st ee a level of detail and confidence about the
hat performance measures alone cannot capture. The Departmsearch to make informed decisi D , p d
osals. This Appendix presents the pri gs of selecinning of FY 2006. Most of s b
velopment and Research clearinghouse, HU b d
Performance E uations an research udies relat d to significant policy issues. These studies providprogrammatic impacts t ent uses the findings of this re ons on HU policies rograms, budget, anlegislative prop mary findin ted research reports completed since the beg the report are availa le from the Office of Policy De D USER, which can e accesse at http://www.huduser.org.
Goal H: Increasing Homeownership Opportunities vant to Strategy Goal 1 were com
rterly), the A an Ho urv pecousing Sur the S a n a
ts. In additi ese r o D, iensus Bureau, releases monthly statistics on new resi n
-fa s also publishes qu e
e absorption of new mi
ownership Reports. To pr a ba t e d menoving homeownership uniti H sp D
esearch commissioned nine studies, and held a conference, omeownership barriers faced by this population. These stud s
ation on the extent of homeownership tw p nwhat is kn bout a an ive
signed to help Hispanics become homeowners. These studies will serve as a critical t His achie r se of
resident’s minority homeownership goal.
The Homeownership Experience of Low-Income and Minority Families: A Review and what is known about the homeownership
nd assesses the extent to which n t tur u y at lo benefit from homeownership. The study
inority families are more apt to encounter difficulties sustainin help
own
Housing Impact Analysis. Current procedures require that all new economically significant his research developed a methodology,
cost and availability of housing. This methodol will helices to increase housing affordability.
The following studies rele pleted during FY 2006. HUD also publishes the U.S. Housing Conditions (qua meric using S ey for s ific metro areas (annually), and the American H
lysis about housing markevey for o
United s
t tes (bien i lly) to nprovide data ana
tion with the Cn to th urvey ep rts, HU
collabora dential co struction including starts, permits, inventories of unused permits, new housing units under construction and completions, and new residential sales such as new single mily sale , prices and inventories of unsold homes. HUD
nd tharterly re m
ports on thly
placementun
of new manufactured housing units a ultifa housing its.
Improving Hispanic Home omote sis for h evelop t of additional policies aimed at impr opport es for i anics, HU ’s Office of Policy Development and Rto examine a variety of h ie provide important inform gaps be een His anics and no -Hispanic whites, the causes of these gaps, and programs de
own a the sc le d effect ness of
foundation from which to develop policies to assis panics ve inc ea d levels homeownership and to support the P
Synthesis of the Literature. This study reviewsexperience of low-income and minority households ahomeownership is benefiting these groups. Based oincome and minority owners are as likely as others tlso finds that low-income and m
he litera e, the st d finds th ow-
a ghomeownership, which points to the importance of continuing and enhancing policies that
ers weather and resolve circumstances that threaten their ability to sustain homeownership.
federal rules undergo a Regulatory Impact Analysis. Tknown as Housing Impact Analysis, that identifies and analyzes regulations that would have a
on thesignificant impactgovernment agencies develop sound housing po
ogy lp
372

SECTION 4. OTHER ACCOMPANYING INFORMATION ROLE OF PROGRAM EVALUATIONS AND RESEARCH STUDIES IN ASSESSING PROGRAM
PERFORMANCE
373
using agencies (PHAs) start this program and had enabled more than 4,000 purchases of homes. This zes the characteristics of this program nationally. It covers such topics as how
s, how they provide homeownership financing, what characterizes h borhoods, and what ch the housing markets in which P a As that have been particularly active in the program. ep w e
G rdable HoAffordable Housing Needs: A Report to Congress on the SignificanThis report is the ninth in a series of Worst Case N ep“ unassisted rentearea medi an half of t coi uat g the exp rs, their income, and the am a se cas ta s first timo re ry. T or or the continued, significant need for housing among low-inc on.
C te n Hom e ovation a ici lly l ro mmissioned a 2005 national survey of housing builders that pr ple i omebuilding firms, of which a few have become publicly traded Fortune 500 companies, as well as nac ie artn fo ng, understand how these large firm wledge, and adopt technological change, and e
Comprehensive Market Analysis Reports. HUD’s Economic and Market Analysis Division p s ioperations. In FY 2006, 18 reports were com lete d a f e economic, d housing inventory c teri uring three periods: from 1990 to 2000, from 2000 to ap einformation, findings, and conclusions contained t ers concerned w
Construction Cost Indices: HUD Section 202 a UD commissioned the National Association of Home Builders (NAHB) Research Center to conduct
202 and Section 811 supportive housilderly and persons with disabilities. This study investigated whether development cost limits ere associated with delays in the production of these units. The results showed that different
Voucher Homeownership Study. In 1999, HUD began to administer the Voucher Homeownership program. By the end of 2005, more than 450 public hohad chosen to study summariPHAs designed their programomebuyers and their neigh
rearacterizes
HAs a administering the program. The study lso includes in-depth case studies of 10 PH This r ort will help policymakers understand
e voucher ays to improve homeownership through the us of th program.
oal A: Promote Decent Affo usingt Need for Housing.
reeds orts to Congress. Households with rs with very low incomes (below 50 percent of worst case needs” are defined as
an income), who pay more th heir in me for housing or live in severely erience of rentenadeq e housing. In addition to examinin
ounts they pay in rent, this study also explores nd how these supply issues may affect wor
s to
the availability of affordable rental housinge needs. This study draws on multiple da
e includes an analysis showing that episodes ource validate core findings, and for the f seve rent burden frequently are tempora his rep t allows policymakers to monit
ome persons across the nati
harac ristics of Innovative Productio e Build rs. To better understand innnd eff ency among large builders, specifica arge p duction builders, HUD co
oduce 200 or more homes a year. The samnclud everal national and international hed s
regio l and local housing production ompan s. This study helps HUD, and the P ership r Advancing Technology in Housi
s process, acknofficiently produce affordable housing.
repar ndividual studies of regional marketsp
e to help guide and support HUD’s program ped. For each analysis, economists develo
emographic, andramework and considered changes in thharac stics of a specific housing market d
“as-of” date the of the analysis and from the “ovide stimates of employment, population, housing, and housing inventory. The factual
s-of”date period to a forecast date. The reports r
in these reports are useful not only to HUD but ith local housing conditions and trends. o homebuilders, mortgagees, and oth
nd 811 Supportive Housing Programs. H
ng programs, which serve the an evaluation of the Section ew

PERFORMANCE AND ACCOUNTABILITY REPORT
regions have varying development costs. The study recommends that regional variationdevelopment costs be considered, in order to alleviate project delays due to a lack of apfunding.
in propriate
Multifamily Properties: Opting In, Opting Out and Remaining Affordable. HUD’s assisted project-based multifamily properties are privately owned properties representing a significant component of federally assisted housing for low-income people. This stock includes more than 22,000 properties and 1.5 million units. In this study the characteristics of the properties remaining part of the multifamily stock are compared to those that have left the stock through either prepayment or opting out. Additionally, the rent structure and affordability of remaining units are compared to those that have left. This study gives policymakers a better understanding of property characteristics associated with affordability within the multifamily stock.
port to Congress. HUD efficiency in public
ed
blic
t shows that it is
dy he
ote greater
nt
Promoting Energy Efficiency at HUD in a Time of Change: Rerecently outlined its strategy for reducing energy costs and increasing energy and assisted housing, as required by the Energy Policy Act of 2005. The report specifies the steps HUD is taking – and proposes to take – to address rising energy costs in public and assisthousing, as well as in housing financed through formula and competitive grant programs. The report details how HUD is promoting, monitoring, and measuring efficient energy use in puand assisted housing. Also included are the strategies that, in cooperation with the Department of Energy and the Environmental Protection Agency, will assist HUD’s effort to advance the cost-effective and efficient use of energy in the future.
Goal C: Strengthen Communities CDBG Formula Targeting to Community Need. This study assesses how well the CDBG formula, after the introduction of 2000 Census data, allocates funds toward community development need. The report offers four alternative formulas that would substantially improve targeting to communities in need and is a major step forward toward reforming this program. This report was particularly important in structuring HUD’s proposed 2006 CDBG reformlegislation.
Predicting Staying in or Leaving Supportive Housing That Services Homeless People with Serious Mental Illness. This study examines the experience of 943 residents of permanensupportive housing in Philadelphia between 2001 and 2005. The investigation not necessarily problematic that some people leave “permanent” supportive housing. This stucontributes to our understanding of how the structure of permanent supportive housing and tuse of various means of stabilization at critical junctures in a resident’s stay can promlong-term residential stability.
Promoting Work in Public Housing: The Effectiveness of Jobs-Plus. This report evaluates the effectiveness of the Jobs-Plus program in promoting employment and increasing earnings of public housing residents. Results of this 5-year research project suggest that the Job-Plus program is associated with increased earnings for tenants living in Job-Plus developments compared to residents in similar developments without Job-Plus. These findings offer importalessons to policymakers and program administrators about how public housing can be used as aplatform to promote labor force participation and increase economic self-sufficiency.
374

SECTION 4. OTHER ACCOMPANYING INFORMATION ROLE OF PROGRAM EVALUATIONS AND RESEARCH STUDIES IN ASSESSING PROGRAM
PERFORMANCE
ne area – discrimination based on religion. This study will help HUD and fair housing advocates
D
Goal FH: Ensure Equal Opportunity In Housing Do We Know More Now? Trends in Public Knowledge, Support and Use of Fair Housing Law. The federal Fair Housing Act defines basic obligations, protections, and enforcement provisions pertaining to housing discrimination. This study helped HUD learn the general public’s awareness of and support for this law and the degree to which persons believing they were victims of housing discrimination sought to take legal action. This study was a follow up toa 2002 baseline report on Fair Housing Act knowledge. This 2006 report showed that knowledge of fair housing laws has increased in two areas – discrimination against families with children and steering of prospective homebuyers by race – but declined in o
understand what aspects of discrimination need to be better targeted.
Goal EM: Embrace High Standards of Ethics, Management, and Accountability Quality Control for Rental Assistance Subsidies Determinations. This study found that HUpaid approximately $681 million in excess housing subsidy payments in 2004 because tenants incomes were underreported or miscalculated. Errors also resulted in a number of subsidy underpayments, which amounted to $306 million. Based on this study, the Office of Public and Indian Housing has taken a number of actions to reduce payment and subsidy calculation errors. These internal changes helped HUD become the only agency to have been assigned a “green” rating by the Office of Management and Budget for its error reduction efforts.
375

PERFORMANCE AND ACCOUNTABILITY REPORT
376

If you have any questions or comments, please call James Martin, l him at
Deputy Chief Financial Officer, at 202-708-1946 or e-mai
Written comments or suggestions for improving this report may be
submitted by mail to: U.S. Department of Housing and Urban Development
Attention: James Martin, Deputy Chief Financial Officer 451 7th St. SW
Washington, DC 20410 Or by e-mail to [email protected]
For additional copies of this report, please call the CFO’s Office for Financial Management at 202-708-0638 extension 6544 or e-mail


![ACCOUNTABILITY REPORT 2013 › ... › 01 › EDUCO-ACCOUNTABILITY-REPO… · Accountability report 2013 [3]](https://static.fdocuments.net/doc/165x107/5f03b5847e708231d40a62a8/accountability-report-2013-a-a-01-a-educo-accountability-repo-accountability.jpg)