Performance analysis of urban road intersections and … · intersections and its environmental...
12
Performance analysis of urban road intersections and its environmental implication: a case study of the Lagos metropolitan area J. J. Dukiya & A. O. Ajiboye Department of Transport Management Technology, School of Entrepreneurship and Management Technology, Federal University of Technology, Minna, Nigeria Abstract Urban road intersections are a major factor that influences the effectiveness of traffic flow systems. This paper is aimed at examining the performance of road intersections in the Lagos metropolitan area using the “Y-junction” of Oga- Ikorodu (Lagos, Nigeria) as the case study. The study examines the delay factors, time wastage and traffic conflicts. The study uses a reconnaissance survey, delay analytical tool, vehicle spot speed study and traffic volume survey to assess the level of delay, economic loss and traffic flow interruption. The study reveals that there are varying Levels of Service (LOS) obtainable at different times of the day on different carriageways, while Ayangburen Road records the best LOS of B in the morning, the afternoon and evening recorded C and D respectively. A different scenario holds for both Lagos and Sagamu as they record the worse LOS of E in the evening peak. In a related manner, the percentage of vehicle stoppage falls between 41.1%–87.8% indicating that vehicles tend to experience a stop scenario than not-stop at each approach especially during the peaks. It is therefore pertinent to note that the road intersection operates at a very low level of service especially during the evening peak when controlled by traffic wardens. It is therefore recommended that a Diamond-at-grade intersection be constructed in the area instead of the round-a-bout. The introduction of an automated traffic control system with full control of access and total removal of on-street parking will remove the road users’ burden in that area. Keywords: delay factors, spot speed, traffic volume, level of service, intersection performance, traffic conflict, traffic control, queuing, sight distance, parking control and, round-a-bout. www.witpress.com, ISSN 1743-3509 (on-line) WIT Transactions on The Built Environment, Vol 116, © 2011 WIT Press Urban Transport XVII 167 doi:10.2495/UT110151
Transcript of Performance analysis of urban road intersections and … · intersections and its environmental...

Performance analysis of urban road intersections and its environmental implication: a case study of the Lagos metropolitan area
J. J. Dukiya & A. O. Ajiboye Department of Transport Management Technology, School of Entrepreneurship and Management Technology, Federal University of Technology, Minna, Nigeria
Abstract
Urban road intersections are a major factor that influences the effectiveness of traffic flow systems. This paper is aimed at examining the performance of road intersections in the Lagos metropolitan area using the “Y-junction” of Oga-Ikorodu (Lagos, Nigeria) as the case study. The study examines the delay factors, time wastage and traffic conflicts. The study uses a reconnaissance survey, delay analytical tool, vehicle spot speed study and traffic volume survey to assess the level of delay, economic loss and traffic flow interruption. The study reveals that there are varying Levels of Service (LOS) obtainable at different times of the day on different carriageways, while Ayangburen Road records the best LOS of B in the morning, the afternoon and evening recorded C and D respectively. A different scenario holds for both Lagos and Sagamu as they record the worse LOS of E in the evening peak. In a related manner, the percentage of vehicle stoppage falls between 41.1%–87.8% indicating that vehicles tend to experience a stop scenario than not-stop at each approach especially during the peaks. It is therefore pertinent to note that the road intersection operates at a very low level of service especially during the evening peak when controlled by traffic wardens. It is therefore recommended that a Diamond-at-grade intersection be constructed in the area instead of the round-a-bout. The introduction of an automated traffic control system with full control of access and total removal of on-street parking will remove the road users’ burden in that area. Keywords: delay factors, spot speed, traffic volume, level of service, intersection performance, traffic conflict, traffic control, queuing, sight distance, parking control and, round-a-bout.
www.witpress.com, ISSN 1743-3509 (on-line) WIT Transactions on The Built Environment, Vol 116, © 2011 WIT Press
Urban Transport XVII 167
doi:10.2495/UT110151

1 Introduction
Movement of people, goods and information has always been a fundamental component of human societies as re-echoed by Adeyemo [1] that immobility perpetuates poverty while an immobile nation is far from being developed. Transportation represents one of the most important human activities worldwide and it is an indispensable component of the economy and plays a major role in spatial relations between locations. A transportation system can be defined as consisting of fixed facilities, the flow entities and the control systems that permit people and goods to overcome the friction of geographical space efficiently in order to participate in a timely manner in some desired activities. With this, an efficient transport system is essential for socio-economic growth. A good transportation system provides the necessary link for all component parts of the system and facilitates the movement of people and goods from one place to another. The rate of economic growth may be retarded by the absence of an efficient transportation system. In Lagos State, the road intersections are currently playing host to a serious gridlock, as most of them can be said to lack proper projection at the design stage couple with the road users’ deviance to traffic laws. In view of this, a thorough assessment of the road intersections which is a vital component of the fixed facilities of road transport sub-system is therefore necessary.
1.1 Background of the study area
Oga road junction in Ikorodu are of Lagos State serves as a hub of the entire road network of the Ikorodu Local Government Area which plays host to so many large industries, tertiary institutions, power generation station, banking avenue, army barrack, housing estates, hospitals, among others. The presence of these major land uses have contributed to the agglomeration of dense economic activities in the local government area. Oga road junction of Ikorodu is undoubtedly a major junction that linkup the three major Lagos, Sagamu and Ayangburen distributor Roads, Fig 1 for the Image of the intersection and the density of land uses. This area of the state is to play host to a proposed Fourth Mainland Bridge and Inland Waterways Project that will turn Lagos State into a mega city. Although these projects are still in an embryo state, there is presently an overwhelming spatial development of the area which has already aggravated the present and future super imposed traffic movement in the area. The ever growing population of Lagos has made the existing road network inadequate thereby rendering the road intersection inadequate coupled with the fact that some of those intersections are without control devices, and where they exist, they are obsolete or not functional.
www.witpress.com, ISSN 1743-3509 (on-line) WIT Transactions on The Built Environment, Vol 116, © 2011 WIT Press
168 Urban Transport XVII

Figure 1: Oga junction in Ikorodu-Lagos, Nigeria.
The situation is made worrisome by the attitude of the road users, pedestrian interference, on-street parking, coupled with the buzz of commercial motorcyclist and street hawkers scouting for people to patronize them around those junctions. And this is occasioned by the inefficiency of the public transit system to cater for a teeming pedestrian population of Lagos metropolis and have made most junctions counter-productive. The junctions on Lagos roads are avenues for delays, time wasting and serious traffic conflicts which have led to various levels of traffic accidents. In an attempt to tackle the traffic snarl-ups and boredom in Lagos, the researcher focused specifically on Oga road junction of Ikorodu with a view to making an impact towards improving movement at these locations.
1.1.1 Aim and objectives of the study This study is aimed at assessing the performance efficiency of “Oga road intersection” of Ikorodu, Lagos Nigeria with a view of proffering functional planning solution that will boost the performance efficiency and consequently ameliorate the perennial traffic holdup in that locality. To achieve this, the following objectives are to be addressed;
i. Identify and map the three arms of the intersection together with the adjoining land uses,
ii. examine the Average Daily Traffic (ADT) flows by vehicle category on the three arms of the intersection,
iii. identify and examine the critical direction of the queue length at the intersection,
iv. determine the vehicular spot speed (at predetermined entry and exit).
www.witpress.com, ISSN 1743-3509 (on-line) WIT Transactions on The Built Environment, Vol 116, © 2011 WIT Press
Urban Transport XVII 169

2 Review of some related literatures
Transportation is generally defined as the movement of goods, services and information from one place to another, with a specific purpose. Transport is the ubiquitous wheel that keeps all other elements as well as the entire system of the country in constant motion according to Badejo [2]. The primary function of a transport system is the moveability of passengers and goods to where the relative value is greater in space which must be time and safety conscious. Transport sector enables exchange of resources, materials, information and services within a specified region. In a related manner, the cost of transportation is one of the most significant variables in determining the market price of any commodity. Transport sector has remained the nucleus of the economy as observed by Arosanyin [3] and likewise provides the interaction and integration of various regions and sectors of the country’s economy and non-existence or inefficient transport system perpetuate subsistence lifestyle, limits the pace of transformation and integration of the society. In a related manner, a transport system is a closed system which incorporates the air, water and land (rail, pipeline and road) transportation. Limiting the review to road transportation, it is a very clear ideology that road transportation in Nigeria is the most abused mode of transportation. The sub-system has now dominated the entire process of movement of goods, passengers and services within the country and still remains underdeveloped. In spite of the tremendous roles played by the sub-system, it has really been bedevilled by traffic congestion. Sequel to this, the pivotal role played by transport in the overall development of any country cannot be overemphasized since it is a key factor in the overall development. According to Akintayo [4], transportation can be seen as the hub on which the entire economy of a nation revolves. Thus, in a particular stage of development, a country requires a certain level of transportation infrastructure (fixed or dynamic) in order to maximize her resource potentials. Unfortunately, the relative rise in congestion can be seen as a natural consequence of the “lumpy” nature of infrastructural provision. However, congestion is perhaps the most visible manifestation of the failures in urban transportation planning, and its costs are significant (Ogunsanya [5]). Traffic congestion is a problem felt by residents of most urban centres and everyone hates traffic congestion but it keeps getting worse in spite of attempted remedies. The growth of traffic congestion is brought about by either the entry of new users or as a result of a shift from another mode. This has spread tremendously along the entire corridors of developing economy, especially during the peak periods. Road congestion trauma causes people to make trips that are not urgent, choose alternative destinations and modes, and even forego avoidable trips. In fact, congestion imposes costs on the economy and generates multiple impacts on urban regions and their inhabitants.
www.witpress.com, ISSN 1743-3509 (on-line) WIT Transactions on The Built Environment, Vol 116, © 2011 WIT Press
170 Urban Transport XVII
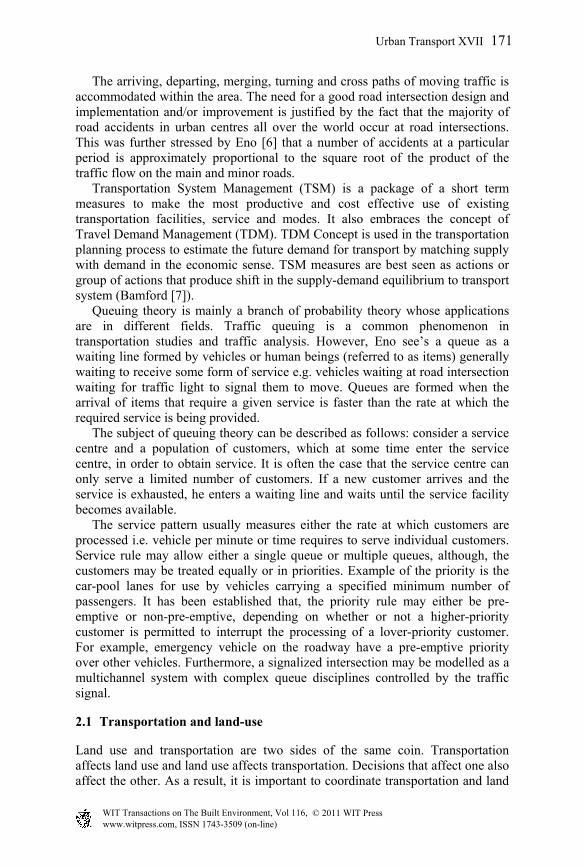
The arriving, departing, merging, turning and cross paths of moving traffic is accommodated within the area. The need for a good road intersection design and implementation and/or improvement is justified by the fact that the majority of road accidents in urban centres all over the world occur at road intersections. This was further stressed by Eno [6] that a number of accidents at a particular period is approximately proportional to the square root of the product of the traffic flow on the main and minor roads. Transportation System Management (TSM) is a package of a short term measures to make the most productive and cost effective use of existing transportation facilities, service and modes. It also embraces the concept of Travel Demand Management (TDM). TDM Concept is used in the transportation planning process to estimate the future demand for transport by matching supply with demand in the economic sense. TSM measures are best seen as actions or group of actions that produce shift in the supply-demand equilibrium to transport system (Bamford [7]). Queuing theory is mainly a branch of probability theory whose applications are in different fields. Traffic queuing is a common phenomenon in transportation studies and traffic analysis. However, Eno see’s a queue as a waiting line formed by vehicles or human beings (referred to as items) generally waiting to receive some form of service e.g. vehicles waiting at road intersection waiting for traffic light to signal them to move. Queues are formed when the arrival of items that require a given service is faster than the rate at which the required service is being provided. The subject of queuing theory can be described as follows: consider a service centre and a population of customers, which at some time enter the service centre, in order to obtain service. It is often the case that the service centre can only serve a limited number of customers. If a new customer arrives and the service is exhausted, he enters a waiting line and waits until the service facility becomes available. The service pattern usually measures either the rate at which customers are processed i.e. vehicle per minute or time requires to serve individual customers. Service rule may allow either a single queue or multiple queues, although, the customers may be treated equally or in priorities. Example of the priority is the car-pool lanes for use by vehicles carrying a specified minimum number of passengers. It has been established that, the priority rule may either be pre-emptive or non-pre-emptive, depending on whether or not a higher-priority customer is permitted to interrupt the processing of a lover-priority customer. For example, emergency vehicle on the roadway have a pre-emptive priority over other vehicles. Furthermore, a signalized intersection may be modelled as a multichannel system with complex queue disciplines controlled by the traffic signal.
2.1 Transportation and land-use
Land use and transportation are two sides of the same coin. Transportation affects land use and land use affects transportation. Decisions that affect one also affect the other. As a result, it is important to coordinate transportation and land
www.witpress.com, ISSN 1743-3509 (on-line) WIT Transactions on The Built Environment, Vol 116, © 2011 WIT Press
Urban Transport XVII 171
use planning decisions so they are complementary rather than contradictory. This ensures that transport planning decisions support land use planning objectives and land use planning decisions support transport planning objectives. Research has shown that the characteristics of travel could be related to the intensity and spatial separation of land uses.
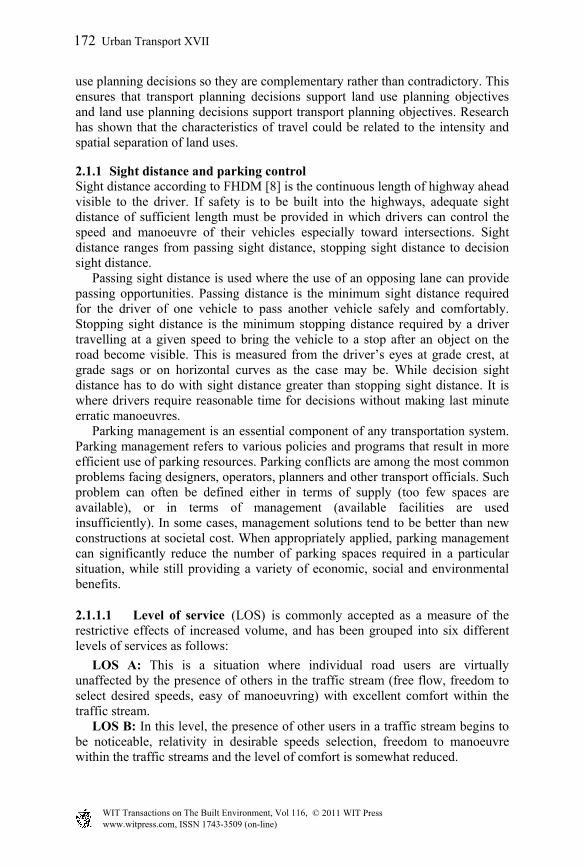
2.1.1 Sight distance and parking control Sight distance according to FHDM [8] is the continuous length of highway ahead visible to the driver. If safety is to be built into the highways, adequate sight distance of sufficient length must be provided in which drivers can control the speed and manoeuvre of their vehicles especially toward intersections. Sight distance ranges from passing sight distance, stopping sight distance to decision sight distance. Passing sight distance is used where the use of an opposing lane can provide passing opportunities. Passing distance is the minimum sight distance required for the driver of one vehicle to pass another vehicle safely and comfortably. Stopping sight distance is the minimum stopping distance required by a driver travelling at a given speed to bring the vehicle to a stop after an object on the road become visible. This is measured from the driver’s eyes at grade crest, at grade sags or on horizontal curves as the case may be. While decision sight distance has to do with sight distance greater than stopping sight distance. It is where drivers require reasonable time for decisions without making last minute erratic manoeuvres. Parking management is an essential component of any transportation system. Parking management refers to various policies and programs that result in more efficient use of parking resources. Parking conflicts are among the most common problems facing designers, operators, planners and other transport officials. Such problem can often be defined either in terms of supply (too few spaces are available), or in terms of management (available facilities are used insufficiently). In some cases, management solutions tend to be better than new constructions at societal cost. When appropriately applied, parking management can significantly reduce the number of parking spaces required in a particular situation, while still providing a variety of economic, social and environmental benefits.
2.1.1.1 Level of service (LOS) is commonly accepted as a measure of the restrictive effects of increased volume, and has been grouped into six different levels of services as follows:
LOS A: This is a situation where individual road users are virtually unaffected by the presence of others in the traffic stream (free flow, freedom to select desired speeds, easy of manoeuvring) with excellent comfort within the traffic stream. LOS B: In this level, the presence of other users in a traffic stream begins to be noticeable, relativity in desirable speeds selection, freedom to manoeuvre within the traffic streams and the level of comfort is somewhat reduced.
www.witpress.com, ISSN 1743-3509 (on-line) WIT Transactions on The Built Environment, Vol 116, © 2011 WIT Press
172 Urban Transport XVII

LOS C: The operation of individual users become significantly affected by the presence of others, and manoeuvring within the traffic stream requires substantial vigilance. The general level of comfort and convenience declines noticeably at this level. LOS D: Here, there is severely restriction of speed and freedom to manoeuvre. Small increase in traffic flow will generally cause operational problems at this level. LOS E: Operating conditions here is at or near the capacity level. Freedom to manoeuvre within the traffic stream is extremely difficult and only achieved with forceful accomplishment. Minor perturbations within a traffic stream can cause holdup. LOS F: This condition exists whenever the amount of traffic approaching a point exceeds the amount which can travel through the point. Operations within the queue are characterized by stop-and-go waves, and traffic operates like a stopwatch cycle fashion. Level of service F is used to describe the operating conditions within the queue as well as at the point of break down.
3 Methodological approach
To commence this study, the external cordon of the study was defined to cover 100metres along the three arms of the intersection. Then three days traffic volumetric count was conducted, while another three working days were used to collect data on geometric data, control measures, traffic data and delay data. Data on geometric features and control measures reveal the physical characteristics of the intersection legs. The counting of the number of vehicles which transverse the assumed stop line of the intersection approach marked by the researcher over a period of thirty minutes was conducted. This was done with the use of stopwatch and pro-formal recording sheet. Also an average thirty minutes approach and directional volume at the intersection approach legs were obtained. An approach distance of 100m was chosen after several sampling of the queue lengths during the “stopped period”. Secondly, the counting of the number of vehicles “stopped and not stopping” on approach length for every fifteen seconds interval for a period of thirty minutes was done.
3.1 Determination of average delay
In this study, two types of delay were used for the assessment of the intersection performance. They are: approach delay per vehicle, which is a measure of the total time lost on an intersection approach when compared with free flow operation and stopped delay per vehicle which is a measure of the time lost while vehicle is completely stopped. These were used for the derivation of the exact Level of Service (LOS) obtainable at the intersection.
www.witpress.com, ISSN 1743-3509 (on-line) WIT Transactions on The Built Environment, Vol 116, © 2011 WIT Press
Urban Transport XVII 173

4 Analysis and discussions
The detailed the geometric characteristics, type of control and traffic flow of the study site is presented in Table1.
Table 1: Data on the geometric features, control measures and type of traffic flow.
Name of Intersection
Name of Intersecting Corridors
Type of Control
Physical Characteristics
Traffic composition
Oga Junction
a, Lagos Road
b, Sagamu Road c, Ayangburen
Road
Manual (traffic
warden).
T-junction, 2-lanes on each
approaches
Heavy vehicles and light vehicles (cars, buses of different sizes and trucks)
4.1 Traffic volume and the corresponding spot speed analysis
Table 2 is the field data observation of the morning, afternoon and evening peak average hourly volume at the intersection. “Outbound” traffic refers to the vehicles moving away from the round-a-bout, while the “inbound” means those vehicles leaving the round-a-bout at a point in time.
Table 2: Summary of intersections average peak hour volume.
Intersection Road Flow Morning Afternoon Peak
Evening Peak
Sub-Total Total
Oga Junction
Lagos Road In 584 661 1104 2349 3253 Out 554 517 380 1451
Sagamu Road
In 758 547 494 1799 3800 Out 513 315 626 1454
Ayangburen In 498 455 511 1464 2890 Out 516 395 515 1426
The inbound traffic from Lagos is quite larger than the outbound (i.e. traffic going to Lagos). More people move out of Lagos in the evenings (1104) after the day’s business than coming in, while Sagamu outbound traffic is higher in the evening (626) than the inbound traffic since more vehicles travel outside the local government. See Fig. 2 for a typical day of convergence and divergence of vehicles at Oga junction (vehicles in white broken lines).
www.witpress.com, ISSN 1743-3509 (on-line) WIT Transactions on The Built Environment, Vol 116, © 2011 WIT Press
174 Urban Transport XVII

Figure 2: Oga road junction with queuing vehicles (vehicles in white broken lines).
4.1.1 The mean spot speed The result of the mean spot speed obtained on the three arms of the round-a-bout during the field survey is presented in table 3 and in Fig. 3.
Table 3: Summary of the mean spot speed obtainable at the road intersection (2010).
Corridor
Mean Spot Speed (km/h)
Day 1 Day 2 Day 3
In Out In Out In Out
Lagos Road 3.9 6.15 3.31 5.66 3.23 5.62
Sagamu Road 3.93 10.71 3.78 11.12 3.91 10.92
Ayangburen Road
4.17 4.41 4.57 3.86 4.48 3.58
In the analysis of the percentage of vehicles stopped for instance, the Lagos arm has 71.6% in the morning, 56% in the afternoon and 41.1% in the evening in one of the days. The Sagamu arm has 74.4% in the morning, 59.8% in the afternoon and 51.85 in the evening. While the Ayanghuren arm has 87.8% in the morning, 72.2% in the afternoon and 67.2% in the evening.
www.witpress.com, ISSN 1743-3509 (on-line) WIT Transactions on The Built Environment, Vol 116, © 2011 WIT Press
Urban Transport XVII 175

Figure 3: Mean spot speed (inbound and outbound) of Oga road intersection (2010).
4.1.1.1 Analysis of Level of Service (LOS) To determine the Level of Service for those intersections, the delay values computed was correlated with the recommended standards, the level of service obtainable at Oga road intersection falls between B and E levels at every point in time. For instance, the LOS for Lagos Road arm is ‘D’ between 9.30am-10am. While the LOS of Sagamu Road is ‘C’ especially between 8.30am-9am, and that of Ayangburen Road is ‘B’ between 9.00am-9.30am. The LOS at evening for the three arms dropped to between ‘E’ and ‘D’ for Logos and Sagamu respectively as from 6.30pm to 7.00pm. See table 4 and 5 for Levels of Service classification.
Table 4: Intersections level of service classification.
Level of Service
Average Total Delay Per Vehicle (Sec/Veh)
A <5 B ≥5 and ≤10 C ≥10 and ≤20 D ≥20 and ≤30 E ≥30 and ≤45 F ≥45
Source: Highway Capacity Manual.
The level of service on Lagos axis remains the most critical with the LOS as poor as ‘D’ both in the morning and afternoon, and it becomes worsen in the evening with LOS at E.
www.witpress.com, ISSN 1743-3509 (on-line) WIT Transactions on The Built Environment, Vol 116, © 2011 WIT Press
176 Urban Transport XVII

Table 5: Relationship between the average delay and the level of service (LOS).
Intersection Approach Period Stopped delay
per vehicle
Level of service
Oga Junction
Lagos Road Morning
21.6 D Sagamu Road 12.1 C Ayangburen R 9.8 B Lagos Road
Afternoon 28.8 D
Sagamu Road 14.8 C Ayangburen R 15.9 C Lagos Road
Evening 36.4 E
Sagamu Road 30.8 E Ayangburen R 25.7 D
Source: Field Survey, (2010).
5 Conclusion
Oga Road intersection is the focal point of Ikorodu Local Government Area of Lagos State where Lagos, Sagamu and Ayanghuren trunk-A roads intersect. The intersection lack functional traffic signalling and right of way clearance that is not unconnected to the mixed land uses in that environment. Pedestrian activities, road hawkers and illegal vehicular loading and offloading at the junction coupled with an influx of commercial motorcycle are the major setback to the level of service in that roadway portion. These and many more make the traffic scenario at that junction chaotic and frustrating.
6 Recommendation
In order to ameliorate the poor level of service at the Oga road junction, and in any other city centre with similar traffic problem, the following recommendations must be adhered to for better urban mobility.
i. The first and most effective is to relocate Ayangburen Market and the garages located within the area as this would remove most of the human traffic and on-street parking around the intersection.
ii. The intersection should be redesign to have adequate flaring and Islands. Also there is the need to introduce Automated Traffic Control signalling precisely volume-density traffic signal.
iii. Relocation of all the activities that have encroached on the right of way at least 100m along each of the arms of the intersection so as to enhance the carriageway capacity and also creating an enabling environment for the enforcement of the existing bylaws against street trading and the likes.
www.witpress.com, ISSN 1743-3509 (on-line) WIT Transactions on The Built Environment, Vol 116, © 2011 WIT Press
Urban Transport XVII 177

iv. There is need for the construction of an alternative route on the Lagos road (inbound) that would link up that Lagos road and Ayangburen road, thereby reducing the traffic volume approaching the road intersection on the Lagos road especially at the peak periods.
v. Traffic management in the form of traffic redistribution is the most cost effective to new constructions especially within developed urban centres with scarce land. Inbound traffic from Lagos to Ayanghuren area can be diverted away from Oga Junction to Olowoshaga and Adeyeri street and improve their capacity.
References
[1] Adeyemo, A.M., An appraisal of motorcycle as a commercial passenger mode in Port Harcourt Metropolis. Journal of Transport Studies, Vol. 2, No. 1, pp 76, 1998.
[2] Badejo, D. Maritime Transport in Nigeria Economy, Rex Charles Publishers Ibadan, Pp 2,1999.
[3] Arosanyin, G.T., Determination of Transport output in Nigeria. Journal of Transport Studies, Vol. 2, No 1, pp 69., 1998
[4] Akintayo S. B., Transport Economics Applied to All Modes, Policy Issues and Logistics Management. Ilagun Press, Zaria, pp 3-8, 2010.
[5] Ogunsanya A. A., Analysis of Nigerian Government Policy on Urban Transportation. Pub. by Nigerian Institute of Transport Technology (INTT), Zaia, pp2003-223, 2004.
[6] Eno , O. (2006). Urban Transportation Planning and Modelling. Akure, Millennium Publishers, 2006.
[7] Bamford C. G., Transport Economic, 4th Edition, Heiemann Pub. Harlow, Essex, CM20 2JE.2006.
[8] FHDM (2006). Federal Highway Design Manual, Ministry of Works.
www.witpress.com, ISSN 1743-3509 (on-line) WIT Transactions on The Built Environment, Vol 116, © 2011 WIT Press
178 Urban Transport XVII