
Performance Analysis Of Multilevel Heliostat Field...
10
Turkish Journal of Science & Technology Volume 11 (2), 11-20, 2016 Performance Analysis Of Multilevel Heliostat Field Layout Ra'ad K Mohammed Aldulaimi 1,2* and Mehmet Sait Söylemez 1 1 Department of Mechanical Engineering, University of Gaziantep, 27310 Gaziantep, Turkey 2 University of Baghdad, Baghdad, Iraq * [email protected] (Received: 10.03.2016; Accepted: 17.06.2016) Abstract A novel heliostat field layout is suggested by dividing specified heliostats located farthest from the tower and exhibiting low optical efficiency into strips and increasing the height for these strips with varying heights, based on the consideration of no blocking. A novel geometrical equation is presented for this purpose, and the results indicate an increase in the total annual efficiency of the field. The proposed layout is implemented on an optimized heliostat field consisting of 2650 SENER heliostats, based on the data obtained using Gemasolar in Seville, Spain, which is used as a reference in this work. Each heliostat position is specified using an optimization algorithm that refines previously proposed models, and two parameters are added to this model to further optimize the heliostat layout. Keywords: Solar Power Tower Plant, Multilevel Layout, Simulation, Heliostat Field. Değişken Seviyeli Heliostat Uygulamalı Güneş Tarlalarının Performans Değerlendirmesi Özet Güneş tarlalarında optik verimliliği temelde helyostatlardaki gölgelemeleri engelleyerek arttırmak amacıyla, kademeli değişken yükseklik uygulamasının etkisi araştırılmış ve düşük optik verimlilik değerlerinin düzeldiği görülmüştür. Bu amaçla, geliştirilen bir geometrik denklem sunulmuş ve sonuçlarda güneş tarlasında yıllık verimin arttığı hesaplanmıştır. Önceden optimize edilmiş 2650 helyostatlı SENER güneş tarlası için öner ilen yöntem kullanılarak, İspanyanın Sevilla şehrinde bulunan Gemasolar helyostat sistemi için alınan sonuçlar önceki değerlerle karşılaştırılmak suretiyle mukayeseli olarak kontrol edilerek doğrulanmıştır. Her bir helyostat pozisyonu için optimizasyon algoritması tanımlanarak önceki modellemelerin önüne geçen ve iki yeni parametreyi de ekleyerek helyostat yerleştirilmesini optimize eden bir yeni model önerilmiştir. Anahtar Kelimeler: Güneş Enerjili Güç Üretimi, Değişken Seviyeli Helyostat Yerleşimi, Modelleme, Heliostat Tarlası 1. Introduction Solar power tower plants (SPTPs) offer a unique method for achieving highly focused solar radiation on a large scale for electrical power generation, among other applications [1]. SPTPs use several hundred or even thousands of reflectors, called heliostats, as intermediate optical devices between the sun’s rays and the energy absorbing device. The heliostats are set around a receiver that follows the sun, and the reflection of the light further focuses it up to 1000 times to a central receiver placed at the central point on the top of a high tower. A computer controls each heliostat’s rotation around two axes to ensure continually correct directing, with a tracking error of less than a fraction of a degree. The ideal layout of the heliostat field is of primary importance and the topic of many studies, mainly because the heliostat approach accounts for 50% of the full price of the scheme, and the annual energy loss is approximately 47% [2]. Several codes have been produced for this purpose dating from the 1970s, and most of those codes are presented in [3]. For the most part, the most recent codes [4–7] identify various forms of access to increase the global optical efficiency . On the other hand, because any SPTP optimization operation should depend on the annual energy estimation of each different layout, the insolation-weighted mean yearly
Transcript of Performance Analysis Of Multilevel Heliostat Field...

Turkish Journal of Science & Technology
Volume 11 (2), 11-20, 2016
Performance Analysis Of Multilevel Heliostat Field Layout
Ra'ad K Mohammed Aldulaimi1,2*
and Mehmet Sait Söylemez1
1Department of Mechanical Engineering, University of Gaziantep, 27310 Gaziantep, Turkey
2 University of Baghdad, Baghdad, Iraq
(Received: 10.03.2016; Accepted: 17.06.2016)
Abstract
A novel heliostat field layout is suggested by dividing specified heliostats located farthest from the tower and
exhibiting low optical efficiency into strips and increasing the height for these strips with varying heights, based
on the consideration of no blocking. A novel geometrical equation is presented for this purpose, and the results
indicate an increase in the total annual efficiency of the field. The proposed layout is implemented on an
optimized heliostat field consisting of 2650 SENER heliostats, based on the data obtained using Gemasolar in
Seville, Spain, which is used as a reference in this work. Each heliostat position is specified using an
optimization algorithm that refines previously proposed models, and two parameters are added to this model to
further optimize the heliostat layout.
Keywords: Solar Power Tower Plant, Multilevel Layout, Simulation, Heliostat Field.
Değişken Seviyeli Heliostat Uygulamalı Güneş Tarlalarının Performans Değerlendirmesi
Özet
Güneş tarlalarında optik verimliliği temelde helyostatlardaki gölgelemeleri engelleyerek arttırmak amacıyla,
kademeli değişken yükseklik uygulamasının etkisi araştırılmış ve düşük optik verimlilik değerlerinin düzeldiği
görülmüştür. Bu amaçla, geliştirilen bir geometrik denklem sunulmuş ve sonuçlarda güneş tarlasında yıllık
verimin arttığı hesaplanmıştır. Önceden optimize edilmiş 2650 helyostatlı SENER güneş tarlası için önerilen
yöntem kullanılarak, İspanyanın Sevilla şehrinde bulunan Gemasolar helyostat sistemi için alınan sonuçlar
önceki değerlerle karşılaştırılmak suretiyle mukayeseli olarak kontrol edilerek doğrulanmıştır. Her bir helyostat
pozisyonu için optimizasyon algoritması tanımlanarak önceki modellemelerin önüne geçen ve iki yeni
parametreyi de ekleyerek helyostat yerleştirilmesini optimize eden bir yeni model önerilmiştir.
Anahtar Kelimeler: Güneş Enerjili Güç Üretimi, Değişken Seviyeli Helyostat Yerleşimi, Modelleme, Heliostat Tarlası
1. Introduction
Solar power tower plants (SPTPs) offer a
unique method for achieving highly focused
solar radiation on a large scale for electrical
power generation, among other applications [1].
SPTPs use several hundred or even thousands of
reflectors, called heliostats, as intermediate
optical devices between the sun’s rays and the
energy absorbing device. The heliostats are set
around a receiver that follows the sun, and the
reflection of the light further focuses it up to
1000 times to a central receiver placed at the
central point on the top of a high tower. A
computer controls each heliostat’s rotation
around two axes to ensure continually correct
directing, with a tracking error of less than a
fraction of a degree.
The ideal layout of the heliostat field is of
primary importance and the topic of many
studies, mainly because the heliostat approach
accounts for 50% of the full price of the scheme,
and the annual energy loss is approximately 47%
[2]. Several codes have been produced for this
purpose dating from the 1970s, and most of
those codes are presented in [3]. For the most
part, the most recent codes [4–7] identify various
forms of access to increase the global optical
efficiency . On the other hand, because any SPTP
optimization operation should depend on the
annual energy estimation of each different
layout, the insolation-weighted mean yearly

Performance Analysis Of Multilevel Heliostat Field Layout
12
heliostat field efficiency ( ) was
calculated in [4], using Eq. (1):
∑ ∫
∑ ∫
and for a compromise between CPU time and
resolution, specify the 21st of each month during
the year (average day), and carry out over all
days the same function with all computations
that are related to the other parameters of optical
efficiency [6].
The annual energy is the integrated sum of
the instantaneous energy transformed by all
heliostats over time [8]. The positioning of the
heliostats around the tower is a critical factor
because the amount of energy collected at the
receiver, for a given position of the sun, is a
function of the position and form of the
heliostats. Therefore, several papers have
suggested changing the level of heliostat
positions.
For instance, in [1], the authors derived a
graphical method to plan a radially staggered
solar field layout, limited by the consideration
that no blocking losses would be sustained over
the year. This method distributed heliostats in the
field by specifying the placement of each one
along an inclined plane, assuring that
neighboring mirrors block none of the energy
reflected by any given heliostat. Further limiting
this study, the inclination of the ground of
heliostat field was considered to cover the entire
field area. This results in an inefficient and
expensive process because the efficiency factor
balance may be negatively affected, for instance,
with shadow losses. Nonetheless, this method is
suitable for preliminary heliostat field designs.
In [9], a Fortran computer program is the
implemented to investigate square, circular, or
mixed heliostats in the solar field layout. This
discretization method computed shadowing and
blocking losses, and compared the optical
performances of different solar fields, including
comparisons between flat and inclined grounds,
assuming an inclined ground with a slope of
in the northern quadrant. This study showed that
the inclined ground inhibits the increase of
shadow losses with respect to the ground.
Most studies are based on an inclined
ground with a fixed slope for all heliostats, and
therefore low-level heliostats could be shaded by
higher-level heliostats. Therefore, this study first
develops the model presented in [1] and
implements the layout presented in [4], which
was shown to have greater overall efficiency by
considerably reducing the requisite land area
relative to the radially staggered layout. Second,
this study investigates changing heliostat levels
with no blocking consideration, but with variable
slope, starting with the heliostat located farthest
from the tower’s central receiver because it has
higher optical losses than the closer heliostats.
2. Simulation Tools
2.1. Instantaneous optical efficiency factors
The factors of optical efficiency, which
presented energy losses associated with the
heliostat field, given by Eq. (2):
in which represents the reflectivity of the
heliostats, and represents the cosine of the
incidence angle between the sun rays and the
heliostat normal , Represents the
atmospheric attenuation efficiency, which
accounts for radiation losses in the distance between a heliostat and the receiver, which can
be estimated by Eqs. (3) and (4) as presented in
[4,5]:
represents the interception efficiency,
which related to Energy directed to the receiver
that does not fall on the absorbing area, because
of, the reflector surface accuracy, beam spread,
mirror canting accuracy, and tracking accuracy
all have a major effect on the flux distribution at
the receiver, etc. An analytical flux density
model or The HFLCAL model presented in
[5,10,11], that simple and accurate tools applied
to estimate the in this study.The HFLCAL
model integrated the flux distribution along an
absorbing surface of the receiver to get the

Ra'ad K Mohammed Aldulaimi, Mehmet Sait Söylemez
13
intercepted power at a certain point in time,
given by Eq. (5)
∫ ∫
(
)
The coordinates and related to the
vertical plane of the receiver, and is the
total dispersion of the flux distribution and is
expressed by Eq. (6)
√ (
)
√
Where, ( )namely sun
shape error, Beam quality, the astigmatic effect,
the tracking error, respectivly, and is
the incidence cosine of the reflected central ray
from the heliostat on the receiver surface (a
vertical plane).Further details about HFLCAL
functions and constants value can be found in
Refs.[5].
represents the shading and blocking
efficiency. Shading often takes place when a
heliostat shaded from the sunlight by an
adjoining heliostat or a tower, and similarly
blocking occurs if a heliostat block the sun rays
reflected from an adjoining to the receiver, In
this paper, the central ray tracing and
discretization technique, which presented in [4],
was adapted to calculate the with small
subdivisions and high accuracy.
2.2 Solar radiation
The annual energy from the receiver is the
sum of the instantaneous energies produced by
the heliostat field. After transforming the solar
radiation along time increments sampled from
the American Society of Heating, Refrigeration,
and Air-conditioning Engineers (ASHRAE)
Clear-sky Radiation Model [12], and utilizing
two monthly factors and the relative air
mass , which can be estimated by Eq. (7):
Where represents the solar altitude
angle and is expressed in degrees. The beam
normal radiation is given by Eq. (8):
[ ] ⁄
in which the beam’s air mass exponents are
given by Eq. (9):
and is the extraterrestrial normal irradiance
accumulated following Eq. (10):
( (
))
⁄
In Eq. (10), is equal to 1366.1 W/m2,
is the day number, and and represent the
apparent beam and diffusion optical depths,
which are site specific and change during the
year. For Seville, Spain, and other cities that
study SPTP technology, these last parameters are
given in [12] for each city on the 21st day of each
month.
2.3 Heliostat and receiver specifications
Gemasolar, an SPTP in Seville, Spain, is the
plant used as a reference in this work. The
complete dimensions of the SENER heliostats
utilized in Gemasolar are presented in [5, 13,
14]; the field parameters used in this study are
presented in Table 1.
Performance Analysis Of Multilevel Heliostat Field Layout
14
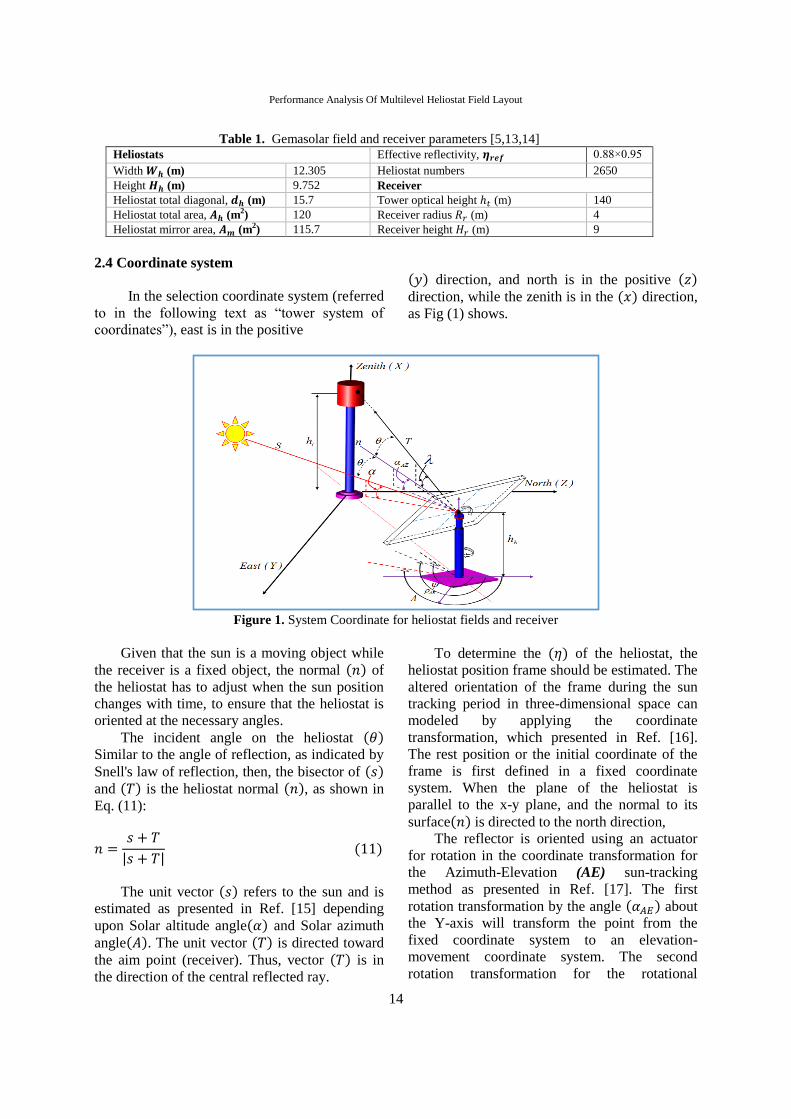
Table 1. Gemasolar field and receiver parameters [5,13,14]
Heliostats Effective reflectivity, 0.88×0.95
Width (m) 12.305 Heliostat numbers 2650
Height (m) 9.752 Receiver
Heliostat total diagonal, (m) 15.7 Tower optical height (m) 140
Heliostat total area, (m2) 120 Receiver radius (m) 4
Heliostat mirror area, (m2) 115.7 Receiver height (m) 9
2.4 Coordinate system
In the selection coordinate system (referred
to in the following text as “tower system of
coordinates”), east is in the positive
direction, and north is in the positive direction, while the zenith is in the direction,
as Fig (1) shows.
Figure 1. System Coordinate for heliostat fields and receiver
Given that the sun is a moving object while
the receiver is a fixed object, the normal of
the heliostat has to adjust when the sun position
changes with time, to ensure that the heliostat is
oriented at the necessary angles.
The incident angle on the heliostat Similar to the angle of reflection, as indicated by
Snell's law of reflection, then, the bisector of and is the heliostat normal , as shown in
Eq. (11):
| |
The unit vector refers to the sun and is
estimated as presented in Ref. [15] depending
upon Solar altitude angle and Solar azimuth
angle . The unit vector is directed toward
the aim point (receiver). Thus, vector is in
the direction of the central reflected ray.
To determine the of the heliostat, the
heliostat position frame should be estimated. The
altered orientation of the frame during the sun
tracking period in three-dimensional space can
modeled by applying the coordinate
transformation, which presented in Ref. [16].
The rest position or the initial coordinate of the
frame is first defined in a fixed coordinate
system. When the plane of the heliostat is
parallel to the x-y plane, and the normal to its
surface is directed to the north direction,
The reflector is oriented using an actuator
for rotation in the coordinate transformation for
the Azimuth-Elevation (AE) sun-tracking
method as presented in Ref. [17]. The first
rotation transformation by the angle about
the Y-axis will transform the point from the
fixed coordinate system to an elevation-
movement coordinate system. The second
rotation transformation for the rotational

Ra'ad K Mohammed Aldulaimi, Mehmet Sait Söylemez
15
movement by the angle about the X-axis
will transform the point of the elevation-
movement coordinate system to the azimuth-
movement coordinate system.
3. Mathematical Model for Multilevel
Heliostat Field Layout
The positioning of the heliostats around the
tower is an essential step that depends on many
factors. On the other hand, the annual optıcal
efficiency is considered to be the main factor for
evaluating different field layouts. The procedure
for estimating new heliostat elevations in a field
layout with gradually varying successive
heliostat levels is summarized in the following
steps.
First, the layout of the heliostat field and the
position for each heliostat, is defined based on
the model presented in [4], which was inspired
by the spiral patterns of the phyllotaxis disc. This
layout was shown to increase overall efficiency
and is expressed by Eqs. (12) and (13) as
presented in [4] :
Where represents the polar position angle
for heliostats in the field, represents the
radial position of the heliostat, and and
represent field layout design variables. From
Eqs. (12) and (13), evaluations of the different
layouts are verified by forming various layout
distributions with adjustments to the and
parameters, using an optimization algorithm to
estimate the best and values. The limits of
are assumed to be [2, 8] and [0.4, 0.7],
respectively. A feature of the created heliostat
field that is larger than the heliostat number for
the necessary range uses Eqs. (12) and (13).
Therefore, this study started with 5000 heliostats,
with the objective of restricting the field to
determine the optimal layout of 2650 heliostats.
The field size was selected to include 2650
heliostats, for comparison with the case study
model. The distance between the heliostat and its
neighbors is the main condition that must be
specified before optimizing the field, to prevent
overlap from occurring among the close circles
in which the heliostats move. Therefore, a
program was written such that layouts that lead
to interference between the circle movements for
the heliostats were not considered. Furthermore,
the diagonal of the total reflector area equals
15.7 m for SENER heliostats (see Table 1) and
the proposed code does not consider any extra
separation distance (dsep = 0).
In this study, a genetic algorithm (GA) is
used to implement the necessary optimization
duty because GA is one of the most efficient
optimization methods. Successive random values
of the design variables are inputted until the
highest value of is recorded; in this
case, the and parameters were 3.55 and
0.675, respectively, corresponding to a layout
with 2650 heliostats.
These results based on the specified
and parameters compare with other values of
the same parameters for other studies [4] and [6]
which used the same heliostat dimensions and
layout, and the results show the higher
performance than others with new values of
parameters.
The second comparison is targeted by
computing the value of the field efficiency in
GEMASOLAR with modeling results of Ref.
[5], depending on the same reference data, and
considering the same model of solar radiation,
where the values of solar radiation of the Ref. [5]
started from ( ) of sun elevations over
horizontal. Even more than( ), some values
range from( ), and end at noon, and shorthand
all year by 35 steps at a time. The comparison
shows that the result (57.3693%) are very close
to the published data of Ref. [5], which equal
(57.232%).
In the process of estimating the annual
efficiency, several conditions become apparent:
that the farthest heliostat from a tower has less
optical efficiency, and heliostats closer to the
tower and to the north exhibit higher cosine
effect efficiency.
From these conditions, a new rear heliostat
field arrangement is derived, arranging heliostats
at different levels, such that no blocking losses
occur throughout the year, with implementing
the same layout model. To enhance the
performance of these heliostats, the heliostats
height is increased for selected heliostats located
Performance Analysis Of Multilevel Heliostat Field Layout
16
at the edge of the field layout, which exhibit the
lowest optical efficiency. This arrangement can
be formulated mathematically from purely
geometrical considerations.
The farthest heliostat in the layout, which
experiences the highest blocking losses, is
considered as a reference to delineate heliostat
strips. In addition, the numbers and radii of
successive heliostats are specified in relation to
this reference heliostat farthest from the tower;
successive heliostats are located in the same
spiral line as the reference heliostat.
The successive heliostats are numbered for
reference, considering the farthest heliostat as
number one, and then heliostats that have a
radius value between one and two are identified.
This group represents the first strip. The same
operation is conducted to identify subsequent
strips.
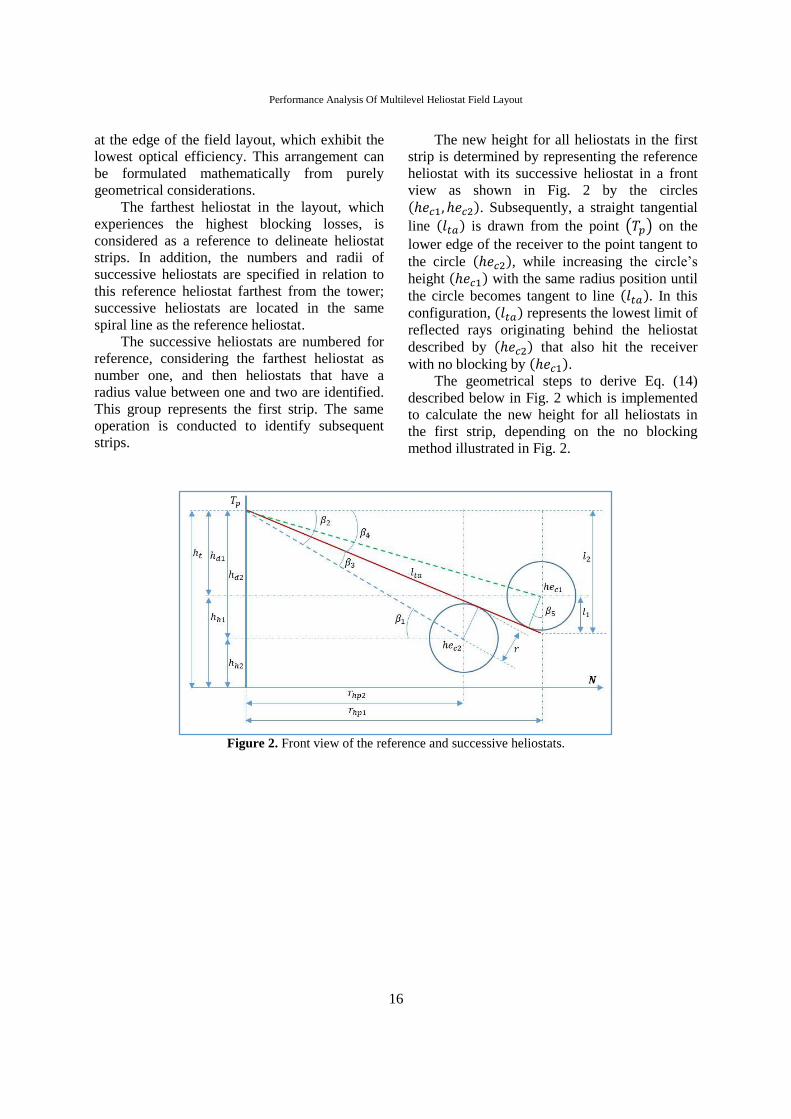
The new height for all heliostats in the first
strip is determined by representing the reference
heliostat with its successive heliostat in a front
view as shown in Fig. 2 by the circles
. Subsequently, a straight tangential
line is drawn from the point ( ) on the
lower edge of the receiver to the point tangent to
the circle , while increasing the circle’s
height with the same radius position until
the circle becomes tangent to line . In this
configuration, represents the lowest limit of
reflected rays originating behind the heliostat
described by that also hit the receiver
with no blocking by . The geometrical steps to derive Eq. (14)
described below in Fig. 2 which is implemented
to calculate the new height for all heliostats in
the first strip, depending on the no blocking
method illustrated in Fig. 2.
Figure 2. Front view of the reference and successive heliostats.
Ra'ad K Mohammed Aldulaimi, Mehmet Sait Söylemez
17
(
(
(
(
)
(
√
)
)
)
(
(
(
)
(
√
)
)
)
)
Where, ⁄ and,
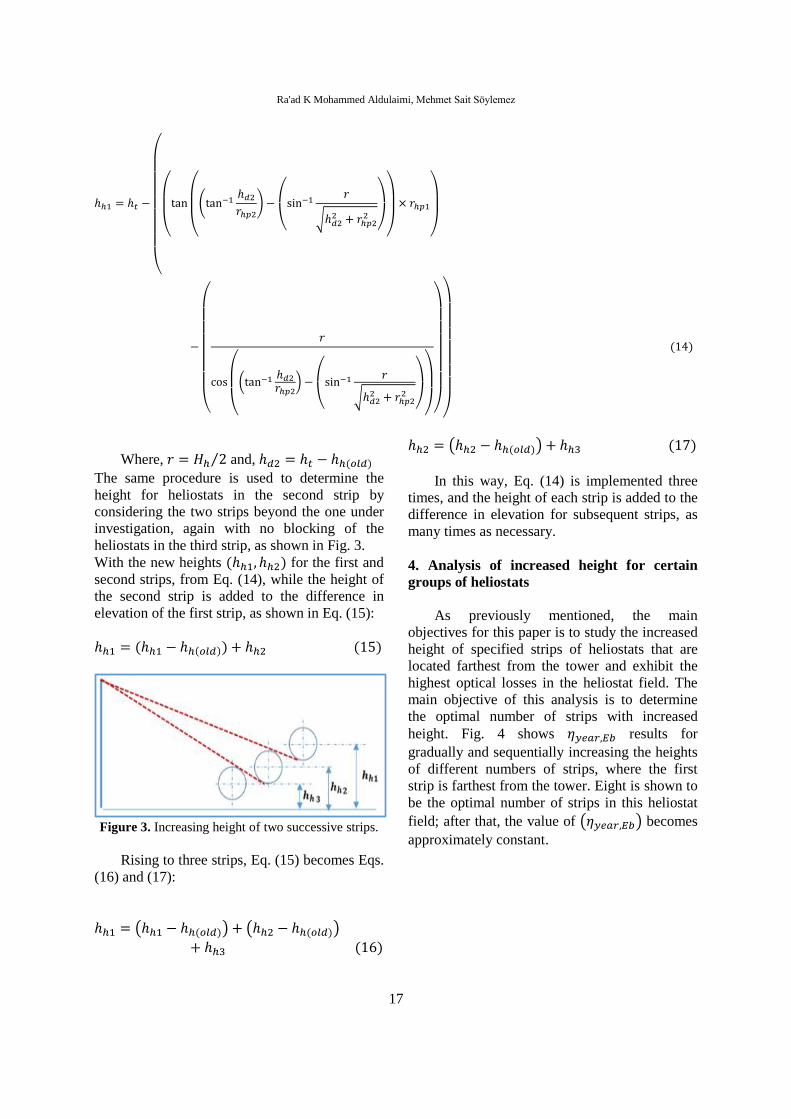
The same procedure is used to determine the
height for heliostats in the second strip by
considering the two strips beyond the one under
investigation, again with no blocking of the
heliostats in the third strip, as shown in Fig. 3.
With the new heights for the first and
second strips, from Eq. (14), while the height of
the second strip is added to the difference in
elevation of the first strip, as shown in Eq. (15):
Figure 3. Increasing height of two successive strips.
Rising to three strips, Eq. (15) becomes Eqs.
(16) and (17):
( ) ( )
( )
In this way, Eq. (14) is implemented three
times, and the height of each strip is added to the
difference in elevation for subsequent strips, as
many times as necessary.
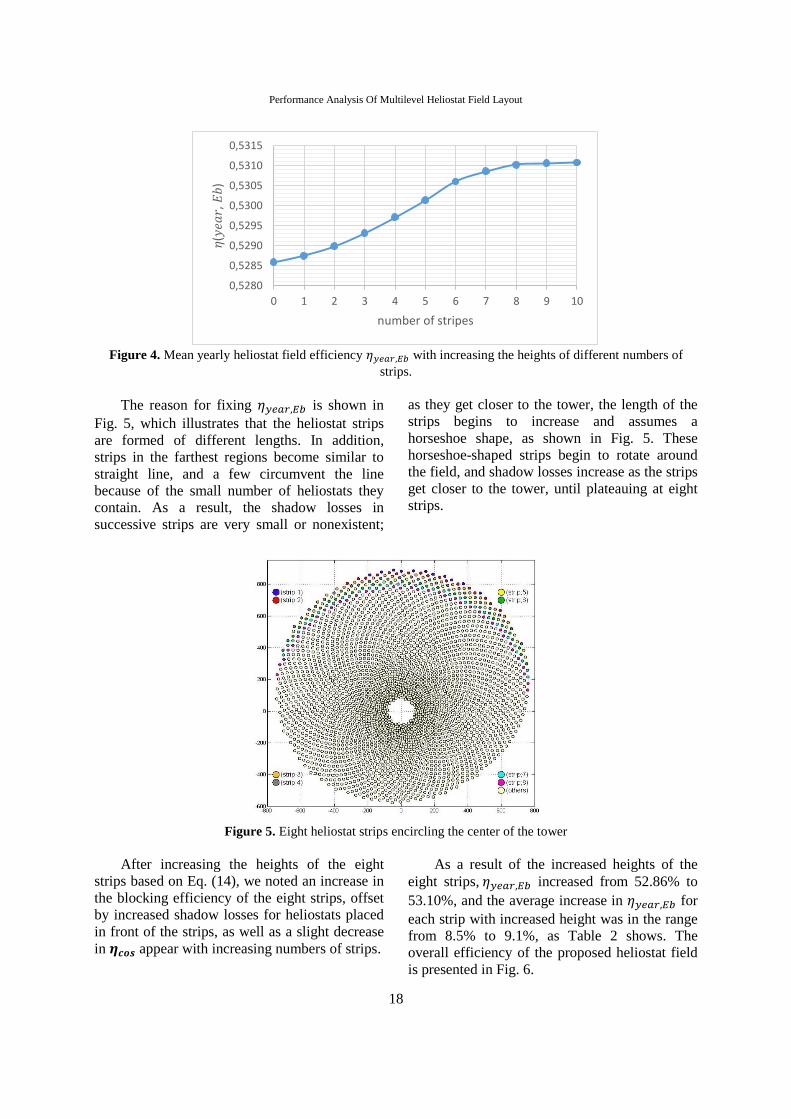
4. Analysis of increased height for certain
groups of heliostats
As previously mentioned, the main
objectives for this paper is to study the increased
height of specified strips of heliostats that are
located farthest from the tower and exhibit the
highest optical losses in the heliostat field. The
main objective of this analysis is to determine
the optimal number of strips with increased
height. Fig. 4 shows results for
gradually and sequentially increasing the heights
of different numbers of strips, where the first
strip is farthest from the tower. Eight is shown to
be the optimal number of strips in this heliostat
field; after that, the value of ( ) becomes
approximately constant.
Performance Analysis Of Multilevel Heliostat Field Layout
18
Figure 4. Mean yearly heliostat field efficiency with increasing the heights of different numbers of
strips.
The reason for fixing is shown in
Fig. 5, which illustrates that the heliostat strips
are formed of different lengths. In addition,
strips in the farthest regions become similar to
straight line, and a few circumvent the line
because of the small number of heliostats they
contain. As a result, the shadow losses in
successive strips are very small or nonexistent;
as they get closer to the tower, the length of the
strips begins to increase and assumes a
horseshoe shape, as shown in Fig. 5. These
horseshoe-shaped strips begin to rotate around
the field, and shadow losses increase as the strips
get closer to the tower, until plateauing at eight
strips.
Figure 5. Eight heliostat strips encircling the center of the tower
After increasing the heights of the eight
strips based on Eq. (14), we noted an increase in
the blocking efficiency of the eight strips, offset
by increased shadow losses for heliostats placed
in front of the strips, as well as a slight decrease
in appear with increasing numbers of strips.
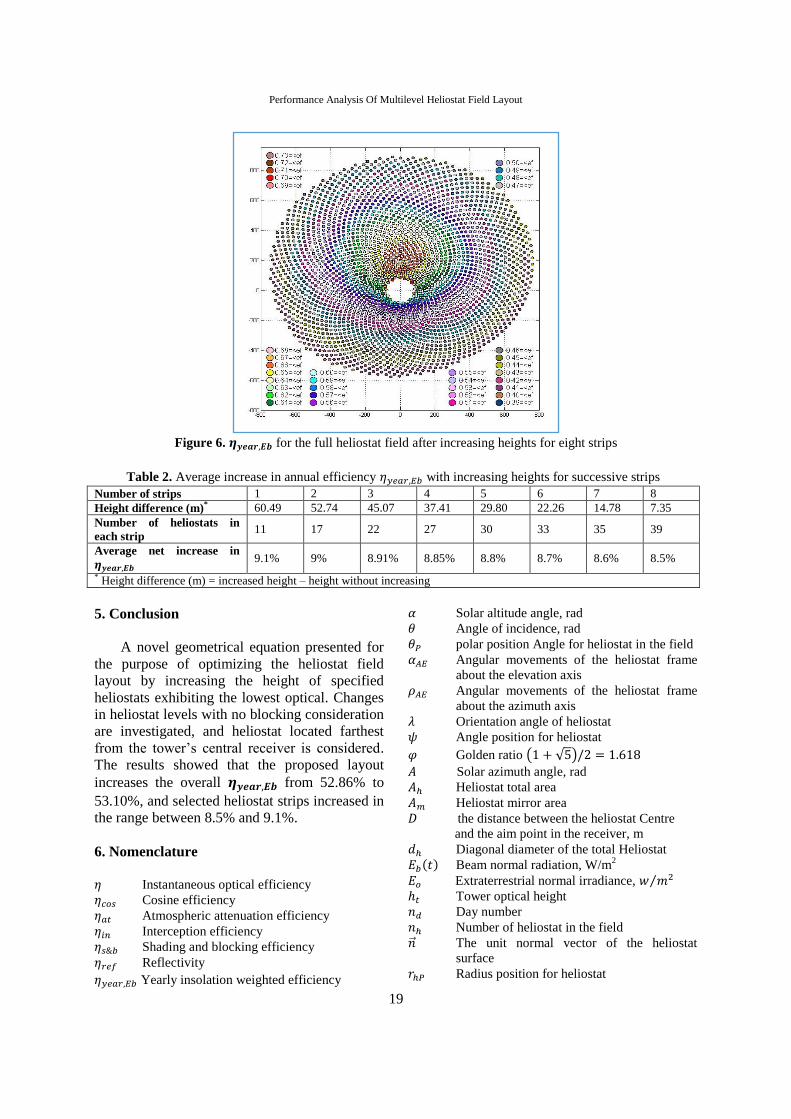
As a result of the increased heights of the
eight strips, increased from 52.86% to
53.10%, and the average increase in for
each strip with increased height was in the range
from 8.5% to 9.1%, as Table 2 shows. The
overall efficiency of the proposed heliostat field
is presented in Fig. 6.
0,5280
0,5285
0,5290
0,5295
0,5300
0,5305
0,5310
0,5315
0 1 2 3 4 5 6 7 8 9 10
𝜂(𝑦𝑒𝑎𝑟,
𝐸𝑏
)
number of stripes
Performance Analysis Of Multilevel Heliostat Field Layout
19
Figure 6. for the full heliostat field after increasing heights for eight strips
Table 2. Average increase in annual efficiency with increasing heights for successive strips
Number of strips 1 2 3 4 5 6 7 8
Height difference (m)* 60.49 52.74 45.07 37.41 29.80 22.26 14.78 7.35
Number of heliostats in
each strip 11 17 22 27 30 33 35 39
Average net increase in
9.1% 9% 8.91% 8.85% 8.8% 8.7% 8.6% 8.5%
* Height difference (m) = increased height – height without increasing
5. Conclusion
A novel geometrical equation presented for
the purpose of optimizing the heliostat field
layout by increasing the height of specified
heliostats exhibiting the lowest optical. Changes
in heliostat levels with no blocking consideration
are investigated, and heliostat located farthest
from the tower’s central receiver is considered.
The results showed that the proposed layout
increases the overall from 52.86% to
53.10%, and selected heliostat strips increased in
the range between 8.5% and 9.1%.
6. Nomenclature
Instantaneous optical efficiency
Cosine efficiency
Atmospheric attenuation efficiency
Interception efficiency
Shading and blocking efficiency
Reflectivity
Yearly insolation weighted efficiency
Solar altitude angle, rad
Angle of incidence, rad
polar position Angle for heliostat in the field
Angular movements of the heliostat frame
about the elevation axis
Angular movements of the heliostat frame
about the azimuth axis
Orientation angle of heliostat
Angle position for heliostat
Golden ratio ( √ )
Solar azimuth angle, rad
Heliostat total area
Heliostat mirror area
the distance between the heliostat Centre
and the aim point in the receiver, m
Diagonal diameter of the total Heliostat
Beam normal radiation, W/m2
Extraterrestrial normal irradiance, ⁄
Tower optical height
Day number
Number of heliostat in the field
The unit normal vector of the heliostat
surface
Radius position for heliostat

Performance Analysis Of Multilevel Heliostat Field Layout
20
The unit vector from the center of the
heliostat pointing to the sun
The unit vector from the center of the
heliostat pointing to the tower
Width & Height of the heliostat
Height & radius of the Receiver height
7. References
1. F.M.F. Siala, M.E. Elayeb, Mathematical
formulation of a graphical method for a no-blocking
heliostat field layout, Renewable Energy 23 (2001)
77–92.
2. X. Wei, Z. Lu, W. Yu, Z. Wang, A new code for
the design and analysis of the heliostat field layout for
power tower system, Sol. Energy 84 (2010) 685–690.
3. P. Garcia, A. Ferriere, J.-J. Bezian, Codes for solar
flux calculation dedicated to central receiver system
applications: a comparative review, Sol. Energy 82
(2008) 189–197.
4. C.J. Noone, M. Torrilhon, A. Mitsos, Heliostat
field optimization: a new computationally efficient
model and biomimetic layout, Sol. Energy 86 (2012)
792–803.
5. F.J. Collado, J. Guallar, A review of optimized
design layouts for solar power tower plants with
campo code, Renewable Sustainable Energy Rev. 20
(2013) 142–154.
6. S.M. Besarati, D.Y. Goswami, A computationally
efficient method for the design of the heliostat field
for solar power tower plant, Renewable Energy 69
(2014) 226–232.
7. M. Chiesi, L. Vanzolini, E.F. Scarselli, R.
Guerrieri, Accurate optical model for design and
analysis of solar fields based on heterogeneous
multicore systems, Renewable Energy 55 (2013) 241–
251.
8. F.J. Collado, J. Guallar, Campo: generation of
regular heliostat fields, Renewable Energy 46 (2012)
49–59.
9. E. Leonardi, B. D’Aguanno, CRS4-2: a numerical
code for the calculation of the solar power collected
in a central receiver system, Energy 36 (2011) 4828–
4837.
10. M. Schmitz, P. Schwarzbozl, R. Buck, R. Pitz-
Paal. Assessment of the potential improvement due to
multiple apertures in central receiver systems with
secondary concentrators. Solar Energy 80 (2006)
111–120.
11. F. J. Collado, One-point fitting of the flux density
produced by a heliostat. Solar Energy 84 (2010) 673–684
12. American Society of Heating, Refrigerating, and
Air-Conditioning Engineers (ASHRAE), 2013
ASHRAE Handbook - Fundamentals (SI); Climatic
Design Information, ASHRAE, Georgia, USA, 2013.
13. J.I. Burgaleta, S. Arias, D. Ramirez,
GEMASOLAR: the first tower thermo-solar
commercial plant with molten salt storage, Proceed.
SolarPACES (2011).
14. C.A. Amadei, G. Allesina, P. Tartarini, W.
Yuting, Simulation of GEMASOLAR-based solar
tower plants for the Chinese energy market: influence
of plant downsizing and location change, Renewable
Energy 55 (2013) 366–373.
15. Duffie JA, Beckman WA. Solar engineering of
thermal processes. New York: Wiley; 1991.
16. W. B. Stine, R. W. Harrigon, Solar Energy
Fundamentals and Design with Computer
Application. New York: Wiley; 1985
17. K.K. Chong, M.H. Tan, Range of motion study
for two different sun-tracking methods in the
application of heliostat field; Solar Energy 85 (2011)
1837–1850.


![Tek-Fazlı Asenkron Motorların Dolaylı Rotor Alan ...fbe.firat.edu.tr/sites/fbe.firat.edu.tr/files/237-245.pdfasenkron motorlar için vektör denetimi; rotor akı denetimi [9,11,12,13],](https://static.fdocuments.net/doc/165x107/60aefd61041fe437486b4f03/tek-fazl-asenkron-motorlarn-dolayl-rotor-alan-fbefiratedutrsitesfbefiratedutrfiles237-245pdf.jpg)


![Proxima Systems Heliostat [ES]](https://static.fdocuments.net/doc/165x107/589f05191a28ab06368b6eeb/proxima-systems-heliostat-es.jpg)


![Limon Kabuğundan Elde Edilen Selüloz ve Karboksimetil ...fbe.firat.edu.tr/sites/fbe.firat.edu.tr/files/119-133.pdf · amacıyla nem, kül, protein ve yağ tayini yapıldı [21].](https://static.fdocuments.net/doc/165x107/5e44e6089408b56b4217281d/limon-kabuundan-elde-edilen-selloz-ve-karboksimetil-fbefiratedutrsitesfbefiratedutrfiles119-133pdf.jpg)