Performance Analysis for Colleges of Education · Performance Analysis for Colleges of Education...
78
Performance Analysis for Colleges of Education Center for Research, Evaluation and Advancement of Teacher Education www.createtx.org Angelo State University PZPI: 150 Miles
Transcript of Performance Analysis for Colleges of Education · Performance Analysis for Colleges of Education...

Performance Analysis for
Colleges of Education
Center for Research, Evaluation and Advancement
of Teacher Education
www.createtx.org
Angelo State University PZPI: 150 Miles

YEAR 5 Released September 2011
CREATE Center for Research, Evaluation and Advancement
of Teacher Education

CREATE COORDINATING COMMITTEE
CREATE ADVISORY COUNCIL
Robert McPherson
Dean, College of Education
University of Houston
Jeanne Burns
Associate Commissioner for Teacher Initiatives
Governor’s Office of Education /
Louisiana Board of Regents
Genevieve Brown
Dean, College of Education
Sam Houston State University
Jill Burk
Dean, College of Education
Tarleton State University
Charles Coble
Partner
The Third Mile Group, LLC
Jeanne Gerlach
Dean, College of Education
University of Texas at Arlington
Lois Adams-Rogers
Chief Operating Officer
Council of Chief State School Officers
Ed Crowe
Senior Adviser
Woodrow Wilson National
Fellowship Foundation
Sabrina Laine
Vice President
American Institutes for Research and
Director, National Comprehensive Center
for Teacher Quality
Linda Mora
Deputy Superintendent
Curriculum & Instruction
Northside Independent School District
Nancy Pelz-Paget
Director of Education & Society Program
Aspen Institute
Rosanne Stripling
Provost & Vice President for Academic Affairs
Texas A&M University – Texarkana
Johnny Veselka
Executive Director
Texas Association of School Administrators
Perry Moore
Vice Chancellor for Academic Affairs
The Texas State University System
Pedro Reyes
Associate Vice Chancellor for Academic Affairs
The University of Texas System
John J. Antel
Sr. Vice Chancellor for Academic Affairs
The University of Houston System
Frank Ashley, Chair
Vice Chancellor for Academic Affairs
The Texas A&M University System

CREATE MEMBER SYSTEMS AND INSTITUTIONS
OPERATING PARTNERS
TEXAS A&M UNIVERSITY SYSTEM
Prairie View A&M University
Tarleton State University
Texas A&M International University
Texas A&M University
Texas A&M University-Central Texas
Texas A&M University-Commerce
Texas A&M University-Corpus Christi
Texas A&M University-Kingsville
Texas A&M University-San Antonio
Texas A&M University-Texarkana
West Texas A&M University
TEXAS STATE UNIVERSITY SYSTEM
Lamar State College-Orange
Lamar University
Sam Houston State University
Sul Ross State University
Sul Ross State University-Rio Grande
Texas State University-San Marcos
UNIVERSITY OF HOUSTON SYSTEM
University of Houston
University of Houston-Clear Lake
University of Houston-Downtown
University of Houston-Victoria
UNIVERSITY OF TEXAS SYSTEM
University of Texas-Arlington
University of Texas-Austin
University of Texas-Brownsville
University of Texas-Dallas
University of Texas-El Paso
University of Texas-Pan American
University of Texas-Permian Basin
University of Texas-San Antonio
University of Texas-Tyler
PROGRAM PARTNERS
Abilene Christian University
Angelo State University
Austin College
Baylor University
Hardin-Simmons University
Howard Payne University
McMurry University
St. Edward’s University
Stephen F. Austin State University
Texas Lutheran University
Texas Tech University
Texas Woman’s University
University of Mary Hardin-Baylor
University of North Texas
University of St. Thomas
University of the Incarnate Word

i
TABLE OF CONTENTS
Performance Analysis for Colleges of Education (PACE)
Overview Purpose and Objectives of PACE ..............................................................................................1 CREATE Assumptions about the Professional Influence and Impact of Colleges of Education ...................................................................................................................................3 The Proximal Zone of Professional Impact (PZPI): A Contextual Framework for Assessing Long-Term Influence and Impact of Colleges of Education ....................................4 Data Sets Used in the PACE Report ..........................................................................................5 How to Use and Apply the PACE Report ..................................................................................6
PACE Reports
I. Educational Trends in University’s Proximal Zone of Professional Impact A. Descriptive Reports on the Characteristics of Public Schools in the Proximal
Zone of Professional Impact ....................................................................................7
A.1. Summary of Public School Enrollment in the Proximal Zone of Professional Impact ................................................................................................................9
A.2. Public School Enrollment by District in the Proximal Zone of Professional Impact (Sample)...............................................................................................10
A.3. Public School Listings in the Proximal Zone of Professional Impact (Sample) ...........................................................................................................11
B. Educational Trend Reports on Public Schools in the Proximal Zone of Professional Impact ................................................................................................12
B.1. Student Enrollment Trends in the Proximal Zone of Professional Impact ......14
B.2. Student Achievement Trends in the Proximal Zone of Professional Impact
B.2.a. Percentage Passing Mathematics TAKS, 2007-2010 .........................16
B.2.b. Percentage Passing English Language Arts/Reading TAKS, 2007-2010 ............................................................................................17

ii
B.2.c. Variability of TAKS Achievement Rates by Ethnicity, 2007-2010
Figure 1: High School Mathematics ...................................................18
Figure 2: Middle School Mathematics ................................................19
Figure 3: Elementary School Mathematics .........................................20
Figure 4: High School Language Arts/Reading ..................................21
Figure 5: Middle School Language Arts/Reading ..............................22
Figure 6: Elementary School Language Arts/Reading .......................23
B.2.d. Highest and Lowest Achieving Schools in Mathematics by Level, 2010
Table 1: 30 Highest-Achieving High Schools in Mathematics .........24
Table 2: 30 Lowest-Achieving High Schools in Mathematics ..........25
Table 3: 30 Highest-Achieving Middle Schools in Mathematics ......26
Table 4: 30 Lowest-Achieving Middle Schools in Mathematics ......27
Table 5: 30 Highest-Achieving Elementary Schools in Mathematics ........................................................................28
Table 6: 30 Lowest-Achieving Elementary Schools in Mathematics ........................................................................29
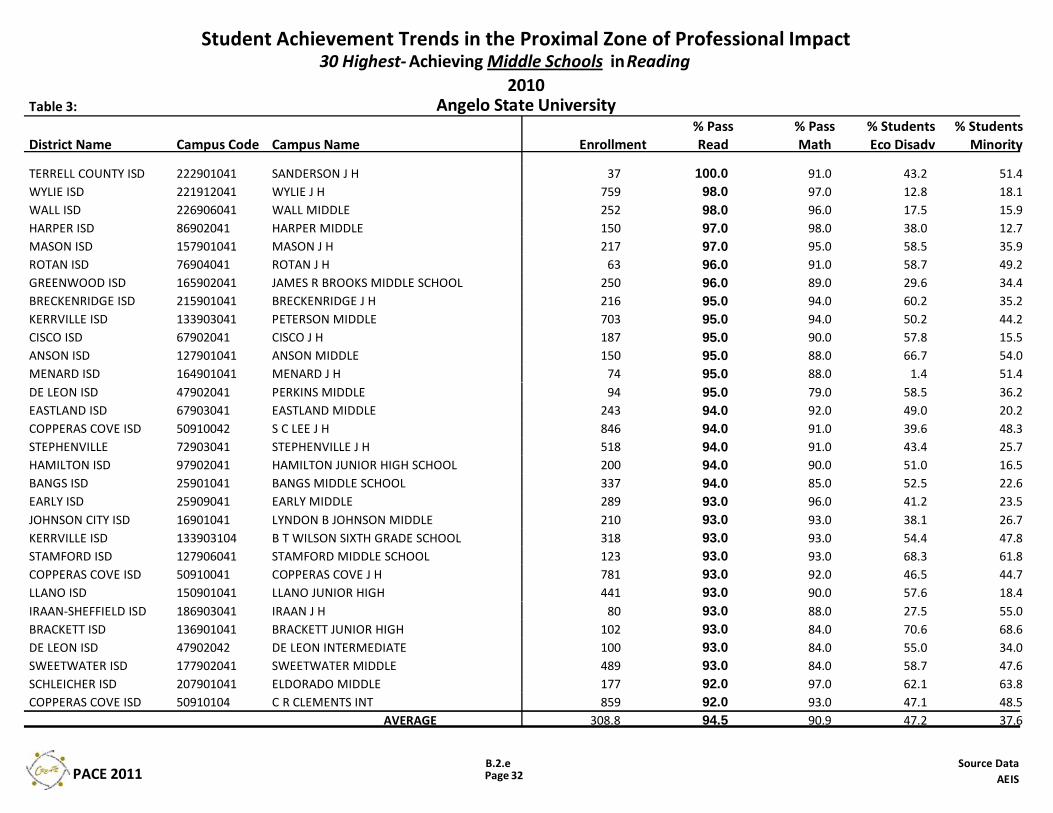
B.2.e. Highest and Lowest Achieving Schools in Reading by Level, 2010
Table 1: 30 Highest-Achieving High Schools in Reading ................30
Table 2: 30 Lowest-Achieving High Schools in Reading .................31
Table 3: 30 Highest-Achieving Middle Schools in Reading .............32
Table 4: 30 Lowest-Achieving Middle Schools in Reading ..............33
Table 5: 30 Highest-Achieving Elementary Schools in Reading ......34
Table 6: 30 Lowest-Achieving Elementary Schools in Reading .......35
II. University and Teacher Education Trends
C. University and Teacher Production Reports ........................................................36
C.1. Five-Year University Production Trends .........................................................37
C.2. Teacher Production Trends for University Completers ...................................38
C.3. Teacher Production by Race/Ethnicity ............................................................39
C.4. Initial Certification Production by Level .........................................................40
C.5. Other Producers of Teachers in Proximal Zone of Professional Impact .........41

iii
D. Professional Impact Trend Reports ......................................................................42
D.1. Teacher Hiring in the Proximal Zone of Professional Impact
D.1.a: High Schools ...................................................................................43
D.1.b: Middle Schools ................................................................................44
D.1.c: Elementary Schools .........................................................................45
D.2. Percentage of Newly-Certified Teachers Employed Inside and Outside the Proximal Zone of Professional Impact ............................................................46
D.3. District Hiring Patterns of University-Prepared Teachers in PZPI (Sample) ..47
D.4. Percentage of University Completers in the Proximal Zone of Professional Impact
D.4.a. High Schools ........................................................................................48
D.4.b. Middle Schools ....................................................................................49
D.4.c. Elementary Schools .............................................................................50
D.5. Comparison of Teacher Retention Trends
D.5.a. Five-Year Retention of First-Year Teachers ........................................51
D.5.b. Five-Year Retention of First-Year Teachers by School Level: High School .........................................................................................52
D.5.c. Five-Year Retention of First-Year Teachers by School Level: Middle School ......................................................................................53
D.5.d. Five-Year Retention of First-Year Teachers by School Level: Elementary School ...............................................................................54
III. University Benchmarks to Guide Improvement
E. University Comparison Reports ............................................................................55
E.1. Comparison of Teacher Production in Nearby Geographic Area ....................56
E.2. Five-Year Production Ratios of Consortium Universities ...............................57
E.3. Comparison of Longitudinal Certificate Production Trends ...........................59
E.4. Teacher Retention Comparison .......................................................................60
Changes Made to the 2011 Reports .........................................................................................61
Information Regarding Data Correction and Data Requests ...................................................61

iv
IV. Attachments Attachment 1: Public School Enrollment in the Proximal Zone of Professional Impact
Attachment 2: Public School Listings in the Proximal Zone of Professional Impact
Attachment 3: District Hiring Patterns of University-Prepared Teachers in the Proximal Zone of Professional Impact
V. Source Data for 2011 PACE Reports
Section A: AEIS 2009-2010, TEA; PZPI, CREATE
Section B: AEIS 2009-20010, TEA; PZPI, CREATE
Section C: IPEDS Fall 2009; ICUT Fall 2009 Teacher certification files 2009-2010, TEA; THECB Accountability System, Prep Online, 2009-20010
Section D: Teacher certification, 2009-2010, TEA (PEIMS) Teacher assignment and employment from PEIMS, 2010-2011 TEA AEIS 2009-2010, TEA PZPI, CREATE
Section E: Teacher certification, 2009-20010, TEA Teacher employment from PEIMS, 2010-2011, TEA

PACE 2011 1
PERFOMANCE ANALYSIS FOR COLLEGES OF EDUCATION
(PACE)
Purpose and Objectives of PACE
As a consortium of universities devoted to on-going analysis and continuous quality
improvement of university-based teacher preparation, the Center for Research,
Evaluation and Advancement of Teacher Education (CREATE) seeks to develop
planning and information systems that can assist universities in professional analysis of
their teacher preparation initiatives, particularly as these practices relate to long-term
teacher influence and effect.
The preparation of effective teachers for Texas public schools is of paramount
importance in assuring sound economic footing and an enhanced quality of life for all
Texans. To this end, university-based teacher preparation is of great public significance
in the state, worthy of careful attention, and an important subject of continuous quality
improvement.
PACE is offered in support of the teacher preparation programs associated with the
CREATE consortium. PACE presents a useful reporting system for universities and their
Colleges of Education centered on public schools. Reports are intended to be used as a
planning and resource tool that can assist teacher education leaders in assessing needs,
targeting refinements in their preparation programs, and evaluating organizational effects
over time.
PACE reports are intended to address the following objectives:
1. Present a system which describes and charts a Proximal Zone of Professional
Impact (PZPI) for each CREATE institution, within which to consider long-
term program interventions and measure effectiveness of university teacher
preparation programs.
2. Provide a school-centered tool that can assist in the continuous quality
improvement of university-based teacher preparation programs.
3. Provide information that will enable university and public school leaders to
track long-term trends related to public schools in their immediate area.
4. Provide information that will enable university and public school leaders to
track long-term trends related to teacher supply in relation to regional demand.
5. Furnish a structured format that will enable university and public school
leaders to engage in systematic analysis of achievement and staffing patterns
in their immediate vicinity.

PACE 2011 2
As an information system, the PACE reports are a work in progress and subject to continuous quality improvement. For Year 5, the core reports have been retained but refined. While these reports offer a structure for data that can assist all consortium members in establishing a school-centered planning focus, PACE data must be augmented with university program information in order to thoroughly answer critical evaluation questions about each institution’s teacher preparation programs. In this regard, PACE is offered as a common data platform that will hopefully encourage expanded “mining” efforts related to local university information systems in order to inform improved teacher preparation practices at the campus and regional level. It is also important to note that PACE reports are derived from Texas state data sources. Large files of this size and scope are always subject to variability and standard degree of error. To this end, it is imperative that PACE users verify and authenticate these reported institutional data prior to final analysis and interpretation. In efforts to refine the data, CREATE staff stand ready to assist in answering questions or clarifying issues regarding data quality. A summary of changes made to the 2011 PACE reports and information about whom to contact regarding data requests and data errors can be found on page 61.

PACE 2011 3
CREATE Assumptions about the Professional Influence and Impact of Colleges of Education
The PACE system is based upon key assumptions that are central to CREATE’s mission and program of work. CREATE assumes the following with regard to the professional influence and impact of Colleges of Education.
A. Colleges of Education are an integral component of a system of public education and, as such, have a professional obligation to contribute to the continuous quality improvement of public school teaching and student learning.
B. Colleges of Education can and do influence continuous quality improvement of
public school teaching and student learning through their core functions of:
• teacher preparation
• research and development
• service to the profession
C. To optimize professional influence, Colleges of Education leaders must regularly assess the status of public school teaching and student learning, and based upon identified needs, work with their public school partners to develop and implement program interventions that support measured improvement over time.
D. The College of Education’s long-term effects on public school teaching and
student learning can best be assessed through:
• on-going analysis of the College’s teacher production, placement and retention trends
• faculty and graduate student research and development activities
• faculty and staff service to the local profession as implemented in a Proximal Zone of Professional Impact (PZPI)
E. Faculty involvement in planning, implementing and/or assessing educational
interventions in the PZPI should be actively encouraged within every College of Education.

PACE 2011 4
The Proximal Zone of Professional Impact (PZPI): A Contextual Framework for Assessing Long-Term Influence and
Impact of Colleges of Education To facilitate consistent long-term assessment of institutional impact, and afford comparative analysis, CREATE has established a Proximal Zone of Professional Impact (PZPI) for CREATE institutions. The Proximal Zone of Professional Impact is comprised of the university and all school districts and campuses within a seventy-five mile radius of the university. This proximal zone describes a “P-16” professional community in the immediate vicinity of each university, and provides each College of Education a professional laboratory setting in which to collaboratively design and implement program improvements over time and to gauge their long-term success. While this Proximal Zone of Professional Impact does not convey the complete impact scenario of the university’s teacher preparation programs, it does provide a common and consistent setting in which the university may measure program effects over time. From CREATE’s perspective, the PZPI offers the following advantages:
A. It presents a useful frame of reference for Colleges of Education to utilize in assessing teaching and learning trends over time in the particular geographic area nearest their institution.
B. It provides Colleges of Education a field laboratory for research and development
activities related to planned instructional interventions. C. It establishes parameters of a professional community that are consistently
defined across the CREATE consortium, enabling long-term program benchmarking and institutional comparisons.
D. It provides geographic boundaries that correlate to the university’s primary
admission centers.
E. It affords a structure for long-term regional networking and professional partnerships among public and higher education institutions in the zone.

PACE 2011 5
Data Sets Used in the PACE Report
The data used to compile the PACE reports are based on the following data sets, listed in alphabetical order:
Academic Excellence Indicator System (AEIS). This data is available from the TEA website and includes data on students, staff, finances, accountability ratings, test scores, and non-test score information related to student achievement and drop outs. The data is available for every public school in Texas since 1993. Newly created schools are not included in the system until at least one year after they have opened.
Independent Colleges and Universities of Texas (ICUT). This data set provides institutional level data on a variety of variables for private universities including information on enrollment and degree awards.
Integrated Postsecondary Education Data System (IPEDS). This data set comes from data collected by The National Center for Education Statistics (NCES) on key variables from every institution of higher education that participates in the federal student financial aid programs. Data can be downloaded through the IPEDS Data Center (http://nces.ed.gov/ipeds/datacenter).
Proximal Zone of Professional Impact (PZPI). This data set, produced by CREATE, contains a list of the K-12 public schools and districts within a 75-mile radius of each university in the CREATE consortium offering teacher preparation.
Teacher Assignment Data Set. This data set, provided by TEA, includes the specific course and subject area assignments by percentage of full-time equivalent (FTE) for every teacher of record in every Texas public school. The data matches each teacher to the district and school or schools in which he or she teaches. The data set is available from the mid-1980s to the current year. The Teacher Assignment Data Set for each academic year is made available in March of that academic year.
Teacher Certification Data Set. This data set, provided by TEA, includes each Texas teaching certificate obtained by a qualified applicant as well as the date the individual received the teaching certificate. The data matches individuals to the program recommending certification and is available from FY1994 through the current year. These data do not distinguish between middle and high school certificates, but do differentiate elementary and secondary certificates. The data include the race/ethnicity, gender, and age of each individual. Finally, the Teacher Certification Data Set is a dynamic data set in that changes are made on a daily basis. Thus, any analysis based on a Teacher Certification Data Set purchased in one month will likely differ somewhat from an analysis based on a data set purchased in another month.
Texas Higher Education Accountability System. This data is used to track performance on critical measures that exemplify higher education institutions' missions. An interactive website (http://www.txhighereddata.org/Interactive/Accountability/) provides information related to four success goals of the Texas Higher Education Closing the Gaps plans within Texas: student participation, student success, excellence, and research. Mathematics, biological sciences, and physical science degree awards were downloaded from the THECB Prep Online site (http://www.txhighereddata.org/Interactive/PREP_New/).

PACE 2011 6
How to Use and Apply the PACE Report
PACE is intended as a tool to assist universities, their Colleges of Education, and their leadership teams in analyzing teaching and learning trends within their institutions and within the public schools of the surrounding area. PACE offers a structure to monitor and gauge long-term professional improvement. The data included in this report are important, therefore, only to the degree that each university chooses to address them in a systematic and continuous manner, and organize mechanisms within their own institutions to apply these analyses for the on-going refinement of their own teacher preparation program, as well as other educational programs. Based on this intended use, we recommend the following actions associated with the PACE reports:
1. Organize and empower a teacher preparation leadership team which includes both university and public school partners (a standing work committee) to analyze and interpret these data as well as recommend organizational improvements based on the needs identified.
2. Verify and validate the state data sets to be certain that they are relatively consistent with comparable data reported by your university. Extend and augment the data in the PACE reports with university data bases and programmatic information available only at your institution.
3. Develop an institutional report which identifies regional teaching and learning needs. Disseminate this report extensively within and outside the institution.
4. Plan, implement and evaluate program improvements intended to address regional teaching and learning needs. Encourage experimental research and development projects based on these planned interventions.
5. Build regional collaboratives based on the needs identified and the organizational interventions pursued.
How CREATE Can Assist CREATE will continue to refine the PACE reports and data sets for annual distribution. However, for member institutions that seriously pursue the recommended steps above, CREATE will make every effort to deliver additional support and technical assistance to university/school leadership teams by:
1. Developing customized reports for active university teams
2. Consulting with leadership teams regarding analysis and interpretation of data
3. Facilitating meetings and other local events that employ these data in a systematic manner for program improvement
4. Evaluating university-based initiatives to design and implement program improvements

I.
Educational Trends in
University’s Proximal Zone of
Professional Impact

A. Descriptive Reports on the Characteristics
of Public Schools in the Proximal Zone of Professional Impact

7
SECTION A: Descriptive Reports on the Characteristics of Public Schools
in the Proximal Zone of Professional Impact Section A consists of descriptive reports regarding the characteristics of public and charter schools located within a 75-mile radius of the target university. The data sources and definitions used to generate the various reports are discussed below. The source data for each report can be found in the lower right-hand corner of each document. The description of the source data for the 2011 PACE reports can be found in the Table of Contents on page iv. A. 1: Summary of Public School Enrollment in the Proximal Zone of Professional Impact
(PZPI). This report provides a summary of enrollment within the PZPI by various subpopulations of students. The data include the number and percent by school level for race/ethnicity, economically disadvantaged, special education, bilingual, and LEP students. Percentages of students in special categories will NOT add up to 100% because different denominators are used to calculate level percentages. The definitions of the subpopulations are described below:
Economically Disadvantaged: Economically disadvantaged students are those coded as eligible for free or reduced price lunch or eligible for other public assistance. See also Campus Group and Total Students. (Source: PEIMS, Oct. 2005, Oct. 2004; and TEA Student Assessment Division).
Limited English Proficient (LEP): These are students identified as limited English proficient by the Language Proficiency Assessment Committee (LPAC) according to criteria established in the Texas Administrative Code. Not all pupils identified as LEP receive bilingual or English as a second language instruction, although most do. For more information see Campus Group and TAKS/SDAA II/TAKS-I Participation (Source: PEIMS, Oct. 2005).
Special Education: This refers to the population served by programs for students with disabilities. (Source: PEIMS, Oct. 2005, Oct. 2004, and TEA Student Assessment Division).
A.2: Public School Enrollment by District in the Proximal Zone of Professional Impact. This report shows the first page of a supplemental document (See Attachment 1 for a full inventory) showing public school enrollment in the PZPI in different ways. First, an alphabetical listing of all district and charter schools in the target university’s PZPI breaks out enrollment by school level (elementary, middle, high, and elementary/ secondary). Then districts’ student enrollment by ethnicity by school level and for selected student subpopulations is represented. A.3: Public School Listing in the Proximal Zone of Professional Impact. This report is the first page of a supplemental document (See Attachment 2 for a full inventory) listing all public schools (including charter schools) by district within the university’s PZPI. The listing includes the district name, campus code and campus name, school type (elementary, middle, high, and elementary/secondary) school size and accountability rating. The campus accountability rating uses the following system:

8
A=Academically Acceptable L= Academically Unacceptable R=Recognized E= Exemplary
In rare occasions, a campus may not have an accountability rating. The campus may include no students enrolled higher than kindergarten, have insufficient data due to small numbers, was designated a Juvenile Justice Alternative Program. The following system is used:
1=Not Rated 2=Not Rated X=Not Rated
Requirements for each rating system can be found in the 2011 Accountability Manual on the TEA website.

Angelo State University2009‐2010
Summary of Public School Enrollment in Proximal Zone of Professional Impact
Traditional Districts 156
Charter Schools 6
District Types in the PZPI
96.3
3.7
N %
Total 162 100.0
LevelNumber
ofSchools
African AmericanN %
HispanicN %
WhiteN %
AsianN %
Native AmericanN %
Total
Number of Students
ELEM 271 5,936 5.8 51,162 44,736 43.3 925 0.9 449 0.4 103,20849.6
MS 104 2,767 6.5 19,102 19,790 46.7 494 1.2 217 0.5 42,37045.1
HS 174 3,169 5.7 23,622 28,256 50.5 567 1.0 324 0.6 55,93842.2
EL/SEC 56 260 2.6 3,976 5,496 55.9 46 0.5 49 0.5 9,82740.5
Total 605 12,132 5.7 97,862 98,278 46.5 2,032 1.0 1,039 0.5 211,34346.3
LevelNumber
ofSchools
Eco DisadvantagedN %
Special EducationN %
BilingualN %
LEPN %
Students in Special Categories
ELEM 271 67,267 65.2 8,843 10,350 10.0 11,062 10.78.6
MS 104 23,322 55.0 4,567 1,569 3.7 1,736 4.110.8
HS 174 24,898 44.5 6,843 1,389 2.5 1,525 2.712.2
EL/SEC 56 5,805 59.1 1,061 628 6.4 672 6.810.8
Total 605 121,292 57.4 21,314 13,936 6.6 14,995 7.110.1
Source Data9Page
A.1AEIS, TEAPACE 2011

District Name School Level EL MS HS El/Sec Total Afro‐Amer
His‐panic
White Asian Native Amer
Total Eco Dis SpecEduc
Bilingual
LEP At‐Risk
SAMPLE DOCUMENT: To view the Total School Listing for Your Proximal Zone of Professional Impact Refer to Attachment 1
Angelo State University2009‐2010
Public School Enrollment by District in the Proximal Zone of Professional Impact
ABILENE ISD EL/SEC 0 0 0 3 7611 27 36 2 03 54 51 0 0 41ELEM 19 0 0 19 9,0141,290 3,761 3,740 160 630 6,437 1,070 354 376 2,559HS 0 0 5 5 4,328598 1,464 2,118 109 390 2,155 746 117 117 2,324MS 0 4 0 4 3,345471 1,317 1,466 68 230 2,093 573 60 63 1,388Total 19 4 5 31 16,7632,370 6,569 7,360 339 1253 10,739 2,440 531 556 6,312
ALBANY ISD ELEM 1 0 0 1 2648 40 213 2 10 117 27 7 7 73HS 0 0 1 1 2518 44 195 3 10 63 23 7 7 87Total 1 0 1 2 51516 84 408 5 20 180 50 14 14 160
ANDREWS ISD EL/SEC 0 0 0 1 121 9 1 1 01 10 4 0 2 12ELEM 3 0 0 3 1,57141 1,017 504 7 20 961 107 235 240 543HS 0 0 1 1 87317 504 343 7 20 249 117 18 58 376MS 0 1 0 1 67814 407 249 6 20 308 59 18 28 287Total 3 1 1 6 3,13473 1,937 1,097 21 61 1,528 287 271 328 1,218
ANSON ISD ELEM 1 0 0 1 37113 184 172 2 00 243 29 17 17 92HS 0 0 1 1 2157 68 138 0 20 110 53 15 14 94MS 0 1 0 1 1502 77 69 1 10 100 20 11 11 64Total 1 1 1 3 73622 329 379 3 30 453 102 43 42 250
ASPERMONT ISD ELEM 1 0 0 1 15110 46 93 2 00 85 11 8 8 35HS 0 0 1 1 873 15 67 1 10 27 10 0 0 28Total 1 0 1 2 23813 61 160 3 10 112 21 8 8 63
BAIRD ISD ELEM 1 0 0 1 1640 35 128 1 00 112 12 0 0 42HS 0 0 1 1 970 15 81 0 10 56 21 0 0 39MS 0 1 0 1 680 12 56 0 00 44 11 0 0 21Total 1 1 1 3 3290 62 265 1 10 212 44 0 0 102
BALLINGER ISD ELEM 1 0 0 1 47111 220 237 0 30 315 39 16 16 188HS 0 0 2 2 3028 109 181 0 40 135 41 2 2 121MS 0 1 0 1 2428 104 129 0 10 137 23 3 3 97Total 1 1 2 4 1,01527 433 547 0 80 587 103 21 21 406
BANDERA ISD ELEM 2 0 0 2 1,1558 339 801 5 20 698 147 76 76 380HS 0 0 1 1 7991 189 600 4 50 322 102 19 16 397
Source Data10Page
A.2AEISPACE

District Name Campus Code Campus Name School Type School SizeAccountability
Rating
SAMPLE DOCUMENT: To view the Total School Enrollment by District for Your Proximal Zone of Professional Impact Refer to Attachment 2Angelo State University
2009‐2010Public School Listings in the Proximal Zone of Professional Impact
ABILENE ISD 221901001 ABILENE H S HS 2,091 AABILENE ISD 221901142 ABILENE PSYCHIATRIC INSTITUTE HS 12 XABILENE ISD 221901002 COOPER H S HS 1,981 AABILENE ISD 221901006 TRAVIS OPPORTUNITY CTR HS 22 XABILENE ISD 221901003 WOODSON CENTER FOR EXCELLENCE HS 222 1ABILENE ISD 221901048 BYRON CRAIG MIDDLE MS 906 RABILENE ISD 221901047 CLACK MIDDLE MS 820 RABILENE ISD 221901044 MADISON MIDDLE MS 864 AABILENE ISD 221901045 MANN MIDDLE MS 755 AABILENE ISD 221901102 AUSTIN EL EL 548 RABILENE ISD 221901153 BASSETTI EL EL 614 AABILENE ISD 221901103 BONHAM EL EL 592 RABILENE ISD 221901104 BOWIE EL EL 611 EABILENE ISD 221901106 COLLEGE HEIGHTS EL EL 365 RABILENE ISD 221901208 DAY NURSERY OF ABILENE EL 152 XABILENE ISD 221901108 DYESS EL EL 483 EABILENE ISD 221901110 FANNIN EL EL 338 EABILENE ISD 221901112 JACKSON EL EL 547 EABILENE ISD 221901113 JOHNSTON EL EL 598 RABILENE ISD 221901116 LEE EL EL 374 AABILENE ISD 221901117 LOCUST ECC EL 361 XABILENE ISD 221901118 LONG EL EL 345 RABILENE ISD 221901152 ORTIZ EL EL 645 RABILENE ISD 221901120 REAGAN EL EL 313 AABILENE ISD 221901121 TAYLOR EL EL 543 EABILENE ISD 221901151 THOMAS EL EL 591 EABILENE ISD 221901150 WARD EL EL 564 E
Source Data11Page
A.3AEISPACE 2011

B. Educational Trend Reports on
Public Schools in the Proximal Zone of Professional Impact

12
SECTION B: Educational Trend Reports on Public Schools in
the Proximal Zone of Professional Impact
Section B describes the trends within the PZPI for student enrollment and student achievement from 2007 to 2010. All of the data in this section come from the AEIS data files.
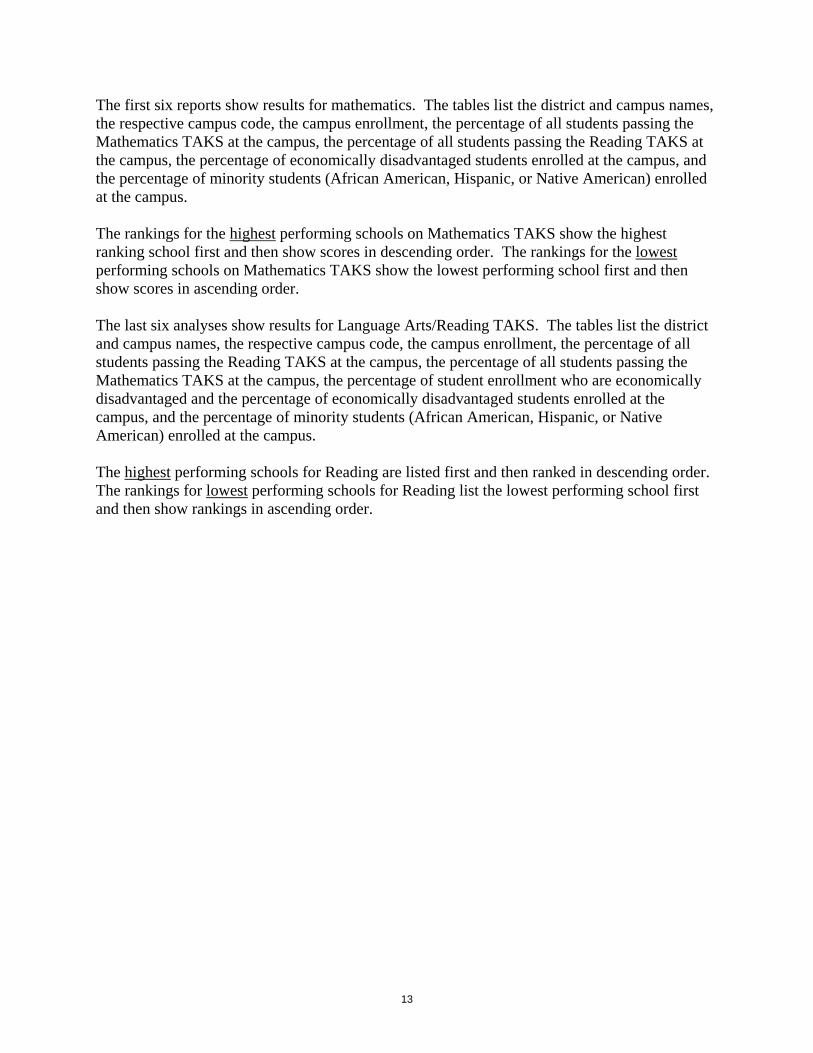
B.1: Student Enrollment Trends in the Proximal Zone of Professional Impact.This two-page analysis describes the trends in student enrollment within the PZPI from 2007 to2010. The data are presented by school level and includes information by student racial/ethniccategories as well as other student subpopulations. The analysis provides the change in thenumber of students within the PZPI and the percentage change in student enrollment over thesame time period. Data are depicted graphically by ethnicity and by students in specialcategories.
B.2: Student Achievement Trends in the Proximal Zone of Professional Impact.B.2.a: and B.2.b: Percentage Passing Mathematics TAKS and Percentage Passing EnglishLanguage Arts/Reading TAKS. These analyses provide trend data on the percentage of studentspassing the Mathematics and English Language Arts/ Reading Texas Assessment of Knowledgeand Skills (TAKS) at all grade levels from 2007 to 2010. The pass rates on TAKS for schoolswithin the PZPI are compared to schools that are not in the PZPI. Within each school group, thepercent of students passing the exam each year are provided, as well as the change in pass ratesover time. The analyses supply information by student racial/ethnic subpopulations and foreconomically disadvantaged students.
B.2.c: Variability of TAKS Achievement Rates by Ethnicity. Figures 1 through 6 provideinformation about the percentage of subpopulations of students at each school level passing ALLTAKS for Mathematics and Language Arts/Reading from 2007 to 2010. Only schools with aregular accountability rating at the same school level all 4 years were included in the analysis.
“Percent Passing” is calculated by dividing the number of students achieving passing on the respective TAKS subject by the number of students tested in the subject.
“Percent Commended” is calculated by dividing the number of students achieving commended performance on the respective TAKS subject by the number of students tested in the TAKS subject.
B.2.d and B.2.e: 30 Highest and Lowest Achieving Schools in Mathematics and Reading byLevel. This section includes a list of the 30 highest- and lowest-performing schools in the PZPIon the TAKS Mathematics and TAKS Language Arts/Reading examinations, by level (high school, middle school, elementary school). Language Arts/Reading has been shortened to Reading in this set of reports. Please note that the AEIS data base incorporates intermediate schools into the elementary school listings.
13
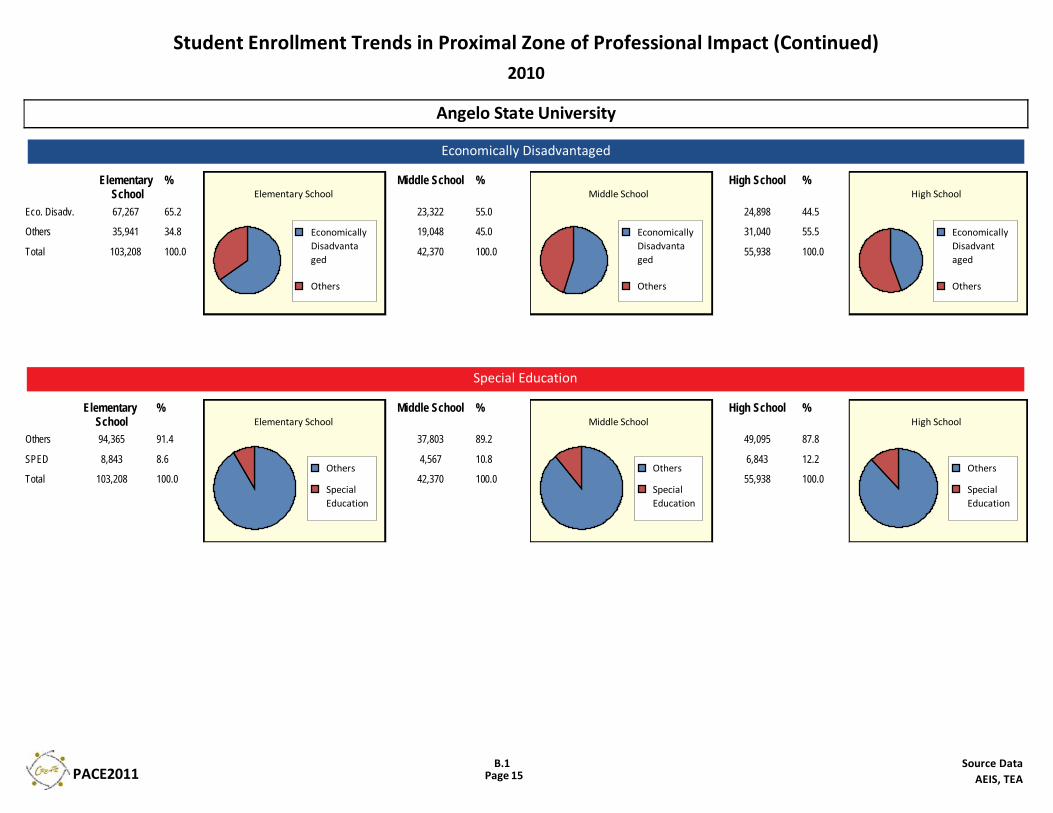
The first six reports show results for mathematics. The tables list the district and campus names, the respective campus code, the campus enrollment, the percentage of all students passing the Mathematics TAKS at the campus, the percentage of all students passing the Reading TAKS at the campus, the percentage of economically disadvantaged students enrolled at the campus, and the percentage of minority students (African American, Hispanic, or Native American) enrolled at the campus. The rankings for the highest performing schools on Mathematics TAKS show the highest ranking school first and then show scores in descending order. The rankings for the lowest performing schools on Mathematics TAKS show the lowest performing school first and then show scores in ascending order. The last six analyses show results for Language Arts/Reading TAKS. The tables list the district and campus names, the respective campus code, the campus enrollment, the percentage of all students passing the Reading TAKS at the campus, the percentage of all students passing the Mathematics TAKS at the campus, the percentage of student enrollment who are economically disadvantaged and the percentage of economically disadvantaged students enrolled at the campus, and the percentage of minority students (African American, Hispanic, or Native American) enrolled at the campus. The highest performing schools for Reading are listed first and then ranked in descending order. The rankings for lowest performing schools for Reading list the lowest performing school first and then show rankings in ascending order.

Fiscal YearStudent Enrollment Trends in Proximal Zone of Professional Impact
2007‐2010Angelo State University
Total
2007 2008 2009 2010210,479 210,635 211,836 211,343
12,172 12,092 12,260 12,132
90,709 92,793 95,538 97,862
104,914 103,014 101,132 98,278
1,690 1,734 1,876 2,032
994 1,002 1,030 1,039
111,177 109,594 110,457 121,292
25,778 23,904 22,365 21,314
13,011 13,553 14,206 13,936
14,457 15,056 15,394 14,995
Headcount - Fall of
Fiscal Year
Elementary
2007 2008 2009 2010All 102,391 101,528 103,416 103,208
African American 6,178 5,819 5,996 5,936
Hispanic 46,800 47,922 49,971 51,162
White 48,123 46,504 46,091 44,736
Asian 842 811 883 925
Native American 448 472 475 449
Economically Disadvantaged
61,975 60,698 61,852 67,267
Special Education 10,890 9,722 9,175 8,843
Bilingual 9,482 9,964 10,595 10,350
LEP 10,391 10,898 11,366 11,062
Middle
2007 2008 2009 201040,180 41,780 41,997 42,370
2,432 2,746 2,734 2,767
17,371 17,950 18,500 19,102
19,900 20,530 20,152 19,790
290 363 415 494
187 191 196 217
20,615 20,948 20,991 23,322
5,615 5,419 4,905 4,567
1,448 1,424 1,530 1,569
1,655 1,638 1,710 1,736
High School
2007 2008 2009 201058,382 57,651 56,749 55,938
3,280 3,219 3,250 3,169
22,764 23,079 23,187 23,622
31,515 30,535 29,466 28,256
517 525 541 567
306 293 305 324
23,238 22,641 22,324 24,898
7,889 7,494 7,176 6,843
1,472 1,532 1,430 1,389
1,757 1,817 1,617 1,525
Both Elem/Second
2007 2008 201020099,526 9,676 9,674 9,827
282 308 280 260
3,774 3,842 3,880 3,976
5,376 5,445 5,423 5,496
41 35 37 46
53 46 54 49
5,349 5,307 5,290 5,805
1,384 1,269 1,109 1,061
609 633 651 628
654 703 701 672
Pct Change
Net Change
864 0.4
-40 -0.3
7,153 7.9
-6,636 -6.3
342 20.2
45 4.5
10,115 9.1
-4,464 -17.3
925 7.1
538 3.7
Middle School %217 0.5
494 1.2
19,790 46.7
19,102 45.1
2,767 6.5
42,370 100.0
African American
Asian
Hispanic
Native American
White
Middle School
African American
Asian
Hispanic
Native American
White
High School
African American
Asian
Hispanic
Native American
White
Elementary SchoolElementary School
%EthnicityEthnic Comparisons by Level 2010
449 0.4Native American
925 0.9Asian
44,736 43.3White
51,162 49.6Hispanic
5,936 5.8African American
103,208 100.0All
High School %324 0.6
567 1.0
28,256 50.5
23,622 42.2
3,169 5.7
55,938 100.0
EthnicityOther Trends and Distributions
Net Change2007-2010
45Native American
342Asian
-6,636White
7,153Hispanic
-40African American
864All
‐10000
0
10000 African American
Asian
Hispanic
Native American
White
Net Change in Zone Enrollment byEthnicity
Year AmountEco. Disadvantaged
111,1772007
109,5942008
110,4572009
121,2922010
93-Yr. Change 105000
110000
115000
120000
125000 2007
2008
2009
2010
Economically Disadvantaged Year AmountBilingual
13,0112007
13,5532008
14,2062009
13,9362010
73-Yr. Change 12500
13000
13500
14000
14500 2007
2008
2009
2010
Bilingual
Source Data14Page
B.1AEIS, TEAPACE2011
Economically Disadvantaged
Special Education
Student Enrollment Trends in Proximal Zone of Professional Impact (Continued)2010
Angelo State University
Elementary School
%
67,267 65.2Eco. Disadv.
35,941 34.8Others
103,208 100.0Total
EconomicallyDisadvantaged
Others
Elementary SchoolMiddle School %
23,322 55.0
19,048 45.0
42,370 100.0
EconomicallyDisadvantaged
Others
Middle SchoolHigh School %
24,898 44.5
31,040 55.5
55,938 100.0
EconomicallyDisadvantaged
Others
High School
Elementary School
%
94,365 91.4Others
8,843 8.6SPED
103,208 100.0TotalOthers
SpecialEducation
Elementary SchoolMiddle School %
37,803 89.2
4,567 10.8
42,370 100.0Others
SpecialEducation
Middle SchoolHigh School %
49,095 87.8
6,843 12.2
55,938 100.0Others
SpecialEducation
High School
Source Data15Page
B.1AEIS, TEAPACE2011

Percentage Passing Mathematics TAKSStudent Achievement Trends in the Proximal Zone of Professional Impact
Angelo State University2007‐2010
Districts in University's PZPI
All StudentsSchoolLevel 2007 2008 2009 2010
87.3 87.1 85.8 85.8Elem75.6 82.2 82.8 82.8Middle69.8 70.2 72.5 77.0High75.9 77.5 78.4 80.0El/Sec79.6 81.0 81.3 82.5Total
Other School Districts in State85.5 87.1 88.0 88.6Elem76.6 83.4 84.0 84.6Middle67.5 69.1 73.1 78.1High65.7 70.5 72.4 76.0El/Sec78.3 81.1 82.9 84.7Total
Change
‐1.57.27.24.12.9
3.18.010.610.36.4
Districts in University's PZPI
African American Students2007 2008 2009 2010
81.0 79.8 76.3 77.366.9 77.1 79.6 76.451.1 54.8 60.8 66.849.6 55.0 69.7 64.369.1 71.8 72.8 74.1
Other School Districts in State76.2 78.5 80.1 81.563.8 72.7 73.8 75.051.3 54.0 59.4 66.650.1 55.4 61.0 65.665.9 69.8 72.5 75.6
Change
‐3.79.515.714.75.0
5.311.215.315.59.7
Districts in University's PZPI
Hispanic Students2007 2008 2009 2010
82.9 82.7 81.0 81.465.7 73.9 75.6 76.758.5 58.7 62.3 69.171.3 72.2 72.4 74.072.8 74.4 75.0 77.1
Other School Districts in State82.4 84.6 85.6 86.670.4 78.8 79.8 81.157.7 60.3 66.0 72.861.1 66.6 68.8 73.573.6 77.2 79.4 81.8
Change
‐1.511.010.62.74.3
4.210.715.112.48.2
Districts in University's PZPI
White StudentsSchoolLevel 2007 2008 2009 2010
91.8 92.1 91.5 91.3Elem84.3 89.5 89.6 89.2Middle79.5 79.8 81.3 84.7High80.4 81.9 83.3 84.9El/Sec86.0 87.4 87.7 88.6Total
Other School Districts in State93.0 93.6 94.0 94.0Elem87.2 91.9 92.3 92.0Middle81.8 82.6 84.8 87.6High77.7 80.9 82.2 83.3El/Sec88.0 89.6 90.6 91.4Total
Change
‐0.54.95.24.52.6
1.04.85.85.63.4
Districts in University's PZPI
Asian Students2007 2008 2009 2010
97.6 95.4 95.1 95.689.1 97.2 96.1 90.088.4 90.1 89.7 90.389.0 100.0 94.0 100.091.8 93.7 93.2 92.0
Other School Districts in State96.5 97.1 97.5 97.793.5 96.2 96.4 96.889.2 90.7 92.2 93.894.7 92.8 93.3 94.793.7 95.1 95.7 96.4
Change
‐2.00.91.911.00.2
1.23.34.60.02.7
Districts in University's PZPI
Native American Students2007 2008 2009 2010
90.1 87.8 79.8 87.486.4 83.3 86.1 82.670.4 83.8 76.8 83.684.2 91.0 87.2 82.079.5 84.8 80.6 83.7
Other School Districts in State82.9 86.1 85.5 86.280.6 87.2 87.9 87.272.3 74.7 77.8 83.656.7 66.0 73.8 82.475.5 79.6 81.8 85.1
Change
‐2.7‐3.813.2‐2.24.2
3.36.611.325.79.6
Districts in University's PZPI
Economically SchoolLevel 2007 2008 2009 2010
83.1 82.8 81.1 81.5Elem66.5 75.3 76.1 76.7Middle58.1 59.1 63.1 68.5High71.6 72.5 71.8 75.1El/Sec74.0 75.8 76.0 77.5Total
Other School Districts in State
antaged Students2007 2008 2009 2010
80.6 82.7 83.8 85.068.1 76.5 77.6 78.855.1 57.5 63.3 70.259.3 65.0 67.7 71.772.0 75.5 77.6 80.1
DisadvChange
‐1.610.210.43.53.5
Change
4.410.715.112.48.1
Source Data16Page
B.2.aAEISPACE 2011

Percentage Passing English Language Arts/Reading TAKSStudent Achievement Trends in the Proximal Zone of Professional Impact
Angelo State University2007‐2010
Districts in University's PZPI
All StudentsSchoolLevel 2007 2008 2009 2010
91.4 92.1 90.7 88.9Elem89.3 92.8 92.6 89.1Middle88.1 90.7 91.8 91.7High89.8 90.5 91.2 88.9El/Sec90.0 91.8 91.4 89.7Total
Other School Districts in State89.4 90.5 90.5 89.8Elem88.7 92.5 91.8 89.1Middle87.0 88.7 90.9 91.9High83.7 86.8 87.9 87.2El/Sec88.5 90.4 90.9 90.2Total
Change
‐2.5‐0.23.6‐0.9‐0.3
0.40.44.93.51.7
Districts in University's PZPI
African American Students2007 2008 2009 2007
88.1 87.9 85.1 82.384.5 90.8 90.4 86.880.3 86.4 88.9 88.079.8 70.1 90.6 85.785.0 87.9 87.5 85.0
Other School Districts in State84.6 85.9 85.9 85.584.0 89.8 89.4 86.082.2 84.3 87.9 89.174.2 78.7 82.8 80.683.6 86.2 87.2 86.6
Change
‐5.82.37.75.90.0
0.92.06.96.43.0
Districts in University's PZPI
Hispanic Students2007 2008 2009 2010
87.4 88.8 86.8 85.084.1 89.1 89.2 84.781.9 85.7 87.6 88.384.8 86.0 86.4 83.085.2 87.9 87.5 85.7
Other School Districts in State86.0 87.5 87.6 87.084.1 89.3 88.3 85.081.2 83.9 87.0 89.179.1 84.3 84.5 84.584.3 86.9 87.6 87.1
Change
‐2.40.66.4‐1.80.5
1.00.97.95.42.8
Districts in University's PZPI
White StudentsSchoolLevel 2007 2008 2009 2010
95.2 95.8 95.0 93.7Elem94.1 96.0 95.9 93.6Middle93.1 94.5 95.5 94.8High93.4 94.3 94.9 93.0El/Sec94.2 95.4 95.3 94.0Total
Other School Districts in State95.8 96.4 96.3 95.6Elem95.1 97.0 97.0 95.1Middle94.3 95.1 96.2 96.2High92.2 93.4 93.7 92.6El/Sec95.1 96.1 96.4 95.6Total
Change
‐1.5‐0.51.7‐0.4‐0.2
‐0.20.01.90.40.5
Districts in University's PZPI
Asian Students2007 2008 2009 2010
97.8 96.8 99.6 96.794.8 98.1 96.2 94.795.1 95.5 94.9 91.789.0 100.0 100.0 100.095.9 96.6 96.9 94.3
Other School Districts in State96.1 97.0 97.1 97.096.1 97.5 97.4 96.693.1 94.6 95.5 95.997.0 94.8 96.1 95.495.2 96.4 96.7 96.6
Change
‐1.1‐0.1‐3.411.0‐1.6
0.90.52.8‐1.61.4
Districts in University's PZPI
Native American Students2007 2008 2009 2010
92.7 95.4 90.6 95.489.9 92.8 99.0 96.389.9 91.1 95.7 94.394.7 100.0 100.0 100.090.7 93.0 95.8 95.3
Other School Districts in State90.3 91.3 88.9 93.293.1 95.5 95.5 93.192.3 92.1 94.4 94.685.9 90.0 89.3 88.091.9 92.8 93.7 93.7
Change
2.76.44.45.34.6
2.90.02.32.11.8
Districts in University's PZPI
Economically SchoolLevel 2007 2008 2009 2010
87.8 88.9 87.1 85.0Elem84.1 89.1 88.9 84.4Middle81.8 85.6 87.7 87.7High85.2 86.9 87.2 85.1El/Sec85.6 88.1 87.6 85.4Total
Other School Districts in State
antaged Students2007 2008 2009 2010
85.2 86.7 86.7 86.283.1 88.5 87.6 84.180.1 82.7 86.0 88.179.5 82.9 84.4 83.883.5 86.1 86.7 86.1
DisadvChange
‐2.80.35.9‐0.1‐0.2
Change
1.01.08.04.32.6
Source Data17Page
B.2.bAEISPACE 2011

High School Mathematics
Figure 1:
1
Angelo State University
2007‐2010
Student Achievement Trends in the Proximal Zone of Professional ImpactVariability of TAKS Achievement Rates by Ethnicity
Percen
t
Spring of Academic Year
0
10
20
30
40
50
60
70
80
90
100
2007 2008 2009 2010
African American Commend Pct African American Pass Pct Hispanic Commend Pct
Hispanic Pass Pct White Commend Pct White Pass Pct
2007 2008 2009 2010Pass Commend Pass Commend Pass Commend Pass Commend51.1 54.8 60.8 66.8African American 5.0 7.8 8.9 8.8
58.5 58.7 62.3 69.1Hispanic 8.2 11.2 13.2 12.9
79.5 79.8 81.3 84.7White 20.6 26.6 27.4 27.4
3‐Yr ChangePass Commend15.7 3.8
10.6 4.7
5.2 6.8
Only schools with a regular accountability rating at the same school level all 4 years were included in the analysis.1
Source Data18Page
B.2.cAEIS, TEAPACE 2011

Middle School Mathematics
Figure 2:
1
Angelo State University
2007‐2010
Student Achievement Trends in the Proximal Zone of Professional ImpactVariability of TAKS Achievement Rates by Ethnicity
Percen
t
Spring of Academic Year
0
10
20
30
40
50
60
70
80
90
100
2007 2008 2009 2010
African American Commend Pct African American Pass Pct Hispanic Commend Pct
Hispanic Pass Pct White Commend Pct White Pass Pct
2007 2008 2009 2010Pass Commend Pass Commend Pass Commend Pass Commend66.9 77.1 79.6 76.4African American 11.3 14.2 15.7 14.0
65.7 73.9 75.6 76.7Hispanic 14.0 17.2 18.9 18.0
84.3 89.5 89.6 89.2White 29.9 34.4 35.9 32.8
3‐Yr ChangePass Commend9.5 2.7
11.0 4.0
4.9 2.9
Only schools with a regular accountability rating at the same school level all 4 years were included in the analysis.1
Source Data19Page
B.2.cAEIS, TEAPACE 2011

Elementary School Mathematics
Figure 3:
1
Angelo State University
2007‐2010
Student Achievement Trends in the Proximal Zone of Professional ImpactVariability of TAKS Achievement Rates by Ethnicity
Percen
t
Spring of Academic Year
0
10
20
30
40
50
60
70
80
90
100
2007 2008 2009 2010
African American Commend Pct African American Pass Pct Hispanic Commend Pct
Hispanic Pass Pct White Commend Pct White Pass Pct
2007 2008 2009 2010Pass Commend Pass Commend Pass Commend Pass Commend81.0 79.8 76.3 77.3African American 18.4 19.1 24.8 21.6
82.9 82.7 81.0 81.4Hispanic 23.6 24.9 30.6 28.8
91.8 92.1 91.5 91.3White 40.3 41.2 47.6 42.1
3‐Yr ChangePass Commend‐3.7 3.2
‐1.5 5.2
‐0.5 1.8
Only schools with a regular accountability rating at the same school level all 4 years were included in the analysis.1
Source Data20Page
B.2.cAEIS, TEAPACE 2011

High School Language Arts/Reading
Figure 4:
1
Angelo State University
2007‐2010
Student Achievement Trends in the Proximal Zone of Professional ImpactVariability of TAKS Achievement Rates by Ethnicity
Percen
t
Spring of Academic Year
0
10
20
30
40
50
60
70
80
90
100
2007 2008 2009 2010
African American Commend Pct African American Pass Pct Hispanic Commend Pct
Hispanic Pass Pct White Commend Pct White Pass Pct
2007 2008 2009 2010Pass Commend Pass Commend Pass Commend Pass Commend80.3 86.4 88.9 88.0African American 9.9 14.7 14.0 15.6
81.9 85.7 87.6 88.3Hispanic 10.9 14.9 15.2 16.6
93.1 94.5 95.5 94.8White 24.7 32.6 30.7 32.0
3‐Yr ChangePass Commend7.7 5.7
6.4 5.7
1.7 7.3
Only schools with a regular accountability rating at the same school level all 4 years were included in the analysis.1
Source Data21Page
B.2.cAEIS, TEAPACE 2011

Middle School Language Arts/Reading
Figure 5:
1
Angelo State University
2007‐2010
Student Achievement Trends in the Proximal Zone of Professional ImpactVariability of TAKS Achievement Rates by Ethnicity
Percen
t
Spring of Academic Year
0
10
20
30
40
50
60
70
80
90
100
2007 2008 2009 2010
African American Commend Pct African American Pass Pct Hispanic Commend Pct
Hispanic Pass Pct White Commend Pct White Pass Pct
2007 2008 2009 2010Pass Commend Pass Commend Pass Commend Pass Commend84.5 90.8 90.4 86.8African American 27.1 31.6 31.5 26.1
84.1 89.1 89.2 84.7Hispanic 27.4 33.0 30.8 25.5
94.1 96.0 95.9 93.6White 48.8 54.3 50.6 46.4
3‐Yr ChangePass Commend2.3 ‐1.0
0.6 ‐1.9
‐0.5 ‐2.4
Only schools with a regular accountability rating at the same school level all 4 years were included in the analysis.1
Source Data22Page
B.2.cAEIS, TEAPACE 2011

Elementary School Language Arts/Reading
Figure 6:
1
Angelo State University
2007‐2010
Student Achievement Trends in the Proximal Zone of Professional ImpactVariability of TAKS Achievement Rates by Ethnicity
Percen
t
Spring of Academic Year
0
10
20
30
40
50
60
70
80
90
100
2007 2008 2009 2010
African American Commend Pct African American Pass Pct Hispanic Commend Pct
Hispanic Pass Pct White Commend Pct White Pass Pct
2007 2008 2009 2010Pass Commend Pass Commend Pass Commend Pass Commend88.1 87.9 85.1 82.3African American 23.1 22.7 25.5 24.7
87.4 88.8 86.8 85.0Hispanic 22.4 22.3 26.0 27.3
95.2 95.8 95.0 93.7White 42.6 44.6 49.2 46.3
3‐Yr ChangePass Commend‐5.8 1.6
‐2.4 4.9
‐1.5 3.7
Only schools with a regular accountability rating at the same school level all 4 years were included in the analysis.1
Source Data23Page
B.2.cAEIS, TEAPACE 2011

District Name Campus Code Campus Name% PassRead
% StudentsEco Disadv
% StudentsMinority
Achieving
% PassMath
30 Highest‐ High Schools inMathematics
Enrollment
Angelo State University2010
Student Achievement Trends in the Proximal Zone of Professional Impact
Table 1:
IRAAN‐SHEFFIELD ISD 186903002 T Y C SHEFFIELD CAMPUS 100.0 100.0 49.4100.083MASON ISD 157901001 MASON H S 97.0 58.2 39.797.0184WATER VALLEY ISD 226905001 WATER VALLEY H S 95.0 35.9 20.096.0145IRION COUNTY ISD 118902001 IRION H S 98.0 39.8 36.595.0181WALL ISD 226906001 WALL H S 96.0 16.2 18.795.0321GLASSCOCK COUNTY ISD 87901001 GLASSCOCK COUNTY H S 92.0 50.4 42.595.0127WYLIE ISD 221912001 WYLIE H S 98.0 7.1 16.194.0942ZEPHYR ISD 25906001 ZEPHYR H S 97.0 45.6 5.694.090HARPER ISD 86902001 HARPER H S 96.0 35.0 20.294.0223MEDINA ISD 10901001 MEDINA H S 94.0 50.6 23.194.0160LUEDERS‐AVOCA ISD 127905001 LUEDERS‐AVOCA H S 88.0 60.0 5.794.035CISCO ISD 67902001 CISCO H S 97.0 50.7 17.593.0229MAY ISD 25905001 MAY H S 94.0 48.1 6.792.0104IRAAN‐SHEFFIELD ISD 186903001 IRAAN H S 99.0 20.0 48.890.0125EARLY ISD 25909001 EARLY H S 98.0 33.6 14.190.0354BRACKETT ISD 136901001 BRACKETT H S 94.0 54.7 69.290.0172BRONTE ISD 41901001 BRONTE H S 92.0 43.6 22.890.0149GOLDTHWAITE ISD 167901001 GOLDTHWAITE HIGH SCHOOL 97.0 41.3 26.789.0172MILES ISD 200902001 MILES H S 94.0 37.4 39.689.0182VERIBEST ISD 226908001 VERIBEST H S 94.0 56.1 32.689.0132STERLING CITY ISD 216901001 STERLING CITY H S 100.0 32.3 51.688.062STEPHENVILLE 72903001 STEPHENVILLE H S 95.0 36.8 26.988.01,039BROOKESMITH ISD 25908001 BROOKESMITH H S 92.0 53.1 28.688.049STAMFORD ISD 127906001 STAMFORD HIGH SCHOOL 99.0 64.1 53.687.0181COMANCHE ISD 47901001 COMANCHE H S 96.0 58.8 40.287.0328BROWNWOOD ISD 25902001 BROWNWOOD H S 95.0 51.3 40.987.0829ASPERMONT ISD 217901001 ASPERMONT HS 98.0 31.0 23.086.087KERRVILLE ISD 133903001 TIVY H S 97.0 38.6 41.886.01,348ROBERT LEE ISD 41902001 ROBERT LEE H S 96.0 50.5 36.686.0101COMFORT ISD 130902001 COMFORT H S 93.0 47.2 52.086.0356
283.0 95.7 44.9 31.791.0AVERAGE
Source Data24Page
B.2.dAEISPACE 2011
District Name Campus Code Campus Name
Achieving30 Lowest‐ High Schools inMathematics
% PassRead
% StudentsEco Disadv
% StudentsMinority
% PassMathEnrollment
Angelo State University2010
Student Achievement Trends in the Proximal Zone of Professional Impact
Table 2:
SNYDER ISD 208902002 HOBBS ALTER ED CO‐OP 33.0 73.3 66.70.015SWEETWATER ISD 177902003 HOBBS ALTER ED CO‐OP 75.0 81.1 62.20.037IRAAN‐SHEFFIELD ISD 186903004 PYOTE HS 85.0 100.0 76.70.043BROWNWOOD ISD 25902003 BROWNWOOD ACCELERATED H S 85.0 79.5 51.323.039CISCO ISD 67902004 CISCO LEARNING CENTER 73.0 85.4 68.325.041ABILENE ISD 221901003 WOODSON CENTER FOR EXCELLENCE 77.0 75.7 68.029.0222COLORADO ISD 168901003 WALLACE ACCELERATED H S 90.0 90.6 40.630.032COPPERAS COVE ISD 50910005 CROSSROADS HIGH SCHOOL 62.0 46.4 40.645.069MIDLAND ISD 165901004 VIOLA M COLEMAN H S 90.0 51.0 81.447.0145BURNET CISD 27903003 QUEST 100.0 76.9 26.957.026MULLIN ISD 167902001 MULLIN HIGH SCHOOL 90.0 86.4 30.559.059ECTOR COUNTY ISD 68901002 ODESSA H S 84.0 42.9 76.661.02,713LAMESA ISD 58906001 LAMESA H S 91.0 59.2 77.862.0436BAIRD ISD 30903001 BAIRD H S 92.0 57.7 16.562.097MENARD ISD 164901001 MENARD H S 89.0 4.1 61.963.097CENTER POINT ISD 133901001 CENTER POINT H S 83.0 60.9 36.764.0169CROCKETT COUNTY CONS 53001001 OZONA H S 92.0 39.3 76.864.0211FORT STOCKTON ISD 186902001 FORT STOCKTON HIGH SCHOOL 93.0 58.0 82.464.0654CHEROKEE ISD 206903001 CHEROKEE H S 91.0 60.3 19.866.0121MIDLAND ISD 165901042 LEE FRESHMAN HIGH SCHOOL 91.0 46.5 61.566.0694BIG SPRING ISD 114901001 BIG SPRING H S 92.0 50.3 64.668.0974REAGAN COUNTY ISD 192901001 REAGAN COUNTY H S 90.0 41.3 65.869.0196SWEETWATER ISD 177902001 SWEETWATER H S 94.0 47.4 45.869.0553MIDLAND ISD 165901044 MIDLAND FRESHMAN HIGH SCHOOL 91.0 48.9 62.770.0710RANGER ISD 67907001 RANGER H S 87.0 64.2 17.471.0109MARBLE FALLS ISD 27904001 MARBLE FALLS HIGH SCHOOL 91.0 48.4 37.871.01,065SAN ANGELO ISD 226903002 LAKE VIEW H S 85.0 66.1 69.172.01,163TAHOKA ISD 153904001 TAHOKA H S 85.0 48.8 59.972.0162SAN FELIPE‐DEL RIO CISD 233901002 DEL RIO FRESHMAN SCHOOL 89.0 73.8 93.872.0837MIDLAND ISD 165901003 MIDLAND H S 85.0 34.9 61.773.02,164
461.8 85.2 60.0 56.753.1AVERAGE
Source Data25Page
B.2.dAEISPACE 2011

District Name Campus Code Campus Name
Achieving30 Highest‐ Middle Schools inMathematics
% PassRead
% StudentsEco Disadv
% StudentsMinority
% PassMathEnrollment
Angelo State University2010
Student Achievement Trends in the Proximal Zone of Professional Impact
Table 3:
HARPER ISD 86902041 HARPER MIDDLE 97.0 38.0 12.798.0150WYLIE ISD 221912041 WYLIE J H 98.0 12.8 18.197.0759SCHLEICHER ISD 207901041 ELDORADO MIDDLE 92.0 62.1 63.897.0177WALL ISD 226906041 WALL MIDDLE 98.0 17.5 15.996.0252EARLY ISD 25909041 EARLY MIDDLE 93.0 41.2 23.596.0289MASON ISD 157901041 MASON J H 97.0 58.5 35.995.0217BAIRD ISD 30903041 BAIRD MIDDLE SCHOOL 90.0 64.7 17.695.068GOLDTHWAITE ISD 167901002 GOLDTHWAITE MIDDLE SCHOOL 90.0 45.0 28.295.0131BRECKENRIDGE ISD 215901041 BRECKENRIDGE J H 95.0 60.2 35.294.0216KERRVILLE ISD 133903041 PETERSON MIDDLE 95.0 50.2 44.294.0703JOHNSON CITY ISD 16901041 LYNDON B JOHNSON MIDDLE 93.0 38.1 26.793.0210KERRVILLE ISD 133903104 B T WILSON SIXTH GRADE SCHOOL 93.0 54.4 47.893.0318STAMFORD ISD 127906041 STAMFORD MIDDLE SCHOOL 93.0 68.3 61.893.0123COPPERAS COVE ISD 50910104 C R CLEMENTS INT 92.0 47.1 48.593.0859EASTLAND ISD 67903041 EASTLAND MIDDLE 94.0 49.0 20.292.0243COPPERAS COVE ISD 50910041 COPPERAS COVE J H 93.0 46.5 44.792.0781TERRELL COUNTY ISD 222901041 SANDERSON J H 100.0 43.2 51.491.037ROTAN ISD 76904041 ROTAN J H 96.0 58.7 49.291.063COPPERAS COVE ISD 50910042 S C LEE J H 94.0 39.6 48.391.0846STEPHENVILLE 72903041 STEPHENVILLE J H 94.0 43.4 25.791.0518ABILENE ISD 221901048 BYRON CRAIG MIDDLE 91.0 68.5 63.291.0906CISCO ISD 67902041 CISCO J H 95.0 57.8 15.590.0187HAMILTON ISD 97902041 HAMILTON JUNIOR HIGH SCHOOL 94.0 51.0 16.590.0200LLANO ISD 150901041 LLANO JUNIOR HIGH 93.0 57.6 18.490.0441JIM NED CISD 221911041 JIM NED MIDDLE 92.0 30.3 10.090.0241STEPHENVILLE 72903103 GILBERT INTERMEDIATE SCHOOL 91.0 47.4 27.090.0492GREENWOOD ISD 165902041 JAMES R BROOKS MIDDLE SCHOOL 96.0 29.6 34.489.0250COPPERAS COVE ISD 50910107 LOVETT LEDGER INT 92.0 52.2 48.989.0978BROWNWOOD ISD 25902108 BROWNWOOD INT 90.0 65.9 46.689.0528MONAHANS‐WICKETT‐PY 238902041 WALKER J H 90.0 45.4 59.189.0291
382.5 93.7 48.1 35.392.5AVERAGE
Source Data26Page
B.2.dAEISPACE 2011

District Name Campus Code Campus Name
Achieving30 Lowest‐ Middle Schools inMathematics
% PassRead
% StudentsEco Disadv
% StudentsMinority
% PassMathEnrollment
Angelo State University2010
Student Achievement Trends in the Proximal Zone of Professional Impact
Table 4:
ECTOR COUNTY ISD 68901045 HOOD J H 80.0 56.9 64.660.0596REAGAN COUNTY ISD 192901041 REAGAN COUNTY MIDDLE 86.0 59.5 75.764.0185BIG SPRING ISD 114901043 BIG SPRING JUNIOR HIGH 81.0 62.9 68.865.0529ECTOR COUNTY ISD 68901047 ECTOR J H 85.0 61.8 82.468.01,467BIG SPRING ISD 114901041 GOLIAD INTERMEDIATE SCHOOL 82.0 70.0 69.870.0580ECTOR COUNTY ISD 68901044 CROCKETT J H 82.0 67.9 80.771.0742BALLINGER ISD 200901041 BALLINGER J H 89.0 56.6 46.772.0242LAMESA ISD 58906041 LAMESA MIDDLE 85.0 77.0 80.274.0409FORT STOCKTON ISD 186902041 FORT STOCKTON MIDDLE SCHOOL 82.0 68.4 85.275.0494MCCAMEY ISD 231901041 MCCAMEY MIDDLE 85.0 57.6 68.175.0144KNOX CITY‐O'BRIEN CISD 138902041 O'BRIEN MIDDLE 88.0 69.5 46.375.082O'DONNELL ISD 153903041 O'DONNELL J H 90.0 78.6 75.775.070ECTOR COUNTY ISD 68901046 NIMITZ J H 91.0 35.2 57.675.0992RADIANCE ACADEMY OF L 15815041 RADIANCE ACADEMY OF LEARNING (DEL 94.0 59.4 86.375.0175SAN FELIPE‐DEL RIO CISD 233901043 DEL RIO MIDDLE SCHOOL 83.0 75.5 93.676.01,480HASKELL CISD 104901041 ROCHESTER J H 89.0 77.2 49.676.0123RANGER ISD 67907041 RANGER MIDDLE SCHOOL 90.0 76.9 17.376.0104POST ISD 85902041 POST MIDDLE 85.0 63.2 63.277.0171STANTON ISD 156902041 STANTON MIDDLE 86.0 56.5 58.977.0168MERKEL ISD 221904041 MERKEL MIDDLE 87.0 51.5 18.777.0241MIDLAND ISD 165901045 SAN JACINTO JUNIOR HIGH 87.0 53.6 66.577.0687EULA ISD 30906041 EULA MIDDLE 90.0 47.7 13.677.044GRAPE CREEK ISD 226907041 GRAPE CREEK MIDDLE 85.0 71.1 37.878.0225DUBLIN ISD 72902041 DUBLIN MIDDLE 86.0 72.8 54.778.0265CRANE ISD 52901041 CRANE MIDDLE SCHOOL 87.0 45.9 69.978.0209SAN FELIPE‐DEL RIO CISD 233901104 SAN FELIPE MEMORIAL MIDDLE SCHOOL 82.0 77.9 92.479.0734COLEMAN ISD 42901041 COLEMAN J H 84.0 61.9 26.179.0226MIDLAND ISD 165901046 GODDARD JUNIOR HIGH 88.0 50.8 61.779.0845ECTOR COUNTY ISD 68901042 BONHAM J H 92.0 41.8 59.679.01,020DE LEON ISD 47902041 PERKINS MIDDLE 95.0 58.5 36.279.094
444.8 86.5 62.1 60.374.5AVERAGE
Source Data27
B.2.dAEISPagePACE 2011

District Name Campus Code Campus Name
Achieving30 Highest‐ Elementary Schools inMathematics
% PassRead
% StudentsEco Disadv
% StudentsMinority
% PassMathEnrollment
Angelo State University2010
Student Achievement Trends in the Proximal Zone of Professional Impact
Table 5:
DIVIDE ISD 133905101 DIVIDE EL 100.0 0.0 28.6100.028ECTOR COUNTY ISD 68901118 EL MAGNET AT REAGAN EL 100.0 19.1 57.9100.0658HARPER ISD 86902101 HARPER EL 99.0 46.1 16.1100.0254WALL ISD 226906101 WALL EL 99.0 18.1 17.8100.0443FREDERICKSBURG ISD 86901103 STONEWALL EL 98.0 34.0 17.0100.0100SWEETWATER ISD 177902104 SWEETWATER INTERMEDIATE SCHOOL 95.0 65.0 57.6100.0311ROTAN ISD 76904101 ROTAN EL 94.0 72.4 51.3100.0156BROWNWOOD ISD 25902107 WOODLAND HEIGHTS EL 100.0 55.8 31.099.0468SAN ANGELO ISD 226903120 SANTA RITA EL 99.0 43.7 35.299.0389MASON ISD 157901101 MASON ELEMENTARY SCHOOL 98.0 63.8 37.699.0279WYLIE ISD 221912101 WYLIE EL 98.0 19.6 20.699.0714WYLIE ISD 221912103 WYLIE INT 98.0 17.6 18.899.0756CHRISTOVAL ISD 226901101 CHRISTOVAL EL 97.0 21.7 16.099.0175MORGAN MILL ISD 72910101 MORGAN MILL EL 90.0 46.6 8.799.0103JIM NED CISD 221911101 LAWN EL 99.0 46.3 6.698.0242SWEETWATER ISD 177902102 EAST RIDGE EL 99.0 60.5 47.798.0392KERRVILLE ISD 133903103 NIMITZ EL 98.0 61.0 47.198.0510KERRVILLE ISD 133903102 STARKEY EL 98.0 50.4 51.798.0542RISING STAR ISD 67908101 RISING STAR EL 98.0 75.6 15.398.0131VERIBEST ISD 226908101 VERIBEST EL 98.0 46.2 31.998.0119SAN ANGELO ISD 226903115 MCGILL EL 98.0 71.6 65.697.0285STAMFORD ISD 127906101 OLIVER EL 98.0 79.5 59.197.0337FORSAN ISD 114904101 FORSAN ELEMENTARY AT ELBOW 97.0 36.0 29.297.0322KERRVILLE ISD 133903101 DANIELS EL 97.0 63.9 54.697.0599KERRVILLE ISD 133903109 FRED H TALLY ELEMENTARY 97.0 51.5 48.697.0551ALBANY ISD 209901101 NANCY SMITH EL 96.0 44.3 19.397.0264IRION COUNTY ISD 118902101 IRION EL 95.0 39.6 28.697.0154JOHNSON CITY ISD 16901101 LYNDON B JOHNSON EL 95.0 47.9 34.897.0267SAN ANGELO ISD 226903122 BONHAM EL 95.0 29.2 34.197.0493SAN FELIPE‐DEL RIO CISD 233901111 RUBEN CHAVIRA ELEMENTARY 95.0 75.0 88.097.0535
352.6 97.3 46.7 35.998.4AVERAGE
Source Data28
B.2.dAEISPagePACE 2011

District Name Campus Code Campus Name
Achieving30 Lowest‐ Elementary Schools inMathematics
% PassRead
% StudentsEco Disadv
% StudentsMinority
% PassMathEnrollment
Angelo State University2010
Student Achievement Trends in the Proximal Zone of Professional Impact
Table 6:
BIG SPRING ISD 114901102 BAUER EL 73.0 77.1 79.744.0306MIDLAND ISD 165901118 TRAVIS ELEMENTARY 61.0 84.5 87.552.0534MONAHANS‐WICKETT‐PY 238902108 TATOM EL 73.0 64.9 69.157.0453MIDLAND ISD 165901105 CR0CKETT ELEMENTARY 77.0 89.1 98.159.0469MIDLAND ISD 165901113 MILAM ELEMENTARY 65.0 84.8 94.260.0446BIG SPRING ISD 114901108 KENTWOOD EL 77.0 49.2 51.363.0199BIG SPRING ISD 114901113 WASHINGTON EL 78.0 77.7 71.363.0394MIDLAND ISD 165901117 SOUTH ELEMENTARY 72.0 85.7 97.765.0442EDEN CISD 48901101 EDEN EL 92.0 61.1 49.766.0149MIDLAND ISD 165901104 BURNET ELEMENTARY 73.0 78.9 78.569.0558MIDLAND ISD 165901101 BONHAM ELEMENTARY 78.0 60.0 68.169.0570SAN FELIPE‐DEL RIO CISD 233901106 LAMAR EL 66.0 93.8 98.970.0529GRAPE CREEK ISD 226907101 GRAPE CREEK ELEMENTARY 81.0 70.7 43.570.0549BROOKESMITH ISD 25908101 BROOKESMITH EL 93.0 51.5 23.570.0132REAGAN COUNTY ISD 192901101 REAGAN COUNTY ELEMENTARY 70.0 66.7 82.871.0390MIDLAND ISD 165901106 DE ZAVALA ELEMENTARY 71.0 87.9 98.071.0404DUBLIN ISD 72902101 DUBLIN EL 78.0 76.1 58.671.0377DUBLIN ISD 72902102 DUBLIN INTERMEDIATE 78.0 72.8 53.871.0316KNOX CITY‐O'BRIEN CISD 138902101 KNOX CITY EL 86.0 76.7 50.071.0146WINTERS ISD 200904101 WINTERS EL 88.0 71.4 56.671.0364RANKIN ISD 231902101 JAMES D GOSSETT EL 76.0 63.5 45.972.0159ECTOR COUNTY ISD 68901110 GOLIAD EL 77.0 87.2 70.872.0627LAMESA ISD 58906103 NORTH EL 81.0 77.2 80.472.0464LAMESA ISD 58906105 SOUTH EL 81.0 81.2 82.372.0600FORT STOCKTON ISD 186902102 ALAMO ELEMENTARY 85.0 75.9 85.572.0490BIG SPRING ISD 114901110 MARCY EL 75.0 73.3 70.473.0520MIDLAND ISD 165901111 LAMAR ELEMENTARY 78.0 82.4 84.073.0438ECTOR COUNTY ISD 68901107 DOWLING EL 81.0 76.2 76.573.0694ECTOR COUNTY ISD 68901126 MURRY FLY EL 81.0 78.1 76.473.0771SANTA ANNA ISD 42903101 SANTA ANNA EL 85.0 76.8 37.773.0151
421.4 77.7 75.1 70.767.6AVERAGE
Source Data29Page
B.2.dAEISPACE 2011

District Name Campus Code Campus Name
Achieving30 Highest‐ High Schools inReading
% PassMath
% StudentsEco Disadv
% StudentsMinority
% PassReadEnrollment
Angelo State University2010
Student Achievement Trends in the Proximal Zone of Professional Impact
Table 1:
IRAAN‐SHEFFIELD ISD 186903002 T Y C SHEFFIELD CAMPUS 100.0 100.0 49.4100.083STERLING CITY ISD 216901001 STERLING CITY H S 88.0 32.3 51.6100.062ROBY CISD 76903001 ROBY H S 85.0 54.1 29.6100.098BURNET CISD 27903003 QUEST 57.0 76.9 26.9100.026IRAAN‐SHEFFIELD ISD 186903001 IRAAN H S 90.0 20.0 48.899.0125STAMFORD ISD 127906001 STAMFORD HIGH SCHOOL 87.0 64.1 53.699.0181HASKELL CISD 104901001 HASKELL H S 81.0 58.1 35.899.0179IRION COUNTY ISD 118902001 IRION H S 95.0 39.8 36.598.0181WYLIE ISD 221912001 WYLIE H S 94.0 7.1 16.198.0942EARLY ISD 25909001 EARLY H S 90.0 33.6 14.198.0354ASPERMONT ISD 217901001 ASPERMONT HS 86.0 31.0 23.098.087BLANKET ISD 25904001 BLANKET H S 85.0 56.7 41.898.067KNOX CITY‐O'BRIEN CISD 138902001 KNOX CITY H S 82.0 62.3 53.698.069BALLINGER ISD 200901001 BALLINGER H S 79.0 43.8 39.798.0297MASON ISD 157901001 MASON H S 97.0 58.2 39.797.0184ZEPHYR ISD 25906001 ZEPHYR H S 94.0 45.6 5.697.090CISCO ISD 67902001 CISCO H S 93.0 50.7 17.597.0229GOLDTHWAITE ISD 167901001 GOLDTHWAITE HIGH SCHOOL 89.0 41.3 26.797.0172KERRVILLE ISD 133903001 TIVY H S 86.0 38.6 41.897.01,348CROSS PLAINS ISD 30901001 CROSS PLAINS H S 85.0 45.3 5.397.0150HAMILTON ISD 97902001 HAMILTON HIGH SCHOOL 85.0 45.1 13.097.0253LLANO ISD 150901001 LLANO H S 85.0 43.5 18.997.0513HAWLEY ISD 127904001 HAWLEY H S 84.0 46.3 10.697.0227EULA ISD 30906001 EULA H S 83.0 42.9 15.297.0112SAN SABA ISD 206901001 SAN SABA H S 76.0 43.3 41.897.0201WALL ISD 226906001 WALL H S 95.0 16.2 18.796.0321HARPER ISD 86902001 HARPER H S 94.0 35.0 20.296.0223COMANCHE ISD 47901001 COMANCHE H S 87.0 58.8 40.296.0328ROBERT LEE ISD 41902001 ROBERT LEE H S 86.0 50.5 36.696.0101THROCKMORTON ISD 224901001 THROCKMORTON H S 85.0 50.0 12.996.070
242.4 86.8 46.4 29.597.7AVERAGE
Source Data30Page
B.2.eAEISPACE 2011

District Name Campus Code Campus Name
Achieving30 Lowest‐ High Schools inReading
% PassMath
% StudentsEco Disadv
% StudentsMinority
% PassReadEnrollment
Angelo State University2010
Student Achievement Trends in the Proximal Zone of Professional Impact
Table 2:
SNYDER ISD 208902002 HOBBS ALTER ED CO‐OP 0.0 73.3 66.733.015COPPERAS COVE ISD 50910005 CROSSROADS HIGH SCHOOL 45.0 46.4 40.662.069CISCO ISD 67902004 CISCO LEARNING CENTER 25.0 85.4 68.373.041SWEETWATER ISD 177902003 HOBBS ALTER ED CO‐OP 0.0 81.1 62.275.037ABILENE ISD 221901003 WOODSON CENTER FOR EXCELLENCE 29.0 75.7 68.077.0222CENTER POINT ISD 133901001 CENTER POINT H S 64.0 60.9 36.783.0169ECTOR COUNTY ISD 68901002 ODESSA H S 61.0 42.9 76.684.02,713SANTA ANNA ISD 42903001 SANTA ANNA SECONDARY 80.0 67.0 33.084.0112IRAAN‐SHEFFIELD ISD 186903004 PYOTE HS 0.0 100.0 76.785.043BROWNWOOD ISD 25902003 BROWNWOOD ACCELERATED H S 23.0 79.5 51.385.039SAN ANGELO ISD 226903002 LAKE VIEW H S 72.0 66.1 69.185.01,163TAHOKA ISD 153904001 TAHOKA H S 72.0 48.8 59.985.0162MIDLAND ISD 165901003 MIDLAND H S 73.0 34.9 61.785.02,164HAMLIN ISD 127903001 HAMLIN H S 77.0 51.1 43.286.0139RANGER ISD 67907001 RANGER H S 71.0 64.2 17.487.0109EVANT ISD 50901001 EVANT H S 81.0 56.9 19.087.0116RISING STAR ISD 67908001 RISING STAR H S 75.0 59.8 16.588.097COLEMAN ISD 42901001 COLEMAN H S 78.0 44.5 34.788.0274ROTAN ISD 76904001 ROTAN H S 78.0 58.6 45.788.0116ANDREWS ISD 2901001 ANDREWS HIGH SCHOOL 81.0 28.5 60.788.0873LUEDERS‐AVOCA ISD 127905001 LUEDERS‐AVOCA H S 94.0 60.0 5.788.035MENARD ISD 164901001 MENARD H S 63.0 4.1 61.989.097SAN FELIPE‐DEL RIO CISD 233901002 DEL RIO FRESHMAN SCHOOL 72.0 73.8 93.889.0837ECTOR COUNTY ISD 68901003 PERMIAN H S 73.0 29.8 59.489.02,322EASTLAND ISD 67903001 EASTLAND H S 78.0 34.5 24.889.0307JOHNSON CITY ISD 16901001 LYNDON B JOHNSON H S 79.0 34.7 27.289.0202POST ISD 85902001 POST H S 84.0 43.6 52.389.0220COLORADO ISD 168901003 WALLACE ACCELERATED H S 30.0 90.6 40.690.032MIDLAND ISD 165901004 VIOLA M COLEMAN H S 47.0 51.0 81.490.0145MULLIN ISD 167902001 MULLIN HIGH SCHOOL 59.0 86.4 30.590.059
431.0 58.8 57.8 49.583.3AVERAGE
Source Data31Page
B.2.eAEISPACE 2011
District Name Campus Code Campus Name
Achieving30 Highest‐ Middle Schools inReading
% PassMath
% StudentsEco Disadv
% StudentsMinority
% PassReadEnrollment
Angelo State University2010
Student Achievement Trends in the Proximal Zone of Professional Impact
Table 3:
TERRELL COUNTY ISD 222901041 SANDERSON J H 91.0 43.2 51.4100.037WYLIE ISD 221912041 WYLIE J H 97.0 12.8 18.198.0759WALL ISD 226906041 WALL MIDDLE 96.0 17.5 15.998.0252HARPER ISD 86902041 HARPER MIDDLE 98.0 38.0 12.797.0150MASON ISD 157901041 MASON J H 95.0 58.5 35.997.0217ROTAN ISD 76904041 ROTAN J H 91.0 58.7 49.296.063GREENWOOD ISD 165902041 JAMES R BROOKS MIDDLE SCHOOL 89.0 29.6 34.496.0250BRECKENRIDGE ISD 215901041 BRECKENRIDGE J H 94.0 60.2 35.295.0216KERRVILLE ISD 133903041 PETERSON MIDDLE 94.0 50.2 44.295.0703CISCO ISD 67902041 CISCO J H 90.0 57.8 15.595.0187ANSON ISD 127901041 ANSON MIDDLE 88.0 66.7 54.095.0150MENARD ISD 164901041 MENARD J H 88.0 1.4 51.495.074DE LEON ISD 47902041 PERKINS MIDDLE 79.0 58.5 36.295.094EASTLAND ISD 67903041 EASTLAND MIDDLE 92.0 49.0 20.294.0243COPPERAS COVE ISD 50910042 S C LEE J H 91.0 39.6 48.394.0846STEPHENVILLE 72903041 STEPHENVILLE J H 91.0 43.4 25.794.0518HAMILTON ISD 97902041 HAMILTON JUNIOR HIGH SCHOOL 90.0 51.0 16.594.0200BANGS ISD 25901041 BANGS MIDDLE SCHOOL 85.0 52.5 22.694.0337EARLY ISD 25909041 EARLY MIDDLE 96.0 41.2 23.593.0289JOHNSON CITY ISD 16901041 LYNDON B JOHNSON MIDDLE 93.0 38.1 26.793.0210KERRVILLE ISD 133903104 B T WILSON SIXTH GRADE SCHOOL 93.0 54.4 47.893.0318STAMFORD ISD 127906041 STAMFORD MIDDLE SCHOOL 93.0 68.3 61.893.0123COPPERAS COVE ISD 50910041 COPPERAS COVE J H 92.0 46.5 44.793.0781LLANO ISD 150901041 LLANO JUNIOR HIGH 90.0 57.6 18.493.0441IRAAN‐SHEFFIELD ISD 186903041 IRAAN J H 88.0 27.5 55.093.080BRACKETT ISD 136901041 BRACKETT JUNIOR HIGH 84.0 70.6 68.693.0102DE LEON ISD 47902042 DE LEON INTERMEDIATE 84.0 55.0 34.093.0100SWEETWATER ISD 177902041 SWEETWATER MIDDLE 84.0 58.7 47.693.0489SCHLEICHER ISD 207901041 ELDORADO MIDDLE 97.0 62.1 63.892.0177COPPERAS COVE ISD 50910104 C R CLEMENTS INT 93.0 47.1 48.592.0859
308.8 90.9 47.2 37.694.5AVERAGE
Source Data32Page
B.2.eAEISPACE 2011

District Name Campus Code Campus Name
Achieving30 Lowest‐ Middle Schools inReading
% PassMath
% StudentsEco Disadv
% StudentsMinority
% PassReadEnrollment
Angelo State University2010
Student Achievement Trends in the Proximal Zone of Professional Impact
Table 4:
ECTOR COUNTY ISD 68901045 HOOD J H 80.0 56.9 64.660.0596BIG SPRING ISD 114901043 BIG SPRING JUNIOR HIGH 81.0 62.9 68.865.0529BIG SPRING ISD 114901041 GOLIAD INTERMEDIATE SCHOOL 82.0 70.0 69.870.0580ECTOR COUNTY ISD 68901044 CROCKETT J H 82.0 67.9 80.771.0742FORT STOCKTON ISD 186902041 FORT STOCKTON MIDDLE SCHOOL 82.0 68.4 85.275.0494SAN FELIPE‐DEL RIO CISD 233901104 SAN FELIPE MEMORIAL MIDDLE SCHOOL 82.0 77.9 92.479.0734SAN FELIPE‐DEL RIO CISD 233901043 DEL RIO MIDDLE SCHOOL 83.0 75.5 93.676.01,480COLEMAN ISD 42901041 COLEMAN J H 84.0 61.9 26.179.0226HAWLEY ISD 127904041 HAWLEY MIDDLE 84.0 58.1 18.083.0172ANDREWS ISD 2901041 ANDREWS MIDDLE SCHOOL 84.0 45.4 63.386.0678ECTOR COUNTY ISD 68901047 ECTOR J H 85.0 61.8 82.468.01,467LAMESA ISD 58906041 LAMESA MIDDLE 85.0 77.0 80.274.0409MCCAMEY ISD 231901041 MCCAMEY MIDDLE 85.0 57.6 68.175.0144POST ISD 85902041 POST MIDDLE 85.0 63.2 63.277.0171GRAPE CREEK ISD 226907041 GRAPE CREEK MIDDLE 85.0 71.1 37.878.0225CENTER POINT ISD 133901041 CENTER POINT MIDDLE 85.0 66.4 41.082.0134REAGAN COUNTY ISD 192901041 REAGAN COUNTY MIDDLE 86.0 59.5 75.764.0185STANTON ISD 156902041 STANTON MIDDLE 86.0 56.5 58.977.0168DUBLIN ISD 72902041 DUBLIN MIDDLE 86.0 72.8 54.778.0265COLORADO ISD 168901041 COLORADO MIDDLE 86.0 65.5 57.480.0223MIDLAND ISD 165901041 ALAMO JUNIOR HIGH 86.0 58.4 71.180.0736SAN SABA ISD 206901041 SAN SABA MIDDLE SCHOOL 86.0 68.4 50.284.0209INGRAM ISD 133904041 INGRAM MIDDLE 86.0 62.8 40.689.0239MERKEL ISD 221904041 MERKEL MIDDLE 87.0 51.5 18.777.0241MIDLAND ISD 165901045 SAN JACINTO JUNIOR HIGH 87.0 53.6 66.577.0687CRANE ISD 52901041 CRANE MIDDLE SCHOOL 87.0 45.9 69.978.0209SAN ANGELO ISD 226903045 LINCOLN MIDDLE SCHOOL 87.0 76.6 68.880.0888SNYDER ISD 208902041 SNYDER J H 87.0 51.6 56.582.0550SONORA ISD 218901041 SONORA J H 87.0 55.7 69.585.0282KNOX CITY‐O'BRIEN CISD 138902041 O'BRIEN MIDDLE 88.0 69.5 46.375.082
458.2 76.8 63.0 61.384.9AVERAGE
Source Data33Page
B.2.eAEISPACE 2011

District Name Campus Code Campus Name
Achieving30 Highest‐ Elementary Schools inReading
% PassMath
% StudentsEco Disadv
% StudentsMinority
% PassReadEnrollment
Angelo State University2010
Student Achievement Trends in the Proximal Zone of Professional Impact
Table 5:
DIVIDE ISD 133905101 DIVIDE EL 100.0 0.0 28.6100.028ECTOR COUNTY ISD 68901118 EL MAGNET AT REAGAN EL 100.0 19.1 57.9100.0658BROWNWOOD ISD 25902107 WOODLAND HEIGHTS EL 99.0 55.8 31.0100.0468HARPER ISD 86902101 HARPER EL 100.0 46.1 16.199.0254WALL ISD 226906101 WALL EL 100.0 18.1 17.899.0443SAN ANGELO ISD 226903120 SANTA RITA EL 99.0 43.7 35.299.0389JIM NED CISD 221911101 LAWN EL 98.0 46.3 6.699.0242SWEETWATER ISD 177902102 EAST RIDGE EL 98.0 60.5 47.799.0392FREDERICKSBURG ISD 86901103 STONEWALL EL 100.0 34.0 17.098.0100MASON ISD 157901101 MASON ELEMENTARY SCHOOL 99.0 63.8 37.698.0279WYLIE ISD 221912101 WYLIE EL 99.0 19.6 20.698.0714WYLIE ISD 221912103 WYLIE INT 99.0 17.6 18.898.0756KERRVILLE ISD 133903103 NIMITZ EL 98.0 61.0 47.198.0510KERRVILLE ISD 133903102 STARKEY EL 98.0 50.4 51.798.0542RISING STAR ISD 67908101 RISING STAR EL 98.0 75.6 15.398.0131VERIBEST ISD 226908101 VERIBEST EL 98.0 46.2 31.998.0119SAN ANGELO ISD 226903115 MCGILL EL 97.0 71.6 65.698.0285STAMFORD ISD 127906101 OLIVER EL 97.0 79.5 59.198.0337BANGS ISD 25901101 J B STEPHENS EL 93.0 64.4 28.198.0430BROWNWOOD ISD 25902109 EAST EL 80.0 67.0 41.498.0285CHRISTOVAL ISD 226901101 CHRISTOVAL EL 99.0 21.7 16.097.0175FORSAN ISD 114904101 FORSAN ELEMENTARY AT ELBOW 97.0 36.0 29.297.0322KERRVILLE ISD 133903101 DANIELS EL 97.0 63.9 54.697.0599KERRVILLE ISD 133903109 FRED H TALLY ELEMENTARY 97.0 51.5 48.697.0551ABILENE ISD 221901108 DYESS EL 96.0 46.6 41.897.0483ABILENE ISD 221901112 JACKSON EL 96.0 56.5 42.897.0547ABILENE ISD 221901150 WARD EL 95.0 45.2 43.397.0564COMANCHE ISD 47901101 COMANCHE ELEMENTARY 95.0 70.3 48.997.0401BANDERA ISD 10902102 HILL COUNTRY EL 93.0 50.5 29.797.0511FORT STOCKTON ISD 186902104 APACHE ELEMENTARY 91.0 76.0 87.197.0371
396.2 96.9 48.6 37.298.0AVERAGE
Source Data34Page
B.2.eAEISPACE 2011

District Name Campus Code Campus Name
Achieving30 Lowest‐ Elementary Schools inReading
% PassMath
% StudentsEco Disadv
% StudentsMinority
% PassReadEnrollment
Angelo State University2010
Student Achievement Trends in the Proximal Zone of Professional Impact
Table 6:
MIDLAND ISD 165901118 TRAVIS ELEMENTARY 52.0 84.5 87.561.0534MIDLAND ISD 165901113 MILAM ELEMENTARY 60.0 84.8 94.265.0446SAN FELIPE‐DEL RIO CISD 233901106 LAMAR EL 70.0 93.8 98.966.0529REAGAN COUNTY ISD 192901101 REAGAN COUNTY ELEMENTARY 71.0 66.7 82.870.0390MIDLAND ISD 165901106 DE ZAVALA ELEMENTARY 71.0 87.9 98.071.0404MIDLAND ISD 165901117 SOUTH ELEMENTARY 65.0 85.7 97.772.0442BIG SPRING ISD 114901102 BAUER EL 44.0 77.1 79.773.0306MONAHANS‐WICKETT‐PY 238902108 TATOM EL 57.0 64.9 69.173.0453MIDLAND ISD 165901104 BURNET ELEMENTARY 69.0 78.9 78.573.0558ABILENE ISD 221901120 REAGAN EL 74.0 86.6 73.573.0313PANTHER CREEK CISD 42905101 PANTHER CREEK EL 83.0 79.8 26.274.084BIG SPRING ISD 114901110 MARCY EL 73.0 73.3 70.475.0520RANKIN ISD 231902101 JAMES D GOSSETT EL 72.0 63.5 45.976.0159SAN ANGELO ISD 226903106 BRADFORD EL 80.0 91.8 77.176.0475MIDLAND ISD 165901105 CR0CKETT ELEMENTARY 59.0 89.1 98.177.0469BIG SPRING ISD 114901108 KENTWOOD EL 63.0 49.2 51.377.0199ECTOR COUNTY ISD 68901110 GOLIAD EL 72.0 87.2 70.877.0627ECTOR COUNTY ISD 68901122 EL MAGNET AT TRAVIS 78.0 82.1 84.077.0633SAN SABA ISD 206901101 SAN SABA EL 79.0 73.2 54.377.0269BIG SPRING ISD 114901113 WASHINGTON EL 63.0 77.7 71.378.0394MIDLAND ISD 165901101 BONHAM ELEMENTARY 69.0 60.0 68.178.0570DUBLIN ISD 72902101 DUBLIN EL 71.0 76.1 58.678.0377DUBLIN ISD 72902102 DUBLIN INTERMEDIATE 71.0 72.8 53.878.0316MIDLAND ISD 165901111 LAMAR ELEMENTARY 73.0 82.4 84.078.0438MIDLAND ISD 165901109 HOUSTON ELEMENTARY 74.0 60.8 65.580.0632DOSS CONSOLIDATED CSD 86024101 DOSS EL 80.0 0.0 15.080.020ECTOR COUNTY ISD 68901103 BURLESON EL 80.0 77.2 79.380.0588GRAPE CREEK ISD 226907101 GRAPE CREEK ELEMENTARY 70.0 70.7 43.581.0549LAMESA ISD 58906103 NORTH EL 72.0 77.2 80.481.0464LAMESA ISD 58906105 SOUTH EL 72.0 81.2 82.381.0600
425.3 69.6 74.5 71.375.2AVERAGE
Source Data35Page
B.2.eAEISPACE 2011

II. University and Teacher
Education Trends

C. University and Teacher
Production Reports

36
SECTION C: University and Teacher Production Reports
Section C provides data on the university production trends, university teacher and certificate production,
as well as data regarding other producers of teachers in the PZPI. Please see Section V in the Table of
Contents for a complete listing of data sources used to complete the Section C reports.
C.1: Five-Year University Production Trends.
This report shows five-year trend data (FY2006-2010) describing university enrollment, degrees
awarded and the number of teachers produced. An Undergraduate Teacher Production Ratio was
calculated by dividing the number of traditional undergraduates obtaining certification by the
total number of baccalaureate degrees awarded. The Teachers Produced by Pathway section
shows teacher production for all university pathways.
C.2: Teacher Production Trends for University Completers.
This analysis provides the total number of teachers produced from FY2000 through FY2010 for
all university pathways. Teacher production is defined as the total number of individuals
(unduplicated) receiving any type of teacher certification from a program during the complete
academic year (fiscal year) from September 1st through August 31
st. Thus, the 2010 production
counts include all individuals from all university pathways who obtained standard or
probationary certification from September 1, 2009 through August 31, 2010.
It is important to note that certification cohorts are not graduation cohorts. A program typically
graduates more individuals than those who actually obtain certification in that year. Individuals
often graduate and obtain certification in a subsequent academic year. Certification data are
based upon when the individual initially applies for certification. For example, a person can
complete a program in AY 2003, yet decide not to obtain certification until AY 2006. Such an
individual would be included in the 2006 certification cohort rather than the 2003 certification
cohort. TEA generally uses the date of the initial application as the date of certification.
The formula used to calculate the one-year change as a percent is: 2010-2009/2009 x100%. To
calculate the five-year percent change, data from years: 2005-2006, 2006-2007, 2007-2008,
2008-2009, 2009-2010 was used in the formula: 2010-2005/2005 x 100%.
C.3: Teacher Production by Race/Ethnicity.
This analysis provides the number and percentages of individuals obtaining certification by
race/ethnicity for FY2000 through FY2010. See C.2 for further information about certification
year. The race/ethnicity of the individual is self-reported.
C4: Initial Certification Production by Level.
This analysis shows initial standard certificate production broken down by level over a ten-year
period (2001-2010). The number of certificates is greater than the number of teachers produced
since many teachers obtain more than one certificate. A 5-year average certificate production is
calculated and when possible a 5-year change is calculated. An asterisk (*) in the 5-year change
column indicates the inability to calculate a 5-year change. See page 61 for a list of changes
made to this report from last year.
C.5: Other Producers of Teachers in the Proximal Zone of Professional Impact.
This report shows the ten-year production trends for other suppliers of teachers in the same PZPI
as the target university sorted from highest to lowest producer.

University Production
5‐Year Inc/Dec
Degrees Awarded (Spring of academic year)
Enrollment (Fall of fiscal year)
Total enrollment also includes doctoral level students.Total degrees awarded also includes doctoral level degrees.
Total number of traditional undergraduates certified divided by the total number of baccalaureate degrees awarded.12
4
Teachers Produced by Pathway (End of fiscal year)
Production Ratio
Angelo State University2006‐2010
Five‐Year University Production Trends
FY 2006 FY 2007 FY 2008 FY 2009 FY 2010
Program numbers may not add up to Total because of missing data.3
6,140 6,211 6,185 6,113 6,376Total 1 3.8%
5,589 5,729 5,718 5,592 5,767Undergraduate 3.2%
437 422 378 465 506Masters 15.8%
1,039 969 998 1,049 1,098Total 2 5.7%
791 760 785 782 816Baccalaureate Degrees 3.2%
20 8 17 11 15Mathematics ‐25.0%
35 38 34 37 40Biological Science 14.3%
8 12 14 14 14Physical Science 75.0%
157 137 143 169 157Masters 0.0%
195 180 180 164 156Total 3 ‐20.0%
0 0 0 0 0ACP Certified 0.0%
14 23 10 17 21Post‐Baccalaureate Certified 50.0%
181 157 170 147 135Traditional Undergraduate Certified ‐25.4%
22.9 20.7 21.7 18.8 16.5Undergraduate Teacher Production % % % % %4
Source Data37Page
C.1THECB Accountability System, PREP Online, ICUT,
IPEDS (Private Universities Only)PACE 2011

Total Teachers Produced by Fiscal YearTotal
1‐Year Change
5‐Year Change
Angelo State UniversityFY 2000‐2010
Teacher Production Trends for University Completers
2009‐2010 2005‐20102000 2001 2002 2003 2004 2005 2006 2007 2008 2009 2010
1
2No. of C
ompleters
Fiscal Year
0
200
400
600
800
1000
1200
2000 2001 2002 2003 2004 2005 2006 2007 2008 2009 2010
Post Bacc Standard
159 181 252 242 237 233 195 180 180 164 156 2,179 ‐4.9% ‐33.0%
1 Number of university completers is the unduplicated number of individuals obtaining standard or probational certification.2 Certificate year equals fiscal year (September 1 ‐ August 31).
Source Data38Page
C.2Teacher Certification Data, TEAPACE 2011

3-Year Change
5-Year Change
Angelo State UniversityFY 2000‐2010
Teacher Production by Race/Ethnicity
2007-2010 2005-2010
Fiscal Year
1
2000 2001 2002 2003 2004 2005 2006 2007 2008 2009 2010
2Num
ber
Fiscal Year
0
200
400
600
800
1000
1200
2000 2001 2002 2003 2004 2005 2006 2007 2008 2009 2010
White Unknown Other Hispanic African American
3African American 5 6 4 2 5 3 7 5 4 2 ‐5 ‐3
16Hispanic 16 39 42 41 38 37 38 33 30 27 ‐11 ‐11
0Other 1 2 2 1 1 0 0 1 0 2 2 1
0Unknown 2 1 0 2 1 2 1 1 2 0 0 0
140White 157 204 194 191 188 153 134 140 128 125 ‐9 ‐63
159 181 252 242 237 233 195 180 180 164 156TOTAL
Source Data39Page
C.3Teacher Certification Files, TEA
1 Race/ethnicity is self‐reported.2 Certification year equals fiscal year (September 1 ‐ August 31).
PACE 2011

Fiscal YearCertificate 5‐Year Average
5‐YearChange
Angelo State UniversityFY 2001‐2010
Initial Certification Production by Level 1
2001 2002 2003 2004 2005 2006 2007 2008 2009 2010 2006-2010 2005-2010
2
0.0%ESLALL LEVEL (K‐12)
3 0 0 0 0 0 0 0 0 0 0 0.057.1%Fine Arts 5 6 3 8 7 1 6 11 7 11 7.20.0%Foreign Language 0 0 0 0 0 0 0 0 0 0 0.0
PE/Health 0 0 2 10 22 42 39 32 25 17 31.0 ‐22.7%71.4%Special Education 0 0 0 7 7 14 10 16 16 12 13.611.1%SUBTOTAL 5 6 5 25 36 57 55 59 48 40 51.8
0.0%Bilingual GeneralistELEMENTARY (EC‐4 and EC‐6)
0 0 0 0 0 0 0 0 0 0 0.00.0%ESL 0 0 0 0 0 0 0 0 0 0 0.0
Generalist 0 0 4 95 118 97 83 88 86 76 86.0 ‐35.6%0.0%Special Education 0 0 0 0 0 0 0 0 0 0 0.03
SUBTOTAL 0 0 4 95 118 97 83 88 86 76 86.0 ‐35.6%
0.0%Bilingual GeneralistHIGH SCHOOL (6‐12 and 8‐12)
0 0 0 0 0 0 0 0 0 0 0.00.0%Career & Tech Education 4 0 0 0 0 0 0 0 0 0 0 0.0
12.5%English 9 15 11 13 8 6 10 9 6 9 8.00.0%ESL 3 0 0 0 0 0 0 0 0 0 0 0.0
Fine Arts 3 4 3 3 6 3 1 0 0 0 0.8 ‐100.0%Foreign Language 5 10 12 7 4 3 6 5 5 1 4.0 ‐75.0%Mathematics 7 15 11 7 14 9 5 8 7 5 6.8 ‐64.3%PE/Health 36 50 32 33 37 8 0 0 0 0 1.6 ‐100.0%
0.0%Science 12 14 18 8 7 4 5 3 6 7 5.016.7%Social Studies 13 14 13 8 6 5 5 7 7 7 6.20.0%Special Education 5 10 7 5 0 0 0 0 0 0 0.03
SUBTOTAL 90 132 107 84 82 38 32 32 31 29 32.4 ‐64.6%
0.0%Bilingual GeneralistMIDDLE SCHOOL (4‐8)
0 0 0 0 0 0 0 0 0 0 0.0English 0 0 0 2 2 5 5 3 0 1 2.8 ‐50.0%
0.0%ESL 3 0 0 0 0 0 0 0 0 0 0 0.00.0%Generalist 0 0 0 6 0 3 6 4 5 11 5.8
Mathematics 0 0 0 3 8 7 4 5 7 7 6.0 ‐12.5%100.0%Science 0 0 0 1 1 1 3 3 1 2 2.0100.0%Social Studies 0 0 0 0 1 1 1 0 1 2 1.091.7%SUBTOTAL 0 0 0 12 12 17 19 15 14 23 17.6
0.0%Bilingual GeneralistOTHER SUPPLEMENTALS
0 0 0 0 0 0 0 0 0 0 0.00.0%ESL 1 0 2 0 0 0 0 0 0 1 0.20.0%Special Education 0 0 0 0 1 7 2 1 0 1 2.2
100.0%SUBTOTAL 1 0 2 0 1 7 2 1 0 2 2.496TOTAL 138 118 216 249 216 191 195 179 170 190.2 ‐21.3 %
1 Individual candidates may receive multiple certificates.2 Certificate year equals fiscal year (Sept. 1 ‐ Aug. 31).3 For this analysis, endorsement and supplemental certificates are reported separately.4 Career and technical education includes the following certificates: Ag sciences and technology, health science technology, marketing education, trade and industrial education.
Source Data40Page
C.4Teacher Certification Files, TEAPACE 2011

Production Entity Total
Angelo State UniversityFY 2000‐2010
Other Producers of Teachers in the Proximal Zone of Professional Impact
2000 2001 2002 2003 2004 2005 2006 2007 2008 2009 2010
12
298 3,929318397350411412436458341277231Tarleton State University156 2,179164180180195233237242252181159Angelo State University131 1,674136111164148150241184145158106University of Texas - Permian Basin95 1,34510011192120114148143154139129Abilene Christian University
107 1,029103106689073798311311493Region 18 Education Service Center58 81458807755738081908973Hardin-Simmons University82 73275606478696373586050McMurry University43 55839364865595954634052Howard Payne University17 30421391930404737301311Schreiner University22 17822171414211315111910Region 14 Education Service Center0 00000000000Region 15 Education Service Center
1 Number of university completers is the unduplicated number of individuals obtaining standard or probational certification.2 Certificate year equals fiscal year (September 1 ‐ August 31).
1,009 12,7421,0361,1371,0761,2061,2441,4031,3701,2571,090914TOTAL
Source Data41Page
C.5Teacher Certification Files, TEA, AEISPACE 2011

D. Professional Impact Trend Reports

42
SECTION D: Professional Impact Trend Reports
Section D includes information regarding employment and district hiring patterns, concentration of university completers in the PZPI, as well as teacher retention and attrition data.
D.1 a-c: Teacher Hiring in the Proximal Zone of Professional Impact. This section consists of charts comparing school district hiring patterns to the supply of new teachers provided by a preparation program by subject area and school level in the PZPI. The category “Teachers Supplied” is defined as the number of newly-hired teacher Full Time Equivalents (FTEs) in the PZPI who obtained probationary or standard certification from the preparation program in FY2010 with no prior teaching experience. The category “District Hires” is defined as the number of newly-hired teacher Full Time Equivalents (FTEs) employed in the PZPI in AY 2010-2011. A hiring ratio was calculated to represent the impact of university teacher production in the PZPI. The data capture teachers new to the PZPI as well as any teacher increase due to increased student enrollment. Newly-hired teacher FTEs could come from a number of sources including teacher preparation programs, the reserve pool of teachers, out-of-state transfers, or teachers transferring in from another zone in Texas.
D.2: Percentage of Newly-Certified Teachers Employed Inside and Outside the Proximal Zone of Professional Impact. This analysis shows where the target university’s newly certified teachers, those obtaining a standard certificate with no prior teaching experience, are employed.
D.3: District Hiring Patterns of University-Prepared Teachers in the Proximal Zone of Professional Impact. Two charts provide information regarding the highest employing districts of the university’s teachers. The first chart provides information regarding teachers with a standard certificate in 2009-2010 from all university pathways. The second chart shows all target university-prepared teachers employed by a district from 1994-2010. See Attachment 3 to view full hiring pattern report.
D.4 a-c: Percentage of University Completers in the Proximal Zone of Professional Impact by Level. This set of analyses provides information about the percentage of Full Time Equivalents (FTEs) employed at a campus within the PZPI by level from the university preparation program since 1995. The first four columns provide the name of the district, campus code, percent of school students classified as economically disadvantaged, and campus name, respectively. The “# School FTEs” column shows the total number of FTEs for all teachers of record working at the campus. The “# Univ FTEs” column provides the total number of FTEs employed at that campus who obtained certification from the target university’s preparation program from 1995 through 2010. The “% Univ FTEs” column is the percentage of teacher FTEs at the campus in AY2010-2011 from the target university’s preparation program.
D.5: Comparison of Teacher Retention Trends. D.5.a: Five-Year Retention of First-Year Teachers. This table and corresponding graphic displays the 5-year teacher retention and attrition rates for individuals obtaining a standard or probationary certificate in 2005-2006 who became employed in a Texas public school in the 2006-2007 academic year with no prior teaching experience. The retention rate for FY 2007 is always 100% in each analysis because the analysis starts with all cohort members employed in Texas public schools in the 2006-2007 academic years. Retention has been broken down comparing the target university with CREATE public and private universities and profit and nonprofit ACPs.
D.5.b-d: University-Prepared Teacher Retention Compared to Retention of Other Teacher Preparation Providers by Level. These analyses further augment the 5-year retention trends by showing retention rates and 5-year attrition rates for high, middle, and elementary school level. Numbers less than 10 are not graphically represented.

High Schools
Subject Area English Total FTEsMathe‐matics
Science Social Studies
Foreign Language
Fine Arts PE / Health Computer Science
Voc / Bus Education
Special Education
Bilingual / ESL
Other Assign
Teacher Hiring in the Proximal Zone of Professional Impact
Angelo State University
Newly‐Hired Teachers in PZPI in FY 2010‐2011
Hiring Ra
tio
Subject Area
11.9
8.6
2.6
8.6
3.1
16.5
8.6
0
4.3
18.3
0.7
7.9
0
5
10
15
20
25
30
35
40
45
50
English Mathematics Science SocialStudies
ForeignLanguage
Fine Arts PE/Health ComputerScience
Voc/BusEducation
SpecialEducation
Other Total FTEs
3.9Teachers Supplied 3.8 1.0 2.4 0.5 1.7 2.4 0.0 1.0 3.9 0.0 0.1 20.61
32.9District Hires 44.0 38.2 27.8 16.1 10.3 28.0 1.2 23.5 21.3 0.0 14.1 259.22
1 Includes number of newly‐hired FTEs from university preparation programs who obtained standard or probationary certification in FY 2010 with no prior teaching experience.
2 The number of newly‐hired teacher FTEs in the PZPI in AY 2010‐2011.
3 Newly‐hired university FTEs divided by number of newly‐hired district FTEs in the PZPI.
11.9%Hiring Ratio 8.6% 2.6% 8.6% 3.1% 16.5% 8.6% 0.0% 4.3% 18.3% 0.0% 0.7% 7.9%3
Source Data43Page
D.1.aTeacher Assignment and Certification Files, TEAPACE 2011

Middle Schools
Subject Area English Total FTEsMathe‐matics
Science Social Studies
Foreign Language
Fine Arts PE / Health
Computer Science
Voc / Bus Education
Special Education
Bilingual / ESL
Other Assign
Self‐Contained
Teacher Hiring in the Proximal Zone of Professional Impact
Angelo State University
Newly‐Hired Teachers in PZPI in FY 2010‐2011
Hiring Ra
tio
Subject Area
0
7.1 7.4
3.95.7
0
2.81.3
0 0 0 0
9.1
4.3
0
5
10
15
20
25
30
35
40
45
50
Self‐Contained
English
Mathematics Science
SocialStudies
ForeignLanguage
Fine Arts PE/Health ComputerScience
Voc/BusEducation
SpecialEducation
ESL Other Total FTEs
Teachers Supplied 2.5 2.2 0.9 0.8 0.0 0.3 0.3 0.0 0.0 0.0 0.0 0.8 7.80.01
District Hires 35.0 29.7 22.8 14.0 3.9 10.9 22.6 0.6 2.9 20.8 2.7 8.8 181.56.82
1 Includes number of newly‐hired FTEs from university preparation programs who obtained standard or probationary certification in FY 2010 with no prior teaching experience.
2 The number of newly‐hired teacher FTEs in the PZPI in AY 2010‐2011.
3 Newly‐hired university FTEs divided by number of newly‐hired district FTEs in the PZPI.
7.1%Hiring Ratio 7.4% 3.9% 5.7% 0.0% 2.8% 1.3% 0.0% 0.0% 0.0% 0.0% 9.1% 4.3%0.0%3
Source Data44Page
D.1.bTeacher Assignment and Certification Files, TEAPACE 2011

Elementary Schools
Subject Area Non‐CoreSubjects
TotalFTEs
SpecialEducation
Bilingual/ESL
CoreSubjects
Angelo State University
Newly‐Hired Teachers in PZPI in FY 2010‐2011
Teacher Hiring in the Proximal Zone of Professional Impact
4 5
Hiring Ra
tio
Subject Area
8.2 9.1
5.3
0.4
7.5
0
5
10
15
20
25
30
35
40
45
50
Core Subjects Non‐Core Subjects Special Education Bilingual/ESL Total
5.2 2.0 0.1 28.621.4Teachers Supplied 1
56.9 37.6 27.4 383.0261.2District Hires 2
4 Core subjects are subjects that are TAKS tested.
5 Non‐core subjects are all subjects not TAKS tested.
1 Includes number of newly‐hired FTEs from university preparation programs who obtained standard or probationary certification in FY 2010 with no prior teaching experience.
2 The number of newly‐hired teacher FTEs in the PZPI in AY 2010‐2011.
3 Newly‐hired university FTEs divided by number of newly‐hired district FTEs in the PZPI.
9.1%Hiring Ratio 5.3% 0.4% 7.5%8.2%3
Source Data45Page
D.1.cTeacher Assignment and Certification Files, TEAPACE 2011

New Teachers Employed
% Change
Number Percent Number Percent Number Percent
Percentage of Newly‐Certified Teachers Employed Inside and Outsidethe Proximal Zone of Professional Impact
Angelo State University
2009‐2011
2009 2010 2011
2009 to 2011
Percen
t of New
Teachers Em
ploy
ed
Spring of Academic Year
65.4
84.778.8
34.6
15.321.2
0
20
40
60
80
100
2009 2010 2011
Not in the Zone In the Zone
In the Zone 83 65.4 83 84.7 67 78.8 13.4
Not in the Zone 44 34.6 15 15.3 18 21.2 ‐13.4
Total 127 100.0 98 100.0 85 100.0 0.0
Source Data46Page
D.2Teacher Assignment and Certification Files
TEAPACE 2011

All Teachers Certified
SAMPLE DOCUMENT: To view the Full Hiring Patterns Report Refer to Attachment 3
District Hiring Patterns of University‐Prepared Teachers in PZPI
Angelo State University2010‐2011
Teachers Newly‐Certified in FY 2009‐2010
1
Employing District% University Newly-
Certified Compared to New Teachers Employed
University-Prepared Employed by District in
2010-2011
New Teachers Employed by District in 2010-2011
MILES ISD 2 2 100.0PAINT ROCK ISD 1 1 100.0VERIBEST ISD 1 1 100.0GRAPE CREEK ISD 7 10 70.0WATER VALLEY ISD 2 3 66.7CHRISTOVAL ISD 3 5 60.0HERMLEIGH ISD 1 2 50.0REAGAN COUNTY ISD 2 4 50.0JUNCTION ISD 2 5 40.0SONORA ISD 2 5 40.0SAN ANGELO ISD 18 53 34.0HAWLEY ISD 1 3 33.3LOMETA ISD 1 3 33.3ROSCOE ISD 1 3 33.3WALL ISD 1 3 33.3
Employing District Percent of Univ-Prepared Teachers in District
University-Prepared (1995-2010) Employed by District
in 2010-2011
Total Teachers Employed by District in 2010-2011
CHRISTOVAL ISD 18 38 47.4GRAPE CREEK ISD 42 92 45.7VERIBEST ISD 10 22 45.5OLFEN ISD 4 9 44.4MILES ISD 18 41 43.9BLACKWELL CISD 9 22 40.9SAN ANGELO ISD 395 985 40.1NOVICE ISD 6 16 37.5WALL ISD 38 104 36.5STERLING CITY ISD 9 25 36.0IRION COUNTY ISD 11 32 34.4GLASSCOCK COUNTY ISD 8 25 32.0REAGAN COUNTY ISD 22 74 29.7SONORA ISD 24 87 27.6WATER VALLEY ISD 8 29 27.61. Includes standard certificates from all university pathways.
Source Data47Page
D.3Teacher Certification and Employment Files
TEAPACE 2011

District Name Campus Code Campus Name# SchFTEs
# UnivFTEs
% UnivFTEs
% School Econ Disadvantaged 2 3 4
Angelo State University2009‐2010
1Percentage of University Completers in High Schools in the Proximal Zone of Professional Impact
WALL ISD 226906005 FAIRVIEW ACCELERATED DAEP 1.2 1.1 96.50.0WALL ISD 226906002 FAIRVIEW ACCELERATED 4.7 3.1 66.761.5MILES ISD 200902001 MILES H S 20.2 9.6 47.437.4VERIBEST ISD 226908150 FAIRVIEW VOC TRAINING 0.1 0.1 42.550.0WALL ISD 226906001 WALL H S 32.0 13.1 41.016.2VERIBEST ISD 226908001 VERIBEST H S 12.0 4.9 40.456.1WATER VALLEY ISD 226905001 WATER VALLEY H S 13.7 5.4 39.335.9SAN ANGELO ISD 226903041 CENTRAL FRESHMAN CAMPUS 55.4 21.1 38.050.5STERLING CITY ISD 216901001 STERLING CITY H S 11.9 4.5 38.032.3GRAPE CREEK ISD 226907001 GRAPE CREEK H S 29.5 10.8 36.452.3GLASSCOCK COUNTY ISD 87901001 GLASSCOCK COUNTY H S 13.0 4.5 35.150.4SAN ANGELO ISD 226903002 LAKE VIEW H S 96.9 33.4 34.566.1IRION COUNTY ISD 118902001 IRION H S 18.7 6.0 32.139.8SAN ANGELO ISD 226903001 CENTRAL H S 143.7 42.3 29.542.4BRADY ISD 160901001 BRADY H S 38.2 10.8 28.149.4BURNET CISD 27903003 QUEST 3.5 0.8 23.276.9EDEN CISD 48901001 EDEN H S 13.7 3.0 21.855.8MCCAMEY ISD 231901001 MCCAMEY H S 17.4 3.7 21.542.0MENARD ISD 164901001 MENARD H S 13.7 2.7 19.84.1SCHLEICHER ISD 207901001 ELDORADO H S 22.8 4.4 19.450.6ROBERT LEE ISD 41902001 ROBERT LEE H S 14.0 2.5 18.050.5REAGAN COUNTY ISD 192901001 REAGAN COUNTY H S 28.0 5.0 17.841.3WINTERS ISD 200904001 WINTERS H S 20.0 3.4 17.254.8COAHOMA ISD 114902001 COAHOMA H S 25.3 3.7 14.824.7CROCKETT COUNTY CONSOLIDATED CS 53001001 OZONA H S 30.5 4.0 13.139.3RANGER ISD 67907001 RANGER H S 14.4 1.8 12.564.2HARPER ISD 86902001 HARPER H S 21.4 2.7 12.435.0
Listing includes both charter and public schools. Only the first 25 campuses are listed.Number of Full Time Equivalents (FTEs) employed by the school.Number of Full Time Equivalents (FTEs) employed by the school from the university.Percent of University FTEs employed by the school.
1234
Source Data48Page
D.4.aAEIS, TEAPACE 2011

1
Angelo State University2009‐2010
Percentage of University Completers in Middle Schools in the Proximal Zone of Professional Impact
District Name Campus Code Campus Name# SchFTEs
# UnivFTEs
% UnivFTEs
% School Econ Disadvantaged 2 3 4
SAN ANGELO ISD 226903045 LINCOLN MIDDLE SCHOOL 61.1 26.3 43.076.6SAN ANGELO ISD 226903042 GLENN MIDDLE SCHOOL 72.6 31.0 42.749.0SAN ANGELO ISD 226903043 LEE MIDDLE SCHOOL 73.4 29.5 40.258.6GRAPE CREEK ISD 226907041 GRAPE CREEK MIDDLE 19.8 7.6 38.271.1SONORA ISD 218901041 SONORA J H 27.2 9.0 33.155.7WALL ISD 226906041 WALL MIDDLE 22.2 6.9 31.117.5MCCAMEY ISD 231901041 MCCAMEY MIDDLE 12.6 3.3 26.057.6BALLINGER ISD 200901041 BALLINGER J H 21.8 5.6 25.756.6REAGAN COUNTY ISD 192901041 REAGAN COUNTY MIDDLE 16.3 3.9 23.659.5TERRELL COUNTY ISD 222901041 SANDERSON J H 4.5 1.0 22.243.2COLORADO ISD 168901041 COLORADO MIDDLE 26.2 5.7 21.965.5WINTERS ISD 200904041 WINTERS J H 7.2 1.4 19.254.9MENARD ISD 164901041 MENARD J H 7.8 1.3 16.51.4CROCKETT COUNTY CONSOLIDATED CS 53001041 OZONA MIDDLE 19.3 3.2 16.555.3SCHLEICHER ISD 207901041 ELDORADO MIDDLE 15.5 2.4 15.262.1HAMILTON ISD 97902041 HAMILTON JUNIOR HIGH SCHOOL 12.4 1.5 12.151.0BIG SPRING ISD 114901041 GOLIAD INTERMEDIATE SCHOOL 35.6 4.0 11.270.0SNYDER ISD 208902041 SNYDER J H 45.0 5.0 11.151.6MONAHANS‐WICKETT‐PYOTE ISD 238902041 WALKER J H 24.5 2.7 11.045.4COAHOMA ISD 114902041 COAHOMA J H 11.9 1.3 10.541.2MIDLAND ISD 165901045 SAN JACINTO JUNIOR HIGH 50.0 4.7 9.453.6BIG SPRING ISD 114901043 BIG SPRING JUNIOR HIGH 43.5 4.0 9.262.9HARPER ISD 86902041 HARPER MIDDLE 12.5 1.1 8.938.0IRAAN‐SHEFFIELD ISD 186903041 IRAAN J H 7.5 0.7 8.927.5ECTOR COUNTY ISD 68901044 CROCKETT J H 46.0 4.0 8.767.9ANSON ISD 127901041 ANSON MIDDLE 16.8 1.4 8.466.7JUNCTION ISD 134901041 JUNCTION MIDDLE 12.1 1.0 8.350.7
Listing includes both charter and public schools. Only the first 25 campuses are listed.Number of Full Time Equivalents (FTEs) employed by the school.Number of Full Time Equivalents (FTEs) employed by the school from the university.Percent of University FTEs employed by the school.
1234
Source Data49Page
D.4.bAEIS, TEAPACE 2011

Angelo State University2009‐2010
1Percentage of University Completers in Elementary Schools in the Proximal Zone of Professional Impact
District Name Campus Code Campus Name# SchFTEs
# UnivFTEs
% UnivFTEs
% School Econ Disadvantaged 2 3 4
SAN ANGELO ISD 226903114 HOLIMAN EL 23.2 16.0 69.057.8SAN ANGELO ISD 226903103 BELAIRE EL 26.2 15.0 57.376.8SAN ANGELO ISD 226903119 SAN JACINTO EL 29.6 16.5 55.790.6OLFEN ISD 200906101 OLFEN EL 9.0 5.0 55.680.6SAN ANGELO ISD 226903113 GOLIAD EL 36.7 19.7 53.776.8SAN ANGELO ISD 226903115 MCGILL EL 22.5 12.0 53.471.6SAN ANGELO ISD 226903105 BOWIE EL 29.8 15.0 50.343.0SAN ANGELO ISD 226903122 BONHAM EL 31.6 15.0 47.529.2SAN ANGELO ISD 226903101 ALTA LOMA EL 23.5 11.0 46.983.7GRAPE CREEK ISD 226907101 GRAPE CREEK ELEMENTARY 41.4 19.4 46.970.7SAN ANGELO ISD 226903111 FT CONCHO EL 24.2 11.0 45.470.7SAN ANGELO ISD 226903112 GLENMORE EL 29.4 13.0 44.268.2SAN ANGELO ISD 226903116 REAGAN EL 30.8 13.4 43.687.1SAN ANGELO ISD 226903106 BRADFORD EL 32.5 14.0 43.191.8SAN ANGELO ISD 226903102 AUSTIN EL 32.8 13.4 40.880.7MILES ISD 200902101 MILES EL 17.5 7.1 40.740.8VERIBEST ISD 226908101 VERIBEST EL 8.4 3.3 39.146.2WATER VALLEY ISD 226905101 WATER VALLEY EL 15.2 5.6 37.049.2EDEN CISD 48901101 EDEN EL 11.3 4.0 35.561.1WALL ISD 226906101 WALL EL 31.9 10.0 31.418.1BALLINGER ISD 200901101 BALLINGER ELEMENTARY 35.8 11.0 30.866.9CROCKETT COUNTY CONSOLIDATED CS 53001103 OZONA ELEMENTARY 33.8 10.4 30.871.1SONORA ISD 218901101 SONORA EL 35.4 10.8 30.665.5SWEETWATER ISD 177902105 SOUTHEAST EL 26.4 8.0 30.380.9IRION COUNTY ISD 118902101 IRION EL 13.3 4.0 30.139.6SAN ANGELO ISD 226903123 LAMAR ELEMENTARY 33.4 10.0 29.939.4ROBERT LEE ISD 41902101 ROBERT LEE EL 10.8 3.2 29.564.5
Listing includes both charter and public schools. Only the first 25 campuses are listed.Number of Full Time Equivalents (FTEs) employed by the school.Number of Full Time Equivalents (FTEs) employed by the school from the university.Percent of University FTEs employed by the school.
1234
Source Data50Page
D.4.cAEIS, TEAPACE 2011

Spring of Academic Year Retention Rate AttritionRate
Number Teachers
Entity/Organization
1,2
Angelo State University2007‐2011
Comparison of Teacher Retention TrendsFive‐Year Retention of First‐Year Teachers
2007 2008 2009 2010 2011
Percen
t Retaine
d
40
45
50
55
60
65
70
75
80
85
90
95
100
2007 2008 2009 2010 2011
Angelo State CREATE Private Universities CREATE Public Universities
For Profit ACPs Non‐Profit ACPs
100.0 97.2 93.5Angelo State 91.7 88.0108 12.0
100.0 93.4 88.8CREATE Public Universities 84.4 80.88429 19.2
100.0 94.9 87.8CREATE Private Universities 82.3 77.0474 23.0
100.0 89.0 82.5For Profit ACPs 76.9 72.94705 27.1
100.0 90.1 80.9Non-Profit ACPs 75.9 71.84304 28.2
100.0 91.6 85.3Total 80.4 76.518909 23.51 Includes teachers obtaining a standard or probationary certificate in 2005‐2006 with no prior teaching experience.Texas data only tracks public school employment.2
Source Data51Page
D.5.aTeacher Certification and Assignment Files, AEIS,
TEAPACE 2011

Spring of Academic Year Retention Rate AttritionRate
Number Teachers
Entity/Organization
High SchoolAngelo State University
2007‐2011
Comparison of Teacher Retention Trends
2007 2008 2009 2010 2011
1,2Five‐Year Retention of First‐Year Teachers by School LevelPe
rcen
t Retaine
d
40
45
50
55
60
65
70
75
80
85
90
95
100
2007 2008 2009 2010 2011
Angelo State CREATE Private Universities CREATE Public Universities
For Profit ACPs Non‐Profit ACPs
100.0 100.0 93.8Angelo State 96.9 87.532 12.5
100.0 90.1 84.7CREATE Public Universities 78.7 75.31856 24.7
100.0 94.8 85.3CREATE Private Universities 83.6 81.9116 18.1
100.0 86.7 78.9For Profit ACPs 72.3 67.71565 32.3
100.0 89.3 78.6Non-Profit ACPs 72.3 68.31097 31.7
100.0 89.2 81.5Total 75.2 71.44849 28.61 Includes teachers obtaining a standard or probationary certificate in 2005‐2006 with no prior teaching experience.Texas data only tracks public school employment.2
Source Data52Page
D.5.bTeacher Certification and Assignment Files, AEIS,
TEAPACE 2011

Spring of Academic Year Retention Rate AttritionRate
Number Teachers
Entity/Organization
Middle School
2007‐2011
Comparison of Teacher Retention Trends
Angelo State University
2007 2008 2009 2010 2011
1,2Five‐Year Retention of First‐Year Teachers by School LevelPe
rcen
t Retaine
d
40
45
50
55
60
65
70
75
80
85
90
95
100
2007 2008 2009 2010 2011
Angelo State CREATE Private Universities CREATE Public Universities
For Profit ACPs Non‐Profit ACPs
100.0 95.5 90.9Angelo State 86.4 81.822 18.2
100.0 93.6 88.5CREATE Public Universities 83.6 80.11652 19.9
100.0 95.5 90.1CREATE Private Universities 82.0 78.4111 21.6
100.0 90.1 84.4For Profit ACPs 79.3 76.41384 23.6
100.0 90.3 80.8Non-Profit ACPs 74.9 70.01159 30.0
100.0 91.6 85.2Total 79.8 76.14516 23.91 Includes teachers obtaining a standard or probationary certificate in 2005‐2006 with no prior teaching experience.Texas data only tracks public school employment.2
Source Data53Page
D.5.cTeacher Certification and Assignment Files, AEIS,
TEAPACE 2011

Spring of Academic Year Retention Rate AttritionRate
Number Teachers
Entity/Organization
Elementary School
2007‐2011
Comparison of Teacher Retention Trends
Angelo State University
2007 2008 2009 2010 2011
1,2Five‐Year Retention of First‐Year Teachers by School LevelPe
rcen
t Retaine
d
40
45
50
55
60
65
70
75
80
85
90
95
100
2007 2008 2009 2010 2011
Angelo State CREATE Private Universities CREATE Public Universities
For Profit ACPs Non‐Profit ACPs
100.0 96.0 94.0Angelo State 90.0 92.050 8.0
100.0 94.8 90.8CREATE Public Universities 87.4 83.74731 16.3
100.0 94.9 88.5CREATE Private Universities 81.7 74.0235 26.0
100.0 90.6 84.7For Profit ACPs 79.6 75.51622 24.5
100.0 91.1 82.6Non-Profit ACPs 79.0 75.41887 24.6
100.0 93.2 87.8Total 83.9 80.09006 20.01 Includes teachers obtaining a standard or probationary certificate in 2005‐2006 with no prior teaching experience.Texas data only tracks public school employment.2
Source Data54Page
D.5.dTeacher Certification and Assignment Files, AEIS,
TEAPACE 2011
III. University Benchmarks to
Guide Improvement

E. University Comparison Reports

55
SECTION E: University Comparison Reports
Section E contains comparison information among universities regarding teacher and certificate production, and teacher retention. Comparison universities were systematically selected for a target university by choosing the two closest universities in proximity to the target university. The data associated with each university represents that university’s Proximal Zone of Professional Impact. If there were more than two universities in the target university’s PZPI, the two having the highest correlation based on student enrollment in the PZPI were chosen as the comparison universities. When there were no universities in the PZPI, the panel of PACE committee members used professional judgment to determine the comparison universities. E.1: Comparison of Teacher Production in Nearby Geographic Area. This analysis describes teacher production over a 10-year time period between the target university and the comparisons. The 10-year total production data is graphically represented. E.2: Five-Year Production Ratios of Consortium Universities. This report compares the ratio of teacher production to baccalaureate degrees awarded of all CREATE consortium members from 2006-20010 by quintiles. E.3: Comparison of Longitudinal Certificate Production Trends. The data for this comparison come from individual university data found in C.4. E.4: Teacher Retention Comparison. The data for this comparison includes only teachers who obtained a standard certificate in FY2005-2006 who became employed in a Texas public school in AY2006-2007 with no prior teaching experience. The data in this comparison does not include individuals who have obtained a probationary certificate and should not be compared to data found in report D.5.a. The attrition rate is calculated by subtracting the 2010 retention rate from 100%.
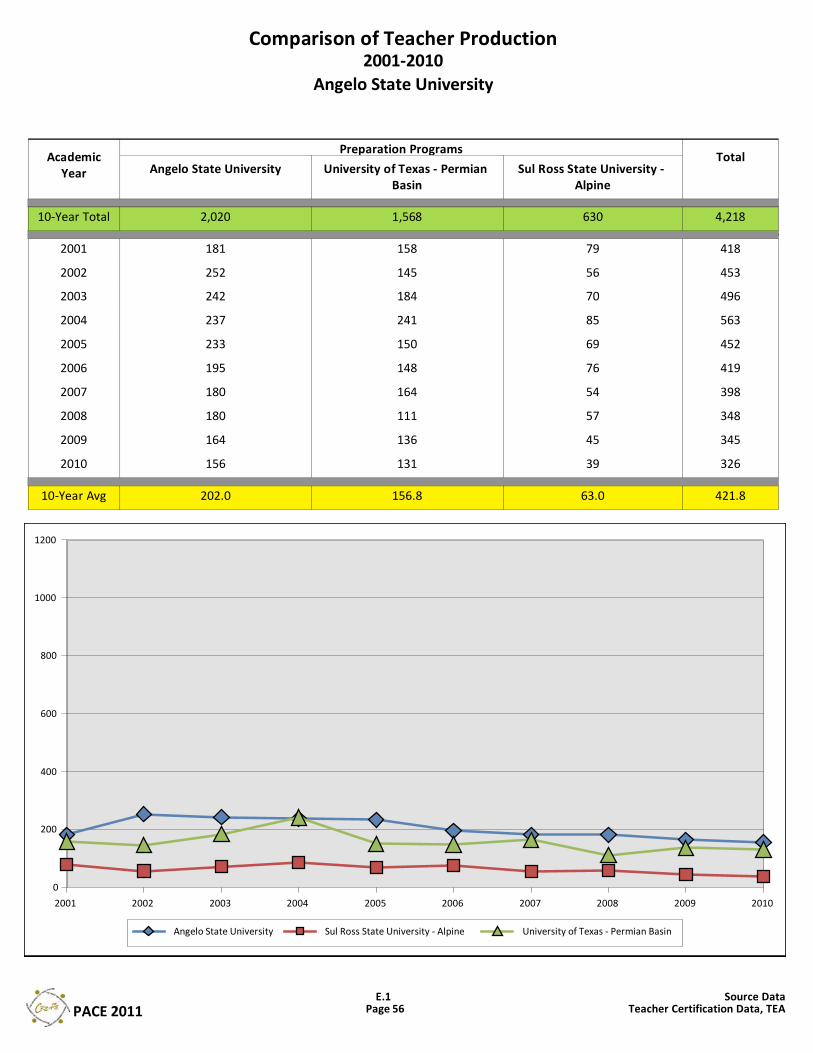
AcademicYear
TotalPreparation Programs
Angelo State University2001‐2010
Comparison of Teacher Production
Angelo State University University of Texas ‐ Permian Basin
Sul Ross State University ‐ Alpine
2,020 1,568 63010‐Year Total 4,218
181 158 792001 418
252 145 562002 453
242 184 702003 496
237 241 852004 563
233 150 692005 452
195 148 762006 419
180 164 542007 398
180 111 572008 348
164 136 452009 345
156 131 392010 326
202.0 156.8 63.010‐Year Avg 421.8
0
200
400
600
800
1000
1200
2001 2002 2003 2004 2005 2006 2007 2008 2009 2010
Angelo State University Sul Ross State University ‐ Alpine University of Texas ‐ Permian Basin
Source Data56Page
E.1Teacher Certification Data, TEAPACE 2011

Five‐Year Production Ratios of Consortium Universities
2006‐2010Percentage of Total Teacher Production Compared to Baccalaureate Degrees Awarded1
5‐Year Trend
FY 2006 FY 2007 FY 2008 FY 2009 FY 2010
Quintile 1
Quintile 2
Quintile 3
Texas A&M University ‐ Commerce 60.8 51.3 55.0 57.3 54.0
Sul Ross State University ‐ Rio Grande 68.1 64.6 64.5 60.7 42.9
Texas A&M University ‐ Texarkana 40.1 44.9 37.6 38.4 39.6
University of Houston ‐ Victoria 54.7 51.0 41.5 32.7 39.6
Texas A&M University ‐ Kingsville 30.4 26.6 28.6 22.4 39.0
McMurry University 31.5 28.7 23.9 33.2 35.3
West Texas A&M University 36.7 35.9 29.7 29.1 31.4
Texas A&M International University 49.4 40.3 41.6 40.3 31.1
University of Texas ‐ Permian Basin 30.5 32.3 21.4 23.7 25.5
Stephen F. Austin State University 28.4 28.4 24.9 25.4 25.2
University of Texas ‐ Brownsville 31.3 30.0 33.2 26.5 23.2
University of Texas ‐ El Paso 27.0 27.1 23.2 22.7 22.9
Sul Ross State University ‐ Alpine 44.4 30.3 25.9 23.6 22.2
Texas A&M University ‐ Corpus Christi 25.7 24.5 22.8 19.3 21.9
Tarleton State University 28.0 22.9 23.0 18.9 21.3
Texas Woman's University 25.8 23.3 21.9 22.8 20.6
University of Houston ‐ Clear Lake 21.0 20.4 20.2 17.4 19.3
Angelo State University 24.7 23.7 22.9 21.0 19.1
Howard Payne University 28.8 20.2 16.6 19.4 18.4
University of Texas ‐ Tyler 16.4 17.2 17.0 16.0 18.2
University of Mary Hardin‐Baylor 18.9 22.8 14.8 15.8 17.9
Texas State University‐San Marcos 23.0 18.5 17.6 17.4 17.2
Hardin‐Simmons University 17.9 23.1 20.9 15.3 16.5
Sam Houston State University 19.5 18.1 18.2 17.3 16.1
University of Texas ‐ Pan American 26.5 23.3 23.0 18.8 14.5
Lamar University 25.9 19.1 16.5 12.6 12.1
Total number of teachers prepared through all university pathways divided by total number of baccalaureate degrees awarded.1
Source Data57Page
E.2Teacher Certification Data, TEAPACE 2011
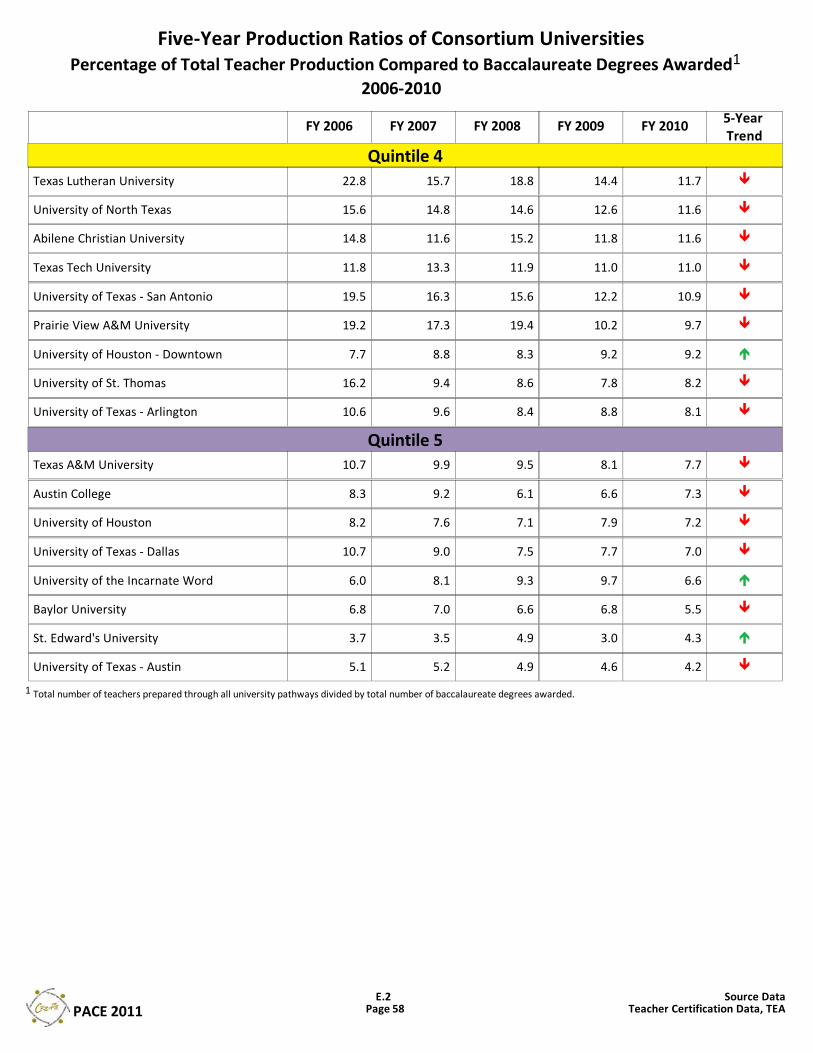
Five‐Year Production Ratios of Consortium Universities
2006‐2010Percentage of Total Teacher Production Compared to Baccalaureate Degrees Awarded1
5‐Year Trend
FY 2006 FY 2007 FY 2008 FY 2009 FY 2010
Quintile 4
Quintile 5
Texas Lutheran University 22.8 15.7 18.8 14.4 11.7
University of North Texas 15.6 14.8 14.6 12.6 11.6
Abilene Christian University 14.8 11.6 15.2 11.8 11.6
Texas Tech University 11.8 13.3 11.9 11.0 11.0
University of Texas ‐ San Antonio 19.5 16.3 15.6 12.2 10.9
Prairie View A&M University 19.2 17.3 19.4 10.2 9.7
University of Houston ‐ Downtown 7.7 8.8 8.3 9.2 9.2
University of St. Thomas 16.2 9.4 8.6 7.8 8.2
University of Texas ‐ Arlington 10.6 9.6 8.4 8.8 8.1
Texas A&M University 10.7 9.9 9.5 8.1 7.7
Austin College 8.3 9.2 6.1 6.6 7.3
University of Houston 8.2 7.6 7.1 7.9 7.2
University of Texas ‐ Dallas 10.7 9.0 7.5 7.7 7.0
University of the Incarnate Word 6.0 8.1 9.3 9.7 6.6
Baylor University 6.8 7.0 6.6 6.8 5.5
St. Edward's University 3.7 3.5 4.9 3.0 4.3
University of Texas ‐ Austin 5.1 5.2 4.9 4.6 4.2
Total number of teachers prepared through all university pathways divided by total number of baccalaureate degrees awarded.1
Source Data58Page
E.2Teacher Certification Data, TEAPACE 2011

Certificate
Fiscal Year Fiscal Year Fiscal Year
Comparison of Longitudinal Certificate Production TrendsFY 2006‐2010
Angelo State University
2006 2007 2008 2009 2010 2006 2007 2008 2009 2010 2006 2007 2008 2009 2010
Angelo State University University of Texas ‐ Permian Basin Sul Ross State University ‐ Alpine
1
2
Bilingual GeneralistELEMENTARY (EC‐4 and EC‐6)
0 0 0 0 0 23 20 13 6 8 2 4 5 0 3ESL 0 0 0 0 0 7 9 1 2 1 0 0 0 0 0Generalist 97 83 88 86 76 54 64 42 60 46 7 8 9 13 6Special Education 0 0 0 0 0 0 0 0 0 0 0 0 0 0 03
SUBTOTAL 97 83 88 86 76 84 93 56 68 55 9 12 14 13 9
Bilingual GeneralistMIDDLE SCHOOL (4‐8)
0 0 0 0 0 2 1 0 0 3 0 0 0 0 0English 5 5 3 0 1 1 7 0 4 3 1 2 4 3 4ESL 3 0 0 0 0 0 1 1 0 0 1 0 0 0 0 0Generalist 3 6 4 5 11 1 9 2 4 14 0 0 0 0 0Mathematics 7 4 5 7 7 3 3 0 4 1 1 0 1 4 0Science 1 3 3 1 2 3 0 1 1 0 1 3 1 1 1Social Studies 1 1 0 1 2 1 2 1 0 0 1 1 4 3 1SUBTOTAL 17 19 15 14 23 12 23 4 13 22 4 6 10 11 6
Bilingual GeneralistHIGH SCHOOL (6‐12 and 8‐12)
0 0 0 0 0 0 0 0 0 0 0 0 0 0 0Career & Tech Ed 4 0 0 0 0 0 0 0 0 0 0 2 1 0 0 0English 6 10 9 6 9 15 13 13 6 6 3 1 0 2 2ESL 3 0 0 0 0 0 0 0 0 0 0 0 0 0 0 0Fine Arts 3 1 0 0 0 0 1 0 0 0 1 3 1 0 0Foreign Language 3 6 5 5 1 11 12 8 5 6 6 2 3 1 3Mathematics 9 5 8 7 5 5 8 5 5 4 0 0 1 1 2PE/Health 8 0 0 0 0 2 0 0 0 0 2 0 0 0 0Science 4 5 3 6 7 5 8 2 6 6 6 3 5 4 1Social Studies 5 5 7 7 7 13 10 7 10 11 3 4 4 1 3Special Education 0 0 0 0 0 0 0 0 0 0 0 0 0 0 03
SUBTOTAL 38 32 32 31 29 51 52 35 32 33 23 14 14 9 11
ESLALL LEVEL (K‐12)
3 0 0 0 0 0 0 0 0 0 0 0 0 0 0 0Fine Arts 1 6 11 7 11 3 1 4 6 7 0 2 3 3 1Foreign Language 0 0 0 0 0 0 0 0 0 0 0 0 0 0 0PE/Health 42 39 32 25 17 9 11 8 11 10 26 18 12 6 10Special Education 14 10 16 16 12 2 1 13 11 12 0 0 0 0 0SUBTOTAL 57 55 59 48 40 14 13 25 28 29 26 20 15 9 11
Bilingual GeneralistOTHER SUPPLEMENTALS
0 0 0 0 0 0 0 0 0 3 0 0 0 0 0ESL 0 0 0 0 1 9 14 11 14 6 0 0 0 0 0Special Education 7 2 1 0 1 1 0 0 0 0 0 0 0 0 0SUBTOTAL 7 2 1 0 2 10 14 11 14 9 0 0 0 0 0
1 Individual candidates may receive multiple certificates.2 Certificate year equals fiscal year (Sept. 1 ‐ Aug. 31).3 For this analysis, endorsement and supplemental certificates are reported separately.4 Career and technical education includes the following certificates: Ag sciences and technology, health science technology, marketing education, trade and industrial education.
216Total 191 195 179 170 171 195 131 155 148 62 52 53 42 37
Source Data59Page
E.3Teacher Certification Files, TEAPACE 2011

Percent Retained in Spring of Academic Year AttritionRate
Preparation Program Name
1
Angelo State University
2007‐2011
Teacher Retention ComparisonFive‐Year Retention Rates for the Certification Cohort of 2006
2007 2008 2009 2010 2011
Percen
t Retaine
d
0
10
20
30
40
50
60
70
80
90
100
2007 2008 2009 2010 2011
Angelo State University Sul Ross State University ‐ Alpine University of Texas ‐ Permian Basin
100.0 97.2 93.5Angelo State University 91.7 88.0 12.0
100.0 96.2 96.2University of Texas - Permian Basin 91.2 88.8 11.2
100.0 91.3 87.0Sul Ross State University - Alpine 95.7 91.3 8.71 Includes only teachers obtaining standard certification in FY 2006, becoming employed in AY 2007 with no teaching experience prior to 2007.
Source Data60Page
E.4Teacher Certification and Assignment Files, TEAPACE 2011

61
Performance Analysis System for Colleges of Education
Changes made to the 2011 PACE Reports B.2.c: Student Achievement Trends in the Proximal Zone of Professional Impact: Variability of TAKS Achievement Rates by Ethnicity. The percent of students commended on TAKS was added to the high, middle, and elementary school mathematics and language arts/reading graphs. Percent commended was calculated using the state definition (See B.2.c on page 12).
B.2.c: Student Achievement Trends in the Proximal Zone of Professional Impact: 30 Highest and Lowest Achieving Schools by Level in Mathematics and Language Arts/Reading. Respective columns for mathematics and language arts/reading were bolded.
C.1: Five-Year University Production Trends. “Degrees Awarded, Bachelors (from Colleges of Arts & Sciences)” was changed to “Baccalaureate Degrees.” “Teachers Produced” was changed to “Teachers Produced by Pathway.”
C.2: Teacher Production Trends. The legend was standardized and the phrase “Total Teachers Produced by” was added to Fiscal Year in the data table.
C.4: Initial Certificate Production by Level. The “10-Year Average” column and the “5-Year Certificate Production” chart were omitted from the report. The graph was eliminated.
D.3: District Hiring Patterns of University-Prepared Teachers in PZPI. Footnote 1 was changed from “Includes all university pathways” to “Includes standard certificates from all university pathways.”
D.4.a-c: Percentage of University Completers (by Level) in the Proximal Zone of Professional Impact. The title was changed from “Concentration of University Completers (Insert Level) in the Proximal Zone of Professional Impact. The “% of School Econ Disadvantaged” column was moved between Campus Code and Campus Name. The “% Univ FTEs” column was bolded.
D.5a-d: Comparison of Teacher Retention Trends. Retention was added to “Spring of Academic Year” in the data table.
E.3: Comparison of Longitudinal Certificate Production Trends. “In Nearby Geographic Area” was omitted from the PACE 2010 report title.
E.4: Comparison of Newly-Certified Teacher Employment in Nearby Geographic Area. The entire report was omitted from PACE 2011.
E.5: Teacher Retention Comparison. “In Nearby Geographic Area was omitted from the 2010 PACE report title and the report became the new E.4.
Data Corrections and Data Requests The 2011 PACE Report is intended for use by various educational stakeholders. The data presented should be validated by each individual university. Depending on each university’s particular need, CREATE offers additional support and technical assistance outlined on page 6 of this report. All inquiries regarding PACE, including data corrections and data requests, should be forwarded to:
Sherri Lowrey CREATE Associate Director of Research
936-273-7661 [email protected]
www.createtx.org

Mona S. Wineburg Executive Director
Jeanette Narvaez Director of Operations & Research Dissemination
Sherri Lowrey Associate Director of Research
John Beck Higher Education Research Liaison
Robert Cox
Higher Education Research Liaison
Paula Hart Administrative Assistant
Nancy Olson Administrative Secretary
Center for Research, Evaluation & Advancement of Teacher Education 3232 College Park Drive, Suite 303
The Woodlands, TX 77384 www.createtx.org