Perceptual Dominant Color Extraction by MD PSO R5muvis.cs.tut.fi/Documents/Perceptual Dominant Color...
23
Perceptual Dominant Color Extraction by Multi-Dimensional Particle Swarm Optimization 1 Abstract— Color is the major source of information widely used in image analysis and content-based retrieval. Extracting dominant colors that are prominent in a visual scenery is of utmost importance since the human visual system primarily uses them for perception and similarity judgment. In this paper, we address dominant color extraction as a dynamic clustering problem and use techniques based on Particle Swarm Optimization (PSO) for finding optimal (number of) dominant colors in a given color space, distance metric and a proper validity index function. The first technique, so-called Multi-Dimensional (MD) PSO, re-forms the native structure of swarm particles in such a way that they can make inter-dimensional passes with a dedicated dimensional PSO process. Therefore, in a multidimensional search space where the optimum dimension is unknown, swarm particles can seek both positional and dimensional optima. Nevertheless, MD PSO is still susceptible to premature convergence due to lack of divergence. To address this problem we then present Fractional Global Best Formation (FGBF) technique, which basically collects all promising dimensional components and fractionally creates an artificial global-best particle (aGB) that has the potential to be a better “guide” than the PSO’s native gbest particle. In order to extract perceptually important colors and to further improve the discrimination factor for a better clustering performance, an efficient color distance metric, which uses a fuzzy model for computing color (dis-) similarities over HSV (or HSL) color space is proposed. The comparative evaluations against MPEG-7 dominant color descriptor show the superiority of the proposed technique. Index Terms—edge detection, multi-scale analysis, multimedia indexing and retrieval, shape descriptor over sub- segments. I. INTRODUCTION OMINANT Color (DC) extraction is basically a dynamic color quantization process, which seeks for such prominent color centers that minimize the quantization error. To this end, studying human color perception and similarity measurement in the color domain becomes crucial and there is a wealth of research performed in this field. For example in [34], Broek et al. focused on the utilization of color categorization (called as focal colors) for content-based image Perceptual Dominant Color Extraction by Multi-Dimensional Particle Swarm Optimization Serkan Kiranyaz, Stefan Uhlmann, Turker Ince and Moncef Gabbouj 1 D
Transcript of Perceptual Dominant Color Extraction by MD PSO R5muvis.cs.tut.fi/Documents/Perceptual Dominant Color...
Perceptual Dominant Color Extraction by Multi-Dimensional Particle Swarm Optimization 1
Abstract— Color is the major source of information widely used in image analysis and content-based retrieval.
Extracting dominant colors that are prominent in a visual scenery is of utmost importance since the human visual
system primarily uses them for perception and similarity judgment. In this paper, we address dominant color extraction
as a dynamic clustering problem and use techniques based on Particle Swarm Optimization (PSO) for finding optimal
(number of) dominant colors in a given color space, distance metric and a proper validity index function. The first
technique, so-called Multi-Dimensional (MD) PSO, re-forms the native structure of swarm particles in such a way that
they can make inter-dimensional passes with a dedicated dimensional PSO process. Therefore, in a multidimensional
search space where the optimum dimension is unknown, swarm particles can seek both positional and dimensional
optima. Nevertheless, MD PSO is still susceptible to premature convergence due to lack of divergence. To address this
problem we then present Fractional Global Best Formation (FGBF) technique, which basically collects all promising
dimensional components and fractionally creates an artificial global-best particle (aGB) that has the potential to be a
better “guide” than the PSO’s native gbest particle. In order to extract perceptually important colors and to further
improve the discrimination factor for a better clustering performance, an efficient color distance metric, which uses a
fuzzy model for computing color (dis-) similarities over HSV (or HSL) color space is proposed. The comparative
evaluations against MPEG-7 dominant color descriptor show the superiority of the proposed technique.
Index Terms—edge detection, multi-scale analysis, multimedia indexing and retrieval, shape descriptor over sub-
segments.
I. INTRODUCTION
OMINANT Color (DC) extraction is basically a dynamic color quantization process, which seeks for such prominent
color centers that minimize the quantization error. To this end, studying human color perception and similarity
measurement in the color domain becomes crucial and there is a wealth of research performed in this field. For example in
[34], Broek et al. focused on the utilization of color categorization (called as focal colors) for content-based image
Perceptual Dominant Color Extraction by Multi-Dimensional Particle Swarm Optimization
Serkan Kiranyaz, Stefan Uhlmann, Turker Ince and Moncef Gabbouj1
D

Perceptual Dominant Color Extraction by Multi-Dimensional Particle Swarm Optimization 2
retrieval (CBIR) purposes and introduced a new color matching method, which takes human cognitive capabilities into
account. They exploited the fact that humans tend to think and perceive colors only in 11 basic categories. In [22],
Mojsilovic et al. performed a series of psychophysical experiments analyzing how humans perceive and measure similarity
in the domain of color patterns. One observation worth mentioning here is that the human eye cannot perceive a large
number of colors at the same time, nor it is able to distinguish similar (close) colors well. Based on this, they showed that
at the coarsest level of judgment, the human visual system (HVS) primarily uses dominant colors (i.e. few prominent
colors in the scenery) to judge similarity.
The usual approach for DC extraction is to perform clustering in a color domain. The most popular clustering method,
which is also used for MPEG-7 DC descriptor (DCD) [24], is K-means, [14]. However, clustering is a multi-modal
problem especially in high dimensions, which contains many sub-optimum solutions resulting in over- and under-
clustering. Therefore, well-known deterministic methods such as K-means, Max-Min [14], FCM [14], SOM [14], etc. are
susceptible to get trapped to the closest local minimum since they are nothing but greedy descent methods, which start
from a random point in the solution space and perform a localized search. This fact eventually turns the focus on
stochastic Evolutionary Algorithms (EAs) [3] such as Genetic Algorithms (GAs) [11], Genetic Programming (GP) [19],
Evolution Strategies (ES), [4] and Evolutionary Programming (EP) [10], all of which are motivated by the natural
evolution process and thus make use of evolutionary operators. The common point of all is that EAs are in population
based nature and can perform a global search. So they may avoid becoming trapped in a local optimum and find the
optimum solution; however, this is never guaranteed.
Conceptually speaking, Particle Swarm Optimization (PSO) [9], [15], [32], which has obvious ties with the EA family,
lies somewhere in between GA and EP. Yet unlike GA, PSO has no complicated evolutionary operators such as crossover,
selection and mutation. In a PSO process, a swarm of particles (or agents), each of which represents a potential solution to
an optimization problem, navigate through the search space. Particles are initially distributed randomly over the search
space and the goal is to converge to the global optimum of a function or a system. Several researchers have shown that
PSO exhibits a better clustering performance than the aforementioned techniques [25]- [27], [32]; however, when the
problem is multi-modal, PSO may also become trapped in local optima [30] due to the premature convergence problem
especially when the search space is of high dimensions [32]. Furthermore, PSO has so far been applied to simple
clustering problems [25]- [27], [32],where the data space is limited and usually in low dimensions and the number of
1 This work was supported by the Academy of Finland, project No. 213462 (Finnish Centre of Excellence Program (2006 - 2011)
Perceptual Dominant Color Extraction by Multi-Dimensional Particle Swarm Optimization 3
clusters (hence the solution space dimension) is kept reasonably low (e.g. <10). Moreover, all clustering methods
mentioned earlier are static in nature, that is, the number of clusters has to be specified a priori. This is also true for PSO
since in its basic form it can only be applied to a search space with a fixed dimension. Particularly for dominant color
extraction, the optimal (true) number of DCs in an image is unknown and should thus be determined within the (PSO)
process.
In this paper, we shall address data clustering as an optimization problem and present techniques, which extend PSO in
a proper way to find optimal (number of) clusters in a multi-dimensional space. To alleviate the premature convergence
problem, the so-called Fractional Global Best Formation (FGBF), collects all promising components from each particle
and fractionally creates an artificial Global Best (GB) particle, the aGB, which may guide the swarm better than the
swarm's native gbest particle [15] in such a way that the swarm can converge to the global optimum (or near-optimum)
solution even in high dimensions and usually in earlier stages. In order to achieve a dynamic clustering where the optimum
number of clusters is also determined within the process, we shall then present the so-called Multi-Dimensional Particle
Swarm Optimization (MD PSO) method, which extends the native structure of PSO particles in such a way that they can
make inter-dimensional passes with a dedicated dimensional PSO process [16]. Therefore, in a multidimensional search
space where the optimum dimension is unknown, swarm particles can seek for both positional and dimensional optima. In
recent works, both techniques have been successfully applied over multi-dimensional non-linear function minimization
and 2D data clustering [16], optimization over dynamic environments [17] and automatic design of artificial neural
networks [13], [18], respectively. In this paper we adapt both techniques to extract the optimal (number of) DCs in an
image with respect to a cluster validity index and color domain.
Cluster validity analysis is the assessment of the clustering method’s output using a specific criterion for optimality, i.e.
the so-called clustering validity index function, [12]. Hence the optimality of any clustering method can only be assessed
with respect to the validity index, which can be defined over a particular data representation with a proper distance
(similarity) metric. Many existing DC extraction techniques, particularly the ones widely used in CBIR systems such as
MPEG-7 DCD, have severe drawbacks and thus show a limited performance. The main reason for this is because most of
them are designed based on some heuristics or naïve rules that are not formed with respect to what humans or more
specifically the human visual system (HVS) finds “relevant” in color similarity. Therefore, it is of decisive importance that
human color perception is considered whilst modeling and describing any color composition of an image. In other words,
Perceptual Dominant Color Extraction by Multi-Dimensional Particle Swarm Optimization 4
when a particular color descriptor is designed entirely based on HVS and color perception rules, further discrimination
power and hence certain improvements in retrieval performance can be achieved. For this reason we shall propose a fuzzy
model to achieve a perceptual distance metric over HSV (or HSL) color space, which provides means of modeling color in
a way HVS does. In this way the discrimination between distinct colors is further enhanced, which in turns improves the
clustering (and DC extraction) performance.
The rest of the paper is organized as follows. Section II surveys related work on DC extraction whilst presenting a brief
overview on data clustering. The application of MD PSO and FGBF for optimal dynamic clustering and the proposed DC
extraction technique are presented in detail in Section III. Section IV provides the experiments conducted over a real
image database and discusses the results. Finally, Section V concludes the paper.
II. RELATED WORK
There is a wealth of research done and still going on in developing efficient DC extraction methods, which can be used in
many applications, such as lossy compression techniques, mobile and hand-held devices, low-cost color displays, color
look-up tables, and CBIR. In this article, we shall restrict the focus on the CBIR domain, which employs color as the
descriptor for image retrieval. We shall then briefly introduce major data clustering methods.
A. DC Descriptors
In order to solve the problems of static quantization in color histograms, various DC descriptors, e.g. [1], [6], [8], [23] and
[24], have been developed using dynamic quantization with respect to image color content. DCs, if extracted properly
according to the aforementioned color perception rules, can indeed represent the prominent colors in any image. They
have a global representation, which is compact and accurate; and they are also computationally efficient. MPEG-7 DC
descriptor (DCD) is adopted as in [6] where the method is designed with respect to HVS color perceptual rules. For
instance, HVS is more sensitive to changes in smooth regions than in detailed regions. Thus colors are quantized more
coarsely in the detailed regions while smooth regions have more importance. To exploit this fact, a smoothness weight
(w(p)) is assigned to each pixel (p) based on the variance in a local window. Afterwards, the General Lloyd Algorithm
(GLA, also referred to as Linde-Buzo-Gray and it is equivalent to the well-known K-means clustering method [14]) is used
for color quantization. For a color cluster iC , its centroid ic is calculated by,
ii Cpxpw
pxpwc ∈=
∑∑ )(,
)()()( (1)

Perceptual Dominant Color Extraction by Multi-Dimensional Particle Swarm Optimization 5
and the initial clusters for GLA is determined by using a weighted distortion measure, defined as,
iii CpxcpxpwD ∈−= ∑ )(,)()( 2 (2)
This is used to determine which clusters to split until either a maximum number of clusters (DCs), maxDCN , is achieved or a
maximum allowed distortion criteria, Dε , is met. Hence, pixels with smaller weights (detailed sections) are assigned
fewer clusters so that the number of color clusters in the detailed regions where the likelihood of outliers’ presence is high,
is therefore suppressed. As the final step, an agglomerative clustering (AC) is performed on the cluster centroids to further
merge similar color clusters so that there is only one cluster (DC) hosting all similar color components in the image. A
similarity threshold ST is assigned to the maximum color distance possible between two similar colors in a certain color
domain (CIE-Luv, CIE_Lab, etc.). Another merging criterion is the color area, that is, any cluster should have a minimum
amount of coverage area, AT , so as to be assigned as a DC; otherwise, it will be merged with the closest color cluster since
it is just an outlier. Another important issue is the choice of the color space since a proper color clustering scheme for DC
extraction tightly relies on the metric. Therefore, a perceptually uniform color space should be used and the most common
ones are CIE-Luv and CIE-Lab, which are designed such that color distances perceived by HVS are also equal in 2L
(Euclidean) distance in these spaces. For CIE-Luv, a typical value for ST is between 10 and 25, AT is between 1-5% and
05.0<Dε [24].
B. Data Clustering
As the process of identifying natural groupings in a multidimensional data space based on some distance metric (e.g.
Euclidean), data clustering can be divided into two main categories: hierarchical and partitional [14]. Each category then
has a wealth of sub-categories and different algorithmic approaches for finding the clusters. Clustering can also be
performed in two different modes: hard (or crisp) and fuzzy. K-means [14] is a well known and widely used hard
clustering method, which first assigns each data point to one of the K cluster centroids and then updates them to the mean
of their associated points. Yet as a hard clustering method, K-means suffers from the several drawbacks, e.g. 1) The
number of clusters, K, needs to be set in advance, 2) Its performance directly depends on the initial (random) centroid
positions as the method converges to the closest local optima and 3) K-means is also dependent on the data distribution.
There are many other clustering variants that are skipped where an extensive survey can be found in [14] and [28].
A hard clustering technique based on the basic PSO (bPSO) was first introduced by Omran et al. in [25] and this work

Perceptual Dominant Color Extraction by Multi-Dimensional Particle Swarm Optimization 6
showed that the bPSO can outperform K-means, FCM, KHM and some other state-of-the-art clustering methods in any
(evaluation) criteria. This is indeed an expected outcome due to the PSO’s aforementioned ability to cope with the local
optima by maintaining a guided random search operation through the swarm particles. In clustering, similar to other PSO
applications, each particle represents a potential solution at a particular time t, i.e. the particle a in the swarm,
},..,,..,{ 1 Sa xxx=ξ , is formed as jajaKajaaa ctxccctx ,,,,1, )(},..,,..,{)( =⇒= where jac , is the jth (potential) cluster
centroid in N dimensional data space and K is the number of clusters fixed in advance. Note that the data space dimension,
N, is now different than the solution space dimension, K. Furthermore, the fitness (validity index) function, f that is to be
optimized, is formed with respect to two widely used criteria in clustering:
Compactness: Data items in one cluster should be similar or close to each other in N dimensional space and
different or far away from the others when belonging to different clusters.
Separation: Clusters and their respective centroids should be distinct and well-separated from each other.
The fitness functions for clustering are then formed as a regularization function fusing both Compactness and
Separation criteria and in this problem domain they are known as clustering validity indices. The minimization of a
validity index will simultaneously try to minimize the intra-cluster distances (for better Compactness) and maximize the
inter-cluster distance (for better Separation). In such a regularization approach, different priorities (weights) can be
assigned to both sub-objectives via proper setting of weight coefficients; however, this makes the approach strictly
parameter dependent. Another traditional and well-known validity index is Dunn’s index [7], which suffers from two
drawbacks: It is computationally expensive and sensitive to noise [12]. Several variants of Dunn’s index were proposed in
[28] where robustness against noise is improved. There are many other validity indices, i.e. proposed by Turi [31], Davies
and Bouldin [5], Halkidi and Vazirganis [12], etc. A throughout survey can be found in [12]. Most of them presented
promising results; however, none of them can guarantee the “optimum” number of clusters in every clustering scheme.
Although PSO-based clustering outperforms many well-known clustering methods, it still suffers from two major
drawbacks. The number of clusters, K, (being the solution space dimension as well) must still be specified in advance and
similar to other bPSO applications, the method tends to trap in local optima particularly when the complexity of the
clustering scheme increases. This also involves the dimension of the solution space, i.e. convergence to “optimum”
number of “true” clusters can only be guaranteed for low dimensions. This is also true for dynamic clustering schemes,
DCPSO [26] and MEPSO [1], both of which eventually present results only in low dimensions and for simple data
distributions. All these drawbacks and limitations have successfully been addressed in [16].

Perceptual Dominant Color Extraction by Multi-Dimensional Particle Swarm Optimization 7
III. THE PROPOSED DC EXTRACTION TECHNIQUE
Humans tend to think and describe color the way they perceive it. Therefore, in order to achieve a color (dis-) similarity
metric taking HVS into account, HSV (or HSL), which is a perceptual color space and provides means of modeling color
in a way HVS does, is used in the proposed technique for extracting dominant colors. Note that in a typical image with 24-
bit RGB representation, there can be several thousands of distinct colors, most of which cannot be perceived by HVS.
Therefore, to reduce the computational complexity of RGB to HSV color transformation and particularly to speed up the
dynamic clustering process via MD PSO and FGBF, a pre-processing step, which creates a limited color palette in RGB
color domain, is first performed. In this way such a massive, yet unperceivable amount of colors in RGB domain can be
reduced to a reasonable number, e.g. 256<n<512. To this end, we used the Median Cut method [20] because it is fast (i.e.
O(n)) and for such a value of n, it yields an image which can hardly be (color-wise) distinguished from the original. Only
the RGB color components in the color palette are then transformed into HSV (or HSL) color space over which the
proposed dynamic clustering technique is applied to extract the dominant colors, as explained next.
A. Dynamic Clustering by MD PSO with FGBF
Based on the earlier discussion it is obvious that the clustering problem requires the determination of the solution space
dimension (i.e. number of clusters, K) and an effective mechanism to avoid local optima (i.e., traps, both dimensionally
and spatially) particularly in complex clustering schemes in high dimensions (e.g. 10>K ). The former requirement
justifies the use of the proposed MD PSO technique while the latter calls for FGBF. A brief description of both
techniques is given in the Appendix and see [16] for details.
At time t, a particle a in the swarm, },..,,..,{ 1 Sa xxx=ξ , has the positional component formed as,
jatxd
jatxdajaatxd
a ctxxccctxx a
a
a,
)(,)(,,1,
)( )(},..,,..,{)( =⇒= meaning that it represents a potential solution (i.e. a cluster
centroid) for the )(txda number of clusters whilst jth component being the jth cluster centroid. Apart from the regular
limits such as (spatial) velocity, maxV , dimensional velocity, maxVD and dimension range maxmin )( DtxdD a ≤≤ , the
(variable) N dimensional data space is also limited with some practical spatial range, i.e. max)(
min )( XtxxX txda
a << . In
case this range is exceeded even for a single dimension j, )()(, txx txdjaa , then all positional components of the particle for
the respective dimension )(txda are initialized randomly within the range and this further contributes to the overall

Perceptual Dominant Color Extraction by Multi-Dimensional Particle Swarm Optimization 8
diversity. Let Z be the set of points, }{ pzZ = , in the N dimensional data space. The following validity index is used to
obtain computational simplicity with minimal or no parameter dependency,
∑∑
=
∈∀
−
=
=
)(
1)(
)(,
)(
)()(
)(,
)(1)(
))(()(),(
txd
jtxd
a
xxzp
txdja
a
txdae
atxd
aetxd
a
a
a
taxdjap
a
a
aa
xx
zxx
txdxxQ
wheretxdxxQZxxf α
(3)
where eQ is the quantization error (or the average intra-cluster distance) as the Compactness term and α))(( txda is the
Separation term, by simply penalizing higher cluster numbers with an exponential, 0>α . Using 1=α , the validity index
yields the simplest form and becomes entirely parameter-free.
On the other hand, (hard) clustering has some constraints. Let [ ])(,1},{)}({ ,)(
, txdjctxxC ajatxd
jaja ∈∀== , be the
set of data points assigned to a (potential) cluster centroid )()(, txx txdjaa for a particle a at time t. The partitions
)](,1[, txdjC aj ∈∀ should maintain the following constraints:
1. Each data point should be assigned to one cluster set ZCtxd
jj
a
==U
)(
1
2. Each cluster should contain at least one data point )](,1[},{ txdjC aj ∈∀≠ φ
3. Two clusters should have no common data points )](,1[,},{ txdjiandjiCC aji ∈∀≠=∩ φ
In order to satisfy the 1st and 3rd (hard) clustering constraints, before computing the clustering fitness score via the validity
index function in Eq. (3), all data points are first assigned to the closest centroid. Yet there is no guarantee for the
fulfillment of the 2nd constraint since )()( txx txda
a is set (updated) by the internal dynamics of the MD PSO process and
hence any dimensional component (i.e. a potential cluster candidate), )()(, txx txdjaa , can be in an abundant position (i.e. no
closest data point exists). To avoid this, a high penalty is set for the fitness score of the particle, i.e.
}{}{,),( )(,
)( φ=∞≈ txdja
txda
aa xxifZxxf for any j.
The major outlines so far given are sufficient for applying the MD PSO technique to dynamic clustering and for this
purpose the details for the application of FGBF over MD PSO can be found in [16].
Perceptual Dominant Color Extraction by Multi-Dimensional Particle Swarm Optimization 9
B. Fuzzy Model over HSV-HSL Color Domains
Let },,{ 1111 vshc = and },,{ 2222 vshc = be two colors in HSV domain. Assume for the sake of simplicity that the hue is
between 0 to 360 degrees and both s and v are unit normalized. The normalized Euclidean distance between s and v can
be defined as in Eq. (4).
( ) ( )22211
22211
221
221 )sin()sin()cos()cos()( hshshshsvvcc −+−+−=− (4)
During the dynamic clustering process by MD PSO and FGBF, the problem of using this equation for computing a color
distance between a candidate color centroid, ],1[),(, djtxxdja ∈∀ and a color in the palette, )(txxz d
ap ∈ , as in Eq. (3) is
that it has a limited discrimination power between distinct colors, as it basically yields arbitrary fractional numbers
despite the fact that HVS finds “no similarity” in between. Therefore, instead of using this typical distance metric for all
color pairs, we adopt a perceptual approach in order to improve discrimination between different colors. Recall from the
earlier discussion that humans can recognize and distinguish 8 to 12 colors. Recall that in [34], the authors exploited the
fact that humans tend to think and perceive colors only in 11 basic categories. Hence above a certain hue difference
between two colors, it is obvious that they become entirely different for HVS, e.g. yellow and green are as different as
yellow and blue or cyan or black or purple, etc. So if the hue difference is above a certain limit, a maximum difference
should be used (i.e. 1.0). We have selected an upper limit by considering distinct colors number as only 8, therefore, the
perceptual threshold is, 458/360 ==Δ HT degrees. In practice, however, even a lower hue threshold can also be used;
because, two colors for instance with 40 degrees of hue difference can hardly have any similarity – yet 45 degrees present
a safe margin leaving any subjectivity out.
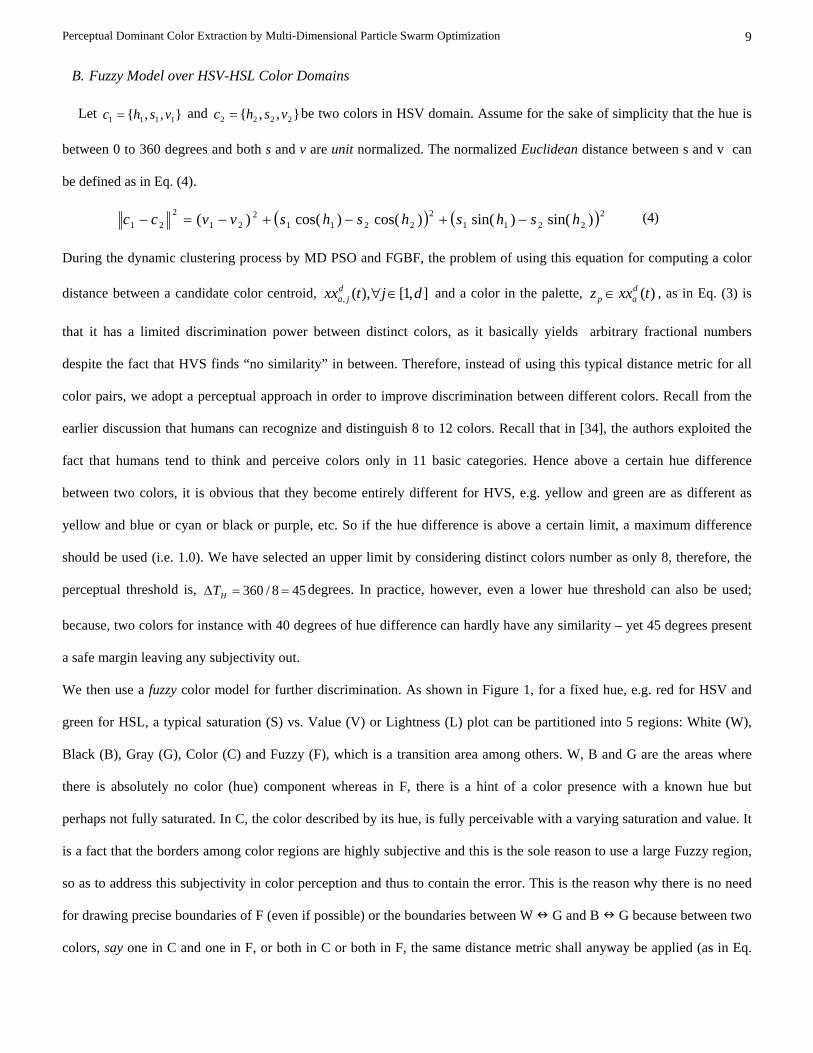
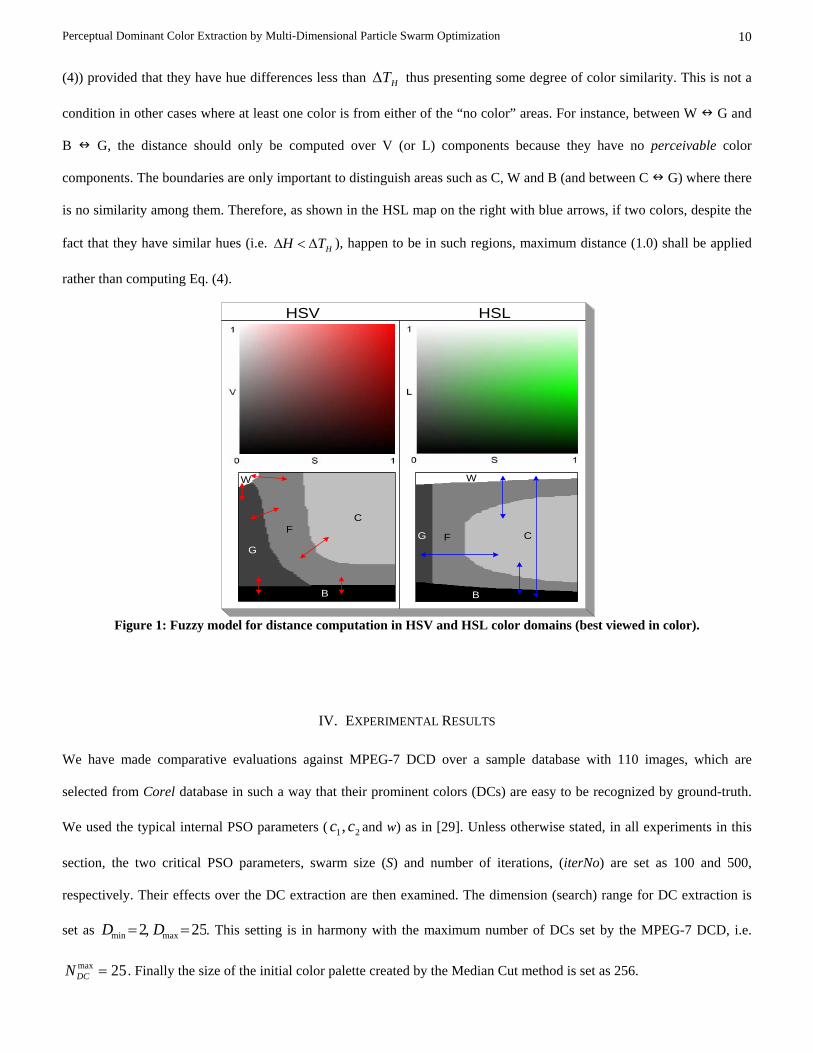
We then use a fuzzy color model for further discrimination. As shown in Figure 1, for a fixed hue, e.g. red for HSV and
green for HSL, a typical saturation (S) vs. Value (V) or Lightness (L) plot can be partitioned into 5 regions: White (W),
Black (B), Gray (G), Color (C) and Fuzzy (F), which is a transition area among others. W, B and G are the areas where
there is absolutely no color (hue) component whereas in F, there is a hint of a color presence with a known hue but
perhaps not fully saturated. In C, the color described by its hue, is fully perceivable with a varying saturation and value. It
is a fact that the borders among color regions are highly subjective and this is the sole reason to use a large Fuzzy region,
so as to address this subjectivity in color perception and thus to contain the error. This is the reason why there is no need
for drawing precise boundaries of F (even if possible) or the boundaries between W G and B G because between two
colors, say one in C and one in F, or both in C or both in F, the same distance metric shall anyway be applied (as in Eq.
Perceptual Dominant Color Extraction by Multi-Dimensional Particle Swarm Optimization 10
(4)) provided that they have hue differences less than HTΔ thus presenting some degree of color similarity. This is not a
condition in other cases where at least one color is from either of the “no color” areas. For instance, between W G and
B G, the distance should only be computed over V (or L) components because they have no perceivable color
components. The boundaries are only important to distinguish areas such as C, W and B (and between C G) where there
is no similarity among them. Therefore, as shown in the HSL map on the right with blue arrows, if two colors, despite the
fact that they have similar hues (i.e. HTH Δ<Δ ), happen to be in such regions, maximum distance (1.0) shall be applied
rather than computing Eq. (4).
W W
C
C
FF
B B
GG
HSV HSL
Figure 1: Fuzzy model for distance computation in HSV and HSL color domains (best viewed in color).
IV. EXPERIMENTAL RESULTS
We have made comparative evaluations against MPEG-7 DCD over a sample database with 110 images, which are
selected from Corel database in such a way that their prominent colors (DCs) are easy to be recognized by ground-truth.
We used the typical internal PSO parameters ( 21, cc and w) as in [29]. Unless otherwise stated, in all experiments in this
section, the two critical PSO parameters, swarm size (S) and number of iterations, (iterNo) are set as 100 and 500,
respectively. Their effects over the DC extraction are then examined. The dimension (search) range for DC extraction is
set as 25,2 maxmin == DD . This setting is in harmony with the maximum number of DCs set by the MPEG-7 DCD, i.e.
25max =DCN . Finally the size of the initial color palette created by the Median Cut method is set as 256.
Perceptual Dominant Color Extraction by Multi-Dimensional Particle Swarm Optimization 11
A. Comparative Evaluations against MPEG-7 DCD
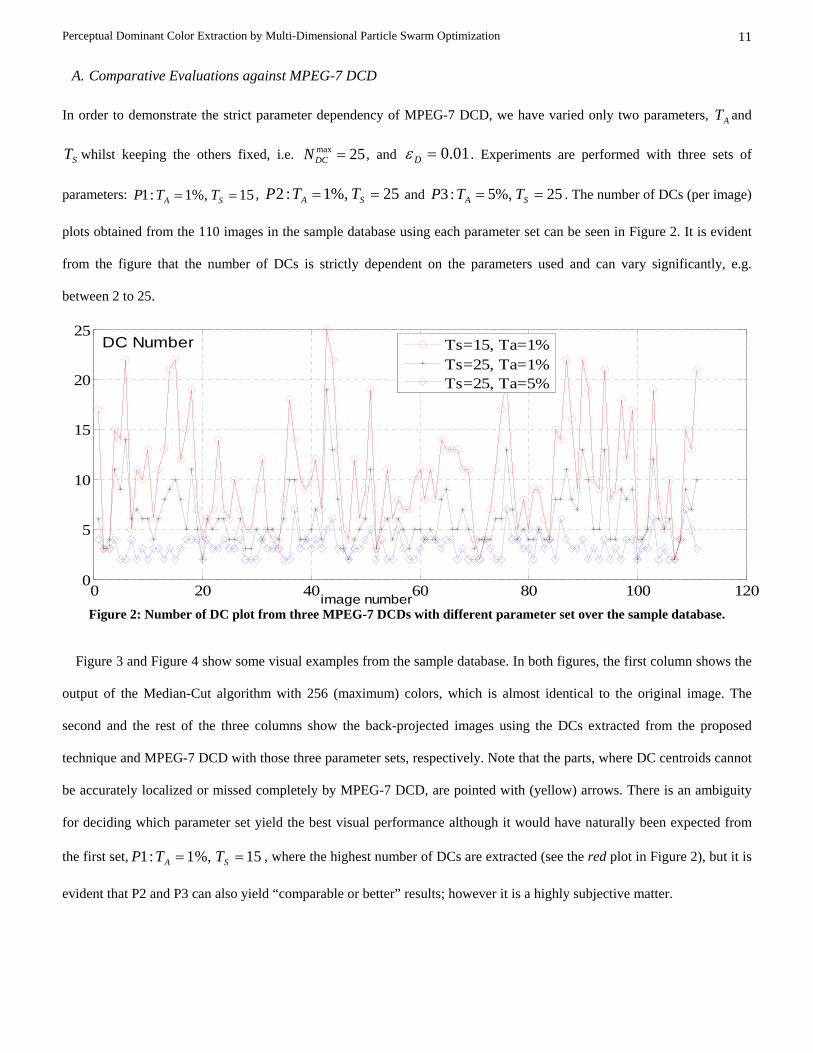
In order to demonstrate the strict parameter dependency of MPEG-7 DCD, we have varied only two parameters, AT and
ST whilst keeping the others fixed, i.e. 25max =DCN , and 01.0=Dε . Experiments are performed with three sets of
parameters: 15%,1:1 == SA TTP , 25%,1:2 == SA TTP and 25%,5:3 == SA TTP . The number of DCs (per image)
plots obtained from the 110 images in the sample database using each parameter set can be seen in Figure 2. It is evident
from the figure that the number of DCs is strictly dependent on the parameters used and can vary significantly, e.g.
between 2 to 25.
0 20 40 60 80 100 1200
5
10
15
20
25
image number
DC Number
Ts=15, Ta=1%Ts=25, Ta=1%Ts=25, Ta=5%
Figure 2: Number of DC plot from three MPEG-7 DCDs with different parameter set over the sample database.
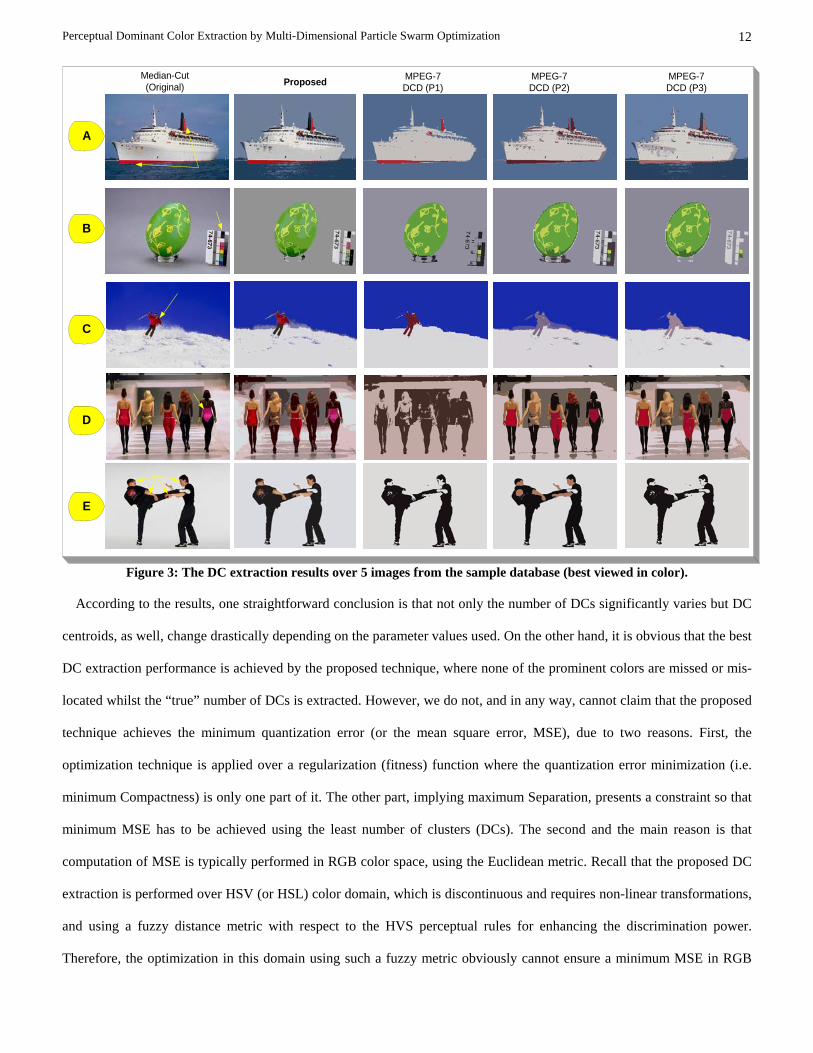
Figure 3 and Figure 4 show some visual examples from the sample database. In both figures, the first column shows the
output of the Median-Cut algorithm with 256 (maximum) colors, which is almost identical to the original image. The
second and the rest of the three columns show the back-projected images using the DCs extracted from the proposed
technique and MPEG-7 DCD with those three parameter sets, respectively. Note that the parts, where DC centroids cannot
be accurately localized or missed completely by MPEG-7 DCD, are pointed with (yellow) arrows. There is an ambiguity
for deciding which parameter set yield the best visual performance although it would have naturally been expected from
the first set, 15%,1:1 == SA TTP , where the highest number of DCs are extracted (see the red plot in Figure 2), but it is
evident that P2 and P3 can also yield “comparable or better” results; however it is a highly subjective matter.
Perceptual Dominant Color Extraction by Multi-Dimensional Particle Swarm Optimization 12
Median-Cut(Original) Proposed
A
D
C
B
E
MPEG-7DCD (P3)
MPEG-7DCD (P2)
MPEG-7DCD (P1)
Figure 3: The DC extraction results over 5 images from the sample database (best viewed in color).
According to the results, one straightforward conclusion is that not only the number of DCs significantly varies but DC
centroids, as well, change drastically depending on the parameter values used. On the other hand, it is obvious that the best
DC extraction performance is achieved by the proposed technique, where none of the prominent colors are missed or mis-
located whilst the “true” number of DCs is extracted. However, we do not, and in any way, cannot claim that the proposed
technique achieves the minimum quantization error (or the mean square error, MSE), due to two reasons. First, the
optimization technique is applied over a regularization (fitness) function where the quantization error minimization (i.e.
minimum Compactness) is only one part of it. The other part, implying maximum Separation, presents a constraint so that
minimum MSE has to be achieved using the least number of clusters (DCs). The second and the main reason is that
computation of MSE is typically performed in RGB color space, using the Euclidean metric. Recall that the proposed DC
extraction is performed over HSV (or HSL) color domain, which is discontinuous and requires non-linear transformations,
and using a fuzzy distance metric with respect to the HVS perceptual rules for enhancing the discrimination power.
Therefore, the optimization in this domain using such a fuzzy metric obviously cannot ensure a minimum MSE in RGB

Perceptual Dominant Color Extraction by Multi-Dimensional Particle Swarm Optimization 13
domain. Besides that, several studies show that MSE is not an appropriate metric for visual (or perceptual) quality (e.g.
[35]) and thus we hereby avoid using it as a performance measure.
Median-Cut(Original)
MPEG-7DCD (P3)Proposed
MPEG-7DCD (P2)
MPEG-7DCD (P1)
A
D
C
B
E
Figure 4: The DC extraction results over 5 images from the sample database (best viewed in color).
B. Robustness and Parameter Invariance of the Proposed Method
Due to its stochastic nature, there is a concern about robustness (or repeatability) of the results. In this section, we perform
several experiments to examine whether or not the results are consistent in regard to accuracy of the DC centroids and
their numbers. Repeatability would be a critical problem for deterministic methods such as K-means, Min-Max, etc. if the
initial color (cluster) centroids are randomly chosen, as the original algorithm suggests. Eventually such methods would

Perceptual Dominant Color Extraction by Multi-Dimensional Particle Swarm Optimization 14
create different clustering scheme each time they are performed since they are bound to get trapped to the nearest local
optimum from the initial position. The solution to this problem induced by MPEG-7 DCD method is to change the random
initialization part to a fixed (deterministic) initial assignment to the existing data points so that the outcome, DC centroids
and the number of DCs extracted, will be the same each time the algorithm is performed over a particular image with the
same parameters. This would also be a practical option for the proposed technique, i.e. fixing the initialization stage and
using a constant seed for the random number generator that MD PSO uses. However, as a global optimization method, we
shall demonstrate that MD PSO with FGBF can most of the time converge to (near-) optimal solutions, meaning that, the
number of DCs and their centroids extracted from the proposed dynamic clustering technique shall be consistent and
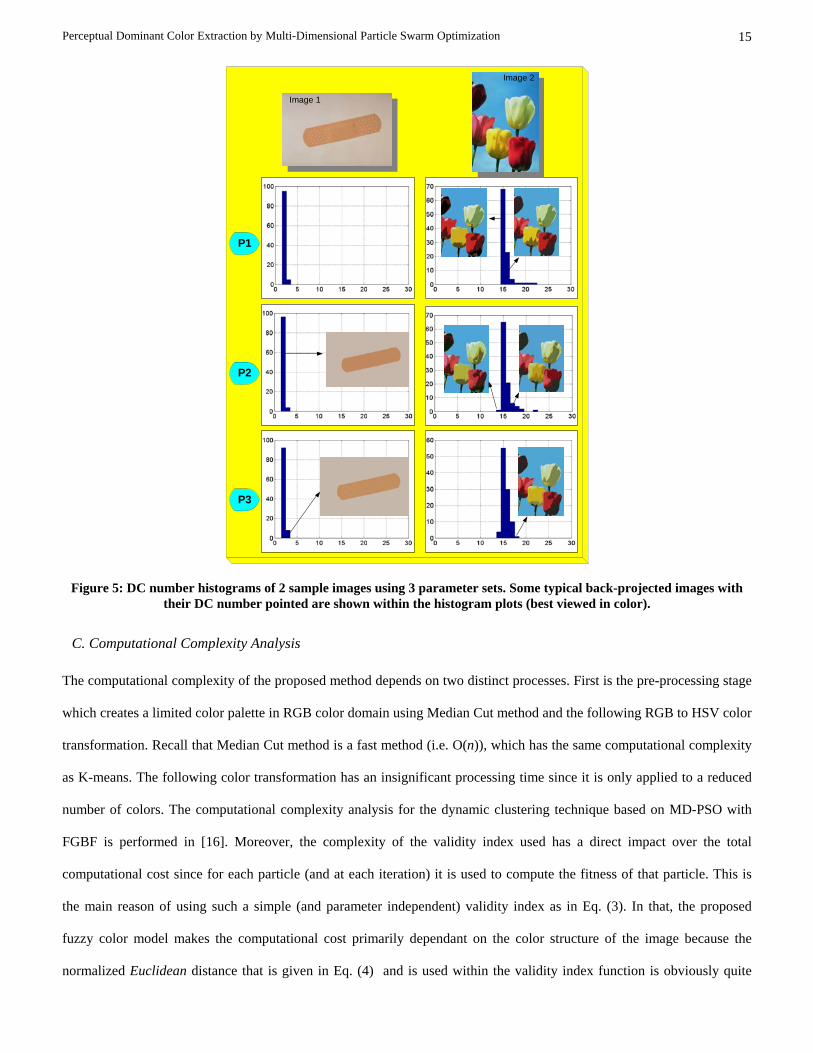
perceptually intact. Furthermore, in order to show that significant variations for two major parameters, iterNo and S, do
not cause drastic changes on the DC extraction, we will use three parameter sets: P1: S=50, iterNo=500, P2: S=50,
iterNo=1000 and P3: S=100, iterNo=1000. With each parameter set, we run the proposed technique (with random
initialization and random seeds) 100 times over two images. The DC number histograms per image and per parameter set
are as shown in Figure 5. In the first image (left), it is certain that the number of DCs is either 2 or 3, as one might argue
the yellowish color of the dot texture over the object can be counted as a DC or not. For the image on the right, it is rather
difficult to decide the exact number of DCs, since apart from blue, the remaining 5 colors, red, pink, yellow, green and
brown have certain shades. It is, first of all, obvious that the proposed technique is parameter invariant since in both cases,
the significant parameter variations, (particularly from P1 to P3 where both iterNo and S are doubled) only make a slight
difference over the histograms. A high degree of robustness (repeatability) is also achieved since all runs in the first image
yielded either 2 or 3 DCs, as desired and >95% of the runs in the second image, the number of DCs is in the range 16±1.
Among the back-projected images, it is evident that quite similar/almost identical DCs are anyway extracted even though
they have different number of DCs (e.g. see the two with 14 and 18 DCs). As a result of the perceptual model used, the
number of DCs can slightly vary, somewhat reflecting the subjectivity in HVS color perception, but similar DCs are
extracted by the proposed technique regardless of the parameter set used.
Perceptual Dominant Color Extraction by Multi-Dimensional Particle Swarm Optimization 15
Image 1
Image 2
P1
P3
P2
Figure 5: DC number histograms of 2 sample images using 3 parameter sets. Some typical back-projected images with their DC number pointed are shown within the histogram plots (best viewed in color).
C. Computational Complexity Analysis
The computational complexity of the proposed method depends on two distinct processes. First is the pre-processing stage
which creates a limited color palette in RGB color domain using Median Cut method and the following RGB to HSV color
transformation. Recall that Median Cut method is a fast method (i.e. O(n)), which has the same computational complexity
as K-means. The following color transformation has an insignificant processing time since it is only applied to a reduced
number of colors. The computational complexity analysis for the dynamic clustering technique based on MD-PSO with
FGBF is performed in [16]. Moreover, the complexity of the validity index used has a direct impact over the total
computational cost since for each particle (and at each iteration) it is used to compute the fitness of that particle. This is
the main reason of using such a simple (and parameter independent) validity index as in Eq. (3). In that, the proposed
fuzzy color model makes the computational cost primarily dependant on the color structure of the image because the
normalized Euclidean distance that is given in Eq. (4) and is used within the validity index function is obviously quite

Perceptual Dominant Color Extraction by Multi-Dimensional Particle Swarm Optimization 16
costly; however, recall that it may not be used at all for such color pairs that do not show any perceptual color similarity.
This further contributes the infeasibility of performing an accurate computational complexity analysis for the proposed
technique. For instance using a PC with P-IV 3GHz CPU and 1GB RAM, the proposed DC extraction technique with
parameter set P1 took 126 and 911 milliseconds respectively, for the two sample images shown in Figure 5. In short, as
any other evolutionary algorithm the DC extraction based on MD PSO with FGBF is slow in nature and may require
indefinite amount of iterations to converge to the global solution.
V. CONCLUSIONS
In this paper, we first presented two efficient techniques, MD PSO and FGBF, as a solution to common drawbacks of the
family of PSO methods such as a priori knowledge of the search space dimension and premature convergence to local
optima. A novel dynamic clustering technique based on MD PSO with FGBF is then proposed and applied for extracting
“true” number of dominant colors in an image. In order to improve the discrimination among different colors, a fuzzy
model over HSV (or HSL) color space is then proposed so as to achieve such a distance metric that reflects HVS
perception of color (dis-) similarity.
The DC extraction experiments using MPEG-7 DCD have shown that the method, although a part of the MPEG-7
standard, is highly dependent on the parameters. Moreover, since it is entirely based on K-means clustering method, it can
create artificial colors and/or misses some important DCs due to its convergence to local optima, thus yielding critical
over- and under-clustering. Consequently, a mixture of different colors,and hence artificial DCs or DCs with shifted
centroids, may eventually occur. This may also cause severe degradations over color textures since the regular textural
pattern cannot be preserved if the true DC centroids are missed or shifted. Using a simple clustering validity index, we
have successfully addressed these problems and a superior DC extraction is achieved with ground-truth DCs. The
optimum number of DCs can slightly vary on some images, but the number of DCs on such images is hardly definitive,
rather subjective and thus on such occasions the dynamic clustering based on a stochastic optimization technique can
converge to some near-optimal solutions. The proposed technique shows a high level of robustness for parameter
invariance and hence the main idea is that instead of struggling to fine tune several parameters to improve performance,
which is not straightforward – if possible at all, the focus can now be drawn to designing better validity index functions or
improving the ones for the purpose of higher DC extraction performance in terms of perceptual quality, which shall be the
subject to our future work.

Perceptual Dominant Color Extraction by Multi-Dimensional Particle Swarm Optimization 17
APPENDIX
A. MD PSO Algorithm
Instead of operating at a fixed dimension N, the MD PSO algorithm is designed to seek both positional and dimensional
optima within a dimension range, ( maxmin DND ≤≤ ). In order to accomplish this, each particle has two sets of components,
each of which has been subjected to two independent and consecutive processes. The first one is a regular positional PSO,
i.e. the traditional velocity updates and following positional moves in N dimensional search (solution) space. The second
one is a dimensional PSO, which allows the particle to navigate through dimensions. Accordingly, each particle keeps
track of its last position, velocity and personal best position (pbest) in a particular dimension so that when it re-visits the
same dimension at a later time, it can perform its regular “positional” fly using this information. The dimensional PSO
process of each particle may then move the particle to another dimension where it will remember its positional status and
keep “flying” within the positional PSO process in this dimension, and so on. The swarm, on the other hand, keeps track
of the gbest particles in all dimensions, each of which respectively indicates the best (global) position so far achieved and
can thus be used in the regular velocity update equation for that dimension. Similarly the dimensional PSO process of each
particle uses its personal best dimension in which the personal best fitness score has so far been achieved. Finally, the
swarm keeps track of the global best dimension, dbest, among all the personal best dimensions. The gbest particle in dbest
dimension represents the optimum solution (and the optimum dimension).
For the description of the positional and dimensional components, we shall use the following two-letter notation rule for
parameterization: the first letter signifies whether it is a position (x) or velocity (v) component and the second letter
corresponds to the type of the component: positional (x) or dimensional (d). As in PSO notation, we also used y for
personal best (pbest) position for the positional component. Therefore, the following enlists all the components of MD
PSO:
:)()(, txx txdjaa jth component (dimension) of the position of particle a, in dimension )(txda
:)()(, tvx txdjaa jth component (dimension) of the velocity of particle a, in dimension )(txda
:)()(, txy txdjaa jth component (dimension) of the personal best (pbest) position of particle a, in dimension )(txda
:)(ˆ tyx dj jth component (dimension) of the global best position of swarm, in dimension d
Perceptual Dominant Color Extraction by Multi-Dimensional Particle Swarm Optimization 18
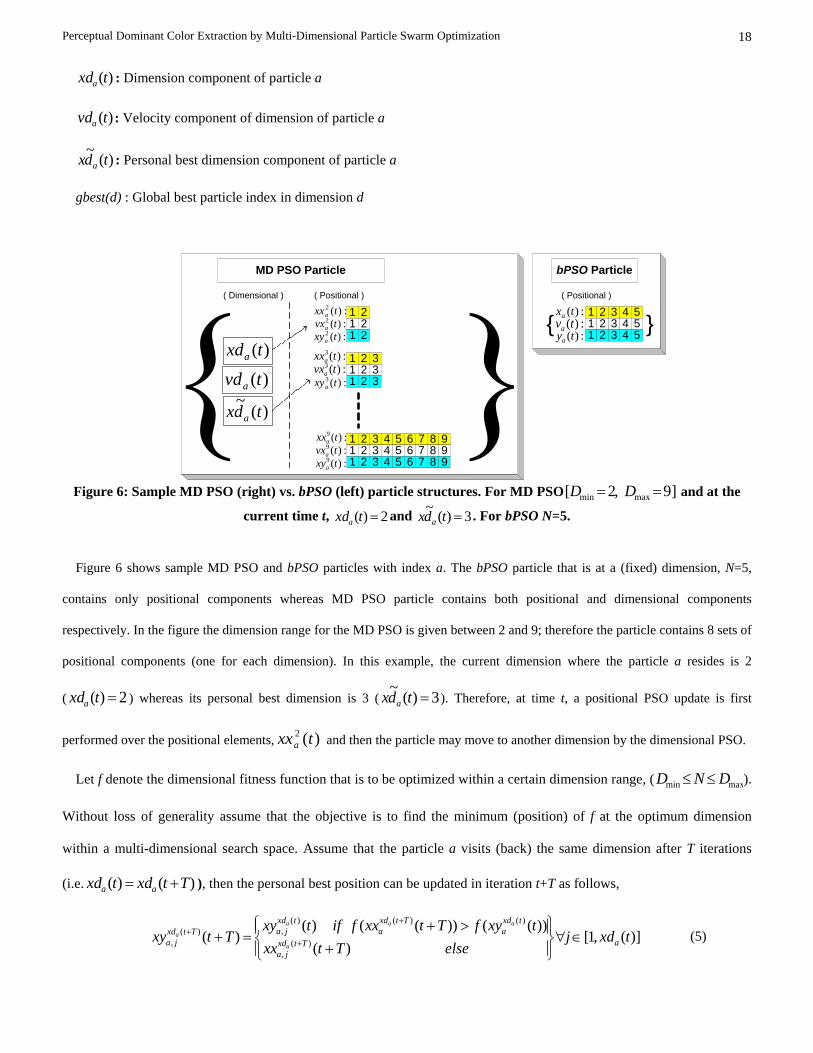
)(txda : Dimension component of particle a
)(tvda : Velocity component of dimension of particle a
)(~ tdx a : Personal best dimension component of particle a
gbest(d) : Global best particle index in dimension d
bPSO Particle
1 32 4 51 32 4 51 32 4 5{ }
:)(txa:)(tva:)(tya
( Positional )
1 32 4 5 76 8 91 32 4 5 76 8 91 32 4 5 76 8 9
1 21 21 2
1 321 321 32
)(txda
)(tvda
)(~ tdx a
:)(2 txxa
:)(2 txya
:)(2 tvxa
:)(3 txxa
:)(3 txya
:)(3 tvxa
:)(9 txxa
:)(9 txya
:)(9 tvxa
MD PSO Particle
( Dimensional ) ( Positional )
Figure 6: Sample MD PSO (right) vs. bPSO (left) particle structures. For MD PSO ]9,2[ maxmin == DD and at the
current time t, 2)( =txda and 3)(~=tdx a . For bPSO N=5.
Figure 6 shows sample MD PSO and bPSO particles with index a. The bPSO particle that is at a (fixed) dimension, N=5,
contains only positional components whereas MD PSO particle contains both positional and dimensional components
respectively. In the figure the dimension range for the MD PSO is given between 2 and 9; therefore the particle contains 8 sets of
positional components (one for each dimension). In this example, the current dimension where the particle a resides is 2
( 2)( =txda ) whereas its personal best dimension is 3 ( 3)(~=tdx a ). Therefore, at time t, a positional PSO update is first
performed over the positional elements, )(2 txxa and then the particle may move to another dimension by the dimensional PSO.
Let f denote the dimensional fitness function that is to be optimized within a certain dimension range, ( maxmin DND ≤≤ ).
Without loss of generality assume that the objective is to find the minimum (position) of f at the optimum dimension
within a multi-dimensional search space. Assume that the particle a visits (back) the same dimension after T iterations
(i.e. )()( Ttxdtxd aa += ), then the personal best position can be updated in iteration t+T as follows,
)](,1[)(
))(())(()()( )(
,
)()()(,)(
, txdjelseTtxx
txyfTtxxfiftxyTtxy aTtxd
ja
txda
Ttxda
txdjaTtxd
ja a
aaa
a ∈∀⎪⎭
⎪⎬⎫
⎪⎩
⎪⎨⎧
+>+
=+ +
++ (5)

Perceptual Dominant Color Extraction by Multi-Dimensional Particle Swarm Optimization 19
Furthermore, the personal best dimension of particle a can be updated in iteration t+1 as follows,
⎪⎭
⎪⎬⎫
⎪⎩
⎪⎨⎧
+>+
=++
elsetxdtxyftxxfiftdxtdx
a
tdxa
txdaa
a
aa
)1())(())1(()(~
)1(~ )(~)1(
(6)
Recall that gbest(d) is the index of the global best particle at dimension d
then[ ]
))(((minarg)()(ˆ,1)( txyftxytyx dbest
iSi
dbestdbestgbest
dbest
∈∀== . For a particular iteration t, and for a
particle ],1[ Sa ∈ , first the positional components are updated in the current dimension, )(txda , and then the dimensional
update is performed to determine the next (t+1st) dimension, )1( +txda . The positional update is performed for each
dimension component, )](,1[ txdj a∈ as follows:
( ) ( ))1()()1(
)()(ˆ)()()()()()()1()(
,)(
,)(
,
)(,
)(,22
)(,
)(,,11
)(,
)(,
++=+
−+−+=+
tvxtxxtxxtxxtyxtrctxxtxytrctvxtwtvx
txdja
txdja
txdja
txdja
txdjj
txdja
txdjaj
txdja
txdja
aaa
aaaaaa
(7)
Note that the particle’s new position, )1()( +txx txda
a , will still be in the same dimension, )(txda ; however, the particle
may fly to another dimension afterwards with the following dimensional update equations:
( ) ( )⎣ ⎦)1()()1(
)()()()(~)()()1( 2211
++=+−+−+=+
tvdtxdtxdtxddbesttrctxdtdxtrctvdtvd
aaa
aaaaa (8)
where ⎣ ⎦. is the floor operator. The inertia weight, w, is not used for dimensional velocity update, since no benefit was
obtained experimentally for dimensional PSO. To avoid exploding, along with the positional velocity limit maxV , two
more clamping operations are applied for dimensional PSO components, such as max, )1( VDtvd ja <+ and the initial
dimension range set by the user, maxmin )( DtxdD a ≤≤ . Once the MD PSO process terminates, the optimum solution will be
dbestyxˆ at the optimum dimension, dbest, achieved by the particle gbest(dbest) and finally the best (fitness) score achieved
will naturally be )ˆ( dbestyxf .
B. FGBF Algorithm
Fractional GB formation (FGBF) is designed to avoid premature convergence by providing a significant diversity
obtained from a proper fusion of the swarm’s best components (the individual dimension(s) of the current position of each
particle in the swarm). At each iteration in a bPSO process, an artificial GB particle (aGB) is (fractionally) formed by
selecting the most promising (or simply the best) particle (dimensional) components from the entire swarm. Therefore,

Perceptual Dominant Color Extraction by Multi-Dimensional Particle Swarm Optimization 20
especially during the initial steps, the FGBF can most of the time be a better alternative than the native gbest particle since
it has the advantage of assessing each dimension of every particle in the swarm individually, and forming the aGB particle
fractionally by using the most promising (or simply the best) components among them. This process naturally uses the
available diversity among individual dimensional components and thus it can prevent the swarm from trapping in local
optima. Suppose for a swarmξ , FGBF is performed in a PSO process at a (fixed) dimension N. In a particular iteration, t,
each PSO particle, a, has the following components: position ( )(, tx ja ), velocity ( )(, tv ja ) and the personal best position
( )(, ty ja ), ],1[ Nj ∈ ). The aGB particle, first of all, does not use a velocity term, since instead of velocity updates, the
aGB particle is fractionally (re-) created from the dimensions of some swarm particles. Consequently, )(tyaGB is set to
the best of )(txaGB and )1( −tyaGB . As a result, the FGBF process creates one aGB particle providing a (potential) GB
solution ( )(tyaGB ). Let ),( jaf be the dimensional fitness score of the jth component of particle a and the computation
of ),( jaf depends entirely on the optimization problem. It keeps track of partial fitness contributions from each individual
dimension from each particle’s position (the potential solution). For those problems without any constraints (e.g. nonlinear
function minimization), the best dimensional components can simply be selected whereas in others (e.g. clustering), some
promising components, which satisfy the constraints, are first selected, grouped and the most suitable one in each group is
then used for FGBF. Here, the internal nature of the problem will determine the “suitability” of the selection. Take for
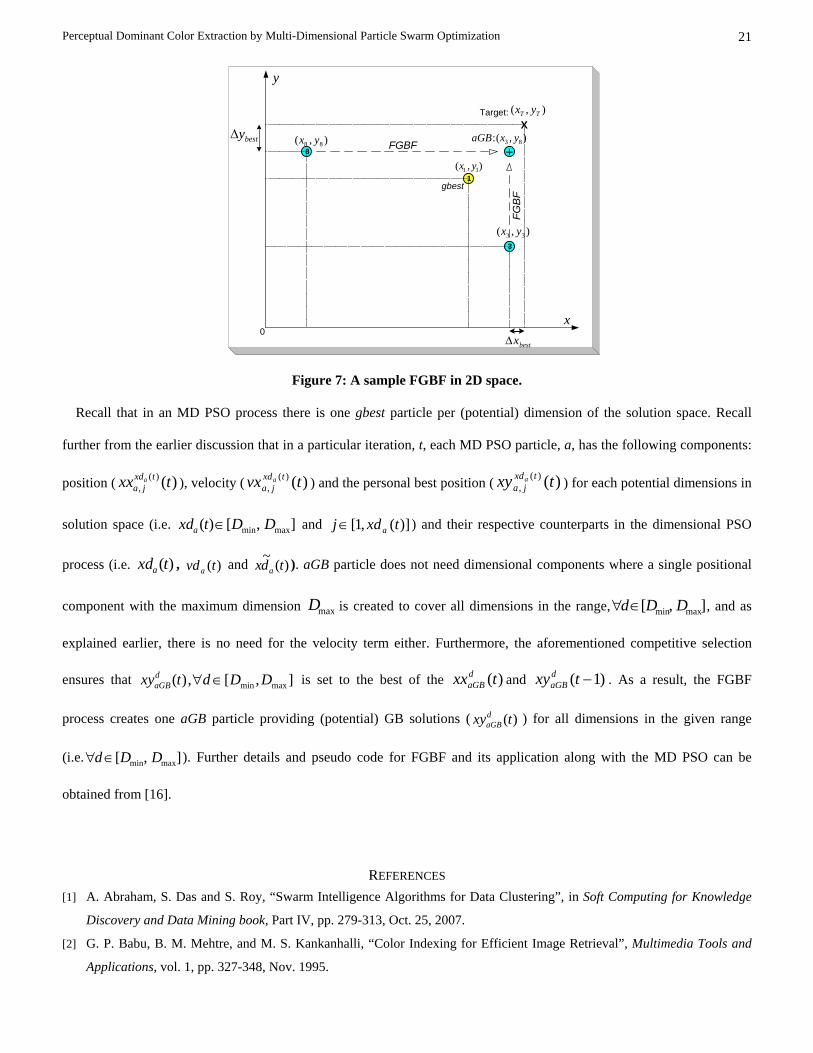
instance the function minimization problem as illustrated in Figure 7 where 2D space is used for illustration purposes. In
the figure, three particles in a swarm are ranked as the 1st (or the gbest), the 3rd and the 8th with respect to their proximity
to the target position (or the global solution) of some function. Although gbest particle (i.e. 1st ranked particle) is the
closest in the overall sense, the particles ranked 3rd and 8th provide the best x and y dimensions (closest to the target’s
respective dimensions) in the entire swarm and hence the aGB particle via FGBF yields a better (closer) particle than the
swarm’s gbest.
Perceptual Dominant Color Extraction by Multi-Dimensional Particle Swarm Optimization 21
X
1
3
8 +
gbest
x
y
bestxΔ
bestyΔ
),( 11 yx
),( 88 yx
),( 33 yx
),(: 83 yxaGB
0
),( TT yxTarget:
FGBF
FGB
F
Figure 7: A sample FGBF in 2D space.
Recall that in an MD PSO process there is one gbest particle per (potential) dimension of the solution space. Recall
further from the earlier discussion that in a particular iteration, t, each MD PSO particle, a, has the following components:
position ( )()(, txx txdjaa ), velocity ( )()(
, tvx txdjaa ) and the personal best position ( )()(
, txy txdjaa ) for each potential dimensions in
solution space (i.e. ],[)( maxmin DDtxda ∈ and )](,1[ txdj a∈ ) and their respective counterparts in the dimensional PSO
process (i.e. )(txda , )(tvda and )(~ tdx a ). aGB particle does not need dimensional components where a single positional
component with the maximum dimension maxD is created to cover all dimensions in the range, ],[ maxmin DDd∈∀ , and as
explained earlier, there is no need for the velocity term either. Furthermore, the aforementioned competitive selection
ensures that ],[,)( maxmin DDdtxydaGB ∈∀ is set to the best of the )(txxd
aGB and )1( −txydaGB . As a result, the FGBF
process creates one aGB particle providing (potential) GB solutions ( )(txydaGB ) for all dimensions in the given range
(i.e. ],[ maxmin DDd ∈∀ ). Further details and pseudo code for FGBF and its application along with the MD PSO can be
obtained from [16].
REFERENCES [1] A. Abraham, S. Das and S. Roy, “Swarm Intelligence Algorithms for Data Clustering”, in Soft Computing for Knowledge
Discovery and Data Mining book, Part IV, pp. 279-313, Oct. 25, 2007.
[2] G. P. Babu, B. M. Mehtre, and M. S. Kankanhalli, “Color Indexing for Efficient Image Retrieval”, Multimedia Tools and
Applications, vol. 1, pp. 327-348, Nov. 1995.

Perceptual Dominant Color Extraction by Multi-Dimensional Particle Swarm Optimization 22
[3] T. Back and H.P. Schwefel, “An overview of evolutionary algorithm for parameter optimization”, Evolution. Comput. 1, pp.
1–23, 1993.
[4] T. Back and F. Kursawe, “Evolutionary algorithms for fuzzy logic: a brief overview”, In Fuzzy Logic and Soft Computing,
World Scientific, pp. 3–10, Singapore, 1995.
[5] D. L. Davies, and D.W. Bouldin, “A cluster separation measure”, IEEE Trans. on Pattern Analysis and Machine
Intelligence, pp. 224–227, 1979.
[6] Y. Deng, C. Kenney, M. S. Moore, and B. S. Manjunath, “Peer Group Filtering and Perceptual Color Image Quantization”,
In Proc. of IEEE Int. Symposium on Circuits and Systems, ISCAS, vol. 4, pp. 21-24, 1999.
[7] J. C. Dunn, “Well separated clusters and optimal fuzzy partitions”, Journal of Cybernetics, vol. 4, pp. 95–104, 1974.
[8] J. Fauqueur and N. Boujemaa, “Region-Based Image Retrieval: Fast Coarse Segmentation and Fine Color Description”, in
Proc. of IEEE Int. Conf. on Image Processing (ICIP'2002), Rochester, USA, Sep. 2002.
[9] A. P. Engelbrecht, Fundamentals of Computational Swarm Intelligence, John Wiley & Sons, 2005.
[10] U.M. Fayyad, G.P. Shapire, P. Smyth and R. Uthurusamy, Advances in Knowledge Discovery and Data Mining, MIT Press,
Cambridge, MA, 1996.
[11] D. Goldberg, Genetic Algorithms in Search, Optimization and Machine Learning, Addison-Wesley, Reading, pp. 1-25. MA,
1989.
[12] M. Halkidi, Y. Batistakis, M. Vazirgiannis, “On Cluster Validation Techniques”, Journal of Intelligent Information Systems,
vol. 17 no. 2, 3. pp. 107-145, 2001.
[13] T. Ince, S. Kiranyaz, and M. Gabbouj, “A Generic and Robust System for Automated Patient-specific Classification of
Electrocardiogram Signals”, IEEE Transactions on Biomedical Engineering, vol. 56, issue 5, pp. 1415-1426, May 2009.
[14] A. K. Jain, M.N. Murthy and P.J. Flynn, “Data Clustering: A Review”, ACM Computing Reviews, Nov 1999.
[15] J. Kennedy, R Eberhart., “Particle swarm optimization”, in Proc. of IEEE Int. Conf. On Neural Networks, vol. 4, pp. 1942–
1948, Perth, Australia, 1995.
[16] S. Kiranyaz, T. Ince, A. Yildirim and M. Gabbouj, “Fractional Particle Swarm Optimization in Multi-Dimensional Search
Space”, IEEE Transactions on Systems, Man, and Cybernetics – Part B, in Press, doi:10.1016/j.neunet.2009.05.013, 2009.
[17] S. Kiranyaz, J. Pulkkinen and M. Gabbouj, "Multi-dimensional Particle Swarm Optimization for Dynamic Environments",
in Proc. of 5th Int. Conf. On Innovations in Information Technology (Innovations’08), Al Ain, UAE, Dec. 2008.
[18] S. Kiranyaz, T. Ince, A. Yildirim and M. Gabbouj, “Unsupervised Design of Artificial Neural Networks via Multi-
Dimensional Particle Swarm Optimization”, in Proc. of Int. Conf. on Pattern Recognition, (ICPR 2008), Tampa, Florida,
US, Dec. 2008.
[19] J. Koza, Genetic Programming: On the Programming of Computers by means of Natural Selection, MIT Press, Cambridge,
Massachussetts, 1992.
[20] A. Kruger, “Median-cut color quantization,” Dr. Dobb’s Journal, pp. 46-54 and 91-92, Sept. 1994.
[21] J. R. Kruskal, “On the shortest spanning subtree of a graph and the traveling salesman problem”, Proc. of AMS, 71, 1956.
[22] A. Mojsilovic, J. Kovacevic, J. Hu, R. J. Safranek, K. Ganapathy, “Matching and Retrieval based on the Vocabulary and
Grammar of Color Patterns”, in IEEE Trans. on Image Processing, vol. 9, no. 1, pp. 38-54, Jan. 2000.
[23] A. Mojsilovic, J. Hu and E. Soljanin, “Extraction of Perceptually Important Colors and Similarity Measurement for Image
Matching, Retrieval and Analysis”, IEEE Trans. On Image Proc., vol. 11, pp. 1238-1248, Nov. 2002.
Perceptual Dominant Color Extraction by Multi-Dimensional Particle Swarm Optimization 23
[24] B. S. Manjunath, J.-R. Ohm, V. V. Vasudevan, and A. Yamada, “Color and Texture Descriptors”, IEEE Trans. On Circuits
and Systems for Video Technology, vol. 11, pp. 703-715, Jun. 2001.
[25] M. Omran, A. Salman and A. P. Engelbrecht, “Image Classification using Particle Swarm Optimization”, In Conf. on
Simulated Evolution and Learning, vol. 1, pp. 370–374, 2002.
[26] M. G. Omran, A. Salman, and A.P. Engelbrecht, “Dynamic Clustering using Particle Swarm Optimization with Application
in Image Segmentation”, In Pattern Analysis and Applications, vol. 8, pp. 332-344, 2006.
[27] M. G. Omran, A. Salman, and A.P. Engelbrecht, Particle Swarm Optimization for Pattern Recognition and Image
Processing, Springer Berlin, 2006.
[28] N.R. Pal and J. Biswas, “Cluster validation using graph theoretic concepts”, Pattern Recognition, pp. 847–857, 1997.
[29] Y. Shi and R.C. Eberhart, “A Modified Particle Swarm Optimizer”, In Proc. of the IEEE Congress on Evolutionary
Computation, pp. 69-73, 1998.
[30] J. Riget and J. S. Vesterstrom, “A Diversity-Guided Particle Swarm Optimizer - The ARPSO”, Technical report,
Department of Computer Science, University of Aarhus, 2002.
[31] R.H. Turi, “Clustering-based colour image segmentation”, PhD Thesis, Monash University, Australia, 2001.
[32] F. Van den Bergh, “An Analysis of Particle Swarm Optimizers”, PhD thesis, Department of Computer Science, University
of Pretoria, Pretoria, South Africa, 2002.
[33] F. Van den Bergh and A.P. Engelbrecht, “A New Locally Convergent Particle Swarm Optimizer”, In Proc. of the IEEE
International Conference on Systems, Man, and Cybernetics, pp. 96-101, 2002.
[34] E. L. Van den Broek, P. M. F. Kisters, and L. G. Vuurpijl, “The utilization of human color categorization for content-based
image retrieval”, in Proc. of Human Vision and Electronic Imaging IX, pp. 351-362, San José, CA (SPIE, 5292), 2004.
[35] Z. Wang, A. C. Bovik, H. R. Sheikh and E. P. Simoncelli, “Image quality assessment: From error visibility to structural
similarity,” IEEE Transactions on Image Processing, vol. 13, no. 4, pp. 600-612, Apr. 2004.