Perceptions of Vocational and Technical Qualifications in ...
77
Perceptions of Vocational and Technical Qualifications in England An Ofqual commissioned report June 2021 Ofqual/21/6802/1
Transcript of Perceptions of Vocational and Technical Qualifications in ...

Perceptions of Vocational and Technical Qualifications in England
An Ofqual commissioned report
June 2021
Ofqual/21/6802/1

Perceptions of Vocational and Technical Qualifications in England
Copyright 2020 YouGov plc. 2
Contents Perceptions of Vocational and Technical Qualifications in England ........................... 1
Introduction ................................................................................................................ 4
Background ............................................................................................................. 4
Glossary of terms .................................................................................................... 5
Executive summary .................................................................................................... 7
Perceptions of the qualifications system in 2020 .................................................... 7
Employer perceptions ............................................................................................. 7
All provider perceptions .......................................................................................... 8
Learner perceptions ................................................................................................ 8
Section 1: Perceptions of vocational and technical qualifications, functional skills
qualifications and end-point assessments in 2020 ..................................................... 9
Key findings – Perceptions of VTQs, FSQs and EPAs in 2020 ............................... 9
Perceptions of vocational and technical qualifications in 2020.............................. 10
Section 2: Perceptions of Functional Skills Qualifications ........................................ 14
Key findings – Functional Skills Qualifications ...................................................... 14
Understanding of Functional Skills Qualifications by employers ........................... 15
Why learners chose Functional Skills Qualifications ............................................. 16
Benefits associated with Functional Skills Qualifications by learners .................... 17
Perceptions of Functional Skills Qualifications: value and flexibility ...................... 19
Perceptions of Functional Skills Qualifications: purpose and future opportunity ... 24
Employer reasons for perceptions of Functional Skills Qualifications ................... 29
Section 3: Perceptions of Other Vocational and Technical Qualifications ................ 30
Key Findings – Other Vocational and Technical Qualifications ............................. 30
Understanding of other Vocational and Technical Qualifications by employers .... 32
Why learners chose other Vocational and Technical Qualifications ...................... 34
Benefits associated with other Vocational and Technical Qualifications by learners
.............................................................................................................................. 35
Perceptions of other Vocational and Technical Qualifications: value and flexibility
.............................................................................................................................. 36
Perceptions of other Vocational and Technical Qualifications: purpose and future
opportunity ............................................................................................................ 40
Employers’ reasons for perceptions of other Vocational and Technical
Qualifications ........................................................................................................ 49

Perceptions of Vocational and Technical Qualifications in England
Copyright 2020 YouGov plc. 3
Section 4: Perceptions of End-Point Assessments .................................................. 50
Key findings – End-Point Assessments ................................................................ 50
Understanding of End-Point Assessments ............................................................ 52
Why learners chose an apprenticeship ................................................................. 58
Benefits associated with apprenticeships by learners ........................................... 59
Section 5: Perceptions of T levels ............................................................................ 66
Key Findings – T Levels ........................................................................................ 66
Understanding of T levels ..................................................................................... 67
Perceptions of T levels .......................................................................................... 68
Section 6: Clarity regarding industry pertinent qualifications .................................... 70
Key Findings – Clarity regarding relevant qualifications ........................................ 70
Section 6: Use of qualifications for recruitment and training ..................................... 72
Key Findings – Other Vocational and Technical Qualifications ............................. 72
Qualifications deemed essential at different occupational levels .......................... 73

Perceptions of Vocational and Technical Qualifications in England
Copyright 2020 YouGov plc. 4
Introduction
Background
This report presents the findings of wave 4 of the Perceptions of Vocational and Technical
Qualifications Survey and should be read alongside the background information document. To best
appreciate the display of the data, this report should be viewed in colour.
The project was commissioned by Ofqual and conducted by YouGov. The aim of this project was to
investigate all providers’, learners’ and employers’ perceptions of vocational and technical
qualifications in England. The survey also explored perceptions of a number of topical aspects of the
system for vocational and technical qualifications.
The survey was conducted using an online method. The fieldwork for this wave was conducted
between 22nd January and 10th March 2021.
The final achieved samples were structured to be representative of the relevant target populations.
However, while the sampling approach aimed to identify groups of participants who were
representative, given that a survey of this kind only captures the views of those involved, throughout
this report responses attributed to groups reflect only those respondents included in the study.
Further information on sampling and methodology is available in the accompanying background
information document.
YouGov and Ofqual advise against drawing conclusions based on differences in the data in
comparison with wave 1 and wave 2. This is due to key changes in the sampling approach and survey
mode which were put into place for wave 3 and wave 4:
1) The sample for learners and employers was drawn from the YouGov panel in waves 3 and 4,
as well as a portion of the provider group sample. By comparison, each sample was selected
from targeted contact databases in previous waves.
2) Fieldwork for the employers’ survey was conducted online in waves 3 and 4, whereas in
previous waves it was done by telephone.
3) Weighting was applied to the waves 3 and 4 results to produce representative samples, which
was not done previously.
Throughout the report, all references to differences in findings between waves refer to statistically
significant differences at an alpha level of 0.05. In some instances, apparent differences between
figures may not be considered ‘statistically significant’ due to sample sizes. Non-significant findings
do not necessarily mean that no change has occurred (for example year on year), but a failure to
detect differences due to change, from differences due to sampling variation.

Perceptions of Vocational and Technical Qualifications in England
Copyright 2020 YouGov plc. 5
Glossary of terms Adult Community Education (ACE)
Adult Community Education includes a range of community based and outreach learning
opportunities, primarily managed and delivered by local authorities and general further education
colleges.
All provider types
The scope of the survey sample included providers of all types such as in the following categories:
Further Education (FE); Higher Education (HE); private class-based; private work-based; public sector
community based; public sector ‘other’; schools; voluntary sector education; Independent Training
Provider (ITP). ITPs are distinct from other types of Further Education providers as they are
‘independent’ and not run or directly controlled by the state. In the report the category ‘All provider
types’, may be referred to as the provider group or all types of providers or all providers.
Apprenticeship frameworks
These were developed by sector bodies, primarily focused on qualifications. They are being phased
out by 2020-21 and being replaced by apprenticeship standards. Framework apprenticeships are
assessed throughout by completing a unit at a time but there is no endpoint assessment.
Apprenticeship standards
New apprenticeship standards, developed by employers, to show what an apprentice will be doing,
and the skills required of them, by job role. Standards are developed by employer groups known as
‘trailblazers’. Standards are occupation-focused rather than qualification-led, with the apprentice
being assessed through an end-point assessment. The Institute of Apprenticeships and Technical
Education (‘the Institute’), supports employer groups in the development of apprenticeship
standards. The Institute is an employer-led organisation focussed on enabling people of all ages and
backgrounds have the opportunity to maximise their potential and contribute to improving social
mobility and the UK’s productivity. The Institute also has responsibility for managing the
development and approval of T levels.
Awarding organisation
An organisation recognised by the qualifications’ regulators in England, Wales or Northern Ireland to
develop, deliver and award qualifications.
Effective base
When sampling is undertaken, it creates a ‘design effect’ that can impact upon the reliability of the
information collected. The effective base size is the base size that is left when removing this effect. It
is used for significance testing.
End-point assessment of apprenticeship (EPA)
The final assessment for an apprenticeship standard, taken at the end of the apprentice’s training
and used to determine whether they are occupationally competent and will pass their
apprenticeship.
Functional Skills qualifications (FSQ)
Functional Skills qualifications are available in English, maths and ICT and are available in levels from
Entry 1 to Level 2. Functional Skills assessments test the fundamental, applied skills in these subjects
for life, learning and work. Reformed functional skills qualifications were introduced for first
teaching in September 2019, and this research does not cover perceptions of these qualifications.

Perceptions of Vocational and Technical Qualifications in England
Copyright 2020 YouGov plc. 6
Further Education (FE)
Further education (FE) includes any study after secondary education that’s not part of higher
education (that is, not taken as part of an undergraduate or graduate degree).
Local Authorities (LAs)
Local Authorities (LAs) are responsible for a range of vital services for people and businesses in
defined areas, including social care, schools and adult education.
Other Vocational and Technical Qualifications (VTQ)
These normally have a vocational focus and include, amongst others, Technical Qualifications and
National Vocational Qualifications (NVQs). For this report, this term refers to qualifications other
than FSQs and EPAs.
T Levels T Levels are new qualifications which follow GCSEs and are equivalent to 3 A levels. These 2-year
qualifications, which launched September 2020, have been developed in collaboration with
employers and businesses. T Levels offer students a mixture of classroom learning, through a
compulsory Technical Qualification and English, maths and digital provision, and ‘on-the-job’
experience during an industry placement of at least 315 hours (approximately 45 days). Ofqual is
responsible for regulating the Technical Qualification component of the T Level.

Perceptions of Vocational and Technical Qualifications in England
Copyright 2020 YouGov plc. 7
Executive summary The below summary gives an overview of the key findings for each of the three respondent groups.
This means for example, that although the same questions were answered on understanding of
particular qualifications across the groups, responses to each of these statements are not all
included in the below summaries. When making comparisons across groups, please refer to the
relevant charts in the main body of the report.
Perceptions of the qualifications system in 2020 • Providers were most likely to agree that in 2020 Vocational and Technical qualifications
(VTQs) were trusted qualifications (64%) compared with Functional Skills Qualifications
(FSQs) being trusted (52%) and end-point assessments (EPAs) being trusted (40%).
• Learners agreed in similar proportions that in 2020 standards were maintained in VTQs
(39%) and in FSQs (37%), with a lower proportion agreeing that standards were maintained
in EPAs in 2020 (29%).
• Almost the same proportion of employers agreed that VTQs were good preparation for work
(31%) and further study (29%).
• Learners agreed in similar proportions that VTQs (39%), FSQs (36%) and EPAs (34%) in 2020
were well understood by people.
Employer perceptions • Over two-fifths (45%) of employers reported that they value VTQs (comparable with wave 3
findings), although this is lower than the value reported amongst the provider group and
learners. The vast majority (92%) of the provider group said that they value VTQs, higher
than the proportion of learners (71%) stating this.
• Organisation size was a key factor influencing levels of understanding of qualifications and
EPAs and employers’ likelihood of holding positive perceptions of them. Large employers
were more likely than smaller employers to be aware of each of the qualifications.
• Approximately three in ten (28%) employers reported that they have a very or quite good
understanding of FSQs, comparable with wave 3. Of those employers with at least some
understanding of FSQs, approximately a third (32%) agreed that their organisation values
them.
• Approximately two-fifths (43%) of employers reported having a very or quite good
understanding of VTQs, comparable with wave 3 findings.
• Fifteen percent of employers reported having a very or quite good understanding of EPAs,
also comparable with wave 3 findings.
• Seven in ten (70%) employers who have arranged or funded training for employees in last 12
months said that for their employees who achieve a VTQ outside of an apprenticeship, this
leads to new responsibilities at least some of the time. Sixty-five percent reported said that
this led to a promotion or improved job status, a comparable proportion (64%) said this
leads to a pay rise at least some of the time.

Perceptions of Vocational and Technical Qualifications in England
Copyright 2020 YouGov plc. 8
All provider perceptions • Two-thirds (67%) of the provider group agreed that they value FSQs, making them the group
most likely to support this statement. This pattern was also observed in wave 3.
• Half (50%) of the provider group agreed that FSQs offer value for money, comparable with
wave 3 findings.
• Understanding of EPAs of apprenticeships was highest among the provider group, with
three-fifths (61%) of providers reporting having a very or quite good understanding of these.
This was also comparable with wave 3.
• In keeping with general higher levels of understanding of qualifications among the provider
group, awareness that EPAs are specific to apprenticeship standards was highest among this
group (82%).
• The vast majority (92%) of the provider group say that they value VTQs. Levels of agreement
among providers remains higher than for learners (71%) and employers (45%), with figures
comparable to the previous wave.
• There has been an increase in the proportion of providers saying that VTQs offer value for
money (63% to 76%), that they prepare learners well for the workplace (76% to 85%) and
that they are good preparation for further study (69% to 78%).
Learner perceptions • Approximately three-fifths (59%) of learners said that they value FSQs. A similar proportion
(56%) agreed that these qualifications offer good value for money. These figures were
comparable with wave 3 findings.
• Learners who had undertaken an FSQ in the last three years most commonly said they
decided to do so in order to progress in their studies (34%). This was particularly true among
younger learners aged 18 or under (50%).
• Among learners who had started taking an FSQ, the top perceived benefits of taking them
were progressing to higher level qualifications (27%), becoming more confident using
English, maths or ICT (24%) and having better job prospects in the longer term (23%).
• Among learners, understanding of EPAs of apprenticeships was lower than among the
provider group, but higher than for employers. Just over half (54%) of learners reported a
good (very or quite good) understanding of these. This was comparable with wave 3
findings.
• It was most common for learners to say that they decided to take an apprenticeship to
progress in their current job (41%), because they can learn new skills on the job (39%) or in
order to find a better job (30%).
• Roughly half (52%) of learners agreed that the availability of VTQs is sufficiently flexible,
comparable with wave 3 (46%).

Perceptions of Vocational and Technical Qualifications in England
Copyright 2020 YouGov plc. 9
Section 1: Perceptions of vocational and technical qualifications, functional skills qualifications and end-point
assessments in 2020
For wave 4, a new series of questions were added to the survey to investigate perceptions specific to the qualifications system in 2020. Stakeholders across all groups were presented with statements and questions similar to those asked in the main annual survey but asked to think specifically about perceptions they had from March 2020 up until December 2020. This section of the report explores the general perceptions of VTQs, FSQs and EPAs of assessments in relation to 2020.
Key findings – Perceptions of VTQs, FSQs and EPAs in 2020
• Providers were most likely to agree that in 2020 VTQs were trusted qualifications (64%)
compared with FSQs being trusted (52%) and EPAs being trusted (40%).
• Learners agreed in similar proportions that in 2020 standards were maintained in VTQs
(39%) and in FSQs (37%), with a lower proportion agreeing that standards were maintained
in EPAs in 2020 (29%).
• Almost the same proportion of employers agreed that VTQs were good preparation for work
(31%) and further study (29%).
• Learners agreed in similar proportions that VTQs (39%), FSQs (36%) and EPAs (34%) in 2020
were well understood by people.

Perceptions of Vocational and Technical Qualifications in England
Copyright 2020 YouGov plc. 10
Perceptions of vocational and technical qualifications in 2020
For figures 1, 2 and 3, the wave 4 effective base is: All employers, 1,391, all providers, 304, all
learners, 521.
Seven in ten (70%) providers agreed that in 2020 VTQs were good preparation for work and a similar proportion (66%) agreed that VTQs were good preparation for further study. The proportion of learners who agreed that in 2020 VTQs were good preparation for both work and for study were the same (both 54%). There was relatively high agreement that in 2020 VTQs were trusted qualifications among providers (64%) and learners (51%), with less agreement indicated among employers (28%). Reflecting on 2020, 51% of providers and 39% of learners agreed that VTQs were well understood by people. Only 12% of employers agreed, although a sizeable minority of employers (27%) said they did not know. In fact, for each of the statements shown in figure 1, a relatively high proportion of employers were unsure. 50% of providers, 39% of learners and 14% of employers agreed that in 2020 standards were maintained in VTQs.

Perceptions of Vocational and Technical Qualifications in England
Copyright 2020 YouGov plc. 11
Figure 1. Results for perceptions of VTQs in 2020 (employers, providers, learners)
Reflecting on 2020, 46% of providers and 37% of learners agreed that FSQs standards were maintained that year. 52% of providers, 44% of learners and 19% of employers agreed that in 2020 FSQs were trusted qualifications. 45% of providers, 36% of learners and 12% of employers agreed that FSQs were well understood by people. Over half (54%) of providers agreed that in 2020 FSQs were good preparation for work and a similar proportion (52%) of providers agreed that FSQs were good preparation for further study in 2020. Almost the same proportion of learners agreed that in 2020 FSQs were good preparation for work (48%) and for study (49%).

Perceptions of Vocational and Technical Qualifications in England
Copyright 2020 YouGov plc. 12
Figure 2. Results for perceptions of Functional Skills qualifications in 2020
(employers, providers, learners)

Perceptions of Vocational and Technical Qualifications in England
Copyright 2020 YouGov plc. 13
Reflecting on 2020, a third (34%) of both providers and learners agreed that EPAs were well understood by people. Only 11% of employers agreed, although approximately half (49%) did not know. For each of the statements shown in figure 3, a relatively high proportion of employers were unsure. There was relatively higher agreement that in 2020 EPAs were trusted qualifications, as 42% of learners, 40% of providers and 15% of employers agreed that VTQs were trusted. Thinking about 2020, 36% of providers, 29% of learners and 9% of employers agreed that standards were maintained in EPAs. Forty-five percent of learners agreed that in 2020 EPAs were good preparation for further study and 41% of learners agreed that EPAs were good preparation for work. Almost the same proportion of employers agreed that in 2020 EPAs were good preparation for work (18%) and for further study (17%).
Figure 3. Results for perceptions of EPAs in 2020 (employers, providers, learners)

Perceptions of Vocational and Technical Qualifications in England
Copyright 2020 YouGov plc. 14
Section 2: Perceptions of Functional Skills Qualifications
Key findings – Functional Skills Qualifications
• Among employers, approximately three in ten (28%) reported having a very or quite good
understanding of FSQs. Large employers (18%) were significantly more likely than smaller
employers to report having a very good understanding of these.
• Learners who had undertaken an FSQ in the last three years most commonly said they
decided to do so in order to progress in their studies (34%). This was particularly true among
younger learners aged 18 or under (50%).
• Among learners who had started taking an FSQ, the top perceived benefits of taking them
were progressing to higher level qualifications (27%), becoming more confident using
English, maths or ICT (24%) and having better job prospects in the longer term (23%).
• The provider group were most likely (67%) to agree that they value FSQs, followed by three-
fifths (59%) of learners and a third (32%) of employers. These figures were all comparable
with wave 3 findings. Large-sized employers (52%) and medium employers (50%) remain
more likely than small (33%) and micro (30%) employers to agree that their organisation
values FSQs.
• Over half (56%) of learners agreed that FSQs offer value for money, as did a similar
proportion (50%) of the provider group.
• Among learners, there was an increase in the proportion of learners saying that the
availability of FSQs is sufficiently flexible (from 39% in wave 3 to 46%). The proportion of
employers agreeing with this was much lower (20%). Each of these figures were comparable
with wave 3.
• Over half of learners and the provider group (both 58%) agreed that those holding FSQs
have the appropriate level of skill in English needed by their organisation, higher than for
employers (30%).
• Twenty-eight percent of employers agreed that those holding FSQs have the appropriate
level of skill in maths needed by their organisation. A notably larger group of learners and
providers agreed when asked the same question (both 58%). For both learners and
providers, this is an increase in comparison to wave 3 (50% learners and 48% providers).
• Agreement levels that those holding FSQs have the appropriate level of skill in ICT were
higher among learners (51%) and providers (46%), and relatively lower for employers (27%).
Among learners, this is an increase in levels of agreement since wave 3 (43%), though figures
are broadly comparable for the other stakeholder groups.
• Two-thirds of learners (68%) agreed that FSQs are good preparation for further study,
comparable with wave 3 (64%).

Perceptions of Vocational and Technical Qualifications in England
Copyright 2020 YouGov plc. 15
Understanding of Functional Skills Qualifications by employers
For figure 4, the wave 4 effective base is: All employers, 1,391.
Approximately three in ten (28%) employers reported that they have a very or quite good understanding of Functional Skills Qualifications (FSQs), comparable with wave 3. A slightly lower proportion (24%) said that they have a limited understanding. Overall, 17% of employers reported not having a very good understanding, leaving a third (31%) saying they have no understanding at all of FSQs.
Large employers were significantly more likely than those in smaller organisations to report having a very good understanding of FSQs. Eighteen percent of employers at large organisations with 250 or more employees said they have a very good understanding, this was the case for just 15% of medium organisations (50 to 249 employees), 10% of small organisations (10 to 49 employees) and 8% of micro organisations (2 to 9 employees). Differences in levels of understanding also appear when comparing by sector. Public sector employers (18%) were significantly more likely than private sector employers (8%) to say they have a very good understanding of FSQs. This likely reflects organisation size as public sector organisations tend to be larger.
Figure 4. Results for ‘Please indicate your level of understanding about the four types
of qualifications listed below.’ – Functional Skills qualifications (Employers)
Please note that YouGov and Ofqual advise against drawing conclusions based on differences in the
data in comparison with waves 1 and 2. This is due to key changes in the sampling approach and
survey mode made for wave 3, which are outlined in more detail in the Introduction.

Perceptions of Vocational and Technical Qualifications in England
Copyright 2020 YouGov plc. 16
Why learners chose Functional Skills Qualifications
For figure 5, the wave 4 effective base is: Learners who are studying or have studied an FSQ in the
last three years, 189.
Most commonly, learners who had undertaken an FSQ in English, maths, or ICT in the last three years said they decided to do so in order to progress in their studies (34%), which is likely due to these qualifications being a mandatory component of some programmes of study. This was also the most common reason in wave 3, with the same proportion reporting this (33%). The next most common reasons reported by learners were that they wanted to improve their skills (24%), needed to complete it as part of an apprenticeship (17%) or did so in order to or get a job (15%). Younger learners aged 18 or under (50%) were significantly more likely to say that they decided to take an FSQ to progress in their studies than learners aged 25+ (24%). Meanwhile, older learners aged 25+ were more likely than younger people (aged 18 or under) to say they did so as part of an apprenticeship (23% vs. 5%) or to progress in their current job (17% vs. 5%). They were also more likely to report deciding to take an FSQ due to not passing a GCSE in English, maths or ICT (17% vs. 3%).
Figure 5. Results for ‘Why did you decide to take a Functional Skills qualification?’
(Learners)
Please note that YouGov and Ofqual advise against drawing conclusions based on differences in the
data in comparison with waves 1 and 2. This is due to key changes in the sampling approach and
survey mode made for wave 3, which are outlined in more detail in the Introduction.

Perceptions of Vocational and Technical Qualifications in England
Copyright 2020 YouGov plc. 17
Benefits associated with Functional Skills Qualifications by learners
For figure 6, the wave 4 effective base is: Learners who are studying or have studied an FSQ in the
last three years, 189.
Learners who had undertaken an FSQ in the last three years perceived that the top benefits associated with taking these qualifications were progressing to higher level qualifications (27%), becoming more confident using English, maths or ICT (24%) and having better have better job prospects in the longer term (23%). These were also the benefits most commonly mentioned in wave 3. It was less common for learners to cite being able to progress in their current job (12%) as a benefit, perhaps due to learners not currently being employed. Older learners aged 25+ were more likely than younger learners aged 18 and under to feel that being able to complete an apprenticeship (21% vs. 7%) is a benefit of undertaking an FSQ. By contrast, younger learners aged 18 and under were more likely than older learners aged 25+ to cite being able to progress to higher level qualifications (40% vs. 17%). Younger learners were also more likely to be unsure of the benefits (21% vs. 7%).

Perceptions of Vocational and Technical Qualifications in England
Copyright 2020 YouGov plc. 18
Figure 6. Results for ‘Now that you have started learning/ have completed learning,
what benefits do you expect from taking a Functional Skills qualification/s?’
(Learners). ‘Don’t know’ was added in wave 3.
Please note that YouGov and Ofqual advise against drawing conclusions based on differences in the
data in comparison with waves 1 and 2. This is due to key changes in the sampling approach and
survey mode made for wave 3, which are outlined in more detail in the Introduction.

Perceptions of Vocational and Technical Qualifications in England
Copyright 2020 YouGov plc. 19
Perceptions of Functional Skills Qualifications: value and flexibility
For figure 7, the wave 4 effective base is: Employers who have an understanding of FSQs, 979; All
types of providers, 304; All learners, 521.
Agreement that different stakeholder groups value FSQs was comparable with wave 3 findings. Two-thirds (67%) of the provider group agreed that they value FSQs, making them the group most likely to support this statement. Approximately three-fifths (59%) of learners agreed that they value these qualifications, followed by approximately a third (32%) of employers agreeing that their organisation values FSQs. These figures were all comparable with wave 3 findings. Large-sized employers (52%) and medium employers (50%) remain more likely than small (33%) and micro (30%) employers to agree that their organisation values FSQs. This follows a similar trend to reported levels of understanding of these qualifications. There were no differences in levels of agreement by organisation size in comparison to wave 3. Among the population of the provider group surveyed, agreement was broadly comparable across provider type, region, the type of public funds the provider was in receipt of and establishment size. However, those from sixth forms were less likely than those from Further Education (FE) or Adult Community Education (ACE) or Local Authority (LA) establishments to agree that they value FSQs (47% vs. 70%).

Perceptions of Vocational and Technical Qualifications in England
Copyright 2020 YouGov plc. 20
Figure 7. Results for ‘To what extent do you agree or disagree with the following
statements about Functional Skills qualifications?’ – I value Functional Skills
qualifications (Learners, All types of providers) - We value Functional Skills
qualifications (Employers)
Please note that YouGov and Ofqual advise against drawing conclusions based on differences in the data in comparison with waves 1 and 2. This is due to key changes in the sampling approach and survey mode made for wave 3, which are outlined in more detail in the Introduction.

Perceptions of Vocational and Technical Qualifications in England
Copyright 2020 YouGov plc. 21
For figure 8, the wave 4 effective base is: All types of providers, 304; All learners, 521.
Agreement that FSQs offer value for money was comparable with wave 3 findings. After being
informed that employers, providers or colleges paid awarding organisations £15 to £20 per student
in 2020 for each FSQ, over half (56%) of learners agreed with this, comparable with wave 3 findings
(52%). A similar proportion (50%) of the provider group agreed that FSQs offer value for money, also
comparable with wave 3 findings (44%).
For both the provider group and learners, there were relatively sizeable proportions who provided a neutral response to this statement or said they did not know. In fact, just 7% of learners disagreed that FSQs offer value for money, and 18% of the provider group disagreed. This was consistent with wave 3 (6% and 17% respectively). Among the population of the provider group surveyed, agreement was broadly comparable across provider type, region, the type of public funds the provider was in receipt of and establishment size. However, those from sixth forms were less likely than those from FE or ACE or LA establishments to agree that FSQs offer value for money (35% vs. 54%).

Perceptions of Vocational and Technical Qualifications in England
Copyright 2020 YouGov plc. 22
Figure 8. Results for ‘In 2019, employers, training providers or colleges paid awarding
organisations in the region of £15 to £20 per student for each Functional Skills
qualification (Source: Ofqual 2019). To what extent do you agree or disagree with the
following statement? – Functional Skills Qualifications offer value for money.’
(Learners, All types of providers)
Please note that YouGov and Ofqual advise against drawing conclusions based on differences in the data in comparison with waves 1 and 2. This is due to key changes in the sampling approach and survey mode made for wave 3, which are outlined in more detail in the Introduction.

Perceptions of Vocational and Technical Qualifications in England
Copyright 2020 YouGov plc. 23
For figure 9, the wave 4 effective base is: Employers who have an understanding of FSQs, 979; All
learners, 521.
A fifth (20%) of employers agreed that the availability of FSQs is sufficiently flexible, though only 4%
strongly agreed with the statement. This was comparable with levels of agreement in wave 3 (19%).
Broken down by organisation size, large employers (37%) were significantly more likely small (24%)
and micro (17%) employers to agree that the availability of FSQs is flexible. There were no
differences in levels of agreement by organisation size in comparison to wave 3.
Among learners, there was increase in the proportion of learners saying that the availability of FSQs
is sufficiently flexible (39% to 46%). There were not differences in levels of agreement by learners’
age.
Figure 9. Results for ‘The availability of Functional Skills qualifications is sufficiently
flexible’ (Employers, Learners)
Please note that YouGov and Ofqual advise against drawing conclusions based on differences in the
data in comparison with waves 1 and 2. This is due to key changes in the sampling approach and
survey mode made for wave 3, which are outlined in more detail in the Introduction.

Perceptions of Vocational and Technical Qualifications in England
Copyright 2020 YouGov plc. 24
Perceptions of Functional Skills Qualifications: purpose and future opportunity
For figure 10, the wave 4 effective base is: Employers who have an understanding of FSQs, 979; All types of providers, 304; All learners, 521. Agreement that those holding FSQs have the appropriate level of skill in English was comparable with wave 3 findings. Over half (58%) of learners agreed that those holding FSQs have the appropriate level of skill in English needed by their organisation, comparable with wave 3 findings (53%). The same proportion of providers agreed (58%), with a lower proportion (30%) of employers agreeing. Both of these figures are comparable with wave 3. As observed in wave 3, large (51%) and medium (48%) employers were more likely than small (32%) and micro (28%) employers to agree people holding FSQs have the appropriate level of English needed by employers.
Figure 10. Results for ‘People holding Functional Skills qualifications have the
appropriate level of skill in English needed by my organisation’ (Employers) ‘People
holding Functional Skills qualifications have the appropriate level of skill in English
needed by employers’ (All types of providers and Learners)
Please note that YouGov and Ofqual advise against drawing conclusions based on differences in the
data in comparison with waves 1 and 2. This is due to key changes in the sampling approach and
survey mode made for wave 3, which are outlined in more detail in the Introduction.

Perceptions of Vocational and Technical Qualifications in England
Copyright 2020 YouGov plc. 25
For figure 11, the wave 4 effective base is: Employers who have an understanding of FSQs, 979; All types of providers, 304; All learners, 521. Agreement that those holding FSQs have the appropriate level of skill in maths needed by their organisation follows the same patterns as for English. Learners and providers were most likely to agree (both 58%), with a smaller proportion of employers agreeing (28%). For both learners and providers, this was an increase in comparison to wave 3 (50% learners and 48% employers). For learners, this was driven in an increase in levels of agreement among those aged 18 and under (43% to 57%). Large (44%) and medium (46%) employers were more likely than small (28%) and micro (27%) employers to agree with this statement, as seen for agreement levels that those holding FSQs have the appropriate level of skill in English. Among the provider group there was no impact on levels of agreement when taking into account the type of public funds the provider was in receipt of, though those from sixth forms were less likely than those from FE or ACE or LA establishments to agree that those holding FSQs have the appropriate level of skill in math needed by their organisation (39% vs. 58%).

Perceptions of Vocational and Technical Qualifications in England
Copyright 2020 YouGov plc. 26
Figure 11. Results for ‘People holding Functional Skills qualifications have the
appropriate level of skill in math needed by my organisation’ (Employers) ‘People
holding Functional Skills qualifications have the appropriate level of skill in math
needed by employers’ (All types of providers and Learners)
Please note that YouGov and Ofqual advise against drawing conclusions based on differences in the data in comparison with waves 1 and 2. This is due to key changes in the sampling approach and survey mode made for wave 3, which are outlined in more detail in the Introduction.

Perceptions of Vocational and Technical Qualifications in England
Copyright 2020 YouGov plc. 27
For figure 12, the wave 4 effective base is: Employers who have an understanding of FSQs, 979; All types of providers, 304; All learners, 521. Agreement levels that those holding FSQs have the appropriate level of skill in ICT were higher among learners (51%) and providers (46%), and relatively lower for employers (27%). Among learners, this was an increase in levels of agreement since wave 3 (43%), though figures are broadly comparable for the other stakeholder groups. Large (40%) and medium (39%) employers were more likely than small (28%) and micro (26%) employers to agree with this statement, as seen for agreement levels that those holding FSQs have the appropriate level of skill in ICT. The same trend can be seen when asked about English skills (see figure 10) and math skills (see figure 11).
Figure 12. Results for ‘Functional Skills qualifications have the appropriate level of
skill in ICT needed by my organisation’ (Employers) ‘People holding Functional Skills
qualifications have the appropriate level of skill in ICT needed by employers’ (All
types of providers and Learners)
Please note that YouGov and Ofqual advise against drawing conclusions based on differences in the
data in comparison with waves 1 and 2. This is due to key changes in the sampling approach and
survey mode made for wave 3, which are outlined in more detail in the Introduction.

Perceptions of Vocational and Technical Qualifications in England
Copyright 2020 YouGov plc. 28
For figure 13, the wave 4 effective base is: All types of providers, 304; All learners, 521.
Two-thirds (68%) of learners said they agreed or strongly agreed that FSQs are good preparation for
further study, comparable with wave 3 (64%). Among providers, there has been an increase in the
proportion agreeing with this statement, from 56% to 64%. This was driven by an increase in levels
of agreement among Independent Training Providers (ITPs) (57% to 69%). Levels of agreement were
particularly high among FE or ACE or LA establishments (70%), higher than for sixth forms (37%).
The type of public funding an establishment receives also has an impact on the perception of FSQs as
preparation for further study. Those with Advanced Learner Loans (78%) were much more likely to
agree than those with direct contracts with the Educational and Skills Funding agency (64%).
Figure 13. Results for ‘Functional Skills qualifications are good preparation for further
study’ (All types of providers and Learners)
Please note that YouGov and Ofqual advise against drawing conclusions based on differences in the
data in comparison with waves 1 and 2. This is due to key changes in the sampling approach and
survey mode made for wave 3, which are outlined in more detail in the Introduction.

Perceptions of Vocational and Technical Qualifications in England
Copyright 2020 YouGov plc. 29
Employer reasons for perceptions of Functional Skills Qualifications
Employers who agreed that their organisation values FSQs (32%) gave a variety of reasons for this through an open response question. As observed in wave 3, many said this was because it is a requirement for their organisation, or that they perceive maths and English skills to be vital. There were also many employers who wrote that they feel FSQs offer good or essential skills and increase employability. These qualifications were thought to give a good indication of basic competence. Other employers who felt that their organisation values FSQs approached it from the perspective of training their existing workforce. From these employers there were mentions related to staff improvement and continuing professional development (CPD). Among employers who disagreed that their organisation values FSQs (11%), a common reason given was that they are not relevant to their business or sector. Many also said that they prefer or require other qualifications, and often that a university degree is needed in order to work for their organisation. In addition, employers often expressed that they require more technical or specialist capabilities than they feel FSQs offer.

Perceptions of Vocational and Technical Qualifications in England
Copyright 2020 YouGov plc. 30
Section 3: Perceptions of Other Vocational and Technical Qualifications
Key Findings – Other Vocational and Technical Qualifications
• Overall, approximately two-fifths (43%) of employers reported having a very or quite good
understanding of VTQs in their sector, comparable with wave 3 findings (41%).
Understanding increased with organisation size, with large employers (24%) more likely to
have a very good understanding compared to micro employers (14%).
• Additionally, roughly three-fifths (63%, 60% in wave 3) of employers said they were aware of
the changes that have been or are currently being made to VTQs. Fewer (7%) employers
were aware and said they fully understand the changes that are proposed or taking place.
• Learners who decided to take VTQs were most likely to say that they did so because they
wanted to improve their skills (36%), are interested in the vocational or technical area (24%)
or took these qualifications to progress in their studies (23%).
• Among learners who are currently undertaking or have completed a VTQ, the most common
stated benefit was being able to find a job or a better job, with roughly a third (35%)
reporting this. The next most common perceived benefits were being more confident in
work / better at their job (33%) or being more confident using their vocational or technical
skills (30%).
• The vast majority (92%, 88% in wave 3) of the provider group value VTQs. Levels of
agreement among providers remains higher than for learners (71%) and employers (45%),
with figures comparable to the previous wave.
• There has been an increase in the proportion of providers saying that VTQs offer value for
money (63% to 76%).
• Roughly half (52%) of learners agreed that the availability of VTQs is sufficiently flexible,
comparable with wave 3 (46%). Agreement among employers remained much lower, with
approximately a quarter (24%) reporting this, consistent with wave 3 findings.
• There has been an increase in the proportion of the provider group agreeing that purpose of
VTQs is well-understood by employers (42% to 58%). Approximately half (49%) of learners
and just over a third (36%) of employers agreed, comparable with wave 3 findings.
• Approximately three-quarters (74%) of learners agreed that they understand the purpose of
VTQs, comparable with wave 3 (72%). Two-thirds (68%) of the provider group agreed that
the purpose of VTQs is well-understood by learners, an increase from wave 3 (53%).
• There was also an increase in the proportion of the provider group agreeing that VTQs
prepare learners well for the workplace (76% to 85%). Two-thirds (66%) of learners and
(39%) of employers agreed, both comparable with wave 3 findings.
• There was an increase in the proportion of the provider group agreeing that people
achieving VTQs have the skills needed by employers, with three-quarters (75%) reporting
this (higher than 67% in wave 3). Fewer employers (35%) agreed with the same statement,
as observed in wave 3.

Perceptions of Vocational and Technical Qualifications in England
Copyright 2020 YouGov plc. 31
• Among the provider group, there was an increase in the proportion agreeing that VTQs are
preparation for further study (69% to 78%). Among learners, 73% agreed, comparable with
wave 3.
• Seven in ten (70%) employers who have arranged or funded training for employees in last 12
months said that for their employees who achieve a VTQ outside of an apprenticeship, this
leads to new responsibilities at least some of the time. Sixty-five percent reported said that
this led to a promotion or improved job status, a comparable proportion (64%) said this
leads to a pay rise at least some of the time.

Perceptions of Vocational and Technical Qualifications in England
Copyright 2020 YouGov plc. 32
Understanding of other Vocational and Technical Qualifications by employers
For figure 14, the wave 4 effective base is: All employers, 1,391. Overall, approximately two-fifths (43%) of employers reported having a very or quite good understanding of Vocational and Technical Qualifications (VTQs) in their sector, comparable with wave 3 findings (41%). This is comprised of 14% stating that they have a ‘very good’ understanding and 29% saying that they have a ‘quite good’ understanding. One fifth (20%) of employers feel that they have no understanding at all. As observed in wave 3, large (24%) and medium (22%) employers were more likely than small (16%) and micro (14%) employers to say that they have a very good understanding of VTQs. Micro employers were more likely than any other employer size to say that they have no understanding at all (23% vs. small 14%, medium 8% and large 8%). There were no differences in levels of agreement by organisation size in comparison to wave 3. Employers working in the public sector (24%) were considerably more likely than those working in
the private sector (14%) to have a very good understanding of VTQs, reflecting organisation size.
Figure 14. Results for ‘Please indicate which of the following statements best
describes your understanding of vocational and technical qualifications in my sector’
(Employers)
Please note that YouGov and Ofqual advise against drawing conclusions based on differences in the data in comparison with waves 1 and 2. This is due to key changes in the sampling approach and survey mode made for wave 3, which are outlined in more detail in the Introduction.

Perceptions of Vocational and Technical Qualifications in England
Copyright 2020 YouGov plc. 33
For figure 15, the wave 4 effective base is: All employers who have at least a limited understanding of VTQs in their sector, 964. Employers were asked to describe their understanding of the changes that have been, or are
currently being made, to vocational and technical qualifications in their sector. They were not asked
about specific changes.
Awareness of the changes that had been made, or were currently being made, to VTQs was
comparable with wave 3 findings. Overall, roughly three-fifths (63%, 60% in wave 3) of employers
were aware of the changes that had been made, or were currently being made, to VTQs. Broken
down, only 7% of employers said they were aware and fully understand the changes proposed or
taking place, whilst larger proportions had some understanding (21%), or were aware but did not
know what changes had taken place (35%).
Thirty-seven percent of employers were not aware of any changes at all. This was predominantly
seen among micro employers (40%), higher than for small (30%), medium (23%) and large (17%)
employers, demonstrating that awareness increases with organisation size.
Figure 15. Results for ‘Please say which of the following statements best describes
your understanding of the changes that have been, or are currently being made to
vocational and technical qualifications in your sector’ (Employers)
Please note that YouGov and Ofqual advise against drawing conclusions based on differences in the data in comparison with waves 1 and 2. This is due to key changes in the sampling approach and survey mode made for wave 3, which are outlined in more detail in the Introduction.

Perceptions of Vocational and Technical Qualifications in England
Copyright 2020 YouGov plc. 34
Why learners chose other Vocational and Technical Qualifications
For figure 16, the wave 4 effective base is: All learners who are studying a VTQ, 363. Wanting to improve their skills was the most common reason (36%) given by learners as to why they
decided to take a VTQ; this was also the most common reason given in wave 3. Interest in the
vocational or technical area (24%) or wanting to progress in studies were the next most popular
(23%). Younger learners aged 18 or under were more likely than those aged 25+ to say that they
decided to take a VTQ to progress in their studies (36% vs. 15%) or because they preferred
vocational or technical qualifications to a more academic route (25% vs. 12%). By contrast, those
aged 25+ were more likely than those aged 18 or under to cite to progress in their current job (31%
vs. 5%) or because their employer advised or required them to (22% vs. 4%) as reasons for taking a
VTQ.
Figure 16. Results for ‘Why did you decide to take a vocational or technical
qualification?’ (Learners)
Please note that YouGov and Ofqual advise against drawing conclusions based on differences in the data in comparison with waves 1 and 2. This is due to key changes in the sampling approach and survey mode made for wave 3, which are outlined in more detail in the Introduction.

Perceptions of Vocational and Technical Qualifications in England
Copyright 2020 YouGov plc. 35
Benefits associated with other Vocational and Technical Qualifications by learners
For figure 17, the wave 4 effective base is: All learners who are studying a VTQ, 363. The most frequently perceived benefit of taking VTQs, among those who have started or completed
one, is being able to find a job or a better job, with roughly a third (35%) reporting this. The next
most common perceived benefits were being more confident in work or better at their job (33%) or
being more confident using their vocational or technical skills (30%). Younger learners aged 18 and
under were more likely than those aged 25+ to feel a benefit of taking a VTQ would be the ability to
progress in their studies (42% vs. 19%), whilst older learners are more likely to cite being able to
progress in their current job (31% vs. 9%).
Figure 17. Results for ‘Now that you have started learning/have completed learning,
what benefits do you expect from taking a vocational and technical qualification?’
(Learners)
Please note that YouGov and Ofqual advise against drawing conclusions based on differences in the data in comparison with waves 1 and 2. This is due to key changes in the sampling approach and survey mode made for wave 3, which are outlined in more detail in the Introduction.

Perceptions of Vocational and Technical Qualifications in England
Copyright 2020 YouGov plc. 36
Perceptions of other Vocational and Technical Qualifications: value and flexibility
For figure 18, the wave 4 effective base is: All employers 1,147; All types of providers, 304; All learners, 521. Agreement that different stakeholder groups value VTQs was comparable with wave 3 findings. The vast majority (92%, 88% in wave 3) of the provider group said that they value VTQs. Levels of agreement among providers remains higher than for learners (71%) and employers (45%), with figures comparable to the previous wave. Among providers, agreement was particularly high among ITPs, rising to 95%. This is higher than for FE or ACE or LA establishments (89%) and for sixth forms (82%). Among employers, agreement increases with organisation size. Large employers (69%) were more likely than medium (60%), small (49%) and micro (43%) employers to agree that they value VTQs.

Perceptions of Vocational and Technical Qualifications in England
Copyright 2020 YouGov plc. 37
Figure 18. Results for ‘We value vocational and technical qualifications’ (Employers) -
‘I value vocational and technical qualifications’ (All types of providers, Learners)
Please note that YouGov and Ofqual advise against drawing conclusions based on differences in the data in comparison with waves 1 and 2. This is due to key changes in the sampling approach and survey mode made for wave 3, which are outlined in more detail in the Introduction.

Perceptions of Vocational and Technical Qualifications in England
Copyright 2020 YouGov plc. 38
For figure 19, the wave 4 effective base is: All types of providers, 304. There has been an increase in the proportion of providers saying that VTQs offer value for money
(63% to 76%). Sixteen percent said that they neither agreed nor disagreed, whilst only a very small
proportion (4%) disagreed.
Agreement was highest among ITPs (84%), followed by FE colleges (79%). However, agreement that
VTQs offer value for money was much lower among sixth forms (59%).
Figure 19. Results for ‘Vocational and technical qualifications offer value for money’
(All types of providers)
Please note that YouGov and Ofqual advise against drawing conclusions based on differences in the data in comparison with waves 1 and 2. This is due to key changes in the sampling approach and survey mode made for wave 3, which are outlined in more detail in the Introduction.

Perceptions of Vocational and Technical Qualifications in England
Copyright 2020 YouGov plc. 39
For figure 20, the wave 4 effective base is: All employers, 1,120; All learners, 521. Agreement that the availability of VTQs is sufficiently flexible was comparable with wave 3 findings. Roughly half (52%) of learners agreed that the availability of VTQs is sufficiently flexible, comparable with wave 3 (46%). Agreement among employers remained much lower, with approximately a quarter (24%) reporting this, consistent with wave 3 findings when the same proportion agreed. Large employers (43%) were significantly more likely than small (30%) and micro (21%) employers to
agree that the availability of VTQs is sufficiently flexible.
Figure 20. Results for ‘The availability of vocational and technical qualifications is
sufficiently flexible’ (Employers, Learners)
Please note that YouGov and Ofqual advise against drawing conclusions based on differences in the data in comparison with waves 1 and 2. This is due to key changes in the sampling approach and survey mode made for wave 3, which are outlined in more detail in the Introduction.

Perceptions of Vocational and Technical Qualifications in England
Copyright 2020 YouGov plc. 40
Perceptions of other Vocational and Technical Qualifications: purpose and future opportunity
For figure 21, the wave 4 effective base is: All employers 1,120; All types of providers, 304; All
learners, 521.
There has been an increase in the proportion of the provider group agreeing that purpose of VTQs is
well-understood by employers (42% to 58%). This is driven by an increase in agreement levels
among ITPs (47% to 63%). Approximately half (49%) of learners agreed with this same statement,
comparable with wave 3 findings (46%). There was however an increase, compared to wave 3, in
the proportion of younger learners (aged 18 and under) agreeing that that purpose of VTQs is well-
understood by employers (38% to 52%). Agreement for employers remained lower than for the
other stakeholder groups, with just over a third (36%) agreeing, comparable with wave 3 (38%).
Among the provider group, ITPs (63%) were more likely than FE or ACE or LA establishments (53%)
or sixth forms (42%) to agree.

Perceptions of Vocational and Technical Qualifications in England
Copyright 2020 YouGov plc. 41
Figure 21. Results for ‘The purpose of vocational and technical qualifications is well-
understood by my organisation’ (Employers) - ‘The purpose of vocational and
technical qualifications is well-understood by employers’ (All types of providers,
Learners)
Please note that YouGov and Ofqual advise against drawing conclusions based on differences in the data in comparison with waves 1 and 2. This is due to key changes in the sampling approach and survey mode made for wave 3, which are outlined in more detail in the Introduction.

Perceptions of Vocational and Technical Qualifications in England
Copyright 2020 YouGov plc. 42
For figure 22, the wave 4 effective base is: All types of providers, 304; All learners, 521. Approximately three-quarters (74%) of learners agreed that they understand the purpose of VTQs, comparable with wave 3 (72%). Comparably, two-thirds (68%) of the provider group agreed that the purpose of VTQs is well-understood by learners, an increase from wave 3 (53%). This was due to increases in levels of agreement for many of the establishment types, including ITPs (59% to 70%) and FE or ACE or LA establishments (51% to 64%). Older learners aged 25+ were more likely than those aged 18 and under to agree that they understand the purpose of VTQs (77% vs. 67%).
Figure 22. Results for ‘The purpose of vocational and technical qualifications is well-
understood by learners’ (All types of providers) - ‘I understand the purpose of
vocational and technical qualifications’ (Learners)
Please note that YouGov and Ofqual advise against drawing conclusions based on differences in the data in comparison with waves 1 and 2. This is due to key changes in the sampling approach and survey mode made for wave 3, which are outlined in more detail in the Introduction.

Perceptions of Vocational and Technical Qualifications in England
Copyright 2020 YouGov plc. 43
For figure 23, the wave 4 effective base is: All employers 1,120; All types of providers, 304; All learners, 521. There was also an increase in the proportion of the provider group agreeing that VTQs prepare learners well for the workplace (76% to 85%). This was due to increases in levels of agreement for many of the establishment types, including ITPs (83% to 92%) and FE colleges (72% to 82%) and sixth forms (56% to 78%). Two-thirds (66%) of learners agreed with the same statement, comparable with wave 3 (70%). Employers reported much lower levels of agreement (39%), also comparable with wave 3 (41%). Among the provider group, a much higher proportion of ITPs (92%) agreed that VTQs prepare learners well for the workplace, more so than among those in FE colleges (82%) and sixth forms (78%). Employers (39%) were considerably less likely than the provider group and learners to state that VTQs prepare learners well for the workplace. A large majority of the provider group (76%) and learners (70%) agreed that VTQs prepared learners well. As seen previously, agreement levels differ greatly by employer size. Large (58%) and medium (57%) employers were smore likely than small (42%) and micro (37%) employers to agree that the availability of VTQs is sufficiently flexible.

Perceptions of Vocational and Technical Qualifications in England
Copyright 2020 YouGov plc. 44
Figure 23. Results for ‘Vocational and technical qualifications prepare learners well
for the workplace’ (Employers, All types of providers, Learners)
Please note that YouGov and Ofqual advise against drawing conclusions based on differences in the data in comparison with waves 1 and 2. This is due to key changes in the sampling approach and survey mode made for wave 3, which are outlined in more detail in the Introduction.

Perceptions of Vocational and Technical Qualifications in England
Copyright 2020 YouGov plc. 45
For figure 24, the wave 4 effective base is: All employers 1,120; All types of providers, 304. There was an increase in the proportion of the provider group agreeing that people achieving VTQs have the skills needed by employers, with three-quarters (75%) reporting this (higher than 67% in wave 3). Fewer employers (35%) agreed people achieveing VTQs have the skills needed by employers in their organisation, comparable with wave 3 findings (33%). Among providers, levels of agreement remained higher among ITPs (81%) than FE or ACE or LA establishments (68%) and sixth forms (63%). A fifth (21%) of micro employers stated that they did not know; this is significantly higher than for both medium and large employers (both 11%).
Figure 24. Results for ‘People achieving vocational and technical qualifications have
the technical skills needed by employers in my organisation’ (Employers) - ‘People
achieving vocational and technical qualifications have the technical skills needed by
employers’ (All types of providers)
Please note that YouGov and Ofqual advise against drawing conclusions based on differences in the data in comparison with waves 1 and 2. This is due to key changes in the sampling approach and survey mode made for wave 3, which are outlined in more detail in the Introduction.

Perceptions of Vocational and Technical Qualifications in England
Copyright 2020 YouGov plc. 46
For figure 25, the wave 4 effective base is: All types of providers, 304; All learners, 521. Among the provider group, there was an increase in the proportion agreeing that VTQs are
preparation for further study (69% to 78%). This was driven by increases in levels of agreement
among ITPs (77% to 87%) and FE colleges (69% to 79%). Among learners, 73% agreed, comparable
with wave 3 (69%).
ITPs (87%) were more likely than other types of providers to agree that VTQs are good preparation
for further study. This was higher than the proportion agreeing in FE colleges (79%) and sixth forms
(57%).
Figure 25. Results for ‘Vocational and technical qualifications are good preparation
for further study’ (All types of providers, Learners)
Please note that YouGov and Ofqual advise against drawing conclusions based on differences in the data in comparison with waves 1 and 2. This is due to key changes in the sampling approach and survey mode made for wave 3, which are outlined in more detail in the Introduction.

Perceptions of Vocational and Technical Qualifications in England
Copyright 2020 YouGov plc. 47
For figure 26, the wave 4 effective base is: All employers who have arranged or funded training for employees in last 12 months, 465. Seven in ten (70%) employers who have arranged or funded training for employees in last 12 months
said that for their employees who achieve a VTQ outside of an apprenticeship, this leads to new
responsibilities at least some of the time. This was comparable with wave 3 (69%).
Sixty-five percent of these employers said that for their employees who achieve a VTQ outside of an
apprenticeship, this leads to a promotion or improved job status at least some of the time. This is
also comparable with wave 3 (63%).
A comparable proportion (64%) of these employers said that for their employees who achieve a VTQ
outside of an apprenticeship, this leads to a pay rise at least some of the time (comparable with
wave 3, 62%). Overall, 9% of employers said that it leads to a pay increase all of the time.

Perceptions of Vocational and Technical Qualifications in England
Copyright 2020 YouGov plc. 48
Figure 26. Results for ‘For your employees who achieve vocational or technical
qualifications outside an apprenticeship, how often, if ever, does this lead to the
following?’ (Employers)
Please note that YouGov and Ofqual advise against drawing conclusions based on differences in the data in comparison with waves 1 and 2. This is due to key changes in the sampling approach and survey mode made for wave 3, which are outlined in more detail in the Introduction.

Perceptions of Vocational and Technical Qualifications in England
Copyright 2020 YouGov plc. 49
Employers’ reasons for perceptions of other Vocational and Technical Qualifications
Employers who agreed that their organisations value VTQs (45%) were asked to explain further
through an open response question.
The most commonly recurring explanations given by employers who agreed that their organisation
values VTQs related to the more practical nature of these qualifications and the work-orientated
structure in which they are conducted, meaning applicants’ skills were aligned with the job they
started. Some employers also suggested that those with VTQs bring diverse skills to their
organisation, highlighting the importance of employing individuals with some ‘real life’ experience.
A lower proportion of employers (9%) disagreed that VTQs are valued in their organisation. In these
cases, employers stated that VTQs were not relevant to them due to the size or nature of their
organisation, while others said that their organisation sought traditional educational qualifications.
Some employers indicated that employees need ‘higher level’ skills or qualifications.

Perceptions of Vocational and Technical Qualifications in England
Copyright 2020 YouGov plc. 50
Section 4: Perceptions of End-Point Assessments
Key findings – End-Point Assessments • Overall, approximately three in ten (29%, 27% in wave 3) employers reported having a very
or quite good understanding of apprenticeships in their sector. Understanding increased
with employer size, with large employers most likely to say that they have a good (50%)
understanding of these.
• A lower proportion (15%, 13% in wave 3) of employers who have at least some
understanding of EPAs of apprenticeships in their sector said that they have a good (very or
quite good) understanding of EPAs of apprenticeships.
• Understanding of EPAs of apprenticeships was higher among the provider group in
comparison to employers, with three-fifths (61%) of the provider group reporting having a
very or quite good understanding of these. This was comparable with wave 3 (60%). Those
from independent training providers (ITPs) were much more likely to say that they have a
good understanding (78%) than other types of providers.
• Among learners, understanding of EPAs of apprenticeships was lower than among the
provider group, but higher than for employers. Over half (54%) of learners reported a good
(very or quite good) understanding of these.
• Over six in ten (64%) of the provider group said that they know the difference between
apprenticeship frameworks and the new apprenticeship standards, comparable with wave 3
(66%). Awareness of the difference was much lower among employers, with only 8%
reporting this.
• Awareness that EPAs are specific to apprenticeship standards was highest among the
provider group (82%), followed by learners (67%), with employers reporting much lower
understanding (18%). Each of these figures are comparable with wave 3 findings.
• It was most common for learners to say that they decided to take an apprenticeship to
progress in their current job (41%), because they can learn new skills on the job (39%) or in
order to find a better job (30%).
• Learners were most likely to say that they will be able to progress in their current job now
they have started or completed an apprenticeship, with half (51%) reporting this.
• Over half (56%) of learners said that they value EPAs of apprenticeship standards, with a
similar proportion (54%) of the provider group reporting this. Approximately half (49%) of
employers agreed that they value EPAs of apprenticeship standards, increasing from 39% in
wave 3.
• Views for the provider group were fairly evenly split over whether or not EPAs of
apprenticeships offer value for money. Three in ten (30%) agreed, whilst a similar proportion
(27%) disagreed.
• Two-fifths (43%) of learners agreed that the availability of EPAs is sufficiently flexible,
compared to 33% of employers and 32% of the provider group. Among employers (26% to
33%) and providers (23% to 32%) this was an increase in comparison to wave 3.
• Overall, three-fifths (62%) of the provider group agreed people passing EPAs of an
apprenticeship have the competence and vocational and technical skills needed by
employers. This was comparable to learners (59%) but higher than for employers (48%).

Perceptions of Vocational and Technical Qualifications in England
Copyright 2020 YouGov plc. 51
• Three-fifths (59%) of learners said that they understand the purpose of EPAs of
apprenticeships, comparable with wave 3 findings. A comparable proportion (55%) of
providers agreed that learners understand the purpose of end-point assessment of
apprenticeship standards.

Perceptions of Vocational and Technical Qualifications in England
Copyright 2020 YouGov plc. 52
Understanding of End-Point Assessments
For figure 27, the wave 4 effective base is: All employers, 1,391.
Understanding of apprenticeships in their sector among employers was comparable with wave 3. Overall, approximately three in ten (29%, 27% in wave 3) employers reported having a very or quite good understanding of apprenticeships in their sector. Only 8% of employers said that they have a very good understanding of apprenticeships. Large employers (21%) were more likely than small (12%) or micro (7%) employers to say that they have a very good understanding of end-point assessments (EPAs) of apprenticeships in their sector. In fact, half (50%) of large employers said that they have a good (very or quite good) understanding of apprenticeships in their sector. Micro employers were more likely than larger employers to say that they have no understanding at all (29% vs. 9% of large employers). These patterns were consistent with wave 3 findings.
Figure 27. Results for ‘Please indicate your level of understanding about the four
types of qualifications listed below.’ – Apprenticeships in my sector (Employers)
Please note that YouGov and Ofqual advise against drawing conclusions based on differences in the
data in comparison with waves 1 and 2. This is due to key changes in the sampling approach and
survey mode made for wave 3, which are outlined in more detail in the Introduction.

Perceptions of Vocational and Technical Qualifications in England
Copyright 2020 YouGov plc. 53
For figure 28, the wave 4 effective base is: All employers who have at least some understanding of
EPAs of apprenticeships in their sector, 1,050.
Among employers who have at least some understanding of EPAs of apprenticeships in their sector, understanding of EPAs of apprenticeships was also comparable with wave 3. Overall, 15% (13% in wave 3) of employers reported having a very or quite good understanding of EPAs of apprenticeships. Only 4% said that they have a very good understanding of these assessments, consistent with the previous wave. In keeping with previous findings, large employers (12%) were more likely than small (7%) or micro (3%) employers to say that they have a very good understanding of EPAs of apprenticeships. Micro employers were more likely than large employers to say that they have no understanding at all of EPAs (54% vs. 30% of large employers). These patterns were consistent with wave 3 findings.
Figure 28. Results for ‘Please indicate which of the following statements best
describes your understanding of end-point assessment of apprenticeships.’
(Employers)
Please note that YouGov and Ofqual advise against drawing conclusions based on differences in the
data in comparison with waves 1 and 2. This is due to key changes in the sampling approach and
survey mode made for wave 3, which are outlined in more detail in the Introduction.

Perceptions of Vocational and Technical Qualifications in England
Copyright 2020 YouGov plc. 54
For figure 29, the wave 4 effective base is: All types of providers, 304.
Understanding of EPAs of apprenticeships was much higher among the provider group, with three-
fifths (61%) of the provider group reporting having a very or quite good understanding of these. This
was comparable with wave 3 (60%). Thirty-six percent reported having a very good understanding of
EPAs of apprenticeships, higher than the proportion saying they have a quite good understanding
(24%).
As might be expected, there were stark differences when looking at provider type, with ITPs much more likely to have had a good understanding (78%) of EPAs of apprenticeships, compared to those from FE or ACE or LA establishments (37%) or sixth forms (22%).
Figure 29. Results for ‘Which of the following describes your understanding of end-
point assessment of apprenticeships?’ (All types of providers)
Please note that YouGov and Ofqual advise against drawing conclusions based on differences in the
data in comparison with waves 1 and 2. This is due to key changes in the sampling approach and
survey mode made for wave 3, which are outlined in more detail in the Introduction.

Perceptions of Vocational and Technical Qualifications in England
Copyright 2020 YouGov plc. 55
For figure 30, the wave 4 effective base is: All learners who are taking an apprenticeship, 78.
Understanding of EPAs of apprenticeships among learners remained lower than among the provider
group, but higher than among employers. Just over half (54%) of learners reported a very or quite
good understanding of these, comprised of 22% reporting a very good understanding and 31% a
quite good understanding.
Figure 30. Results for ‘Please tell us which of the following statements best describes
your understanding of end-point assessment of apprenticeships’ (Learners)
Please note that YouGov and Ofqual advise against drawing conclusions based on differences in the
data in comparison with waves 1 and 2. This is due to key changes in the sampling approach and
survey mode made for wave 3, which are outlined in more detail in the Introduction.

Perceptions of Vocational and Technical Qualifications in England
Copyright 2020 YouGov plc. 56
For figure 31, the wave 4 effective base is: All employers, 1,079; All types of providers, 304.
Over six in ten (64%) of the provider group said that they know the difference between
apprenticeship frameworks and the new apprenticeship standards, comparable with wave 3 (64%).
Understanding was much higher among ITPs (84%) than for those from FE or ACE or LA
establishments (41%), with a lower understanding within sixth forms (25%).
Only 8% of employers said that they know the difference between apprenticeship frameworks and
the new apprenticeship standards. This was comparable with wave 3 (7%). Knowledge increased
with organisation size; this was highest among large employers (21%) with comparable levels of
knowledge for medium employers (16%) but lower for small (9%) and micro (7%) employers.
Figure 31. Results for ‘Do you understand the difference between apprenticeship
frameworks and the new apprenticeship standards?’ (Employers, All types of
providers)
Please note that YouGov and Ofqual advise against drawing conclusions based on differences in the data in comparison with waves 1 and 2. This is due to key changes in the sampling approach and survey mode made for wave 3, which are outlined in more detail in the Introduction.

Perceptions of Vocational and Technical Qualifications in England
Copyright 2020 YouGov plc. 57
For figure 32, the wave 4 effective base is: All who have at least some understanding of EPAs.
Employers, 1,050; All types of providers, 304; learners, 78.
Awareness that EPAs are specific to apprenticeship standards was highest among the provider group
(82%), followed by learners (67%), with employers reporting much lower understanding (18%). Each
of these figures are comparable with wave 3 findings.
In line with their generally higher levels of understanding related to qualifications, almost all (95%)
ITPs said that they were aware EPAs are specific to apprenticeship standards. This was higher than
for those from FE or ACE or LA establishments (66%), with a lower awareness in sixth forms (53%).
Awareness of EPAs varied greatly by employer size. Over a third (37%) of large employers said that
they were aware EPAs are specific to apprenticeship standards, higher than medium (25%), small
(19%) and micro (19%) employers.
Figure 32. Results for ‘Are you aware that End-Point Assessments (EPAs) are specific
to apprenticeship standards?’ (Employers, All types of providers, Learners)
Please note that YouGov and Ofqual advise against drawing conclusions based on differences in the
data in comparison with waves 1 and 2. This is due to key changes in the sampling approach and
survey mode made for wave 3, which are outlined in more detail in the Introduction.
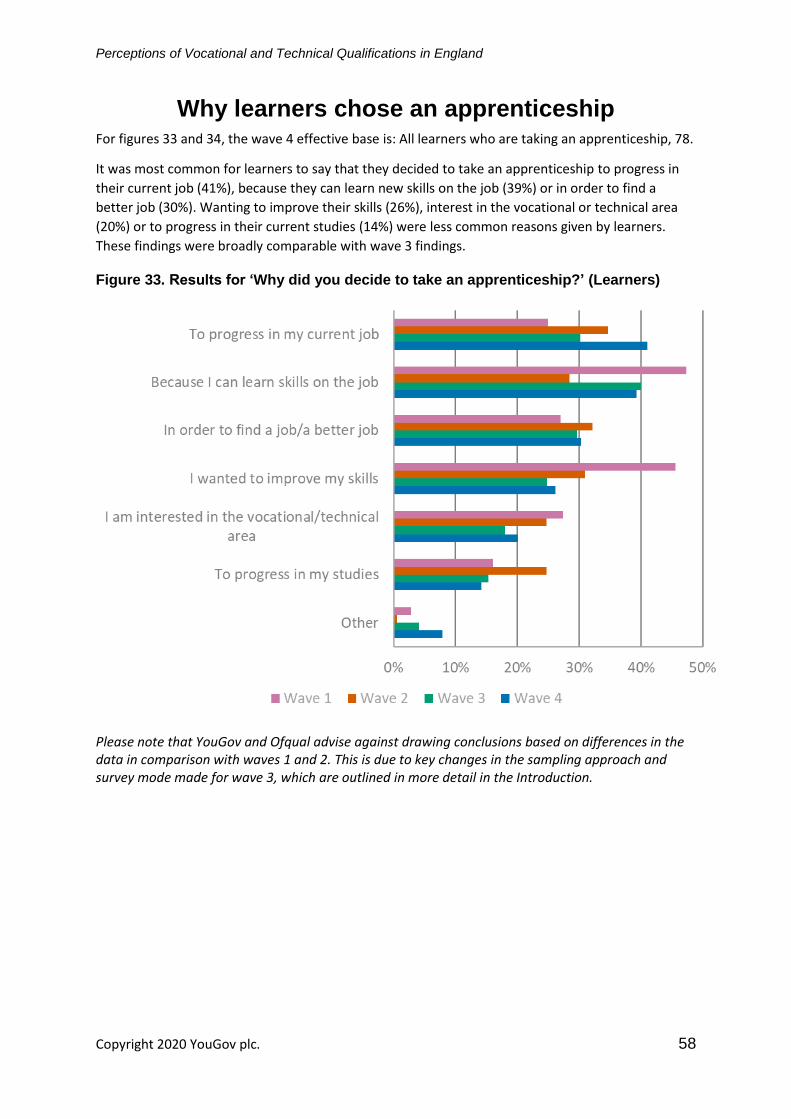
Perceptions of Vocational and Technical Qualifications in England
Copyright 2020 YouGov plc. 58
Why learners chose an apprenticeship For figures 33 and 34, the wave 4 effective base is: All learners who are taking an apprenticeship, 78.
It was most common for learners to say that they decided to take an apprenticeship to progress in
their current job (41%), because they can learn new skills on the job (39%) or in order to find a
better job (30%). Wanting to improve their skills (26%), interest in the vocational or technical area
(20%) or to progress in their current studies (14%) were less common reasons given by learners.
These findings were broadly comparable with wave 3 findings.
Figure 33. Results for ‘Why did you decide to take an apprenticeship?’ (Learners)
Please note that YouGov and Ofqual advise against drawing conclusions based on differences in the data in comparison with waves 1 and 2. This is due to key changes in the sampling approach and survey mode made for wave 3, which are outlined in more detail in the Introduction.

Perceptions of Vocational and Technical Qualifications in England
Copyright 2020 YouGov plc. 59
Benefits associated with apprenticeships by learners
Learners were most likely to say that they will be able to progress in their current job now they have
started or completed an apprenticeship, with roughly half (51%) reporting this. The next most
common reported benefits were having better knowledge of how to do their job (47%) and a
broader range of skills to apply in the workplace (46%) and There were not statistically significant
differences compared to wave 3.
Figure 34. Results for ‘Now that you have started learning/have completed learning,
what benefits do you expect to get from taking an apprenticeship?’ (Learners)
Please note that YouGov and Ofqual advise against drawing conclusions based on differences in the data in comparison with waves 1 and 2. This is due to key changes in the sampling approach and survey mode made for wave 3, which are outlined in more detail in the Introduction.

Perceptions of Vocational and Technical Qualifications in England
Copyright 2020 YouGov plc. 60
Perceptions of end-point assessments of apprenticeships: value and flexibility
For figure 35, the wave 4 effective base is: All employers who have EPAs of apprenticeships in their
organisation, 347; All types of providers 304; Learners, 521.
Over half (56%) of learners said that they value EPAs of apprenticeship standards, comparable with
wave 3 (55%). A similar proportion (54%) of the provider group said that they value these
assessments, which was also comparable with wave 3 findings (53%). Approximately half (49%) of
employers agreed that they value EPAs of apprenticeship standards, increasing from 39% in wave 3.
This was driven by an increase in the proportion of micro employers reporting this.
Figure 35. Results for ‘We value end-point assessments of apprenticeships’
(Employers) - ‘I value end-point assessments of apprenticeships’ (All types of
providers, Learners)
Please note that YouGov and Ofqual advise against drawing conclusions based on differences in the data in comparison with waves 1 and 2. This is due to key changes in the sampling approach and survey mode made for wave 3, which are outlined in more detail in the Introduction

Perceptions of Vocational and Technical Qualifications in England
Copyright 2020 YouGov plc. 61
Employer reasons for perceptions of End-Point Assessments
Employers who said that they value EPAs (49%) were asked to explain why they think this through an open response question. As observed in wave 3, responses indicated that their value of EPAs tends to stem from the idea that EPAs are a good way of measuring or showing that the learner has reached the required standard. Some employers also made the case that EPAs improve the value of the apprenticeship for the employer as they demonstrate apprentices’ commitment to learning and applying training in a practical way. A very small (5%) proportion of employers disagreed that they value EPAs. For some, this was because they do not hire people with apprenticeships or that they are not relevant for the role or industry. For figure 36, the wave 4 effective base is: All types of providers 304.
Views for the provider group were fairly evenly split over whether or not EPAs of apprenticeships
offer value for money. Three in ten (30%) agreed, whilst a similar proportion (27%) disagreed. ITPs
were much more likely to disagree, with approximately two-fifths (42%) disagreeing. This was higher
than levels of disagreement from FE or ACE or LA establishments (12%) and sixth forms (7%).
Figure 36. Results for ‘End-Point Assessments of Apprenticeships offer value for
money’ (All types of providers)
Please note that YouGov and Ofqual advise against drawing conclusions based on differences in the data in comparison with waves 1 and 2. This is due to key changes in the sampling approach and survey mode made for wave 3, which are outlined in more detail in the Introduction.

Perceptions of Vocational and Technical Qualifications in England
Copyright 2020 YouGov plc. 62
For figure 37, the wave 4 effective base is: All employers who have EPAs of apprenticeships in their
organisation, 347; All types of providers, 304; All learners 521.
Two-fifths (43%) of learners agreed that the availability of EPAs is sufficiently flexible, compared to
33% of employers and 32% of the provider group. Among employers, there has been an increase in
the proportion agreeing that the availability of EPAs is sufficiently flexible, rising from 26% in wave 3
to 33% in the current wave. This was driven by an increase in the proportion of micro employers
reporting this (21% to 33%). There has also been an increase in agreement among providers (23% to
32%), driven by an increase among ITPs (20% to 34%).
Among the employer group, large employers (52%) were more likely than small (35%) and micro
employers (32%) to report that the availability of EPAs is sufficiently flexible.
Figure 37. Results for ‘The availability of end-point assessments of apprenticeships is
sufficiently flexible’ (Employers and All types of providers and Learners)
Please note that YouGov and Ofqual advise against drawing conclusions based on differences in the
data in comparison with waves 1 and 2. This is due to key changes in the sampling approach and
survey mode made for wave 3, which are outlined in more detail in the Introduction.

Perceptions of Vocational and Technical Qualifications in England
Copyright 2020 YouGov plc. 63
Perceptions of end-point assessments of apprenticeships: purpose and future
opportunity
For figure 38, the wave 4 effective base is: All employers who have EPAs of apprenticeships in their
organisation, 347; All types of providers, 304; All learners 521.
Levels of agreement that people passing EPAs have the competence and vocational and technical
skills needed by employers have remained broadly comparable with wave 3 findings.
Overall, 62% of the provider group agreed that people passing EPAs have the competence and
vocational and technical skills needed by employers, broadly comparable with wave 3 (57%). A
comparable proportion of learners agreed with this (59%, 61% in wave 3). Just under half (48%) of
employers agreed that people passing EPAs have the competence and vocational and technical skills
needed by their organisation. This was also comparable with wave 3 findings (47%).

Perceptions of Vocational and Technical Qualifications in England
Copyright 2020 YouGov plc. 64
Figure 38. Results for ‘People completing end-point assessments of apprenticeships
have the competence and vocational and technical skills needed by my organisation’
(Employers) ‘People passing end-point assessments of apprenticeship standards
have the competence and vocational and technical skills needed by employers’ (All
types of providers) ‘End-point assessments of apprenticeships test the competence
and vocational and technical skills needed by employers‘ (Learners)
Please note that YouGov and Ofqual advise against drawing conclusions based on differences in the
data in comparison with waves 1 and 2. This is due to key changes in the sampling approach and
survey mode made for wave 3, which are outlined in more detail in the Introduction.

Perceptions of Vocational and Technical Qualifications in England
Copyright 2020 YouGov plc. 65
For figure 39, the wave 4 effective base is: All types of providers 304; Learners, 521.
Three-fifths (59%) of learners said that they understand the purpose of EPAs of apprenticeships,
comparable with wave 3 findings (60%). A comparable proportion (55%) of providers agreed that
learners understand the purpose of end-point assessment of apprenticeship standards. This was also
in line with wave 3 findings.
Figure 39. Results for ‘Learners understand the purpose of end-point assessment of
apprenticeship standards’ (All types of providers) - ‘I understand the purpose of end-
point assessments of apprenticeships’ (Learners)
Please note that YouGov and Ofqual advise against drawing conclusions based on differences in the data in comparison with waves 1 and 2. This is due to key changes in the sampling approach and survey mode made for wave 3, which are outlined in more detail in the Introduction.

Perceptions of Vocational and Technical Qualifications in England
Copyright 2020 YouGov plc. 66
Section 5: Perceptions of T levels
Key Findings – T Levels
• There has been an increase in the proportion of learners reporting a very or quite good
understanding of T levels (20% to 25%).
• Awareness of T Levels among employers was 12% (comparable with 13% in wave 3).
• For each of the statements about T Levels (e.g. understanding their purpose), there was
relatively low agreement among learners. This tends to be due to a large proportion saying
that they ‘don’t know’, as opposed to disagreement, which is likely because it is only the
second year of T Levels.

Perceptions of Vocational and Technical Qualifications in England
Copyright 2020 YouGov plc. 67
Understanding of T levels For figure 40, the wave 4 effective base is all learners, 521 (514 in wave 3).
The first wave of three T Levels was introduced in September 2020 for a selected number of providers
and their learners. A quarter (25%) of all learners reported having a very or quite good understanding
of T levels, while 35% reported that they have no understanding at all. The data from this wave
indicates that overall, learners now have a better understanding of T levels in comparison to wave 3
(25% vs. 20%), as well as fewer learners saying that they have no understanding at all (35% vs. 43%).
Figure 40. ‘Which of the following statements describes your understanding of T
Levels?’

Perceptions of Vocational and Technical Qualifications in England
Copyright 2020 YouGov plc. 68
For figure 41, the wave 4 effective base is all employers, 1,391.
In line with their general lower understanding of qualifications, employers also had a relatively low
understanding of T levels. Levels of understanding of T Levels remained low, with only 12% having a
very or quite good understanding of these qualifications. This was comparable with wave 3 findings
(13%).
Figure 41. Results for ‘Please indicate your level of understanding about T Levels’
Perceptions of T levels For figure 42, the wave 4 effective base is all learners, 521.
For each of the statements about T Levels below (e.g. understanding their purpose), there was
relatively low agreement among learners. This tends to be due to a large proportion saying that they
‘don’t know’, as opposed to disagreement, which is likely due to only a quarter (25%) of learners
reporting having a very or quite good understanding of these qualifications.
Learners were more likely to agree that T Levels test the competence and vocational and technical
skills needed by employers (33%) with only a very small proportion (5%) disagreeing. Most were
unsure, with 43% saying they don’t know and 19% neither agreeing nor disagreeing.
Overall, roughly a quarter (27%) said they understand the purpose of T Levels. A smaller but significant
proportion said that they disagreed (18%) and a third (34%) were unsure.

Perceptions of Vocational and Technical Qualifications in England
Copyright 2020 YouGov plc. 69
Figure 42. ‘To what extent do you agree or disagree with the following statements
about T Levels?’

Perceptions of Vocational and Technical Qualifications in England
Copyright 2020 YouGov plc. 70
Section 6: Clarity regarding industry pertinent qualifications
Key Findings – Clarity regarding relevant qualifications
• Five in ten (52%) employers said it is clear which qualifications are relevant to their
organisation, and this was significantly higher among large employers (68%). There have
been no significant differences between waves 3 and 4 in whether employers agreed or
disagreed that it is clear which qualifications are relevant to their organisation.
• Seven in ten (70%) learners reported that it is clear to them which qualifications are relevant
to their needs. This was comparable with wave 3 (73%).
For figure 43, the wave 4 effective base is: All employers, 1,391.
Five in ten employers (52%) reported that it is clear which qualifications are relevant to their organisation, while two in ten (20%) said that it is not. Agreement that it is clear which qualifications are relevant decreased steadily alongside organisation size. Large (68%) and medium employers (65%) were significantly more likely than small (56%) and micro employers (50%) to feel that it is clear. Mirroring these findings by organisation size, public sector employers (74%) were statistically significantly more likely than private (51%) and voluntary sector (58%) employers to feel it is clear which qualifications are relevant to their organisation. As figure 43 shows, there have been no statistically significant differences between waves 3 and 4 in whether employers agreed or disagreed that it is clear which qualifications are relevant to their organisation.
Figure 43. Results for ‘It is clear which qualifications are relevant to my organisation’
(Employers)

Perceptions of Vocational and Technical Qualifications in England
Copyright 2020 YouGov plc. 71
For figure 44, the wave 4 effective base is: All learners, 521.
Seven in ten (70%) agreed that it is clear to them which qualifications are relevant to their needs, while a much smaller proportion (9%) disagreed. This was comparable with wave 3 findings.
Figure 44. Results for ‘It is clear to me which qualifications are relevant to my needs’
(Learners)
Perceptions of Vocational and Technical Qualifications in England
Copyright 2020 YouGov plc. 72
Section 6: Use of qualifications for recruitment and training
Key Findings – Other Vocational and Technical Qualifications
• For people in entry level and admin roles, roughly a quarter (27%) of employers reported
that all or most training leads to a qualification, similar to the 28% of employers who
reported this for skilled and supervisory roles and the 31% who reported this for
professional and managerial roles.
• Micro and small employers were more likely than large employers to report that no training
leads to qualifications for employees across all different roles.
• Approximately four in ten (38%) employers reported that in the last 12 months, training
their organisation had arranged or funded had led to a VTQ. Large employers were
significantly more likely than micro, small or medium sized employers to have reported that
training led to FSQs or EPA of an apprenticeship.
• Employers reported that the most common factor taken into account when they decide
which qualification to offer to employees is the relevance of the qualification to their
organisation (68%). Roughly two-fifths (38%) of employers mentioned that the qualification
being valued in their sector was a factor taken into consideration.

Perceptions of Vocational and Technical Qualifications in England
Copyright 2020 YouGov plc. 73
Qualifications deemed essential at different occupational levels
For figure 45, the effective base for wave 4 is: All employers, 1,391. Roughly a third of employers reported that when recruiting to skilled and supervisory roles (35%) and to professional and managerial roles (32%), relevant work experience was essential. This was a decrease since wave 3, in which 42% of employers reported that relevant work experience was essential for skilled and supervisory roles. For professional and managerial roles, a third (33%) reported that it was essential that new employees had a degree, or equivalent level 6 qualification. When recruiting to skilled and supervisory roles it was more common for employers to report that it was essential that new employees had a relevant VTQ (22%). In contrast, when recruiting for entry level and admin roles it was most common for employers to have reported that new employees should have Maths and English GCSEs (34%) and/or Maths and English FSQs (28%).
Figure 45. Results for ‘When recruiting new employees, are any of the following
essential for the following types of roles’ (Employers)

Perceptions of Vocational and Technical Qualifications in England
Copyright 2020 YouGov plc. 74
For figures 46 and 47, the wave 4 effective base is: Employers who have arranged or funded training for their employees, 465. For the differing levels of job roles, a similar proportion of employers reported that all or most training leads to a qualification. For people in entry level and admin roles, roughly a quarter (27%) of employers reported that all or most training leads to a qualification compared with 28% of employers who reported this for skilled and supervisory roles and 31% who reported this for professional and managerial roles. Micro and small employers were more likely than large employers to report that no training leads to qualifications for employees across all different roles. For entry level and admin roles, 35% of micro employers and 19% of small employers reported that no training they arranged or funded leads to a qualification compared to just 12% of large employers.
Figure 46. Results for ‘Thinking about the training your company has arranged or
funded in the last 12 months, how much of it, if any, typically results in a qualification’

Perceptions of Vocational and Technical Qualifications in England
Copyright 2020 YouGov plc. 75
Approximately four in ten (38%) employers reported that training their organisation arranged or funded had led to a VTQ – this was the most common qualification across all employers. A quarter (25%) of employers reported that training led to an ‘other’ type of qualification, with micro employers (29%) being much more likely to report this than large employers (8%). Large employers were significantly more likely than micro, small or medium sized employers to have reported that training led to FSQs or an EPA of an apprenticeship.
Figure 47. Results for ‘Has any of the training your organisation has arranged or
funded in the last 12 months led to any of the following?’ (Employers who have
arranged or funded training for employees in last 12 months)

Perceptions of Vocational and Technical Qualifications in England
Copyright 2020 YouGov plc. 76
For figure 48, the wave 4 effective base is: Employers who arranged or funded training that didn’t
lead to a vocational or technical qualification or EPA of an apprenticeship, 446.
Employers who said that they had not arranged or funded training that had resulted in a vocational qualification, an apprenticeship or a technical qualification were asked why that was. Most commonly employers reported that they had no need for those qualifications or that they don’t have any apprentices in their organisation (both 36%). Compared with wave 3 these 2 factors remain the most common reasons. Roughly one in ten employers mentioned lack of awareness, with 8% reporting that they were not aware of them or did not know which ones were relevant for them. Of those employers who said they had no need to arrange or fund training that led to a qualification, (51%) reported this was simply because their employees do not need VTQs or apprenticeships. This was comparable with wave 3 (54%).
Figure 48. Results for ‘Can you please say why your organisation hasn’t arranged or
funded training that led to a vocational or technical qualification and/or
apprenticeship?’ (Employers who have arranged or funded training for employees in
last 12 months which has not led to Vocational/technical qualification or End-point
assessment of an apprenticeship)

Perceptions of Vocational and Technical Qualifications in England
Copyright 2020 YouGov plc. 77
For figure 49, the wave 4 effective base is: Employers who have arranged or funded training for their employees, 465. Employers reported that the most common factor taken into account when they decide which qualification to offer their employees is the relevance of the qualification to their organisation (68%). Roughly two-fifths (38%) of employers mentioned that the qualification being valued in their sector was a factor taken into consideration.
Figure 49. Results for ‘Can you please indicate which of the following factors are
taken into account when your organisation decides which qualifications to offer its
employees?’ (Employers who have arranged or funded training for employees in last
12 months)