
PERCEPTIONS OF RISK By Linda M. Robson
165
PERCEPTIONS OF RISK AT MEETINGS AND CONFERENCES: AN EVENT PLANNER’S PERSPECTIVE By Linda M. Robson A thesis presented to the University of Waterloo in the fulfillment of the thesis requirement for the degree of Doctor of Philosophy in Recreation and Leisure Studies Waterloo, Ontario, Canada Linda Robson 2009
Transcript of PERCEPTIONS OF RISK By Linda M. Robson

PERCEPTIONS OF RISK
AT MEETINGS AND CONFERENCES:
AN EVENT PLANNER’S PERSPECTIVE
By
Linda M. Robson
A thesis presented to the University of Waterloo
in the fulfillment of the thesis requirement for the degree of
Doctor of Philosophy in
Recreation and Leisure Studies
Waterloo, Ontario, Canada
Linda Robson 2009

ii
I hereby declare that I am the sole author of this thesis. This is a true copy of the thesis,
including any required final revisions, as accepted by my examiners.
I understand that my thesis may be made electronically available to the public.

iii
ABSTRACT Events are a part of every culture and community (Allen, et al., 2002; Getz, 1997; Getz,
2007; Rogers, 2003). They may differ in their purpose (celebration, education,
marketing), but at the core they are a gathering of people (Goldblatt & Nelson, 2001).
Economically, the event industry is an important sector of the tourism industries; in the
USA it is estimated at $652 billion USD in revenues and to have created more than 1.7
million jobs in 2005 (Rutherford Silvers, 2008). Inherent within this industry are risks of
varying types (financial, physical, legal, etc) that are the responsibility of the event
planner to assess and manage. There are numerous proposed risk assessment and
management strategies (GWU Tourism, 2007; MacLaurin & Wykes, 2003; Rutherford
Silvers, 2008; Ryerson, 2008; Tarlow, 2002a), which are based on models presented in
the general risk literature (Althaus, 2005; Johnson, 1993; Law, 2006; Sjoberg, 2000b;
Slovic, 2000; Slovic, et al., 2004). However, there are no empirical data to support these
proposed models, nor any research that has studied event planner perceptions of potential
sources of risk. This study is an exploration of the socio-demographic influences of
event planners on risk perception and how these support the current risk assessment and
risk management strategies.
A model was developed that outlined the manner in which experience, education,
gender and country of residence influenced the risk concepts of “dread” and
“familiarity”. These concepts then lead to risk perception that, in turn, influenced risk
assessment and risk management. In order to test this model, a mixed-methods, two-
stage approach was used (Creswell, 2003; Veal, 2006). In-depth interviews were used to
develop a definition of risk specific to the event industry, followed by an on-line survey

iv
to measure perceptions of various risk elements and gather socio-demographic
information. There was evidence to support education, experience, gender and country of
residence as influencing perceptions of “dread” and “familiarity” that, in turn, directly
correlated with levels of risk perception.
This exploratory research has opened the way for many new facets of research in
the event industry. Future research is suggested in the areas of cultural influence on risk
perception, risk perception related to various event types (festivals, sports, mega-events,
etc), and risk management strategies utilized by event planners.
KEYWORDS: event industry, risk, risk perception
v
Acknowledgements This work is the result of a great deal of support and encouragement from several tremendous individuals and groups. I am grateful to have so much support surrounding me. First, I would like to thank Meeting Professionals International (MPI) for their continued support through a Foundation Grant, several scholarships, and use of their membership e-mail list. Thank you also to all the participants, this would have been impossible without them. My doctoral committee, Dr. Stephen Smith, Dr. Mark Havitz, Dr. Tanya MacLaurin, and Dr. Don MacLaurin, were a continual source of encouragement, both professionally and personally. They provided essential direction and guidance. Thank you to Dr. Douglas Frechtling (George Washington University) for encouraging me to pursue this degree in the first place, and for being a wonderful mentor. A special thank you to my advisor, Dr. Stephen Smith for continually supporting my goals and objectives, for giving me advice, and for many enlightening conversations. I feel truly lucky to have a mentor who looked after my best interests, even when I was being ‘ambitious’. My time at Waterloo was made memorable thanks to my cohort, Suzanne Ainley, Cris Calley Jones, Darla Fortune, Karen Gallant, Amanda Johnson, and Colleen Whyte. It was an honour to share the field of battle with you. Thanks to Dr. David Swayne (University of Guelph). I have been fortunate to have such a wonderful person as my employer for many years and even more fortunate to be able to call him friend and family. Thank you to my friend and stats wizard, Serge Desmarais, you have helped me more times than I can count. Thank you for always being there and supporting me. Thank you to my friends, Marlene Blas, Joy Steele, and Christine Lockhurst, for always being there to boost my spirits when I felt like I had taken on too much. Their kind words and love have meant the world to me.

vi
Dedication
Thank you does not even begin to describe my gratitude to Cody, Amy, and Brian. You
have been witness to the process first-hand, seeing all the stress, frustration, excitement,
and joy. Your unwavering and unconditional love, pride, and belief gives me strength
and courage; this accomplishment is as much yours as mine.

vii
Table of Contents
List of Figures ixList of Tables x Chapter 1: Introduction and Overview 11.1 Event Industry Introduction 11.2 Event Industry History 31.3 Event Industry Today 41.4 Purpose of the Study 8 Chapter 2: Literature Review 92.1 Event Industry Research 2.1.1 Definitions and Terminology 2.1.2 Meeting Planners 2.1.3 Safety and Security 2.1.4 Summary of Literature Review of Event Industry Research
1015161617
2.2 Risk and Risk Perception 182.3 Risk and Tourism 252.4 Risk and the Event Industry 272.5 Conclusions 30 Chapter 3: Methodology and Risk Definition 333.1 Introduction 333.2 Research Questions 333.3 Approach and Analysis 343.4 Considerations in Developing the Sampling Frame 343.5 First Stage Methodology
3.5.1 Interviews 3.5.2 Operationalizing a Definition of Risk 3.5.3 Respondent Profiles 3.5.4 First Interview 3.5.5 Second Interview
3.5.6 Third Interview
36363738384143
Chapter Four: Risk Perception 464.1 Second Stage Methodology 4.1.1 Surveying
4646
4.2 Risk Perception 4.2.1 Sampling Frame 4.2.2 Pilot Survey
484950
4.3 Survey Procedures 53 Chapter Five: Results 545.1 Introduction 545.2 Respondent Demographics 54

viii
5.3 Respondent Professional Practices 565.4 Event Industry Risk Perception 605.5 Dimensions of Risk 635.6 Regression Analysis 675.7 Education, Experience and Gender Questions 705.8 Country of residence Questions 865.9 Summary 91 Chapter Six: Discussion, Conclusions, and Future Research 926.1 Discussion 6.1.1 Education and Experience 6.1.2 Gender 6.1.2 Country of residence
92929697
6.2 Conclusions 996.3 Future Research 1036.4 Final Remarks 106 Appendix A – Expert Panel Correspondence 107Appendix B – Expert Panel Questions 110Appendix C – CATPAC Exclusion Words 111Appendix D – First Interview Dendogram Results 113Appendix E – Announcement Letter 121Appendix F – Survey Instrument 122Appendix G – Reminder E-mail 134Appendix H – Regression Tables 135 Bibliography 147

ix
List of Figures Figure 1 Tourism Industry Sectors 2Figure 2 A Typology of Planned Events 6Figure 3 Event Industry Publications 1990 – 2003 10Figure 4 Topic Areas of Event Industry Research 12Figure 5 Topic Areas by Research Focus 12Figure 6 EMBOK Model 18Figure 7 Event Industry Risk Perception Model 32Figure 8 Histogram of Risk Element Scale 63Figure 9 The Risk Management Process 100Figure 10 Event Industry Risk Perception Model 102

x
List of Tables
Table 1 Event Industry Organizations 5Table 2 Disciplines and Risk Perceptions 19Table 3 Cultural Theory Groups, Characteristics, and Risk Perceptions 23Table 4 Advantages and Disadvantages of Interviewing 36Table 5 Memo Note Analysis 41Table 6 Risk Examples 43Table 7 Questionnaire Types and Descriptions 46Table 8 Advantages and Disadvantages of Survey Methods 47Table 9 Survey Revisions from Pilot Survey 51Table 10 Respondent Information 55Table 11 Years of Experience 56Table 12 Event Management Education & Years of Experience 56Table 13 Number of Event Planned 57Table 14 Resources Used 58Table 15 Resources Used by Country 58Table 16 Risk Strategies 60Table 17 Cronbach’s Alpha 60Table 18 Risk Perceptions 61Table 19 Mean Probability Ratings of Risk Sources 62Table 20 Results of KMO and BST 64Table 21 Communalties 65Table 22 Factor Solution 66Table 23 Risk Perception Scale Regression 67Table 24 Weather and/or Natural Hazards Regression 69Table 25 Event Management Education 70Table 26 Education and Risk Perception 70Table 27 Risk Perception and Years of Experience 76Table 28 Gender and Risk Perception 83Table 29 Country of Residence and Risk Perception 87Table 30 Experience and Risk Perception Levels 93Table 31 Country of Residence and High Risk Perception Levels 97Table 32 EMBOK and Risk Perception 103

1
CHAPTER ONE
Introduction and Overview
Risk is a many-layered concept, one that has yet to have a single, widely accepted
definition (Clarke and Short Jr, 1993; Fischhoff, et al, 2004; Tierney, 1999). Risk can take
myriad forms and is influenced by facts, perceptions, experience, social groups, culture,
and personal judgments (Boholm, 1998; Cole and Withey, 1981; Rogers, 1997; Sjoberg,
2000b). In addition, sensational occurrences can dramatically affect risk perception, as
evidenced by the 2001 September 11th terrorist attacks that led to an increased awareness
in the tourism academic and non-academic literature (see, e.g., Kegley, 2003) of terrorism.
Tourism is an integral part of the global economy; it generates spending
internationally and creates jobs (Allen et al, 2002; Dwyer, 2002; Tarlow, 2005). Socially,
tourism provides a venue exposing travelers to new cultures and ideas, thereby promoting
a more global community (Goeldner & Ritchie, 2003; Tarlow, 2002b). In addition, visitors
are highly mobile and may change their choice of destination if they perceive an increase
in risk at a destination. Does this belief that tourism is at risk trickle down to the
individual industries of the tourism sector? Although the event industry is part of the
tourism sector, and shares some of these risks, there are risks that are event-specific.
Studies have concentrated on how to assess and manage risk, but as yet have not provided
an empirical exploration of risk from the perspective of the event planners.
1.1 Event Industry Introduction
Events are one of many industries that are considered part of tourism (Figure 1). The
Events sector can be further classified as conventions, meetings, and exhibitions. For the

2
purposes of this research, “events” are defined as “a function requiring public assembly for
the purpose of celebration, education, marketing and reunion” (Goldblatt & Nelson, 2001:
71). The various types of events can be categorized as: meetings and conferences; social
life-cycle events; civic events; expositions; fairs and festivals; hallmark events; and sports
events.
Figure 1. Tourism Industry Sectors
Source: Goeldner & Ritchie, 2003: 122
Attractions
Adventure & Outdoor
Recreation
Food Services
Entertainment
Transportation
Tourism Services
Accommodation
Travel
Events
Tourism
Industries

3
1.2 Event Industry History
Events have always been a part of every culture as rites of passages, celebrations, festivals,
and rituals (Allen, et al, 2002; Getz, 1997; Getz, 2007; Rogers, 2003). The oldest known
event is arguably the Greek Olympics. Although the original date is not known, it is
believed to have began circa 776 BC (Olympic Museum Lausanne, 2002). As civilization
became less nomadic, and city centres became places for gathering and business, events
took on a public face. These traditions were transported to North America with the arrival
of the first settlers.
Over the course of the next century, professional associations formed which hosted
events in North America, becoming part of American culture (Spiller, 2002). These
associations began to hold meetings in the mid-1800s, attracting the attention of businesses
interested in making a profit by serving the association meetings’ growing needs. In 1896,
the city of Detroit formed the first convention bureau with the aim of attracting convention
business (Montgomery & Strick, 1995; Spiller, 2002). By 1910, five more cities had
convention bureaux and the American Hotel Protective Association (AHPA) was formed
(Montgomery & Strick, 1995; Spiller, 2002). This was followed quickly by the
International Association of Convention Bureaus (IACB) in 1914, and the Hotel Sales
Management Association (HSMA) in 1927 (Montgomery & Strick, 1995).
These organizations were designed to increase the professionalism of individuals
and corporations in the hospitality industry (Montgomery & Strick, 1995). In 1949, three
of these organizations (AHPA, IACB, and HSMA) joined together with the American
Society of Association Executives (ASAE) to form the Convention Liaison Council
(CLC), which is still in existence today (Fenich, 2005; Montgomery & Strick, 1995). This
4
organization has a mandate to provide a centralized location for information related to
meetings, conventions, and expositions (Montgomery & Strick, 1995). Another key
development for the event industry came from Jim Collins in the late 1940s. Mr. Collins
was a salesperson at the Chicago Conrad Hilton Hotel and recognized a need for a
designated person to deal with these increasing business meetings, the first meeting
planner (Montgomery & Strick, 1995).
As can be inferred, the hotel industry was the leader in professionalizing the event
industry, but it was not alone in that venture. In the background there were always people
responsible for planning the events. The Professional Convention Management
Association was formed in 1957 (PCMA History, 2007). In 1972, Meeting Planners
International (MPI) was formed, later changing its name to Meeting Professionals
International to reflect the diversity of its membership (Fenich, 2005). The International
Special Events Society (ISES) was formed in 1987 (ISES, 2007). These associations were
designed to provide educational and professional development opportunities (ISES, 2007;
MPI, 2007; PCMA, 2007). Currently, Human Resources and Skills Development Canada
lists 30 job titles related to the event industry (HRSDC, 2008).
1.3 Event Industry Today
Economically, the event industry is an important part of tourism. Lee & Back (2005)
estimated that in 2003 $141.3 billion USD in revenues were generated by the MICE
(meetings, incentives, conventions and expositions) industry. The event industry is
comprised of many different types of events and a variety of industries (Goldblatt, 2000).

5
Each event draws different kinds of people with different reasons for attendance, with the
common denominator being people coming together.
Table 1 is a partial list of the current associations that exist in the event industry
and the country in which it is incorporated. There are numerous other organizations that
are affiliated, or provide services to, the event industry, but events are not their primary
business. As can be seen, the majority of the event associations have their headquarters in
the USA. The numerous entries in the table illustrate the diversity of the industry with
umbrella organizations such as MPI, and ISES and specialized organizations, such as
FILM. The majority of professionals belong to MPI and/or ISES; many also belong to
more specialized associations because each specialization has characteristics that require
specific educational and training programs.
Table 1. Event Industry Organizations American Society of Association Executives (ASAE), U.S.A.
Association for Convention Operations Management, U.S.A.
Association for Fundraising Professionals, U.S.A.
Association of Bridal Consultants (ABC), U.S.A.
Association of Destination Management Executives (ADME), U.S.A.
Association of International Meeting Planners (AIMP), U.S.A.
Convention Liaison Council (CIC), U.S.A.
Council of Engineering and Scientific Society Executives (CESSE), U.S.A.
Foundation for International Meetings (FILM), U.S.A.
Hospitality Sales and Marketing Association International (HSMAI), U.S.A.
Insurance Conference Planners Canada, Canada
International Association for Exhibition Management, U.S.A.
International Association of Assembly Managers, U.S.A.
International Association of Conference Centers, U.S.A.
International Association of Conventions and Visitors Bureaus (IACVB), U.S.A.
International Association of Fairs and Expositions (IAFE), U.S.A.
International Association of Professional Congress Organizers (IAPCO), United Kingdom
International Congress and Convention Association, The Netherlands
International Meetings Association, The Netherlands
International Festivals and Events Association (IFEA), U.S.A.
International Institute of Convention Management, U.S.A.
International Special Events Society (ISES), U.S.A.
Meeting Professionals International (MPI), U.S.A.
National Association of Catering Executives (NACE), U.S.A.
National Association of Reunion Managers, U.S.A.
National Coalition of Black Meeting Planners (NCBMP), U.S.A.
National Society of Fundraising Executives, U.S.A.
Professional Convention Management Association
Religious Conference Management Association
Society of Corporate Meeting Professionals (SCMP), U.S.A.

6
(PCMA), U.S.A. (RCMA), U.S.A. Society of Government Meeting Professionals (SGMP), U.S.A.
Society of Government Travel Professionals (SGTP), U.S.A.
Society of Incentive Travel Executives (SITE), U.S.A.
Source: Goldblatt & Hu, 2005: 419-425
These associations represent different subfields of events. There are many different
types of events, from weddings to sports tournaments to conventions. One way to
categorize these many subfields is illustrated by Figure 2. Each of these categories fulfills
different requirements for their attendees. Meetings and conferences are educational and
networking opportunities; private events are celebrations; cultural celebrations are
community based; expositions are trade shows; fairs and festivals are entertainment
gatherings; hallmark events are large and global (e.g., Olympics, National Football League
Super Bowl); and, sports events are athletic games and/or tournaments (Goldblatt, 2008;
Goldblatt & Nelson, 2001). Although there are many differences, at the core, all these
events are gatherings, and social (networking, celebrating, etc) in some manner.
Figure 2. A Typology of Planned Events CULTURAL CELEBRATIONS - Festivals - Carnivals - Religious events - Parades - Heritage Commemorations
SPORT COMPETITIONS - Professional - Amateur
POLITICAL / STATE - Inaugurations - Investitures - VIP visits - Rallies
ART / ENTERTAINMENT - Concerts - Other performances - Exhibits - Awards ceremonies
EDUCATIONAL AND SCIENTIFIC - Seminars, Workshops, Clinics - Congresses - Interpretive events
BUSINESS / TRADE - Fairs, Markets, Sales - Consumer and Trade Shows - Expositions - Meetings and Conferences - Publicity events - Fund-raiser events
RECREATIONAL - Games and Sports for fun - Amusement events
PRIVATE EVENTS Personal Celebrations - Anniversaries - Family holidays - Rites of passage Social Events - Parties, galas - Reunions
Source: Getz, 1997: 7

7
Not only does the event industry boast diversity of subfields, but also in its
stakeholders. There are four main stakeholders in the event industry: the
attendees/participants, the planners, the suppliers, and the organizations.
Attendees/participants are those who are invited and/or pay to attend an event. Suppliers
are the various businesses that provide the goods and services necessary to create the event
environment (hotels, conference centres, rental companies, florists, etc). Organizations are
the groups that require, and pay for, the event to occur. They can be corporations,
associations, or volunteer-based. Planners are the people who are responsible for the
research, design, planning, coordination, evaluation and execution of the event (Goldblatt
& Nelson, 2001). Although ultimately planners are responsible to the client that hired
them or the organization for which they work, they also have a responsibility to provide a
satisfying experience for attendees. In addition, planners and suppliers are part of the
event industry and must work in concert to uphold the standards and reputation of the
industry as a whole.
Given the uniquely important position of event planners in the event industry, it is
curious that little research has been undertaken on this profession. Descriptive
demographic research investigating age, education, certification, years of employment in
the industry, training, type of event planned, location of event (domestic or international),
travel habits, research sources, and place of residence would provide benchmark data on
which to conduct future research on event planners’ perception, motivation, and decision-
making processes.

8
1.4 Purpose of the Study
As just noted, there is little demographic research on event planners. Moreover, with
respect to the current study, there has been no research on event planners’ perception of
risk. Most academic literature on events has focused on surveying event planners
regarding site selection, and evaluation of meeting services and destinations (Lee & Back,
2005). Some professional literature describes how the event industry should manage risk,
but does not provide guidance for assessing the actual level of threat. Event planners are
faced with many forms of risk that have not been previously identified.
This research is an exploratory examination of the potential factors that contribute to
the perception of risk by meeting and conference event planners in the event industry.
Questions will be developed to explore the potential relationships between gender,
experience, education, and country of residence and 11 event industry risk elements. This
research will assist event planners, educational institutions, and destinations to gain a sense
of those factors contributing to an increase in the risk perception of event planners. It will
also provide a starting point for understanding which event elements are perceived as being
riskier than others.

9
CHAPTER TWO
Literature Review
A large body of scholarly literature regarding risk and risk perception in general, and with
regard to tourism, has been developed. The literature related to risk and the event industry
has focused on risk management, risk assessment, and risk strategies. This chapter begins
with an overview of the event industry literature both scholarly and professionally. It also
includes a review of the literature on risk and risk perception, followed by risk and tourism
literature and concluding with the event industry risk literature.
Many scholars have applied the general risk and risk perception literature to their
disciplines (Faro & Rottenstreich, 2006; Froot, et al., 1994; Linsley & Linsley, 2008;
March & Shapiro, 1987; Miller, 1992). Event planners could be viewed as having to make
risk decisions in the same vein as managers in the field of business, so a brief review of
this literature was considered. Studies in management focus on decision-making processes
and those variables that could influence these processes, such as risk (Faro &
Rottenstreich, 2006; Linsley & Linsley, 2008). As well, this literature also looks at
predicting other people’s perceptions of risk in order to assess and manage risk. Although
efforts to predict risk appears to be in line with what event planners do, there is a
significant and important difference: the management literature assumes that managers
will willingly take risks (March & Shapiro, 1987). This means that they will seek out
those risks that offer the potential for an increase in profitability and/or awareness. By
stark contrast, event planners seek to identify and assess risk as a means of eliminating, or
reducing it to an acceptable level and developing strategies to deal with the negative

10
consequences. Due to the difference in focus on acceptable risk, this literature was not
examined further for the current study.
2.1 Event Industry Research
The event industry includes people, places, and activities. It is a dynamic and evolving
industry with many related industries, such as venues, hotels, and caterers. Research has
contributed to knowledge in several areas and there are also numerous review articles that
summarize this research (Abbey & Link, 1994; Formica, 1998; Lee & Back, 2005).
Several articles identify dominant research themes and suggest avenues for future research
(Getz, 2000; Ladkin, 2002; Yoo & Weber, 2005). Prior to 1993, with the founding of the
journal Festival Management & Event Tourism (now titled Event Management), event
industry research was found in main stream tourism journals such as Annals of Tourism
Research, Tourism Management, and Journal of Travel Research (Formica, 1998; Lee &
Back, 2005). In 1998, the Journal of Convention & Exhibition Management (now titled
Journal of Convention & Event Tourism) was founded, providing two publications
committed to the advancement of event industry knowledge and research (Lee & Back,
2005). From 1998-2003, a total of 137 research articles related to the event industry were
published (Figure 3).
Figure 3. Event Industry Publications 1990-2003
Name of Publication Years Covered in Analysis
# of Articles Identified
Journal of Convention & Exhibition Management (JCEM) International Journal of Hospitality Management (IJHM) Cornell Hotel & Restaurant Administration Quarterly (CHRQ) Tourism Management (TM)
1998-2003
1990-2003
1990-2003
1990-2003
60
13
11
10

11
Journal of Hospitality & Tourism Research (JHTR) * Journal of Travel & Tourism Marketing (JTTM) International Journal of Tourism Research (IJTR) FIU Hospitality Review (FIU) Journal of Hospitality & Leisure Marketing (JHLM) Journal of Travel Research (JTR) Annals of Tourism Research (ATR) International Journal of Contemporary Hospitality Management (IJCHM) Others
1990-2003
1992-2003
1999-2003
1990-2003
1993-2003
1990-2003
1990-2003
1990-2003
1990-2003
8
5
5
4
4
3
2
2
10
Total: 137 *Formerly the Hospitality Research Journal (1990-1996) Source: Lee & Back, 2005: 7
Marketing dominates research in the event industry (Ladkin, 2002; Lee & Back,
2005; Yoo & Weber, 2005). This is not surprising considering the fact that the event
industry is a sector of the tourism industries and marketing research has been a dominant
theme in this field as well. An electronic search of SCIRUS using “marketing” and
“tourism” resulted in 1,785 articles (SCIRUS, 2007). Formica (1998) conducted a content
analysis of 83 articles related to festivals and special events to discover the research topics
investigated and the methodological and statistical techniques used. He found that
economic/financial impact and marketing dominated the articles (see Figure 4). The focus
on economic/financial impact and marketing is understandable because the
accommodation industry sought, and funded, much of the event industry research in order
to make their marketing programs more effective.

12
Figure 4. Topic Areas of Event Industry Research Area Number Economic/financial impact Marketing Profile of festival/event Sponsorship Management Trends and forecasts
15 13 10 10 10 4
N=83 Source: Formica, 1998: 135
Lee and Back (2005) conducted a content analysis of 137 convention and meeting
articles in the period 1990-2003 (see Figure 5). In their study, research areas were further
elaborated to connect the industry player with the research topic. For example, research
that focused on “Attendees” was concerned with those factors that could potentially
influence their decision to participate in an event. Lee and Back found that research
focused on Meeting Buyers (planners) dominated the articles, with site selection and
perceived evaluation of meeting services and destinations as the leading themes.
Figure 5. Topic Areas by Research Focus Research Focus Sub-themes (Functional area) # of Articles (%) Meeting Suppliers Meeting Buyers Attendees Industry General
Destination marketing & CVB operations Hotel meeting sales & operations Convention center development & operations Other meeting venues
Sub-Total: Meeting planning (budgeting, scheduling, planners’ role) Site-selection process (attributes, factors, & criteria) Planners’ evaluation of meeting services & destinations
Sub-Total: Meeting participation process (factors)
Sub-Total: Trends, issues, and the future of industry (forecasting) International meeting market Economic (socio-economic) impact Advances in technology Education (college curriculum) Other areas (law, labor, government)
19 (13.87) 9 (6.57) 7 (5.11) 3 (2.19)
38 (27.74)
12 (8.76)
18 (13.14) 16 (11.68) 46 (33.58)
8 (5.84) 8 (5.84)
11 (7.03) 5 (3.65)
13 (9.49) 9 (6.57) 4 (2.92) 3 (2.19)

13
Sub-Total:
Total:
45 (32.85)
137 (100)
N=137 Source: Lee & Back, 2005: 15
These studies are supported by other summaries of event industry research, albeit
not as detailed or longitudinal. For example, Abbey and Link (1994) noted the importance
of site selection in their review of academic and industry (associations and trade
publications) research on events. According to their analysis, research by industry
associations was conducted primarily by the International Association of Convention and
Visitor Bureaus (IAVCB). This research was concerned with convention expenditures.
Other trade publication research explored the characteristics of meetings (type, number of
attendees, lead time in planning, etc).
Ladkin (2002) also looked at the same three groups conducting research as Abbey
and Link. She suggested that academic research has focused on economic impacts and site
selection issues. Industry association research has been conducted by the Union of
International Associations (UIA) and the International Congress and Convention
Association (ICCA), and findings from this research have been international in nature,
centered on characteristics of the meetings (size, types, services, and venues), and profiles
corporate meeting planners. Ladkin also mentions the IACVB research referred to by
Abbey and Link. Ladkin suggests that research by trade publications is generally
concerned with destination and facility promotion.
As mentioned, there have been two publications dedicated to research specific to
the event industry since 1993. A review of the titles of articles published in Event
Management (formerly Festival Management and Event Tourism), and the Journal of

14
Convention and Event Tourism (formerly the Journal of Convention and Exhibition
Management) was conducted using the period 1998 – 2007. Topics from Event
Management used festivals, sporting events, and cultural activities, with some references
to conventions, for the base of study. A majority of the articles focused on marketing,
economics, behaviours, motivations, perceptions, and reactions of event planners and
attendees (Event Management, 2007; Festival Management and Event Tourism, 2007).
Authors from the Journal of Convention and Event Tourism used conventions,
conferences, associations, and meetings for their base of study. Articles in this journal are
concerned primarily with convention centers and planners; with marketing and economic
issues following closely. This journal also seems to have included more studies of
international destinations such as Australia and Asia (Journal of Convention and Event
Tourism, 2007). As an aside, the Australian event industry is a source of a great deal of
research on the event industry, in part because the Australian government supports the
industry through funding of research and academic programs. In North America, academic
event industry programs are generally part of a tourism or hospitality program. In
Australia, however, there are numerous stand-alone event industry programs.
Two recent publications, Convention Tourism: International Research and Industry
Perspectives (Weber & Chon, 2002) and Event Studies: Theory, Research, and Policy for
Planned Events (Getz, 2007), contain large bibliographies. Again, a review of articles
within these bibliographies was conducted by the researcher that supports the claim that
marketing and economics are the primary areas of research. The scan of these two journals
and the bibliographies was not rigorous and did not follow content analysis procedures;

15
however, it does give an indication of academia’s research foci with regard to the event
industry.
Suggestions for future research have been made in many of the articles that have
been written (Abbey & Link, 1994; Carlsen, 1995; Go, et al, 2002; Ladkin, 2002; Lee &
Back, 2005; Oppermann & Chon, 1997; Weber & Chon, 2002). Those most relevant for
this study include definitions and terminology, meeting planners, and safety and security.
2.1.1 Definitions and Terminology
There are many definitions for all aspects of the event industry (Carls0n, 1995; Ladkin,
2002). This makes it difficult to compare research results. For example, Goldblatt (2008)
outlines the different responsibilities for event leaders, event managers, catering directors,
family reunion leaders, political event leaders, and tourism event leaders to name a few.
All of these titles have different background and experience requirements. It would be
useful to conduct research into the diverse definitions and terminologies that exist in
academia and the industry. The Convention Industry Council’s APEX (Accepted Practices
Exchange) has begun this process through panels that have proposed voluntary standards
for definitions, event specifications, requests for proposals, housing and registration,
contracts, and post-event reports (CIC, 2007). This could be the starting point for further
standardization of definitions, terminology, policies, and procedures.
In 2006, the World Tourism Organization and Meeting Professionals International
undertook a study to acquire the information necessary to develop a Tourism Satellite
Account for the event industry (UNWTO, 2006). As part of this study, concepts were
16
operationally defined, a list of services for the industry was identified, and cooperation
encouraged and promoted in data collection from all stakeholders (UNWTO, 2006).
2.1.2 Meeting Planners
Meeting planner, event manager, conference planner, conference producer, special event
manager, special event coordinator, corporate planner, wedding planner, meeting manager,
party planner: these are just a few of the titles used to describe the person responsible for
coordinating and executing the event plan (CIC, 2007). Responsibilities also vary greatly
depending on the organization, the event, experience levels, education, and accreditation.
There has been little research that has studied meeting planners’ education, responsibilities,
education, and/or skill sets. In addition there are numerous academic and professional
training programs available (Abbey & Link, 1994; Ladkin, 2002; Lee & Back, 2005).
2.1.3 Safety and Security
A focus of attention within the event industry has been the terrorist attacks of September
11, 2001. This horrific attack changed the world, bringing safety and security concerns to
the forefront in many industries, including events. Although some researchers have argued
the event industry is an ideal target for terrorists, several industry leaders suggest that
terrorism is not a direct threat (Ito, 2001; Yang, 2003). They suggest that a risk
management plan is necessary, but that objectivity is required when assessing terrorism as
part of this plan (Sturken, 2005). The belief in the need for developing risk management
plans or crisis plans is an assumption behind much of the existing literature (Boger, et al,
2005; Diamond, 2001; Goldblatt & Hu, 2005; Sturken, 2005; Tarlow, 2004). However,

17
even with all the attention and discussion regarding the potential impact of terrorism on the
industry, almost half of planners voluntarily surveyed do not have a risk management plan
tailored to each of their meetings (Sturken, 2005). In addition to terrorism are concerns
such as food safety, insurance requirements, on-site security, and alcohol regulations.
These concerns are likely to be more relevant to most events; however, there is no research
on the types of risks that are specifically associated with events. Research on safety and
security plans for each of the major players would provide a foundation for
standardization, and to identify gaps.
2.1.4 Summary of Literature Review on Event Industry Research
Getz (2007) asserts that there is a gap in the event industry between academia and
practitioners. Many practitioners are unaware of the research done in academia, do not
have an academic background, or do not see how to apply the research being done. At the
same time, researchers are not asking practitioners what they need to know. Getz (2000)
highlights the need for a framework for research conducted on the event industry. One
way to frame research would be to base it on the various management or functional areas
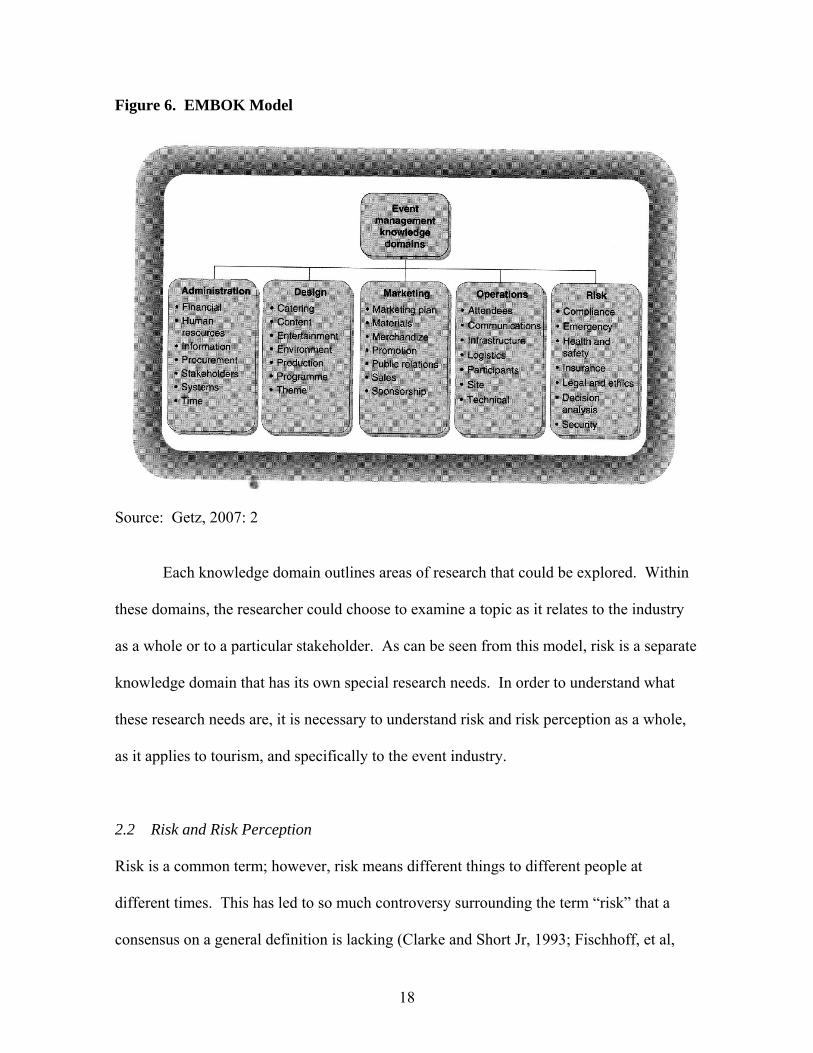
within the industry. The “Event Management Knowledge Domains” model EMBOK
(Figure 6), was designed by Rutherford Silvers (2008); based on work from a Masters’
thesis by William O’Toole. Its aim is:
[t]o create a framework of the knowledge and processes used in event management that may be customized to meet the needs of various cultures, governments, education programs, and organizations. (EMBOK, 2007)
18
Figure 6. EMBOK Model
Source: Getz, 2007: 2
Each knowledge domain outlines areas of research that could be explored. Within
these domains, the researcher could choose to examine a topic as it relates to the industry
as a whole or to a particular stakeholder. As can be seen from this model, risk is a separate
knowledge domain that has its own special research needs. In order to understand what
these research needs are, it is necessary to understand risk and risk perception as a whole,
as it applies to tourism, and specifically to the event industry.
2.2 Risk and Risk Perception
Risk is a common term; however, risk means different things to different people at
different times. This has led to so much controversy surrounding the term “risk” that a
consensus on a general definition is lacking (Clarke and Short Jr, 1993; Fischhoff, et al,

19
2004; Tierney, 1999). The reality, however, is that risk is part of everyday life and of
every decision that is made (Trimpop, 1994).
Each academic discipline has its own view of risk (Table 2). Historically,
economics dominated risk research (Althaus, 2005; Cole and Withey, 1981) and has
influenced the manner in which other disciplines have developed their theories of risk.
Economic theory suggests that within risk there is a concept of “loss”. The idea of loss
occurs frequently within the literature (Reisinger and Mavondo, 2005; Sonmez and Graefe,
1998b; Trimpop, 1994; Tsaur, et al, 1997; Yates, 1992). Kaplan, Szybillo, and Jacoby
(1974) developed a taxonomy of risks in terms of losses: financial loss, performance loss,
physical loss, psychological loss, social loss, and time loss. Yates (1992) has suggested
that the elements of risk include the potential of loss, the significance of loss, and the
possibility of loss. Risk was believed to be defined through a cost/benefit analysis, closely
linked to economic theory (Renn, 1998), with measurement strategies that contain
mathematical concepts (e.g. Weber, et al., 2002). However, these mathematical concepts
and measurements do not account for individual differences such as motivation,
experience, education, and societal influence.
Table 2. Disciplines and Risk Perception Discipline How It Views Risk Logic and Mathematics Risk as a calculable phenomenon Science and Medicine Risk as an objective reality Anthropology Risk as a cultural phenomenon Sociology Risk as a societal phenomenon Economics Risk as a decisional phenomenon, a means of securing
wealth or avoiding loss Law Risk as a fault of conduct and a judicable phenomenon Psychology Risk as a behavioural and cognitive phenomenon Linguistics Risk as a concept History Risk as a story The Arts (literature, music, theatre, etc) Risk as an emotional phenomenon

20
Religion Risk as an act of faith Philosophy Risk as a problematic phenomenon Recreation * Risk as an experience Tourism * Risk as motivation Event Industry ** Risk as an objective and subjective reality to be
negotiated Source: Althaus, 2005: 569 * Adapted from: Lepp & Gibson, 2008 ** Author’s view
The concept of risk, in the social sciences, combines the ideas of what individuals
value and uncertainty (Renn, 1988). Subjectivity clearly is a central consideration in this
combination. Not only will individuals subjectively assign a value to a phenomenon, but
will subjectively assess the likelihood of a detrimental versus favourable outcome. In the
1970s, there was an increasing interest in explaining human response to natural hazards
(Slovic, 2000), which allowed social sciences to move to the forefront in risk research.
The emergence of social science perspectives in the field of risk research allowed
new perspectives on defining, measuring, and explaining the concept of risk. Some of the
new components of risk that were proposed included shock, threat, danger, lack of control,
and uncertainty (Althaus, 2005; Law, 2006; Sjoberg, 2000b; Yates, 1992). Social science
did not negate the economic concept of loss but, instead, incorporated it within a context
related to the ideas of uncertainty and control (Althaus, 2005; Fischhoff, et al, 2004).
These ideas outlined the manner in which risk is related to the human experience, in other
words, its subjective nature. From this perspective, risk cannot be defined solely in terms
of the activity or event, but must be viewed within the context of the person and social
environment in which the event occurs (Althaus, 2005; Clarke and Short Jr, 1993; Sjoberg,
2000b; Tierney, 1999; Yates, 1992). This is a particularly important point to keep in mind
when discussing risk perception, as perception is an even more individualized phenomenon

21
than risk. Perception is based not only on objective fact, but also on the individual’s
background, experience, and social group (Boholm, 1998; Cole and Withey, 1981; Rogers,
1997; Sjoberg, 2000b).
Risk perception research is an attempt to understand the differences in perceptions
across individuals (Cole and Withey, 1981; Renn, 1998; Slovic, 2000). It is rooted in
cognitive psychology and began as an attempt to discover the extent to which bias
(personal beliefs) affected judgments of risk (Slovic, 2000). In recent years, the focus has
shifted to an attempt to explain the discrepancy between expert and laypeople’s perception
of risk (Slovic, 2000). The field has been dominated by a few key personalities, namely
Paul Slovic, Baruch Fischhoff, and Sarah Lichtenstein. These researchers have been
conducting risk perception research since the 1960s (Slovic, 2000). Their research is based
on the initial work done in 1969 by Chauncey Starr. Starr’s research was an attempt to
understand how people judged technical risks as “safe” (Starr, 1969). It is difficult to
encounter any research or literature on risk or risk perception that does not refer to one, or
all, of these researchers. Two central concepts of the risk perception research promoted by
this group that have been supported by other researchers are heuristics (both affective and
availability), and culture (Boholm, 1998; Cole and Withey, 1981; Johnson, 1993).
Affective heuristics relate to the “good” or “bad” feelings individuals associate
with an event or activity (Slovic, et al., 2004). These responses occur automatically and
are useful when dealing with the multitude of choices (and risks) that are a part of
everyday life. The biggest problem with affective heuristics is its susceptibility to
manipulation by outside influences such as family, friends, media, and culture (Boholm,
1998; Slovic, et al., 2004). The concepts of “dread” and “unknown” have been found to be

22
common affective elements in individual’s perception of risk (Slovic, et al., 1982). Dread
risks are those events that invoke a strong emotional response of fear; these events are
perceived to be uncontrollable, fatal, and involuntary. Unknown risks are those events that
have not been experienced before and/or are delayed.
Availability heuristics are particularly important when considering individual risk
perception. They suggest that the easier an event is to recall or imagine, the more effect it
has on risk perceptions (Cole and Withey, 1981; Johnson, 1993; Renn, 1998). In fact, an
event that is negatively sensationalized, like the September 11, 2001 terrorist attacks, tends
to be judged as more of a risk even though it may involve fewer casualties than a more
common event such as smoking, which accounted for 37,000 deaths per year in Canada in
2007 (Health Canada, 2007). Availability heuristics also assists in explaining the difficulty
in changing an individual’s perception that is based on experience and emotion (Slovic, et
al., 1981). This suggests that a person’s experience plays an active role in determining risk
and not just the data or information that is being presented (Rogers, 1997).
Cultural influence is another common thread in the literature (Johnson, 1993; Renn,
1998; Rogers, 1997; Slovic, 2000). It has even lead to the association of something called
“cultural theory” as an explanation for risk perception (Althaus, 2005; Boholm, 1998;
Sjoberg, 2000b). In tourism risk perception research, “cultural theory” is prominent (Law,
2006; Reisinger and Mavondo, 2005; Rippl, 2002; Taylor-Gooby and Zinn, 2006). In
cultural theory, individuals are categorized through a “group/grid” typology, with “group”
referring to the extent an individual is incorporated into a particular social unit and “grid”
referring to the degree of control this social unit exerts over the individual (Thompson, et
al., 1990). At the core of this theory is the idea that “what matters most to people is how

23
they would like to relate to other people and how they would like others to relate to them”
(Thompson, et al., 1990: 97). This perspective suggests that people’s interpretation of the
world is influenced by their cultural environment; which includes various institutions, such
as schools and political systems (Althaus, 2005; Rippl, 2002).
The group/grid typology identifies five groups or ways of life: egalitarian,
hierarchical, individualistic, fatalistic, and hermit (Sjoberg, 2000a; Thompson, et al.,
1990). These groups are important to developing an understanding of risk perceptions
because group affiliations are the foundation of individual preferences and cultural biases
(Boholm, 1998; Taylor-Gooby and Zinn, 2006; Thompson, et al., 1990). Risk is seen,
within the group, as a force that affects the group’s way of life (Rippl, 2002). Table 3
summarizes the characteristics and associated risk perceptions of the five groups.
Table 3. Cultural Theory Groups, Characteristics, and Risk Perceptions Way of Life Characteristic Risk Perception Egalitarian Strong group boundaries
Minimal prescriptions Safe inside group
Hierarchical Strong group boundaries Binding prescriptions
Acceptable risk limits can be set
Individualistic Neither group or prescribed roles Risk as opportunity Fatalistic Binding prescriptions
Exclusion from group Risk is to be avoided
Hermit Withdrawal from coercive or manipulative social involvement
Eager to accept myopically perceived risk
Source: Thompson, et al, 1990
Cultural theory suggests that an individual’s perception of risk can be determined
through the process of determining his/her group. This theory predicts that an individual’s
perception of risk is a function of social processes (culture and institutions) more than an
individual’s autonomy, experience, and ability to adapt or learn.

24
Research in the fields of sociology and anthropology also contributed the idea that
culture is important in forming an individual’s risk perception (Althaus, 2005; Gardner,
2008). This view is based on the idea that individuals are influenced by the culture in
which they were raised and that each culture can have a different view of the world and
risk (Althaus, 2005; Boholm, 1998).
The literature also shows that gender can influence perceptions of risk. Women
have a slighter higher perception of risk than men (Flynn, et al., 1994; Gustafson, 1998;
Finucane, et al, 2000). Women tend to view risks that have the potential to harm those
they care about as having a higher probability of occurring than do men, due to the fact that
traditional gender roles ascribe women to a nurturing position (Finucane, et al., 2000). On
the other hand, men, particularly Caucasian men, are involved in the creation of societal
order to a greater extent and are presumed to have more control over social institutions
(Finucane, et al., 2000). This makes them more familiar with potential risks and
consequences which lessens the feeling of being out of control and/or unable to assess or
manage these situations.
Johnson (1993) offers a comprehensive list of factors that potentially influence risk
perception. They include:
1. Dread, Familiarity i. dread is characterized by a perceived lack of control, dread potential and
perceived fatal consequences ii. familiarity refers to the amount of knowledge and/or exposure that an
individual has regarding a risk 2. Likelihood of Occurrence
i. individual determination of possibility of risk occurring 3. Hazard Outcome
i. possible positive and negative outcomes 4. Social Networks, Religious Beliefs and Ideologies
i. opinions from friends, family, religious teachings, or people in employment or neighbourhood networks

25
Johnson’s categories have significant overlap with risk elements previously
mentioned. For instance, Renn’s (1988) “possibility of occurrence” is Johnson’s concept
of “likelihood of occurrence”. In addition, the concepts of shock, threat, danger, lack of
control, uncertainty, and social networks are also listed within Johnson’s categories.
Affective heuristics list “dread” and “unknown” as components that influence risk
perception and the availability heuristic is incorporated in terms of ease of recall. The
difference in Johnson’s categories is that the focus is not on confined to negative
experiences only; in fact, an individual’s positive experience with an event often results in
a lower perception of risk in future similar situations.
Johnson’s categories could also be reduced to “dread” and “familiarity”.
Likelihood of occurrence and the perception of a hazardous outcome are both an
individual’s assessment that is determined by the dread factor. Social networks, religious
beliefs, and ideologies (culture) are part of an individual’s knowledge base that is part of
familiarity. This, too, means that Johnson’s original four categories can be condensed into
two categories: dread and familiarity.
2.3 Risk and Tourism
Risk has always been part of the tourism experience, from the bandits on the roads to the
more recent threats of terrorism, SARS, and avian flu yet people still travel. Risk
perception takes as many forms as there are people; some see risk behind every corner,
while others willingly engage in “risky” behaviour (rock climbing, sky diving, SCUBA).
Tourism has specific characteristics that make engaging in it inherently risky (Huan, et al,

26
2004; Mansfeld, 1992): the intangible nature of the product, the uncertainty involved with
destination information, and individual perceptions of risk (Roehl & Fesenmaier, 1992).
The potential for risk can be the motivation for travel (Lepp & Gibson, 2008;
Reisinger & Mavondo, 2005; Roehl & Fesenmaier, 1992; Sonmez & Graefe, 1998a).
Various typologies have been developed that focus on tourist motivation. These typologies
share some basic concepts such as stimulation, sensation seeking, and novelty (Agrussa, et
al. 2008; Ariffin, 2008; Galloway, et al., 2008; Lepp & Gibson, 2008).
Stimulation assumes that each individual has an optimal, or preferred, level of
stimulation, and will strive to maintain this level (Ariffin, 2008). Tourism, and especially
meeting tourism, can provide a venue in which to do this.
Zuckerman’s psychological theory of sensation seeking is defined as a “need for
varied, novel and complex sensations and experiences and the willingness to take physical
and social risks for the sake of such experience” (Zuckerman, 1979, as quoted in Lepp &
Gibson, 2008:741). Tourism provides an outlet for individuals to achieve their desired
level of sensation seeking through its diversity of options for travel. These include
everything from travel that is completely organized by a third party (travel agent) to
spontaneous trips.
Novelty is the final concept that occurs frequently in tourism literature as an
explanation for differing risk behaviour. This is the desire to seek out new and different
experiences through travel (Ariffin, 2008; Lee & Crompton, 1992). It can be motivated by
a variety of factors such as boredom alleviation, a need for escape, thrill, adventure,
surprise, or a desire for a change of routine. This demonstrates that risk can be both a
motivation and a deterrent for tourism activities to be undertaken.

27
2.4 Risk and the Event Industry
Risk perception in the event industry has not been specifically researched. Events, like
tourism, contain elements of risk. Some of the many factors that come into play include
crowd size, size and nature of event site, time of day, nature of event, consumables, age of
crowd, weather conditions, and location of event (Tarlow, 2002a).
Although events are part of the tourism industry, they differ in the level of
uncertainty contained within the experience. An individual planning a personal trip is
responsible for all aspects of her/his experience, from the initial decision to travel to all the
logistics, including the schedule. Events, on the other hand, are usually planned by others
and the individual input is limited. This reduces the level of uncertainty, thereby lowering
the perception of risk for the individual. Quite often an individual is responsible only for
making the initial decision to attend the event. Individuals have an idea of what to expect
when attending an event, be it a wedding, a conference, or a sporting event. Many times
transportation and accommodation suggestions are also included in the invitation, further
reducing the uncertainty surrounding attendance.
In addition to the reduction in uncertainty, events are familiar. Each culture
contains events that become part of the lives of its members, such as weddings and
graduations. Even if an individual has not attended a specific event in the past, there are
elements that are common to each type of event. For instance, most weddings have a
ceremony, then a meal function, and speeches. Sporting events are located at a specific
venue, and have specific start and end times. Conferences contain a detailed schedule,
often including social activities in the evenings.

28
From the perspective of the individual attending the event, there is an expectation
of attention to detail. For the event professional, numerous checklists exist that assist in
determining the potential risks that could affect the success of the project (McLaurin &
Wykes, 2003). Many of the educational programs offered for event planners now contain
courses on risk (GWU Tourism, 2007; Ryerson, 2007). This is both an ethical obligation
and a legal concern, protecting the attendee, the client, and the event professional.
Although there is limited research on risk perception and the event industry; risk
itself has been a topic of several research studies and books, particularly on risk
management strategies. Risk assessment is also a common theme; however, it begins with
the assumption that risks have already been identified (EPMS, 2009; ICCA, 2005;
Rutherford Silvers, 2008; Tarlow, 2002a). In order to assess risks event planners are
encouraged to consider the likelihood/probability of occurrence and the potential
consequences. These concepts are also included in the reference to a risk definition in
addition to words such as control, danger, potential for harm, and threat (EPMS, 2009;
ICCA, 2005; Toohey & Taylor, 2008)
Tarlow’s book, Event Risk Management and Safety (2002a), was one of the first
attempts to outline risk management strategies and plans for event planners. As can be
deduced from the title, this book is concerned with risk management, not risk perception.
However, it does contain a description of risk:
We may state that ‘risk’ is a future event that we treat as if it had already happened. Thus, the event manager cannot actually observe risk. The best that he or she can do is to assume that a particular situation can result in the potential for harm. Thus, even in the most empirical of event cases, the event risk manager must rely on his or her own professional intuition from past events. (Tarlow, 2002a: 35).

29
Although Tarlow does not give a specific definition of risk, he does state that risk has the
“potential for harm”, which is mentioned in the general risk perception literature as a
characteristic.
Another important aspect of Tarlow’s book is his description of risk assessment.
Here he outlines a probability matrix and the importance of collecting data from previous
events. He also stresses that this empirical data are not sufficient to determine risk, but
that the event professional must make decisions based on “past experience and personal
intuition” (2002a: 37).
A book by Rutherford Silvers (2008) titled Risk Management for Meetings and
Events is the most recent attempt at outlining risk management tools and strategies. This
book is a large step forward in educating both practitioners and academics about risk and
the event industry. There is a focus on physical (e.g., terrorism) and non-physical risks
(e.g., financial), as well as references from numerous countries illustrating the diversity of
risks and globalization of the event industry. The recognition of the diversity of risk types
is key to developing risk assessment and risk management tools in that there is not one
solution.
Rutherford Silvers offers an explanation and definition of risk:
Risk is the unknown, and the positive or negative outcomes that may be associated with the unknown. It is possibility – the possibility that something good or something bad might happen, the exposure to the possibility of loss, damage, or injury arising from an uncertainty. Risk is ‘any’ condition or occurrence that ‘might’ affect the outcome of an event or event activity and might expose an event organization to loss measured in terms of probability and consequences. Not all risk is bad. An event itself is a speculative risk; its production incurs liabilities yet has the potential for economic, political, and/or social rewards. One needs to look at the worst that can happen and the best that can happen in order to be prepared for anything in between. Speculative risk: The possibility of loss and the possibility of gain.

30
Absolute risk: The possibility of loss and NO possibility of gain. (4) Risk: An uncertain event or condition that, if it occurs, has a positive or negative effect on an event’s objectives. (22).
Although there is the suggestion risk can be positive, she gives no examples. Instead, her
focus is on the negative aspects of risk (loss, damage, injury), a view consistent with
general risk literature. Uncertainty, unknown, potential, possibility, loss, probability,
consequences – these are words found within the larger risk literature, indicating the
opportunity to integrate and apply this research to the event industry.
Rutherford Silvers’ definition and explanation go a long way to applying the
concepts of risk to the event industry; however, it is grounded in academic research and not
the experiences of event professionals. The assertion that risks can be positive or negative
is supported by the literature; however, without understanding if event planners view risks
in this manner, it is difficult to develop an event industry specific risk definition. Further,
risk management tools and strategies that are based on the assumption that event planners
view risk as positive and negative will not be as effective if this view is not empirically
based.
2.5 Conclusions
It is apparent that there has been a great deal of research activity in the fields of risk and
risk perception, as well as risk and tourism that can be applied to the event industry. To
this point, the event industry has focussed on how to manage risk, and superficially how to
assess it. Tarlow (2002a) stresses the importance of relying on empirical data and past
experiences and professional intuition; however, novice event planners do not have this

31
background. This exploratory research will provide a foundation of event planner
experiences from which to base risk assessment, as well as empirically test the concepts
forwarded by event industry scholars (Rutherford Silvers, 2008; Tarlow, 2002a)
Within risk assessment, probability is mentioned frequently as is likelihood of
occurrence and impact. All these concepts are based in the risk perception literature, and
particularly in Johnson’s (1993) categories. This makes these categories of factors
influencing risk perception crucial in ascertaining risk perceptions. It is proposed that by
condensing these categories into dread and familiarity, which contain all the concepts of
risk perception listed by other researchers, a model can be developed to illustrate the
process by which risk is conceptualized by event planners. Experience and/or education,
key components of risk assessment (Tarlow, 2002a), impact dread and familiarity
characteristics by providing the individual event planner with knowledge and exposure to a
risk element; further by gaining this experience and/or education, event planners can gain a
sense of control over the situation and a real-world basis for assessing the potential
outcome. Women are the dominant gender in the event industry. As mentioned in the risk
literature, women tend to judge risks at a higher level and differently than men (Finucane,
et al., 2000; Flynn, et al., 1994; Gustafson, 1998). Therefore it is important to recognize
that this may affect the type and level of perception of the various risks associated with the
event industry.
The individual characteristics of experience, education, and gender are further
influenced by culture (Boholm, 1998; Taylor-Gooby and Zinn, 2006; Thompson, et al.,
1990). Each culture can have a different view of the world and risk (Althaus, 2005;
Boholm, 1998; Gardner, 2008). For the purpose of this study, country of residence will

32
represent cultural influence. This is due to the fact that media, history, and institutions of a
country are an integral part of its culture (Althaus, 2005; Thompson, et al., 1990).
The following model (Figure 7) is proposed as a means of visualizing risk perception
in the context of the existing literature. This research will focus on the stages up to, and
including, risk perception.
Figure 7. Event Industry Risk Perception Model

33
CHAPTER THREE
Methodology and Risk Definition
3.1 Introduction
As can be seen from the literature review, event industry scholars have focused on the
assessment and management of risk. The proposed strategies are based on concepts from
overall risk studies, but neglect to address risk perception and the individuality of the event
planners. Specifically for the event industry, the concepts of “dread” and “familiarity” are
particularly relevant. Dread encompasses the ideas of control and consequences, while
familiarity deals with experience, education, and social networks/culture. It is believed
that education, experience, gender, and country of residence can influence these concepts
and, by extension, the perception of risk of various event elements.
3.2 Research Questions
The purpose of this research was to explore the general question about how risk perception
is influenced by dread and familiarity, which in turn are influenced by education,
experience, gender, and country of residence. Differences in the perception of risk vary
based on education, experience, and gender because of the dual concepts of familiarity and
dread (Johnson, 1993; Slovic, et al., 1982). Country of residence influences the perception
of risk based on the concepts of familiarity and dread (Johnson, 1993; Slovic, et al., 1982),
as well as culture (Boholm, 1998; Taylor-Gooby and Zinn, 2006; Thompson, et al., 1990).
Based on a review of the influences on the perceptions of risk within and, outside, the
context of tourism and events, and the results from the in-depth interviews, the following
questions were proposed:
34
Question 1 Is there a relationship between event management education and risk perception?
Question 2 Is there a relationship between years of experience and risk perception?
Question 3 Does gender influence risk perception?
Question 4 Does the country of residence affect risk perception?
3.3 Approach and Analysis
This research was conducted using a mixed-methods, two-stage approach (Creswell, 2003;
Veal, 2006). During the first stage, three rounds of in-depth, semi-structured interviews
were conducted with the aim of developing a definition of risk specific to the event
industry. Analysis consisted of verbatim transcription, memo-writing, and member-
checking to validate the findings (Creswell, 2003).
The second stage of the research used an on-line survey. As the focus of the study
was exploratory, cross-tabulations, Chi-square analysis, factor analysis and regression
analysis were employed to examine the potential relationships between education,
experience, gender, and country of residence and the 11 sources of risk (Babbie, et al.,
2007). The risk-source categories were created based on the outcome of the in-depth
interviews in which participants suggested examples of sources of risk that, in their
opinion, were most common to events in general.
3.4 Considerations in Developing the Sampling Frame
Permission was received from MPI to survey their members. MPI maintains a list of all
members (including the researcher) that is available upon request. Thus, access to the
membership list did not violate rights to privacy.

35
Respondents could conceivably have felt uncomfortable answering questions about
their perception of risk because event industry publications place substantial emphasis on
developing risk management plans (Sturken, 2005) but not all event planners have done
this. The confidentiality of the survey, in addition to the fact that it is being conducted
electronically, may have alleviated these concerns.
There was a possibility of a low response rate. Nardi (2006) suggested that response
rates for electronic surveys can be higher than for mail surveys. In addition, event planners
may not be comfortable discussing their perceptions of risk, particularly if it is contrary to
the event industry’s view. Further, work in the event industry requires long hours and
frequent travel, meaning that planners do not feel that they have the time to participate in
the research. These limitations were addressed by producing a survey instrument that was
short, limited to 18 questions. Finally, the researcher’s reputation as an event manager was
beneficial in dealing with understanding the demands of the industry and adding credibility
to the research.
There was also a possibility that contact would be made with non-event planners
because the MPI membership includes suppliers. The use of the following qualifying
question eliminated this limitation.
Event planners are people who are responsible for the research, design, planning, coordination, evaluation, and execution of events. Based on this definition, are you an event planner?
The final consideration was the high proportion of American membership. It was
necessary to institute a target of 100 completed surveys from each country in order to
avoid skewing the data (Creswell, 2003).

36
3.5 First Stage Methodology
3.5.1 Interviews
Interviews have been used extensively in the tourism field as well as in event industry
research ((Lee & Back, 2005; Riley, 1996). Dann, et al. (1988) conducted a meta-analysis
of Annals of Tourism Research from 1978-1986 that found that 40% of articles used
subjective research methods, primarily analysis of personal interviews. The focus of
interviews has generally been on the meanings of touristic experiences for individuals or
on how tourism decisions are made (Riley, 1996; Harrill and Potts, 2002). There are three
types of interviews available (Table 4), each with advantages and disadvantages. For the
purposes of this research, semi-structured was chosen as this type of interview allowed the
researcher to probe new topics and ideas introduced by respondents, while still providing a
framework of key questions.
Table 4. Advantages and Disadvantages of Interviewing Type of Interview Advantages Disadvantages Structured Interviewees answer same
questions, increasing the comparability of the responses Interviewer bias reduced Data easily analysed using statistical techniques
Very little flexibility and the standardised wording may inhibit responses Pre-determined questions may not be relevant
Semi-structured Combines the flexibility of the unstructured interview with comparability of key questions
Bias may increase as interviewer selects questions to probe and may inhibit comparability of responses
Unstructured Interviewer responds in a flexible way to the interviewee Interviewer’s role is minimal allowing interviewee to express ideas in his/her own words
Comparability is much reduced and data analysis is more difficult Data quality depends on listening and communicating skills of the interviewer
Source: Finn, et al., 2000: 75

37
3.5.2 Operationalizing a Definition of Risk In order to elicit responses from event planners regarding their perception of risks, it was
necessary to develop an operational definition of risk. As mentioned, there is no consensus
on the definition of risk (Clarke and Short Jr, 1993; Fischhoff, et al, 2004; Tierney, 1999).
Although definitions of risk have been proposed for the event industry (Rutherford Silvers,
2008; Tarlow, 2002a), these are based on concepts lacking any empirical data from the
event industry or event planners. For the purpose of this research, it was determined that
in order to develop an operational definition of risk in the context of the event industry,
interviews with event planners would be necessary. Thus, in-depth interviews were
conducted with eight event planners from Canada and the United States (USA) and
grounded theory procedures were applied to code and interpret the transcripts of the
interviews (Glaser, 1978; Glaser & Strauss, 1967).
Participants were chosen using snowball sampling (Creswell, 2003), where the
researcher initially contacted colleagues currently employed in the event industry, which
then provided additional contacts. This method was chosen as the aim of the research was
to develop a working definition of risk that would be used in the subsequent on-line survey
rather than to develop a statistically representative set of responses. The participants were
informed that they would be part of an expert panel where diversity of experience and
education as well as differences in country of residence (USA and Canada) were the main
criteria for inclusion. This was done to reflect the diversity of the event industry and to
develop a definition that would be understandable and applicable for novice and
experienced planners. Interviews were conducted using both telephone and Internet chat,
with three phases. The first phase elicited responses from the panel to develop an initial

38
definition of risk as it applies to the event industry. The second and third phases were used
to refine the definition to achieve consensus from the participants.
3.5.3 Respondent Profiles
Respondents 2, 3, 4, 5, and 7 (the numbers assigned reflect the order in which respondents
were initially interviewed) were personal acquaintances of the researcher; with respondents
1, 6, and 8 referred to the researcher by the first five respondents. Respondents 1, 4, 6, and
8 are Canadian event planners; Respondents 2, 3, 5, and 7 are USA event planners. The
Canadian event planners had no formal education (university or college) in event
management, while the USA event planners all hold Masters degrees in event
management. Respondents 1, 2, 3, and 7 are owners of event management companies.
Respondents 1, 2, 3, and 5 are full-time event planners. Respondents 1, 2, 3, 5, and 7
currently possess the event industry designation of Certified Meeting Planner (CMP),
obtained through Meeting Professionals International (MPI). The reason for the difference
in formal education between Canadian and USA planners may be due to the fact that
certificate courses offered in Canadian colleges are relatively new, where there are several
event management programs offered in the USA (CHRIE, 2006).
3.5.4 First Interview
The first stage was an unstructured personal interview in which respondents were provided
the question, “How do you define risk as it applies to the event industry?” prior to the
interview. The question was sent by e-mail with a request to set up a time for either a

39
telephone or on-line interview. This was done in order to allow the respondents time to
formulate their responses.
Interviews ranged from 30 to 45 minutes in length. Supplementary questions were
asked about the need for a definition, the effect of experience versus education on a
definition of risk, and the elements that were considered important to a definition
(Appendix B). The researcher gave an explanation of the purpose of the interview at
different times depending on the panel member’s familiarity with the research. The
researcher summarized the risk definition elements at the end of each interview and asked
for confirmation/corrections/additions.
The interview with Respondent 1 was not recorded because of technical difficulties
with the recorder. Instead, notes were made by the researcher and sent to the respondent
for confirmation. The respondent made changes and sent them back to the researcher.
Interviews with Respondents 4 and 5 encountered technical difficulties resulting in re-
interviewing. Interviews with respondents 7 and 8 were conducted via an Internet chat
function, which resulted in a verbatim transcription of the interview. Respondents 2, 3, 4,
5, and 6 were conducted using a digital recorder and transcribed, verbatim, by the
researcher.
Initial analysis consisted of a content analysis using a software program called
CATPAC. This is “a neural network program which has been designed to read and
understand text of any kind” (Woelfel & Stoyanoff, 1998: c). This analysis consisted of
designating the number of unique words required for results. Analysis was run on five
occasions with each of the eight transcripts, with the first and second runs including 100
unique words. This was done in order to determine words that should be added to the

40
exclusion list, such as proper names, pronouns, agreement words, filler words (“though”,
“like”, etc). In addition, the words “event”, “events”, “planning”, “planner”, and
“industry” were also excluded as they occurred frequently but did not add to the definition
(Appendix C). The third through fifth analyses included 30 unique words that captured
those most descriptive in relation to the words “risk”, “risks”, “definition”, and “defining”
(the key words). The sixth analysis produced a frequency list of words and a dendogram
that illustrated the position of these frequent words in relation to the key words (Appendix
D). This information did not prove meaningful in developing a definition on its own,
which led the researcher to use a coding strategy based on a grounded theory approach.
Analysis of the text using a grounded theory approach (Glaser & Strauss, 1967)
consisted of using memo notes to record words and phrases that occurred when
respondents were asked to define risk in relation to the event industry. Other memo notes
recorded types of risks that could be used as examples, as well as the difference in defining
risk based on education or experience. Further, respondents stated that a risk definition
should be “broad”, “general”, and “applicable/practical”, as well as include “examples”,
“categories”, and “headings”. They also stated that there should be one definition that
applied to the event industry as a whole, instead of the various event types (meetings,
conventions, special events, etc).
Respondents agreed that a definition of risk that applied to the event industry was
needed for a variety of reasons. They believed that a definition would allow people to
know what a risk is, would broaden perspectives, get people thinking about risks, raise
consciousness and awareness, provide a foundation and frame for risk assessment and
reduce inconsistencies in terminology.

41
Table 5 illustrates the words/phrases that occurred frequently throughout the eight
interviews and were used as the basis for a working definition of risk as it applies to the
event industry.
Table 5. Memo Note Analysis Negative influence potentially
Threatens Injury or Death
Interferes Affect outcome Health & wellness Impedes success Danger Human element Action Loss Hazard Safeguard Liability Anything could go wrong Damage Exposure Unpleasant Uncertain Unforeseen Disorder Harm Legal Situations Source: In-depth Interview
Based on these words/phrases, the following definition was developed:
Risk is anything that could potentially impede, threaten, influence, or interfere with the successful outcome of an event. Risk is the potential for loss and could be financial, physical, psychological, legal, or ethical. Some examples of risks common to the event industry are: theft, equipment failure, fire, terrorism, intoxication, contracts, and transportation strikes.
This definition was sent by e-mail to all members of the expert panel and a second
interview was scheduled.
3.5.5 Second Interview
The second set of interviews involved semi-structured, open-ended questions (Appendix
B). The purpose of the second interviews was to refine the definition. The discussion
centred on tone, understanding, layout, and format of the definition. Interviews ranged
from 10 to 15 minutes in length and were conducted by telephone and Internet chat.
Interviews with Respondents 1, 2, 3, 5, and 6 were recorded telephone interviews; those

42
with Respondents 4, 7, and 8 were conducted on-line with MSN Chat and AIM Chat.
Verbatim transcription followed the interviews, and memo notes were used to record
additions, deletions, or revisions suggested by each respondent.
Respondent 1 was asked if this definition would be easy to understand for novice
planners. This respondent replied that with 30 years of experience in the industry, this was
not a determination that he/she felt comfortable making, instead he/she suggested that the
researcher consult the event management students from her summer 2008 course. The
working definition was sent to 11 undergraduate students enrolled in an event management
course. They were sent an e-mail, asking if they would take the time to provide feedback
on how easy the definition was to understand and if they could think of anything that
would make it better. Six responses were received, all of which confirmed that the
definition was easy to understand. There is the potential for bias in the student responses,
as they were current students of the researcher and may have attempted to give the
“correct” answer. The students were not personally interviewed, nor was there any follow-
up to their replies.
Memo note analysis was conducted for this stage, wherein words and phrases were
recorded for the following categories: overall impression; novice and experienced planner;
reflection of view; human element; layout; examples; and, additions. These categories
were based on the questions asked during the interview. Respondents felt that this
definition was broad, easy to understand, encompassing, very clear, and applied to all types
of events. In addition, it was felt that the examples made the definition “more concrete”.
Respondents felt that this definition was a good reflection of the view of risk as it applies
to the event industry, in that it was broad and illustrated the variety of potential risks. The

43
list of examples was the area respondents commented on most frequently. There was
significant discussion of other types of examples that could be included (see Table 6).
However, there was agreement that the list needed to stay short, as it was impossible to
produce an exclusive list of examples.
Table 6. Risk Examples Attrition Cancellation Currency exchange Slips and falls Licensing Entertainment no shows Speaker no shows Labour strikes Fuel prices Poor customer service Food poisoning Food allergies Dietary restrictions Religious food restrictions Mishandling of food Food shortage Sponsorship loss Weather Source: In-depth Interview The working definition of risk was revised to read:
Risk is anything or anyone that could impede, threaten, influence, or interfere with the successful outcome of an event. Risk is the potential for financial, physical, psychological, legal, or ethical loss. Some examples of risk that are common to the event industry are: theft, equipment failure, fire, terrorism, intoxication, food poisoning, contracts, trips and falls, transportation strikes, or labour disputes.
This definition was again sent to the panel by e-mail and a third and final interview
was scheduled.
3.5.6 Third Interview
The third stage of interviews involved semi-structured, open-ended questions based on the
second version of the definition (Appendix B). The purpose of this stage was to finalize
the definition. Respondents were asked to comment on the revisions and given the
opportunity to make any further suggestions or comments. Interviews ranged from 10 to
15 minutes in length and were conducted by telephone and Internet chat. Interviews with

44
respondents 1, 2, 3, 5, and 6 were recorded telephone conversations; respondents 4, 7, and
8 were interviewed using MSN Chat and AIM Chat. At the conclusion of the third
interview, the researcher explained to the panel member that the definition would now be
used in an on-line survey on risk perceptions.
The third interview began with a general question asking for the panel member’s
overall impression of the definition. Every member of the panel believed that this
definition was clear, concise, and easy to understand. Each indicated that it reflected a
broad overview of risk as it applies to the event industry. In order to ascertain their
support of the definition, respondents were asked if they would be happy having their
name associated with the definition; every member of the panel indicated that she/he
would.
The next questions focused on the revision of each sentence. Every panel member
approved of the change to the first sentence, stating that it made it better, more
encompassing, and more succinct. The second sentence was more problematic.
Specifically, the phrase “ethical loss” was a source of concern; some panel members felt
that this rephrasing changed the meaning and focus of the definition. Other members felt
that this restructuring made the sentence flow better. Four members of the panel preferred
the first version of the sentence and four members preferred the second version. During
the interviews the researcher was asked to give examples of ethical loss to six of the panel
members. This indicated to the researcher that individuals who had not been involved with
the development of the definition may have problems understanding what was meant by
the second version. Based on suggestions made by panel members during the interviews
the following definition of risk, as it applies to the event industry, was finalized:

45
Risk is anything or anyone that could impede, threaten, influence, or interfere with the successful outcome of an event. Risk is the potential for loss; financially, physically, psychologically, legally, or ethically. Some examples of risk that are common to the event industry are: theft, equipment failure, fire, terrorism, intoxication, food poisoning, contracts, trips and falls, transportation strikes, or labour disputes.
This definition was sent to the expert panel members in a thank you e-mail that also
contained a gift certificate from Amazon (Appendix A).
The final definition was used in the next stage of data collection – an on-line survey.
The first two sentences of the definition were used in conjunction with the type of event
planned most often to give respondents a framework for ranking their perceptions of 11
potential sources of risk. The example portion of the definition was used to create the 11
categories of risk used in question 10 of the Likert-type scale (Appendix F).

46
CHAPTER FOUR
Risk Perception
4.1 Second Stage Methodology
4.1.1 Surveying
Surveying is one of the most popular forms of empirical data collection undertaken in
social science research (Dillman, 2002; Dillman, 2007; Fowler, 2002). Put simply,
surveying is a way to collect information about a subject by asking people questions,
collecting the data, and producing statistics that summarize the collected data (Fink, 2003;
Fowler, 2002). Even though it sounds simple, surveying involves numerous considerations
and procedures in order to produce results that can be said to be representative of a
population (Fowler, 2002). The most common types of survey methods are described in
Table 7.
Table 7. Questionnaire Types and Description Type Description Household Survey People are selected on the basis of where they live and are
interviewed in their home Street Survey (also called Intercept Surveys)
People are selected by stopping them in the street, in shopping malls, etc
Telephone Survey Interviews are conducted by telephone Mail Survey Questionnaires are sent and returned by mail E-Surveys Surveys making use of the Internet and e-mail User/on-site/visitor Survey
Users of a leisure or tourism facility, site or destination are surveyed on-site
Captive Group Survey
Members of groups, such as classes of school children, are surveyed
Source: Veal, 2006: 235-236
Table 8 lists the advantages and disadvantages of the various survey methods.

47
Table 8. Advantages and Disadvantages of Survey Methods
Data Collection Method
Advantages Disadvantages
Personal Interviewing 1. Some sample designs implemented best by personal interview (area probability samples) 2. Most effective way enlisting cooperation 3. Interviewer can answer respondent questions and get additional answers 4. Multimethod data collection feasible (observations, visual cues) 5. Rapport and confidence building possible
1. More costly than other alternatives 2. Need trained staff of interviewers geographically near sample 3. Longer data collection period than telephone procedures 4. Some samples more accessible by other modes
Telephone Interviewing
1. Lower cost than personal interviewing 2. Random-digit-dialing sampling of general populations 3. Better access to some populations 4. Shorter data collection periods 5. Interviewer can answer respondent questions and get additional answers 6. Smaller staff needed; not necessary be near sample 7. Better response rate than by mail
1. Sampling limitations 2. Nonresponse association with RDD higher than personal interviews 3. Questionnaire or measurement constraints 4. Less appropriate for personal or sensitive questions
Self-Administered 1. Ease of presenting questions requiring visual aids 2. Asking questions with long or complex response categories 3. Asking similar questions 4. Respondent does not have to share answers with an interviewer
1. Careful questionnaire design required 2. Open questions not usually useful 3. Good reading and writing skills by respondents needed 4. No quality control from interviewer 5. No control over who answers questions
Mail Surveys 1. Relatively low cost 2. Minimal staff and facilities 3. Access to wider dispersion samples 4. Respondents have time to give thoughtful answers
1. Difficult enlist cooperation 2. Need good mailing addresses
Dropping off Questionnaire
1. Interviewer can explain study, answer questions and designate household respondent 2. Response rates similar to personal interview 3. Respondents have time to give thoughtful answers 4. Does not require trained interviewing staff
1. Costs as much as personal interviews 2. Field staff required
Internet Surveys 1. Low unit cost of data collection 2. Potential high speed of returns 3. All advantages of self-administered instrument 4. All advantages of computer-assisted instrument 5. Respondents have time to give thoughtful answers
1. Limited to samples of Internet users 2. Need for good addresses 3. Difficult enlist cooperation
Source: Fowler Jr. 2002: 71-74

48
For researching issues facing event industry planners, based on the information in
Tables 7 and 8, e-mail and Internet surveys provide the most efficient and effective method
of reaching event industry planners. Most event planners rely heavily on computers and
the Internet in the course of their daily responsibilities (research, marketing, advertising,
on-line registration, and communication), making them familiar with the technical
requirements of Internet and e-mail surveys. E-mail addresses could be gained through the
industry associations who maintain membership information. All these reasons made a
web-based survey the best method in terms of efficiency, time, and resources.
4.2 Risk Perception
Although there is a great deal of professional literature outlining how to develop terrorism
plans and to implement risk management strategies (Diamond, 2001; Ito, 2001; Nelson,
2004; Spindel & Tesdahl, 2005; Sturken, 2005), there is limited information on the types
of risks that are most common in the event industry (Rutherford Silvers, 2008; Tarlow,
2002a). In fact, there has not been any empirical research that examines this area of the
event industry. As noted in the literature review, in order to develop risk assessment and
management plans that reflect the event industry needs and the needs of event planners, it
is necessary to explore event planner perceptions of potential sources of risk in events.
These sources were based on the interviews described in Chapter 3. In order to measure
these risk perceptions, an on-line survey with current MPI members from Canada, the
USA, and the member countries of the European Union (EU) was conducted.

49
4.2.1 Sampling Frame
The population used for this research was individual event planners with current
membership in Meeting Professionals International (MPI). MPI maintains an electronic
membership list that is used for regular member communications. This membership list is
available to members for their use, as well as being available for purchase by non-member
researchers. The list facilitated the drawing of a random, representative sample.
MPI was chosen due to its international nature and large membership base. MPI has
chapters in Canada, the USA, and the EU. The e-mail list released to the researcher was
current as of September 2008, and numbered 10,852. This list contained all current
members of MPI, including suppliers, vendors, and students. The researcher sorted the list
alphabetically by country, and removed any members who did not reside in Canada, the
USA, or the EU. The researcher removed any member listed as a supplier, vendor, or
student. This resulted in a list of 688 Canadian event planner members, 810 EU event
planner members, and 8,898 USA event planner members. A census was conducted with
members from Canada and the EU and a random sample of 600 USA members was drawn.
In order to draw the random sample of 600 USA members, the Excel e-mail membership
list was first sorted alphabetically by last name, and then a blank column was created to the
left of the names. An Excel function (=RAND() * 9000) was entered on the first line and
copied to the remainder of the list. This formula randomly assigns numbers to each row of
the spreadsheet. Once this was complete, the researcher shuffled the list by selecting the
randomly assigned number column a total of 14 times (the age of the researcher’s youngest
child). The first 600 names were then used in the survey.

50
Responses rates of 70% have been suggested as achievable for on-line surveys
(Dillman, 2007) through use of the Tailored Design Method; however, Smith (personal
communication, 2008) has noted that the tourism industry average for on-line surveys
ranges from 15-20%. Therefore, a target of 100 completed surveys per country, for a total
of 300 surveys, would satisfy this requirement.
The research instrument was an on-line survey (Appendix F). Closed-ended
questions asked for the type of event planned, event venue, sources of information used,
type of event management education, and the respondent’s age. In addition, an “other”
category was offered for type of event planned, event venue, and sources of information to
provide respondents with the opportunity to offer responses that were not included in the
proposed response categories. Questions relating to country of residence, number of
events planned during 2007, length of time in events industry, and number of international
trips taken were open-ended in order to allow respondents to provide precise answers.
Likert-type scales were used to assess the individual planner's perception of a variety of
risks common to the industry, as well as use of accepted risk management strategies. One
open-ended question gave respondents the opportunity to describe their experiences
dealing with any or all of the listed risks.
4.2.2 Pilot Survey
A test of a draft questionnaire is standard procedure for ensuring the clarity of
questionnaires, as well as estimating response rates and completion times (Dillman, 2007;
Veal, 2006). In order to ensure the survey would be easily understood, a pilot survey was
undertaken. Twenty-eight respondents were contacted: the four members of the

51
researcher’s doctoral committee, seven graduate students from the researcher’s department,
thirteen event planners who are personal acquaintances of the researcher, and four personal
friends of the researcher. The committee members and graduate students were chosen for
their expertise in academic research surveys. The event planners were chosen as
representative of the survey population. The personal friends were chosen to provide
general comments on the survey.
Based on pilot survey comments, there were grammatical changes made to ensure
consistency. Substantive changes were made to questions 5, 6, 7, 8, 9, 10, and 15 (Table
8). Questions 5 and 6 were changed from a choice of a range (1-5, 6-10, etc) to an open-
ended question. This was done to allow respondents to enter an actual number to permit
the calculation of means. Question 7 was split into two questions to make answering
easier. The revised first question determined whether the event planner focused on
domestic events or international events. The subsequent question determined the venue in
which the event planner held events most often. Categories were chosen based on those
used in research studies conducted by MPI (Meeting Professionals International and
American Express, 2007). Categories were added to questions 9 and 10 in order to be
more inclusive of the information sources used by event planners. The scale was changed
in question 11 in order to make choices easier for respondents. Question 15 was changed
to reflect the variation in education that was possible.
Table 9. Survey Revisions from Pilot Survey Original Revision Q7. Domestically (in the country where you work)
- Urban within 30 minutes of international airport
- Rural more than 30 minutes from
Q7. Between January – December 2007, where did most of your events occur? Please choose only one. Domestically – in the country of your primary

52
international airport Internationally (in any country where you do not work)
- Urban within 30 minutes of international airport
- Rural more than 30 minutes from international airport
office Internationally – outside the country of your primary office Q8. Between January – December 2007, what type of venue did you use for the event you plan most often? City Hotels Resort Hotels Airport & Suburban Hotels Conference Centres & Universities Convention Centres Restaurants, Country Clubs & Unique Venues Other
Q8 & 9. None Industry publications (e.g., The Meeting Professional, Smart Meetings) Academic publications (e.g., Convention and Event Tourism, Journal of Event Management) Newspapers Magazines Internet Sites
Q9 & 10. None Previous Experience Word-of-Mouth Industry publications (e.g., One + One, Smart Meetings) Academic publications (e.g., Convention and Event Tourism, Journal of Event Management) Newspapers Magazines Internet sites Other
Q10. Rated on scale of 10 with labels of:
- No chance of occurrence - Poor chance of occurrence - Moderate chance of occurrence - High chance of occurrence - Virtual certainty of occurrence
Q11. Rated on scale of 7 with labels of:
- Low chance of occurrence - Moderate chance of occurrence - High chance of occurrence
Q14. What level of education do you have? Choose all that apply.
- None - Diploma - College/University certification - Undergraduate degree - Graduate degree (Masters, Doctorate)
Q15. Please indicate the highest level of education that you have achieved.
- Some High School - Graduated from High School - Diploma - College/University certification - Undergraduate degree - Graduate degree (Masters, Doctorate)
Changes were made to the survey as comments were received from respondents. This
allowed those who had not responded to see an updated version of the survey. Responses
were received from 24 participants. When all changes had been made, the survey was sent

53
to the researcher’s committee and five event planners for comment. The final on-line
version of the survey (Appendix F) went live on October 15, 2008 using SurveyMonkey.
4.3 Survey Procedures
An e-mail invitation was sent to prospective respondents on October 15, 2008. A total of
148 e-mails were returned as undeliverable. Corrections were made to these addresses and
the invitation was re-sent on October 16, 2008. A total of 2,062 invitations were sent out;
667 to Canadian event planners, 599 to USA event planners, and 796 to EU event planners.
SurveyMonkey allows potential respondents to “opt-out” of all surveys. This
function resulted in two opt-outs from the EU and two opt-outs from the USA, for a total
2,058 e-mail invitations for the initial invitation. Reminder e-mails were sent until the
targeted 100 completed surveys were received. Forty out-of-office responses, on average,
were received with each mailing. This was expected because the period between
September through December are busy months for event planners. A total of 1,947 e-mail
addresses were valid, with a total of 329 completed surveys received (116 from Canada,
102 from the USA, and 111 from the EU), which resulted in an overall 17% response rate.
Canadian planners were sent the initial invitation on October 15th. A total of 639
e-mail addresses were valid, with 116 completed surveys returned for a response rate of
18%. USA planners were sent the initial invitation on October 15th. A total of 568 e-mail
addresses were valid, with 102 completed surveys returned for a response rate of 18%. EU
planners were also sent the initial invitation on October 15th. A total of 740 e-mail
addresses were valid, with 111 completed surveys returned for a response rate of 15%.

54
CHAPTER FIVE
Results
5.1 Introduction
This chapter presents the results of the on-line survey. A total of 329 respondents from the
three regions (Canada, USA, and EU) completed the questionnaire. The chapter begins
with a brief description of the demographics of the respondents, followed by an overview
of the types of events planned by the respondents as well as other professional
characteristics. The results of the questions described in Chapter 3 are then presented.
5.2 Respondent Demographics
Industry literature suggests that women are the dominant gender among professional
meeting planners (Grimaldi, 2004; Grimaldi, 2005), a generalization supported by this
research. A total of 238 of 301 respondents, or 79%, indicated they were women. A
plurality of planners fell into the 35-44 years of age category (35%), with the 45-54 years
of age category following closely (30%). Seventy-one percent of respondents held post-
secondary level certification and undergraduate degrees; however, only 18% of
respondents had event management education at the same level. Forty-seven percent of
respondents had taken individual event industry courses, with 31% obtaining industry
certification; however, 23% had no event management education of any kind. Table 10
illustrates respondents’ demographic information.

55
Table 10. Respondent Information Characteristic PercentageGender Female Male N=301
79.1 20.9
Age 18-24 25-34 35-44 45-54 55-64 65 or over N=300
1.0
21.3 35.7 30.3 10.0
1.7
Education Some High School Graduate High School Diploma College/University certification Undergraduate degree Graduate degree (Masters, Doctorate) N=300
2.7
11.7 11.0 34.7 36.0 14.7
Event Management Education None Individual industry courses Diploma Industry certification College/University certification Undergraduate degree Graduate degree (Masters, Doctorate) N=297
22.6 46.8
8.1 31.0
8.4 4.7 4.0
Respondents were asked how many years of experience they had. The answers
ranged from none to 40, with a median of 10 years. For the sake of clarity, responses were
grouped by lustra (five-year categories, except for the first group, which covers six years
because of the inclusion of zero years) (Table 11). A plurality of respondents had six to
ten years of experience, with 51% having 10 years of experience or less. Seventy-two
percent have 15 years of experience or less. Only 13% have more than 20 years of
experience.

56
Table 11. Years of Experience Years of Experience
No. of Respondents
Percentage
0 – 5 54 17.56 – 10 105 34.011 – 15 64 20.716 – 20 46 14.921 – 25 25 8.126 – 30 10 3.231 – 35 4 1.336 – 40 1 0.3N=309
Table 12 illustrates that those respondents in the 0-5 and 6-10 years of experience
categories were most likely to obtain event management education of some type. It is
interesting to note that these same categories also contain the highest percentage of
respondents with no event management education.
Table 12. Event Management Education and Years of Experience Years of Experience
No Education
Industry Education
Formal Education
Industry & Formal Education
0-5 30.3 15.2 20.0 10.5 6-10 33.3 30.9 36.0 39.5 11-15 21.2 22.4 28.0 10.5 16-20 7.6 16.4 12.0 23.7 21-25 6.1 10.9 0 5.3 26-40 1.5 4.2 4.0 10.5 N=294
5.3 Respondent Professional Practices
Every respondent reported she or he planned meetings and conferences; further, 91% of
respondents also noted that meetings and conferences were the type of event planned most
often. This was expected because the sampling frame was the MPI membership – MPI
focuses on meetings, conferences, and expositions. A strong majority of planners (83%)
worked on domestic events rather than international events – also an expected finding.

57
City hotels were the preferred venue for events (56%), with resort hotels,
convention centres and unique venues being chosen by less than 15% of planners. The
number of events planned during 2007 ranged from 5 to 1200, with a median of 20 events.
As with experience, planners were asked to give precise numbers for this question.
Categories were created in groupings of 10 (Table 13). A plurality (about one in three)
planned 10 or fewer events in 2007. Fifty-three percent planned 20 or fewer events.
Table 13. Number of Events Planned No. of Events Planned
No. of Respondents
Percentage
0 – 10 100 32.311 – 20 64 20.621 – 30 34 11.031 – 40 23 7.441 – 50 28 9.051 – 60 11 3.561 – 70 3 1.071 – 80 5 1.681 – 90 7 2.391 – 100 10 3.2101 + 25 8.1N=310
Previous experience, Internet sites, and word-of-mouth recommendations were the
most common resources for choosing potential destinations and venues for events (Table
14). Information from convention and visitor bureaux and destination management
organizations were chosen by over 80% of planners. Research journals, magazines, and
newspapers respectively were used by less than 50% of planners; however, industry
publications were used by 40%. Only 3% of planners did not use any resources when
researching potential destinations and 1% when researching potential venues.

58
Table 14. Resources Used Resource Used No. of
Resp. % No. of
Resp. %
Destination Venue None 10 3.0 None 4 1.2Previous Experience 267 81.2 Previous Experience 257 78.1Word of Mouth 197 59.9 Word of Mouth 222 67.5Industry Publications 137 41.6 Industry Publications 140 42.6Research Journals 55 16.7 Research Journals 56 17.0Newspapers 21 6.4 Newspapers 23 7.0Magazines 78 23.7 Magazines 82 24.9DMOs 97 29.5 DMOs 112 34.0CVBs 169 51.4 CVBs 171 52.0Internet 222 67.5 Internet 237 72.0Third Party 14 4.3 Other 28 8.5Other 19 5.8 N=302 N=306
When resources used were cross-tabulated with country of residence, there was
relatively little variation among the three regions. One difference, though was that EU
respondents were more likely than North American respondents to cite DMOs as a source.
However, this difference may reflect terminology more than anything else (Table 15).
Table 15. Resources Used by Country Resources Used No. of
Resp. % Resources No. of
Resp. %
Destination Venue Industry Pub. Canada USA EU
57 45 35
51.8 45.0 35.4
Previous Experience Canada USA EU
94 75 88
85.5 75.8 88.0
Newspapers Canada USA EU
6 3
12
5.5 3.0
12.2
Word of Mouth Canada USA EU
84 66 72
76.4 66.7 72.0
Magazines Canada USA EU
24 23 31
21.8 23.2 31.3
Industry Publications Canada USA EU
58 44 38
52.7 44.4 38.0
DMOs Canada USA EU
28 29 40
25.5 29.3 40.4
Newspapers Canada USA EU
7 4
12
6.4 4.0
12.0

59
CVBs Canada USA EU
66 57 46
60.0 57.6 46.5
DMOs Canada USA EU
31 33 48
28.2 33.3 48.0
Internet Canada USA EU
83 65 74
75.5 65.7 74.7
CVBs Canada USA EU
69 51 51
62.7 51.5 51.0
Internet Canada USA EU
90 67 80
81.8 67.7 80.0
N=302 N=306
Several event management textbooks refer to four types of risk management
strategies (Goldblatt, 2008; Allen, et al., 2002; Fenich, 2005). Planners were asked to rate
their use of these four risk strategies (avoidance, reduction, transference, and retention)
(Rutherford Silvers, 2008) (Table 16). Avoidance is the removal of event elements that are
considered a risk liability or hazard, such as removing pyrotechnics from a program.
Reduction involves the implementation of loss prevention methods and strategies to lessen
the potential impact, likelihood, and/or consequences of a potential risk, such as hiring
security officers to patrol exhibitions for theft. Transference is the reallocation of liability
for, and impact of, a risk to a third party, such as taking out insurance. Retention is the
conscious acceptance of a risk, with no special effort to control it, and acceptance of the
potential liability. None of the strategies were consistently used by more than 27% of
planners; in fact the “occasional use” category garnered the largest percentages in the
categories of avoidance (38%) and retention (38%). When strategies were examined by
country, transference was “always” used most often by Canadian planners (36%); whereas
both USA and EU planners “always” used reduction most often. Canadian planners
demonstrated the highest “always” use in all four strategy categories.

60
Table 16. Risk Strategies Risk Strategy
Never Use (%)
Occasionally Use (%)
Regularly Use (%)
Always Use (%)
Rating Average
Number
Avoidance 71 (24.1) 112 (38.0) 79 (26.8) 33 (11.2) 2.25 295Reduction 29 (9.8) 75 (25.4) 111 (37.6) 80 (27.1) 2.82 295Transference 57 (19.4) 77 (26.2) 82 (27.9) 78 (26.5) 2.62 294Retention 102 (34.9) 111 (38.0) 59 (20.2) 20 (6.8) 1.99 292
5.4 Events Industry Risk Perception
A Likert-type scale was used to ask planners to rate 11 potential risk elements as to their
likelihood of occurrence. This scale was created using the examples from the in-depth
interviews. As this scale was used to measure the risk perception and is central to all seven
hypotheses, its internal consistency was tested using Cronbach’s Alpha (Table 17). An α
of 0.7 indicates acceptable reliability, and 0.8 or higher indicates good reliability (Allison,
1999). As can be seen the scale achieved an α of 0.821 indicating good reliability. In
addition, the individual elements of the scale also displayed good reliability. Thus, the
eleven proposed sources of risk are deemed to represent an internally consistent scale for
assessing perceived probabilities of risk in events.
Table 17. Cronbach’s Alpha
Cronbach's Alpha N of Items
.821 11
Scale Mean if Item Deleted
Scale Variance if Item Deleted
Corrected Item-Total Correlation
Cronbach's Alpha if Item
Deleted
Food and Beverage 17.5000 14.330 0.538 0.802
Transportation 17.0576 14.711 .471 .809
Contracts 17.2122 14.529 .475 .808
Financial 17.0144 15.083 .363 .820
Health 17.5396 14.827 .525 .804
Alcohol 17.5468 14.610 .474 .808
Terrorism 17.7086 15.348 .397 .815

61
Accidents 17.5000 14.410 .578 .799
Weather &/or Nat. Hazards 17.3957 14.688 .490 .807
People 17.4065 14.675 .512 .805
Crime 17.7014 14.571 .575 .800
Planners were asked to rate 11 potential sources of risk in terms of their probability
of occurrence (Table 18). Finances were rated as the most likely source by 31% of the
respondents, followed by transportation at 25%, and contracts at 21%. None of the other
sources of risk were cited as having a high probability of occurring by more than 12% of
respondents. Crime was rated by 60% of respondents as having a low chance of
occurrence – the form of risk most widely seen as having a low probability of occurring.
Terrorism (59% of respondents), alcohol (50%), and food and beverage (46%) were also
seen as not very likely to be sources of risk.
Table 18. Risk Perceptions Risk Element Low Moderate High Food and Beverage 45.5 % (122) 44.8% (120) 9.7% (26) Transportation 16.0% (43) 58.6% (157) 25.4 (68%) Contracts 25.5% (67) 53.2% (140) 21.3% (56) Financial 16.5% (43) 52.1% (136) 31.4% (82) Health 45.1% (120) 50.8% (135) 4.1% (11) Alcohol 49.6% (130) 40.8% (107) 9.5% (25) Terrorism 58.6% (156) 36.8% (98) 4.5% (12) Accidents 42.7% (114) 50.9% (136) 6.4% (17) Weather/Natural Hazards 34.3% (92) 54.1% (145) 11.6% (31) People 33.7% (90) 56.2% (150) 10.1% (27) Crime 60.3% (161) 35.2% (94) 4.5% (12) N=267
The 11 potential sources of risk were rated on a 7-point scale (1 = poor probability
of occurrence, 7 = high probability of occurrence) reflecting the probability of occurrence
(Table 19). The distribution of responses is shown in Figure 8, and indicates a positively
skewed distribution, with a symmetrical curve. The highest means were associated with

62
finances (4.40), transportation (4.30), and contracts (3.92). This indicates a general
perception by respondents of only a moderate chance of their occurrence. Terrorism
(2.57), crime (2.58), and health (2.97) had the lowest rating averages, indicating a
perception of low chance of occurrence. The remaining risk elements (food and beverage,
alcohol, accidents, weather and/or other natural hazards, and people) had averages of 3.00
to 3.42, indicating a perception of low-to-moderate probability of occurrence.
Table 19. Mean Probability Ratings of Risk Sources Risk Element Mean Number Food and Beverage 3.10 304Transportation 4.30 304Contracts 3.92 299Financial 4.40 297Health 2.97 301Alcohol 3.00 297Terrorism 2.57 299Accidents 3.11 303Weather and/or Natural Hazards 3.39 304People 3.42 303Crime 2.58 303(1= low probability; 7 = high probability)
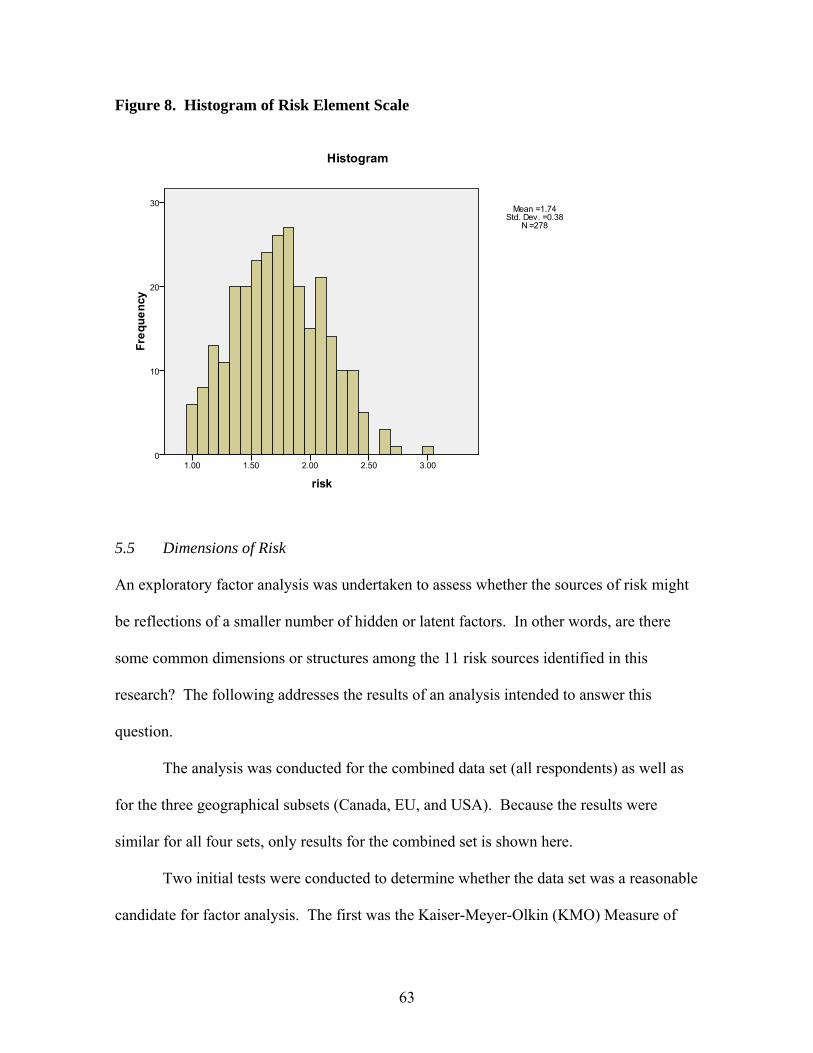
63
Figure 8. Histogram of Risk Element Scale
5.5 Dimensions of Risk
An exploratory factor analysis was undertaken to assess whether the sources of risk might
be reflections of a smaller number of hidden or latent factors. In other words, are there
some common dimensions or structures among the 11 risk sources identified in this
research? The following addresses the results of an analysis intended to answer this
question.
The analysis was conducted for the combined data set (all respondents) as well as
for the three geographical subsets (Canada, EU, and USA). Because the results were
similar for all four sets, only results for the combined set is shown here.
Two initial tests were conducted to determine whether the data set was a reasonable
candidate for factor analysis. The first was the Kaiser-Meyer-Olkin (KMO) Measure of

64
Sampling Adequacy. KMO is based on correlation and partial correlations measures for
each variable, and provides a preliminary indication of whether a set of variables could
potentially provide an interpretable factor analysis. It reflects, in part, the degree of
multicollinearity among individual variables. Individual KMO statistics are calculated
from each variable and then summed for the entire data set. The KMO for a set of
variables being tested will range from 0.0 to .10. A rule-of-thumb for the results of a
KMO test is to use a set of variables in a factor analysis only when the overall KMO is ≥
0.6.
Bartlett’s Test of Sphericity (BTS) was also conducted. BTS is a measure of the
degree to which the bivariate correlation matrix of the variables differs from an identity
matrix – that is, a matrix in which the main diagonal has values of 1.0 and all other cells
have values of 0.0. BTS is a form of Chi-square test, where the null hypothesis is that the
correlation matrix is not an identity matrix. In other words, if the results of a BTS are
significant (probability values ≤ 0.05), one can conclude the correlation matrix may be
appropriate for a factor analysis.
The results of these two tests are shown in Table 20. Both KMO and BTS met the
levels expected for a successful factor analysis, so such an analysis was undertaken.
Table 20. Results of KMO and BST Kaiser-Meyer-Olkin Measure of Sampling Adequacy. 0.851
Bartlett's Test of Sphericity Approx. Chi-Square 844.348
df 55
Sig. 0.000

65
The factor analysis was conducted using the conventions of varimax rotation and
an eigenvalue threshold of 1.0. The analysis was conducted for the combined data set (all
respondents) as well as for the three geographical subsets (Canada, EU, and USA).
Table 21 presents the extracted communalties. While there is some debate about
the minimum value of communalities required to conduct a meaningful factor analysis,
MacCallum, et al. (1999:96) suggest that every communality should be greater than 0.6, or
the mean value of all communalities should be at least 0.7. A review of the extracted
communalities in Table 20 reveals that they fall substantially short of either criterion.
Only three are above the minimum of 0.6. This indicates that there is little underlying
coherent structure within the responses to the perceptions of probability of risk occurring
in the 11 possible sources. As a result, any useful factor structure was unlikely to emerge.
Still, to test this speculation, a factor analysis was conducted.
Table 21. Communalties Extracted
Communality
Food and Beverage 0.444
Transportation 0.408
Contracts 0.706
Financial 0.642
Health 0.503
Alcohol 0.322
Terrorism 0.311
Accidents 0.659
Weather and/or Natural Hazards 0.420
People 0.401
Crime 0.576
The rotated solution for the factor analysis of the complete data set is shown in
Table 22. Two factors emerged with eigenvalues above 1.0, explaining 38.9%, and 12.1%

66
of variance, respectively. The first factor has highest loadings in accidents, crime, health,
and weather and/or natural hazards. These factors are related in that they are external
forces over which an event planner would have little control or influence.
The remaining risks (food and beverage, transportation, alcohol, terrorism, and
people) are a combination of external and internal forces. Food and beverage and alcohol
are generally contracted out to suppliers, effectively transferring the responsibility for
managing these risks to a third party. Transportation and terrorism are external forces for
which an event planner may institute strategies for managing potential risks; however they
are largely out of their control. The risk of people is also an external force; however, as
events rely on the gathering of people, this is an element for which event planners must
exercise due diligence in ensuring as safe an environment as possible.
However, the fact remains that a factor analytic approach failed to identify a clear
latent structure in the entire data set or in the subsets of each geographical sub-sample, so
further comment is not warranted.
Table 22. Factor Solution Factor
1 2
Eigenvalue 4.0566 1.355
Variance explained (%) 38.875 12.139
Food and Beverage 0.520 0.417
Transportation 0.326 0.549
Contracts 0.123 0.831
Financial 0.007 0.801
Health 0.706 0.072
Alcohol 0.474 0.312
Terrorism 0.548 0.105
Accidents 0.808 0.080
Weather and/or Natural Hazards 0.610 0.217

67
People 0.479 0.414
Crime 0.747 0.131
5.6 Regression Analysis
A series of regression analyses was employed to test the ability of four independent
variables (gender, education, country of residence, experience) to “predict” both the risk
perception scale (Table 23) and the 11 individual risk elements. The risk scale scores were
averaged in order to create the same metric as used for the individual risk elements.
Education and country of residence were recoded as a series of dummy variables, with
each of the possible responses coded as “1” or “0” except for a referent category. For
education, the category of “none” was chosen as the referent category. Included in the
category of “industry” were individual industry courses and industry certification, “formal”
included diploma, college/university certification, undergraduate, and graduate education,
and “both” included responses that indicated a combination of industry and formal
education. Canada was the referent category for country of residence, with the USA and
EU representing the coded variables.
Table 23. Risk Perception Scale Regression Model Summaryb
Model
R
R Square
Adjusted R Square
Std. Error of the Estimate
Durbin-Watson
1 0.149a 0.022 -0.004 0.37646 1.922a. Predictors: (Constant), both, EU, Yrs of Experience, formal, Gender, USA, ind b. Dependent Variable: risk
ANOVAb
Model
Sum of Square
df
Mean Square
F
Sig.
1 Regression Residual Total
0.830 36.565 37.394
7 258 265
0.119 0.142
0.839 0.558a
a. Predictors: (Constant), both, EU, Yrs of Experience, formal, Gender, USA, ind

68
b. Dependent Variable: risk Coefficientsa
Model
Unstandardized Coefficients
B
Unstandardized Coefficients Std. Error
Standardized Coefficients
Beta
t
Sig. Constant Gender Yrs of Experience USA EU ind formal both
1.703
0.040
0.003
0.017
-0.042
-0.050
-0.045
0.072
0.094
0.065
0.003
0.057
0.061
0.062
0.092
0.085
0.043
0.062
0.021
-0.052
-0.066
-0.035
0.066
18.134
0.623
0.947
0.293
-0.680
-0.803
-0.488
0.852
0.000
0.534
0.344
0.770
0.497
0.423
0.626
0.395
The predictor variables were entered as a block in a stepwise regression because
there were no a priori expectations or questions about the relative importance of the
independent variables. The results (see Appendix H) indicate that only one of the
dependent variables, weather and/or natural hazards as a source of risk, was significantly
correlated (p = 0.031) with any of the independent variables (Table 24). In this case, it was
positively correlated with USA residence (yes/no). In other words, USA residents were
more likely to perceive weather and/or natural hazards as a source of risk compared to
Canadians. However, the R-square was only about 0.05, which probably is not practically
meaningful. As a result, it was concluded that further regression analysis of the gender,
education, country of residence, and experience was not warranted, and that simpler
nonparametric cross-tabulation were appropriate for testing the questions.

69
Table 24. Weather and/or Natural Hazards Regression Model Summaryb
Model
R
R Square
Adjusted R Square
Std. Error of the Estimate
Durbin-Watson
1 0.299a 0.052 0.029 0.63123 2.022a. Predictors: (Constant), both, EU, Yrs of Experience, formal, Gender, USA, ind b. Dependent Variable: risk
ANOVAb
Model
Sum of Square
df
Mean Square
F
Sig.
1 Regression Residual Total
6.246 113.162 119.408
7 284 291
0.892 0.398
2.239 0.031a
a. Predictors: (Constant), both, EU, Yrs of Experience, formal, Gender, USA, ind b. Dependent Variable: risk
Coefficientsa
Model
Unstandardized Coefficients
B
Unstandardized Coefficients Std. Error
Standardized Coefficients
Beta
t
Sig. Constant Gender Yrs of Experience USA EU ind formal both
1.537
0.124
0.006
0.180
-0.080
0.053
-0.070
0.108
0.149
0.104
0.005
0.091
0.099
0.098
0.150
0.138
0.078
0.073
0.132
-0.058
0.041
-0.031
0.056
10.325
1.197
1.195
1.1972
-0.808
0.544
-0.465
0.781
0.000
0.232
0.233
0.050
0.420
0.587
0.642
0.436

70
5.7 Education, Experience, and Gender Questions
Question 1: Is there a relationship between event management education and risk perception?
Frequency tables revealed that only a small portion of respondents had no formal event
management education (17%); a plurality (47%) had taken industry courses; and
approximately one in four (24%) had obtained industry certification (Table 25).
Table 25. Event Management Education Type of Education No. of
Respondents Percentage
None 66 17.1Industry Courses 154 46.8Diploma 24 6.2Industry Certification 92 23.8College/University Certification 25 6.5Undergraduate 14 3.6Graduate 12 3.1N=297
The categories of industry courses and industry certification were combined into an
“Industry” category; diploma, college/university certification, undergraduate, and graduate
categories were combined into a “Post-Secondary category”. Some event planners had
both industry and post-secondary education, which is illustrated by the Industry/Post-
Secondary category (Table 26). These categories were then analyzed using cross-
tabulations and Chi-square analysis.
Table 26. Education and Risk Perceptions Risk Element Low Moderate High 2 df p= Food and Beverage None (N=66) Observed Expected Percentage Industry (N=167) Observed
37 30.2 56.1
71
23 28.9 34.8
79
6 6.9 9.1
17
7.616 6 0.268

71
Expected Percentage Post-Secondary (N=26) Observed Expected Percentage Industry/Post-Sec. (N=38) Observed Expected Percentage
76.5 42.5
15
11.9 57.7
13
17.4 34.2
73.1 47.3
8
11.4 30.8
20
16.6 52.6
17.4 10.2
3
2.7 11.5
5
4.0 13.2
Transportation None (N=66) Observed Expected Percentage Industry (N=167) Observed Expected Percentage Post-Secondary (N=26) Observed Expected Percentage Industry/Post-Sec. (N=38) Observed Expected Percentage
11 10.9 16.7
29
27.6 17.4
1
4.3 3.8
8
6.3 21.1
36 37.8 54.5
101
95.6 60.5
17
14.9 65.4
16
21.8 42.1
19 17.3 28.8
37
43.9 22.2
8
6.8 30.8
14
10.0 36.8
8.343 6 0.214
Contracts None (N=63) Observed Expected Percentage Industry (N=165) Observed Expected Percentage Post-Secondary (N=26) Observed Expected Percentage Industry/Post-Sec. (N=38) Observed Expected Percentage
15 16.0 23.8
40
41.8 24.2
9
6.6 34.6
10
9.6 34.6
31 34.5 49.2
95
90.4 57.6
13
14.2 50.0
21
20.8 55.3
17 12.5 27.0
30
32.8 18.2
4
5.2 15.4
7
7.5 18.4
3.882 6 0.693
Financial None (N=64) Observed Expected Percentage Industry (N=162) Observed
11 11.0 17.2
27
30 33.3 46.9
84
23 19.6 35.9
51
4.076 6 0.666

72
Expected Percentage Post-Secondary (N=26) Observed Expected Percentage Industry/Post-Sec. (N=38) Observed Expected Percentage
27.9 16.7
6
4.5 23.1
6
6.6 15.8
84.4 51.9
16
13.5 61.5
21
19.8 55.3
49.7 31.5
4
8.0 15.4
11
11.7 28.9
Health None (N=65) Observed Expected Percentage Industry (N=166) Observed Expected Percentage Post-Secondary (N=26) Observed Expected Percentage Industry/Post-Sec. (N=37) Observed Expected Percentage
29 28.1 44.6
71
71.7 42.8
13
11.2 50.0
14
16.0 37.8
30 33.8 46.2
91
86.4 54.8
12
13.5 46.2
20
19.3 54.1
6 3.1 9.2
4
7.9 2.4
1
1.2 3.8
3
1.8 8.1
7.014 6 0.320
Alcohol None (N=64) Observed Expected Percentage Industry (N=162) Observed Expected Percentage Post-Secondary (N=26) Observed Expected Percentage Industry/Post-Sec. (N=38) Observed Expected Percentage
33 31.8 51.6
85
80.4 52.5
10
12.9 38.5
16
18.9 42.1
24 25.6 37.5
59
64.8 36.4
15
10.4 57.7
18
15.2 47.4
7 6.6
10.9
18 16.8 11.1
1
2.7 3.8
4
3.9 10.5
5.743 6 0.453
Terrorism None (N=64) Observed Expected Percentage Industry (N=164) Observed
38 37.7 59.4
96
26 23.0 40.6
59
0 3.3
.0
9
10.677 6 0.099

73
Expected Percentage Post-Secondary (N=26) Observed Expected Percentage Industry/Post-Sec. (N=38) Observed Expected Percentage
96.6 58.5
14
15.3 53.8
24
22.4 63.2
59.0 36.0
11
9.3 42.3
9
13.7 23.7
8.4 5.5
1
1.3 3.8
5
2.0 13.2
Accidents None (N=66) Observed Expected Percentage Industry (N=166) Observed Expected Percentage Post-Secondary (N=26) Observed Expected Percentage Industry/Post-Sec. (N=38) Observed Expected Percentage
30 27.4 45.5
70
69.0 42.2
11
10.8 42.3
12
15.8 31.6
31 33.4 47.0
86
84.1 51.8
12
13.2 46.2
21
19.3 55.3
5 5.1 7.6
10
12.9 6.0
3
2.0 11.5
5
3.0 13.2
4.203 6 0.649
Weather/Natural Hazards None (N=66) Observed Expected Percentage Industry (N=167) Observed Expected Percentage Post-Secondary (N=26) Observed Expected Percentage Industry/Post-Sec. (N=38) Observed Expected Percentage
28 22.7 42.4
50
57.4 29.9
12
8.9 46.2
12
13.1 31.6
30 35.6 45.5
97
90.0 58.1
13
14.0 50.0
20
20.5 52.6
8 7.8
12.1
20 19.7 12.0
1
3.1 3.8
6
4.5 15.8
6.759 6 0.344
People None (N=66) Observed Expected Percentage Industry (N=166) Observed
26 23.0 39.4
60
35 36.8 53.0
93
5 6.2 7.6
13
12.254 6 0.057

74
Expected Percentage Post-Secondary (N=26) Observed Expected Percentage Industry/Post-Sec. (N=38) Observed Expected Percentage
57.8 36.1
8
9.0 30.8
9
13.2 23.7
92.5 56.0
17
14.5 65.4
20
21.2 52.6
15.7 7.8
1
2.5 3.8
9
3.6 23.7
Crime None (N=65) Observed Expected Percentage Industry (N=167) Observed Expected Percentage Post-Secondary (N=26) Observed Expected Percentage Industry/Post-Sec. (N=38) Observed Expected Percentage
39 39.1 60.0
103
100.4 61.7
15
15.6 57.7
21
22.9 55.3
24 23.1 36.9
56
59.2 33.5
11
9.2 42.3
14
13.5 36.8
2 2.9 3.1
8
7.3 4.8
0
1.1 .0
3
1.7 7.9
3.340 6 0.765
Finances and transportation were perceived as having the highest probability of
occurring by event planners regardless of whether or not they have formal event
management education. All event planners viewed terrorism as having a low probability
of occurrence, with over half of those with no education and those with both industry and
post-secondary education ranking its probability as low. Crime was also seen as having a
low chance of occurrence with all event planners. There were similarities in perceptions
from event planners with no education and those with industry education; with the same
sources of risk chosen as being highly probably (financial, transportation, contracts), or
having low probability (crime, terrorism, accidents), and two of the same sources of risk at
the moderate level (contracts and transportation).

75
Event planners with both industry and post-secondary education also assessed
crime, terrorism, and accidents as being “low” sources of risk, while they identified
transportation and finances as being a high source of risk. The Chi-square analysis
illustrates the lack of any statistically significant relationships; although the risk element of
“people” was almost significant.
Even though the Chi-square analysis did not demonstrate a statistical significance
for the various risk elements, an examination of the expected and observed values does
reveal some interesting information. At all levels of education, the variance between the
expected and observed values occurred in a +/- 5 level. In the “None” category of
education, food and beverage and weather and/or other natural hazards had more responses
at the low probability level and fewer responses at the moderate probability level than
expected. Event planners with industry education demonstrated differences between
expected and observed values at the moderate level. Specifically, there were more
responses than expected for food and beverage, transportation, contracts, health, and
weather, and/or other natural hazards. Alcohol as a source of risk received fewer responses
than expected at the moderate level and more at the low level than expected. Weather
and/or other natural hazards had fewer responses than expected at the low probability
category. The responses for transportation were less than expected at the high probability
level. Post-secondary education only demonstrated a difference between expected and
observed values in the alcohol risk category, with more responses at the moderate
probability level. Finally for those event planners with both industry and post-secondary
education, transportation received fewer responses than expected at the moderate
probability level.

76
Question 2: Is there a relationship between experience and risk perception?
Cross-tabulations and Chi-square analysis were used to examine patterns relating to
experience level and risk perception (Table 27). Respondents were asked to provide their
years of experience; these data were analyzed to ascertain if experience had any effect on
risk perception. The categories of 26-30, 31-35, and 36-40 years of experience were
combined due to low respondent numbers in each individual category. These three
categories had only 15 respondents in total; the remaining 86 respondents had experience
of 25 years or less. Generally speaking, 50% (+/- 5%) of respondents with 25 years of
experience or less felt transportation, contracts, finances, health, accidents, weather and/or
natural hazards, and people were moderately likely sources of risk. In contrast, 46%-60%
of respondents with 26 years of experience or more felt that all sources of risk had a
moderate chance of occurring, with the exception of accidents. Only 33% of these
respondents believed that accidents had a moderate chance of occurring. Finances as a
source of risk had the highest rating with 31%, followed by transportation with 27%.
Chi-square analysis did not indicate any significant relationship between years of
experience and risk perception.
Table 27. Risk Perception and Years of Experience Risk Element Low Moderate High 2 df p= Food and Beverage 0-5 Yrs (N=55) Observed Expected Percentage 6-10 Yrs (N=99) Observed Expected Percentage
23 24.9 41.8
46
44.7 46.5
23 24.3 41.8
42
43.7 42.4
9 5.8
16.4
11 10.5 11.1
6.558 10 0.766

77
11-15 Yrs (N=62) Observed Expected Percentage 16-20 Yrs (N=46) Observed Expected Percentage 21-25 Yrs (N=24) Observed Expected Percentage 26-40 Yrs (N=15) Observed Expected Percentage
30
28.0 48.4
20
20.8 43.5
12
10.8 50.0
5
6.8 33.3
29
27.4 46.8
22
20.3 47.8
10
10.6 41.7
7
6.6 46.7
3
6.6 4.8
4
4.9 8.7
2
2.6 8.3
3
1.6 20.0
Transportation 0-5 Yrs (N=55) Observed Expected Percentage 6-10 Yrs (N=99) Observed Expected Percentage 11-15 Yrs (N=62) Observed Expected Percentage 16-20 Yrs (N=46) Observed Expected Percentage 21-25 Yrs (N=24) Observed Expected Percentage 26-40 Yrs (N=15) Observed Expected Percentage
7 9.3
12.7
17 16.8 17.2
14
10.5 22.6
8
7.8 17.4
3
4.1 12.5
2
2.5 13.3
30 31.1 54.5
56
55.9 56.6
33
35.0 53.2
25
26.0 54.3
17
13.6 70.8
9
8.5 60.0
18 14.6 32.7
26
26.3 26.3
15
16.5 24.2
13
12.2 28.3
4
6.4 16.7
4
4.0 26.7
5.097 10 0.885
Contracts 0-5 Yrs (N=54) Observed Expected Percentage 6-10 Yrs (N=98) Observed Expected Percentage 11-15 Yrs (N=61)
10 13.5 18.5
24
24.5 24.5
30 29.2 55.6
51
53.0 52.0
14 11.3 25.9
23
20.5 23.5
7.661 10 0.662

78
Observed Expected Percentage 16-20 (N=45) Observed Expected Percentage 21-25 Yrs (N=23) Observed Expected Percentage 26-40 Yrs (N=15) Observed Expected Percentage
20 15.3 32.8
11
11.3 24.4
4
5.8 17.4
5
3.8 33.3
33 33.0 54.1
25
24.3 55.6
15
12.4 65.2
6
8.1 40.0
8 12.8 13.1
9
9.4 20.0
4
4.8 17.4
4
3.1 26.7
Financial 0-5 Yrs (N=53) Observed Expected Percentage 6-10 Yrs (N=98) Observed Expected Percentage 11-15 Yrs (N=60) Observed Expected Percentage 16-20 Yrs (N=46) Observed Expected Percentage 21-25 Yrs (N=22) Observed Expected Percentage 26-40 Yrs (N=15) Observed Expected Percentage
7 9.2
13.2
13 17.0 13.3
16
10.4 26.7
9
8.0 19.6
2
3.8 9.1
4
2.6 26.7
31 27.2 58.5
50
50.3 51.0
28
30.8 46.7
26
23.6 56.5
9
11.3 40.9
7
7.7 46.7
15 16.6 28.3
35
30.7 35.7
16
18.8 26.7
11
14.4 23.9
11
6.9 50.0
4
4.7 26.7
12.308 10 0.265
Health 0-5 Yrs (N=55) Observed Expected Percentage 6-10 Yrs (N=98) Observed Expected Percentage 11-15 Yrs (N=61) Observed
24 23.8 43.6
38
42.4 38.8
27
28 28.6 50.9
58
51.0 59.2
28
3 2.6 5.5
2
4.6 2.0
6
13.913 10 0.177

79
Expected Percentage 16-20 Yrs (N=45) Observed Expected Percentage 21-25 Yrs (N=24) Observed Expected Percentage 26-40 Yrs (N=15) Observed Expected Percentage
26.4 44.3
24
19.5 53.3
12
10.4 50.0
4
6.5 26.7
31.7 45.9
20
23.4 44.4
12
12.5 50.0
9
7.8 60.0
2.9 9.8
1
2.1 2.2
0
1.1 .0
2 .7
13.3Alcohol 0-5 Yrs (N=52) Observed Expected Percentage 6-10 Yrs (N=96) Observed Expected Percentage 11-15 Yrs (N=62) Observed Expected Percentage 16-20 Yrs (N=46) Observed Expected Percentage 21-25 Yrs (N=23) Observed Expected Percentage 26-40 Yrs (N=15) Observed Expected Percentage
24 25.6 46.2
50
47.3 52.1
28
30.6 45.2
24
22.7 52.2
15
11.3 65.2
4
7.4 26.7
23 21.0 44.2
36
38.9 37.5
25
25.1 40.3
18
18.6 39.1
8
9.3 34.8
9
6.1 60.0
5 5.3 9.6
10
9.8 10.4
9
6.3 14.5
4
4.7 8.7
0
2.3 .0
2
1.5 13.3
9.041 10 0.528
Terrorism 0-5 Yrs (N=55) Observed Expected Percentage 6-10 Yrs (N=98) Observed Expected Percentage 11-15 Yrs (N=59) Observed Expected
40 32.1 72.7
53
57.3 54.1
30
34.5
14 20.1 25.5
42
35.8 42.9
25
21.5
1 2.8 1.8
3
5.0 3.1
4
3.0
14.144 10 0.167

80
Percentage 16-20 Yrs (N=45) Observed Expected Percentage 21-25 Yrs (N=24) Observed Expected Percentage 26-40 Yrs (N=15) Observed Expected Percentage
50.8
28 26.3 62.2
15
14.0 62.5
7
8.8 46.7
42.4
12 16.4 26.7
8
8.8 33.3
7
5.5 46.7
6.8
5 2.3
11.1
1 1.2 4.2
1 .8
6.7Accidents 0-5 Yrs (N=55) Observed Expected Percentage 6-10 Yrs (N=98) Observed Expected Percentage 11-15 Yrs (N=62) Observed Expected Percentage 16-20 Yrs (N=46) Observed Expected Percentage 21-25 Yrs (N=24) Observed Expected Percentage 26-40 Yrs (N=15) Observed Expected Percentage
26 22.7 47.3
40
40.5 40.8
26
25.6 41.9
16
19.0 34.8
9
9.9 37.5
7
6.2 46.7
26 28.2 47.3
51
50.3 52.0
30
31.8 48.4
27
23.6 58.7
15
12.3 62.5
5
7.7 33.3
3 4.0 5.5
7
7.2 7.1
6
4.5 9.7
3
3.4 6.5
0
1.8 .0
3
1.1 20.0
9.271 10 0.507
Weather/Natural Hazards 0-5 Yrs (N=55) Observed Expected Percentage 6-10 Yrs (N=99) Observed Expected Percentage 11-15 Yrs (N=62) Observed Expected Percentage
20 18.6 36.4
34
33.5 34.3
19
21.0 30.6
28 29.8 50.9
56
53.6 56.6
35
33.6 56.5
7 6.6
12.7
9 11.8
9.1
8 7.4
12.9
3.421 10 0.970

81
16-20 Yrs (N=46) Observed Expected Percentage 21-25 Yrs (N=24) Observed Expected Percentage 26-40 Yrs (N=15) Observed Expected Percentage
17
15.6 37.0
6
8.1 25.0
6
5.1 40.0
22
24.9 47.8
15
13.0 62.5
7
8.1 46.7
7
5.5 15.2
3
2.9 12.5
2
1.8 13.3
People 0-5 Yrs (N=55) Observed Expected Percentage 6-10 Yrs (N=99) Observed Expected Percentage 11-15 Yrs (N=62) Observed Expected Percentage 16-20 Yrs (N=45) Observed Expected Percentage 21-25 Yrs (N=24) Observed Expected Percentage 26-40 Yrs (N=15) Observed Expected Percentage
15 18.9 27.3
36
34.0 36.4
25
21.3 40.3
13
15.5 28.9
8
8.2 33.3
6
5.2 40.0
36 30.6 65.5
52
55.1 52.5
31
34.5 50.0
27
25.1 60.0
14
13.4 58.3
7
8.4 46.7
4 5.5 7.3
11
9.9 11.1
6
6.2 9.7
5
4.5 11.1
2
2.4 8.3
2
1.5 13.3
4.808 10 0.904
Crime 0-5 Yrs (N=55) Observed Expected Percentage 6-10 Yrs (N=98) Observed Expected Percentage 11-15 Yrs (N=62) Observed Expected Percentage 16-20 Yrs (N=46)
38 33.0 69.1
57
58.8 58.2
35
37.2 56.5
15 19.6 27.3
38
35.0 38.8
24
22.1 38.7
2 2.4 3.6
3
4.2 3.1
3
2.7 4.8
10.306 10 0.414

82
Observed Expected Percentage 21-25 Yrs (N=24) Observed Expected Percentage 26-40 Yrs (N=15) Observed Expected Percentage
32 27.6 69.6
13
14.4 54.2
5
9.0 33.3
12 16.4 26.1
9
8.6 37.5
9
5.4 60.0
2 2.0 4.3
2
1.0 8.3
1 .7
6.7
As with education, the observed and expected values were examined for differences
with experience. The variance for experience was in a range of +/- 5-8, with +8 for the
low probability level in connection with terrorism as a source of risk. For event planners
with 0-5 years of experience, terrorism and crime had more responses than expected at the
low probability level, less responses than expected at the moderate probability level for
terrorism, and more responses than expected at the moderate probability level for people.
This group of event planners were the only ones who responded less than expected at the
moderate level for the risk element of terrorism. With 6-10 years of experience, health and
terrorism demonstrated more responses than expected at the moderate probability level,
and more responses than expected at the high probability level. Contracts and financial
risks garnered more responses than expected at the low probability level for event planners
with 11-15 years of experience. Event planners with 16-20 years of experience responded
more than expected at the low probability level in the areas of health and crime, whereas
those event planners with 21-25 years of experience responded more than expected at the
high probability level for financial. Event planners with 26-40 years of experience
demonstrated consistency in all observed versus expected responses (within 5%).

83
Question 3: Does gender influence risk perception? Cross-tabulations and Chi-square analysis were used to assess the potential relationship
between gender and risk perceptions (Table 28). The perception of food and beverage, and
weather and/or other natural hazards as sources of risk showed a strong gender-related
connection. Female event planners were more likely to view the probability of both these
sources of risk as having moderate to high probability of occurring, compared to their male
counterparts. Although not statistically significant, female event planners appeared to
believe that alcohol, terrorism, and people were more likely to be sources of risk than male
event planners.
Table 28. Gender and Risk Perception Risk Element Low Moderate High 2 df p= Food & Beverage Female (N=239) Observed Expected Percentage Male (N=62) Observed Expected Percentage
98 108.8 41.0
39
28.2 62.9
113 104.8 47.3
19
27.2 30.6
28 25.4 11.7
4
6.6 6.5
9.577 2 0.008
Transportation Female (N=239) Observed Expected Percentage Male (N=62) Observed Expected Percentage
42 40.5 17.6
9
10.5 14.5
132 135.0 55.2
38
35.0 61.3
65 63.5 27.2
15
16.5 24.2
.759 2 0.684
Contracts Female (N=236) Observed Expected Percentage Male (N=60) Observed Expected Percentage
59 60.6 25.0
17
15.4 28.3
130 127.6 55.1
30
32.4 50.0
47 47.8 19.9
13
12.2 21.7
.508 2 0.776

84
Financial Female (N=234) Observed Expected Percentage Male (N=60) Observed Expected Percentage
42 40.6 17.9
9
10.4 15.0
119 121.0 50.9
33
31.0 55.0
73 72.4 31.2
18
18.6 30.0
.420 2 0.811
Health Female (N=236) Observed Expected Percentage Male (N=62) Observed Expected Percentage
98 102.2 41.5
31
26.8 50.0
126 122.8 53.4
29
32.2 46.8
12 11.1
5.1
2 2.9 3.2
1.589 2 0.452
Alcohol Female (N=233) Observed Expected Percentage Male (N=61) Observed Expected Percentage
111 115.7 47.6
35
30.3 57.4
95 93.5 40.8
23
24.5 37.7
27 23.8 11.6
3
6.2 4.9
3.144 2 0.208
Terrorism Female (N=236) Observed Expected Percentage Male (N=60) Observed Expected Percentage
138 138.7 58.8
36
35.3 60.0
84 85.3 35.6
23
21.7 38.3
14 12.0
5.9
1 3.0 1.7
1.836 2 0.399
Accidents Female (N=238) Observed Expected Percentage Male (N=62) Observed Expected Percentage
99 98.4 41.6
25
25.6 40.3
119 121.4 50.0
34
31.6 54.8
20 18.2
8.4
3 4.8 4.8
1.060 2 0.589
Weather/Natural Hazards Female (N=239) Observed Expected Percentage
77 82.6 32.2
129 128.6 54.0
33 27.8 13.8
6.575 2 0.037

85
Male (N=62) Observed Expected Percentage
27
21.4 43.5
33
33.4 53.2
2
7.2 3.2
People Female (N=238) Observed Expected Percentage Male (N=62) Observed Expected Percentage
79 82.5 33.2
25
21.5 40.3
134 133.3 56.3
34
34.7 54.8
25 22.2 10.5
3
5.8 4.8
2.432 2 0.296
Crime Female (N=239) Observed Expected Percentage Male (N=61) Observed Expected Percentage
143 142.6 59.8
36
36.4 59.0
84 85.2 35.1
23
21.8 37.7
12 11.2
5.0
2 2.8 3.3
.411 2 0.814
When examining the observed versus expected responses for gender, food and
beverage, and weather and/or other natural hazards reveal statistically significant
differences between females and males. Female event planners responded less than
expected at the low probability level for food and beverage, and weather and/or other
natural hazards. They also responded more than expected at the moderate probability level
for food and beverage and more than expected at the high probability level for weather
and/or other natural hazards. Male event planners demonstrated the opposite pattern for
these same risk elements and probability levels: more at the low probability level for food
and beverage and weather and/or other natural hazards, less at the moderate probability
level for food and beverage and less at the high probability level for weather and/or other
natural hazards.

86
Although not statistically significant, female event planners responded less
frequently than expected at the low probability level for health, and more than expected at
the moderate probability level for health. Male event planners responded more than
expected at the low probability level for health and alcohol.
5.8 Country of Residence Questions
Question 4: Does the country of residence of the event planner affect risk perception? Cross-tabulation and Chi-square were used to examine the relationship of country of
residence to sources of risk (Table 29). Cross-tabulation indicated that the location of the
respondents’ residence had the greatest influence on risk perceptions in the moderate
chance of occurrence category. Food and beverage, terrorism, and people showed the
largest variation among geographic areas; whereas perceptions of risks associated with
weather and/or natural hazards were generally similar across the three regions.
Canadian event planners perceived the potential risk sources of food and beverage,
transportation, health, alcohol, and people as more likely to have a moderate chance of
occurrence than European or USA planners. EU planners perceived contracts, financial,
and crime risks as more likely to have a moderate chance of occurrence than did Canadians
or USA planners. USA event planners perceived terrorism as more likely to have a
moderate chance of occurrence than Canadian or EU planners. Chi-square indicated that
there was a statistically significant relationship between geographic origin of planners and
their perceptions of food and beverage, health, alcohol, and weather and/or other natural
hazards as potential source of risk.
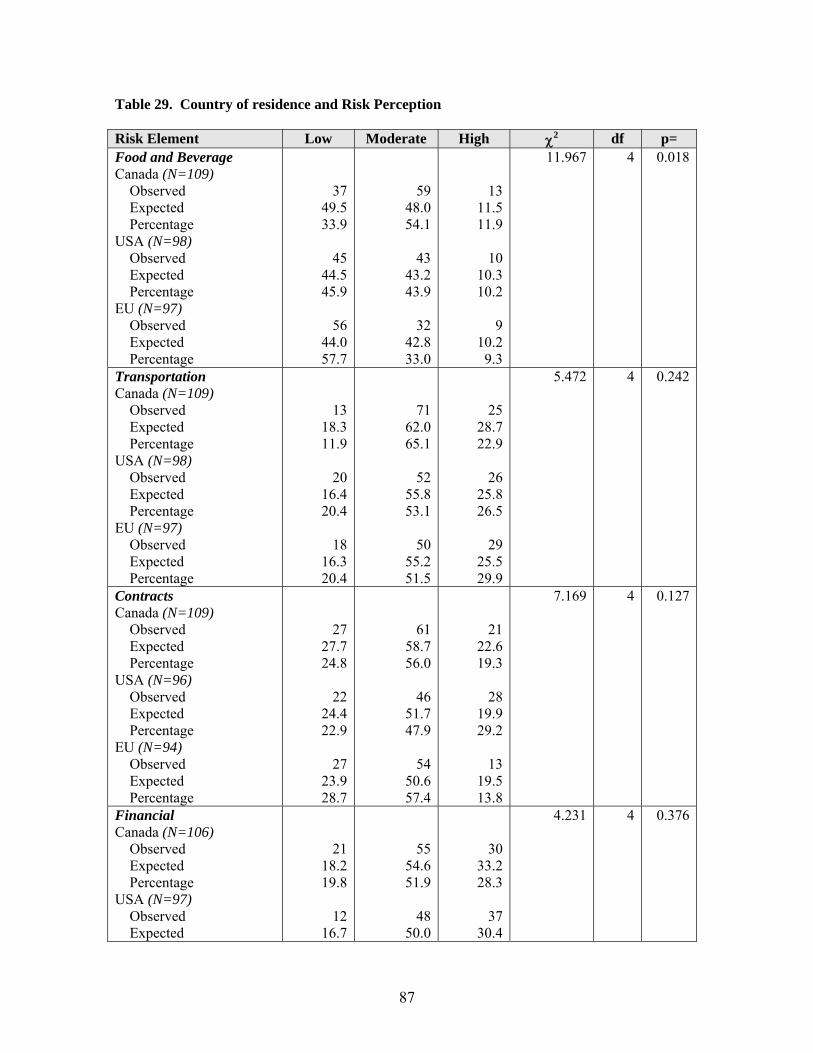
87
Table 29. Country of residence and Risk Perception Risk Element Low Moderate High 2 df p= Food and Beverage Canada (N=109) Observed Expected Percentage USA (N=98) Observed Expected Percentage EU (N=97) Observed Expected Percentage
37 49.5 33.9
45
44.5 45.9
56
44.0 57.7
59 48.0 54.1
43
43.2 43.9
32
42.8 33.0
13 11.5 11.9
10
10.3 10.2
9
10.2 9.3
11.967 4 0.018
Transportation Canada (N=109) Observed Expected Percentage USA (N=98) Observed Expected Percentage EU (N=97) Observed Expected Percentage
13 18.3 11.9
20
16.4 20.4
18
16.3 20.4
71 62.0 65.1
52
55.8 53.1
50
55.2 51.5
25 28.7 22.9
26
25.8 26.5
29
25.5 29.9
5.472 4 0.242
Contracts Canada (N=109) Observed Expected Percentage USA (N=96) Observed Expected Percentage EU (N=94) Observed Expected Percentage
27 27.7 24.8
22
24.4 22.9
27
23.9 28.7
61 58.7 56.0
46
51.7 47.9
54
50.6 57.4
21 22.6 19.3
28
19.9 29.2
13
19.5 13.8
7.169 4 0.127
Financial Canada (N=106) Observed Expected Percentage USA (N=97) Observed Expected
21 18.2 19.8
12
16.7
55 54.6 51.9
48
50.0
30 33.2 28.3
37
30.4
4.231 4 0.376

88
Percentage EU (N=94) Observed Expected Percentage
12.4
18 16.1 19.1
49.5
50 48.4 53.2
38.1
26 29.4 27.7
Health Canada (N=107) Observed Expected Percentage USA (N=97) Observed Expected Percentage EU (N=97) Observed Expected Percentage
34 46.2 31.8
51
41.9 52.6
45
41.9 46.4
68 22.8 63.6
42
50.6 43.3
47
50.6 48.5
5 5.0 4.7
4
4.5 4.1
5
4.5 5.2
9.926 4 0.042
Alcohol Canada (N=108) Observed Expected Percentage USA (N=94) Observed Expected Percentage EU (N=95) Observed Expected Percentage
47 53.5 43.5
42
46.5 44.7
58
47.0 61.1
50 43.6 46.3
37
38.0 39.4
33
38.4 34.7
11 10.9 10.2
15
9.5 16.0
4
9.6 4.2
11.948 4 0.018
Terrorism Canada (N=107) Observed Expected Percentage USA (N=96) Observed Expected Percentage EU (N=96) Observed Expected Percentage
72 62.6 67.3
48
56.2 50.0
55
56.2 57.3
32 39.0 29.9
42
35.0 43.8
35
35.0 36.5
3 5.4 2.8
6
4.8 6.3
6
4.8 6.3
6.908 4 0.141
Accidents Canada (N=108 Observed Expected Percentage USA (N=98)
41 44.6 38.0
57 55.2 52.8
10 8.2 9.3
1.568 4 0.815

89
Observed Expected Percentage EU (N=97) Observed Expected Percentage
40 40.4 40.8
44
40.0 45.4
51 50.1 52.0
47
49.6 48.5
7 7.4 7.1
6
7.4 6.2
Weather/Natural Hazards Canada (N=109) Observed Expected Percentage USA (N=98) Observed Expected Percentage EU (N=97) Observed Expected Percentage
37 37.3 33.9
26
33.5 26.5
41
33.2 42.3
59 58.8 54.1
53
52.9 54.1
52
52.3 53.6
13 12.9 11.9
19
11.6 19.4
4
11.5 4.1
13.128 4 0.011
People Canada (N=109) Observed Expected Percentage USA (N=97) Observed Expected Percentage EU (N=97) Observed Expected Percentage
29 37.4 26.6
41
33.3 42.3
34
33.3 35.1
67 60.8 61.5
46
54.1 47.4
56
54.1 57.7
13 10.8 11.9
10
9.6 10.3
7
9.6 7.2
6.778 4 0.148
Crime Canada (N=109) Observed Expected Percentage USA (N=98) Observed Expected Percentage EU (N=96) Observed Expected Percentage
68 65.1 62.4
64
58.5 65.3
49
57.3 51.0
35 38.9 32.1
30
34.9 30.6
43
34.2 44.8
6 5.0 5.5
4
4.5 4.1
4
4.4 4.2
5.475 4 0.242

90
Cross-tabulations indicated that terrorism was not viewed as a high source of risk by event
planners from any country of residence, and the Chi-Square analysis did not indicate a
statistical significance. Although planners from each country perceived terrorism as
having only a low chance of occurrence; event planners from the USA tended to perceive
terrorism as having a moderate chance of occurrence more often than planners in the two
other jurisdictions who tended to give terrorism an even lower probability of occurring.
Contracts are seen as being a high source of risk more often for event planners from
the USA, than those from Canada or the EU. Although the results tentatively suggest USA
planners are somewhat more likely to view contract risks as having a higher probability of
occurring, the differences among the three jurisdictions are not statistically significant.
Although European event planners perceived transportation as having a high
chance of being a source of risk more often than planners from Canada or the USA,
Canadian event planners perceived this source of risk as having a moderate chance of
occurrence with a larger frequency than either EU or USA planners. The Chi-square value
indicates a non-significant relationship between transportation and country of residence,
meaning that any observed differences are likely due to chance only.
The expected versus observed values demonstrate some results that are important to
outline. For example, Canadian event planners had differences between the expected and
observed values in the elements of food and beverage and health (which were statistically
significant) and at the low and moderate levels for all risk elements. Only terrorism had
more responses than expected at the low probability level and less at the moderate
probability level than the USA or European event planners. In addition, health had the

91
largest variance for all event planners and risk elements, at the moderate probability level
with a 46 more responses than expected.
USA event planners responses differed with more responses than expected at the
high probability level. For example, contracts, financial, alcohol and weather and/or other
natural hazards had more responses than expected at the high probability level. Contracts,
health, and people received fewer responses than expected at the moderate probability
level, while terrorism received more responses than expected at the same probability level.
At the low probability level health, people and crime had more responses than expected,
whereas terrorism and weather and/or other natural hazards had less responses than
expected.
European event planners had fewer than expected responses at the high probability
level than Canadian or USA event planners in the risk elements of contracts, alcohol, and
weather and/or other natural hazards. Food and beverage, transportation, and alcohol had
less responses than expected at the moderate probability level, whereas crime had more
responses. Food and beverage, alcohol and weather and/or other natural hazards had more
responses than expected at the low probability level and crime had fewer responses than
expected.
5.9 Summary
Chapter 6 discusses the results of the survey, makes conclusions related to the model of
risk perception, and suggests avenues for future research in this area.

92
CHAPTER SIX
Discussion, Conclusions, and Future Research
6.1 Discussion
The following discussion is an interpretation of the results in Chapter 5 and presents
comments from the open-ended questions that were part of the on-line survey. These
comments are provided to add richness to the patterns. It is not surprising that, based on
the curve illustrated by the histogram (Figure 8, page 60), the majority of the variation in
the results occurs in the moderate level.
6.1.1 Education and Experience
As mentioned in the literature review, familiarity (Johnson, 1993) is the idea that the
knowledge or exposure an individual has to an event or situation, has an influence on risk
perception. If a negative experience has occurred, such as an allergic reaction, then the
event planner is likely to perceive food and beverage as a higher risk in future events. On
the other hand, if the event planner had developed a risk strategy that was successful, such
as supervision of articles left in the meeting room resulting in no thefts, then the event
planner is likely to view crime as a lower risk in future events as the strategy for dealing
with the risk was sufficient to overcome it. Dread, the second concept influencing risk
perception, is characterized by a perceived lack of control and the potential for fatal
consequences (Johnson, 1993). In this study, dread was difficult to separate from
familiarity as sources of risk that demonstrated dread characteristics, such as terrorism,
accidents, and crime, were also influenced by education, social networks and experience
(familiarity). For example, terrorism has been a frequent topic in event management

93
education since the September 11, 2001 attacks. Event planners with event management
education (all categories) did not view terrorism as having a moderate or high probability
of occurrence, as they were likely exposed to management strategies in the course of their
instruction. On the other hand, event planners’ perception of the risk of terrorism having a
high probability of occurrence showed a decrease through the first three age categories,
and then an increase in the final three age categories (Table 30).
Table 30. Experience and Risk Perception Levels
0-5 6-10 11-15 16-20 21-25 26-40 Food & Beverage 16.4 11.1 4.8 8.7 8.3 20.0 Transportation 32.7 26.3 24.2 28.3 16.7 26.7 Contracts 25.9 23.5 13.1 20.0 17.4 26.7 Financial 28.3 35.7 26.7 23.9 50.0 26.7 Health 5.5 2.0 9.8 2.2 0 13.3 Alcohol 9.6 10.4 14.5 8.7 0 13.3 Terrorism 1.8 3.1 6.8 11.1 4.2 6.7 Accidents 5.5 7.1 9.7 6.5 0 20.0 W NH 12.7 9.1 12.9 15.2 12.5 13.3 People 7.3 11.1 9.7 11.1 8.3 13.3 Crime 3.6 3.1 4.8 4.3 8.3 6.7
Over 50% of event planners in this study had gained practical knowledge of event
industry risks through a combination of experience, events planned, and resources utilized.
Fifty-four percent of planners had six to 15 years of experience, only 17% had zero to five
years of experience. In addition, 33% of respondents planned between 11-30 events in
2007. Finally, 47% of planners had taken industry courses. One could speculate that those
event planners with 0-5 years experience would likely have event management education,
leading to a higher risk perception as they have not been exposed to many risks. Those
event planners with 6-10 and 11-15 years experience also likely have event management
education as well, resulting in a lower perception of the 11 risk elements. When moving to
94
the 16-20 and 21-25 years of experience categories, there is a possibility of less event
management education, meaning that they were not instructed in the risk management
strategies of the more novice event planners. Finally the 26-40 years of experience
category demonstrates an increase in risk perception. For this group, it is speculated that
they possibly have little event management education and/or are employed in a more
supervisory role, removing them from the consequences of risks.
The above speculation needs to consider that overall the risk perceptions of event
planners had a mean of 1.74, suggesting that overall risk is an accepted part of planning
events. This is illustrated through the responses collected from an open-ended question in
the on-line survey. Respondents were provided with the opportunity to comment on their
experiences with any of the 11 sources of risk. A total of 178 comments were made; many
of which support the argument that familiarity reduces risk perception.
Injuries and health issues have occurred at many events. Weather as well. But nothing major.
Flight delays and no shows are pretty common with corporate events. I believe that all planners have tried to see customers break a contract or foreign no-shows. Furthermore we have in all countries seen strikes in airports… Transportation – every program has at least one delay it seems Contracts – every contract has the potential for cancellation or attrition delayed/cancelled flights are a occupational hazard Have experienced all of the risks checked above the moderate level. basic problems such as injuries during team building activities, heavy drinking, flight delays and airports changes No shows are a common occurance at most conferences

95
Not in any serious way; we’ve had delegates become ill onsite but they were treated and there was no risk to us/our client The risks are always there regardless of the year or type of conference. It’s how you handle it that makes the difference.
Event planners with formal event management education are exposed to both
knowledge and culture influences. Instruction in risk addresses assessment and
management strategies, thereby increasing their exposure to the potential consequences
associated with terrorism. The same argument applies to the risks associated with
accidents and health, in that emphasis is placed in event management education on first aid
certification, as well as providing safety and security for attendees. Although event
planners with formal event management education are likely to develop strategies and
plans to address these “dread” risks because they have been trained to do so; they are also
more apt to perceive them as likely to happen due to the emphasis placed on their inability
to entirely prevent these risks. Experience would also lead planners to develop strategies
and plans to address these “dread” risks if they had encountered them in past events.
Again comments made by respondents support this premise.
Outbreak of the Iraq War and SARS during a conference we organised in Brunei. We involved the help of a local travelagency. We organised a desk at the premises, in order for delegates to change flights etc Hurricane Katrina during a conference in the Netherlands, where 50% of the delegates were from New Orleans and Houston. We placed TV screens all over the hotel with CNN connections for delegates to watch and check on the situation at home. And again a travelagency at the premises. We have had in the past food allergy emergencies and are very careful now to get the proper information from our delegation and either pass them on directly to the cooks for all venues that we are using for hospitality or pass on the information ourselves.

96
During a formal event I planned, we had a handful of people drink too much. A few threw up on the dance floor and two passed out at tables. We had transportation standing by, so we were able to take them home. Each event planner has to ensure that sensible steps are taken to secure rooms, no equipment / confidential information is left lying around etc Attendee was having a heart attack during a meeting, but didn't want to let the 'rest of the team' down. Refused medical attention. Company policy is that if he refused attention, we were not to force it. I did check on him as did his manager and other team members. We flew him home early and when he went to the doctor, he found out he had an anurisym. Good thing he made it home.
In contrast, the perception of the probability of risk associated with contracts and
financial risks was lower for event planners with formal event management education than
those with no formal education. This is likely due to the fact that contracts and financial
planning topics are addressed regularly within event management courses. The Masters of
Tourism Administration program at George Washington University, for example, requires
students to plan and execute an on-line conference that includes developing a budget and
negotiating a speaker contract (George Washington University, 2008). In this case,
education provides event planners with a sense of control over the situation.
As mentioned in Chapter 5, only 23% of event planners surveyed had no event
management education of any kind, this makes it difficult to separate education and
experience as suggested in the initial Event Industry Risk Perception model (Figure 7).
6.1.2 Gender
The results from Chapter 5 suggest that female event planners are more likely than
their male counterparts to assess food and beverage and weather and/or other natural
hazards as risk elements that need to be managed. In addition, female event planners

97
tended to assess health as having a moderate probability of occurrence more often than
male event planners. These sources of risk have the potential to cause harm to people, and
as suggested in the literature, women’s traditional gender as nurturers may make them
more sensitive to these types of risk. Male event planners, as suggested in the literature,
would have a greater confidence in the policies and procedures that are in place to protect
people from harm due to poor food safety, or a lack of snow removal during snowstorms.
This confidence is a result of their greater involvement and control within the social
structure of that they have historically influenced.
6.1.3 Country of Residence
Chi-square analysis showed significant relationships between the risk sources of food and
beverage, health, alcohol, and weather and/or natural hazards, and residence of event
planners. Overall, Canadian event planners were more likely to perceive the probability of
the various risk elements occurring than event planners from the USA or the EU. Only in
the area of terrorism were Canadian event planners less likely to perceive a moderate
chance of occurrence (Table 31).
Table 31. Country of Residence and High Risk Perception Canada United States European Union F&B 11.9 10.2 9.3Transportation 22.9 26.5 29.9Contracts 19.3 29.2 13.8Financial 28.3 38.1 27.7Health 4.7 4.1 5.2Alcohol 10.2 16.0 4.2Terrorism 2.8 6.3 6.3Accidents 9.3 7.1 6.2W NH 11.9 19.4 4.1People 11.9 10.3 7.2Crime 5.5 4.1 4.2 N=109 N=98 N=97

98
As illustrated by the Event Industry Risk Perception Model (Figure 7), in this study
country of residence represents culture. Social networks, media, and institutions combine
to increase the dread factor of the likelihood and severity of occurrence, as well as
providing sensationalized information instead of factual data. September 11, 2001 is still
quite recent and is only the second instance of a foreign terrorist attack on American soil in
modern history (the first being Pearl Harbour). Historically, European countries have dealt
with terrorism for many years, the various attacks and resulting deaths receiving media
attention. The situations in the USA and EU expose event planners to the concept of
terrorism and its potentially deadly consequences more frequently. Canadian planners, on
the other hand, are removed slightly from exposure to both attacks and media attention,
which would explain why terrorism was chosen as a low chance of occurrence by 67%.
USA event planners viewed contract-related risks as having a high chance of
occurrence more often than Canadian and EU event planners. Contracts represent the
potential for loss, primarily financially. Although signing a contract should represent a
guarantee of a product, venue, or service, there is still the chance that the other party will
not honour it. There have been instances in North America of hotels cancelling a
conference when presented with the opportunity to book a larger one. This puts an event
planner in a position of having to sue the hotel, which could result in large legal fees.
Until recently, chain hotels were not commonplace throughout Europe. The researcher has
held several conferences at a variety of hotels and venues in numerous European countries
that did not have a legal contract.

99
Transportation-related risks are perceived by Canadian event planners as more
likely to occur than USA or EU event planners, probably due to the risk of weather
problems in Canada. Canadian cities (both as origins of event attendees as well as
destinations hosting events) are more apt to experience severe weather conditions
(snowstorms, freezing rain) resulting in delays and cancellations than are American or
European cities.
6.2 Conclusions
Event management is a process by which an event planner researches, designs,
coordinates, plans, and evaluates an event (Goldblatt, 2008). Risk management has its
own process (Figure 8) and should be integrated into the overall event management
process (Rutherford Silvers, 2008). Risk assessment and management are an integral part
of an event planner’s responsibilities when planning and executing an event. There are
tools and strategies offered for use; however, these are only conceptual, with no grounding
in empirical research conducted with event planners. As can be seen, there is no
component that considers the individual event planner’s risk perception prior to the
process, nor what can influence this perception.

100
Figure 9. The Risk Management Process
Source: Rutherford Silvers, 2008: 25
Risk assessment is concerned with identifying and ranking risk. Ideally, a risk is
identified and then a determination is made as to its potential as an opportunity or a threat
(Rutherford Silvers, 2008; Tarlow, 2002a). In ranking risks, both the probability of
occurrence and the potential severity of the outcome (positive or negative) are determined.
It is interesting to note that at this point risks can be considered positive; when conducting
the risk definition interviews respondents were asked if risks could be positive. The
responses were that the risk itself was viewed as the potential for a negative outcome;
however, the strategies used to manage the risk offered the opportunity for a creative and
positive experience.
Risk management is the next step in the process and deals with how each risk is
negotiated and handled. Generally speaking, this is done through minimizing threats and
maximizing opportunities. Risk assessment and risk management tools and strategies are
flawed in their assumption that event planners are rational in their decision-making and
behaviour; the risk perception literature indicate this is not the case (Gardner, 2008; Slovic,
101
et al., 2004). Emotions and intuitions are key components to an individual’s identification
of a risk and their subsequent assessment and management.
The original Event Industry Risk Perception Model (Figure 7, page 31) was
designed as a result of the literature review that was conducted for this research. The
revised Event Industry Risk Perception Model (Figure 10) is based on the empirical results
of this study and illustrates the manner in which an individual’s preconceived notion of
risk fits into the process of identifying, assessing, and managing risk in a more
comprehensive manner. Experience and education have now been combined into the same
box. The results of this study indicate that these variables act together as an influence on
dread and familiarity; whereas country of residence and gender were seen to influence
dread and familiarity individually. Dread and familiarity are now in the same box as these
concepts are difficult to separate. An arrow from Risk Assessment back to Risk Perception
indicates that once a risk has been assessed as part of the event planning process, a change
to perception can occur. Finally the arrow from the Risk Management Strategies back to
Dread and Familiarity, indicate that the success or failure of implemented strategies can
affect these concepts.

102
Figure 10. Event Industry Risk Perception Model
The flow of the model now proceeds as follows: individual variables of
experience, education, gender, and country of residence influence the concepts of dread
and familiarity; leading to an individual’s definition of risk governed by familiarity and
dread, resulting in an individual’s risk perception; individual risk perception affects the
assessment of risk, which can also change the perception; finally risk management
strategies are employed based on the risk assessment, the success or failure of these
strategies then affect the concepts of dread and familiarity in future situations.
By conducting this research risk assessment and management have been placed
within the context of the individual. The risk management literature (Rutherford Silvers,
2008) suggests that risks should be seen as opportunities as well as threats; however, in the
course of the in-depth interviews participants were asked if risk could be a positive. Their
response was that it could not; instead, the manner in which the risk was managed could
inspire creativity and positive outcomes.
Participants were asked if they felt it was necessary to define the concept of “risk”.
They all believed that it was. The reason for their concurrence was that an event industry-

103
specific definition would provide planners (both novice and experienced) with a starting
point for risk assessment as well as encourage them to think beyond their experiences.
EMBOK has been developed as a way for practitioners to formulate plans and
strategies for dealing with the various aspects of planning and executing events
(Rutherford Silvers, 2009). For scholars, this model suggests possible areas of research.
This model is meant to be a work in progress, a fact that Rutherford Silvers recognizes on
her website:
Further development, improvement, expansion, and ratification of the Event Management Body of Knowledge Project depends on the review and input of a broad variety of industry practitioners, experts, certification bodies, and academicians from the full spectrum of event genres and industries. (Rutherford Silvers, 2009) This research can be applied to the Risk Management Knowledge domain in order to
further develop the model. Specifically, the risk categories determined through the in-
depth interviews can be applied to the categories in this domain (Table 32).
Table 32. EMBOK and Risk Perception EMBOK Risk Knowledge Domain Category Risk Element Compliance Alcohol, Food and Beverage, Health Emergency People, Terrorism, Weather and/or Other
Natural Hazards, Crime, Health Health & Safety Accidents, People, Food and Beverage, Health Insurance Contracts, Financial, Crime, Accidents Legal & Ethics People, Contracts, Transportation, Crime Security Management People, Crime, Transportation, Accidents Source: Rutherford Silvers, 2009 & Researcher
6.3 Future Research
This survey was limited to MPI members, which means that the data and results can be
applied to only meetings and conferences. Conducting a similar survey for other event

104
types (festivals, sports, political, expositions, hallmark, and social life-cycle) would be the
next logical step in order to determine if there is a difference in risk perception based on
event type. Although all events are a “gathering of people” (Goldblatt & Nelson, 2001),
the structure and objectives of these events could potentially affect risk perception. For
example, a wedding event planner would not necessarily perceive the risks terrorism or
crime as high as an event planner of an international conference. Even within the category
of meetings and conferences, there are different types of events. Corporate events tend to
be sponsored by a business with attendance required. Profit is not usually a consideration.
Association events, on the other hand, are voluntary, with attendees paying a registration
fee and absorbing other costs of attending such as transportation, accommodation, and
food service. Profit or breaking-even is a consideration for these events. Finally, event
lengths can vary greatly, from a few hours to a few days, which could also have an impact
on risk perceptions.
There was an indication that, overall, Canadian event planners have different
perceptions of risk than event planners from the USA or EU. Canadian event planners
perceived five sources of risk as more likely to have at least a moderate chance of
occurrence than USA or EU planners. Only in the area of terrorism were Canadian event
planners less likely to perceive a moderate chance of occurrence. Canadian culture is often
anecdotally viewed as being more conservative; however, there are no data collected in this
study to support this statement. Further research into the effects of culture could be
beneficial in understanding risk perceptions.
Forty-seven percent of event planners had taken industry courses, possibly because
event industry conferences position many of their sessions as “educational”. Indeed, these

105
sessions do count toward the requirements for writing the Certified Meeting Planner
(CMP) industry certification examination. The sessions tend to be no more than three
hours in length, with some as short as 60 minutes. They are often informal, with no
testing, and generally deal with a “hot” topic such as risk management planning. These
sessions are generally led by other event planners, so the information is based on
individual experiences and knowledge. In contrast, the CMP designation offered through
the Convention Industry Council requires an event planner to have a combination of
education, experience, and industry participation prior to applying to write the certification
examination. The examination is written at the annual conference in January and is two-
hours in length. It tests knowledge from across the industry, such as lighting specifications
and risk management. Although this testing can result in a broader, more diverse group of
professionals, some of the information tested is not applicable to the individual planner’s
daily job requirement. This may explain the lower percentage of event planners with
industry certification. Further study into the reasons why event planners obtain, or do not
obtain, the industry certification would allow industry associations to better tailor their
educational offerings. It may also be useful for the industry associations to look at
partnering with educational institutions to offer a more standardized curriculum. Another
area of study within education could be an examination of why some event planners did
not have any formal event management education. This could lead to better information
dissemination regarding educational opportunities and their value.
As mentioned, there are four risk management strategies that are taught in event
management textbooks (avoidance, reduction, transference, and retention). Respondents
were asked to provide information as to the frequency of their use of each of these

106
strategies, as presented in Chapter 5; however, more information is needed concerning why
different strategies were chosen, the event planner’s understanding of what these various
strategies involved, and the manner in which they were implemented. This would all be
valuable information for educational purposes.
6.4 Final Remarks
Event planners are responsible for the planning and execution of successful events. Since
September 11th, 2001, risk management has come to the fore of this job, and yet according
to an industry study, almost half of planners surveyed do not have any risk management
plan tailored to each of their meetings (Sturken, 2005).
Planners are expected to identify, assess, and manage the risks inherent in events.
Risk assessment and management strategies have been developed; however, they were not
grounded in the perceptions of event planners. The revised Event Industry Risk Perception
Model inserts the individual into the process, taking into account the variables of country
of residence (culture), education and experience, and gender and their influence on risk
perception. This is an important first step in supporting and enhancing the existing
assessment and management tools by identifying potential gaps, opportunities, and
strengths.

107
Appendix A – Expert Panel Correspondence
Expert Panel Invitation My name is Linda Robson and I am doing a PhD in the Recreation & Leisure Studies Department at the University of Waterloo. I have also been an event planner since 1996. I am a current member of MPI and PCMA. I am conducting research into the perception of risk of terrorism at events from the perspective of event planners. To do this, I need to develop a definition of risk as it relates to the event industry, which I believe is best done by asking to event planners. I am recruiting 12 event planners, who will become part of an expert panel. I will send out an e-mail with a working definition of risk and then set up a time to conduct an on-line chat. This will be an opportunity for you to comment on the definition, offer suggestions, criticisms, etc I will do this with everyone on the panel, then integrate the results of these interviews into a new definition of risk. This will again be sent out to you and we will have another on-line chat. This process will be repeated one more time and a final definition of risk will be constructed for use in the risk perception survey that will be conducted over the summer. I will share this definition with the panel members if they would like it. I am also happy to share the final results of my research with the panel members. The on-line chat is being used so that your answers will be recorded in your own words. Your identity will not be revealed to any of the other panel members and you will only be interviewed by me. I will be asking you questions about the amount of time you have been an event planner, what type of education/certification (if any) that you have, and what type of events you plan. This is being done to make sure that the panel reflects the diversity of the industry itself. Your responses will only be seen by myself and possibly my committee members (all professors). The on-line chats will be very informal, and will likely take 10 minutes. My aim is to complete these chats and develop the definition by the end of May. This proposed research is currently being reviewed by the University of Waterloo's Ethics Board and will not proceed without their approval. If you agree to be a part of this Expert Panel, once Ethics has approved the research, you will receive an official invitation to participate, along with the definition and a request for an interview time. If you have any questions, please do not hesitate to contact me by e-mail ([email protected]) or by phone (519-831-1925). Thank you for your time. Second Interview Invitation I hope you are enjoying the summer, even with all the rain we are getting. At long last I have analyzed the results of the interviews and have compiled a very rough draft of a working definition of risk in the event industry. Risk is anything that could potentially impede, threaten, influence, or interfere with the successful outcome of an event. Risk is the potential for loss and could be

108
financial, physical, psychological, legal, or ethical. Some examples of risks common to the event industry are: theft, equipment failure, fire, terrorism, intoxication, contracts, and transportation strikes. What I need to do now is to have you look over this definition and provide me with feedback. I would like to set up a time to talk to you, either by phone, Internet chat, or e-mail to discuss what you think of the definition. Thank you again for your assistance in this and I look forward to talking to you. Third Interview Invitation Thank you very much for taking the time to complete the second interview for this research. This has been a fantastic experience for me, I've learned so much about how others view risk. I have finished analyzing the second round of interviews and made some revisions to the definition. Risk is anything or anyone that could impede, threaten, influence, or interfere with the successful outcome of an event. Risk the potential for financial, physical, psychological, legal, or ethical loss. Some examples of risk that are common to the event industry are: theft, equipment failure, fire, terrorism, intoxication, food poisoning, contracts, trips and falls, transportation strikes, or labour disputes. What I would like to do now is schedule a time to talk to you once more. Can you please let me know when you would be available? This will be the last round of interviews and I expect that it will take approximately 10-15 minutes. Again thank you very much for your time and input with this research. Thank you Thank you for your time and input on the Expert Panel. The result of your suggestions is the following definition of risk for the event industry. Risk is anything or anyone that could impede, threaten, influence, or interfere with the successful outcome of an event. Risk is the potential for loss financially, physically, psychologically, legally, or ethically. Some examples of risk that are common to the event industry are: theft, equipment failure, fire, terrorism, intoxication, food poisoning, contracts, trips and falls, transportation strikes, or labour disputes. This definition will now be used in an on-line survey asking MPI event planners from Canada, the United States, and the member countries of the European Union to rank their perceptions of different types of risks. The results of this survey will provide information related to the types of risks that event planners see as most commonly occurring, as well as possibly being able to connect risks with specific types of events, and/or geographic locations.

109
I would be happy to share my findings with you at the conclusion of my research, please let me know if you would be interested. As a small token of appreciation for your time, energy, and assistance, please accept this gift certificate for Amazon. Thank you again, I could not have done this without you.

110
Appendix B – Expert Panel Questions First Interview Questions
1. How do you define risk as it applies to the event industry? 2. What would you add to the definition? 3. What elements should be in a risk definition? 4. Do you think you can define risk without knowing what types of risks are part of
the industry? 5. Do you think a theoretical or practical definition is better? 6. Do you think experience would affect the definition of risk? 7. Do you think education or industry certification would affect the definition of
risk? 8. How do you think education vs experience will affect a definition of risk? 9. Who would have an easier time defining risk, those with education or experience? 10. Do you think risk definition applies to individual event elements or to the event
as a whole? 11. Does it apply to all types of events? 12. Does each event type need a separate definition?
Second Interview Questions 1. What do you think of the overall definition? 2. Is it easy to understand? 3. Do you think this definition could be understood by a novice planner? 4. Do you think this definition could be understood by an experienced planner? 5. Do you think it reflects the view of risk as it applies to the event industry? 6. Do you think the tone is appropriate? 7. Does it apply to all types of events? 8. Should examples be after each category? 9. Do you think “human element” should be added as a category? 10. What do you think of the layout? 11. What would you add/change/remove from this definition? 12. Are there other examples of risk you think should be included?
Third Interview Questions
1. What do you think of the overall definition? 2. What do you think of the revisions? 3. Are there other examples of risk that you think should be included? 4. Do you have any changes? 5. Would you be happy having your name associated with this definition?

111
Appendix C - CATPAC Exclusion Words USE SHLL BOTH SO MAKE DID NIETHER STILL WHO DIDN’T NOR SUCH WHAT ISN’T ALTHOUGH TAKE WHERE WHEN HOW WHY IT’S ITS THE BUT ANY CAN THIS THAT AND HAVE FOR ARE HAS THEM THESE OUR YOUR YOURS OURS THEIRS THEIR WAS HAD WITH ALSO FROM WERE WHILE THEN NOW HERE THERE CAME INTO DURING THEY’D AFTER MRS MISS MISTER THEY MAY SHE THOUGH THAN HER HIM YET GET KEPT GIVE THUS VERILY GOES GONE ECT GOT MID OWN VERY EVERY EACH SOME MUCH ONLY GAVE BEING WHICH HIS HERS BEEN USING HER’S WENT MADE UNTIL SAID SAY TRIED TRY EITHER OTHER MORE LESS ALL ONTO DONE SAW DOES NOT WOULD COULD SHOULD ABOUT BECAUSE BECAME OFF EXCLUDE A AN ANOTHER AS AT BACK BE BEFORE BESIDES BETWEEN BY COME DO EWVEN HE HI HIMSELF IF IN IS IT JUST LIKE MANY MOST MUST MY NO OF ON ONE OR OUT S SAME SEE SINCE THOSE THROUGH TO TOO UP WAY WE WELL YOU BEVERLY LINDA DON’T DOING DOESN’T DOWN ABLE DEFINITELY PLANNING PLANNER PLANNERS I I’VE I’M YOU’VE YOU’RE ELSE GO GOOD GOING GUESS KNOW ME LOT NECESSARILY OKAY PHONE PLANNING REALLY THAT’S THAT THAT’LL THERE THERE’S THEY’RE THINK US WILL WE’VE AGAIN ACTUALLY GOD I’D MAYBE OH SURE TALK TELL THEY’VE WE’RE WHAT’S ‘OH ‘THIS ADD AM FAR YEAH YES YEA RIGHT EXACTLY O’LEARY ASKING SAYS BECAUSE CHAT COM ERIN FINE FIRST GREAT MEETINGS MSN OK SORRY SEND TRUE USED ALWAYS AREN ASK ASKED ASSISTANT BIT CALL COMES DEPEND DEPENDING DON ESSENTIALLY FOLLOWED HAPPEN HAPPENED HAPPENS HAVE K
112
L KATRINA M RE PERHAPS T VE WOW YOUNG HAVING MIGHT PM WATSON WATSONWYATT WOULDN WYATT ALMOST ALONG BRINGS DIDN EST GETTING GOTTEN MARLENE MEAN MOVING PLAN POSSIBLE POSSIBLY SENT WHETHER WANT ACROSS AGAINST BASICALLY BELIEVE COMING FIND FOUND FURTHER INC ITSELF KNOWING LET MARY OBVIOUSLY PUT SEEMS TRYING MYSELF MGMT PLANNED ‘TERM’ AMONG ETC EMAIL EXCELLENT GIVEN GIVING LINDALROBSON LEGALHOTEL ROBERT THANKS TRAVELADVOCATES ALREADY B BIBACK SANDY CURRENTLY IMAGINATIONMEETINGS BECAUSE C MEETING GIVES SAYING BEO EVENT INDUSTRY INCLUDE INCLUDES INCLUDED EVENTS CONSIDERED EVOLVES LOOKING LOOK LOOKS LOOKED APPROXIMATELY BASED NEED NEEDS AWAY COOKIES DEPENDS DINNER ENOUGH SCHOOL BAR POINT PULL REAL FALL INVOLVED PLANE VERSUS WORD EXITS FIRE HARD PART OCCUR PROVIDE APPROPRIATELY WITHOUT ACCORDINGLY WHOLE COUPLE DEAL NEVER CONTINUE COURSE PROBABLY SOMETIMES WORKS AMERICA APPLY

113
Appendix D – First Interview Dendograms Respondent #1 – First Interview 30 Words WARDS METHOD A S D O A I P D O N A E D H E P R A E C T L C D A R N W I E F O E U F M E E R U T L E U X R I W D E I I E E N I E R N V F M C T F A O S G M T E F M P A S A U R M T R S Y S G O F E E E I C E G P I A B E M I A E C K R C T E T T I T K A N L R C T D O C E L G N E N E N N R T S E A I . L I G H . T G U Y T H E M T . E N I R D N I . I I . N T F . E F N I . I . E T . I . E S . . . Z S E T T . E C . E I I . . I A N . V . N H . N . . . . . . A . E S I . N A . S O C . . E T G . E . C I . G . . . . . . T . S . O . C L . S N A . . D I . . . . E N . . . . . . . . I . . . N . E . . . . T . . . O . . . . . G . . . . . . . . O . . . . . . . . . . I . . . N . . . . . . . . . . . . . . N . . . . . . . . . . O . . . . . . . . . . . . . . . . . . . . . . . . . . . . . N . . . . . . . . . . . . . . . . . . . . . . . . . . . . . . . . . . . . . . . . . . . . . . . . . . . . . . . . . . . . . . . . . . . . . . . . . . . . . . . . . . . . . . . . . . . . . . ^^^ . . . . . . . . . . . . . . . . . . . . . . . . . . . . ^^^^^ . . . . . . . . . . . . . . . . . . . . . . . . . . . ^^^^^^^ . . . . . . . . . . . . . . . . . . . . . . . . . . ^^^^^^^^^ . . . . . . . . . . . . . . . . . . . . . . . . . ^^^^^^^^^^^ . . . . . . . . . . . . . . . . . . . ^^^ . . . ^^^^^^^^^^^ . . . . . . . . . . . . . . . . . . . ^^^^^ . . ^^^^^^^^^^^ . . . . . . . . . . . . . . . . . . . ^^^^^ ^^^ ^^^^^^^^^^^ . . . . . ^^^ . . . . . . . . . . . . ^^^^^ ^^^ ^^^^^^^^^^^ . . . . . ^^^ . . . . . ^^^ . . . . . ^^^^^ ^^^ ^^^^^^^^^^^ . . . . ^^^^^ . . . . . ^^^ . . . . . ^^^^^ ^^^ ^^^^^^^^^^^ . . . . ^^^^^ ^^^ . . . ^^^ . . . . . ^^^^^ ^^^ ^^^^^^^^^^^ . . . . ^^^^^ ^^^ . . . ^^^ ^^^ . . . ^^^^^ ^^^ ^^^^^^^^^^^ ^^^ . . ^^^^^ ^^^ . . . ^^^ ^^^ . . . ^^^^^ ^^^ ^^^^^^^^^^^ ^^^ . . ^^^^^ ^^^ . . . ^^^ ^^^ . . . ^^^^^^^^^ ^^^^^^^^^^^ ^^^ . . ^^^^^ ^^^ . . . ^^^ ^^^ . ^^^ ^^^^^^^^^ ^^^^^^^^^^^ ^^^ . . ^^^^^ ^^^ . ^^^ ^^^ ^^^ . ^^^ ^^^^^^^^^ ^^^^^^^^^^^ ^^^ . . ^^^^^ ^^^^^ ^^^ ^^^ ^^^ . ^^^ ^^^^^^^^^ ^^^^^^^^^^^ ^^^ . . ^^^^^ ^^^^^ ^^^^^^^ ^^^ . ^^^ ^^^^^^^^^ ^^^^^^^^^^^ ^^^^^ . ^^^^^ ^^^^^ ^^^^^^^ ^^^ . ^^^ ^^^^^^^^^ ^^^^^^^^^^^ ^^^^^^^ ^^^^^ ^^^^^ ^^^^^^^ ^^^ . ^^^ ^^^^^^^^^ ^^^^^^^^^^^ ^^^^^^^ ^^^^^ ^^^^^ ^^^^^^^ ^^^^^ ^^^ ^^^^^^^^^ ^^^^^^^^^^^ ^^^^^^^ ^^^^^^^^^^^ ^^^^^^^ ^^^^^ ^^^ ^^^^^^^^^ ^^^^^^^^^^^ ^^^^^^^ ^^^^^^^^^^^ ^^^^^^^ ^^^^^ ^^^^^^^^^^^^^ ^^^^^^^^^^^ ^^^^^^^ ^^^^^^^^^^^ ^^^^^^^^^^^^^ ^^^^^^^^^^^^^ ^^^^^^^^^^^ ^^^^^^^^^^^^^^^^^^^ ^^^^^^^^^^^^^ ^^^^^^^^^^^^^ ^^^^^^^^^^^ ^^^^^^^^^^^^^^^^^^^^^^^^^^^^^^^^^ ^^^^^^^^^^^^^ ^^^^^^^^^^^ ^^^^^^^^^^^^^^^^^^^^^^^^^^^^^^^^^^^^^^^^^^^^^^^ ^^^^^^^^^^^ ^^^^^^^^^^^^^^^^^^^^^^^^^^^^^^^^^^^^^^^^^^^^^^^^^^^^^^^^^^^

114
Respondent #2 – First Interview 30 Words WARDS METHOD A D E E E B D C E N S B L T C E E E S S T C C C D R T M C R R E D D X R E A F E O U O H A L M L A A H L O O I I E A O I E F U U P O F U F G M S S I N E P E F F I I M N F S R N N S A I C C E A I S E A E I S N C M L M E E N E P T F K M A T K . N A A R D N E C T T N . G E E O E G G G N A R E S I G R . . E T T I . I . T I H E . . L N Y N U U S T N A R . N E A . . . E I E . T . . V I S . . L T E T A A . S Y C E . O M C . . . D O N . I . . E N S . . A . E S R R . . . T N . L E T . . . . N C . O . . . G . . . T . S . D D . . . . T . O N S . . . . . E . N . . . . . . . I . . . . I . . . . . . G T . . . . . . . . . . . . . . . . O . . . . N . . . . . . Y . . . . . . . . . . . . . . . . . N . . . . G . . . . . . . . . . . . . . . . . . . . . . . . . . . . . . . . . . . . . . . . . . . . . . . . . . . . . . . . . . . . . . . . . . . . . . . . . . . . . . . . . . . . . . . . . . . . . . ^^^ . . . . . . . . . . . . . . . . . . . . . . . . . . . . ^^^^^ . . . . . . . . . . . . . . . . . . . . . . . . . . ^^^^^^^ . . . . . . . . . . . . . . . . . . . . . . . . . . ^^^^^^^^^ . . . . . . . . . . . . . . . . . . . . . . . . . ^^^^^^^^^^^ . . . . . . . . . . . . . . . . . . . . . . . ^^^^^^^^^^^^^ . . . . . . . . . . . . . . . . . . . . . . ^^^^^^^^^^^^^^^ . . . . . . . . . . . . . . . . . . . . . . ^^^^^^^^^^^^^^^^^ . . . . . . . . ^^^ . . . . . . . . . . . ^^^^^^^^^^^^^^^^^ . . . ^^^ . . . ^^^ . . . . . . . . . . . ^^^^^^^^^^^^^^^^^ . . . ^^^ ^^^ . ^^^ . . . . . . . . . . . ^^^^^^^^^^^^^^^^^ . . . ^^^ ^^^ ^^^^^ . . . . . . . . . . . ^^^^^^^^^^^^^^^^^ . . . ^^^ ^^^ ^^^^^ . ^^^ . . . . . . . . ^^^^^^^^^^^^^^^^^ . . ^^^^^ ^^^ ^^^^^ . ^^^ . . . . . . . . ^^^^^^^^^^^^^^^^^ . . ^^^^^ ^^^ ^^^^^ . ^^^ . . . . . . ^^^ ^^^^^^^^^^^^^^^^^ . . ^^^^^ ^^^ ^^^^^ . ^^^ . . . . ^^^ ^^^ ^^^^^^^^^^^^^^^^^ . ^^^^^^^ ^^^ ^^^^^ . ^^^ . . . . ^^^ ^^^ ^^^^^^^^^^^^^^^^^ . ^^^^^^^ ^^^ ^^^^^ . ^^^^^ . . . ^^^ ^^^ ^^^^^^^^^^^^^^^^^ . ^^^^^^^ ^^^ ^^^^^ . ^^^^^ . . . ^^^^^^^ ^^^^^^^^^^^^^^^^^ ^^^^^^^^^ ^^^ ^^^^^ . ^^^^^ . . . ^^^^^^^ ^^^^^^^^^^^^^^^^^ ^^^^^^^^^ ^^^ ^^^^^ . ^^^^^ . ^^^ ^^^^^^^ ^^^^^^^^^^^^^^^^^ ^^^^^^^^^ ^^^ ^^^^^^^ ^^^^^ . ^^^ ^^^^^^^ ^^^^^^^^^^^^^^^^^ ^^^^^^^^^ ^^^ ^^^^^^^ ^^^^^ ^^^^^ ^^^^^^^ ^^^^^^^^^^^^^^^^^ ^^^^^^^^^ ^^^ ^^^^^^^ ^^^^^^^^^^^ ^^^^^^^ ^^^^^^^^^^^^^^^^^ ^^^^^^^^^ ^^^ ^^^^^^^ ^^^^^^^^^^^^^^^^^^^ ^^^^^^^^^^^^^^^^^ ^^^^^^^^^^^^^ ^^^^^^^ ^^^^^^^^^^^^^^^^^^^ ^^^^^^^^^^^^^^^^^ ^^^^^^^^^^^^^^^^^^^^^ ^^^^^^^^^^^^^^^^^^^ ^^^^^^^^^^^^^^^^^ ^^^^^^^^^^^^^^^^^^^^^^^^^^^^^^^^^^^^^^^^^ ^^^^^^^^^^^^^^^^^ ^^^^^^^^^^^^^^^^^^^^^^^^^^^^^^^^^^^^^^^^^^^^^^^^^^^^^^^^^^^

115
Respondent #3 – First Interview 30 Words WARDS METHOD A A B K R T P A D C H D R F T E T G C L E T D S E S T E R L C C R I I H E N E E E I I I Y D H E I E X H E O X O E X E I T T O N S I O Y F R L F S N P U E N R A P I F M A M X P C F S U A D K N P T I T P F K A E C O E C S E N I E M E T E O E . A D . . G L H N A . E S N . A R R U T R G N O P T B R G . . L . . . S E I E I . R . C . T Y A M . I . I N L H O I N . . . . . . . . N . N . E . I . I . L S . E . T E E I O E I . . . . . . . . G . . . N . A . O . . T . N . I . S N K N Z . . . . . . . . . . . . T . L . N . . A . C . O . . G . C E . . . . . . . . . . . . . . . . . . . N . E . N . . . . E . . . . . . . . . . . . . . . . . . . . C . D . . . . . . . . . . . . . . . . . . . . . . . . . . . E . . . . . . . . . . . . . . . . . . . . . . . . . . . . . S . . . . . . . . . . . . . . . . . . . . . . . . . . . . . . . . . . . . . . . . . . . . . . . . . . . . . . . . . . . . . . . . . . . . . . . . . . ^^^ . . . . . . . . . . . . . . . . . . . . . . . . . . . . ^^^^^ . . . . . . . . . . . . . . . . . . . . . . . . . . ^^^^^^^ . . . . . . . . . . . . . . . . . . . . . . . . . . ^^^^^^^^^ . . . . . . . . . . . . . . . . . . . . . . . . ^^^^^^^^^^^ . . . . . . . . . . . . . . . . . . . . . . . . ^^^^^^^^^^^^^ . . . . . . . . . . . . . . . . . . . . . . ^^^^^^^^^^^^^^^ . . . . . . . . . . . . . . . . . . . . . . ^^^^^^^^^^^^^^^^^ . . . . . . . . . . . . . . . . . . . . . ^^^^^^^^^^^^^^^^^ . . . . . . . . . ^^^ . . . . . . . . . . ^^^^^^^^^^^^^^^^^ . . . . . . ^^^ . ^^^ . . . . . . . . . . ^^^^^^^^^^^^^^^^^ . . . . . . ^^^ . ^^^ . . . . ^^^ . . . . ^^^^^^^^^^^^^^^^^ . . ^^^ . . ^^^ . ^^^ . . . . ^^^ . . . . ^^^^^^^^^^^^^^^^^ . . ^^^ . . ^^^ . ^^^ . . . . ^^^ . ^^^ . ^^^^^^^^^^^^^^^^^ . . ^^^ . . ^^^ . ^^^ . . . . ^^^^^ ^^^ . ^^^^^^^^^^^^^^^^^ . . ^^^ . . ^^^ . ^^^ . . . . ^^^^^ ^^^^^ ^^^^^^^^^^^^^^^^^ . . ^^^ . . ^^^ . ^^^ ^^^ . . ^^^^^ ^^^^^ ^^^^^^^^^^^^^^^^^ . . ^^^ ^^^ ^^^ . ^^^ ^^^ . . ^^^^^ ^^^^^ ^^^^^^^^^^^^^^^^^ ^^^ ^^^ ^^^ ^^^ . ^^^ ^^^ . . ^^^^^ ^^^^^ ^^^^^^^^^^^^^^^^^ ^^^ ^^^ ^^^ ^^^^^ ^^^ ^^^ . . ^^^^^ ^^^^^ ^^^^^^^^^^^^^^^^^ ^^^ ^^^ ^^^ ^^^^^ ^^^ ^^^ ^^^ ^^^^^ ^^^^^ ^^^^^^^^^^^^^^^^^ ^^^^^^^ ^^^ ^^^^^ ^^^ ^^^ ^^^ ^^^^^ ^^^^^ ^^^^^^^^^^^^^^^^^ ^^^^^^^ ^^^ ^^^^^ ^^^^^^^ ^^^ ^^^^^ ^^^^^ ^^^^^^^^^^^^^^^^^ ^^^^^^^^^^^ ^^^^^ ^^^^^^^ ^^^ ^^^^^ ^^^^^ ^^^^^^^^^^^^^^^^^ ^^^^^^^^^^^^^^^^^ ^^^^^^^ ^^^ ^^^^^ ^^^^^ ^^^^^^^^^^^^^^^^^ ^^^^^^^^^^^^^^^^^ ^^^^^^^^^^^ ^^^^^ ^^^^^ ^^^^^^^^^^^^^^^^^ ^^^^^^^^^^^^^^^^^ ^^^^^^^^^^^ ^^^^^^^^^^^ ^^^^^^^^^^^^^^^^^ ^^^^^^^^^^^^^^^^^ ^^^^^^^^^^^^^^^^^^^^^^^ ^^^^^^^^^^^^^^^^^ ^^^^^^^^^^^^^^^^^^^^^^^^^^^^^^^^^^^^^^^^^ ^^^^^^^^^^^^^^^^^^^^^^^^^^^^^^^^^^^^^^^^^^^^^^^^^^^^^^^^^^^

116
Respondent #4 – First Interview 30 Words WARDS METHOD A S B P S D T K T A D P P S A I I C U E E S C D R D S O Z P C E I E U A I N H N E R E O S N N O N X X I O E I I O U O E T N G R C N M O I Y F O R M P T T N D A A T M F S F M T N O I S . C C G E W N T I P S E E E E C E M M U F I K F E S E P O E . E E E . L G H N E O B C R R I R P P A O N . E T I . L N . . P S R . E . I E R N O T N N S S L L T R I . R H D . E . . . T S . . D . N . . . D S A A E T E E I T T . E I E . . . . . I . . . G . G . . . Y . L T . A . S O . I . N N . . . . . . O . . . E . . . . . . . . I . N . . N . O . T G . . . . . . N . . . . . . . . . . . . O . D . . . . N . . . . . . . . . . . . . . . . . . . . . . N . . . . . . . . . . . . . . . . . . . . . . . . . . . . . A . . . . . . . . . . . . . . . . . . . . . . . . . . . . . L . . . . . . . . . . . . . . . . . . . . . . . . . . . . . . . . . . . . . . . . . . . . . . . . . . . . . . . . . . . . . . . . . . . . . . . . . . . . . . . . . . . . . . . . . . . . . . . . ^^^ . . . . . . . . . . . . . . . . . . . . . . . . . . . . ^^^^^ . . . . . . . . . . . . . . . . . . . . . . . . . . . ^^^^^^^ . . . . . . . . . . . . . . . . . . . . . . . . . . ^^^^^^^^^ . . . . . . . . . . . . . . . . . . . . . . . . ^^^^^^^^^^^ . . . . . . . . . . . . . . . . . . . . . . . . ^^^^^^^^^^^^^ . . . . . . . . . . . . . . . . . . . . . . . ^^^^^^^^^^^^^^^ . . . . . . . . . . . . . . . ^^^ . . . . . ^^^^^^^^^^^^^^^ . . . . . . . . . . . . . . . ^^^ . . ^^^ . ^^^^^^^^^^^^^^^ . . . . . . . . . . . . . . ^^^^^ . . ^^^ . ^^^^^^^^^^^^^^^ . . . ^^^ . . . . . . . . . ^^^^^ . . ^^^ . ^^^^^^^^^^^^^^^ . . . ^^^ . . ^^^ . . . . . ^^^^^ . . ^^^ . ^^^^^^^^^^^^^^^ ^^^ . ^^^ . . ^^^ . . . . . ^^^^^ . . ^^^ . ^^^^^^^^^^^^^^^ ^^^ . ^^^ . . ^^^ . . . ^^^ ^^^^^ . . ^^^ . ^^^^^^^^^^^^^^^ ^^^^^ ^^^ . . ^^^ . . . ^^^ ^^^^^ . . ^^^ . ^^^^^^^^^^^^^^^ ^^^^^ ^^^ . . ^^^ . . . ^^^ ^^^^^ ^^^ ^^^ . ^^^^^^^^^^^^^^^ ^^^^^^^^^ . . ^^^ . . . ^^^ ^^^^^ ^^^ ^^^ . ^^^^^^^^^^^^^^^ ^^^^^^^^^ ^^^ ^^^ . . . ^^^ ^^^^^ ^^^ ^^^ . ^^^^^^^^^^^^^^^ ^^^^^^^^^ ^^^ ^^^ . ^^^ ^^^ ^^^^^ ^^^ ^^^ . ^^^^^^^^^^^^^^^ ^^^^^^^^^ ^^^ ^^^ . ^^^ ^^^ ^^^^^ ^^^^^^^ . ^^^^^^^^^^^^^^^ ^^^^^^^^^^^^^ ^^^ . ^^^ ^^^ ^^^^^ ^^^^^^^ . ^^^^^^^^^^^^^^^ ^^^^^^^^^^^^^ ^^^ ^^^^^ ^^^ ^^^^^ ^^^^^^^ . ^^^^^^^^^^^^^^^ ^^^^^^^^^^^^^ ^^^ ^^^^^ ^^^ ^^^^^ ^^^^^^^^^ ^^^^^^^^^^^^^^^ ^^^^^^^^^^^^^ ^^^ ^^^^^^^^^ ^^^^^ ^^^^^^^^^ ^^^^^^^^^^^^^^^ ^^^^^^^^^^^^^^^^^ ^^^^^^^^^ ^^^^^ ^^^^^^^^^ ^^^^^^^^^^^^^^^ ^^^^^^^^^^^^^^^^^^^^^^^^^^^ ^^^^^ ^^^^^^^^^ ^^^^^^^^^^^^^^^ ^^^^^^^^^^^^^^^^^^^^^^^^^^^ ^^^^^^^^^^^^^^^ ^^^^^^^^^^^^^^^ ^^^^^^^^^^^^^^^^^^^^^^^^^^^^^^^^^^^^^^^^^^^ ^^^^^^^^^^^^^^^ ^^^^^^^^^^^^^^^^^^^^^^^^^^^^^^^^^^^^^^^^^^^^^^^^^^^^^^^^^^^

117
Respondent #5 – First Interview 30 Words WARDS METHOD A E K K P I T A W A D I N P A D B F E R S C D R M L S C E P N X I N E M H P O R A M E O R I E O X I O O E I A A M R X E A P N O R P I P R E N P G T E F V O A S M N F S N R A O A O L E D W S O N L K A G A A E A F E D M K E T I K A G L W M P Y R . L O R G I I . E C T N S E R . P S T R N . G E L D P L S I . E N T S E N . R T I T . R A . L . H O I . E . . . L E I E . D . A . S G . . . V I . E G . E . I L T . M . . . E . S N . G . N . . . . . . E A . N E . . . N . I . E . . . S . . C . E . T . . . . . . . L . T . . . . G . O . N . . . . . . E . . . . . . . . . . . . . . . . . . . . N . T . . . . . . . . . . . . . . . . . . . . . . . . . . . . . . . . . . . . . . . . . . . . . . . . . . . . . . . . . . . . . . . . . . . . . . . . . . . . . . . . . . . . . . . ^^^ . . . . . . . . . . . . . . . . . . . . . . . . . . . . ^^^^^ . . . . . . . . . . . . . . . . . . . . . . . . . . . ^^^^^^^ . . . . . . . . . . . . . . . . . . . . . . . . . . ^^^^^^^^^ . . . . . . . . . . . . . . . . . . . . . . . . ^^^^^^^^^^^ . . . . . . . . . . . . . . . . . . . . . . . . ^^^^^^^^^^^^^ . . . . . . . . . . . . . . . . . . . . . . . ^^^^^^^^^^^^^^^ . . ^^^ . . . . . . . . . . . . . . . . . . ^^^^^^^^^^^^^^^ . . ^^^ . . . . . . . . . . . . . . . . . . ^^^^^^^^^^^^^^^^^ . ^^^ . . . . . . . . . ^^^ . . . . . . . ^^^^^^^^^^^^^^^^^ . ^^^ . . . . . . . . ^^^^^ . . . . . . . ^^^^^^^^^^^^^^^^^ . ^^^ . . . . . . . . ^^^^^ . . ^^^ . . . ^^^^^^^^^^^^^^^^^ ^^^^^ . . . . . . . . ^^^^^ . . ^^^ . . . ^^^^^^^^^^^^^^^^^ ^^^^^ ^^^ . . . . . . ^^^^^ . . ^^^ . . . ^^^^^^^^^^^^^^^^^ ^^^^^ ^^^ . . . . . . ^^^^^ . . ^^^ . ^^^ ^^^^^^^^^^^^^^^^^ ^^^^^ ^^^ . . ^^^ . . ^^^^^ . . ^^^ . ^^^ ^^^^^^^^^^^^^^^^^ ^^^^^ ^^^ . . ^^^ . . ^^^^^ ^^^ ^^^ . ^^^ ^^^^^^^^^^^^^^^^^ ^^^^^ ^^^ . . ^^^ . ^^^^^^^ ^^^ ^^^ . ^^^ ^^^^^^^^^^^^^^^^^ ^^^^^ ^^^ . . ^^^ . ^^^^^^^ ^^^ ^^^ ^^^^^ ^^^^^^^^^^^^^^^^^ ^^^^^^^^^ . . ^^^ . ^^^^^^^ ^^^ ^^^ ^^^^^ ^^^^^^^^^^^^^^^^^ ^^^^^^^^^ . . ^^^^^ ^^^^^^^ ^^^ ^^^ ^^^^^ ^^^^^^^^^^^^^^^^^ ^^^^^^^^^ ^^^ ^^^^^ ^^^^^^^ ^^^ ^^^ ^^^^^ ^^^^^^^^^^^^^^^^^ ^^^^^^^^^ ^^^ ^^^^^ ^^^^^^^ ^^^^^^^ ^^^^^ ^^^^^^^^^^^^^^^^^ ^^^^^^^^^^^^^ ^^^^^ ^^^^^^^ ^^^^^^^ ^^^^^ ^^^^^^^^^^^^^^^^^ ^^^^^^^^^^^^^ ^^^^^^^^^^^^^ ^^^^^^^ ^^^^^ ^^^^^^^^^^^^^^^^^ ^^^^^^^^^^^^^ ^^^^^^^^^^^^^ ^^^^^^^^^^^^^ ^^^^^^^^^^^^^^^^^ ^^^^^^^^^^^^^ ^^^^^^^^^^^^^^^^^^^^^^^^^^^ ^^^^^^^^^^^^^^^^^ ^^^^^^^^^^^^^^^^^^^^^^^^^^^^^^^^^^^^^^^^^ ^^^^^^^^^^^^^^^^^ ^^^^^^^^^^^^^^^^^^^^^^^^^^^^^^^^^^^^^^^^^^^^^^^^^^^^^^^^^^^

118
Respondent #6 – First Interview 30 Words WARDS METHOD A A C T S P L M R A L E R S A B D D A F T H I C S E E E L L C T O H O E I A I N I V I O R R E I W O R O N O E V X X I E C T N I M O A J S T T E S M E O F F A R A P C M N E A P S A U A T N E P B O K I T R K E A A I F R M I E E M S R M E T R R C I G B L I R . C L Y S T S D N E E A N . N O E Y P R . N A K N S O E L . . I E T . H . . I R . L I . T N . B L I . . T . G . D . I . . P . H . I . . T E . . N . I . . O E E . . E . E . Y . T . . A . I . N . . I N . . G . V . . D S N . . . . N . . . Y . . T . N . G . . O C . . . . E . . Y . C . . . . C . . . . . . E . G . . . . N E . . . . . . . . . E . . . . Y . . . . . . . . . . . . . . S . . . . . . . . . . . . . . . . . . . . . . . . . . . . . . . . . . . . . . . . . . . . . . . . . . . . . . . . . . . . . . . . . . . . . . . . . . ^^^ . . . . . . . . . . . . . . . . . . . . . . . . . . . . ^^^^^ . . . . . . . . . . . . . . . . . . . . . . . . . . . ^^^^^^^ . . . . . . . . . . . . . . . . . . . . . . . . . . ^^^^^^^^^ . . . . . . . . . . . . . . . . . . . . . . . . . ^^^^^^^^^^^ . . . . . . . . . . . . . . . . . . . . . . . ^^^^^^^^^^^^^ . . . . . . . . . . . . . . . . . . . . . . ^^^^^^^^^^^^^^^ . . . . . . . . . . . . . . . . . . . . . . ^^^^^^^^^^^^^^^^^ . . . . . . . . . . . . . . . . . . . . . ^^^^^^^^^^^^^^^^^ . . . . . . . . . . ^^^ . . . . . . . . . ^^^^^^^^^^^^^^^^^ . . . . . . . . . . ^^^ . . ^^^ . . . . . ^^^^^^^^^^^^^^^^^ . . . . . . ^^^ . . ^^^ . . ^^^ . . . . . ^^^^^^^^^^^^^^^^^ . . . ^^^ . ^^^ . . ^^^ . . ^^^ . . . . . ^^^^^^^^^^^^^^^^^ . . . ^^^ . ^^^ . . ^^^ . . ^^^ . ^^^ . . ^^^^^^^^^^^^^^^^^ . . . ^^^ . ^^^^^ . ^^^ . . ^^^ . ^^^ . . ^^^^^^^^^^^^^^^^^ . . . ^^^ ^^^^^^^ . ^^^ . . ^^^ . ^^^ . . ^^^^^^^^^^^^^^^^^ . . . ^^^ ^^^^^^^ . ^^^ ^^^ ^^^ . ^^^ . . ^^^^^^^^^^^^^^^^^ . . . ^^^ ^^^^^^^ . ^^^ ^^^ ^^^ . ^^^^^ . ^^^^^^^^^^^^^^^^^ ^^^ . ^^^ ^^^^^^^ . ^^^ ^^^ ^^^ . ^^^^^ . ^^^^^^^^^^^^^^^^^ ^^^ ^^^^^ ^^^^^^^ . ^^^ ^^^ ^^^ . ^^^^^ . ^^^^^^^^^^^^^^^^^ ^^^ ^^^^^ ^^^^^^^ . ^^^ ^^^ ^^^ . ^^^^^^^ ^^^^^^^^^^^^^^^^^ ^^^ ^^^^^ ^^^^^^^ ^^^^^ ^^^ ^^^ . ^^^^^^^ ^^^^^^^^^^^^^^^^^ ^^^ ^^^^^ ^^^^^^^ ^^^^^^^^^ ^^^ . ^^^^^^^ ^^^^^^^^^^^^^^^^^ ^^^ ^^^^^ ^^^^^^^ ^^^^^^^^^ ^^^ ^^^^^^^^^ ^^^^^^^^^^^^^^^^^ ^^^^^^^^^ ^^^^^^^ ^^^^^^^^^ ^^^ ^^^^^^^^^ ^^^^^^^^^^^^^^^^^ ^^^^^^^^^ ^^^^^^^ ^^^^^^^^^ ^^^^^^^^^^^^^ ^^^^^^^^^^^^^^^^^ ^^^^^^^^^^^^^^^^^ ^^^^^^^^^ ^^^^^^^^^^^^^ ^^^^^^^^^^^^^^^^^ ^^^^^^^^^^^^^^^^^ ^^^^^^^^^^^^^^^^^^^^^^^ ^^^^^^^^^^^^^^^^^ ^^^^^^^^^^^^^^^^^^^^^^^^^^^^^^^^^^^^^^^^^ ^^^^^^^^^^^^^^^^^^^^^^^^^^^^^^^^^^^^^^^^^^^^^^^^^^^^^^^^^^^

119
Respondent #7 – First Interview 30 Words WARDS METHOD A T A C C S D T D E I E F A P C A M B D E L O C D P R S N U C H M O O P E E E X L D O D A O V I A E X E T I E R I E E N T I O N N E F R F A L U R D S M O S D R P A H R F O S N G F U N R C C C I M I M U C M I T M I T . I E R E C I B K S A O A G P E I I N . N P S A A T . O D A . V R N R U N A . E T R L S H P S F I . E L T T L I . N . K . E I . S M E B . . I E . . O T E I T . . E R I . O . . . E . D E . . S D I . . V S . . U . . C I . . S A O . N . . . S . . N . . T . L . . E E . . S . . . O . . . T N . . . . . . . . C . . A . I . . . E . . . . . . N . . . E . . . . . . . . . E . . N . T . . . N . . . . . . . . . . . . . . . . . . . . . . . C . Y . . . . . . . . . . . . . . . . . . . . . . . . . . . E . . . . . . . . . . . . . . . . . . . . . . . . . . . . . S . . . . . . . . . . . . . . . . . . . . . . . . . . . . . . . . . . . . . . . . . . . . . . . . . . . . . . . . . . . . . . . . . . . . . . . . . . . . . . . . . . . . . . . . . . . ^^^ . . . . . . . . . . . . . . . . . . . . . . . . . . . ^^^^^ . . . . . . . . . . . . . . . . . . . . . . . . . . . ^^^^^^^ . . . . . . . . . . . . . . . . . . . . . . . . . . ^^^^^^^^^ . . . . . . . . . . . . . . . . . . . . . . . . ^^^^^^^^^^^ . . . . . . . . . . . . . . . . . . . . . . . . ^^^^^^^^^^^^^ . . . . . . ^^^ . . . . . . . . . . . . . . . ^^^^^^^^^^^^^ . . . . . . ^^^ . . . . . . . . ^^^ . . . . . ^^^^^^^^^^^^^ . . . . . . ^^^ ^^^ . . . . . . ^^^ . . . . . ^^^^^^^^^^^^^ . . . . ^^^ ^^^ ^^^ . . . . . . ^^^ . . . . . ^^^^^^^^^^^^^ . . . . ^^^ ^^^ ^^^ . ^^^ . . . ^^^ . . . . . ^^^^^^^^^^^^^ . . ^^^ ^^^ ^^^ ^^^ . ^^^ . . . ^^^ . . . . . ^^^^^^^^^^^^^ . . ^^^ ^^^ ^^^ ^^^ . ^^^ ^^^ . ^^^ . . . . . ^^^^^^^^^^^^^ . . ^^^ ^^^ ^^^ ^^^^^ ^^^ ^^^ . ^^^ . . . . . ^^^^^^^^^^^^^ ^^^ ^^^ ^^^ ^^^ ^^^^^ ^^^ ^^^ . ^^^ . . . . . ^^^^^^^^^^^^^ ^^^ ^^^ ^^^ ^^^ ^^^^^ ^^^ ^^^^^ ^^^ . . . . . ^^^^^^^^^^^^^ ^^^ ^^^ ^^^ ^^^ ^^^^^ ^^^ ^^^^^ ^^^ ^^^ . . . ^^^^^^^^^^^^^ ^^^ ^^^ ^^^ ^^^ ^^^^^ ^^^ ^^^^^ ^^^ ^^^ . ^^^ ^^^^^^^^^^^^^ ^^^ ^^^ ^^^ ^^^ ^^^^^ ^^^ ^^^^^^^^^ ^^^ . ^^^ ^^^^^^^^^^^^^ ^^^ ^^^ ^^^ ^^^ ^^^^^ ^^^ ^^^^^^^^^ ^^^ ^^^^^ ^^^^^^^^^^^^^ ^^^^^^^ ^^^ ^^^ ^^^^^ ^^^ ^^^^^^^^^ ^^^ ^^^^^ ^^^^^^^^^^^^^ ^^^^^^^ ^^^^^^^ ^^^^^ ^^^ ^^^^^^^^^ ^^^ ^^^^^ ^^^^^^^^^^^^^ ^^^^^^^ ^^^^^^^ ^^^^^ ^^^ ^^^^^^^^^^^^^ ^^^^^ ^^^^^^^^^^^^^ ^^^^^^^ ^^^^^^^ ^^^^^^^^^ ^^^^^^^^^^^^^ ^^^^^ ^^^^^^^^^^^^^ ^^^^^^^ ^^^^^^^ ^^^^^^^^^ ^^^^^^^^^^^^^^^^^^^ ^^^^^^^^^^^^^ ^^^^^^^ ^^^^^^^^^^^^^^^^^ ^^^^^^^^^^^^^^^^^^^ ^^^^^^^^^^^^^ ^^^^^^^^^^^^^^^^^^^^^^^^^ ^^^^^^^^^^^^^^^^^^^ ^^^^^^^^^^^^^ ^^^^^^^^^^^^^^^^^^^^^^^^^^^^^^^^^^^^^^^^^^^^^ ^^^^^^^^^^^^^ ^^^^^^^^^^^^^^^^^^^^^^^^^^^^^^^^^^^^^^^^^^^^^^^^^^^^^^^^^^^

120
Respondent #8 – First Interview 30 Words WARDS METHOD A P F I P C D G L B S D L E P I M O P L T L M D R E S E H D T H A D E U I E E R E E E X O D A R E I H O O E I X A F A I T Y C E R L F N V O N F G P L E N D O A I S N F S A F F R S E S T A S T F E E A S I A E I N A E P B N E E I K M E E M O N I O . O U E R L D E N L R C T G R L L G . Y N . P T C . R D C R . N R R A . . . E . I Y I E . E E S . . I . L Y T . D E A S . . A E L . . . . . E . F M . . . . . . T . E . . . E E L . . . L N . . . . . . N . Y E . . . . . . I . . . . . R S . . . . . T . . . . . . C . . N . . . . . . O . . . . . . . . . . . . . . . . . . . E . . T . . . . . . N . . . . . . . . . . . . . . . . . . . . . . . . . . . . . . . . . . . . . . . . . . . . . . . . . . . . . . . . . . . . . . . . . . . . . . . . . . . . . . . . . . . . . . . . . ^^^ . . . . . . . . . . . . . . . . . . . . . . . . . . . . ^^^^^ . . . . . . . . . . . . . . . . . . . . . . . . . . . ^^^^^^^ . . . . . . . . . . . . . . . . . . . . . . . . . . ^^^^^^^^^ . . . . . . . . . . . . . . . . . . . . . . . . . ^^^^^^^^^^^ . . . . . . . . . . . . . . . . . . . . . . . . ^^^^^^^^^^^^^ . . . . . ^^^ . . . . . . . . . . . . . . . . ^^^^^^^^^^^^^ . . . . . ^^^^^ . . . . . . . . . . . . . . . ^^^^^^^^^^^^^ . . . . . ^^^^^ . . . ^^^ . . . . . . . . . . ^^^^^^^^^^^^^ . . . ^^^ ^^^^^ . . . ^^^ . . . . . . . . . . ^^^^^^^^^^^^^ . . . ^^^ ^^^^^ . ^^^ ^^^ . . . . . . . . . . ^^^^^^^^^^^^^ . . . ^^^ ^^^^^ . ^^^ ^^^ . . . . . . . . ^^^ ^^^^^^^^^^^^^ . . . ^^^ ^^^^^^^ ^^^ ^^^ . . . . . . . . ^^^ ^^^^^^^^^^^^^ . . . ^^^ ^^^^^^^ ^^^ ^^^ ^^^ . . . . . . ^^^ ^^^^^^^^^^^^^ . . . ^^^ ^^^^^^^ ^^^ ^^^ ^^^ . ^^^ . . . ^^^ ^^^^^^^^^^^^^ . . . ^^^ ^^^^^^^ ^^^ ^^^ ^^^ ^^^^^ . . . ^^^ ^^^^^^^^^^^^^ . . . ^^^ ^^^^^^^ ^^^ ^^^ ^^^ ^^^^^ . ^^^ ^^^ ^^^^^^^^^^^^^ . . . ^^^ ^^^^^^^ ^^^ ^^^^^^^ ^^^^^ . ^^^ ^^^ ^^^^^^^^^^^^^ . . . ^^^ ^^^^^^^ ^^^ ^^^^^^^ ^^^^^^^ ^^^ ^^^ ^^^^^^^^^^^^^ ^^^ . ^^^ ^^^^^^^ ^^^ ^^^^^^^ ^^^^^^^ ^^^ ^^^ ^^^^^^^^^^^^^ ^^^ ^^^^^ ^^^^^^^ ^^^ ^^^^^^^ ^^^^^^^ ^^^ ^^^ ^^^^^^^^^^^^^ ^^^^^^^^^ ^^^^^^^ ^^^ ^^^^^^^ ^^^^^^^ ^^^ ^^^ ^^^^^^^^^^^^^ ^^^^^^^^^ ^^^^^^^ ^^^^^^^^^^^ ^^^^^^^ ^^^ ^^^ ^^^^^^^^^^^^^ ^^^^^^^^^ ^^^^^^^ ^^^^^^^^^^^ ^^^^^^^^^^^ ^^^ ^^^^^^^^^^^^^ ^^^^^^^^^^^^^^^^^ ^^^^^^^^^^^ ^^^^^^^^^^^ ^^^ ^^^^^^^^^^^^^ ^^^^^^^^^^^^^^^^^ ^^^^^^^^^^^ ^^^^^^^^^^^^^^^ ^^^^^^^^^^^^^ ^^^^^^^^^^^^^^^^^ ^^^^^^^^^^^^^^^^^^^^^^^^^^^ ^^^^^^^^^^^^^ ^^^^^^^^^^^^^^^^^^^^^^^^^^^^^^^^^^^^^^^^^^^^^ ^^^^^^^^^^^^^ ^^^^^^^^^^^^^^^^^^^^^^^^^^^^^^^^^^^^^^^^^^^^^^^^^^^^^^^^^^^

121
Appendix E – Announcement Letter Dear [FirstName] Event planners are in a unique position in that they work with suppliers, organizations, and participants to produce an experience that will be enjoyed by all. A large part of an event planner's responsibility centers around risk, yet no research has been done asking them what they see as risky. You are invited to participate in a 10 minute on-line survey that will investigate what event planners perceive as risky. This study is being conducted by Linda Robson, under the supervision of Dr. Stephen Smith, of the Recreation & Leisure Studies Department, University of Waterloo, Ontario, Canada. This results of this research will be used to assist in developing tools and strategies for risk management plans. The voluntary on-line survey can be accessed through the following link: https://www.surveymonkey.com/s.aspx In order to further protect your privacy you will need to enter the password “risky” to begin the survey. If you have any questions, please feel free to contact Linda Robson ([email protected]). This study has been reviewed by, and received ethics clearance through, the Office of Research Ethics, University of Waterloo, Ontario, Canada. Thank you for your time, Linda https://www.surveymonkey.com/optout.aspx

122
Appendix F – Survey Instrument

123

124

125

126

127

128

129

130

131

132

133
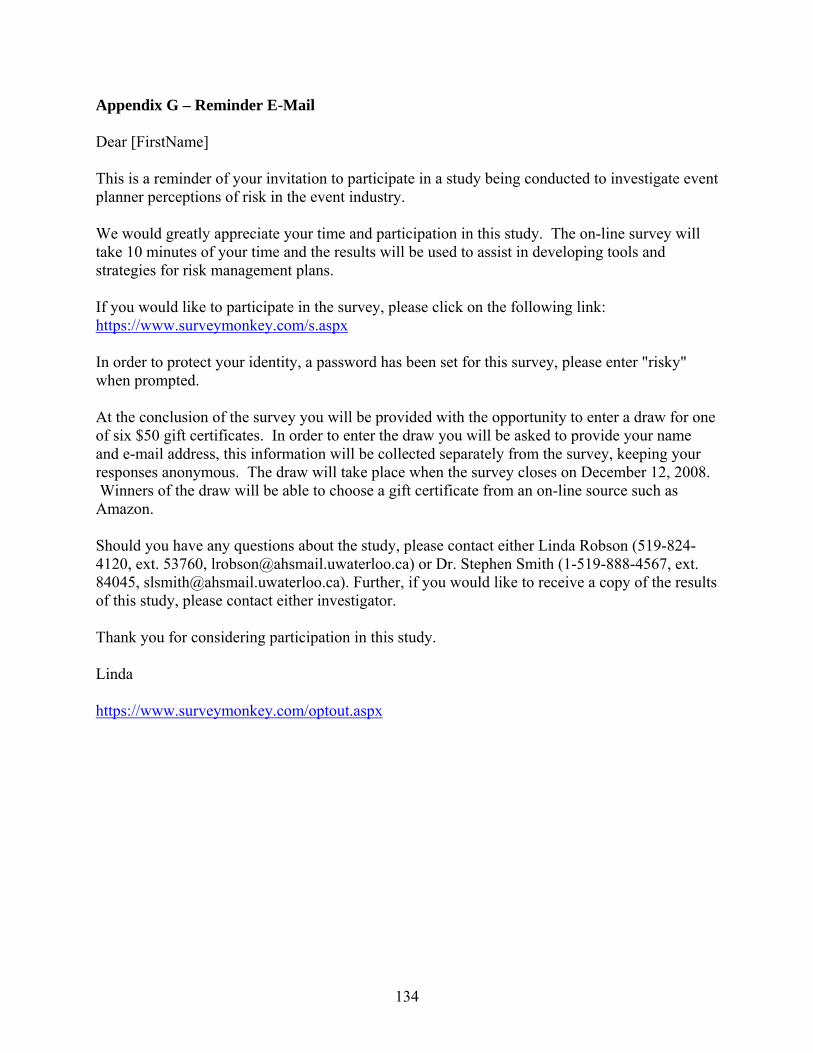
134
Appendix G – Reminder E-Mail Dear [FirstName] This is a reminder of your invitation to participate in a study being conducted to investigate event planner perceptions of risk in the event industry. We would greatly appreciate your time and participation in this study. The on-line survey will take 10 minutes of your time and the results will be used to assist in developing tools and strategies for risk management plans. If you would like to participate in the survey, please click on the following link: https://www.surveymonkey.com/s.aspx In order to protect your identity, a password has been set for this survey, please enter "risky" when prompted. At the conclusion of the survey you will be provided with the opportunity to enter a draw for one of six $50 gift certificates. In order to enter the draw you will be asked to provide your name and e-mail address, this information will be collected separately from the survey, keeping your responses anonymous. The draw will take place when the survey closes on December 12, 2008. Winners of the draw will be able to choose a gift certificate from an on-line source such as Amazon. Should you have any questions about the study, please contact either Linda Robson (519-824-4120, ext. 53760, [email protected]) or Dr. Stephen Smith (1-519-888-4567, ext. 84045, [email protected]). Further, if you would like to receive a copy of the results of this study, please contact either investigator. Thank you for considering participation in this study. Linda https://www.surveymonkey.com/optout.aspx

135
Appendix H – Regression Tables
Model Summaryb
Model R R Square
Adjusted R
Square
Std. Error of the
Estimate Durbin-Watson
1 .213a .045 .022 .65614 1.853
a. Predictors: (Constant), both, EU, Yrs of Experience, formal, Gender, USA, ind
b. Dependent Variable: Food and Beverage
ANOVAb
Model Sum of Squares df Mean Square F Sig.
1 Regression 5.798 7 .828 1.924 .066a
Residual 122.267 284 .431
Total 128.065 291
a. Predictors: (Constant), both, EU, Yrs of Experience, formal, Gender, USA, ind
b. Dependent Variable: Food and Beverage
Coefficientsa
Model
Unstandardized
Coefficients
Standardized
Coefficients
t Sig.
Correlations
B Std. Error Beta Zero-order Partial Part
1 (Constant) 1.620 .155 10.469 .000
Gender .139 .108 .084 1.292 .197 .149 .076 .075
Yrs of
Experience
-.004 .005 -.047 -.761 .447 -.049 -.045 -.044
USA -.126 .095 -.089 -1.328 .185 -.016 -.079 -.077
EU -.182 .103 -.127 -1.773 .077 -.140 -.105 -.103
ind .085 .102 .064 .836 .404 .042 .050 .048
formal -4.150E-5 .156 .000 .000 1.000 -.043 .000 .000
both .186 .144 .093 1.291 .198 .090 .076 .075

136
Coefficientsa
Model
Unstandardized
Coefficients
Standardized
Coefficients
t Sig.
Correlations
B Std. Error Beta Zero-order Partial Part
1 (Constant) 1.620 .155 10.469 .000
Gender .139 .108 .084 1.292 .197 .149 .076 .075
Yrs of
Experience
-.004 .005 -.047 -.761 .447 -.049 -.045 -.044
USA -.126 .095 -.089 -1.328 .185 -.016 -.079 -.077
EU -.182 .103 -.127 -1.773 .077 -.140 -.105 -.103
ind .085 .102 .064 .836 .404 .042 .050 .048
formal -4.150E-5 .156 .000 .000 1.000 -.043 .000 .000
both .186 .144 .093 1.291 .198 .090 .076 .075
a. Dependent Variable: Food and Beverage
Model Summaryb
Model R R Square
Adjusted R
Square
Std. Error of the
Estimate Durbin-Watson
1 .122a .015 -.009 .65295 2.077
a. Predictors: (Constant), both, EU, Yrs of Experience, formal, Gender, USA, ind
b. Dependent Variable: Transportation
ANOVAb
Model Sum of Squares df Mean Square F Sig.
1 Regression 1.837 7 .262 .615 .743a
Residual 121.081 284 .426
Total 122.918 291
a. Predictors: (Constant), both, EU, Yrs of Experience, formal, Gender, USA, ind
b. Dependent Variable: Transportation

137
Coefficientsa
Model
Unstandardized
Coefficients
Standardized
Coefficients
t Sig.
Correlations
B Std. Error Beta Zero-order Partial Part
1 (Constant) 2.186 .154 14.197 .000
Gender -.011 .107 -.007 -.106 .916 -.012 -.006 -.006
Yrs of
Experience
-.003 .005 -.040 -.643 .521 -.045 -.038 -.038
USA -.044 .094 -.032 -.467 .641 -.041 -.028 -.028
EU -.010 .102 -.007 -.094 .925 .019 -.006 -.006
ind -.063 .102 -.048 -.624 .533 -.095 -.037 -.037
formal .148 .155 .064 .955 .341 .084 .057 .056
both .074 .143 .038 .515 .607 .051 .031 .030
a. Dependent Variable: Transportation
Model Summaryb
Model R R Square
Adjusted R
Square
Std. Error of the
Estimate Durbin-Watson
1 .156a .024 .000 .67010 2.005
a. Predictors: (Constant), both, EU, Yrs of Experience, formal, Gender, USA, ind
b. Dependent Variable: Contracts
ANOVAb
Model Sum of Squares df Mean Square F Sig.
1 Regression 3.129 7 .447 .996 .435a
Residual 125.282 279 .449
Total 128.411 286
a. Predictors: (Constant), both, EU, Yrs of Experience, formal, Gender, USA, ind
b. Dependent Variable: Contracts

138
Coefficientsa
Model
Unstandardized
Coefficients
Standardized
Coefficients
t Sig.
Correlations
B Std. Error Beta Zero-order Partial Part
1 (Constant) 2.150 .160 13.409 .000
Gender -.082 .111 -.049 -.740 .460 -.008 -.044 -.044
Yrs of
Experience
-.002 .006 -.026 -.412 .681 -.041 -.025 -.024
USA .105 .097 .073 1.075 .284 .113 .064 .064
EU -.122 .105 -.084 -1.154 .250 -.091 -.069 -.068
ind -.115 .106 -.085 -1.082 .280 -.017 -.065 -.064
formal -.200 .161 -.084 -1.242 .215 -.053 -.074 -.073
both -.111 .148 -.055 -.749 .455 -.021 -.045 -.044
a. Dependent Variable: Contracts
Model Summaryb
Model R R Square
Adjusted R
Square
Std. Error of the
Estimate Durbin-Watson
1 .177a .031 .007 .67520 2.010
a. Predictors: (Constant), both, EU, Yrs of Experience, formal, Gender, USA, ind
b. Dependent Variable: Financial
ANOVAb
Model Sum of Squares df Mean Square F Sig.
1 Regression 4.103 7 .586 1.286 .257a
Residual 126.283 277 .456
Total 130.386 284
a. Predictors: (Constant), both, EU, Yrs of Experience, formal, Gender, USA, ind
b. Dependent Variable: Financial
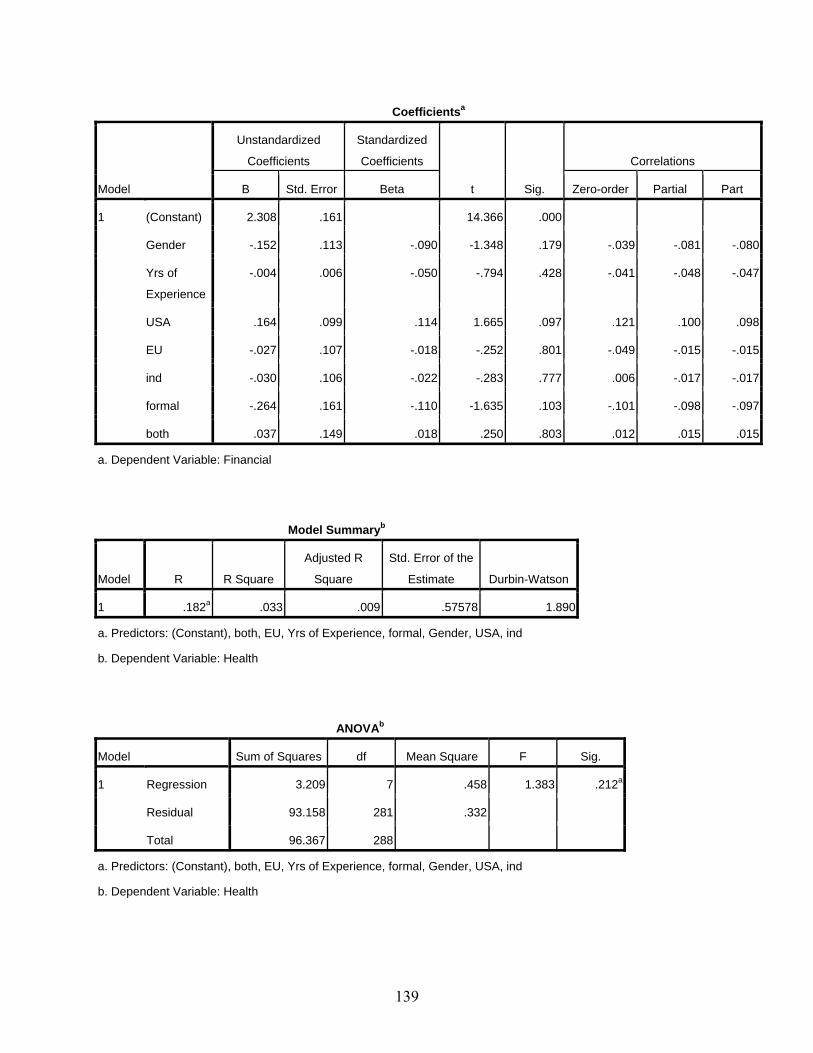
139
Coefficientsa
Model
Unstandardized
Coefficients
Standardized
Coefficients
t Sig.
Correlations
B Std. Error Beta Zero-order Partial Part
1 (Constant) 2.308 .161 14.366 .000
Gender -.152 .113 -.090 -1.348 .179 -.039 -.081 -.080
Yrs of
Experience
-.004 .006 -.050 -.794 .428 -.041 -.048 -.047
USA .164 .099 .114 1.665 .097 .121 .100 .098
EU -.027 .107 -.018 -.252 .801 -.049 -.015 -.015
ind -.030 .106 -.022 -.283 .777 .006 -.017 -.017
formal -.264 .161 -.110 -1.635 .103 -.101 -.098 -.097
both .037 .149 .018 .250 .803 .012 .015 .015
a. Dependent Variable: Financial
Model Summaryb
Model R R Square
Adjusted R
Square
Std. Error of the
Estimate Durbin-Watson
1 .182a .033 .009 .57578 1.890
a. Predictors: (Constant), both, EU, Yrs of Experience, formal, Gender, USA, ind
b. Dependent Variable: Health
ANOVAb
Model Sum of Squares df Mean Square F Sig.
1 Regression 3.209 7 .458 1.383 .212a
Residual 93.158 281 .332
Total 96.367 288
a. Predictors: (Constant), both, EU, Yrs of Experience, formal, Gender, USA, ind
b. Dependent Variable: Health

140
Coefficientsa
Model
Unstandardized
Coefficients
Standardized
Coefficients
t Sig.
Correlations
B Std. Error Beta Zero-order Partial Part
1 (Constant) 1.698 .136 12.449 .000
Gender .098 .095 .068 1.035 .302 .079 .062 .061
Yrs of
Experience
.001 .005 .017 .268 .789 .005 .016 .016
USA -.202 .084 -.163 -2.406 .017 -.106 -.142 -.141
EU -.126 .091 -.101 -1.390 .166 -.039 -.083 -.082
ind -.097 .091 -.083 -1.070 .286 -.036 -.064 -.063
formal -.162 .137 -.079 -1.178 .240 -.051 -.070 -.069
both -.015 .128 -.009 -.117 .907 .069 -.007 -.007
a. Dependent Variable: Health
Model Summaryb
Model R R Square
Adjusted R
Square
Std. Error of the
Estimate Durbin-Watson
1 .205a .042 .018 .66409 1.968
a. Predictors: (Constant), both, EU, Yrs of Experience, formal, Gender, USA, ind
b. Dependent Variable: Alcohol
ANOVAb
Model Sum of Squares df Mean Square F Sig.
1 Regression 5.384 7 .769 1.744 .099a
Residual 122.160 277 .441
Total 127.544 284
a. Predictors: (Constant), both, EU, Yrs of Experience, formal, Gender, USA, ind
b. Dependent Variable: Alcohol

141
Coefficientsa
Model
Unstandardized
Coefficients
Standardized
Coefficients
t Sig.
Correlations
B Std. Error Beta Zero-order Partial Part
1 (Constant) 1.575 .158 9.968 .000
Gender .088 .109 .053 .806 .421 .099 .048 .047
Yrs of
Experience
.004 .006 .047 .754 .452 .009 .045 .044
USA .087 .097 .061 .896 .371 .121 .054 .053
EU -.213 .105 -.147 -2.030 .043 -.177 -.121 -.119
ind -.092 .105 -.069 -.880 .379 -.034 -.053 -.052
formal .048 .159 .020 .300 .764 .012 .018 .018
both .020 .146 .010 .137 .891 .051 .008 .008
a. Dependent Variable: Alcohol
Model Summaryb
Model R R Square
Adjusted R
Square
Std. Error of the
Estimate Durbin-Watson
1 .216a .047 .023 .58869 1.953
a. Predictors: (Constant), both, EU, Yrs of Experience, formal, Gender, USA, ind
b. Dependent Variable: Terrorism
ANOVAb
Model Sum of Squares df Mean Square F Sig.
1 Regression 4.747 7 .678 1.957 .061a
Residual 96.688 279 .347
Total 101.436 286
a. Predictors: (Constant), both, EU, Yrs of Experience, formal, Gender, USA, ind
b. Dependent Variable: Terrorism

142
Coefficientsa
Model
Unstandardized
Coefficients
Standardized
Coefficients
t Sig.
Correlations
B Std. Error Beta Zero-order Partial Part
1 (Constant) 1.062 .141 7.523 .000
Gender .106 .098 .071 1.079 .282 .024 .064 .063
Yrs of
Experience
.009 .005 .117 1.893 .059 .106 .113 .111
USA .251 .086 .197 2.916 .004 .114 .172 .170
EU .193 .093 .150 2.071 .039 .038 .123 .121
ind .059 .093 .049 .633 .527 .004 .038 .037
formal .173 .141 .082 1.230 .220 .028 .073 .072
both .127 .130 .072 .976 .330 .030 .058 .057
a. Dependent Variable: Terrorism
Model Summaryb
Model R R Square
Adjusted R
Square
Std. Error of the
Estimate Durbin-Watson
1 .149a .022 -.002 .61363 1.982
a. Predictors: (Constant), both, EU, Yrs of Experience, formal, Gender, USA, ind
b. Dependent Variable: Accidents
ANOVAb
Model Sum of Squares df Mean Square F Sig.
1 Regression 2.434 7 .348 .923 .489a
Residual 106.563 283 .377
Total 108.997 290
a. Predictors: (Constant), both, EU, Yrs of Experience, formal, Gender, USA, ind
b. Dependent Variable: Accidents

143
Coefficientsa
Model
Unstandardized
Coefficients
Standardized
Coefficients
t Sig.
Correlations
B Std. Error Beta Zero-order Partial Part
1 (Constant) 1.677 .145 11.584 .000
Gender -.047 .101 -.031 -.467 .641 .002 -.028 -.027
Yrs of
Experience
.005 .005 .058 .927 .355 .056 .055 .055
USA .001 .089 .001 .012 .991 .020 .001 .001
EU -.126 .096 -.096 -1.313 .190 -.077 -.078 -.077
ind -.036 .096 -.030 -.382 .703 -.054 -.023 -.022
formal .037 .146 .017 .255 .799 .008 .015 .015
both .169 .135 .092 1.258 .210 .109 .075 .074
a. Dependent Variable: Accidents
Model Summaryb
Model R R Square
Adjusted R
Square
Std. Error of the
Estimate Durbin-Watson
1 .229a .052 .029 .63123 2.022
a. Predictors: (Constant), both, EU, Yrs of Experience, formal, Gender, USA, ind
b. Dependent Variable: Weather and/or Natural Hazards
ANOVAb
Model Sum of Squares df Mean Square F Sig.
1 Regression 6.246 7 .892 2.239 .031a
Residual 113.162 284 .398
Total 119.408 291
a. Predictors: (Constant), both, EU, Yrs of Experience, formal, Gender, USA, ind
b. Dependent Variable: Weather and/or Natural Hazards

144
Coefficientsa
Model
Unstandardized
Coefficients
Standardized
Coefficients
t Sig.
Correlations
B Std. Error Beta Zero-order Partial Part
1 (Constant) 1.537 .149 10.325 .000
Gender .124 .104 .078 1.197 .232 .124 .071 .069
Yrs of
Experience
.006 .005 .073 1.195 .233 .053 .071 .069
USA .180 .091 .132 1.972 .050 .164 .116 .114
EU -.080 .099 -.058 -.808 .420 -.155 -.048 -.047
ind .053 .098 .041 .544 .587 .071 .032 .031
formal -.070 .150 -.031 -.465 .642 -.088 -.028 -.027
both .108 .138 .056 .781 .436 .048 .046 .045
a. Dependent Variable: Weather and/or Natural Hazards
Model Summaryb
Model R R Square
Adjusted R
Square
Std. Error of the
Estimate Durbin-Watson
1 .195a .038 .014 .61202 1.961
a. Predictors: (Constant), both, EU, Yrs of Experience, formal, Gender, USA, ind
b. Dependent Variable: People
ANOVAb
Model Sum of Squares df Mean Square F Sig.
1 Regression 4.182 7 .597 1.595 .137a
Residual 106.004 283 .375
Total 110.186 290
a. Predictors: (Constant), both, EU, Yrs of Experience, formal, Gender, USA, ind
b. Dependent Variable: People

145
Coefficientsa
Model
Unstandardized
Coefficients
Standardized
Coefficients
t Sig.
Correlations
B Std. Error Beta Zero-order Partial Part
1 (Constant) 1.714 .145 11.863 .000
Gender .073 .101 .048 .724 .470 .075 .043 .042
Yrs of
Experience
.001 .005 .010 .157 .875 .017 .009 .009
USA -.116 .089 -.088 -1.305 .193 -.072 -.077 -.076
EU -.077 .096 -.058 -.808 .420 -.042 -.048 -.047
ind -.006 .095 -.005 -.067 .947 -.061 -.004 -.004
formal .006 .146 .003 .044 .965 -.016 .003 .003
both .274 .134 .148 2.039 .042 .170 .120 .119
a. Dependent Variable: People
Model Summaryb
Model R R Square
Adjusted R
Square
Std. Error of the
Estimate Durbin-Watson
1 .148a .022 -.002 .57514 2.010
a. Predictors: (Constant), both, EU, Yrs of Experience, formal, Gender, USA, ind
b. Dependent Variable: Crime
ANOVAb
Model Sum of Squares df Mean Square F Sig.
1 Regression 2.086 7 .298 .901 .506a
Residual 93.612 283 .331
Total 95.698 290
a. Predictors: (Constant), both, EU, Yrs of Experience, formal, Gender, USA, ind
b. Dependent Variable: Crime

146
Coefficientsa
Model
Unstandardized
Coefficients
Standardized
Coefficients t Sig. Correlations

147
Bibliography Abbey, James R. & Link, Carl K. (1994). The convention and meetings sector – its operation
and research needs. In J.R. Brent Ritchie and Charles S. Goeldner (eds), Travel, tourism, and hospitality research. A handbook for managers and researchers (pp. 273-284). Toronto: John Wiley & Sons.
Agrusa, Jerome F., Maples, Glenn, Kitterlin, Miranda, & Tanner, John R. (2008). Sensation
seeking, culture, and the valuation of experiential services. Event Management, 11(3), 121-128.
Allen, Johnny, O’Toole, William, McDonnell, Ian, & Harris, Robert. (2002). Festival and
special event management, 2nd edition. Australia: John Wiley & Sons Australia, Ltd. Althaus, Catherine E. (2005). A disciplinary perspective on the epistemological status of risk.
Risk Analysis, 25(3), 567-588. Arifiin, Ahmad Azmi M. (2008). Understanding novelty-seeking behavior in meeting tourism:
a measurement development approach. Event Management, 11(4), 179-190. Babbie, Earl, Halley, Fred, Zaino, Jeanne. (2007). Adventures in social research. Data analysis
using SPSS 14.0 and 15.0 for Windows. Thousand Oaks, CA: Pine Forge Press. Boger Jr., Carl A., Varghese, Nigi and Rittapirom, Somruethai “Dew”. (2005). The impact of
the September 11 attacks on airline arrivals and conventions in nine major U.S. cities. Journal of Convention & Event Tourism, Vol 7(2), 21-41.
Boholm, Asa. (1998). Comparative studies of risk perception: a review of twenty years of
research. Journal of Risk Research, 1(2), 135-163. Carlson, Jack. (Dec 1995). Gathering information: meetings and conventions sector research in
Australia. Journal of Tourism Studies, 6(2), 21-29. Clarke, Lee, & Short Jr., James F. (1993). Social organization and risk: some controversies.
Annual Review of Sociology, 19, 375-399. Cohen, Erik. (1979). A phenomenology of tourist experiences. Sociology, 13, 179-201. Cole, Gerald A., & Withey, Stephen B. (1981). Perspectives on risk perceptions. Risk
Analysis,1(2), 143-163. Convention Industry Council. (2007). APEX. Retrieved from
http://www.conventionindustry.org/apex/accepted.htm Council on Hotel, Restaurant, and Institutional Education (CHRIE). (2006). Guide to college
programs in hospitality, tourism & culinary arts, 9th edition. Richmond, Virginia: International CHRIE.

148
Creswell, John W. (2003). Research design. Qualitative, quantitative, and mixed methods
approaches. 2nd edition. Sage Publications, London. Dann, Graham, Nash, Dennison, & Pearce, Philip. (1988). Methodology in tourism research.
Annals of Tourism Research, 15, 1-28. Diamond, Craig. (2001). What’s in a meeting? These days, lots of new answers. Meeting
News. Retrieved from http://www.meetingnews.com. Dillman, Don A. (May 2002). Navigating the rapids of change: some observations on survey
methodology in the early 21st century. Retrieved August 30, 2007, from http://survey.sesrc.wsu.edu/dillman/papers.htm
Dillman, Don A. (2007). Mail and internet surveys. The tailored design method. 2nd edition.
2007 update with new internet, visual, and mixed-mode guide. New Jersey: John Wiley & Sons, Inc.
Dwyer, Larry (2002). Economic contribution of convention tourism: Conceptual and empirical
issues. In Karin Weber and Kye-Sung Chon (eds), Convention tourism. International research and industry perspectives (pp. 21-35). New York: Haworth Hospitality Press.
EPMS. (2009). Event risk management. Retrieved from: http://www-
personal.usyd.edu.au/~wotoole/EPMS_Control. Event Management Body of Knowledge (EMBOK). (2007). An introduction. Retrieved from
http://www.embok.org. Event Management. (2007). Table of contents. Retrieved from
http://www.cognizantcommunication.com/filecabinet/EventManagement. Faro, David, Rottenstreich, Yuval. (2006). Affect, empathy, and regressive mispredictions of
others’ preferences under risk. Management Science, 52(4), 529-541. Fenich, George G (2005). Meetings, expositions, events, and conventions. An introduction to
the industry. New Jersey: Pearson Prentice Hall. Festival Management & Event Tourism. (2007). Table of contents. Retrieved from
htp://www.cognizantcommunication.com/filecabinet/EventManagement. Finn, Mick, Elliott White, Martin, & Walton, Mike. (2000). Tourism and leisure research
methods. Data collection, analysis, and interpretation. Toronto, CA: Pearson Education. Fink, Arlene. (2003). The survey handbook, volume 1, 2nd edition. The survey kit, 2nd edition.
Thousand Oaks, CA: Sage.

149
Finucane, Melissa L., Slovic, Paul, Mertz, C.K., Flynn, James, and Satterfield, Theresa A. (2000). Gender, race, and perceived risk: the ‘white male’ effect, in Health, Risk, and Society, 2(2). 159-172.
Fischhoff, Baruch, de Bruin, Wandi Bruine, Perrin, Wendy, Downs, Julie. (2004). “Travel
Risks in a Time of Terror: Judgments and Choices”, in Risk Analysis, Vol 24, No. 5. 1301-1309.
Flynn, James, Slovic, Paul, Mertz, C.K. (1994). Gender, race, and perception of environmental
health risks, in Risk Analysis, 14(6). 1101-1108. Formica, Sandro. (1998). The development of festivals and special events studies. Festival
Management and Event Tourism, 15, 131-137. Fowler Jr., Floyd J. (2002). Survey research methods, 3rd edition. Applied Social Research
Methods Series. Volume 1. Thousand Oaks, CA: Sage. Froot, Kenneth A., Scharfstein, David, S., and Stein, Jeremy C. (1994). A framework for risk
management. Journal of Applied Corporate Finance, 7(3), 22-32. Galloway, Graeme, Mitchell, Richard, Getz, Don, Crouch, Geoffrey, & Ong, Ben. (2008).
Sensation seeking and the prediction of attitudes and behaviours of wine tourists. Tourism Management, 29(5), 950-966.
Gardner, Dan. (2008). Risk. Why we fear the things we shouldn’t – and put ourselves in greater
danger. Toronto, Canada: McClelland & Steward Ltd. George Washington University Tourism. (2007). Department of Hospitality and Tourism.
Retrieved from http://www.gwutourism.org George Washington University. (2008). Event and meeting management. Retrieved from
http://www.gwutourism.org/em.htm Getz, Donald (1997). Event management and event tourism. New York: Cognizant
Communication. Getz, Donald. (2000). Developing a research agenda for the event management field. In John
Allen, Robert Harris, Leo K. Jago, and A.J. Veal (eds), Events Beyond 2000: Setting the Agenda. Proceedings of Conference on Event Evaluation, Research and Education (pp. 10-21). Sydney: Australian Centre for Event Management.
Getz, Donald. (2003). Bidding on events: identifying event selection criteria and critical
success factors. Journal of Convention & Exhibition Management, 5(2), 1-24. Getz, Donald. (2007). Event studies. Theory, research, and policy for planned events. New
York: Elsevier.

150
Glaser, Barney G. (1978). Advances in the methodology of grounded theory. Theoretical
sensitivity. California: The Sociology Press. Glaser, Barney G. & Strauss, Anselm L. (1967). The discovery of grounded theory. Strategies
for qualitative research. New York: Aldine de Gruyter. Go, Frank, Govers, Robert, Vliegenthart, Anton M. (2002). Planning and development issues
for the convention industry. In In Karin Weber and Key-Sung Chon (eds), Convention Tourism. International Research and Industry Perspectives (pp. 37-55). New York: Haworth Hospitality Press.
Goeldner, Charles R. and Ritchie, J.R. Brent (2003). Tourism, principles, practices,
philosophies, 9th edition. New Jersey: John Wiley & Sons. Goldblatt, Joe. (2008). Special events. The roots and wings of celebration. 5th Edition.
Hoboken, New Jersey: John Wiley & Sons, Inc. Goldblatt, Joe. (2000). A future for event management: the analysis of major trends impacting
the emerging profession. In John Allen, Robert Harris, Leo K. Jago, and A.J. Veal (eds), Events Beyond 2000: Setting the Agenda. Proceedings of Conference on Event Evaluation, Research and Education (pp. 2-9). Sydney: Australian Centre for Event Management.
Goldblatt, Joe and Hu, Clark. (2005). Tourism, terrorism and the new world for event leaders.
e-Review of Tourism Research (eRTR), 3(6), 139-144. Goldblatt, Joe & Nelson, Kathleen S. (eds) (2001). The international dictionary of event
management, 2nd edition. Toronto, CA: John Wiley & Sons, Inc. Grimaldi, Lisa (2004). 2004 international meeting planner survey. M&C Global Planner. May
2004, 2-20. Grimaldi, Lisa (Ed). (2005) 2005 international meeting planner survey. M&C 2005 Global
Planner. April 2005, 1-24. Gustafson, Per E. (1998). Gender differences in risk perception: theoretical and methodological
perspectives, in Risk Analysis, 18(6). 805-811. Harrill, Rich & Potts, Thomas D. (2002). Social psychological theories of tourist motivation:
exploration, debate, and transition. Tourism Analysis, 7, 105-114. Health Canada. Canada’s New Government Announces New Goals for Smoking Rates. (2007).
Retrieved from http:// http://www.hc-sc.gc.ca/ahc-asc/media/nr-cp/_2007/2007_106-eng.php.

151
Huan, Tzung-Cheng, Beaman, Jay, & Shelby, Lori. (2004). No-escape natural disaster. Mitigating impacts on tourism. Annals of Tourism Research, 31(2), 255-273.
Human Resources and Social Development Canada. (2008). Career handbook, 2nd edition.
Retrieved from: http://www.23.hrdc-drhc.gc.ca/ch/e/docs/ch_index_search_results.asp?index_search_type=noc_code&noc=1226&referer-gro
International Congress & Convention Association (ICCA). (April 2005). Secure event
management advice and checklists for better protected international meetings. UK: ICCA.
International Special Event Society (ISES). (2007). About ISES. Retrieved from
http://www.ises.com/about/index.cfm#history. Ito, Suzanne. (2001). Event security tips: keeping guests safe. BizBash: Ideas and Resources
for Special Events and Meetings. Retrieved December 14, 2005, from http://bizbash.com/content/editorial.
Johnson, Branden B. (1993). Advancing understanding of knowledge’s role in lay risk
perception. Retrieved from www.piercelaw.edu/risk/vol14/summer/johnson.html Journal of Convention & Event Tourism. (2007). Contents page. Retrieved from
http://www.haworthpress.com/store/product.asp?sid=UR8R278F3M138GQM8EDQ8MFG8DB598AB&sku=J452&detail=TOCList#TOCList.
Kaplan, Leon B., Szybillo, George J., & Jacoby, Jacob. (1974). Components of perceived risk
in product purchase: a cross-validation. Journal of Applied Psychology, 59(3), 287-291. Kegley, Charles W. (ed). (2003). The new global terrorism. Characteristics, causes, controls.
New Jersey: Prentice Hall. Ladkin, Adele (2002). Research issues and challenges for the convention industry. In Karin
Weber and Kye-Sung Chon (eds). Convention tourism. International research and industry perspectives (pp. 101-118). New York: Haworth Hospitality Press.
Law, Rob. (2006). The perceived impact of risks on travel decisions. International Journal of
Tourism Research, 8, 289-300. Lee, Myong Jae & Back, Ki-Joon (2005). A review of convention and meeting management
research 1990-2003: identification of statistical methods and subject areas. Journal of Convention & Event Tourism, 7(2), 1-20.
Lee, T.H., & Crompton, J. (1992). Measuring novelty seeking in tourism, Annals of Tourism
Research, 19, 732-751.

152
Lepp, Andrew, & Gibson, Heather. (2008). Sensation seeking and tourism: tourist role, perception of risk and destination choice. Tourism Management, 29(4), 740-750.
Linsley, Colin, Linsley, Christine. (2008). Impact of the Sarbanes-Oxley Act upon
management: a behavioural discussion. Managerial Auditing, 23(4), 313-327. MPI. (2007). Vision and mission. Retrieved from
http://www.mpiweb.org/CMS/mpiweb/mpicontent.aspx?id=40. MPI. (2008). Facts and figures. Retrieved from
http://www.mpiweb.org/cms/mpiweb/mpicontent.aspx?id=18992 MacCallum, R. C.; Widaman, K. F., Preacher, K. J., and Hong, S. 2001. Sample size in factor
analysis: The role of model error. Multivariate Behavioral Research 36, 611-637. Mansfeld, Yoel. (1992). From motivation to actual travel. Annals of Tourism Research, 19,
399-419. MacLaurin, Don & Wykes, Ted (eds). (2003). Meetings and conventions: a planning guide.
Mississauga, CA: Meeting Professionals International. March, James G., and Shaprio, Zur. (1987). Managerial perspectives on risk and risk taking.
Management Science, 33(11), 1404-1418). Meeting Professionals International and American Express. (2007). Future Watch 2007. A
Comparative Outlook on the Global Business of Meetings. Retrieved from http://www.mpiweb.org/CMS/uploadedFiles/Research_and_Whitepapers/2007%20FutureWatch%20Small.pdf
Miller, Kent D. (1992). A framework for integrated risk management in international business.
Journal of International Business Studies, 23(2), 311-331. Ministry of Civil Defence & Emergency Management. (2003). Safety planning guidelines for
events. Wellington, New Zealand: Ministry of Civil Defence & Emergency Management. Montgomery, Rhonda J. & Strick, Sandra K. (1995). Meetings, conventions and expositions.
An introduction to the industry. New York, NY: Van Nostrand Reinhold. Nardi, Peter M. (2006). Doing survey research. A guide to quantitative methods. 2nd edition.
New York, NY: Pearson. Natural Resources Canada. (2008). The European Union. Retrieved from
http://atlas.nrcan.gc.ca/site/english/maps/reference/legends/eu_legend.html/document)view.

153
Nelson, Peter (2004). The World Quest Forum: Planning for the New Challenges of International Meetings, Summary of World Quest Forum. Washington, D.C.
Olympic Museum Lausanne. (2002). The Olympic games in Ancient Greece. Retrieved from
http://www.multimedia.olympic.org/pdf/en_report_658.pdf Oppermann, Martin and Chon, Kye-Sung (1997). “Convention Participation Decision-Making
Process”, in Annals of Tourism Research, Vol. 24, No. 1. 178-191. PCMA. (2007). PCMA History. Retrieved from http://www.pcma.org/source/about. Reisinger, Yvette, & Mavondo, Felix. (Feb. 2005). Travel anxiety and intentions to travel
internationally: implications of travel risk perception. Journal of Travel Research, 43, 212-225.
Renn, Ortwin. (1998). Three decades of risk research: accomplishments and new challenges.
Journal of Risk Research, 1(1), 49-71. Riley, Roger. (1996). Revealing socially constructed knowledge through quasi-structured
interviews and grounded theory analysis. Recent Advances in Tourism Marketing, 21-40. Rippl, Susanne. (2002). Cultural theory and risk perception: a proposal for a better
measurement. Journal of Risk Research 5(2), 147-165. Roehl, Wesley S., & Fesenmaier, Daniel R. (Spring 1992). Risk perceptions and pleasure
travel: an exploratory analysis. Journal of Travel Research, 30(4), 17-26. Rogers, George O. (1997). The dynamics of risk perception: how does perceived risk respond
to risk events? Risk Analysis, 17(6), 745-757. Rogers, Tony. (2003). Conferences and conventions. A global industry. Boston, MA:
Butterworth Heinemann. Rutherford Silvers, Julia. (2008). Risk Management for Meetings and Events. Burlington, MA:
Butterworth-Heinemann. Rutherford Silvers, Julia. (2009). EMBOK Proposed Knowledge Domain Structure. Retrieved
from: http://www.juliasilvers.com/embok.htm Ryerson University. (2008). Event management certificate program. Retrieved from
http://www.ryerson.ca/tedrogersschool/htm/eventmgmt SCIRUS. (2007). Search page. Retrieved from
http://ww.scirus.com.proxy.lib.uwaterloo.ca/srsapp Sjoberg, Lennart. (2000a). Factors in risk perception. Risk Analysis, 20(1), 1-11.

154
Sjoberg, Lennart. (2000b). The Methodology of Risk Perception Research. Quality and
Quantity 34, 407-418. Slovic, Paul (ed). (2000). The perception of risk. London: Earthscan. Slovic, Paul, Finucane, Melissa, Peters, Ellen, & MacGregor, Donald. (2004). Risk as analysis
and risk as feelings: some thoughts about affect, reason, risk and rationality. Risk Analysis, 24(2), 311-322.
Slovic, P., Fischhoff, B., Lichtenstein, Sarah, & Roe, F.J.C. (April 30, 1981). Perceived risk:
psychological factors and social implications [and discussion]. In Proceedings of the Royal Society of London, Series A, Mathematical and Physical Sciences, Vol 376, No. 1764. (pp. 17-34).
Slovic, Paul, Fischhoff, Baruch, & Lichtenstein, Sarah. (1982). Why study risk perception?
Risk Analysis, 2(2), 82-93. Sonmez, Sevil F., & Graefe, Alan R. (1998a). Determining future travel behavior from past
travel experience and perceptions of risk and safety. Journal of Travel Research, Vol. 37, 171-177.
Sonmez, Sevil F., & Graefe, Alan R. (1998b). Influence of terrorism risk on foreign tourism
decisions. Annals of Tourism Research, 25(1), 112-144. Spiller, Julie (2002). History of convention tourism. In Karin Weber and Kye-Sung Chon (eds).,
Convention tourism. International research and industry perspectives (pp. 3-22). New York: Haworth Hospitality Press.
Spindel, Marla & Tesdahl, Ben. (2005). Holding conferences in an age of terror and natural
disasters: what you should know when planning your organization’s next conference. Retrieved September 8, 2005, from http://by102fd.bay102.hotmail.msn.com/cgi-bin.
Starr, Chauncey (19 September 1969). Social benefit versus technological risk. What is our
society willing to pay for safety? Science, 165, 1232-1238. Sturken, Cheryl-Anne. (2005). In case of emergency. What you need to know about crisis
planning and event insurance. Meetings & Conventions, 40 (12), 63-67. Tarlow, Peter (2002a). Event risk management and safety. New York: John Wiley & Sons, Inc. Tarlow, Peter (2002b). Tourism in the twenty-first century. Futurist, Sept 2002, 36(5), 48-51. Tarlow, Peter. (2004). Tourism risk. e-Review of Tourism Research (eRTR), 2(3), 11-13.

155
Tarlow, Peter (2005). Terrorism and tourism. e-Review of Tourism Research (eRTR), 3(5), 18-21. Retrieved from http://ertr.tamu.edu/appliedresearch.cfm
Taylor-Gooby, Peter, & Zinn, Jens O. (2006). Current directions in risk research: new
developments in psychology and sociology. Risk Analysis, 26(2), 397-411. Thompson, Michael, Ellis, Richard, & Wildavsky, Aaron. (1990). Cultural theory. San
Francisco: Westview Press. Tierney, Kathleen J. (1999). Toward a critical sociology of risk. Sociological Forum, 14(2),
215-242. Toohey, Kristine, Taylor, Tracy. (2008). Mega events, fear, and risk: terrorism at the Olympic
Games. Journal of Sport Management, 22. 451-469. Trimpop, Rudiger M. (1994). The psychology of risk taking behavior. Amsterdam, the
Netherlands: Elsevier Science. Tsaur, Sheng-Hshiung, Tzeng, Gwo-Hshiung, & Wang, Kuo-Ching. (1997). Evaluating tourist
risks from fuzzy perspectives. Annals of Tourism Research, 24(4), 796-812. United Nations World Tourism Organization (UNWTO). (2006). Measuring the economic
importance of the meetings industry – developing a tourism satellite account extension. Madrid, Spain: World Tourism Organization.
Veal, A.J. (2006). Research methods for leisure and tourism. A practical guide. 3rd edition.
England: Pearson. Weber, Karin & Chon, Kye-Sung (2002). Trends and key issues for the convention industry in
the twenty-first century. In Karin Weber and Kye-Sung Chon (eds)., Convention tourism. International research and industry perspectives (pp. 203-212). New York: Haworth Hospitality Press.
Woelfel, Joseph & Stoyanoff, N.J. (September 1998). CATPAC: A neural network for
qualitative analysis of text. Paper presented at annual meeting of the Australian Marketing Association, Melbourne, Australia.
Yang, Jacky. (2003). The war may have scared leisure travelers, but certainly not meeting
planners. e-Review of Tourism Research (eRTR), 1(1), 41-42. Yates, J. Frank (ed). (1992). Risk taking behavior. Toronto: John Wiley and Sons. Yoo, Joanne Jung-Eun & Weber, Karin. (May 2005). Progress in convention tourism research.
Journal of Hospitality and Tourism Research, 29(2), 194-222.


![[Robson] 4. Dualidade](https://static.fdocuments.net/doc/165x107/5597c5341a28abba098b4613/robson-4-dualidade.jpg)
