Perceptions of Risk: an Experimental Approach using Internet...
35
Perceptions of Risk: an Experimental Approach using Internet Questionnaires by Frank A Cowell and Guillermo Cruces London School of Economics and Political Science Discussion Paper Distributional Analysis Research Programme No. DARP 70 The Toyota Centre May 2003 Suntory and Toyota International Centres for Economics and Related Disciplines London School of Economics and Political Science Houghton Street London WC2A 2AE Tel.:020-7955 6678 This research was supported by the Centre for Analysis of Risk and Regulation, LSE. The paper has benefited from comments by Lupin Rahman, and the comments of seminar participants at STICERD (LSE) and RID (Paris).
Transcript of Perceptions of Risk: an Experimental Approach using Internet...
Perceptions of Risk: an Experimental Approach using Internet Questionnaires
by
Frank A Cowell and Guillermo Cruces London School of Economics and Political Science
Discussion Paper Distributional Analysis Research Programme No. DARP 70 The Toyota Centre May 2003 Suntory and Toyota International Centres for Economics and Related Disciplines London School of Economics and Political Science Houghton Street London WC2A 2AE
Tel.:020-7955 6678 This research was supported by the Centre for Analysis of Risk and Regulation, LSE. The paper has benefited from comments by Lupin Rahman, and the comments of seminar participants at STICERD (LSE) and RID (Paris).

Distributional Analysis Research Programme The Distributional Analysis Research Programme was established in 1993 with funding from the Economic and Social Research Council. It is located within the Suntory and Toyota International Centres for Economics and Related Disciplines (STICERD) at the London School of Economics and Political Science. The programme is directed by Frank Cowell. The Discussion Paper series is available free of charge and most papers are downloadable from the website. To subscribe to the DARP paper series, or for further information on the work of the Programme, please contact our Research Secretary, Sue Coles on:
Telephone: UK+20 7955 6678 Fax: UK+20 7955 6951 Email: [email protected] Web site: http://sticerd.lse.ac.uk/DARP
Abstract
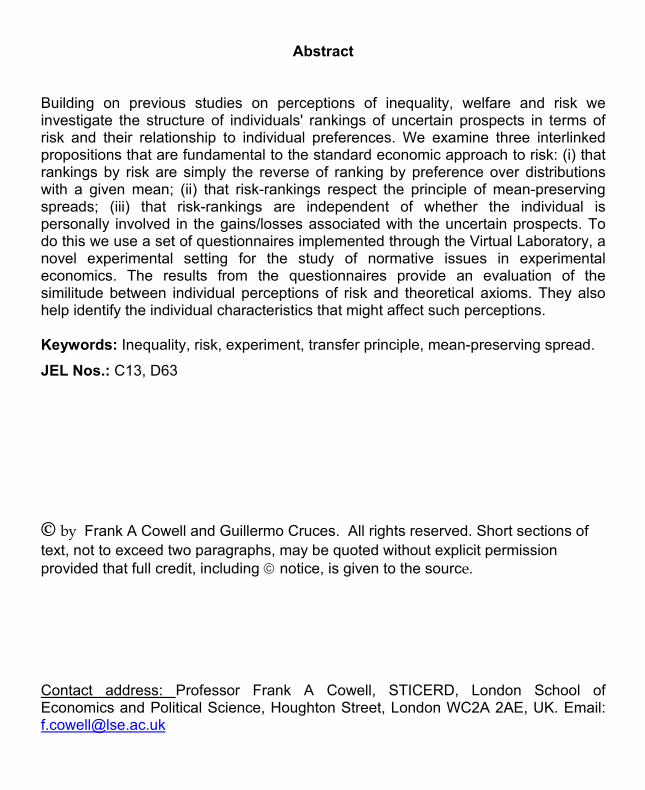
Building on previous studies on perceptions of inequality, welfare and risk we investigate the structure of individuals' rankings of uncertain prospects in terms of risk and their relationship to individual preferences. We examine three interlinked propositions that are fundamental to the standard economic approach to risk: (i) that rankings by risk are simply the reverse of ranking by preference over distributions with a given mean; (ii) that risk-rankings respect the principle of mean-preserving spreads; (iii) that risk-rankings are independent of whether the individual is personally involved in the gains/losses associated with the uncertain prospects. To do this we use a set of questionnaires implemented through the Virtual Laboratory, a novel experimental setting for the study of normative issues in experimental economics. The results from the questionnaires provide an evaluation of the similitude between individual perceptions of risk and theoretical axioms. They also help identify the individual characteristics that might affect such perceptions. Keywords: Inequality, risk, experiment, transfer principle, mean-preserving spread.
JEL Nos.: C13, D63
© by Frank A Cowell and Guillermo Cruces. All rights reserved. Short sections of text, not to exceed two paragraphs, may be quoted without explicit permission provided that full credit, including notice, is given to the source.
Contact address: Professor Frank A Cowell, STICERD, London School of Economics and Political Science, Houghton Street, London WC2A 2AE, UK. Email: [email protected]

1 IntroductionThis paper brings together economic theory and innovative methodology inorder to focus on some key questions that lie at the heart of the theoryof choice under uncertainty. We investigate the structure of individuals’rankings of uncertain prospects in terms of risk and their relationship toindividual preferences. Specifically, we examine three interlinked propositionsthat are fundamental to the standard economic approach to risk:
1. that rankings by risk are simply the reverse of ranking by preferenceover distributions with a given mean;
2. that risk-rankings respect the principle of mean-preserving spreads;
3. that risk-rankings are independent of whether the individual is person-ally involved in the gains/losses associated with the uncertain prospects.
To address these issues we use questionnaire-experiments, building onprevious studies on perceptions of inequality, risk and welfare. While theuse of experiments in economics has progressed rapidly in recent decades,mainly in the study of markets and individual interactions, similar workon normative economics and the study of preferences is still comparativelyrare. The literature described in Amiel and Cowell (1999) developed anoriginal experimental setting for studying the empirical validity of inequalitymeasurement axioms. We extend this technique in a number of ways.The basic intuition is that the agents’ personal judgements may not be
captured adequately by conventional theory. The benchmarks against whichthe axioms are compared are the perceptions and judgements from responsesto carefully specified questionnaire experiments. The use of such experimen-tal techniques is a valuable tool for investigating the structure of individual’sjudgments about distributions of outcomes in terms of welfare, risk and un-certainty. While previous studies focused mainly upon whether responsesconform to standard axioms of inequality analysis, it is our aim to extendthe approach to cover the main assumptions of risk theory.The results from the questionnaires provide an evaluation of the differ-
ences and similarities between individual perceptions of risk and theoreticalaxioms with respect to the three questions we outlined above. The exper-imental results also help identify specific response patterns and systematicdifferences in the determinants of attitudes toward risk in terms of observablecharacteristics of the respondents. This will assist in developing an approachto risk in economics that is based on evidence rather than assumptions ofmathematical convenience.
1

We implement our questionnaire experiments through the Virtual Labo-ratory, a novel web-based experimental tool for the study of normative issuesand preferences in economics. The use of the Virtual Laboratory representsan important methodological development in the field, providing researcherswith a new facility that supersedes the paper questionnaires on which previ-ous research was based.The paper is organised as follows. Section 2 starts with a brief discus-
sion of the theoretical background in terms of basic principles and previousresearch on the issue. Section 3 contains a description of our experimentalsetup, reviews the content of the experiment, and illustrates the advantagesof the novel experimental methodology employed here. Finally, in Section 4we present some results from the questionnaires we administered to a set ofstudents. Conclusions follow.
2 Theory and backgroundIn recent years experimental methods in economics have been extended to theanalysis of income distributions (Amiel and Cowell 1999). One of the mainpurposes of this literature is to establish whether conventional approachesto modelling inequality, welfare and related concepts are consistent with theway individuals view income distributions. Since both the theoretical andempirical settings of this paper originate in this literature, we will brieflysummarize its development in order to set the context for our research afteran introduction to our main research question.
2.1 The meaning of risk
In the abstract, the concept of risk is remarkably difficult to pin down. Stan-dard reference works fall back on either generalised descriptions or a simpleenumeration of alternative interpretations.1 In short: “people disagree moreabout what risk is than about how large it is” (Fischhoff 1985).In the economics literature one might immediately think of a standard
paradigm derived from the conventional model of choice under uncertainty— the expected utility (EU) model. However, despite the ubiquity of the
1For example Pass et al. (1993) states that “risk reflects the variability of future returnsfrom a capital investment”. Yates (1992) lists ten different definitions of risk on page 1.“Risk should not, however, be confused with probability since it is an amalgam of boththis probability and the size of the event. If the 1 in 10 chance of a loss is one of makinga very big loss indeed, this can be a more risky event than one where the probable gainsare exactly the same, but the risk of loss is much smaller.” (Pearce 1983 page 287).
2

paradigm, there are good reasons to query it as the sole basis for the analysisof risk.First, it is generally acknowledged that the EU model is somewhat re-
strictive: it imposes an additively separable structure on the utility functionthat implies strong assumptions about the way individuals perceive choicesamong alternative prospects. For this reason a number of alternative models— such as rank-dependent expected utility, for instance — have been consid-ered as alternative models of individual preference under uncertainty withconsequences for the formulation of risk.2 Because the notion of risk itselfis the product of a specific axiomatisation, in that the axioms relate to thepreference structure from which the risk concept is extracted, risk-rankingsderived from EU are special. It is clear that even if peoples’ preferences donot conform to EU assumptions, they may yet have a coherent perception ofrisk.Second, risk can be axiomatised directly, not as a derivation from a model
of preference. This is arguably more general than a preference-based ap-proach in that assessments in terms of risk may be considered to have appli-cations over a broad range of distributional comparisons, and not just oversituations in which an individual has a personal stake. This direct approachcan be illuminated by considering risk in the context of a parallel literature.
2.2 Risk and inequality
There is a historic link between the analysis of economic inequality and thatof risk and this link is informative in understanding the issues that are centralto this paper.Some of the early inequality literature uses the well-developed theory of
choice under uncertainty and its associated model of risk and transposes themain concepts from one kind of distribution (probability) to another (in-come or wealth): inequality is just risk in new clothes (Atkinson 1970). Theinequality-risk link has been made more formal through explicit axiomatisa-tion, mainly but not only by Rothschild and Stiglitz (1970, 1971, 1973). Inaddition there is an approach that suggests that social choice among incomedistributions should be based on a choice amongst lotteries behind a “veilof ignorance” as to one’s identity (Harsanyi 1953, 1955) — social aversion toinequality is then explicitly based on personal aversion to risk.The close relationship between the two fields suggests that some of the
research methods that have been applied to investigate further the axiomatic
2Kahneman and Tversky (1979) and Kahneman et al. (1982) are perhaps the most fa-mous, but certainly not the only theoretical developments of non expected utility theories.
3

basis for inequality analysis may also be applicable to risk (Amiel and Cowell1999). However, the social-welfare theoretic approach to income distributioncan further assist in understanding points that we want to investigate in thecontext of risk. This approach can be briefly summarised as follows.Suppose F represents the set of all income distributions — each member
of the set is a univariate distribution function3 F . The problem is to rank Faccording to criteria that suitably reflect social values: this is done either byusing social-welfare functions or inequality measures, and by specifying thecharacteristics of a class of these functions that make clear what is meant by“suitable.” It is conventional to assume:
• A social-welfare function W is endowed with “ethical” properties suchas monotonicity and Schur-concavity; perhaps also with “structural”properties such as homotheticity and decomposability.
• Likewise the inequality measure I satisfies the Principle of Transfers (itis Schur-convex) and may be endowed with structure properties thatcomplement those of W .
• For each F in a subset of F with given mean µ there is a link betweenthe two concepts, welfare and inequality
I(F ) = φ (W (F ), µ) (1)
where φ is strictly decreasing in its first argument.
• The selection of a particular W or I does not depend on an observer’sown position in the income distribution. This is implied by, for exam-ple, the “veil of ignorance” assumption of Harsanyi.
Clearly, either W or I could be taken as the basic concept and the re-lationship (1) establishes an equivalence between the class of social-welfarefunctions and the class of inequality measures.Now the approach to risk could be characterised in similar terms: F would
represent the set of all probability distributions relating to some random en-dowment of income and the problem would be to rank F according to criteriathat “suitably” reflect individual preferences in the face of uncertainty. Thiswould be done by specifying a class of utility functions or a class of riskmeasures. In the risk literature the following is usually assumed, explicitlyor implicitly:
3The support of F is usually taken to be the set of all nonnegative numbers. For anyincome x ≥ 0, F (x) represents the proportion of the population less than or equal to x.
4

• A suitable utility function U is endowed with standard properties suchas monotonicity and quasi-concavity. For a conventional EU approachseparability and other structural properties are also required. For someapplications further structural properties such as constant absolute riskaversion or constant relative risk aversion may also be imposed.
• Likewise the risk measure R satisfies the principle of mean-preservingspreads (MPS) — the counterpart of quasi-concavity for U (Rothschildand Stiglitz 1970).
• For each F in a subset of F with given mean µ there is a link betweenthe two concepts, utility and risk
R(F ) = φ (U(F ), µ) (2)
where φ is strictly decreasing in its first argument. Once again φ es-tablishes an equivalence relation between the class of utility functionsand the class of risk measures.
• The selection of a particular R does not depend on an observer’s owninvolvement in the risk.
Each of the points in this list is open to challenge. For example, in thecontext of the preference-related approach to risk, it is not self-evident thatindividuals’ preferences conform to the EU paradigm;4 if one examines atti-tudes to risk — either directly or inferred from preferences — these may violatethe MPS principle in some parts of the distribution. Rankings according toU may differ from R-rankings because of a confusion between “better-than”relationships and pure risk comparisons. Moreover, it is possible that indi-viduals’ preference orderings over risky choices that directly affect their ownpersonal wellbeing may differ from risk orderings that are applicable to im-personal comparisons, or comparisons involving others (with varying degreesof proximity).
2.3 The approach
A comprehensive study that successfully disentangled the concept of risk perse from the language of preference would require the investigation of severalkey axioms twice over — for the functions U and R defined above. This
4For a review of experimental evidence on the EU model and other paradigms of indi-vidual decision making see Camerer (1995).
5
would clearly be demanding. We have a more narrowly-focused agenda thatconcentrates on some of the key assumptions about risk highlighted in Section2.2. Specifically, we want to investigate:
1. whether rankings by risk are simply the reverse of ranking by preferenceover distributions with a given mean;
2. whether risk-rankings respect the MPS principle
3. that risk-rankings are independent of whether the individual is person-ally involved in the gains/losses associated with the uncertain prospects.
We will pursue this using a methodology that has been established in thecontext of inequality and social welfare.
3 Experimental Setting
3.1 Methodology — previous experiments
The collection of evidence on the validity of axioms is a central task in theliterature on inequality perceptions (Amiel and Cowell 1999), and is alsocentral for answering our previous questions on risk theory. The benchmarksagainst which the axioms are compared are the perceptions and judgementsfrom ordinary individuals. While stressing the obvious point that the axiomscannot be right or wrong, it is still interesting to know the extent to whichthe principles used by social scientists are relevant or coincide with the valuesof individuals.How is this to be done? Eliciting such preferences or attitudes from
economic data is not an easy task, as some of the studies trying to obtain“revealed preferences” from economic aggregates have found. The solutionmay lie in the field of experimental economics.The use of experiments in economics has progressed rapidly from rel-
ative obscurity to Nobel prize-winning prominence; they are now seen toprovide an important source of empirical information as an alternative tomarket observations, and experiments are now well established in a numberof economic applications. They are used, for instance, to analyse behaviouralchoices where an econometric approach to market outcomes is inappropri-ate because of lack of data, measurement difficulties or thinness of samples.However, standard experimental approaches concentrate on participatory ex-periments designed to investigate the way people behave, for instance, inlaboratory markets, or in interactions in provision-of-public-goods types of
6

settings. Although there is a large literature on experimental bargaining andthe problem of experimental design in such contexts, similar work on norma-tive economics and the analysis of preferences is still rare. Our aim, as in theinequality perceptions literature, is not to analyse actual behaviour, but tounearth the basic implicit principles that guide individual judgements. Withthese objectives in mind, traditional experimental settings are unlikely to beuseful.The research programme described in Amiel and Cowell (1999) has de-
veloped an original experimental setting to study inequality perceptions andrelated concepts. Amiel and Cowell (1999), Gaertner and Jungeilges (1999)and Schokkaert and Devooght (1998) are examples of these experimentaltechniques applied to normative issues. The original approach consists inusing questionnaire-experiments to establish the type of assumptions aboutinequality comparisons implicitly made by the experimental subjects in theirchoices.The original experiments on inequality perceptions, whether paper or
computer based, shared a set of similar characteristics. Since the aim wasthe comparison of distributions, the respondents faced a series of pairs ofvectors, and were asked to compare them. Typically, respondents were con-fronted with two sets of distributions, and asked to rank them according tosome criteria (more/less unequal, better/worse...). The following section, the“verbal” question, consisted of a long question that enunciated the principleon which the questionnaire was focusing, and provided different versions ofthe theoretical principles underlying the choices between distributions. Re-spondents had to choose which option (if any) they agreed with. All thiswas done with a fictional underlying story (for instance, policy options insome non existent country), and the fact that there were no correct answerswas stressed to encourage pure statement of preferences. Section 3.2 and theAppendix contain a detailed description of our specific setting.An important feature of these experiments was that there was not one
but at least two versions of each, with the same income distributions and thesame type of verbal question; the difference was that while half of the copieswere asking questions in terms of what was “more unequal”, the other halfwould be termed, for instance, “riskier” (for inequality-risk experiments)or “better” (for preference-inequality experiments). See Amiel and Cowell(1999, 2002) for a complete set of questionnaires and a lengthy discussion oftheir administration.The questionnaire approach has provided important insights on the issues
discussed above, namely, (a) whether or not standard assumptions made inthe formulation of distributional orderings are appropriate, and (b) the fac-tors accounting for systematic differences between certain groups of persons
7

in their attitudes on issues such as inequality, poverty and social welfare. Weaim to establish whether these insights also apply to the theory of risk.Results from previous studies have found rejections of some of the basic
inequality axioms, which sometimes respond to specific patterns. For in-stance, Amiel and Cowell 1999 find that while studying economics and beingmale increases the likelihood of responses being consistent with economic or-thodoxy, other background variables such as income, political attitudes andage are relatively unimportant.In the light of these results, obtained with experiments exploiting the
analogies between risk and inequality, our research question becomes all themore relevant. Using the methodology developed for the inequality field, wewill focus on the question — what is the meaning of risk comparisons?
3.2 The experimental setting
As discussed above, a specific model of preference — expected utility — isusually taken as the vehicle for the microeconomics of choice in the face ofuncertainty. However, there are alternative possibilities — potentially “appro-priate” axiom structures — for representing risk comparisons. Our experimentaims to distinguish fundamentally different patterns of risk comparisons.Our setting for the study of risk draws from these original designs, but
also contains a series of innovations. While the underlying vectors and ques-tions are similar, our research implied a higher level of involvement from theindividual respondents. In previous experiments, the judgements about thewhole society required some form of “Olympian detachment”, but in terms ofrisk, the individual’s perceptions required him or her to be involved. Giventhat our respondents were students, we decided to ask our questions in termsof potential jobs. The vectors of incomes would not represent the distributionof income in a society, but the earning possibilities of two different jobs.However, how close should the individual be? Should the hypothetical
situation refer to him/herself, or to someone close? To analyse the effectof the level of involvement, we study the issue of whether individuals wouldrecommend the same prospects for themselves or for a friend.5
The experiment, then, follows the structure of previous studies (Section3.1), consisting of six numerical questions and one verbal question. Ourexperiment is an extension of the original setting by Amiel and Cowell (2002),focusing on the three specific issues highlighted in Section 2.3.Regarding the specific issue of whether risk-rankings respect the MPS
principle, we adopted for the numerical questions the same income vectors as
5We owe this variation of the experiment to a suggestion by Yoram Amiel.
8

Amiel and Cowell (2002).6 For each pair of vectors, the first can be obtainedfrom the second by a mean preserving spread, and thus the agreement of therespondent with the MPS principle can be easily deduced.Dealing with the other two points raised (whether rankings by risk are
simply the reverse of ranking by preference over distributions with a givenmean, and whether risk-rankings are independent of personal involvementby the individual), however, is not self-evident. Ideally, one would like toask to the same person similar questions in terms of riskiness and preference,and with and without involvement, to test whether any of these two issuesmake a difference with respect to the nature of risk perceptions and judge-ments. Clearly, it is not possible to do this, since asking the same or verysimilar questions would bias the respondent’s answers. We thus adopted therandomisation procedure described in the previous section and in Amiel andCowell (2002). While we cannot ask similar questions to the same respon-dent, we can still assign different types of questionnaires at random. With asufficiently large and carefully selected sample, we can test whether differentquestionnaire formats matter for answers to questions with the same under-lying structure. We are thus able to examine the structure of both types ofcomparison (risk/preference rankings, and personal involvement) simultane-ously with the procedure outlined below.We use four similarly structured versions of the questionnaire. There is
a randomisation between the risk and preference types of questionnaire, andalso with respect to the way in which the questions are phrased: respondentsare asked to choose a job for themselves, or alternatively which option theywould recommend to a friend. This results in four types of questionnaires,with categories defined as follows:
• Friend/Self : the questionnaires ask about a prospective job offer to beconsidered by the respondent (self ), or for advising a friend (friend).
• Risk /Preference: in the numerical questions, the options are labeled“More risky” (risk) or “Better” (preference).
The Appendix contains a template of the full questionnaire, with thecontent of the verbal question as well.7 We reproduce here the first numericalquestion and its introductory blurb in the four formats:
6The differences in the fictional prospective incomes are relatively large. While this maybe considered unrealistic, we believe there is an implicit contract between the researcherand the experimental subject about the fictional nature of the setting.
7The four versions are also available online: http://darp.lse.ac.uk/types.htm
9

Risk-Self: “Below are two alternative lists of incomes A andB (in the same currency). Each list represents the five possibleoutcomes of the A-job or the B-job respectively after you haveaccepted it. Please state which you consider would result in higherrisk for yourself by clicking the appropriate button.”Preference-Self:“Below are two alternative lists of incomes A
and B (in the same currency). Each list represents the five possi-ble outcomes of the A-job or the B-job respectively after you haveaccepted it. Please state which you consider would be better foryourself by clicking the appropriate button.”Risk-Friend: “Below are two alternative lists of incomes A and
B (in the same currency). Each list represents the five possibleoutcomes of the A-job or the B-job respectively after your friendhas accepted it. Please state which you consider would result inhigher risk for your friend by clicking the appropriate button.”Preference-Friend: “Below are two alternative lists of incomes
A and B (in the same currency). Each list represents the fivepossible outcomes of the A-job or the B-job respectively after yourfriend has accepted it. Please state which you consider would bebetter for your friend by clicking the appropriate button.”
A (2, 5, 9, 20, 30)
B (2, 6, 8, 20, 30)
• A more risky / A better• B more risky / B better
Apart from the differing introductions from the numerical questions andcorresponding differences in wording of the verbal question, all the ques-tionnaires are exactly the same. The experiments are implemented on theInternet (see Section 3.3 below). After logging on to the questionnaire site,the respondent is presented with a general preamble, followed by an expla-nation about the format of the numerical questions. The preamble stressesthe fact that there are no right or wrong answers, and that the researchersare interested solely in the respondent’s judgements and preferences. Thesix following windows correspond to the numerical questions. A brief textthen explains the background to the verbal questions, which consists of a setof pre-defined multiple choice answers and a box for the user to complete.Finally, there are two sets of questions about the respondent’s background
10

and characteristics, followed by a page thanking the respondent for his/herparticipation in the experiment.The Appendix contains images of the screens presented to the respon-
dents, with the whole text of the setting and the questions. There is also a“live” demonstration of the experiment accessible through the World WideWeb.8
3.3 Beyond paper based questionnaires: the VirtualLaboratory approach
Most of the empirical work described in Section 3.1 used paper questionnairesand worked with student samples (see for instance Amiel 1999; Amiel andCowell 1999). The general form of these experiments has been as follows:
• Respondents are asked numerical and/or verbal questions about alter-native distributions in carefully specified hypothetical environments.
• Internal controls for consistency of responses are incorporated in thequestion design.
For this study, we developed an extension of the original methodology thatsupersedes the paper based “questionnaire experiments”. At the core of theresearch is a new Internet-based technology, the Virtual Laboratory, a facilityfor designing and running questionnaire experiments. The motivation of theVirtual Laboratory is three-fold: (a) individual respondents can participateremotely; (b) interaction with the Web-server is designed in a way that allowsobservation of the process of reaching decisions as well as final judgments;(c) researchers at remote locations can develop and redesign experiments anddownload results automatically.It still has to be established whether the format of the questionnaire
(paper or electronic) has any effect on the nature of the results. Whereas thepresent experiment was only administered electronically, ongoing research isseeking to establish if there is any kind of bias using the R4A4 experiment(see for instance Amiel 1999; Amiel and Cowell 1999) for which both paperbased and electronic questionnaires are available.9
8It can be accessed by following the link:http://darp.lse.ac.uk/test/0302b/start.aspNote that since this is the same version administered to our respondents, the resulting
questionnaire will be one of the four versions described above, chosen at random by theweb server. To see each of the four different versions, please use the following link:http://darp.lse.ac.uk/types.htm9An example of the original experiment from Amiel and Cowell (2001), can be found
at http://darp.lse.ac.uk/experimentdemo.htm
11

We now turn the nature of our sample and present our results.
4 Data and Results
4.1 Characteristics of the respondents
4.1.1 Selection of the sample
The questionnaire experiment was administered to a sample of ninety-twoLSE students during the academic years 2001/2002 and 2002/2003. The stu-dents were mostly undergraduates from Economics and other social sciences.Considering the choice of the respondent sample and the mechanisms to
induce participation, there are two main issues in experimental economics:the source of participants, and the incentives to participate.Regarding the participants, whereas we make intensive use of Internet
technology, we did not want to have a respondent base drawn from therandom flow of Internet users. For that reason, we limited our sample bycontacting our own students by email, briefly explaining in general terms thepurpose of the research and giving them a URL to follow. This ensured arelatively high quality of responses, which in our view is far more importantthan a potentially large sample size with low quality responses. The issue ofwhether students are representative of the population and the need to extendthe respondent base beyond universities is left for further research.On the other hand, incentives (and, especially, remuneration linked to
experimental outcomes) are seen as highly important in market-based exper-iments to ensure that participants will put in effort and behave rationally. Inour setting, however, there are no correct answers, and this type of incentiveis not necessary. However, we set up a random draw of 25 GBP as a way tomotivate the student’s participation in the experiment. While it might beargued that this lottery would attract students with biased preferences overrisky prospects, the results outlined below are roughly consistent with pre-vious findings obtained in non remunerated experiments and questionnaires.
4.1.2 The respondent sample
Table 1 contains summary statistics of the respondents’ characteristics col-lected at the end of the questionnaire. As can be expected from a groupconsisting mainly of undergraduate students, the average age is only 20.2years, with 82% of respondents between 18 and 21 years old. The samplecontains a majority of males (58%), which reflects the composition of thecourses in which the experiments were administered. A relatively high 41%
12

Table 1: Characteristics of respondentsCharacteristics PV PV
Variable Obs Mean σ Min Max Risk Fr.Age 87 20.24 2.12 18 31 0.329 0.372
Females 92 42% 0.5 0 1 0.736 0.422Employed 92 41% 0.5 0 1 0.571 0.806
Family inc. (1-7) 85 4.5 1.12 2 7 0.913 0.971Inc. prospect (1-7) 84 5.2 0.92 2 7 0.173 0.780
Subject=Econ. 92 63% 0.49 0 1 0.837 0.874Pol. Views (1-7) 85 4.1 0.95 2 6 0.433 0.515
Left 92 21% 0.41 0 1 0.867 0.719Right 92 30% 0.46 0 1 0.447 0.317
of the students declared themselves to have been employed, though giventhe nature of their degrees this probably refers mostly to part time jobs.Regarding the subject of study, 63% of the respondents follow an economicsdegree (or a mixed economics degree - i.e., “Economics and Finance”, etc.).In terms of political views, respondents were asked to classify themselves ina one to seven scale, where four represented the centre, lower values the leftand higher values the right. The mean of this variable, 4.1, suggests that thesample is relatively balanced with respect to political views.Finally, for a set of reasons (privacy, the international nature of the sam-
ple, avoiding missing answers from indiscreet questions), students were notasked about their current incomes, but instead were required to classify theirfamily incomes in 1990 and their expected future income in 2010 in a one toseven scale (one being poor and seven rich). We can see that our group ofrespondents are relatively optimistic about the future, with a mean of pastfamily income of 4.5 and future income of 5.2.These characteristics are the main controls that will be used in the analy-
sis of the results.
4.1.3 Types of questionnaires
As explained in Section 3.2, our experiment consists of four different typesof questionnaires from the mix of friend/self and risk/preference categories.In order to make inferences about the relevance of these categories for theexperiment’s answers, we must verify that there was no bias in the assignmentof the respondents.Reassuringly, the evidence confirms that the sample is well balanced
among categories. The questionnaires were assigned randomly to the stu-
13

Table 2: Types of questionnairesType of Questionnaire Respondents %
Preference-Self 25 27.17%Preference-Friend 17 18.48%
Risk-Self 20 21.74%Risk-Friend 30 32.61%
Total 92 100%
dents by a computer handled randomisation which worked correctly. Whilewe can observe in Table 2 that there are relatively more risk-friend and lesspreference-friend questionnaires, this is mostly due to the small size of thesample (simulations with the Virtual Laboratory show that increasing thenumber of questionnaires would result in a convergence of 25% for each cate-gory). Most importantly, Table 1 contains the p-values of t-tests of differencesin means in respondent characteristics between the risk and preference andthe friend and self questionnaires. As can be appreciated in the table, noneof the differences are even barely significant at the standard levels, confirmingthat the allocation of questionnaires was truly random.
4.2 Results
4.2.1 Numerical questions
As explained above, in the numerical questions the respondents were askedto choose between two vectors of possible outcomes. Table 3 presents theresults for the total number of questions answered (523) from the groups of 90respondents with complete characteristics. It should be stressed that in therisk questionnaire, the choice of option A (“Amore risky”) corresponds to theagreement with the MPS principle, while in the preference questionnaire this“orthodox” view is represented by the choice of option B (“B better”). Thisis because in all numerical questions the vector represented by A is obtainedfrom B by a mean preserving spread (see Section 3.2). We will present theanswers in terms of options A, AB and B in this first table, but for the rest ofthe document we will reclassify the answers and deal with categories definedas agreement/indifference/disagreement with the MPS principle.From this table we can extract some preliminary conclusions. While
agreement with the MPS principle is high, it seems to be higher for the riskquestionnaire (61.3 versus 55.9% of the answers). While the t-tests of thisdifference (not reported) are not significant at the 5% level, the differences inthe indifference and rejection rates of the MPS are strongly significant (28.2%
14

Table 3: Answers by type of questionnaireRisk
Answers Friend % Self % Total %A 106 63.1% 70 58.8% 176 61.3%
AB 44 26.2% 37 31.1% 81 28.2%B 18 10.7% 12 10.1% 30 10.5%
Total 168 100% 119 100% 287 100%
PreferenceAnswers Friend % Self % Total %
A 32 31.7% 24 17.8% 56 23.7%AB 19 18.8% 29 21.5% 48 20.3%B 50 49.5% 82 60.7% 132 55.9%
Total 101 100% 135 100% 236 100%
vs. 20.3%, and 10.5% vs. 23.7% , for risk and preference respectively).However, the small differences in answers between the self and friend versionsdo not appear to be significant at standard levels. We will return to this pointwhen dealing with the multivariate analysis.Full agreement with the principle requires a simple but strict pattern of
responses: “AAAAAA” in the case of risk, and “BBBBBB” in the case ofpreference. The subsample adopting this “pure” form of response is sparse:preference-self : 5 respondents, preference-friend : 1 respondent, risk-self : 3respondents and risk-friend : 9 respondents.Because of this sparseness, in the following tables we have re-classified the
answers in three categories as explained above (agreement / indifference to /disagreement with theMPS). Rather than conducting the analysis at the levelof individual questions, we aggregated the answers by respondent, assigningthem to one category only if 50% or more of the answers corresponded withone of these categories.With this new definition, we can observe in Table 4 that around 68% of
the respondents agree with the MPS principle. However, a non-negligible32% does not accept it (weakly and/or strongly), and in the case of stronglyrejecting it, it was much more important for questions asked in terms ofpreference (21%) than risk (4%).Table 5 presents information about the same reclassification, but this
time breaking down answers by self or friend questionnaires. It appearsthat there is a much higher probability of a strong rejection of the MPS ifthe questionnaire was of the friend type (17%) than the self (7%).
15
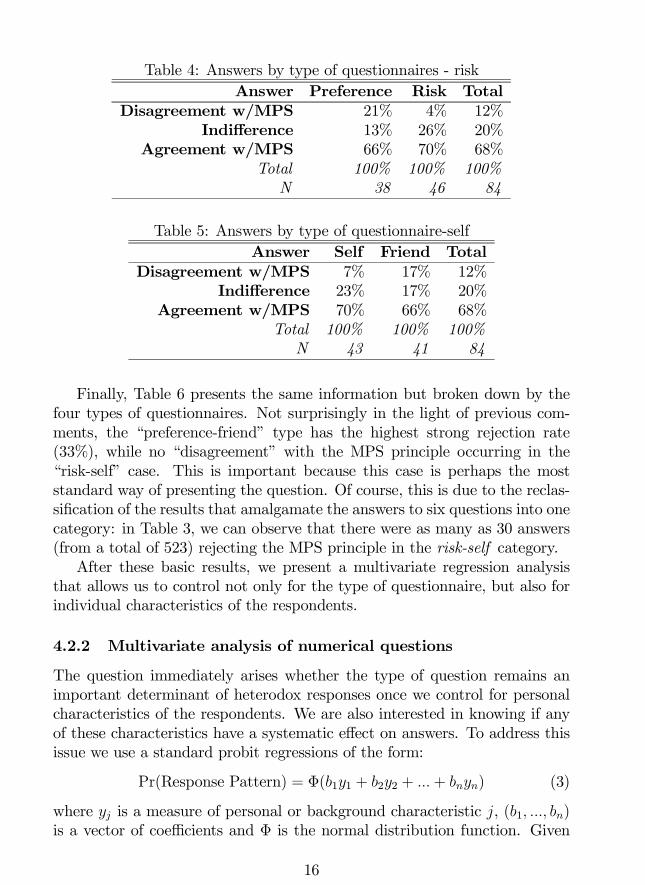
Table 4: Answers by type of questionnaires - riskAnswer Preference Risk Total
Disagreement w/MPS 21% 4% 12%Indifference 13% 26% 20%
Agreement w/MPS 66% 70% 68%Total 100% 100% 100%N 38 46 84
Table 5: Answers by type of questionnaire-selfAnswer Self Friend Total
Disagreement w/MPS 7% 17% 12%Indifference 23% 17% 20%
Agreement w/MPS 70% 66% 68%Total 100% 100% 100%N 43 41 84
Finally, Table 6 presents the same information but broken down by thefour types of questionnaires. Not surprisingly in the light of previous com-ments, the “preference-friend” type has the highest strong rejection rate(33%), while no “disagreement” with the MPS principle occurring in the“risk-self” case. This is important because this case is perhaps the moststandard way of presenting the question. Of course, this is due to the reclas-sification of the results that amalgamate the answers to six questions into onecategory: in Table 3, we can observe that there were as many as 30 answers(from a total of 523) rejecting the MPS principle in the risk-self category.After these basic results, we present a multivariate regression analysis
that allows us to control not only for the type of questionnaire, but also forindividual characteristics of the respondents.
4.2.2 Multivariate analysis of numerical questions
The question immediately arises whether the type of question remains animportant determinant of heterodox responses once we control for personalcharacteristics of the respondents. We are also interested in knowing if anyof these characteristics have a systematic effect on answers. To address thisissue we use a standard probit regressions of the form:
Pr(Response Pattern) = Φ(b1y1 + b2y2 + ...+ bnyn) (3)
where yj is a measure of personal or background characteristic j, (b1, ..., bn)is a vector of coefficients and Φ is the normal distribution function. Given
16
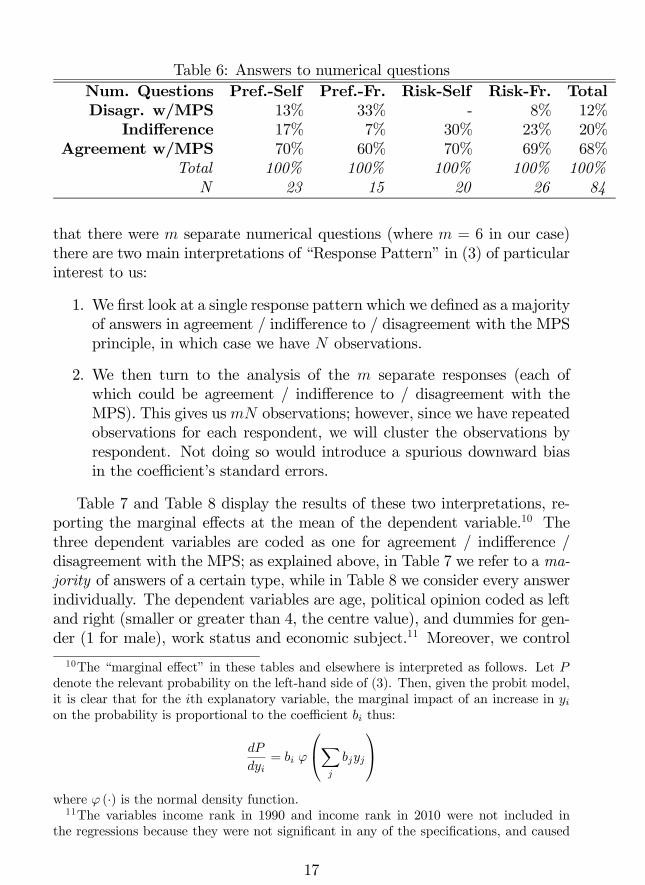
Table 6: Answers to numerical questionsNum. Questions Pref.-Self Pref.-Fr. Risk-Self Risk-Fr. TotalDisagr. w/MPS 13% 33% - 8% 12%
Indifference 17% 7% 30% 23% 20%Agreement w/MPS 70% 60% 70% 69% 68%
Total 100% 100% 100% 100% 100%N 23 15 20 26 84
that there were m separate numerical questions (where m = 6 in our case)there are two main interpretations of “Response Pattern” in (3) of particularinterest to us:
1. We first look at a single response pattern which we defined as a majorityof answers in agreement / indifference to / disagreement with the MPSprinciple, in which case we have N observations.
2. We then turn to the analysis of the m separate responses (each ofwhich could be agreement / indifference to / disagreement with theMPS). This gives usmN observations; however, since we have repeatedobservations for each respondent, we will cluster the observations byrespondent. Not doing so would introduce a spurious downward biasin the coefficient’s standard errors.
Table 7 and Table 8 display the results of these two interpretations, re-porting the marginal effects at the mean of the dependent variable.10 Thethree dependent variables are coded as one for agreement / indifference /disagreement with the MPS; as explained above, in Table 7 we refer to a ma-jority of answers of a certain type, while in Table 8 we consider every answerindividually. The dependent variables are age, political opinion coded as leftand right (smaller or greater than 4, the centre value), and dummies for gen-der (1 for male), work status and economic subject.11 Moreover, we control
10The “marginal effect” in these tables and elsewhere is interpreted as follows. Let Pdenote the relevant probability on the left-hand side of (3). Then, given the probit model,it is clear that for the ith explanatory variable, the marginal impact of an increase in yion the probability is proportional to the coefficient bi thus:
dP
dyi= bi ϕ
Xj
bjyj
where ϕ (·) is the normal density function.11The variables income rank in 1990 and income rank in 2010 were not included in
the regressions because they were not significant in any of the specifications, and caused
17

whether the respondent answered a risk or preference questionnaire (withthe indicator risk being one), and self or friend (with one corresponding tothe self case).Table 7 contains interesting results regarding both individual character-
istics and type of questionnaire. Firstly, none of the variables seem to haveany effect on the probabilities of agreeing or being indifferent to the MPS.However, there are strongly significant determinants of the disagreement indi-cator. Regarding personal characteristics, it is interesting to note the lack ofany gender effect or any effect from pursuing an economics degree, which hadbeen identified as important factors in previous research. Being older has anegative and significant effect on the probability of disagreeing with standardeconomic theory, which may be proxying for the small subset of postgraduatestudents in our sample who have been more exposed to the standard axiomsof economic theory. Finally, being employed or at the left of the politicalspectrum significantly increases the probability of the respondent having apoint of view not consistent with standard economic assumptions.Regarding the type of questionnaires, the Risk type clearly reduces the
probability of disagreement with the MPS; the Self type also reduces thisprobability, but the level of significance of this coefficient is much lower.The results in Table 8 correspond to the case in which we consider the
answer to all questions. This allows us to increase significantly the numberof observations and thus precision (although as stated above we control forrepeated observations by clustering on individual respondents — observationsfrom the same person are not considered independent in the regression), andavoids the biases that might be introduced by the aggregation procedurewe used for the previous table, which is arbitrary up to a certain point.This regression also includes controls for each of the six numerical questions,since they imply different mean preserving spreads and thus we can expectrespondents to evaluate them differently.We notice again that none of the variables on questionnaire type or indi-
vidual characteristics seem to have any effect on the probabilities of agreeingor being indifferent to the MPS (except for a barely significant effect from“right” in the indifferent case). But again, we find strong predictors of the“heterodox” position. There is now a slightly significant effect of gender,with males having a higher probability of answering in a conventional way.Being older again has a negative and significant effect on the probability ofdisagreeing with standard risk theory, while being employed has a positiveand significant effect on heterodoxy. Finally, there is no effect from pursuing
colinearity problems in some of the regressions. The results were not qualitatively alteredby this omission.
18

Table 7: Probit Results, Numerical Questions — Aggregated ResponsesDisag. w/MPS Indifferent Agrees w/MPS
Male -0.0428 [1.24] 0.0428 [0.47] 0.0069 [0.06]age -0.0267 [1.93]* 0.0071 [0.32] 0.0246 [0.82]Risk -0.1241 [3.64]*** 0.1433 [1.62] 0.0405 [0.37]Self -0.0608 [1.79]* 0.1034 [1.25] 0.032 [0.30]
employed 0.1028 [2.59]*** -0.0117 [0.12] -0.168 [1.42]left 0.1604 [2.05]** -0.1539 [1.49] 0.0617 [0.45]right 0.0117 [0.31] -0.0741 [0.76] 0.1291 [1.08]econ 0.0284 [1.07] -0.0293 [0.30] -0.0364 [0.33]
Pseudo R2 0.316 0.077 0.035Notes:N=83Level of significance: *10%, **5%, ***1%
Robust z statistic in brackets,
Except for age, dFdxis for discrete change of dummy from 0 to 1
Table 8: Probit Results, Numerical Questions — All ResponsesHeterodox Indifferent Orthodox
Male -0.0656 [1.65]* -0.0003 [0.00] 0.0838 [1.09]age -0.0283 [2.25]** -0.0165 [0.79] 0.04 [1.48]Risk -0.1445 [3.80]*** 0.0938 [1.58] 0.072 [0.98]Self -0.0598 [1.63] 0.0472 [0.81] 0.0333 [0.45]
employed 0.07 [1.77]* 0.0152 [0.22] -0.0993 [1.14]left -0.0158 [0.30] -0.0337 [0.45] 0.0514 [0.52]
right 0.0065 [0.17] -0.1341 [1.88]* 0.1318 [1.54]econ 0.0402 [1.13] -0.0049 [0.07] -0.0455 [0.58]
Question 2 -0.0836 [2.15]** 0.383 [6.09]*** -0.2585 [4.32]***Question 3 -0.0278 [0.84] 0.0807 [1.94]* -0.0284 [0.56]Question 4 0.0194 [0.46] -0.0795 [1.26] 0.0375 [0.63]Question 5 -0.1187 [2.67]*** -0.0094 [0.15] 0.1864 [2.53]**Question 6 -0.0398 [1.02] 0.1877 [3.59]*** -0.1112 [1.94]*Pseudo R2 0.145 0.124 0.09Notes:N=517
Level of significance: *10%, **5%, ***1%Robust z statistic in brackets, clustered by respondent
Except for age, dFdxis for discrete change of dummy from 0 to 1
19

an economics degree or from political views.As in the previous regressions, the Risk case clearly reduces the probabil-
ity of non standard answers, while the small effect of the Self questionnairewe noticed in the previous table now disappears.We now turn to the analysis of the verbal question.
4.3 The verbal question
4.3.1 Descriptive analysis
The question itself is very similar to the ones used in previous studies onperceptions of inequality. Respondents face a set of statements, and they haveto choose which correspond to their views - multiple selections are allowed.There are five possible responses, including “none of the above”. The choiceof these responses was designed to cover the views corresponding to the MPSprinciple. Individuals are allowed to check more than one response, and onlyresponse “d” is consistent with the standard risk theory view.
Table 9: Answers to verbal questionAnswer Freq. Percent
a 10 11.49ac 3 3.45ad 1 1.15ab 2 2.3b 25 28.74bc 2 2.3c 14 16.09cd 2 2.3d 16 18.39e 12 13.79
Total 87 100
The fact that respondents were allowed to make multiple selections fromquestion 7 means that we can interpret consistency with economic orthodoxyin either a broad or narrow sense. On the narrow interpretation — whetherfor preference or for risk questionnaires — people should have checked “d” andnothing else. However, it might be reasonable to look at cases where, becauseof difficulties with understanding the question, or some perceived ambiguity,respondents checked both “d” and one or more other possibilities.We can see in Table 9 that 19% chose the orthodox answer, and less
than 22% chose this option or this option combined with some other. These
20

Table 10: Probit Results — Verbal QuestionHeterodox
Male 0.1694 [0.0986]*age -0.0484 [0.0234]**Risk -0.0235 [0.0795]Self 0.0086 [0.0847]
employed 0.2014 [0.0828]**left 0.0155 [0.1083]
right -0.1511 [0.1158]econ 0.0307 [0.0966]
Pseudo R2 0.105Notes:
N=87Level of significance as in previous tablesRobust z statistic in brackets
Except for age, marginal effects for dummies
numbers were higher in the case of Risk and Friend questionnaires (notreported). Support for the pure MPS seems to be very low when spelled outdirectly.We now turn to a brief regression analysis of the determinants of answers
to the verbal question.
4.3.2 Regression analysis
Let us look once again at the role of personal factors on the response to theverbal question using probit regressions. Table 10 presents the results of aprobit estimation of a model like (3), using the same independent variablesas in the two previous regression tables. The dependent variable, in this case,is an indicator that takes value one if the respondent did not choose option“d” or option “d” combined with some other choice in the verbal question.Employment and age continue to be significant, with the same signs as
before. The indicator for male respondents is again significant, but in thiscase with a positive (though not highly significant) coefficient: in the ver-bal question, being male increases the chance of a non-orthodox response.Finally, political opinion and economics subject are not significant.Regarding the type of questionnaire, this table indicates that there does
not seem to be any type of questionnaire effect on answers to the verbalquestion.
21
4.4 Comparison with previous results
While Amiel and Cowell (2002) find persistent evidence of an “orthodox” ef-fect from studying an economic subject in inequality comparisons, in the caseof risk we do not find any significant effect from this individual characteristic.This may be an artefact of the sample selection in this case: the LSE stu-dents approached were either economics specialists or pursuing courses thathave a high economics component.They also found that being male had similar impact — more conventional
numerical responses; in our case, we find the same for the numerical ques-tions, although for verbal questions this result is reversed (males appear tobe more heterodox than females).
5 ConclusionsBy means of our questionnaire experiments, we find evidence that a minorityof respondents do not respect the principle of mean-preserving spreads intheir risk-rankings. Moreover, we find some evidence that rankings by riskare not simply the reverse of ranking by preference over distributions witha given mean. Comparisons in terms of preference seem to induce a higherproportion of disagreement with the MPS for similar underlying questions.However, we find significant evidence that risk-rankings are independent
of whether the individual is personally involved in the gains/losses associatedwith the uncertain prospects, at least as far as our experimental settingis concerned. Finally, we also find that there is almost no effect in theresponse pattern from the “gender” of the respondent, or the fact that he/sheis studying economics.The results we obtained are broadly consistent with previous work done
with paper questionnaires on risk and inequality. Future work will focus onsignificantly increasing the sample to test the robustness of our findings.
22

ReferencesAmiel, Y. (1999). The subjective approach to the measurement of incomeinequality. In J. Silber (Ed.), Income Inequality Measurement: FromTheory to Practice. Dewenter: Kluwer.
Amiel, Y. and F. A. Cowell (1999). Thinking about Inequality. Cambridge:Cambridge University Press.
Amiel, Y. and F. A. Cowell (2001). Risk and inequality perceptions. Dis-tributional Analysis Discussion Paper 55, STICERD, London Schoolof Economics, London WC2A 2AE.
Amiel, Y. and F. A. Cowell (2002). Attitudes towards risk and inequal-ity: A questionnaire-experimental approach. In F. Andersson and H. J.Holm (Eds.), Perspectives on Experimental Economics — Interviews andContributions from the 20th Arne Ryde Symposium. Dewenter: Kluwer.
Atkinson, A. B. (1970). On the measurement of inequality. Journal ofEconomic Theory 2, 244—263.
Camerer, C. (1995). Individual decision making. In J. H. Kagel and A. E.Roth (Eds.), The Handbook of Experimental Economics, Chapter 8, pp.587—673. Princeton, New Jersey: Princeton University Press.
Fischhoff, B. (1985). Managing risk perceptions. Issues in Science andTechnology 2, 83—96.
Gaertner, W. and J. Jungeilges (1999). Evaluation by extended orderings:empirical findings from west and east. Distributional Analysis Discus-sion Paper 42, STICERD, London School of Economics, LondonWC2A2AE.
Harsanyi, J. C. (1953). Cardinal utility in welfare economics and in thetheory of risk-taking. Journal of Political Economy 61, 434—435.
Harsanyi, J. C. (1955). Cardinal welfare, individualistic ethics and inter-personal comparisons of utility. Journal of Political Economy 63, 309—321.
Kahneman, D., P. Slovic, and A. Tversky (1982). Judgment under Un-certainty: Heuristics and Biases. Cambridge: Cambridge UniversityPress.
Kahneman, D. and A. Tversky (1979). Prospect theory : An analysis ofdecision under risk. Econometrica 47 (2), 263—291.
Pass, C., B. Lowes, and L. Davies (1993). A Dictionary of Economics.London: Collins.
23

Pearce, D. (1983). Macmillan Dictionary of Modern Economics. London:Macmillan.
Rothschild, M. and J. E. Stiglitz (1970). Increasing risk: I. A definition.Journal of Economic Theory 2, 225—243.
Rothschild, M. and J. E. Stiglitz (1971). Increasing risk: II. Its economicconsequences. Journal of Economic Theory 3, 66—84.
Rothschild, M. and J. E. Stiglitz (1973). Some further results on the mea-surement of inequality. Journal of Economic Theory 6, 188—203.
Schokkaert, E. and K. Devooght (1998). The empirical acceptance of com-pensation axioms. In M. Fleurbaey, N. Gravel, and A. Trannoy (Eds.),Freedom in Economics: New Perspectives in Normative Analysis. Rout-ledge.
Yates, J. F. (1992). Risk-Taking Behavior. John Wiley Ltd.
24

Appendix 1 – Sample Questionnaire This appendix contains a sample questionnaire. Following is the sequence of screens
seen by a respondent who completed the risk-friend type of questionnaire. We prefer to use these images rather than the text to give the reader an idea of the whole “look and feel” of the questionnaire. A “live” version of the questionnaire is available on the World Wide Web and can be found at:
http://darp.lse.ac.uk/test/0302b/start.asp The questionnaire below corresponds to the risk/self category. The other categories
are defined as follow: • Friend/Self : the questionnaires ask about a prospective job offer to be considered
by the respondent (self), or for advising a friend (friend). • Risk / Preference: in the numerical questions, the options are labeled “More
risky” (risk) or “Better” (preference). Please note that the “live” version will randomise between the four types of
questionnaire available. To see a particular version, please follow the URL: http://darp.lse.ac.uk/types.htm Apart from these different categories, all the questionnaires are exactly the same.
After logging, the respondent is presented with a general preamble about the questionnaire, followed by an explanation about the numerical questions. The six following windows correspond to the numerical questions. A brief text explains the background to the verbal questions, which consists in a set of pre-defined multiple choice answers and a box for the user to complete. Finally, there are two sets of questions about the respondent’s background and characteristics, following by a page thanking the respondent for participating in the experiment.