
Perceptions of innovations: exploring and developing ... · Perceptions of innovations: exploring...
347
CRANFIELD UNIVERSITY RICHARD ADAMS Perceptions of innovations: exploring and developing innovation classification SCHOOL OF MANAGEMENT PhD THESIS
Transcript of Perceptions of innovations: exploring and developing ... · Perceptions of innovations: exploring...

CRANFIELD UNIVERSITY
RICHARD ADAMS
Perceptions of innovations: exploring and developing innovation classification
SCHOOL OF MANAGEMENT
PhD THESIS

CRANFIELD UNIVERSITY
SCHOOL OF MANAGEMENT
PhD THESIS
Academic Year 2002-2003
RICHARD ADAMS
Perceptions of innovations: exploring and developing innovation classification
Supervisors: Professor D. Tranfield Dr. D. Denyer
September 2003
© Cranfield University 2003. All rights reserved. No part of this publication may be reproduced without the written permission of the copyright owner.

ABSTRACT The capacity to innovate is commonly regarded as a key response mechanism, a critical organisational competence for success, even survival, for organisations operating in turbulent conditions. Understanding how innovation works, therefore, continues to be a significant agenda item for many researchers. Innovation, however, is generally recognised to be a complex and multi-dimensional phenomenon. Classificatory approaches have been used to provide conceptual frameworks for descriptive purposes and to help better understand innovation. Further, by the facility of pattern recognition, classificatory approaches also attempt to elevate theorising from the specific and contextual to something more abstract and generalisable. Over the last 50 years researchers have sought to explain variance in innovation activities and processes, adoption and diffusion patterns and, performance outcomes in terms of these different ‘types’ of innovation. Three generic approaches to the classification of innovations can be found in the literature (innovation newness, area of focus and attributes). In this research, several limitations of these approaches are identified: narrow specification, inconsistent application across studies and, indistinct and permeable boundaries between categories. One consequence is that opportunities for cumulative and comparative research are hampered. The assumption underpinning this research is that, given artefact multidimensionality, it is not unreasonable to assume that we might expect to see the diversity of attributes being patterned into distinct configurations. In a mixed-method study, comprising of three empirical phases, the innovation classification problem is addressed through the design, testing and application of a multi-dimensional framework of innovation, predicated on perceived attributes. Phase I is characterised by an iterative process, in which data from four case studies of successful innovation in the UK National Health Service are synthesised with those drawn from an extensive thematic interrogation of the literature, in order to develop the framework. The second phase is concerned with identifying whether or not innovations configure into discrete, identifiable types based on the multidimensional conceptualisation of innovation artefact, construed in terms of innovation attributes. The framework is operationalised in the form of a 56-item survey instrument, administered to a sample consisting of 310 different innovations. 196 returns were analysed using methods developed in biological systematics. From this analysis, a taxonomy consisting of three discrete types (type 1, type 2 and type 3 innovations) emerges. The taxonomy provides the basis for additional theoretical development. In phase III of the research, the utility of the taxonomy is explored in a qualitative investigation of the processes underpinning the development of exemplar cases of each of the three innovation types. This research presents an integrative approach to the study of innovation based on the attributes of the innovation itself, rather than its effects. Where the challenge is to manage multiple discrete data combinations along a number of dimensions, the configurational approach is especially relevant and can provide a richer understanding

and description of the phenomenon of interest. Whilst none of the dimensions that comprise the proposed framework are new in themselves, what is original is the attempt to deal with them simultaneously in order that innovations may be classified according to differences in the way in which their attributes configure. This more sensitive classification of the artefact permits a clearer exploration of relationship issues between the innovation, its processes and outcomes.

ACKNOWLEDGEMENTS This research has been supported through the assistance of the Engineering and Physical Sciences Research Council as part of the ‘Teamworking for Knowledge Management – Building Capabilities in Complex Environments’ project, grant numbers GR/M72869 and GR/M74092. The University of Cranfield, School of Management has also financially supported this research. I gratefully acknowledge the support of both. Undertaking a PhD, for whatever reason, is a challenge. It is also an indulgence which, curiously for something which is essentially a solitary task, relies on the support and encouragement of others, much of it given unconditionally. I am indebted to friends and colleagues at Cranfield University who have made this a stimulating and enjoyable journey. Notable amongst these are the two Davids, Tranfield and Denyer, who, as supervisors, have kept their hands on the reins, at times loosely and at others tightly, allowing me the freedom to explore and the discipline to craft this thesis. Also, special thanks is due Marie Koulikoff-Souviron who has been a constant and constructive critic of my work over the last four years. I must also pay my thanks to John Towriss who guided me through the complexities of cluster analysis and, Anita Beal, of the Kings Norton Library, for her terrific feats in tracking down references. Of course, this thesis would not have been possible without the willing participation of the various institutions and individuals who have helped identify potential informants and answered my questions. I would particularly like to thank the British Association for Medical Management, the European Forum for Teamwork, the British Journal of Renal Medicine, and ‘Hospital Doctor’ and ‘Doctor’ magazines for granting access. Also, I must thank all the clinicians, nurses and medical managers who have taken an interest in this research and given generously of their time and insights. Finally, I have to thank my family, Jenny, my wife, and our children Tommy and Holly, for their unconditional support, encouragement and tolerance over the life of this PhD. Without them it would simply not have been possible. Actually, not wholly unconditional. Holly, who is only two, demands a ‘lully bink’. But that would take a whole other thesis to explain, and now is not the time.

TABLE OF CONTENTS
1 INTRODUCTION_______________________________________1 1.1 Introduction __________________________________________________ 1
1.2 Rationale _____________________________________________________ 1
1.3 Aims of the research____________________________________________ 4
1.4 Research outline _______________________________________________ 7
1.5 Research contribution __________________________________________ 7
1.6 Structure of the thesis __________________________________________ 9
1.7 Summary_____________________________________________________ 9
2 THE CONTEXT OF THE NHS __________________________11 2.1 Introduction _________________________________________________ 11
2.2 Innovation in Products and Services _____________________________ 11
2.3 Public and service sector innovation studies _______________________ 12
2.4 The context of the NHS ________________________________________ 15
2.5 Drivers for change ____________________________________________ 17 2.5.1 Changes in operating environment __________________________________ 18 2.5.2 Technological change ____________________________________________ 20 2.5.3 Customer changes _______________________________________________ 20 2.5.4 Changing nature of competition ____________________________________ 21
2.6 Summary____________________________________________________ 21
3 CONCEPTUALISING INNOVATION ____________________23 3.1 Introduction _________________________________________________ 23
3.2 Conceptualising Innovation_____________________________________ 23
3.3 Innovation Inputs _____________________________________________ 28 3.3.1 Introduction ____________________________________________________ 28 3.3.2 Structural factors ________________________________________________ 28 3.3.3 Resource factors ________________________________________________ 32 3.3.4 People factors __________________________________________________ 35 3.3.5 Inputs - summary________________________________________________ 38
3.4 Innovation Process ____________________________________________ 38 3.4.1 Process Background _____________________________________________ 38 3.4.2 Process – summary ______________________________________________ 40
3.5 Innovation Type ______________________________________________ 40 3.5.1 Type Background _______________________________________________ 40 3.5.2 Type – summary ________________________________________________ 41
3.6 Innovation Output ____________________________________________ 42 3.6.1 Output Background ______________________________________________ 42 3.6.2 Innovation output - conclusion _____________________________________ 43

3.7 Conclusion___________________________________________________ 43
4 A PHILOSOPHY AND PRACTICE OF CLASSIFICATION IN INNOVATION RESEARCH ________________________________47
4.1 Introduction _________________________________________________ 47
4.2 A philosophy of classification ___________________________________ 47
4.3 Classification in innovation research _____________________________ 56
4.4 Newness _____________________________________________________ 57
4.5 Innovation area of focus _______________________________________ 61
4.6 Innovation attributes __________________________________________ 63
4.7 Discussion ___________________________________________________ 66
5 THE NOTION OF ATTRIBUTES ________________________71 5.1 Introduction _________________________________________________ 71
5.2 Attributes in innovation research ________________________________ 72
5.3 Theoretically-derived attributes _________________________________ 74 5.3.1 Singular items __________________________________________________ 74 5.3.2 Multi-attribute empirical studies ____________________________________ 79
5.4 Discussion ___________________________________________________ 87
5.5 Conclusion___________________________________________________ 89
6 METHODOLOGY AND RESEARCH DESIGN_____________91 6.1 Introduction _________________________________________________ 91
6.2 Ontology and epistemology in management research _______________ 91 6.2.1 Realism _______________________________________________________ 94 6.2.2 Philosophical perspective _________________________________________ 96
6.3 Research design ______________________________________________ 97 6.3.1 Introduction ____________________________________________________ 97 6.3.2 Phase I: How do innovators perceive innovations?______________________ 98 6.3.3 Phase II: Applying the framework, an exploratory survey _______________ 102 6.3.4 Phase III: Exploring the utility of the taxonomy _______________________ 106
6.4 Validity and reliability________________________________________ 107
6.5 Summary___________________________________________________ 108
7 PHASE I, DEVELOPING THE SURVEY INSTRUMENT ___111 7.1 Introduction ________________________________________________ 111
7.2 Paradigm for framework development __________________________ 112 7.2.1 Domain specification____________________________________________ 113 7.2.2 Item generation ________________________________________________ 115 7.2.3 Purification of measures _________________________________________ 116
7.3 Case histories _______________________________________________ 118 7.3.1 Introduction ___________________________________________________ 118

7.3.2 Team A ______________________________________________________ 119 7.3.3 Team B ______________________________________________________ 121 7.3.4 Team C ______________________________________________________ 122 7.3.5 Team D ______________________________________________________ 122
7.4 Data collection and analysis ___________________________________ 123 7.4.1 Collection and analysis of interview data ____________________________ 123 7.4.2 Collection and analysis of repertory grid data_________________________ 124 7.4.3 Collection and analysis of documentary data _________________________ 125 7.4.4 Data coding ___________________________________________________ 126
7.5 Framework elaboration _______________________________________ 128 7.5.1 Newness______________________________________________________ 128 7.5.2 Ideation ______________________________________________________ 135 7.5.3 Application ___________________________________________________ 137 7.5.4 Benefit _______________________________________________________ 143
7.6 Discussion __________________________________________________ 148
8 CLASSIFICATION BY CLUSTER ANALYSIS____________151 8.1 Introduction ________________________________________________ 151
8.2 Cluster analysis______________________________________________ 152 8.2.1 Hierarchical techniques __________________________________________ 153 8.2.2 Non-hierarchical techniques ______________________________________ 156
8.3 Selection of (Dis)Similarity Measures ___________________________ 157
8.4 Selection of Amalgamation Rules _______________________________ 159 8.4.1 Hierarchical methods____________________________________________ 159 8.4.2 Non hierarchical methods ________________________________________ 160
8.5 Processes of Cluster Analysis __________________________________ 161
8.6 Specification of Research Objective _____________________________ 161
8.7 Selection of Variables_________________________________________ 162
8.8 Cluster Analysis Design Issues _________________________________ 162 8.8.1 Sample issues _________________________________________________ 162 8.8.2 Standardisation of measures ______________________________________ 163 8.8.3 Multicollinearity _______________________________________________ 166 8.8.4 Outliers ______________________________________________________ 166 8.8.5 Stopping Rules ________________________________________________ 166 8.8.6 Competing solutions ____________________________________________ 168 8.8.7 Stability of solutions ____________________________________________ 169
8.9 Validation __________________________________________________ 169 8.9.1 Replication____________________________________________________ 170 8.9.2 Monte Carlo Simulations_________________________________________ 171 8.9.3 ANOVA analysis_______________________________________________ 171
8.10 Limitations of Cluster Analysis_________________________________ 171
8.11 Cluster analysis design specification ____________________________ 172
8.12 Summary___________________________________________________ 173

9 PHASE II, SURVEY RESULTS AND ANALYSIS__________175 9.1 Introduction ________________________________________________ 175
9.2 Software for statistical analysis_________________________________ 175
9.3 SPSS® procedure ____________________________________________ 176 9.3.1 File template __________________________________________________ 177 9.3.2 Data integrity__________________________________________________ 177 9.3.3 Data analysis __________________________________________________ 178
9.4 Analysis 1: Ward’s method ____________________________________ 179 9.4.1 Unconsolidated data ____________________________________________ 179 9.4.2 Consolidated data ______________________________________________ 179 9.4.3 Comment _____________________________________________________ 179
9.5 Analysis 2: Furthest neighbour_________________________________ 182 9.5.1 Unconsolidated data ____________________________________________ 182 9.5.2 Consolidated data ______________________________________________ 182 9.5.3 Comment _____________________________________________________ 182
9.6 Analysis 3: Within-groups linkage ______________________________ 184 9.6.1 Unconsolidated data ____________________________________________ 184 9.6.2 Consolidated data ______________________________________________ 184 9.6.3 Comment _____________________________________________________ 184
9.7 Analysis 4: Pearson correlation ________________________________ 186 9.7.1 Unconsolidated data ____________________________________________ 186 9.7.2 Consolidated data ______________________________________________ 186 9.7.3 Comment _____________________________________________________ 186
9.8 Preferred solution____________________________________________ 190
9.9 Non hierarchical refinement ___________________________________ 190 9.9.1 SPSS® procedure ______________________________________________ 190
9.10 Comparison of K-Means analyses ______________________________ 192
9.11 Cluster profiles ______________________________________________ 193 9.11.1 Profiling by cluster variables______________________________________ 193 9.11.2 Profiling by non-cluster (independent) variables ______________________ 196
9.12 Results and discussion ________________________________________ 198
9.13 Summary___________________________________________________ 203
10 PHASE III, THE TAXONOMY IN THE CONTEXT OF INNOVATION PROCESS _________________________________205
10.1 Section 1 - Introduction _______________________________________ 205
10.2 Process Research ____________________________________________ 205
10.3 Event sequence models________________________________________ 210 10.3.1 Linear________________________________________________________ 210 10.3.2 Recursive_____________________________________________________ 214 10.3.3 Chaotic_______________________________________________________ 216

10.4 Process activities_____________________________________________ 217 10.4.1 Idea generation and screening _____________________________________ 217 10.4.2 Business analysis_______________________________________________ 217 10.4.3 Technical development and testing _________________________________ 219 10.4.4 Innovation launch ______________________________________________ 219
10.5 Enabling climate_____________________________________________ 219
10.6 Management commitment_____________________________________ 221 10.6.1 Norms _______________________________________________________ 221 10.6.2 Top management support ________________________________________ 221 10.6.3 Resource allocation _____________________________________________ 221
10.7 Group factors _______________________________________________ 222 10.7.1 Champions and leadership________________________________________ 222 10.7.2 Autonomy ____________________________________________________ 223 10.7.3 Social factors __________________________________________________ 224 10.7.4 Group orientation ______________________________________________ 225 10.7.5 Vision _______________________________________________________ 225
10.8 Section 2 - Investigating process amongst exemplar teams __________ 226
10.9 Research method ____________________________________________ 226 10.9.1 Data collection and sample _______________________________________ 226 10.9.2 Data analysis __________________________________________________ 227
10.10 Results _____________________________________________________ 227 10.10.1 Type 1 Innovations_____________________________________________ 228 10.10.2 Type 2 Innovations_____________________________________________ 229 10.10.3 Type 3 Innovations_____________________________________________ 234
10.11 Findings____________________________________________________ 235
10.12 Summary___________________________________________________ 240
11 CONCLUSION _______________________________________243 11.1 Introduction ________________________________________________ 243
11.2 Research contribution ________________________________________ 245 11.2.1 Contribution to academic theory ___________________________________ 245 11.2.2 Contribution to the methodology of innovation research ________________ 249 11.2.3 Contribution to the theory of practice _______________________________ 250
11.3 Validity, limitations and future research _________________________ 252
11.4 A final thought ______________________________________________ 257
References_______________________________________________259 Appendices ______________________________________________293

TABLE OF FIGURES, TABLES AND APPENDICES Figure Page
Figure 1-1: Gradual ascension to general theory through the integration of progressively more abstract bodies of midrange theories (Source: adapted from Pinder & Moore, 1979; 108) _________________________________ 6 Figure 1-2: Research outline _____________________________________ 8 Figure 2-1: Forces driving innovation (Source: adapted from Sheth & Ram, 1987) ________________________________________________________ 18 Figure 3-1: Input-process-output model _____________________________ 26 Figure 6-1: Inductive/retroductive research approach __________________ 100 Figure 7-1: Paradigm for the better measurement of constructs (adapted from Churchill, 1979) ___________________________________________ 113 Figure 7-2: Repertory grid, informant C2 ___________________________ 125 Figure 7-3: Framework of attributes of innovation ____________________ 128 Figure 8-1: Dendrogram illustrating hierarchical clustering (fictional data) _ 154 Figure 8-2: Graphical plot of agglomeration schedule (fictional data) _____ 156 Figure 8-3: Comparison of distance and correlational measures __________ 158 Figure 9-1: Percentage changes in agglomeration coefficient. Analysis by Ward’s method. Consolidated and unconsolidated Monte Carlo and empirical data _________________________________________________ 180 Figure 9-2: Dendrogram showing suggested 3-cluster solution from Ward’s method, consolidated data ________________________________________ 181 Figure 9-3: Percentage changes in agglomeration coefficient. Analysis by furthest neighbour method. Consolidated and unconsolidated Monte Carlo and empirical data ______________________________________________ 183 Figure 9-4: Percentage changes in agglomeration coefficient. Analysis by within groups linkage method. Consolidated and unconsolidated Monte Carlo and empirical data _________________________________________ 185 Figure 9-5: Percentage changes in agglomeration coefficient. Analysis by Pearson correlation. Unconsolidated Monte Carlo and empirical data ______ 187 Figure 9-6: Percentage changes in agglomeration coefficient. Analysis by Pearson Correlation method of consolidated Monte Carlo and empirical data _____________________________________________________________ 188 Figure 9-7: Pearson correlation dendrogram (empirical, consolidated) _____ 189 Figure 9-8: Cluster profiles by variable means _______________________ 195 Figure 10-1: 50 years of innovation process models, after Wolfe (1994) ___ 211 Figure 10-2: Dendrogram showing clusters of innovation types according to process factors _________________________________________________ 239

Table Page Table 2-1: Contrasting products, services and the NHS along Atuahene-Gima’s (1996) dimensions _______________________________________ 12 Table 2-2: Database returns for keyword search on ‘innovation’, ‘service’ and ‘health’ ___________________________________________________ 13 Table 2-3: Innovation research in the health sector ____________________ 14 Table 2-4: Contrasting characteristics of NHS and private sector organisations (Source: adapted from McNulty and Ferlie, 2002) __________ 15 Table 2-5: Key events in the history of the NHS ______________________ 17 Table 3-1: Dispersion of innovation research ________________________ 27 Table 3-2: The input-process-output model of innovation _______________ 44 Table 4-1: Comparison of taxonomic and typological approaches to classification __________________________________________________ 51 Table 4-2: Guidelines for classification exercises (Source: McKelvey, 1975; 512-522) _____________________________________________________ 53 Table 4-3: Classification schemes in innovation studies ________________ 57 Table 4-4: Classification by innovation area of focus __________________ 62 Table 4-5: Limitations of approaches to innovation classification ________ 67 Table 5-1: Innovation attributes, singular items (after Wolfe, 1994) ______ 79 Table 5-2: Rogers’ (1983) framework ______________________________ 80 Table 5-3: Citations of multi-attribute innovation studies (Source: Web of Science, March 2003) ___________________________________________ 81 Table 5-4: Needed research on innovation attributes (Source: Rogers and Shoemaker, 1971; 168-172) ______________________________________ 81 Table 5-5: Empirical multi-attribute studies of innovation ______________ 83 Table 5-6: Problematising attribute-centric studies ____________________ 88 Table 6-1: Continuum extremes of competing philosophical perspectives and implications for management research (adapted from: Blaikie, 1993; Denzin and Lincoln, 1994; Easterby-Smith et al.,1994; Johnson and Duberley, 2001) ________________________________________________ 93 Table 6-2: Bhaskar’s overlapping domains of reality (adapted from Bhaskar, 1978; Blaikie, 1993; 60) __________________________________ 95 Table 6-3: Three exploratory phases of empirical research ______________ 98 Table 6-4: Comparison of approaches to questionnaire administration (after de Vaus, 1996; Oke, 1999) _______________________________________ 104 Table 6-5: Phase II sample _______________________________________ 105 Table 6-6: Evaluation of suitability of potential respondents ____________ 106 Table 6-7: Validity and reliability, guiding principles (adapted from Yin, 1994; Miles and Huberman, 1994) _________________________________ 108 Table 7-1: Component parts of innovation (after West and Farr, 1990) ____ 112 Table 7-2: Framework definitions and antecedent literature _____________ 115

Table 7-3: Alpha coefficients of framework scales ____________________ 118 Table 7-4: Data analysis, coding to a pre-existing sub-category __________ 127 Table 7-5: Data analysis, coding to emergent sub category ______________ 127 Table 7-6: Sub-categories of innovation category newness ______________ 129 Table 7-7: Operationalising novelty ________________________________ 130 Table 7-8: Operationalising departure ______________________________ 132 Table 7-9: Operationalising disruption ______________________________ 133 Table 7-10: Operationalising risk __________________________________ 135 Table 7-11: Sub-categories of innovation category ideation _____________ 135 Table 7-12: Operationalising ideation ______________________________ 137 Table 7-13: Sub-categories of innovation category application ___________ 137 Table 7-14: Operationalising uncertainty ____________________________ 138 Table 7-15: Operationalising scope ________________________________ 140 Table 7-16: Operationalising complexity ____________________________ 142 Table 7-17: Operationalising adaptability ___________________________ 143 Table 7-18: Sub-categories of innovation category benefit ______________ 143 Table 7-19: Operationalising actual operation ________________________ 146 Table 7-20: Operationalising relative advantage ______________________ 146 Table 7-21: Operationalising profile _______________________________ 147 Table 7-22: Operationalising observability __________________________ 148 Table 7-23: Comparison of multi-attribute innovation studies ___________ 149 Table 8-1: Illustration of an agglomeration schedule (fictional data) ______ 155 Table 8-2: Comparison of popularly used clustering procedures (adapted from Aldenderfer and Blashfield, 1984; Milligan, 1996; Hair et al., 1998) __ 160 Table 8-3: Comparisons of cluster analysis design in this research against the prescriptions of Hair et al. (1998) and Milligan (1996) ______________ 161 Table 8-4: Counter measures to weaknesses of cluster analysis __________ 172 Table 8-5: Cluster analysis research design __________________________ 173 Table 9-1: SPSS® data files ______________________________________ 176 Table 9-2: SPSS® labelling and formatting __________________________ 177 Table 9-3: Survey response descriptive statistics ______________________ 178 Table 9-4: SPSS® analysis procedure _______________________________ 178 Table 9-5: Summary of cluster membership. Ward’s method, 3-, 4- and 5-cluster solutions, consolidated and unconsolidated data _________________ 179 Table 9-6: Summary of cluster membership. Furthest neighbour method, 3- and 5-cluster solutions, consolidated and unconsolidated data ____________ 182 Table 9-7: Summary of cluster membership. Within groups linkage 3-, 4- and 5-cluster solutions. Consolidated and unconsolidated data ___________ 184 Table 9-8: Initial cluster centres (seed points) 3-cluster solution _________ 191 Table 9-9: Initial cluster centres (seed points) 4-cluster solution _________ 191 Table 9-10: Comparison of cluster membership for 3-cluster solution. Analysis by Ward’s method and K-Means ___________________________ 192 Table 9-11: Comparison of cluster membership for 4-cluster solution. Analysis by Ward’s method and K-Means ___________________________
192
Table 9-12: Interdifference matrix for 3-cluster solution ________________ 193

Table 9-13: Interdifference matrix for 4-cluster solution ________________ 193 Table 9-14: Cluster membership, 3-cluster solution ___________________ 194 Table 9-15: Final cluster centres for 3-cluster solution (after K-Means refinement) ___________________________________________________ 194 Table 9-16: ANOVA analysis, 3-cluster solution _____________________ 196 Table 9-17: Innovation functional types ____________________________ 197 Table 9-18: Chi squared test, association between cluster membership and innovation area of focus _________________________________________ 198 Table 9-19: Chi squared test, association between cluster membership and source _______________________________________________________ 199 Table 9-20: Chi squared test, association between cluster membership and clinical type ___________________________________________________ 200 Table 9-21: Chi squared test, association between cluster membership and functional type _________________________________________________ 200 Table 9-22: Chi squared test, association between cluster membership and novelty _______________________________________________________ 201 Table 9-23: Chi squared test, association between cluster membership and newness ______________________________________________________ 201 Table 9-24: Overview of type 1 innovations _________________________ 202 Table 9-25: Overview of type 2 innovations _________________________ 202 Table 9-26: Overview of type 3 innovations _________________________ 202 Table 10-1: Process factors uncovered in Phase I _____________________ 207 Table 10-2: Five generations of innovation process (Source: Rothwell, 1992) ________________________________________________________ 208 Table 10-3: Methodological approaches to project selection _____________ 218 Table 10-4: Enabling conditions of innovative organisations ____________ 220 Table 10-5: Inputs to the innovation process _________________________ 222 Table 10-6: Phase III sample, characteristics _________________________ 227 Table 10-7: Innovation 188, issue-solution cycle _____________________ 233 Table 10-8: Comparison of innovations’ process characteristics __________ 238 Table 10-9: Item process and type membership _______________________ 239 Table 11-1: Sequence of operations in numerical taxonomy developed in biological sciences and applied in innovation research (after Sneath and Sokal, 1973; 5) __________________________________________________ 250

Appendix Page
Appendix One: Innovation newness ________________________________ 293 Appendix Two: Innovation area of focus _____________________________ 301 Appendix Three: Innovation attributes ______________________________ 305 Appendix Four: Phase I interview protocol __________________________ 310 Appendix Five: Survey instrument and covering documentation __________ 313 Appendix Six: Case history summary sheet ___________________________ 319 Appendix Seven: Content analysis of repertory grids, an example from team D ____________________________________________________________ 320 Appendix Eight: Preliminary coding to the innovation framework, illustrative extracts from team A ____________________________________ 325 Appendix Nine: Early renditions of the framework _____________________ 329 Appendix Ten: Interview protocol and indicative lines of enquiry, Phase III _ 330

“A wit has said that one might divide mankind into officers, serving maids and chimney sweeps. To my mind this remark is
not only witty but profound, and it would require a great speculative talent to devise a better classification”
(Kierkegaard, 1941; 56).

- 1 -
1 INTRODUCTION
1.1 Introduction The research reported on in this thesis focuses on the question of the classification of innovations. The research addresses the question of whether or not innovations, conceptualised as configurations of a range of ‘attributes’1, may be grouped into discrete and distinct categories, and consequently classified. Classification plays an important role in the social sciences. Bailey (1994) identifies some of its benefits: classification is an aid to description, it can help to reduce complexity and enable comparison, classifications can be used as the basis for the identification of similarities and differences and contribute to the study of relationships. Classification is then, not an end in itself but has some instrumental purpose. Consequently, although the main contribution of this research is the development of a novel taxonomy of innovation, its instrumentality is demonstrated by its application in the context of innovation process and its relationship to innovation artefact. It is partly true to say that this research was borne out of frustration. Frustration at being unable to find a satisfactory and justifiable system for the comparison of innovations one against the other. As is often the case though, the devil was in the detail and the apparently innocuous question stimulated a line of enquiry not initially envisaged. The research question has its origins in pragmatic concerns with regard to innovation management in organisational settings but is addressed in a sectoral-specific study, namely the UK National Health Service (NHS). Nevertheless, it is thought that the results of the research can at the very least, be helpful in suggesting propositions that may be generalisable beyond that sector and explored in others. There is though, also a more fundamental issue that forms the theoretical core of this thesis. By adopting a configurational approach, the thesis investigates how and to what extent a conceptualisation of innovations more sensitive to their multidimensionality presents the opportunity to gain new insights into key innovation management issues. In this research there are two clear foci of attention: the substantive issue and the context. The substantive issue of the research is the conceptualisation and consequent classification of innovation in the context is the NHS. The purpose of this introductory chapter is to outline the origins of this doctoral research project, to delimit its boundaries and indicate the shape and content of the following chapters.
1.2 Rationale Change is a fundamental condition of human existence and the potential for change exists wherever there is turbulence within an environment or system (Smith, 1982). The history of mankind is characterised by patterns of crises, turbulence and responses in which the ability to adapt is recognised as being crucial to survival. As members of
1 The terms ‘attributes’, ‘perceived characteristics’ and ‘properties’ are used interchangeably in the literature to describe individuals’ perceptions of their innovations. In this thesis, the term ‘attributes’ is used throughout.

- 2 -
systems pass through stages of increasing turbulence, their adaptive response mechanisms are challenged by the complexity and change implicit in that turbulence (McCann and Selsky, 1984). Members who face an overload of demand for change relative to their capacity to accommodate that demand must innovate or contemplate extinction. The capacity to innovate is regarded as one key response mechanism in turbulent conditions (Sastry, 1997). It is argued that the rate of the pace of change in the world continues to accelerate. Many organisations describe themselves as operating in hyper-competitive, turbulent environments where short periods of advantage are punctuated by frequent disruptions (Johannessen et al., 1999). Rapid technological change, shortening product lifecycles, fragmented niche markets, dynamic regulatory environments, increasingly mobile workforces, and changing customer demographics and expectations characterise the environment for many organisations. Many organisations describe themselves as operating in such turbulent environments and in order to remain competitive they must constantly create new strategies, processes, products and ways of working (Nonaka and Yamanouchi, 1989; DTI, 1998). This accelerated competitive environment has highlighted the continued importance of innovation for an organisation's ability to compete, even survive: indeed few issues are characterised by as much agreement as the importance of innovation for social and economic development (Van de Ven, 1986). Innovation, then, continues to remain important for organisations of all types. In order to meet the demands of a competitive environment, to cope in the face of aggressive product innovation and increased and changing customer expectations, to develop new products for long-term survival or adapt in order to be able to deliver new services as a result of technological change, organisations are required to make changes in order to survive. Giaoutzi et al.’s (1988) view is potentially apocalyptic. They envisage a scenario in which, without morphogenic or morphostatic transformation, economies and organisations would stagnate and eventually crumble. Understanding, therefore, how innovation works, continues to be a significant agenda item for many researchers. In the field of organisations and management innovation is broadly associated with economic advancement, improved prosperity, health, welfare and education and, advances in knowledge and other human endeavours. Schumpeter (1934) argued that innovations were a most potent source of competitive advantage. If a strategy of innovation can be purposefully chosen as a device for organisational survival, competitive advantage or adaptation, then the processual aspects of its management are crucial. At the most fundamental level, innovation is conceived to be about two things: the processes by which inputs are converted into something new and, the results or outcome of those processes. Innovation is both a process and an outcome. The concept of organisational survival is suggestive of an evolutionary perspective and whilst this research borrows little from evolutionary theory it does make use of some of its analytic techniques and broader perspectives and so it would be useful to delineate those areas. The management sciences, particularly organisational research and aspects of strategic management research, have already learned much from the

- 3 -
biological sciences in which many of the principles and techniques of classificatory science have been developed. In the same way that there is an enormous diversity of life on earth there is too a diversity of innovations. As biologists communicate with each other about organisms by classifying them into groups so too do innovation theorists with their phenomenon of interest. Ideally, the classification, which is the identification and description of groups, should be meaningful and not arbitrary (though Gold (2002) argues that ultimately all classifications might be described as arbitrary). Pinder and Moore (1979), for example, describe the succession of criteria used as the basis for delineating between species: first, ‘character discontinuity’ (physical differences), second ‘genetic compatibility’ (ability to create progeny together) and, thirdly, ‘evolutionary lineage’ (commonality of ancestry). Each of these classification systems has developed as a response to insufficiencies in previous approaches. For example, the move from ‘character discontinuity’ to ‘genetic compatibility’ was prompted by the observation that
“…geneticists continually encountered instances in which plants or animals that were thought to be of a common species could not produce progeny together, whereas individuals from what were thought to be different species were able to procreate successfully” (Pinder and Moore, 1979: 109).
This research locates itself in a similar school of thought. Existing classification systems are argued to be insufficient and an alternative is proposed. Classification, however, is only one aspect of the much larger field of phylogenetic systematics. Systematics is an attempt to understand the evolutionary interrelationships of living things, trying to interpret the way in which life has diversified and changed over time. While classification is primarily the creation of names for groups, systematics goes beyond this to elucidate new theories of the mechanisms of evolution. In this sense this research is more about classification than it is about systematics. The over-riding objective of the research is to explore the viability of a classification system based on new criteria. However, given that the viability of a system of classification is largely determined by its usefulness (Everitt et al., 2001), observations about the viability of the system are drawn, in this research, from an investigation of the processes underpinning each of the categories in the classification system. This is similar to the case in the biological sciences in which relationships between specie characteristics and evolutionary processes have been a focus. Darwin famously describes scientists as being of one of two types, lumpers or splitters: Splitters disaggregate phenomena into very small units - their opponents say that if they can tell two animals apart, they place them in different genera, and if they cannot tell them apart, they place them in different species. Lumpers aggregate into large units: their opponents say that if a carnivore is neither a dog nor a bear they call it a cat (Simpson, 1945). That is, splitters maintain that small differences in salient characteristics should be the basis for new species. Splitters might be construed as specialists and lumpers as generalists.

- 4 -
In offering a configurational approach to innovation conceptualisation this research owes a debt to the splitters without whose work the construction of a multidimensional framework would have been considerably more difficult. But, in suggesting a configurational or holistic approach to the study of the phenomenon of interest this research aligns itself with similar approaches in other disciplines. The approach is somewhat reflected in health care, Peckham (1998) underscores the apparent paradox of genetic research tantalisingly holding the promise of understanding an individual’s uniqueness and yet people are seeking ‘whole person’ forms of health care. In strategic management Mintzberg, Ahlstrand and Lampel (1998) want a view of the ‘whole beast’ of strategy formation rather than just its constituent parts. Finally, in organisational studies scholars have argued strongly for a configurational approach that allows for the analysis of synthesis rather than component parts (Miller and Mintzberg, 1983; Meyer et al., 1993). Each of these is driven by the belief that the configurational approach offers potentially richer insights and understanding, as Miller and Mintzberg conclude
“…it can open the eyes of the researcher to the study of whole beasts, each a logical combination of its own characteristics, similar to all members of its own species, yet fundamentally different from those of other species” (1983; 72).
1.3 Aims of the research It is held to be common to many PhD projects that the substance of the research question modifies over the lifetime of the study. It has been no different for this research project. An initial research question was posed, structured around the issue of the relationship between team processes and innovation outcomes, gestated over a 10-year period working in a variety of teams in the transitional economies of the former Warsaw Pact countries. Underpinning many of the studies of innovation is the assertion that innovations differ one from the other and that it is these differences that explain variance in organisational performance, innovation performance and innovation process. To research a question in this area required, not least, a stable and constant framework to enable the comparison of innovations, one against another. Whilst many innovation classification frameworks exist in the literature they appear to lack any strong scientific basis and, consequently, the use of them is difficult to justify. What was found, instead, was a large number of competing classifications, which themselves could be categorised into one of three different types (classification by newness, area of focus and attribute, see Chapter four). The justification for operationalising any of these approaches appears largely to be a matter of analytic convenience and historic convention. In and of themselves each of these approaches and schemes provide the mechanisms by which some sense can be made of the diversity of innovation. However, cumulatively studies operationalising these systems of classification have tended to be associated with inconsistent or contradictory results (Wolfe, 1994). Furthermore, there appears to be no scientific or warranted basis for inclusion in further studies of innovation. Part of the difficulty in generalising from previous innovation studies, with subsequent implications for theory, is the problem of the innovation/context relationship. Innovations are developed and applied in different social contexts which gives each innovation process unique, context-specific

- 5 -
characteristics. So, whilst there have previously been attempts to describe the innovative outcomes, comparison of outcomes across cases has been made difficult by local contextualisation rendering generalisation difficult. These confounding observations largely motivate this research. The dominant theme of the research, which in the early stages focused on team processes underpinning innovation outcomes, consequently became subsumed by the over-riding priority of developing a theoretically-derived and empirically-developed, scientifically derived and practical framework for the comparison of innovations. The focus on process diminished. It is something of a truism for any of the sciences, that it is on the basis of formal and agreed classifications, that diversity can first be managed and second, begun to be understood (McCarthy and Ridgway, 2000; Hey, 2001). In the absence of a formal, warranted, scientifically justifiable and agreed classification of innovations suitable for operationalisation in large multi-innovation studies, the initial research proposition (comparison of team processes) became untenable. Consequently, an imperative developed to consider how a formal framework of innovation outcome classification might look. Knowledge creation is underpinned by the availability of widely accepted and usable classification schemes. Differences between innovations tend to have been articulated by invoking one of three categories of classification (newness, area of focus or attribute – see Chapter four). These systems have contributed to the development of a vast body of contextual research but have thwarted efforts to build a cumulative and generalisable body of theory. The premise underpinning this research is that it is due to the inadequacies of under-specification, inappropriateness and absence of scientific method in the classification systems that distinguish innovations that theory tends to remain at a low level. Indeed there tends to be little in the way of mid-range and no general or universal theories of innovation. Such a thing remains beyond the grasp of researchers. The myriad of past approaches to the study of innovation led Wolfe (1994; 405) to observe that “the most consistent theme found in the organizational innovation literature is that its research results have been inconsistent” (original emphasis). Pinder and Moore (1979) provide a useful illustration of how sub-groups of theory might eventually contribute to the development of higher order theories based on a more complete understanding of the various dimensions of the phenomenon of interest (see figure 1-1). This research proposes an approach to classification that addresses the issues of under-specification and inappropriateness by further developing one of the existing classification systems. This approach, classification according to the attributes of an innovation, has received some theoretical attention but examples of operationalised multidimensional attribute frameworks are rare. A theoretically derived and empirically developed framework is operationalised in order to explore whether or not this more sensitive (in terms of its multidimensionality) conceptualisation contributes to generating new insights into the nature of innovation.

- 6 -
Figure 1-1: Gradual ascension to general theory through the integration of progressively more abstract bodies of midrange theories (Source: adapted from Pinder & Moore, 1979; 108) The research contends that a conceptualisation of innovation along unconnected, isolated dimensions, as a unidimensional or bi-dimensional construct, is incomplete. A robust and substantive conceptualisation must include a series of dimensions. Further, previous scholars have operationalised existing or modified classificatory systems without questioning the origins of those systems. Whilst these might provide a convenient basis for classification, in highly contextualised studies, their specificity can restrict their use in generating insights across a range of studies. If innovations can be measured along a series of dimensions, described by their attributes, it would not be unreasonable to expect that innovations would differ, one from another, according to the degree, presence or absence of any of those dimensions. That is, innovations may be distinguished by different configurations of their attributes. The configurational approach is especially relevant to the study of multidimensional phenomena where the challenge is to manage multiple discrete data combinations along dimensions that provide a richer understanding/description of the phenomenon of interest (Ketchen and Shook, 1996). As Chapters three to six demonstrate, innovation can be regarded as a multidimensional phenomenon and the configurational approach adopted for this study makes an important contribution in innovation research. At the heart of configuration analysis is the assumption that by identifying internally consistent and externally distinct groupings of the phenomenon, that hold across all instances of the phenomenon, rich insights and better understanding can be achieved (Ketchen and Shook, 1996).
General theory of innovation – pertaining to all types of innovation
Mid range theory of higher order for
innovation type beta
Mid range theory of higher order for
innovation type alpha
Midrange theory for innovation
type A
Contextual innovation theory 1
Contextual innovation theory 2
Contextual innovation theory 3
Contextual innovation theory 4
Contextual innovation theory 5
Contextual innovation theory 6
Contextual innovation theory 7
Midrange theory for innovation
type B
Midrange theory for innovation
type C
Midrange theory for innovation
type D

- 7 -
A configurational approach immediately prompts a series of questions. These questions are listed here for purposes of clarity, but their origination is more fully described in subsequent chapters. Do distinct configurations of innovation exist where innovations are construed in terms of their attributes? Do similarly configured innovations share common origins in terms of process? Hence, the research is underpinned by the assumption that pattern may be representative of process and that the processual origins of innovations may be identified and understood from the identification of similarities and differences in salient distinguishing characteristics (i.e. attributes) of the innovation artefact. By grouping similarly configured innovations into clusters, any underlying patterning or structuring can provide the researcher with a means of revealing relationships among the observations that is not necessarily possible from individual observations. If the underlying patterning does not directly portray such relationships then at least it may suggest areas for further investigation (Hair et al., 1998).
1.4 Research outline This section provides a brief overview of the principal methodological features of the study. These are illustrated in figure 1-2.
1.5 Research contribution Classification is an integral part of innovation research and innovation ‘types’ have been both the dependent and independent variable in previous studies. It is argued that previous approaches have been insufficiently specified resulting in highly contextual studies, poor opportunity for comparative research and the generation of low- and mid-range theory. This thesis builds on previous research that has developed and operationalised frameworks of innovation classification. It augments previous studies that have developed and utilised innovation typologies by empirically deriving basic configurational types from a large base of innovations. In building and proposing a theoretically derived and empirically developed framework of innovation this research fills a well-documented gap in the literature (Downs and Mohr, 1976; Wolfe, 1994) for a robust framework capable of broadly specifying innovations. This research contributes to the existing body of knowledge by proposing and developing a framework of innovation based on the perceived attributes of the innovation as held by innovators and users. The study also contributes to the movement for a configurational approach in organisational and management studies. Previous studies have tended to conceptualise innovation in narrow terms, on one or maybe two dimensions. The proposed framework has the merit of generality and can thus be deployed for cumulative and comparative research. By facilitating comparisons it promises the opportunity for a series of new insights and propositions on the nature of innovation that can be explored in different contexts and compared back to earlier studies, thereby building up a body of consistent data from which theory development can occur. However, limitations with the framework are also identified and opportunities for refining the research are noted.

- 8 -
Figure 1-2: Research outline
Identify gap, develop conceptual framework from a diverse literature: innovation, NPD, services, health
care, classification sciences.
Literature Search and Review
4 Exploratory Case Studies
Framework Development
Framework Validation
Item Generation
Instrument testing
Apply Instrument
Data Analysis
Exploration of Process
Snowballing, conversations database search, authorities, definitionally
guided.
To develop empirically and validate observations drawn from the literature on innovators’ perceptions of their
innovations and processes.
Integration and synthesis of literature and empirical data into a comprehensive but parsimonious framework of
innovation.
To ensure the validity of qualitative research conclusions.
To operationalise the framework in the form of a survey instrument.
To establish acceptable levels of validity & reliability.
To gather data on characteristics of 310 innovations in NHS, drawn from diverse sources.
To explore possible cluster solutions for a taxonomy of innovation based on attributes.
To explore the process activities, sequence and enabling conditions underpinning categories of the taxonomy.
ACTIVITY OBJECTIVE OBSERVATIONS
Personal construct theory, repertory grid analysis, semi-structured interview.
Analysis facilitated by NVivo software.
Content analysis, constant comparison, retroductive method.
Case study protocol, data triangulation, structured approach. Conclusions
disseminated and validated through conferences & case study teams.
Items drawn from the literature and newly generated.
Validated in pilot amongst discipline and domain relevant experts.
Postal survey.
Hierarchical and non-hierarchical cluster analysis.
9 semi-structured interviews of exemplars and random items from the
cluster solution.
Analysis and conclusions

- 9 -
Finally, although research into the processes of innovation already forms a sizeable corpus it has been significantly neglected in the context of the NHS. The NHS has recently embarked on an unprecedented journey of change. In the context of medical practice, as clinicians increasingly take on managerial responsibilities, there is a latent demand for frameworks that give new insights into the nature of innovation.
1.6 Structure of the thesis The thesis comprises of five distinct sections. These sections are described below. Chapters 1 and 2 set the scene and focus of the research, they include a brief description of the importance of the way in which innovation is conceptualised, how it is conceptualised in the literature and the problems associated with those conceptualisations. The context of the NHS is also discussed and an argument put forward justifying its selection as a suitable context in which to study innovation. Chapters 3 to 5 review the literature addressing the double issues of classification in innovation research and the development of the conceptual framework and research questions. Chapter 6 describes the philosophical position, research strategy and method. Chapters 7 to 10 present the data, results and analysis from three phases of empirical study. The first phase is a study of 4 exemplar innovations in the NHS. The results of this study are integrated with inductively derived data from the literature in order to produce a multi-attribute framework for describing the artefacts of innovation. Subsequently the framework is operationalised as a 56-item survey instrument and administered to 310 innovations in the NHS. Usable responses to the survey numbered 171 and these were subject to cluster analysis techniques in order to provide a systematic and rigorous grouping of items. Cluster analysis delivers a preferred solution of three distinct innovation types. These are then described according to their constitutive characteristics. The three types form the basis of the final round of enquiry into the processes that underpin each of these types. The data and analysis on process is preceded by a discussion of the perspectives on process found in the literature. Nine innovations selected from across the emergent clusters were further interrogated on the processes underpinning their innovations. Chapter 11 discusses the findings, making links back to the literature and considers the contribution to knowledge made by the study. The limitations of the research are also explored along with implications for practice and opportunities for further research.
1.7 Summary It is suggested that one way of moving toward new insights and a more generalisable understanding of the nature of innovation is through a multidimensional conceptualisation based on the attributes of innovations. At the heart of this research is a theoretically derived empirically developed formal framework describing innovation outcome. This framework has been developed as a response to calls identifying an absence in the literature of a comprehensive but parsimonious framework capable of facilitating cumulative research.

- 10 -
The principal objective of this research is to develop a new conceptual tool to facilitate cross case and cumulative research in innovation studies. A large number of competing frameworks, that have been successfully operationalised, exist in the literature. This research challenges the approaches to innovation classification that have by historic convention become the de facto variables in much innovation research. The objective is to produce a discrete but manageable taxonomy to form the basis of a more sensitive understanding of innovation. This research builds on previous work by adopting a holistic approach to the conceptualisation of innovation based on the multidimensionality of innovation outcomes. This is accomplished first by combining typologic and taxonomic classifications (Adams and Tranfield, 2002) to create a perceptual framework that informs the development of a survey instrument. Second, the survey instrument is applied to innovations in the NHS and returns subjected to quantitative statistical analysis to yield clusters of innovations whose members are distinct from members of other clusters according to different configurations of attributes. The framework is deliberately applied exclusively in one sector of the economy, the health sector, specifically the NHS. Generalising the results from one sector into another is clearly problematic. However, concentration of the research focus can help to identify and isolate factors that clarify the nature of the phenomenon in that sector and, at the very least, can be helpful in suggesting propositions that may be generalisable beyond that sector and tested in others (Kimberly and Evanisko, 1981). In addition, given the exploratory nature of this research and the unique circumstances of the NHS (which are expounded upon in the following chapter) this single sector focus is justified. In summary, this project seeks to develop a useful framework for describing the properties of the products or artefacts of innovation processes. The usefulness of the framework may be determined by the extent to which it facilitates comparison across cases. In doing so a wide range of innovations originating in the NHS are examined according to innovators’ perceptions. These innovations are organised into groups according to rules specifying that members of a group are more similar to each other than they are to members of any other group. Subsequently selected examples from each of the groups are further examined with regard to the processes by which they came about. The following Chapter considers the context of the NHS.

- 11 -
2 THE CONTEXT OF THE NHS
2.1 Introduction During the life of this research project the notion of investigating innovation in the NHS has been met with varying degrees of perplexity, even derision. Eyebrows are raised in quizzical expression as familiar litanies about the inability of the public sector in general and the NHS in particular to innovate and change continually get rehearsed. Regrettably, some of this originates amongst researchers of innovation. This chapter identifies four reasons justifying the selection of the NHS as a context for the study of innovation. First, characteristics of NHS service are contrasted with characteristics of products from NPD. It is argued that service and product innovations are sufficiently different to suggest that theory generated in one domain may not be generalisable to the other. Second, services in general and healthcare in particular are important features of the UK economy and yet have been neglected in terms of their study. Third, in this chapter organisational characteristics of the NHS are compared against those of organisations from the private sector to determine the extent of similarity between the two organisational types. It is argued that they are sufficiently dissimilar that it is uncertain that results of innovation research generated from studies of new product development (NPD) and innovation in the private sector, from where the bulk of innovation research originates, can reliably be generalised to the NHS. Finally, utilising a framework for analysis developed by Sheth and Ram (1987) it is demonstrated that the NHS is susceptible and subject to similar drivers of innovation as organisations in the private sector. Much of the historical data in this Chapter has been drawn from Rivett’s excellent history of the NHS ‘From cradle to grave: fifty years of the NHS’ (Rivett, 1998).
2.2 Innovation in Products and Services The separate study of service innovation from product innovation is increasingly being justified in terms of the dissimilarity of the two. Atuahene-Gima (1996) characterised four dimensions along which products and services differ: tangibility, separability, heterogeneity, and perishability. Services can be considered to be intangible, in that they are difficult to evaluate and assess before consumption (Sundbo, 1997). Intangible services are also more difficult to protect from imitation by, say, patenting. Inseparability (simultaneity, synchronicity, co-terminality) describes the concurrent production and consumption of services, which implies the necessity of and opportunity of close connections between personnel and consumers in order to understand better customer needs. Heterogeneity refers to the variability in the quality of services offered. Finally, perishability reflects the fact that services, unlike products cannot be stored thereby leading to problems in matching supply and demand (Atuahene-Gima, 1996). Services, products and the NHS are compared against these dimensions in table 2-1.

- 12 -
Dimension NPD Services NHS Tangibility Tangible Intangible Predominantly intangible but not easily
imitated because of high barriers to entry (e.g. skill requirements, resources).
Separability Separable Inseparable Predominantly inseparable but becoming increasingly separable with time
Homogeneity Homogenous Heterogeneous In principle homogenous, in practice heterogeneous
Perishability Imperishable Perishable Has the potential to be stored in terms of advice given to patients – i.e. if they continue to practice what they have been told. Unlike, say, insurance that in order to be effective requires maintenance of the relationship over time. If the relationship ceases insurance ends – NHS care is not dependent on enduring relationships in this way
Table 2-1: Contrasting products, services and the NHS along Atuahene-Gima’s (1996) dimensions Arguably this separation of products and services is becoming less pronounced, as increasingly manufacturers of products supplement their offerings with extensive service support packages, and product offers often, now, have significant service components as an integral element of the product package (Bharadwaj et al., 1993). As Gallouj and Weinstein (1997) remind us, not only do services provide services but goods, too, provide services. The NHS is a good example of the fluidity of the boundaries that discriminate between characteristics of products and services. And as such warrants focused attention in innovation studies.
2.3 Public and service sector innovation studies The absence of a significant body of innovation literature addressing public and service sector issues is explainable by the fact that the majority of research has been undertaken in a manufacturing/NPD context, in R&D and technological innovation and innovation in consumer products (Ferguson and Cheyne, 1995; Hobday and Rush, 2000). That is, the literature tends to exclude the service and the public sectors. Clearly the NHS exists in both the service and public sectors. Table 2-2 gives some indication of this state of neglect. A search was undertaken across three electronic databases in the spring of 2002 for the following keywords in journal article titles: innovation, service* (the * denotes the possibility of service or services), innovation and service* and innovation and health. Between them the keywords ‘innovation’ and ‘service*’ generate some 21,044 and 103,736 returns respectively. Combined as ‘innovation and service*’ they generate only 424 returns whereas ‘innovation and health’ generates only 202 returns or, 0.9% of the total returns for innovation.

- 13 -
Social Sciences Citation
Index (WoS)
ABI Inform Infotrac Total
Innovation 9,421 10,000 1,623 21,044
Service* 58,764 5,829 39,143 103,736
Innovation and Service* 138 108 178 424
Innovation and Health 103 83 16 202
Innovation and Service* as % of innovation 1.5 1.1 10.9 2.0
Innovation and Health as % of innovation 1.1 0.8 0.9 0.9
Table 2-2: Database returns for keyword search on ‘innovation’, ‘service’ and ‘health’ Culling, to remove duplicates or irrelevant (e.g. where ‘health’ refers to ‘organisational health’), articles reduced by 75% the original total of 202. Table 2-3 provides a brief synopsis of the principal foci of study and methods employed in innovation research in the health sector and demonstrates that there are many gaps for both replication studies and original studies. Both service and health care innovation are seriously neglected areas of innovation research. Why this should be the case is unclear but it does strongly suggest potential research gaps in the areas of service and, particularly, health innovation. Nevertheless, interest in service and public sector innovation appears to be growing, not least of all because of the growing importance of the service sector in western economies (Atuahene-Gima, 1996). In 1992 private and public services (including healthcare) accounted for almost two-thirds of jobs in most OECD countries (Carroll and Hannan, 1995; Evangelista et al., 1998). Indeed, there is growing interest in health service innovation from several quarters: politically, because it is high on the national agenda; amongst health professionals, as the debate about reform and reorganisation impacts significantly on their work environments and practices; and, increasingly, amongst students of organisational change. Although it is growing, the field remains small. However, it is not safe to assume that results pertaining to private sector new product innovation are generalisable to either health or services innovation. Consequently, the NHS can provide a rich field of study to students of innovation and organisational change.

- 14
-
M
etho
d, p
redo
min
antly
Fo
cus o
f stu
dy
Surv
ey
Cas
e st
udy
Obs
erva
tions
from
pr
actic
e A
ctio
n re
sear
ch
Inno
vatio
n pr
oces
s A
dopt
ion
of te
chno
logi
cal i
nnov
atio
ns in
fluen
ced
mor
e by
indi
vidu
al, o
rgan
isat
iona
l and
con
text
ual
fact
ors t
han
adm
inis
trativ
e in
nova
tions
(K
imbe
rly a
nd E
vani
sko,
198
1). I
mpo
rtanc
e of
in
stitu
tiona
l for
ces t
o in
nova
tion
diff
usio
n,
parti
cula
rly in
unc
erta
in e
nviro
nmen
ts (W
alst
on
et a
l., 2
001)
.
Rec
ursi
ve m
odel
of i
nnov
atio
n ch
arac
teris
ed b
y sh
ocks
, set
back
s, pr
olife
ratio
n of
idea
s an
d fe
edba
ck fo
und
to m
ore
accu
rate
ly re
pres
ent p
roce
ss b
y w
hich
radi
cal i
nnov
atio
ns
com
e ab
out (
Kin
g, 1
992)
. Com
mun
icat
ion
of in
nova
tions
acc
ordi
ng to
per
ceiv
ed
attri
bute
s inf
luen
ces r
ate
of a
dopt
ion
(Mey
er e
t al.,
199
7). N
ot a
ll in
nova
tions
dev
elop
fo
llow
ing
the
sam
e pa
ttern
, but
eac
h is
det
erm
ined
by
the
radi
cal n
atur
e of
the
inno
vatio
n (F
erná
ndez
, 200
1).T
here
may
be
no u
nifo
rm p
atte
rn o
f inn
ovat
ion
diff
usio
n. D
iffus
ion
influ
ence
d by
inte
rpla
y of
mul
tiple
fact
ors (
Fitz
gera
ld e
t al.,
200
2). O
bser
vatio
ns o
n re
ason
s for
failu
re to
diff
use
an e
xem
plar
of o
rgan
isat
iona
l pra
ctic
e (P
eck
et a
l. 2
002)
.
Che
cklis
t of t
actic
s to
use
in o
rder
to p
rom
ote
diss
emin
atio
n an
d ad
optio
n of
clin
ical
in
nova
tions
(Wya
tt,
2000
).
Gro
up fa
ctor
s M
anag
emen
t con
cern
for c
ontro
l rat
her t
han
flexi
bilit
y im
pact
s on
natu
re o
f inn
ovat
ion
(Wes
t an
d A
nder
son,
199
2). S
uppo
rt fo
r Inn
ovat
ion
emer
ged
as th
e be
st p
redi
ctor
of o
vera
ll in
nova
tion
and
the
only
pre
dict
or o
f inn
ovat
ion
nove
lty. P
artic
ipat
ive
safe
ty e
mer
ged
as b
est f
or
num
ber o
f inn
ovat
ions
and
, tas
k or
ient
atio
n as
pr
edic
tor o
f adm
inis
trativ
e ef
fect
iven
ess
(And
erso
n an
d W
est,
1998
).
Eval
uatio
n of
TQ
M a
t NH
S de
mon
stra
tion
site
s. M
ixed
resu
lts. N
o im
prov
emen
t in
heal
th st
atus
foun
d. H
ighl
ight
s im
porta
nce
of to
p m
anag
emen
t com
mitm
ent a
nd n
eed
for
rega
rd to
cul
tura
l, st
ruct
ural
and
syst
ems c
onte
xt (J
oss,
1994
).
Rol
es,
beha
viou
r &
qu
ality
B
PR is
diff
icul
t to
impl
emen
t in
the
polit
icis
ed c
onte
xt o
f a h
ospi
tal (
Buc
hana
n, 1
997)
. C
halle
nges
ratio
nalis
tic c
once
ptio
n of
cha
nge
that
und
erpi
ns e
vide
nce-
base
d m
edic
ine
(Woo
d et
al.,
199
8). G
ains
from
BPR
are
con
tent
ious
, rad
ical
cha
nge
is d
iffic
ult i
n pu
blic
se
ctor
org
anis
atio
ns, s
enio
r man
agem
ent c
omm
itmen
t is n
eces
sary
to se
cure
cha
nge
(Pac
kwoo
d et
al.
199
8). H
ighl
ight
s a n
umbe
r of c
ontro
vers
ial i
ssue
s uni
que
to h
ealth
ca
re p
rofe
ssio
nals
par
ticul
arly
in th
e ar
eas o
f job
rede
sign
, mul
ti-sk
illin
g an
d em
pow
erm
ent (
Leve
rmen
t et a
l., 1
998)
. Suc
cess
in q
ualit
y pr
ogra
mm
es li
nked
with
hig
h jo
b se
curit
y an
d a
co-o
pera
tive
rela
tions
hip
with
trad
e un
ions
. A fa
vour
able
vie
w o
f qu
ality
was
stro
nges
t whe
re m
onito
ring
was
mos
t int
ense
(Edw
ards
et a
l., 1
998)
. H
ighl
ight
s pro
blem
s with
ratio
nalis
tic m
odel
s of b
ehav
iour
cha
nge
such
as t
hose
that
un
derp
in e
vide
nce-
base
d m
edic
ine
(Daw
son
et a
l., 1
999)
. Clin
ical
exp
ertis
e is
priv
ilege
d ov
er m
anag
eria
l exp
ertis
e, a
nd th
e ne
w o
rgan
isat
iona
l pos
ition
(clin
icia
n/m
anag
er) i
s m
ade
vuln
erab
le b
y la
ck o
f fin
anci
al m
anag
emen
t exp
ertis
e (L
lew
elly
n, 2
001)
.
A
ctio
n re
sear
ch
met
hodo
logy
use
d to
im
prov
e qu
ality
in th
ree
hosp
ital d
epar
tmen
ts
(Pot
ter e
t al.,
199
4).
Org
anis
atio
nal
leve
l in
nova
tion
10 y
ear s
tudy
pro
vide
s sup
port
for t
he
rela
tions
hip
betw
een
inte
r-or
gani
satio
nal l
inks
an
d in
nova
tion
(Goe
s and
Ho
Park
, 199
7).
Impr
essi
on m
anag
emen
t in
a st
udy
of
orga
nisa
tiona
l res
truct
urin
g (A
rndt
and
Big
elow
, 20
00).
Impa
ct o
f cha
ngin
g st
ruct
ural
and
regu
lato
ry e
nviro
nmen
t on
biom
edic
al in
nova
tion
(Che
ng a
nd V
an d
e V
en, 1
996)
.
Tab
le 2
-3: I
nnov
atio
n re
sear
ch in
the
heal
th se
ctor

- 15 -
2.4 The context of the NHS The NHS is a dynamic environment in which to study innovation. The NHS, anecdotally the largest employer in the western world and with an estimated expenditure of £75 billion in 2003, has recently embarked on an unprecedented journey of change “to increase the quality of patient care, ensure better patient outcomes and contribute to improved health in the wider community” (Cameron et al., 2001; 3). In some respects it shares characteristics with organisations in the private sector but, in many respects, it is a unique organisation. The NHS is contrasted against organisations in the private sector in table 2-4.
NHS Characteristic Private sector
High, multiple interest groups Politicisation Low
Public Property rights Private
Multiple and conflicting Organisational performance
measures Singular - profit
Low, slow Market forces influence High, immediate
Constrained Behaviour & power of management Free
Bureaucratic, risk averse, politically mindful Management style Risk taking
Professional dominance Management context Management dominance
Stochastic & susceptible to political fadism Orientation to change Continuous, perpetual,
simultaneous, dynamic
Non-continuous Production processes Continuous
Complex, differentiated & unpredictable. Nature of work Largely predictable
Table 2-4: Contrasting characteristics of NHS and private sector organisations (Source: adapted from McNulty and Ferlie, 2002)
The NHS employs more than 70 different professions, ranging from the obvious medical professions through estate management, engineering, legal, financial and administrative occupations. It is a complex organisation with a range and diversity of stakeholders; complex ownership and resourcing arrangements and a professional, largely autonomous, staff sometimes in conflict with management colleagues (Iles and Sutherland, 2001).

- 16 -
In spite of more than a decade’s worth of attempts to inject market-type reforms in the NHS, its management style is largely regarded as bureaucratic, risk averse and more attuned to political whim than the needs of patients or staff (McNulty and Ferlie, 2002). Arguably the NHS also differs from private sector organisations in its orientation to change. Spurgeon (1998) employed a construction industry metaphor to describe change in the NHS, rather than building on the previous platform, there has been a tendency of digging up the foundations and starting again. In the private sector there is a sense, much more of change being continuous and simultaneous (Bowen et al., 1994; Bessant and Caffyn, 1997). Nevertheless, at the macro level, the public sector, it has been argued (McNulty and Ferlie, 2002), is losing its distinctiveness. A series of reforms has attempted to create a more ‘business-like’ NHS (Rivett, 1998). The intersectoral blurring of the boundaries between public and private health care, the quasi-privatisation of some services, the integration of professional clinicians into management roles and so forth, have all brought the NHS closer to resembling private sector organisations. In spite of this putative confluence, Iles and Sutherland (2001) point out two important reasons why change in the NHS is different from change in the private sector. First, two professional cadres exist within the NHS, medical and management. Whilst top management support is generally recognised as essential for the successful implementation of change and innovation programmes (West and Anderson, 1996), senior medical professionals have not always seen themselves as members of this (management) group (Llewellyn, 2001). Tensions between these cadres have been identified as a possible reason for apparent difficulties in implementing change within the NHS (McNulty and Ferlie, 2002). That is not to say though, that senior medical professionals are not a significant nor influential group. Second, the scale of the change required in the NHS is considered, by some commentators to be vulnerable to and challenged by the inherent complexity, traditions and power dynamics of public sector organisations (Iles and Sutherland, 2001). There is no doubt about the pressures for change within the NHS. Since its inception in 1948 the fundamental questions that have tested Health Ministers are ‘how is the health service best organised and managed, and how is it to be paid for?’. Since then, management and delivery of services has been a focus of concern for successive national administrations. From its beginnings the NHS has been characterised as being what Mintzberg (1979) has called a ‘professionalised bureaucracy’, relying on the standardisation of skills as the co-ordinating mechanism. This is partly due to the architect of the NHS, Aneurin Bevan the post-war Labour Government’s Minister for Health, famously ‘stuffing their mouths with gold’ in order to convince medical consultants to sign up to the plan (Rivett, 1998). Senior clinicians, who jealously guard their autonomy and professional authority, have ever since dominated the NHS. Since 1948 the NHS has been subject to frequent rounds of investigation, restructuring and reorganisation. Some key dates and events in this history are shown in table 2-5, which serves to illustrate the magnitude and frequency of change within the NHS.

- 17 -
Date Event Implication Source 1948 NHS starts Professional (clinician) dominance commences. Rivett, 1998 1962 Porritt report Criticises organisational structure of NHS. Rivett, 1998 1967 Cogwheel report Encouraging clinicians to become involved in
management. Rivett, 1998
1974 NHS reorganisation Regional health authorities replace regional hospital boards. A new tier of management introduced – Area health authorities.
Rivett, 1998
1982 NHS restructured To ‘simplify’ the organisation Rivett, 1998 1983 Griffiths report Introduction of general management provides
momentum for social and organisational change. NHS to be managed rather than administered on behalf of medical practitioners.
DHSS, 1983; Rivett, 1998; Connelly, 2000
1989 White paper, ‘Working for Patients’
Introduction of the internal market to tackle problems of resource constraint and increased demand by increasing free market principles and responsiveness to the customer.
Rivett, 1998
1990-1991
Community care act and NHS reforms
Purchaser (Health authorities) Provider (hospitals) principles introduced.
Rivett, 1998
1991 NHS R&D strategy commences
Aims to support a knowledge-based health service in which clinical, managerial and policy decisions are based on sound information and research findings.
Rivett, 1998
1991-1995
All providers became independent NHS Trusts
Trusts to have independent management intended to encourage competition. Many GPs become fund holders. One outcome regarded to be inequality of provision.
Rivett, 1998
1997 White paper, ‘The New NHS. Modern. Dependable’
Internal market scrapped. Rivett, 1998
2000 White paper, ‘NHS Plan: a plan for investment a plan for reform
Increased funding announced and challenges of: partnership, performance, professions and the wider NHS workforce, patient care and prevention. Re-shaping the NHS from the patient’s point of view.
NHS, 2000
2001 White paper, ‘Shifting the Balance of Power’
Tangible demonstration of shift in emphasis to the value that patients always come first.
Rivett, 1998
2002 White paper, ‘Delivering the NHS Plan’
Primary Care Trusts replace Health Authorities. 28 Strategic Health Authorities introduced.
Rivett, 1998
2002 New consultant contracts rejected
Demonstration of continuing dominance of clinicians.
Rivett, 1998
2002 Wanless report Investigation of funding requirements for next 20 years. Resources should be more effectively and efficiently used.
Rivett, 1998
Table 2-5: Key events in the history of the NHS
2.5 Drivers for change In recent years a momentum for social and organisational change in the NHS has developed. This can be traced back to the Griffiths report (DHSS, 1983). Peckham (1999; 2000) argues for the need to correct the discrepancy between technical sophistication and organisational dysfunction that has resulted from the progressive uncoupling of medical innovation and organisational development within the NHS. Technological progress has outstripped the social and organisational capacity to

- 18 -
deliver and there is increasing onus on social and organisational innovation within the NHS to redress the balance (Fulop et al., 2001). Rising user expectations, political and ideological imperatives, pressure to become more ‘business-like’, competition and accountability, internal discontent amongst staff all exert pressure on the NHS to change. This pressure emanates from multiple and different stakeholders not just on technological change but also for innovation in the way services are organised and delivered (Fulop et al., 2001). These forces are more fully explored below. The drivers in private-sector, profit-oriented organisations to innovate have been well documented, for example Sheth and Ram (1987) identify four distinct forces responsible for the increasing importance of product and service innovation for organisational survival in the 1990s. These provide a useful framework for considering drivers for innovation in the NHS and, are presented in figure 2-1. Arguably, these forces remain just as potent in the early years of the 21st century and, as with the private sector, the factors driving innovation in the NHS are intricate and interwoven.
Figure 2-1: Forces driving innovation (Source: adapted from Sheth & Ram, 1987)
2.5.1 Changes in operating environment Political forces have been instrumental in shaping the modern day health service. From 1948 until 1973 the organisational structure of the NHS remained largely unchanged, since then there have been major structural changes or minor modifications on a regular basis. Since the 1980s, UK central government has increasingly acted to disturb inherited organisational forms within health care, imposing waves of top-down change (McNulty and Ferlie, 2002), general management, as introduced in the Griffiths report, is an early example. In the belief that consensus management had failed general management of a control and command type was introduced following the Griffiths report. The role of management consequently changed from that of custodian to decision maker. The professional dominance of clinicians was challenged and
The need for innovation
Changes in operating
environment
Customer changes
Technological
change
Changing nature of competition

- 19 -
clinicians continued to be encouraged to adopt the dual role of clinician/manager (Llewellyn, 2001). At the beginning of the 1990s the Conservative government imposed market-like features (internal competition, separation of purchasers and providers) on the NHS. Subsequently, and in order to address the two major issues of health technology (methods and tools of care, intervention, rehabilitation and so forth) and, the organisation and delivery of services to patients, the NHS Research and Development Programme was introduced (Rivett, 1998). In 1997 the new Labour administration reversed some of these reforms but, seemingly enamoured of some underlying principles, began to introduce further market-type reforms, such as patient choice. Organisationally, the NHS has vacillated between devolution to front-line decision making and centralisation. The most recent bout of reform started with the publication of the NHS plan (HMSO, 2000). This laid the groundwork for addressing the specific problems of: a lack of national standards; old-fashioned demarcations between staff and barriers between services; a lack of clear incentives and levers to improve performance; and, over-centralisation and disempowered patients. There is now a plethora of new structures and institutions within the framework of the NHS. Many of these have the remit of redesigning the organisation of the NHS to be patient-centred. They also attempt to optimise or provide a better understanding of the processes of organisational change within the health service (e.g. Modernisation Board, Modernisation Agency, National Institute for Clinical Excellence, Commission for Health Improvement). Of these the Modernisation Board and the Modernisation Agency are the prime vehicles for change. The former has been established to advise the Secretary of State for Health on the implementation of the NHS Plan. Its role is conceived in terms of three overarching objectives: renewal (tackling historic under investment), redesign (changing the way that services are delivered to make them work better for patients and staff) and respect (in and for the service). The latter, the Modernisation Agency, formed in April 2001, is charged with helping local clinicians and managers redesign local services. As the NHS Plan states, central to the implementation of the plan is the recently created Modernisation Agency which has been charged with providing the NHS with a centre of excellence as to how knowledge and know-how about best practice can be spread. The plan explicitly commits the NHS to an approach to service redesign that “mirrors the change management approach taken in much of the private sector” (NHS, 2000; 60). And, the objective is to continue the journey
“…begun with the NHS Plan, which represents nothing less than the replacement of an outdated system…it is time to move beyond the 1940s monolithic topdown centralised NHS towards a devolved health service, offering wider choice and greater diversity bound together by common standards, tough inspection and NHS values” (NHS, 2002; 3).

- 20 -
This is a challenging agenda for the NHS and includes tackling the over-politicisation of the NHS, excessive centralisation, lack of responsiveness to individuals and communities (King's Fund, 2003) and of prolonged under-investment that has condemned the NHS to operate in a 21st century world with a 1940s system (HMSO, 2000). The impact that these successive reorganisations have had in terms of improved health care, the management of expectations, staff morale, efficiency and effectiveness and so forth are beyond the scope of this research. However, there is an agenda for modernisation that requires a high degree of innovation in the models of health care delivery (Iles & Sutherland, 2001; 81). It is an organisation in a state of change, exemplifying the turbulent environment described in Chapter one wherein the ability to adapt is crucial to survival, and so provides the focus for this enquiry.
2.5.2 Technological change The quality and nature of health care treatment we receive today is as significantly different from that which our parents received as it will be from that which our children receive in 20 years. More people are being treated in more and complex ways. Much of this can be attributed to advances in medical technology and knowledge. However, new treatments and therapies are only part of the answer to improved healthcare and not the only drivers of innovation in the NHS. Twentieth century medicine has been characterised by a high level of technological innovation. It is not necessary to list the considerable technological advances that have taken place during the lifetime of the NHS from organ transplants to the coiling of subarachnoid haemorrhages. However, organisationally the NHS has not always managed to adapt to this technological change. Since the creation of the NHS half a century ago, the sharply accelerated pace of research discovery and technological progress has outstripped the capacity of the health service to adapt to change, and has resulted in a progressive uncoupling of medical innovation and organisational development. The misalignment between technology and social application is seen to a varying extent in all health systems (Peckham, 1999). Technological and clinical innovation have not proved to be synonymous with organisational innovation and the effort expended on product development, and on the advancement of clinical practice, has in the past had little counterpart in organisational innovation and development (Peckham, 2000).
2.5.3 Customer changes Demographic changes have been well-documented (Sheth and Ram, 1987). Average ages are increasing as life expectancy increases and fewer children are born. The former has implications for long term care and the latter funding the NHS. There is a tendency for parents to have children later in life, older mothers bring new medical issues to be tackled. Coupled with advances in technology and greater access to information society’s expectations from healthcare are greatly increased (Fulop et al., 2001). The internet has, to some extent, helped to demystify medical practice and create a patient-led health system. It has proved to be a powerful device for informing patients with details of their own problems and putting them in touch with fellow sufferers.

- 21 -
Patients are consequently better informed about their condition, possible treatments and, even, inequity of service. Finally, in the light of recent, but high profile scandals (e.g. Bristol Heart Unit, Harold Shipman, Alder Hey organ retention and so forth) the way in which medical practitioners are regarded within and as members of society appears to have undergone a transition.
2.5.4 Changing nature of competition Arguably, the NHS has enjoyed a virtual monopoly on health care. Reforms have, however, attempted to create a sense of internal competition and accountability. Increasing internal competition arrived with fund-holding, Hospital Trusts and, at the time of writing Foundation Hospitals, which will have the freedom and flexibility within the new NHS pay systems to reward staff appropriately, and have full control over all assets and retention of land sales, are being considered. The designation ‘National’ has always been something of a misnomer implying, as it does, homogeneity and equity across the nation. In reality the culture and style of institutions and disciplines vary one to the other across the country (Peckham, 2000). Foundation Hospitals, it would seem, have the potential to exacerbate these differences. The dominance and autonomy of medical professionals within the health service has given rise to an organisation that is relatively weak at the administrative core (at least in terms of ability to change) but able to effect change at a micro, local level. Peckham (1998) notes that there are micro cultures within the NHS, with different atmospheres and different ways of doing things even though each institution forms part of one system and has comparable responsibilities:
“The UK method of organising hospital-based medical staff into consultant firms encourages isolation both of medical decision making and of support when something goes wrong” (Peckham, 1998; 207).
McNulty and Ferlie (2002) summarise the situation by arguing that the real power has historically rested with loose coalitions of local clinical groups engaged in the incremental development of their own services, so that macro or strategic organisational change across such groups remains highly problematic.
2.6 Summary This chapter has demonstrated that the NHS is an organisation that exists in a turbulent environment in which the ability to adapt is crucial to its survival. Innovation, as it was pointed out in Chapter one is one potential response mechanism. Using Sheth and Ram’s (1987) model of forces driving innovation, the NHS has been identified as being subject to similar pressures for change as affect the private, commercial sector. However, because of organisational level and product/service level differences between the NHS and private, commercial organisations, that sector that has tended to furnish us with the bulk of our empirical settings for the investigation of innovation, it is difficult to generalise back to the health service. Health care provision, in terms of its technology and the organisational and social structures through and by which it is delivered, is changing rapidly. In the absence of models for innovation and change developed within its own context the NHS has

- 22 -
drawn on those that have been developed in the private sector (e.g. Business Process Re-engineering, Total Quality Management, Project Management). A number of these are reviewed by Iles and Sutherland (2001) and are shown to have met with varying degrees of success. This confirms the view of McNulty and Ferlie (2002) that general management models and tools may not be generalisable across industries and sectors but may vary sharply according to the setting. Further, this chapter has illustrated that a significant difference exists between manufacturing and NPD environments and the NHS. This difference has been demonstrated in terms of both organisational and service characteristics. At an institutional level, the NHS has witnessed, in recent years, considerable structural innovation and more is planned (see the NHS Plan, 2000). Innovation required for improving health care is required in different and multiple settings: government, hospitals, primary care and the community (Peckham, 1999). At the macro level, a changing political imperative has stimulated ideas for public sector reform. Innovation is driven, too, at the micro level by technological, demographic and social change. Indeed, the designation ‘National’ may be confusing by the implication of consistency across the nation. At the micro level the NHS consists of small, local units. It is not uncommon for treatment protocols for a given condition to vary within the same specialism and across locations. Also, at the local level the NHS is subject to the multiple, occupational professional and interest groups with competing objectives. The NHS has been demonstrated to be an economically significant institution as determined either by resource requirements or numbers of employees. The quantitative importance of the NHS as an employer and user of resources contrasts with the prominence of its profile in innovation research. The relative paucity of attention given to innovation research in the context of the NHS has been indicated. Finally, the NHS has been shown to be subject and sensitive to similar drivers for change as are experienced by other organisations. Although the NHS shares some characteristics in common with private sector organisations it is in many respects different and because of these differences it cannot simply be assumed that models and prescriptions for explaining and understanding innovation in the private sector are generalisable to the NHS. New evidence, models and concepts are needed to help explain and understand innovation in other sectors where demands for innovation appear to be equally high. The research focus of this thesis will therefore be innovation in the NHS. The following chapters scope out the perspective taken on innovation and culminate in the specification of research questions. Initially, a broad landscape view of the innovation literature is taken before moving to a more focused review of that part of the literature relating specifically to classification of innovation and the notion of innovation attributes. In doing so, these chapters will demonstrate, in part, the predominantly manufacturing and NPD origins of innovation studies thereby further corroborating the relative paucity of research in other sectors.

- 23 -
3 CONCEPTUALISING INNOVATION
3.1 Introduction The study of innovation is characterised by its multi- and inter-disciplinarity and multiple competing perspectives. Researchers impose structures on the innovation literature and its conceptual content in order to manage the volume and try to make sense of it. There is little agreement though, about the ‘right’ way to structure the literature. As a consequence, research is characterised by its fragmented and inconsistent nature and the suggestion that it has, historically, been of little practical value to practitioners (Barclay, 1992). In spite of the diversity of discipline and perspective there are, perhaps surprisingly, areas of consensus amongst scholars across themes within the domain of innovation. Some themes bestride these discrete disciplines and the review that follows draws from each of these disciplines in order to attempt a presentation of the current ‘state of the art’, that looks for synthesis across the various disciplines. For the last 50 years and more, the study of innovation has engaged the attention of researchers from a diversity of disciplines, bringing with them a diversity of perspectives. Early research focused on identifying the characteristics of so-called innovative organisations and an exploration of the events and activities that together comprise the process of innovation. From around the 1980s new and distinct streams of research, which Wolfe (1994) categorises as organisational innovation, innovation diffusion and innovation process research, began to emerge. The aim of this chapter is to locate the current research within the wider body of innovation literature. The literature on innovation is of tsunamic proportions and this chapter is necessarily an overview, however, it attempts to establish a position supporting the need for integrative studies providing theory-building opportunities predicated on a broad conceptualisation of innovation. At the end of this chapter the research questions are outlined. These questions are explored and elaborated upon in subsequent chapters that present in-depth reviews of specific sub-domains of the field. The review commences with a discussion of ways in which innovation has been conceptualised
3.2 Conceptualising Innovation Innovation is a broad church. Debate about its nature, processes, extent, location, determinants and consequences is vigorous and wide-ranging. There is no single theory of innovation, Wolfe (1994) was satisfied that there never would be - innovations are not all similar. They do, however, have certain features in common, which include their pivotal role in processes of change and the embodiment of novel combinations of existing and new knowledge. As a concept, innovation evokes images of mystery, skill, inspiration creative genius, toil and serendipity. The etymological root of innovation is 'innovare' - to renew (Hanks, 1979). Implicit within its origins is, therefore, a sense of newness and change.
- 24 -
However, there has been considerable debate about the meaning, location and nature of 'newness' and 'change' (Becker and Whisler, 1973; Damanpour, 1992). Various theoretical perspectives have been employed in efforts to understand innovation as it happens across the full range of organisational levels. The emphasis in the literature has developed from one in which innovation was seen as serendipitous, not an activity that can be deliberately pursued but is retrospectively rationalised, to one that regards it as a rational, purposive action (Nelson and Winter, 1982). Early proponents of the rational and purposive view argued that innovation is a problem-driven response to declining organisational performance or to the fear of future decline (Bolton, 1993). Similarly, Nelson and Winter’s (1982) evolutionary view is purposive, in which the fundamental mechanisms are the search for better techniques and the selection of successful innovations by the market (Ruttan, 1997). Other perspectives include the population/ecology perspective (Hannan and Freeman, 1984), general systems (von Bertalanffy, 1962) and, contingency theory (Burns and Stalker, 1961). The population approach, in which innovation is a randomly occurring phenomenon distributed through a population of firms over time during which problems and solutions drift together, owes much to the pioneering work of Hannan and Freeman (1977). The population ecology approach is particularly suited to examining how specific forms arise, grow in numbers up to some Malthusian maximum tolerable level and then level out or decline. General systems theory locates innovations in an environment that is pervasive. That is innovation does not stand alone in splendid isolation, rather it is an element of a wider system with which it is integrally connected. Contingency theorists have it that organisation type influences innovation (Burns and Stalker, 1961). Characterising innovation as a purposeful and adaptively rational activity suggests a process, the end of which is a better place to be than at its commencement at the core of which is an explication of the relationships between inputs, processes and outcomes (Cheng and Van de Ven, 1996). Schumpeter’s (1934) view of innovation was broad. He proposed a typology of organisational innovation arranged under five categories: new goods (or modified existing products), new processes, new markets, new sources of raw material supply and the creation of new types of industrial organisation. Implicit within this typology are several of the key themes that have emerged from innovation research in subsequent years. Specifically, typologising innovations (do different types of innovation exist, and with what implications?), the nature of newness (what is it and what does it mean?), and the temporal dynamic (innovation as a process rather than an event). Newness is conceptualised in several different ways in the literature. Coopey et al. (1998) regard innovation as a particular form of change characterised by the introduction of something new. The 'new' idea may be a recombination of old ideas so long as the idea is perceived as new to the people involved: it is an innovation even though it may appear to others to be an "imitation" of something that exists elsewhere (Van de Ven, 1986; 592). The view is endorsed by Zaltman et al. (1973; 10) who define an innovation as “any idea, practice, or material artifact perceived to be new by the relevant unit of adoption”.

- 25 -
In this view, newness may vary in magnitude and scope. Innovations may be radical (new to the world) or incremental (slight modification of some pre-existing state) and they may impact only the manager's own role or have implications for the whole organisation or a wider constituency (McAdam and McClelland, 2002). The view contrasts with the alternative that considers innovation to be the first use of a new to the world artefact, for example Becker and Whisler (1973) differentiate (by degree of risk) between first users and imitators. This is a minority view in the literature. The assumption that first users necessarily take the largest risk has been challenged and risk has been more sensitively construed in terms of the implied new behaviours that the innovation represents for organisational subsystems and their members. For example Burns and Stalker (1961) observed that the adoption of innovation creates changes in the structure and functioning of an organisation. Nonaka and Yamanouchi (1989; 299) note that “…eventually new and existing information may be integrated to produce a change in organizational cognitive and behavioural patterns”. Schumpeter does not dwell on the creative origins of innovations, indeed he makes a strong distinction between invention and innovation. However, invention and creativity are increasingly recognised as integral parts of the innovation process (Amabile, 1983; Amabile, 1988; Amabile et al., 1996; Rivett, 1998; Kirton, 1980; Kirton, 1988; Kirton, 1994). Invention is the creation of ideas, that Amabile et al. (1996; 1155) define as “the production of novel and useful ideas in any domain”. Successful innovation has its roots in creativity, all innovation begins with creative ideas and, innovation is the successful implementation of creative ideas within an organisation or social context (Amabile et al., 1996). On its own, however, creativity or invention is not sufficient for innovation. Creativity must also be appropriate, useful and actionable (Amabile, 1998). Dougherty (1992) reinforces the view, she conceives of innovation as the creation and exploitation of new and existing knowledge that links market and technological possibilities. Dougherty’s (1992) view includes within it senses of combinations, utility and purpose. Creativity is evidently, then, a part of innovation and, whilst it can be separated temporally and spatially (Holbek, 1988), its isolation from mainstream innovation studies appears largely to have been an analytic convenience. In addition to being combinatorial, innovation is also a collaborative, social process that brings benefits to identifiable stakeholders or beneficiaries (Van de Ven, 1986; Damanpour, 1990; Dougherty, 1992; Quintas et al., 1997). Innovation rarely takes place throughout the whole organisation at the same time (Rabson and DeMarco, 1999). Innovation is usually a group process (Leonard and Sensiper, 1998) and, much of the early innovation research overlooked the role of the group in innovation focusing instead on the relation of the innovation to the organisation (Dougherty and Hardy, 1996). In its broadest sense, then, innovation is about the creation and implementation of a new idea in a social context with the purpose of delivering benefit(s). West and Farr’s (1990; 9) definition succinctly captures these ideas,

- 26 -
“the intentional introduction and application within a role, group or organization of ideas, processes, products or procedures, new to the relevant unit of adoption, designed to significantly benefit the individual, the group, organization or wider society”,
and is adopted to guide this research. The key elements of the definition are that innovations are the embodied artefacts of ideas that are new to the context of their intentional use and application and bring benefit. The definition provides a wide perspective on the concept of innovation. It underpins a complex conceptualisation of innovation, implying through the presence, absence or degree of these elements potentially many types of innovations. There is a range of models, conceptual and empirical, that attempt to encapsulate some of the complexities of innovation. That these derive from diverse scholastic origins and reflect different theoretical perspectives has already been alluded to. Underlying each of these though, is the tendency to adopt a view of innovating as consisting of a series of inputs which is converted by a process to deliver a series of outputs. This input-process-output model has become a widely-adopted generic model for the study of innovation (see figure 3-1).
Figure 3-1: Input-process-output model Wolfe (1994) identifies three distinct streams of research in organisational innovation, which broadly coincide with the framework of the input-process-output model. Wolfe’s streams are organisational innovativeness (by which he means the variables antecedent to or predisposing organisational innovation, equivalent to inputs), process theory (process), and innovation diffusion (outputs). A fourth category, one that Wolfe (1994) does not identify as a distinct stream but rather as a factor that should be considered in all innovation research (the absence of which confounds comparative research), is innovation type. Mapping these categories against the four levels at which innovation research has taken place (individual, group, organisation, supra-organisation) illustrates where the relative weight of effort has fallen (see table 3-1, in which the dotted lines indicate the permeability of cell boundaries). Using this table as a template for discussion the following sections review this literature, takes and expands upon Wolfe’s categorisation and, drawing upon the various approaches in innovation research, develops a conceptual framework around the input-process-output model to frame the current research programme.
Process
Inputs
Outputs

- 27
-
Indi
vidu
al
Gro
up/P
roje
ct
Org
anis
atio
n Su
pra-
orga
nisa
tiona
l In
puts
B
aldr
idge
and
Bur
nham
, 19
75; K
irton
, 197
6; K
elle
r an
d H
olla
nd, 1
978;
Kirt
on,
1980
; Kirt
on, 1
988;
Kin
g,
1990
; Am
abile
et a
l., 1
996;
D
ough
erty
and
Har
dy,
1996
; Fah
ey a
nd P
rusa
k,
1998
; Am
abile
, 199
8
Ban
tel a
nd Ja
ckso
n, 1
989;
Bes
sant
and
C
affy
n, 1
997;
And
erso
n an
d W
est,
1998
; K
ing
and
And
erso
n, 1
990;
Wes
t, 19
90;
Wes
t and
And
erso
n, 1
992;
Wes
t and
A
nder
son,
199
6; L
eona
rd a
nd S
ensi
per,
1998
(Moh
r, 19
69; N
orm
an, 1
971;
Bal
drid
ge a
nd B
urnh
am, 1
975;
Daf
t an
d B
ecke
r, 19
78; M
iller
and
Frie
sen,
198
2; D
aman
pour
, 199
2;
Bow
en e
t al.
199
4; W
olfe
, 199
4; D
ough
erty
and
Coh
en, 1
995;
D
ough
erty
and
Har
dy, 1
996;
Chi
esa
et a
l., 1
996;
Dam
anpo
ur, 1
996;
K
essl
er a
nd C
hakr
abar
ti, 1
996;
Sub
ram
ania
n, 1
996;
Sub
ram
ania
n an
d N
ilaka
nta,
199
6; T
eece
, 199
8; B
omm
er a
nd Ja
laja
s, 19
99;
Avl
oniti
s et a
l., 2
001;
Non
aka,
199
0; W
oodm
an e
t al.,
199
3; S
cott
and
Bru
ce, 1
994;
Dag
hfou
s and
Whi
te, 1
994;
Fau
lkne
r, 19
94; v
on
Hip
pel,
1994
; Non
aka
and
Take
uchi
, 199
5; N
ohria
and
Gul
ati,
1996
; Q
uint
as e
t al.,
199
7; C
oom
bs a
nd H
ull,
1998
; Gol
denb
erg
et a
l.,
1999
; Joh
anne
ssen
et a
l. 1
999;
Rup
pel a
nd H
arrin
gton
, 200
0
Pow
ell,
1987
; Pav
itt, 1
991;
O
ndøe
j, 19
93; J
oyce
and
Stiv
ers,
1999
; Law
son
and
Lore
nz, 1
999;
A
verm
aete
et a
l., 2
003;
Goe
s and
H
o Pa
rk, 1
997;
Sm
ith, 2
000
Proc
ess
Boi
sot e
t al.,
199
6; P
itt a
nd
Cla
rke,
199
9; M
cAda
m,
1999
Coo
per,
1990
; Kin
g, 1
992;
Bow
en e
t al.,
19
94; A
grel
l and
Gus
tafs
on, 1
994;
A
nder
son
and
Lars
son,
199
8; M
alac
h,
1998
; Tho
mas
, 199
8; B
arth
, 199
8;
Fern
ánde
z, 2
001
Bur
ns a
nd S
talk
er, 1
961;
Mili
o, 1
971;
Zal
tman
et a
l., 1
973;
War
ner,
1974
; Ettl
ie, 1
980;
Kim
berly
and
Eva
nisk
o, 1
981;
Rog
ers,
1962
; R
oger
s and
Sho
emak
er, 1
971;
Rog
ers,
1983
; Pel
z, 1
983;
Pel
z, 1
985;
V
an d
e V
en, 1
986;
Mey
er a
nd G
oes,
1988
; Ang
le a
nd V
an d
e V
en,
1989
; War
ren
et a
l., 1
989;
Non
aka
and
Yam
anou
chi,
1989
; Sc
hroe
der e
t al.
198
9; V
an d
e V
en a
nd P
oole
, 198
9; K
imbe
rly e
t al.,
19
90; S
tace
y, 1
993;
Pag
e, 1
993;
Che
ng a
nd V
an d
e V
en, 1
996;
Su
ndbo
, 199
7; K
oput
, 199
7; V
eryz
er, 1
998;
Noc
i and
Ver
gant
i, 19
99; W
ilson
et a
l., 1
999;
Poo
le e
t al.,
200
0; D
aman
pour
and
G
opal
akris
hnan
, 200
1; F
eldm
an a
nd R
onzi
o, 2
001;
Mar
tins a
nd
Terb
lanc
he, 2
003
Poud
er a
nd S
t Joh
n, 1
996;
Kee
ble
and
Wilk
inso
n, 1
999;
Ahu
ja,
2000
Inno
vatio
n ty
pe
Aga
rwal
and
Pra
sad,
199
7;
Coo
pey
et a
l.,19
98
Flie
gel a
nd K
ivlin
, 196
6; C
ardi
nal,
2001
D
owns
and
Moh
r, 19
76; H
ollo
way
, 197
7; T
orna
tzky
and
Kle
in,
1982
; Hea
ny, 1
983;
Dew
ar a
nd D
utto
n, 1
986;
Coo
per a
nd
Kle
insc
hmid
t, 19
87b;
Dam
anpo
ur, 1
988;
Coo
per,
1990
; Hen
ders
on
and
Cla
rk, 1
990;
Moo
re a
nd B
enba
sat,
1991
; Dea
ring
and
Mey
er,
1994
; She
nhar
et a
l., 1
995;
Che
sbor
ough
and
Tee
ce, 1
996;
Gal
louj
an
d W
eins
tein
, 199
7; G
arci
a an
d C
alan
tone
, 200
2
Bis
was
, 200
1
Out
puts
Ban
tel a
nd Ja
ckso
n, 1
989;
Coo
per a
nd
Kle
insc
hmid
t, 19
95; d
e B
rent
ani,
1991
; de
Bre
ntan
i and
Rag
ot, 1
996;
Wes
t and
A
nder
son,
199
6; G
riffin
, 199
7a; d
e B
rent
ani,
2001
John
e an
d Sn
elso
n, 1
988b
; Dam
anpo
ur e
t al.,
198
9; D
aman
pour
, 19
90; K
lein
schm
idt a
nd C
oope
r, 19
91; L
engn
ick-
Hal
l, 19
92; G
riffin
an
d Pa
ge, 1
993;
Ali
et a
l., 1
995;
Atu
ahen
e-G
ima,
199
5; A
tuah
ene-
Gim
a, 1
996;
Mey
er e
t al.,
199
7; G
riffin
, 199
7b; L
ynn
and
Akg
ün,
2001
; Tat
ikon
da a
nd M
onto
ya-W
eiss
, 200
1; T
idd,
200
1;
Gop
alak
rishn
an a
nd B
ierly
, 200
1
(Rot
hwel
l, 19
92; B
agch
i-Sen
, 20
01)
Tab
le 3
-1: D
ispe
rsio
n of
inno
vatio
n re
sear
ch

- 28 -
3.3 Innovation Inputs
3.3.1 Introduction Wolfe (1994) circumscribes the innovativeness stream of research with questions that seek to identify the antecedents and determinants of organisational innovation, which tends to be the dependent variable. The results of this work are commonly expressed in terms of either factors that predispose an organisation to innovate or, an assessment of the degree to which organisations are considered to be innovative. The bulk of the research has taken place at the level of the organisation. A wide range of determinants has been identified. These can be categorised under the headings: structural, resource and people factors.
3.3.2 Structural factors 3.3.2.1 Size The research history on the relationship between organisational size and innovation is both long and inconclusive. One reason given for the lack of clarity is the use of different measures of innovation and different sampling methods used in operationalised research (Avermaete et al., 2003). There is considerable research evidence in support of a positive relationship between organisational size, measured by personnel indicators (e.g. number of employees), non personnel indicators (e.g. physical capacity, such as number of beds in a hospital), input/output indicators (e.g. student throughput) and financial resources (Damanpour, 1992) and organisational innovativeness. Damanpour (1992) postulated a curvilinear relationship between size and innovativeness. The evidence though, is inconsistent. Kimberly and Evanisko (1981) found that larger hospitals tended to be more innovative than smaller hospitals, Tether (1998) reported on findings that small firms introduce more innovations per thousand employees than do large firms. Organisational size has its advantages: the larger the organisation the greater the potential resource available to invest in processes of innovation (Damanpour, 1991). Size facilitates financial slack, provides marketing skills, research capabilities and, experience and, large organisations are presumed to be more capable of tolerating losses than small ones (Kimberly and Evanisko, 1981). Conversely, large size can hinder innovativeness: as organisations become over- formalised, there is a tendency to practice standardised managerial behaviour and, for lower commitment to innovating becoming evident (Figueroa and Conceiçâo, 2000). Small organisations are arguably more appropriate: they are more flexible, more readily adaptable, more willing to accept and implement change and, are better at enacting the coupling of parts that is required for innovation (Damanpour, 1996). The relationship between organisational size and innovation is mostly positive, though there is high variance. Alternatively, it might be that size is a surrogate measure of several factors that influence the innovativeness of organisations. As Mohr (1969) suggested, size could be expected to predict innovativeness only insofar as it implies the presence of motivation, obstacles or resources.

- 29 -
Pavitt (1991) noted that the average size of innovative firms is increasing but the average size of divisions within those firms is decreasing and that large, innovative organisations are creating flexibility and autonomy by founding smaller more specialised divisions. The implication of this is that, as organisations grow and age, they become more mechanistic and need to find alternative ways of sourcing innovation through delegation to groups or sub-units. 3.3.2.2 Complexity Complexity, the amount of occupational specialisation and task differentiation within the organisation, is reported to have a positive influence on innovation. The creation of today's complex systems of products and services requires the merging of knowledge from diverse national, disciplinary, and personal skill based perspectives (Leonard and Sensiper, 1998). Greater complexity provides a diversity of specialists and more differentiated units from which collaborative relationships can emerge (Damanpour, 1991). It is well acknowledged that diversity in occupational backgrounds can bring a variety of sources of information to bear, which can facilitate awareness or knowledge of innovations (Amabile, 1998). However, complexity is not of itself either an adequate or sufficient explicator of innovation. Wolfe (1994) commented that complexity could be a positive influence on initiation but a negative influence on implementation. Baldridge and Burnham (1975) indicated that large, complex organisations with heterogeneous environments are more likely to adopt innovations than small, simple organisations with relatively stable homogeneous environments. 3.3.2.3 Vertical differentiation Vertical differentiation, measured by levels of hierarchy, has been shown to have a negative relationship to organisational innovativeness. Increased numbers of hierarchical levels increase links in communication channels making communication between the levels more difficult, thereby inhibiting the flow of innovative ideas (Damanpour, 1991). Flatter structures facilitate intra-organisational communication (Packendorff, 1995). 3.3.2.4 Functional differentiation Functional differentiation, the extent to which an organisation is divided into different units, also known as horizontal differentiation, structural differentiation, departmentalisation, and measured by the number of units (not to be confused with hierarchy) under the chief executive level, has been shown to have a positive relationship with innovation (Damanpour, 1991). Innovation depends on the individual and collective expertise of employees (Leonard and Sensiper, 1998). They illustrate that varying perspectives bring creative abrasion that proves to be a powerful enabler. The requirement of multifunctionality in complex innovative environments, variously called functional differentiation (Damanpour, 1991), and requisite variety (Nonaka and Takeuchi, 1995) demands a high degree of interaction within innovative groups. Communication, trust, sharing and redundancy make groups a holistic single entity engaged in a single process of expertise, rather than purely as a well-coordinated group

- 30 -
of individual contributors (Madhavan and Grover, 1998). Innovation, conceptualised as the embodiment or articulation of new knowledge, acknowledges the primacy of the contribution of individual knowledge to the innovation process. The transfer of knowledge within the group is better seen as a process of socialisation (Pinch et al., 1996) which stresses the importance of social relationships to innovation. 3.3.2.5 Organisational type The literature on the influence of organisational type on organisational innovation is not clear cut. There appears to be inconsistency in the use of terms and, there is a high degree of variance in results. Burns and Stalker (1961) differentiate between mechanistic and organic organisations. Similarly, Miller and Friesen (1982) propose and test ‘entrepreneurial’ and ‘conservative’ models of innovation, and Dougherty and Hardy (1996) investigate the relationship of mature bureaucratic organisations with innovation. Mechanistic, mature, bureaucratic and conservative firms are found variously to have negative impacts on innovation or positive impacts on some types of innovation. Mechanistic organisations are best-suited to stable conditions and innovate incrementally (Burns and Stalker, 1961), the conservative model describes product innovation as something that takes place only when absolutely necessary (Miller and Friesen, 1982) and, bureaucratic control has a negative influence on innovation (Cooper, 1979a). Administrative intensity, however has been shown to have a positive influence on administrative innovations (Damanpour, 1991; Damanpour, 1996; Damanpour, 1996). According to Burns and Stalker (1961) organic organisations are well-adapted to changing, unstable conditions and are able to yield more radical innovations. The entrepreneurial model predicts innovation to be a continuous feature of the organisation. 3.3.2.6 Longevity Research has indicated a curvilinear relationship between innovation and organisational age. Various dimensions of longevity have been identified at different levels of study: the age of the organisation, maturity of the innovating group and, the tenure of individual members of the group. As the group matures practices become more institutionalised, routinised and habitual, the boundaries of individual and group activity systems become narrowed, attention tends to revert to local issues rather than to the whole system, inter-relating becomes careless, collective mind gradually decreases and so does propensity to innovate (Leonard and Sensiper, 1998). King and Anderson (1990) report that research scientists are more creative if not assigned to permanent groups and that relatively short-lived groups should be formed, at least, for creative processes to take place. Dougherty and Hardy (1996) observe barriers to sustained innovation in the structures and processes of mature organisations. Yet, conflicting influences are evident here. Organisational longevity contributes to organisational cohesiveness which, in turn, facilitates innovation because it allows for high psychological and participative safety (West, 1990). There are, too, incipient risks of 'group-think' (Janis, 1971) associated with the homogenising effects of maturity and cohesiveness when concurrence-seeking over-rides appraisals of alternative courses of action and becomes the dominant mode of thinking within the group.
- 31 -
3.3.2.7 Centralisation and formalisation Centralisation, the concentration of decision making authority at the top of the organisational hierarchy and, formalisation, the degree of emphasis on following rules and procedures in role performance, have both been shown to have a negative impact on organisational innovation (Burns and Stalker, 1961; Damanpour, 1991). High centralisation, measured by the degree of organisational members’ participation in decision making or freedom to make their own decisions, inhibits the initiation of innovation. It restricts both channels of communication and information availability within the organisation (Burns and Stalker, 1961). Similarly, high formalisation prevents the initiation of innovative solutions. Damanpour (1991) found it also to hinder implementation of innovations, though other studies have demonstrated that it might enable implementation (Holbek, 1988). Rigid rules and procedures may prohibit organisational decision-makers from seeking new sources of information (Vyakarnam and Adams, 2001). 3.3.2.8 Routines The concept of organisational routine is an interesting one. Levitt and March (1988) describe routines as involving established sequences of actions for undertaking tasks enshrined with a mixture of technologies, formal procedures or strategies, and informal conventions or habits. In this sense, routines reflect highly context-specific knowledge, embedded in organisational practice that has developed over time through experience and practice. Thus routines become the mechanisms that transmit the lessons of history, and are postulated to have an existence independent of particular personnel and are unique and difficult to imitate (Levitt and March, 1988). Therefore, organisations ‘remember’ through repeated actions and practices, which are socially embedded and communicated through personal contact between workers, rather than by exclusive reference to manuals and checklists. Pentland and Rueter (1994) distinguish aspects of routines into ‘effortful accomplishments’, the more formal and codified aspects of organisational life, and ‘automatic responses’ the more uncodified or taken-as-given aspects. Tranfield and Smith (1998) postulate that routines have within them cognitive, behavioural and structural aspects which are constantly being adapted and interpreted such that formal policy may not always reflect the current nature of the routine. Thus, shared-taken-for-granted routines are part of an organisation's culture. Routines have been demonstrated to both enable and hinder innovation. Routines enable in the sense that they provide recourse to patterns of taken-for-granted problem solving. They hinder in the sense that it may prove difficult to unlearn knowledge that is tacit and fully embedded into routine behaviour (Lawson and Lorenz, 1999), in which case they may become core rigidities (Leonard-Barton, 1992). Indeed, when knowledge is primarily tacit in nature and routines are deeply embedded it is difficult for individuals to think beyond the constraints inherent to routines (Jordan and Jones, 1997). Routines, sets of regular and predictable patterns of organisational behaviour (Fitzgerald et al., 2002), can both enable and hinder innovation. Some groups follow

- 32 -
algorithms and have routines imposed on them. Groups that have been socialised have stocks of tacit knowledge about how they previously combined tacit knowledge, and will work better together than teams that have not worked together before. Effective teams begin with a shared prior knowledge of how things ought to be, explicated, perhaps, by leadership and vision (West, 1990) or articulated by artefacts and symbols (Kreiner and Schultz, 1995), and from which learning will proceed (Levinthal and March, 1993). 3.3.2.9 Structural factors – conclusion The brief review of structural factors has demonstrated that the relationships between structural factors and innovation are ambiguous and contingent. Underpinning each of these factors though, is the sense of a social environment in which they are utilised. Whilst size qua size might not be a determinant its presence or absence might indicate flexible autonomous environments, which, in turn, might be constrained by levels of vertical differentiation, formalisation and centralisation. Similarly, complexity privileges diversity and heterogeneity, studies of longevity suggest that the social dynamic becomes less effective as relationships mature beyond a certain point. Finally, it would appear that no organisational type is clearly more suited than others for innovation. Daft’s (1978) dual-core model, Holbek’s (1988) innovation design dilemma and Rabson and DeMarco’s (1999) model of innovation systems (see Chapter ten) attest to this. Consequently, variance might be expected across different structural configurations. So, whilst an important consideration in understanding innovation, structural factors are not the only story. Daft (1978) reports that the values of leaders toward change are better predictors of new programme adoption in health and welfare agencies than the structural characteristics of the agencies. In more recent years, therefore, the structural factors approach has given way to a focus on other factors, notably resource and social factors.
3.3.3 Resource factors The Resource-Based View suggests that sustainable competitive advantage can be achieved through the expeditious exploitation of resources internal to the firm. The resource-based view explores the link between a firm's internal resources, which are defined as all assets capabilities, organisational processes, firm attributes, information, knowledge etc. controlled by a firm that enable the firm to conceive of and implement strategies that improve its efficiency (Barney, 1991), and performance. The resource-based view provides a useful theoretical framework in which to consider resources for innovation. Grant (1996; 110) interprets the resource-based view as presenting the firm as a “unique bundle of idiosyncratic resources”, that are optimally deployed. Barney’s (1986) framework for exploring whether or not a particular resource might be a source for sustained advantage emphasises that, in order for them to contribute, resources must be unique, valuable, rare, imperfectly imitable, and capable of being operationalised by the firm. That is, they must be heterogeneous across organisations; exploit opportunities or nullify threats; be difficult to trade, to copy or, to imitate. Teece et al. (1997) describe the ability of an organisation to combine its competencies

- 33 -
and resources advantageously as its ‘dynamic capability’. This suggests a purposeful approach to innovation and is consistent with Tranfield and Smith’s (1998) view of strategic advantage being driven from the ‘inside-out’. The following section reviews those resources that the literature proposes influence innovation: knowledge, technical knowledge, slack, functional differentiation, specialisation and, professionalism. Nonaka (1995) advocates a planned allocation of resources for innovation to take place and, that this allocation should be deliberate. Resources do not always flow smoothly to innovation, particularly where prevailing practice supports established activities (Dougherty and Hardy, 1996) and, where innovation falls outside the boundaries of this ‘normality’. 3.3.3.1 Knowledge Competitive pressure and the rapid and pervasive growth of information and communications technologies have forced companies to review the sources of their competitive advantage. This has resulted in a focus on both innovation and knowledge and, the concept of knowledge has received a deal of attention in recent years. The concept of knowledge has emerged as a strategically significant resource for the firm (Grant, 1996; Milio, 1971; Mintzberg et al., 1976) and has been asserted to play a significant role in the innovation process (Song and Montoya-Weiss, 1998). Indeed, the complexity of skills and processes needed in the development of today's products and services requires that managers attend to the processes of managing knowledge combination as the very basis of innovation (Leonard and Sensiper, 1998). Mingers (1990) conceptualised innovation as both an exploration and synthesis involving a process of the combination and exchange of knowledge (Nahapiet and Ghoshal, 1998). Galunic and Rodan (1998) report that firms are encouraged to innovate by searching out new resources or finding new ways of using existing resources. Sometimes innovation consists of a recombination of knowledge and other resources that were previously in existence (Cooper, 1988b). Grant (1996) suggests that organisations accumulate knowledge over time, learning from their members. Organisational knowledge is created through the interactions of individuals. Diverse and disparate individual knowledge is moulded, integrated and reconciled (Grant, 1996) with the collective whole through story-telling (Brown and Duguid, 1991), metaphor and analogy (Nonaka and Takeuchi, 1995) and, common cognitive schema (Weick and Roberts, 1993), which may or may not come to be captured in explicit form. In the course of this review, three models have been identified that present the notion of knowledge as a fundamental component at the core of the innovation process. These develop contingent explanations of the management of the knowledge dynamic: the knowledge spiral (Nonaka and Takeuchi, 1995), and competing renditions of a social learning cycle (Boisot et al., 1996; Pitt and Clarke, 1999). The knowledge spiral (Nonaka and Takeuchi, 1995) presents an abstracted view of the interaction between tacit and explicit knowledge in a continuous process of exchange, combination and new knowledge creation. Boisot (1995) describes a four-stage social
- 34 -
learning cycle which, arguably, maps the movement of technical knowledge around a system and suggests a paradigm of a manageable knowledge creation process. Pitt and Clarke (1999), on the other hand, suggest a much less manageable process in which the diverse, idiosyncratic, experiential knowledge of individuals is diffused in social settings commonly, but not necessarily, on a face-to-face basis. Pitt and Clarke’s (1999; 305) is a “master-apprentice model…wherein neither party may know explicitly what has been transmitted or gained from any particular encounter”. They make a powerful claim that, whilst the two models of social learning can exist concurrently, the directed learning of Boisot’s model may be insufficient to cope with the challenges of radical new knowledge creation. In the Boisot model we recognise a routinisation of the innovation process exemplified by 'ghettos' of research and development. It is suggestive of a tendency to address problems through the application of fundamental, but constraining, R&D routines. Pitt and Clarke’s (1999) model illustrates a more distributed process of knowledge creation which, although less manageable, presents a fluid adaptive framework for the creation of new knowledge. The implication of their model for the role and management of knowledge in innovation is that, although the outcome of the innovation process cannot be predicted, it can be facilitated by creating environments that recognise the significance of social interaction as the lubricant of knowledge generation and dissemination. 3.3.3.2 Technical knowledge Technical resources and technical knowledge, measured by the presence of a technical group or technical personnel, has been shown to have a positive impact on technical innovation. The greater the extant technical resources within the innovating system the more likely new technical innovations can be understood (Damanpour, 1991). The construct is similar to that of administrative intensity which posits a relationship between the ratio of managers to employees and administrative innovativeness. This is echoed by Daft’s (1978) dual-core model of innovation that argues that administrative innovations emanate from the administrative core and technical innovations from the technical core (see Chapter ten). 3.3.3.3 Slack Slack is defined as the “pool of resources in an organisation that is in excess of the minimum necessary to produce a given level of organisational output” (Nohria and Gulati, 1996; 1246). Evidence in its support as a positive resource for innovation is somewhat equivocal and a curvilinear relationship has been postulated (Damanpour, 1992). Slack resources, items of excess inputs such as redundant employees or unused capacity, are regarded by many as an important catalyst for innovation. Typically financial measures of slack are used (Damanpour, 1991), Miller and Friesen (1982) though, used both financial and human measures of slack. Slack allows innovations, derived exogenously, to be purchased; allows failures to be absorbed; provides the opportunity for diversification; frees up management attention where it is scarce, or focused principally on short-term performance; allows for a relaxation of controls; fosters a culture of experimentation; and, protects against the uncertainty of project failure (Leonard and Sensiper, 1998). Even though a positive relationship may be

- 35 -
identified between slack and innovation, there is evidence though, suggesting a negative relationship: slack can become synonymous with waste; a reflection of self-interest, incompetence and sloth and, represents a cost that is unnecessary and should be eliminated. 3.3.3.4 Specialisation As with functional differentiation, specialisation has been shown to have a positive relationship with innovation. Measured by the number of job titles, a greater variety of specialists provides a broader knowledge base (Kimberly and Evanisko, 1981) and increases opportunities for the cross-fertilisation of ideas (Damanpour, 1991). 3.3.3.5 Professionalism The professional knowledge, measured in numbers or percentage of staff with specified educational backgrounds, of organisational employees has a positive relationship with innovation: it has been shown to be positively related to high levels of self-esteem, develop confidence and is associated with increased boundary spanning activities (Damanpour, 1991), which positively impact innovation. 3.3.3.6 Resource factors - conclusion The literature review has shown that innovation is reliant on diverse resource inputs and, that social processes mediate knowledge creation and application. However, a tension exists between the need for enduring secure relationships for effective resource utilisation and the diverse heterogeneous relationships recommended by innovation theory. Consequently, it is argued that social factors are integral to understanding innovation. Each of the resource factors examined here has been demonstrated, though occasionally under certain contingencies, to have a positive impact on innovation. There is some equivocation about the relationship of slack with innovation. Different approaches to the generation of new knowledge would appear to result in different types of innovation. For West and Anderson (1996) resource availability does not predict overall group innovation. It is evident though, that knowledge, explicit or codified, and its exploitation in the innovation process is augmented through facilitating personal interaction and social relationships. Exchange of resources is a prerequisite for innovation to take place, occurring through social interaction and coactivity (Nahapiet and Ghoshal, 1998) A wide and diverse range of skills and processes is needed for the development of today's product and service requirements (Nonaka and Yamanouchi, 1989; Leonard and Sensiper, 1998). This diversity is brought together through the combination and exchange of knowledge in highly interactive, mutually dependent social contexts.
3.3.4 People factors The role of the individual in innovation receives little attention in the literature. There seem to be two reasons for this. First, innovation tends to be conceptualised as a social process with impact on a wider (though possible small and proximal) community and the contribution of the individual is often overlooked (King, 1990). Second, at the

- 36 -
individual level, 'innovation' and 'creativity' tend to be terms used almost interchangeably and the two literatures overlap (Amabile, 1988; Marshall, 1993). Indeed, the notion of individual innovation is partly dismissed by Dougherty and Hardy (1996) who suggest that primary reliance on individuals is inherently ineffective for sustained innovation. However, extant literature on the contribution of the individual to innovation divides into two categories: first of all demographic profiles of the individual – age, sex, education, cosmopolitanism, tenure etc. Secondly a description of an individual’s propensity or disposition to innovate or be creative. 3.3.4.1 Demographic Baldridge and Burnham (1975) indicated that individual demographic factors such as sex, age, cosmopolitanism and education did not account for differences in innovative behaviour between individuals. More recent research has though, challenged these findings and suggested that individual demographic factors do have a role to play. Members with high levels of education and self-esteem increase the effectiveness of research and development project teams (Kessler and Chakrabarti, 1996). Bantel and Jackson (1989) noted that individuals of greater educational attainment with diverse backgrounds managed the more innovative teams. Whilst individual variables have a role, organisational level variables, argue Kimberly and Evanisko (1981), particularly, are better predictors of innovation. From a longitudinal study of 27 top management teams in the health sector, West and Anderson (1996) concluded that the quality of innovation may be determined by team composition and that the proportion of the team that is innovative predicts innovation radicalness. A study of 199 banks by Bantel and Jackson (1989) showed a positive relationship between innovation/problem-solving and the characteristics of the top management team – age, tenure, educational background, function. The more innovative banks were managed by more educated teams that were diverse with respect to their functional areas of expertise. Intellectually heterogeneous groups are more innovative than homogenous ones (Leonard and Sensiper 1998). However, putting a diverse collection of people on teams will not of itself deliver innovation. Too diverse a team creates too many diverse frames of reference and, a lack of balance amongst members’ commitment and ability to contribute to the various activities of innovation (Kessler and Chakrabarti, 1996). Group composition has been seen, therefore, to have a significant impact on innovation, and a curvilinear relationship between the two might be postulated to explain the interaction. 3.3.4.2 Disposition Kirton's (1976) Adaption Innovation Theory argues that it is within the capacity of all individuals to be innovative, that which differentiates people is the extent to which they are prepared to consider solutions that exist outside the existing paradigm. He postulates a continuum of innovative personalities, polarised as 'adaptors' and 'innovators'. Adaptors characteristically produce a sufficiency of ideas, based closely

- 37 -
on existing understandings of the problem and likely solutions. Innovators, on the other hand, tend to generate a large number of ideas, and, in seeking a solution, separate the problem from existing, customary models of thinking to emerge with much less expected, and invariably less acceptable, solutions. However, the innovation literature reveals tensions. Creative people are argued to be self-motivated, risk orientated and expert in their relevant subject matter but averse to social conformity (Kirton, 1994). Finding a way for highly creative people to interact and share knowledge effectively with others within co-operative systems and collective activities may be one of the key challenges in the management of innovation (Angle, 1989). Innovation can also be conceptualised as a problem-solving process (Bessant and Caffyn, 1997). Dougherty and Hardy’s (1996) study of innovation in mature organisations argued that the key to effectiveness appeared to be the approach to problem-solving. They suggested two aspects of problem-solving are relevant to innovation: approach and cognitive style. First, Dougherty and Hardy (1996) and, Jordan and Jones (1997) suggest individual style and procedural approach influence innovation outcome. Their dimensionalisation of the procedural approach to problem-solving dichotomised a trial-and-error approach against a heuristic approach. Problem solving in general has trial and error as a prominent feature (von Hippel, 1994). Where a large amount of knowledge is integrated in a process of problem solving or innovation, we would expect to see an iterative process of trial-and-error. Individuals may have preferred approaches and groups may have procedures thrust upon them. The heuristic approach will constrain freedom to explore alternatives beyond the scope permitted by the parameters of the algorithm. That is, where routines are embedded and rigid we would not expect to see similar levels of trial-and-error and thus a reduced level of innovative newness. Second, cognitive style. Scott and Bruce (1994) describe a conceptualisation of problem-solving as two independent modes of thinking: associative and bisociative thinking. Associative thinking is based on habit, following a set of rules and routines and, the use of rationality and logic: systematic problem-solving working within established routines and boundaries. Kirton’s (1976) adaptors are similar and prefer to try to do things better through improvement and amendment. Bisociative thinking is characterised by overlapping several domains of thought simultaneously, with a lack of regard for existing rules and boundaries. They call this ‘intuitive problem-solving style’ and argue that it is more likely to generate novelty. This method of problem-solving is similar to that of Kirton’s (1976) innovators who choose effectiveness over efficiency and break or ignore rules. The ‘overlapping’ style can exist as an individual cognitive style, as has been described, also at a group or organisational level. Nonaka and Takeuchi (1995) describe this as redundancy, i.e. information that exists beyond immediate operational requirements. It is “intentional overlapping” (Nonaka and Takeuchi, 1995).

- 38 -
3.3.4.3 People factors - conclusion The review of people factors has emphasised the importance of collective activity in the pursuit of an innovation agenda, and also a cognitive approach that is able, depending on the extent to which it is able to challenge the orthodoxy, to generate innovations of various hue. Innovation may have roots in individual creativity and invention but it has been argued that this alone is insufficient for an enduring innovation strategy. The contribution of the individual to innovation within a social context is moderated by: trust and time-served relationships (Coopey et al., 1998), levels of autonomy and supportive collaboration, feedback and recognition, organisational cultural and physical structure (King, 1990), reward systems (West and Anderson, 1996), individual discretion (Scott and Bruce, 1994), and encouragement of creativity, resource availability, pressure and organisational impediments (Amabile et al., 1996).
3.3.5 Inputs - summary A wide range of input factors ordered under three category headings have been reviewed. The findings of structural research have tended to be ambiguous, or at least difficult to generalise widely. Similarly, resource factors, although held to be an important determinant of innovation across a variety of contexts, are best understood within the context of a social process, able optimally to exploit their latent potential. Finally, the role of dispositional and demographic characteristics were reviewed. Diversity, approach to problem solving and tenure leading to a comfort factor were held to be important. To understand innovation, therefore, this section concludes with the proposition that understanding social processes is an integral factor.
3.4 Innovation Process
3.4.1 Process Background Process research addresses the nature of the innovation process, how and why innovations emerge and grow. Process has come to be conceived as a temporal, path-dependent phenomenon (Schroeder et al., 1989; King, 1992; Koput, 1997) that is a collection of tasks or activities which together transform inputs into outputs (Garvin, 1993). Singular development activities or events are fitted into categories of stages or phases of a temporal innovation process2. The literature is broadly consistent in its view on constituent parts of process. First, that, at the macro-level, innovations are initiated and then implemented (Zaltman et al., 1973). Second, that these macro-level phases consist of sub-phases. The number of sub-phases varies across studies (see table 10-1, Chapter ten), though eight have been identified by Pelz (1983), and 13 by Cooper (1988a). The nature of the process has been shown to be affected by a range of factors such as organisational structure (Burns and Stalker, 1961; Daft, 1978; Holbek, 1988), environmental factors (Tidd, 2001) and, innovation attributes (Pelz, 1983). Pelz’s
2 Avlonitis et al. (2001) provide a useful illustration of this event/activity listing and subsequent categorisation (pp. 339).

- 39 -
(1983) study of urban innovations found, for example, that the innovation process appeared to differ according to the radicalness of the innovation. That is, simple borrowed innovations were developed and implemented in a clearly identifiable sequence of phases, whereas for original complex innovations the ‘sequence’ was overlapping and disorderly. Scholars continue to disagree as to the specific nature of these processes and, indeed, the extent to which the various events and activities that comprise the process are both necessary and sufficient in all cases of innovating and the nature of their pattern of occurrence. At the level of the individual, research focus tends to be on creativity and the creation and diffusion of knowledge and the factors that inhibit or facilitate these processes (Boisot et al., 1996; Pitt and Clarke, 1999; McAdam and McClelland, 2002). At the group level two themes emerge. The first originates in the project management literature where the project is seen as a microcosm of the larger organisation and is its agent of change (Bowen et al., 1994). An over-riding objective of project management is to deliver projects on-time and on budget, and so the processes of change tend to be acutely managed to reduce time to market and improve utilisation of resources (Guellec and Pattinson, 2001). The characteristic view of project management is as a vehicle to create order and control through a determinant and closed process of following prescription and rules (Thomas, 1998). It is generally reckoned that the more ordered processes of innovating, where, perhaps, process is strongly prescribed, the opportunities for delivering radical innovation are constrained. The second theme that the group/project literature addresses is that of the social environment in which innovation occurs. The factors said to affect group innovation include team size, group climate, heterogeneity, vision, leadership style and group cohesiveness (Agrell and Gustafson, 1994). The boundary between the group/process cell and group/input cell in table 3-1 is permeable, and a number of studies combine aspects of both innovativeness and process factors (King and Anderson, 1990; Meyer et al., 1999; West and Anderson, 1996). At the organisational level, process research focuses principally on understanding the core activities in which innovators engage and the order in which they occur. Most recently chaos theory has provided a theoretical perspective for understanding process. A picture of innovation has emerged that is chaotic in its early stages, or as Kim and Wilemon (2002) call it the ‘fuzzy front end’, and is characterised by periodicity in the final stages (Cheng and Van de Ven, 1996). Prior to this view process was considered to be an ordered sequence of events (Zaltman et al., 1973; Rogers, 1983) or less orderly, characterised by feedback and feed forward loops (Schroeder et al., 1989; King, 1992). Finally, research at the supra-organisational level relates network-ties to innovation output (Ahuja, 2000) and considers the environmental, socio and institutional factors that exist within geographic regions that create favourable conditions for the creation and exchange of knowledge. These studies echo, though at a macro-level, the results of studies at the organisational and sub-organisational level, emphasising the importance

- 40 -
of social processes in the creation and exploitation of knowledge for innovation. Importantly, they add a dimension not seen at the other levels of innovation research (or at least it is made explicit) and that is importing essential technological and managerial expertise from outside the cluster (Keeble and Wilkinson, 1999).
3.4.2 Process – summary Two clear themes are evident in process research to date: those that focus on core activities and those that focus on the surrounding enabling processes. Von Bertalanffy’s (1962) description of organisational processes as collections of activities, involving many people, that unfold over time is particularly apposite and privileges the social in addition to the temporal and sequential. Pentland’s (1995) view of processes, as sequences of actions that occur in the context of enabling and constraining structures, permits a wider conceptualisation of process as opposed to one framed simply by time and sequence of events and the innovation process can be construed as being facilitated by social processes that run concurrently within the context of innovators’ relationships. These themes are returned to in Chapter ten.
3.5 Innovation Type
3.5.1 Type Background The notion that there are different kinds of innovation, with different organisational, economic and competitive effects, has long been an important theme in the literature (Schumpeter, 1934; Cooper and Kleinschmidt, 1987b; Robb, 1989; Henderson and Clark, 1990; Burningham and West, 1995; Neely and Hii, 1998). Consequently, typologies of innovation play an important role in the whole genre of innovation research. ‘Type’, by which is meant the classification of innovations according to a specific scheme (of which there are several in the literature) of innovation has been used extensively as an independent variable in innovation research. Type has been shown variously to impact on adoption and diffusion of innovations (Rogers, 1962, 1983; Rogers and Shoemaker, 1971; Damanpour, 1988; Damanpour, 1990), organisational and innovation performance (Cooper and Kleinschmidt, 1987a; Cooper and Kleinschmidt, 1993; Danneels and Kleinschmidt, 2001) and innovation process (Pelz, 1983; King, 1992; Fernández, 2001). Three different typographic approaches are most commonly used in innovation studies. Of these, approaches which categorise innovations according to their functionality or domain of application (hereafter ‘area of focus’) or according to degree of newness are the most frequently occurring. Examples of the former include administrative, technological, process, service and product innovations. Examples of the latter include simple dichotomisations between new to the world innovations and innovations involving only minor changes (variously known as radical/incremental, revolutionary/evolutionary, discontinuous/continuous etc). More sensitive conceptualisations of newness that dimensionalise the space between the polar extremes of radical and incremental exist. Garcia and Calantone (2002) identify typologies of degree of newness comprising ranges of from three to eight categories. The third approach is that which focuses on the attributes of an innovation.

- 41 -
It has been established that different types of innovation (based on any of the three typologies) impact differently on factors in the innovating process and the innovation output (Garcia and Calantone, 2002). It is the contention of this thesis that two of the approaches (area of focus and novelty) are inadequate and the third (innovation attributes) is under-developed for generalisable and comparative purposes. First, although it is widely agreed that no two innovations are the same, the area of focus approach tends to treat them as unitary phenomena – all process, for example, innovations are treated as the same or similar. Studies occasionally differentiate area of focus innovations by degree of newness (Damanpour, 1990) but these are rare. This debate is more fully explored in Chapters four and five. This unidimensional style of research continues despite the observation, made through the history of innovation studies, that innovations differ one to another. One powerful and sensitive means of distinguishing between innovations is according to the developer’s or user’s perspective (Warner, 1974; Downs and Mohr, 1976; Rogers, 1962). Indeed, Zaltman et al. (1973) define innovations as entities perceived by the relevant unit of adoption. They argue that the distinguishing characteristic of innovation is that, instead of being an external object, it is by the perception of the social unit that it is recognised. Thus it can be, for example, that the same ‘administrative’ innovation can be perceived completely differently in different social units. In simple terms this might mean that Organisation A perceives the innovation to be radically new whilst Organisation B considers it only marginally new. Such divergence clearly has implications for the differential management of innovation in Organisations A and B. However, according to West and Farr’s (1990) definition that guides this research, innovation consists of more than simply newness, whether radical or incremental. Indeed, there is a growing body of studies that is re-evaluating the utility of continued researches based on more intricate and contextual measures of newness (Garcia and Calantone, 2002). For the moment though, there is little agreement on the specifications of a universal measure of newness. Certainly newness is a fundamental and important aspect of innovation, but it is only one part. Innovations are complex, multidimensional phenomena and the literature is replete with evidence of a wide range of perceived attributes of innovations. These are reviewed in Chapter five.
3.5.2 Type – summary Typologising in innovation studies, and in any of the scientific disciplines, helps to manage the diversity and reduce the complexities of multidimensional phenomena. However, the typologies operationalised in innovation research appear not to have a foundation of scientific derivation. Rather, it would seem that the most, apparently intuitive categorisations of innovation artefacts, area of focus and degree of newness, have, by convention, become the default independent variables for many innovation studies. There is no universal agreement on which is the best justified of the typologies to operationalise in innovation research. In the absence of this, cumulative research is

- 42 -
hampered (Calvert et al., 2002). The case for a classification of innovations based on their psychometric properties developed according to scientific principles begins to be made. Such an approach will further enhance our understanding of the complexity of the phenomenon and its associated processes and origins and is developed in the following chapters.
3.6 Innovation Output
3.6.1 Output Background Intuitively, it is not difficult to recognise the contribution that innovation makes to competitive advantage (Tidd, 2001). This output has generally been construed in terms of financial, market or organisational performance. Measurement is undertaken principally at the level of the organisation or industry and includes factors such as: numbers of patents (Rogers, 1983), contribution to turnover (Figueroa and Conceiçâo, 2000), research and development expenditure (Goffin et al., 1997), market share and market growth (Tidd, 2001). Furthermore, few studies have focused on the performance of the process of innovating. For example Keller (1986) considered budget and cost performance, meeting the assigned schedule and value to the company. There is a tendency in these studies to treat innovations as unitary phenomena, such that it becomes difficult to distinguish between the innovation and the performance. Consequently they are best suited to industry-wide benchmarking activities. At the level of the innovation though, the approach contributes little to theory or practice and tells us very little about the innovation itself. Short term financial indicators can undervalue innovation, for example where research and development expenditure is treated as a profit and loss item, as opposed to being capitalised, earnings per share are reduced (Tidd, 2001). Number of patents, measures of market growth and so forth do not tell the whole story. The measures might identify some organisations as innovative but they do not tell anything about how they do it, or from where the innovations come. Furthermore, implicit in the approach is the assumption that outputs of the processes of innovating are directly related to the process: that is, the activities in which innovators engage and the mode of their engagement, influence the resultant outcome. However, this relationship is far from clearly established in the literature other than to suggest that some types of temporal/sequential activities are related to innovation novelty (King, 1992). The argument that output and process are related has theoretical and practical implications. Empirical work establishing that different outputs of innovation are related to different dynamical processes can be useful in developing our understanding of innovation, particularly if developed within a framework that will permit comparisons across future studies. Further, there is a practical application in helping organisational leaders understand the requirements of their innovating systems. The choice of systems cannot be made solely on what is most comfortable for the organisation Tidd (2001) but has to include, also, recognition and acceptance of the process characteristics needed to achieve the desired result (Rabson and DeMarco, 1999).

- 43 -
Finally, output performance research focuses intently on the role of novelty or newness as a factor of success. Research is principally reported in the New Product Development literature where the results are inconsistent. For example, Avlonitis et al. (2001) concluded an inverted U-type relationship between degree of novelty and financial success, on the other hand, Kleinschmidt and Cooper (1991) observed a U-type relationship between innovativeness and commercial success. Consequently, it has been difficult to establish any strong empirical relationships between the inputs, processes and outputs of innovation where the relationship is based on an unmodified input-process-output model (Tidd, 2001; Goffin and Szwejczeski, 2001). Indeed, there is a multitude of other factors, beyond the control of the actors and the innovation, that can impinge upon performance, for example a recession (Howell and Shea, 2001). It is also conceivable that an innovation in one domain of an organisation might be in conflict with the objectives and mission of the whole organisation. In the UK NHS, for example, innovative methods for the diagnosis and treatment of illness, particularly those that divert significant resources and skills from other parts of the service, may detract from the mission of the NHS to provide a “universal service for all based on clinical need, not the ability to pay” (NHS, 2000; 3).
3.6.2 Innovation output - conclusion Studies addressing financial and market performance measures suggest a preoccupation with efficiencies in the processes of innovation or with economic indicators. These contributions pay less attention to what it actually is, the artefact, that the process of innovation produces. Dubiety also exists about the extent to which the relationship between organisational performance and an individual innovation can be determined. Because of the difficulty of establishing empirically any strong relationships between degree of novelty and innovation performance/success, new perspectives are beginning to develop. An alternative perspective, therefore, that argues a role for the innovation artefact as the mediator, the middle ground, between process and performance, has recently gained currency in the literature.
3.7 Conclusion Innovation has been introduced as a complex and multidimensional phenomenon. Coming to an understanding of the state of innovation research demands the tolerance of high levels of ambiguity. In this brief synopsis the objective has been to present an understanding of how researchers have tried to make sense of the diversity of the phenomenon of innovation and, several important themes have been highlighted. Modifying Wolfe’s (1994) conceptualisation, four streams of research have been identified (organisational innovativeness, innovation processes, innovation type and the output of innovation) in studies that take place across levels ranging from individual to supra-organisational. Furthermore, a wide range of factors have been indicated to influence and relate with each of these four streams at each level of research (see table 3-2).

- 44 -
Stage Characterised by
Inputs Variables predisposing organisations to innovate, some are quasi-controllable such as structure, resources and people. Others are not, such as environmental factors: world events, technology, demographic change, relationships etc.
Process
The sequence of events and individual activities taking the organisation from input to output. Also the interactions among group members; information exchange; patterns of participation in decision making; social support and sanctions for group related behaviour; and combination and exchange of knowledge that provides for a conducive climate.
Outputs The innovation output, for example: number and kinds of innovation; rates of diffusion the products of the group's performance; and, the diffusion of the innovation.
Type Categorisation according to area of focus, nature of newness or, attributes of an innovation.
Table 3-2: The input-process-output model of innovation As the field of innovation research has developed the permeability of the boundaries between the levels and streams of research has increased. And, whilst on the one hand knowledge and understanding would appear to have moved forward. On the other though, research strategies and operationalisation of concepts have delivered an output characterised by its contingent qualities. The consequence is the generation of mid- to low-level theory. Two perspectives on process were introduced. In addition to the core activities of innovating, there is strong theoretical and empirical support to the importance of facilitating social processes to optimise opportunities for successful innovation. Innovation takes place within the context of interpersonal interaction and social relationships the enaction of which influences the output of the process. It is a process that can be conceived of as taking place within a system characterised by intentionality, flexibility, social collaboration and, the combination and exchange of knowledge resources to produce beneficial outcomes. The direct link between process and output, commonly construed in terms of organisational performance, in the input-process-output model, that underpins much innovation research, has been empirically difficult to establish. This latter approach tends not to differentiate between the innovation and organisational performance. However, the stream of research that has been identified as ‘innovation type’ would offer the opportunity to bridge the empirical gap between process and output. Several studies have linked process to artefact and artefact to output. This body of work motivates a re-drafting of the input-process-output model with the process-output relationship moderated by artefact. Three approaches to operationalising innovation artefact research were subsequently identified. Anticipating the debate in Chapter five, two of these approaches are argued to be inadequate for generalisable, cumulative research. That which considers the area

- 45 -
of focus of innovation treats ‘types’ as unitary phenomena and fails to take account of the fact that innovations differ one from another. The ‘newness’ approach was shown to be inconsistent in both its conceptualisation and application and not to be a sensitive enough measure of the innovation artefact. The third approach, innovation attributes, was felt to have potential but was in need of further development. A focus on an approach that privileges perceptions of innovations as the basis for classification challenges many of theses engrained approaches and has implications, at least for the re-evaluation of, extant theory that posits certain relations between processes of innovation and output. Previous classificatory approaches tend to be based on convention, analytic convenience and individual bias rather than on a scientific approach. Only in recent years, after a decade of calls (Wolfe, 1994; Calvert et al., 2002; Garcia and Calantone, 2002; McCarthy et al., 1997), have researchers begun to make concerted efforts at comprehensive approaches to classification. In order to advance our knowledge of innovation, not only is a consistent typology an essential prerequisite but that typology must also be based on a meaningful conceptualisation of innovation – is novelty enough? The multidimensionality of innovation is too complex and varied to be understood within a narrow perspective. An approach that looks for distinguishable patterns and meaning among its many attributes is that which identifies composites of states that are labelled gestalts, archetypes and configurations (Miller and Mintzberg, 1983). The implications for innovation research of developing the configurational ‘attribute’ approach to conceptualising the innovation artefact are significant. Principally, a validated framework is required and subsequently relationship between configurations, process and output can then be empirically explored. This clearly identified research gap can be summarised by the question: Based on a multidimensional conceptualisation of innovation artefact, construed in terms of attributes, do innovations configure into discrete, identifiable types? This over-arching question triggers a set of sub-questions: • How do innovators perceive their innovations? Little empirical evidence is
evident in the literature, most frameworks having been derived from revisiting the framework initially developed in Rogers and Shoemaker (1971) and Rogers (1962; 1983).
• How might a parsimonious, scientifically-developed framework of attributes
of innovation appear? There is no evidence that innovation research is based on universally agreed, formal, scientifically developed taxonomies of artefact.
• Can different innovations be described in terms of different configurations of
attributes? Is a taxonomy based on attributes of innovations valid? Does it perform the function of classification in helping to manage and understand?
• What are the distinguishing attributes of the different innovations? Assuming
the validity of the taxonomy, on what basis do the different taxa differ from each other?

- 46 -
• Do innovations differentiated by attributes exhibit different processual
origins? Previous research (for example King, 1992) has suggested a relationship between innovation types and processual origins.
These questions drive this research over the following eight chapters, the first of which explores the role of classification in innovation studies.

- 47 -
4 A PHILOSOPHY AND PRACTICE OF CLASSIFICATION IN INNOVATION RESEARCH
4.1 Introduction The previous chapter concluded by posing a series of questions relating to the classification of innovations according to different configurations of attributes. This chapter presents a review of classification in innovation studies. It opens, however, with a discussion of the ontology and epistemology of classification and traces a series of principles and guidelines to help in its practice. Subsequently, three approaches to the classification of innovation are described: classification according to newness, innovation area of focus and by attributes. The origin of each of these classificatory approaches and their roles as categories of classification are briefly explored. Finally, the limitations of the three approaches are discussed in the context of proposing an alternative approach. The chapter concludes that, in innovation studies, the reliance on time-served approaches to classification that lack a strong scientific basis has led to multiple idiosyncratic operationalisations of measures, which hampers comparative research.
4.2 A philosophy of classification
Wordsworth’s Romantic persuasions led him to be critical of science’s clinical dissection and categorisation of nature’s beauty, a phenomenon that he considered to be indivisible. Earlier in the century (1737) Carl von Linné had written
“All the real knowledge which we possess, depends on methods by which we distinguish the similar from the dissimilar. The greater the number of natural distinctions this method comprehends the clearer becomes our idea of things” (quoted in Everitt et al., 2001; 2).
Wordsworth’s view has not prevailed and individuals appear to make sense of and navigate their worlds by categorising their experiences into groups or classes on the basis of their similarity and, subsequently, appending theories to them. Through the ability to recognise different entities, organisms or individuals as belonging to different groups, generalisations and predictions may be made about the world (Everitt, 1995). Such grouping of objects, according to specified criteria, considered similar to each
Sweet is the lore which nature brings;
Our meddling intellect Mis-shapes the beauteous forms of things:
We murder to dissect.
The Tables Turned William Wordsworth, 1798

- 48 -
other has played a pivotal role in facilitating mankind’s understanding of his universe and, it is argued (Meyer et al., 1993), is the basic orientation of human beings. The practice of classification, of sorting items into categories has been central to research and sense-making in a multitude of disciplines (McCarthy et al., 2000). It is an important technique in the natural and social sciences, providing a method for organising large amounts of multivariate data. Different class labels can provide a parsimonious way of describing patterns of similarities and differences in the data (Everitt and Dunn, 2001). For Everitt et al. (2001) classification performs three functions: • Management of data: Classification provides a means of dealing with large and
complex volumes of non-classified data (McCarthy, 1995). Through the reduction of complexity, description of cases, comparison of similarities and differences amongst a diverse population of items, classification permits large amounts of data to be allocated into sets, be more easily managed and better understood (Bailey, 1994). Consequently, theorising can adhere more closely to the principle of parsimony.
Meyer et al. (1993) call this ‘codification’ and suggest that it is widely used in the social sciences, particularly where phenomena are complex and multidimensional. The conceptual challenge that complexity and multidimensionality offers can be, at least partly, met by classification that allows the opportunity of sensemaking through configuration and/or pattern recognition (Ketchen and Shook, 1996).
• Prediction of events: Classification underpins predictive endeavours, for example making prognoses about different classes of disease or illness. Hypotheses can be developed and laws tested based on clearly demarcated, homogenous groupings of entities. That is, there is a key contribution to generalisability to be made from classifications generated from salient characteristics (McCarthy, 1995). Classification in innovation studies has been widely used in pursuit of this predictive goal, not least of all in attempts to understand and explain the determinants of innovation diffusion and adoption (Rogers, 1983; Damanpour, 1991; Moore and Benbasat, 1991; Dearing and Meyer, 1994).
• Explanation of phenomena: Classification helps frame studies exploring causation,
provoking such questions as ‘do different classes of object have different origins?’. Classifications provide conceptual frameworks that describe and aid understanding of complex phenomena and which may be useful in other areas of organisational research (McCarthy, 1995).
Others have identified similar purposes of classification, for example Bailey (1994) and Good (1965). Good (1965) offers: 1) for mental clarification and communication, 2) for discovering new fields of research, 3) for planning an organisational structure or machine, 4) as a check list, 5) for fun, as the purposes of classification, and most authors appear to be broadly in agreement with these.

- 49 -
The origins of classificatory science would appear to lie in the Aristotelian and Platonic discourses on animal and plant classification that sought to establish the complex differentiae and genera central to definitions of living things. Differentiae are those properties by which entities (or species, items, objects etc) within the same genus are distinguished from one another (for example distinguishing between human, horse and cat within the animal kingdom), which Plato calls ‘the collection and division of kinds’. The list of properties that distinguish kinds, once identified, form (in the Aristotelian/Platonic paradigm) the fixed essence of that entity or species, which came to be known as ‘natural kinds’ or ‘natural types’ (Audi, 1999). This ‘Classical’ approach was based on the premise that nature designates and demarcates categories into which entities fit, and remain: so-called ‘natural types’. These pre-Darwinian biological classifications of species were held to be immutable, part of the unchanging make-up of the universe. Darwin’s idea, which is now more commonly held, was that species are not eternal, that they change over time and that consequently boundaries between them are not sharp (Dennett, 1996). Previous classificatory approaches were shown to be highly persuasive but little more than pre-scientific intuitive judgements based on comparative similarities (Audi, 1999). One consequence of Darwin’s thinking, at least in the biological sciences, is that the target or subject of classification is considered to be moving. Species are argued to evolve. That is they change gradually over time and so do not display the formerly requisite characteristics of species (categories): eternality, immutability and discreteness - ‘natural kinds’. Part of Darwin’s contribution was to challenge the established classifications of the day and permit the development of classificatory approaches based on criteria of data management, predictive capacity and causal explanation. That is not to say though, that the debate regarding the ontological basis of classifications or the fixedness of boundaries between categories is any closer to being resolved. The biological sciences are possibly the most practised of all the sciences in the techniques and philosophy of classification but have yet to recover from Darwin’s challenge. The debate as to whether or not species (in the sense of categories of entities with fixed properties) actually exist still engages biologists and has become known as the ‘species problem’ (Hey, 2001). Hey (2001) discusses the ontological status of categories through recourse to his evening meal. It is evident that the fish on his plate (he recounts), that he will have for tea tonight, is real. In what real sense though, can the category (species) FISH be said to exist other than as a convenient lexical tool for managing a diversity of animal forms that share, at a certain point in time, certain characteristics that are deemed to be significant to a greater or lesser extent (Hey, 2001)? The debate about the ontological status of natural types continues to be played out amongst philosophers of classification. Nominalists would argue that natural types do not, in any real sense exist rather they are lexical and conceptual constructions by dint of which we are able to organise the constitutive ideas we attach to items of our experiences. Realists might argue that natural kinds are more than merely ideas invented to help us compartmentalise the world and that they have ontological status.

- 50 -
That is not to suggest though, that the Realist position asserts the immutability of these types. So, for Nominalists classifications are abstract constructions that do not exist and, not being observable, are meaningless (Blaikie, 1993), though the individual entities that populate them do exist. So, to classify is a human sense-making impulse in which classifications are an artefact of mind and not a reflection of reality. Realists, on the other hand, recognise classifications and categories as a device for managing the complexities of human experience and affirm them as useful means on which to base predictions about the future and explanations of the past. This debate is partly diversionary. Both positions recognise the instrumentality of classification though they disagree in the degree to which they affirm an ontological status to resultant categories. This research adopts the instrumentality of classification and aligns itself with Everitt and Dunn’s (2001) pragmatic observation that the ultimate test of any classification is its usefulness. Invariably, a population of objects may be classified in a variety of different ways, human beings, for instance, by age, sex, occupation, education, ethnicity and so forth, and the contents of classes will differ across the different classifications. Each classification system can be justified in terms of the extent to which it helps in solving or understanding different issues. Bonner (1964) argues that if using a term such as “cluster” or “group” produces an answer of value to the investigator, then that is sufficient justification for its use, whether or not that group is a natural kind (has ontological status). Everitt and Dunn’s (2001) mandate of usefulness has already been noted and it is endorsed by Punj and Stewart (1983) for whom the ultimate test of what they call archetypes or classifications is their usefulness in aiding understanding the phenomena under investigation. Classifications, then, may be judged by their usefulness, and are not like scientific theories whose merit endures only so long as they are held to be true (Popper, 1991). The distinction is important because it emphasises the point that in undertaking a classification exercise the variables that are chosen to describe classes must vary according to the research problems and the predictive or exploratory tasks at hand (Miller and Friesen, 1984). Classification is, therefore, concerned with the investigation of a set of objects and their characteristics in order to establish whether or not they fall into groups (natural or artificial) of objects. A group has the property that the objects within it are similar to one another and different from objects in other groups. The issue of analysis therefore becomes a multivariate data-solving problem: given a sample of N objects, each of which is measured on each of p variables, devise a classification scheme for grouping the objects into g classes (Everitt, 1974). Classification, therefore, is descriptive and exploratory. Classification is not explanatory. It may, however, form the foundations for explanation (Gordon, 1996). In the widest sense of its use, ‘systematics’ is the label given to the scientific study of the kinds and diversity of organisms or entities and of any and all relationships among them. By this, systematics attempts to understand the evolutionary interrelationships

- 51 -
amongst organisms and the way in which life has diversified over time. Systematics’ concern is not only with the arrangement of organisms into taxa and with the naming of those taxa, but also with the causes and origins of these arrangements (Bailey, 1994). One output of systematics, with its holistic approach to the study of phenomena or entities, is the arrangement of types of entity into a meaningful order (Sneath and Sokal, 1973; Bailey, 1994). The routes by which the principles and techniques of biological classification were introduced into the management sciences are not distinct. Much is owed to the work of Sneath and Sokal (1973) who identify practitioners in psychology, social anthropology, social science and computer studies, disciplines whose boundaries occasionally merge with those of the management sciences (Easterby-Smith et al., 1994). It is not really until the late 1960s and 1970s that the scientific approach to classification in the management sciences begins to establish itself. In the vanguard of this movement were organisational scholars such as Pugh et al. (1968) and McKelvey (1975; 1978). Of course classification occurred in management disciplines prior to the scientific method of systematics. Perhaps the most familiar conceptual classification scheme in the social sciences has been Weber’s ideal or pure type(s) (Pugh and Hickson, 1996), which Bailey (1994) calls an extreme or heightened representation of all dimensions in the typology. Weber’s classification is interesting from the point of view of epistemology of classification because the debate that surrounds it reflects, in miniature, some of the epistemological debate on classification. The basis for Weber’s classification was organisational authority structures according to which he proposed three pure organisational types: rational-legal, charismatic and traditional (Pugh and Hickson, 1996). Evincing the conceptual purity of the models Weber asserted these ideal types could not be found empirically anywhere in reality. Side-stepping a large proportion of the debate that Bailey (1994) expertly recounts we are left to consider the merit of classification schemes that specify ‘types’ that do not exist in reality. This philosophical dilemma is partly resolved in the two different approaches to classification that exist. These are classification by typology and classification by taxonomy, key features of which are illustrated in table 4-1.
Approach Method Role of theory Application Output
Typology Deductive
A priori theory as a basis for categorising phenomena.
Hypothesis testing based on existing theory.
Theoretically-based classification scheme. These may offer a heuristic framework in the form of certain assumptions and constraints to guide further inductive enquiry (Ketchen and Shook, 1996; 1307).
Taxonomy Inductive Absence of a priori theory.
Exploratory – use of configurations generated from empirical observation as basis for comparison and classification.
Empirically based classification of actual objects. Classifications are empirically-based multivariate classifications may be monothetic or polythetic.
Table 4-1: Comparison of taxonomic and typological approaches to classification
- 52 -
Typologies are a priori classifications, theoretically or conceptually grounded approaches to classification of objects based on the grouping of one or more characteristics. Doty and Glick (1994; 232) define typologies as “conceptually derived interrelated sets of ideal types each of which represents a unique combination of the attributes that are believed to define the phenomenon”. So, typologies are categorisations of phenomena grouped into mutually exclusive and exhaustive sets through following a series of discrete decision rules, but which do not attempt to group actual observations. Taxonomies are the grouping of actual observations, empirically derived multivariate classificatory schemes based on one or more characteristics (Pinder and Moore, 1979). For example Hull et al.’s (2000) taxonomy enumerated five main groups of knowledge management practices for innovation according to their relation to dimensions of research and development activity, management and relationships. The differentiation between taxonomy and typology is useful in helping identify the theoretical or empirical origins and nature of the classificatory systems being used. It also provides the conceptual space for classifications such as Weber’s ideal types to exist alongside those based on empirical observation. In reality, however, the boundaries between the two often are blurred. Typologies, at some point, have been grounded in empirical experience and taxonomies, at some point, have at least some (tacit) theoretical underpinning. Indeed, because of this blurring, Meyer et al. (1993) regard the debate about the relative merits of taxonomy versus typology as diversionary, and in effect many classification systems combine, to a greater or lesser extent, elements of the two. The distinction though, does help to locate the orientation of any particular scheme and roughly equates with Bailey’s (1994) three levels of classificatory analysis: • Conceptual classifications: in which only concepts are classified. • Empirical classifications: in which only empirical entities are classified. • Conceptual/empirical classifications: also known as operational or indicator level
classifications in which both are combined. A conceptual classification is first devised and then empirical examples of some or all of the categories are identified.
Notwithstanding the final point, in developing a comprehensive parsimonious classification system decisions must be made with regard to choice of the ‘right’ characteristics and, sufficient of these in order to obtain a stable classification. Unfortunately, we do not have answers to questions about ‘right’ or ‘sufficiency’ though several authors have provided guidelines. Sneath and Sokal (1973; 108), for instance, recommend that investigators should “employ at the very least as many characters as will give the confidence limits the investigator wishes”. Sneath and Sokal (1973) alert us against over-reliance on conceptual studies as the basis for empirical classification. The danger is that historical weight, in effect conventionalism, leads to inordinate favour being attributed to conceptual characters. This largely accords with McKelvey (1975) who suggests 10 guidelines to keep the researcher free from the influence of previous taxonomies and typologies (see table 4-2). The guidelines make no concessions to the invariable limitations of empirical

- 53 -
investigation (lack of resources, problems with access and so forth), but are a useful common-sense guide to helping to try to maintain objectivity.
Guideline 1: Define the broadest possible population of entities. Guideline 2: Use a probability sampling plan without stratification for selecting a sample of entities in order to ensure that all members of the population have an equal probability of being selected. Guideline 3: Define as inclusive a population of characters as possible. Guideline 4: Use a probability sampling plan for selecting a sample of characters if there is the possibility of volume leading to unmanageability. Guideline 5: Define the population of observers of characters to be as inclusive as possible. Guideline 6: Use a stratified probability sampling plan for selecting observers. Guideline 7: The sample of characters must be no larger than the input capacity of the multivariate analysis program. Guideline 8: Each character must not be over-represented in the input stream of the multivariate programme and must be independently measured. Each character must have equal potential as a classificatory concept, and it must also be assumed that each attribute [character] concept is a theoretical entity independent of all others in definition and capable of being operationally measured in a way that does not compromise its independence, and leaves it equally represented in the input stream as a potential classificatory concept (pp. 518). Guideline 9: Criteria guiding unavoidable decisions in using multivariate analysis must be publicly described and consistently applied. Guideline 10: Classificatory breaks in ordering type concepts should come at points optimising parsimony and intraclass homogeneity.
Table 4-2: Guidelines for classification exercises (Source: McKelvey, 1975; 512-522) All classifications are based upon the comparison of sets of characters and the evaluation of the similarities and differences between them (Sneath and Sokal, 1973). Consequently, the identification of characters on which to base the classification and, the expression and implementation of the concepts of similarity/dissimilarity and/or resemblance are of central importance in the epistemology of classification. It is on the basis of similarities and differences between characteristics that categories are formed, and so will ultimately influence the final results of any analysis (Fernandez and McCarthy, 2002). Bailey (1994; 2) argues that the one
“…basic secret to successful classification…is the ability to ascertain the key or fundamental characteristics on which the classification is based…It is crucial that the fundamental or defining characteristics of the phenomenon be identified”.
Yet, in spite of its importance selecting characteristics can be a subjective task, and whilst there is no specific formula for identifying key characteristics, there are certain types of character whose nature disqualifies them from consideration (Sneath and Sokal, 1973). These can be grouped under 5 headings:

- 54 -
• Meaningless characters: attributes that are not a reflection of the inherent nature of the item itself.
• Logically correlated characters: any property that is a logical consequence of another must be excluded.
• Partial logical correlations: where the dependence of one character upon another is not total but partial.
• Invariant characters: any characters that are invariant over the whole population should be excluded, including them does not afford extra insight.
• Empirical correlations: this problem is one of the absence of logical correlation but the presence of empirical correlation between factors.
On the issue of empirical correlation there remains room for subjectivity. Sokal and Sneath (1973) concede that even where there is evidence of empirical correlation between characteristics at least some independent sources of variation should be assumed. The corollary of this is that the classification framework may contain levels of redundancy. Redundancy is acceptable, they argue, because it would be counterbalanced by the likelihood of obtaining new information. Given that classification is the process of ordering entities into groups or sets on the basis of their relationships then the concept of similarity or resemblance is, too, of central importance to processes of classification. It is on the basis of ‘sharedness’ of properties of characters that similarity between entities is judged. In order to be able to state that entity A is more similar or closely related to entity B than it is to entity C a clear definition of what it means to be ‘more similar’ or ‘closely related’ must be given. By what criteria can similarity or relatedness be measured? Sneath and Sokal (1973) make the distinction between similarity based on evolutionary relatedness (phyletic or phylogenetic relationships) or resemblance as judged by the characters of the entity without any implication as to their relationship by ancestry (phenetic relationships). Phenetic relationships are determined by contemporary characteristics not by ancestry, and in this sense are cross-sectional as opposed to the longitudinal phyletic relationships. This distinction clearly has implications for the way in which similarity may be determined. An evolutionary perspective has often been utilised to help understand processes of innovation and organisational change e.g. (Aldrich, 1999; Poole et al., 2000). In particular, concepts have been borrowed from evolutionary theory to help explain the origins and nature of stimuli for change such as punctuated equilibrium and natural selection (O'Shea, 2002). However, in that part of the innovation literature where the innovation is taken as the unit of analysis, the longitudinal, evolutionary perspective of ancestral relationships is uncommon. That being the case, the similarity basis for the classification of innovations in this study is the phenetic relationship. Numerical taxonomy is the label given to “the grouping by numerical methods of taxonomic units into taxa on the basis of their character states” (Sneath and Sokal, 1973; 4). There are a variety of statistical approaches to phenetic and phyletic classification. Of interest here are those techniques suited to phenetic classification. Cluster analysis is a generic term for a collection of statistical techniques for dealing

- 55 -
with multivariate data pertaining to individual entities. Chapter eight details the cluster analysis approach and, in the light of the previous debate, specifies a design for the analysis of multivariate data pertaining to a sample of innovations.
In brief, clustering techniques use measures of distance (dissimilarity) or resemblance (similarity) between objects, which can be either individual entities or the emergent groupings. Two cases are identical where they share the same scores on the range of variables (characters): absence of correspondence of variables can be construed as distance or dissimilarity. These distances can be based on a single dimension or multiple dimensions. Sneath and Sokal (1973; 5) outline seven principles to guide the operation of a classification exercise: • The greater the content of information in the taxa of a classification and the more
characters on which it is based, the better a given classification will be. • A priori every character is of equal weight in creating natural taxa. • Overall similarity between any two entities is a function of their individual
similarities in each of the many characters in which they are being compared. • Distinct taxa can be recognised because correlations of characters differ in the
groups of organisms under study. • Phylogenetic inferences can be made from the taxonomic structures of a group and
from character correlations, given certain assumptions about evolutionary pathways and mechanisms.
• Taxonomy is viewed and practised as an empirical science. Cluster analysis permits the identification of categories of entities based on the use of multiple variables (characters) in permutations or configurations of similarity or resemblance as the defining quality of the categories. When we speak of configurations, note Miller and Friesen (1984; 4),
“…we are concerned with complex clusters of elements or variables...we are speaking of different constellations of conceptually distinct variables or elements that commonly cluster together to characterise many aspects of organisational...[phenomenon of interest]."
The configurational approach in which phenomena are described according to the extent to which they share, or otherwise, common profiles based on degrees of difference or conformity along conceptually discrete variables, is a key means by which humans make sense of their world. Multidimensional configurational studies have been popular in some domains of the management sciences for example Mintzberg’s (Pugh and Hickson, 1996) five types of organisational structure or Bailey and Johnson’s (1995) six types of strategy development process. They have not, however, proved so popular in the innovation literature. It is argued that there are many phenomena that can be construed of as being multidimensional with the implication of potentially infinite combinations of characters (where variance is independent and continuous)

- 56 -
“…but for theorists taking a configurational perspective, this potential variety is limited by the attributes' tendency to fall into coherent patterns...The upshot is that just a fraction of the theoretically conceivable configurations are viable and apt to be observed empirically” (Meyer et al., 1993; 1176).
Innovation research has long used a classificatory approach, but predominantly based on narrow dimensions. Indeed, the use of multiple variables to define groups requires the use of new research techniques in innovation studies – because research based on multiple variables has not been done in this way before. This has implications for the methodology of this research (see Chapter six). Classifying innovations poses interesting ontological and epistemological challenges. Ontologically the field is divided between those theorists who conceive innovations positivistically, as objective properties (Damanpour, 1988; Veryzer, 1998; Garcia and Calantone, 2002) and the constuctivist perspective that conceives of innovations as perceptual artefacts arising from the interaction between the innovator/adopter and the innovation (Rogers, 1962, 1983; Rogers and Shoemaker, 1971; Dearing and Meyer, 1994). There is a wide array of classifications of innovation in the literature, these are fully reviewed in the following chapter. Of the classifications many share dimensions that show such high levels of congruence that these classifications can themselves be categorised as being one of three different kinds: innovation newness, innovation area of focus, and perceived characteristics of the innovation. It is, however, reasonable to assume that innovation diversity might be patterned into countable configurations of greater or lesser clarity. It is proposed that a suitable conceptualisation of innovation is polymorphic, that is innovations have or occur in several distinct forms and these forms are best circumscribed by an holistic conceptualisation based on the perceptions of those who develop and implement the innovation. Underlying every classificatory system is a drive for better understanding and, the different paths of innovation research are hedged around by competing and complementary classificatory approaches. Innovation studies appear to have concentrated on using classifications to predict and explain, but have not provided the scientific basis for the management of classifications in the form in which they are manifested. In the following sections of this chapter those approaches are reviewed. A number of these classifications are narrowly specified and many researchers have relied on estimates and measures of only one or two parameters. It is a limitation of conceptualisations of innovation that the complexity of the phenomenon is defined across narrow sets of variables. The chapter concludes that groups established on the basis of single characters are of low or limited exploratory value and argues that a classification of innovation based on user/innovator perceptions would offer a rich and original approach to innovation classification that addresses limitations of existing approaches.
4.3 Classification in innovation research The origins of the three classificatory approaches, described in Chapter three (see also table 4-3), in innovation research are somewhat obscure. The newness approach likely

- 57 -
has its origins in Schumpeter’s (1934) early circumscription of innovation and would appear to be legitimised by intuition, common-sense and convention. The distinction between administrative, product and technological innovations, the ‘area of focus’ approach, has its roots in a more general distinction between social structures and technology and also represents changes made in a wide range of activities within an organisation (Damanpour, 1988). Finally, the attribute approach, this would appear to be predicated on the sociological dictum that perceptions reify situations (Rogers, 1983). The most significant event in this latter approach was the introduction of a five-factor framework of innovation attributes, initially by Rogers (1962) and then refined by Rogers and Shoemaker (1971) and then, again, by Rogers (1983). This framework is further examined in Chapter five but, it presents five conceptually distinct but empirically interrelated attributes of innovation (see section 5.3.2 Multi-attribute empirical studies) based on meta-analysis of over 300 innovations in 12 separate studies that, it is argued, are as mutually exclusive and universally relevant as possible. Henceforward this framework is referred to as Rogers’ (1983) framework.
Innovation newness
Innovation area of focus
Innovation attributes
Novelty (narrow) Administrative Narrow (uni- or bi-dimensional)
Novelty (broad) Technological and process
Broad (multidimensional)
Familiarity Product Conceptual
Table 4-3: Classification schemes in innovation studies In spite of the longevity of interest in innovation classification, and despite a number of attempts, there is no single universally adopted classification. Further, innovation theorists fail to agree on how to distinguish and enumerate diversity in innovation. Recent attempts have been made to synthesise the diversity of approaches and present refreshed perspectives on classifications (Garcia and Calantone, 2002). The following three sections briefly review three approaches to the classification of innovations: by newness, by area of focus and by innovation attributes.
4.4 Newness Conceptualisations of newness have been fundamental to the study of innovation since Schumpeter (1934) used one as the basis for explaining economic cycles. It has become a taken-for-granted convention that innovation is about newness. It is undeniable that, to at least some extent, innovations introduce newness into social contexts (West and Farr, 1990). Appendix one identifies 38 ‘newness’ studies. Whilst the list is not exhaustive it presents an illustrative purview of the construct, its role and the nature of debate surrounding its use in innovation research. From the list several things become apparent. First, there are numerous and competing conceptualisations and operationalisations of newness. It is an area that has attracted a large amount of theoretical and empirical debate (Schumpeter, 1934; Burns and

- 58 -
Stalker, 1961; Heany, 1983; Roberts and Berry, 1985; Subramanian, 1996; Garcia and Calantone, 2002). Second, newness has been demonstrated to be an important determinant of innovation and organisational success and performance (Booz-Allen and Hamilton, 1982; Johne and Snelson, 1988b; Kleinschmidt and Cooper, 1991). Third, multiple factors determine the newness of an innovation (Tushman and Nadler, 1986; de Brentani, 2001; Cardinal, 2001; Lynn and Akgün, 2001). Finally, the degree of newness has a significant impact upon the nature of the innovation process (King, 1992; Cheng and Van de Ven, 1996; Rice et al., 1998; Veryzer, 1998; Fernández, 2001). At this point in the thesis the principal interest is in the debate regarding the construct of newness and its stability, or lack of it, in innovation research, as opposed to its role as a variable. It is argued that the distinction between innovations on the basis of degree of newness is an important one because radical and incremental innovations have dissimilar dynamics. Radical innovations produce fundamental changes in the activities of the organisation and represent a large departure from existing practices, whereas incremental innovations result in a lesser degree of departure from existing practices (Damanpour, 1996). It is difficult to identify a commonly held, universally agreed definition or measure of newness. Avlonitis et al. (2001) identified what they described as 10 key typologies, and their dimensions, of product and service innovativeness each presenting a conceptualisation in terms of degree of newness. In a review and synthesis of 21 empirical studies Garcia and Calantone (2002) identify 15 constructs and 51 scale items to measure newness. Newness, as reported in these two studies, is generally determined along a continuum with contrasting polar extremes. Various labels are used to identify these polar points, such as radical, revolutionary, discontinuous, new-to-the-world and so forth at one end and, incremental, evolutionary, repositioning of existing products, minor modifications, style changes and so forth at the other. Whilst anchoring at the poles would appear to be stable, gradations of newness along the continua vary. Between the poles newness is dimensionalised into between two and eight different categories (Garcia and Calantone (2002), see Appendix one). Both studies correctly identify the plethora of definitions and conceptualisations of innovation newness in the literature. They both ponder whether or not there is any difference between the various constructs, whether or not having such a range adds anything meaningful to innovation research, or it simply serves to obfuscate? Certainly the results of studies are inconsistent with regard to newness. For example, Avlonitis et al. (2001) concluded that an inverted U-type relationship existed between degree of novelty and financial success. Similarly, Goldenberg et al. (1999) suggest that successful products tend to be those that are moderately new to the market but not the firm. On the other hand, Kleinschmidt and Cooper (1991) observed a U-type relationship between innovativeness3 and commercial success, where highly or only marginally innovative products were more successful than moderately innovative products. Atuahene-Gima (1995) notes that radical innovations appeared to be more
3 The term ‘innovativeness’ is potentially confusing. It has meanings ranging from degree of newness to capacity of an organisation to innovate (see section 7.5.1.2 Operationalising novelty).

- 59 -
dependent on more market research and investigation activities (that is devoting more time and resources to structures and processes that engender understanding of customers) than was the case for incremental ones. Conversely, Veryzer (1998) suggested that exploratory, less customer-driven was the route to discontinuous innovation. Much of the inconsistency in the results can be attributed to differences in the conceptualisation and operationalisation of variables. This results in different and competing conceptualisations of newness and this leads to accusations of inconsistency in the innovation literature (Downs and Mohr, 1976; Wolfe, 1994; Garcia and Calantone, 2002; Wolfe, 1994; Garcia and Calantone, 2002; Garcia and Calantone, 2002). Other studies have taken broader views of newness, conceiving it in terms wider than simply only the single radical/incremental type continuum. Although Damanpour (1996) does not operationalise a broad conceptualisation of newness, his observation that radical innovations represent a large departure from existing practices and incremental innovations a lesser degree of departure usefully illustrates the second perspective on newness observed in the literature. This second perspective argues that there are some inherent qualities that are indivisible from newness and so a broader approach is required. Chief amongst these qualities is the departure or discontinuity that an innovation can generate at a macro (e.g. a global paradigm shift) or micro (e.g. adopting unit’s processes) level (Damanpour, 1996; Garcia and Calantone, 2002). These qualities are further discussed in Chapter seven. Roberts and Berry (1985) take a third view on conceptualising newness with what they call the ‘Familiarity Matrix’. In this approach innovations are allocated to a category generated from the orthogonalisation of two of four domains of activity wherein the innovation is implemented. The predominant view is familiarity to the firm, but also applied is familiarity to the market (Atuahene-Gima, 1995), familiarity to the project group (Lynn and Akgün, 2001) and familiarity of the technology (Johne and Snelson, 1988b). It has been utilised principally in what might be considered strategic innovation studies. Booz et al. (1982) use it as a basis for selecting ‘successful’ innovation strategies, Roberts and Berry (1985) to select strategic response for new business opportunities and, de Brentani (2001) for better understanding different new service development scenarios. There are two weaknesses of the approach. First, innovations are categorised on the basis of only two dimensions, but arguably, many more than two dimensions define an innovation. Second, the approach assumes that innovations within each of the resultant categories are homogenous. These assumptions would appear to be at odds with the widely acknowledged view that innovations differ one from the other. The requirement for new solutions to new or even recurrent problems would explain the widespread acceptance of ‘newness’ as a significant construct in innovation research. However, a diversity of approaches to newness is evident. Broadly, three categories of approach to newness have been identified. The first is a narrow perspective predicated on the view that newness is the degree of change from a

- 60 -
previous state. Research in this field has generated inconsistent and contradictory results. Inconsistency of the research results in this field becomes a problem at the level of generalisability and hampers comparative research and theoretical development. The second perspective broadens the view and introduces the idea that additional factors can be associated with newness, such as departure and discontinuity. The third approach assesses familiarity, the extent to which aspects of the innovation (e.g. technology) are familiar to innovators, the firm or the market. This was argued to be valuable but, again, difficult to generalise. Earlier in this chapter it was suggested that one criterion by which a classification system may be judged is its ‘usefulness’. What, therefore, has been the utility of ‘newness’ as an approach to classification and, to what extent does it remain useful? Clearly investigation and discussion of the approach has occupied a portion of the academic community for some years. However, as yet there is no consensus on the meaning of newness, in either its broad or narrow forms, and so results tend to be inconsistent, contextual, difficult to compare and sometimes contradictory. Barclay’s (1992) observation that innovation research had proved to be of little value to practitioners was, a critique aimed at the whole body of innovation research. But, if after four decades and more of research, that part which concerns itself with newness shows little evidence of advancement it cannot be immune from Barclay’s criticism. This strongly suggests that a narrow conceptualisation of newness, on its own is not adequate or sufficiently sensitive to capture the complex and dynamic nature of an innovation. Interestingly, in the same issue of the Journal of Product Innovation Management in which Garcia and Calantone’s (2002) synthesis appears, a short editorial provides reflective commentary on product innovations that had their origins in past years’ wars. In helping the reader to understand something of the innovations the editor uses the word ‘new’ (or similes) four times. More attention, however, is given over to describing, and therefore in helping the reader to come to some understanding, the innovations in terms other than newness. The utility of submarines is, demonstrated, and of the catamaran whose twin hulls shielded a central paddle wheel, and the list further includes ship camouflaging schemes, radar, microwave and many other innovations. The language that is used in order to help the reader come to know and understand each of these innovations describes them in use, their application and some of the benefit they bring. Thus it is that the helicopter “was used in WWII”, they have “been used in all sorts of humanitarian…”, it started life “as an instrument”(Griffin, 2002; 108) and so on. It is an interesting juxtaposition of articles. Garcia and Calantone (2002) argue the criticality of the variable newness to our understanding of innovation whilst the editorial helps us to understand something about a series of innovations by supplementing the construct newness with further factors. It seems that by its language the editorial implicitly recognises that a fuller understanding of innovations rests on factors in addition to newness. Perhaps part of the reason for the sustained focus on ‘newness’ as the attribute of choice in conceptual models of innovation is the complexity of defining different types
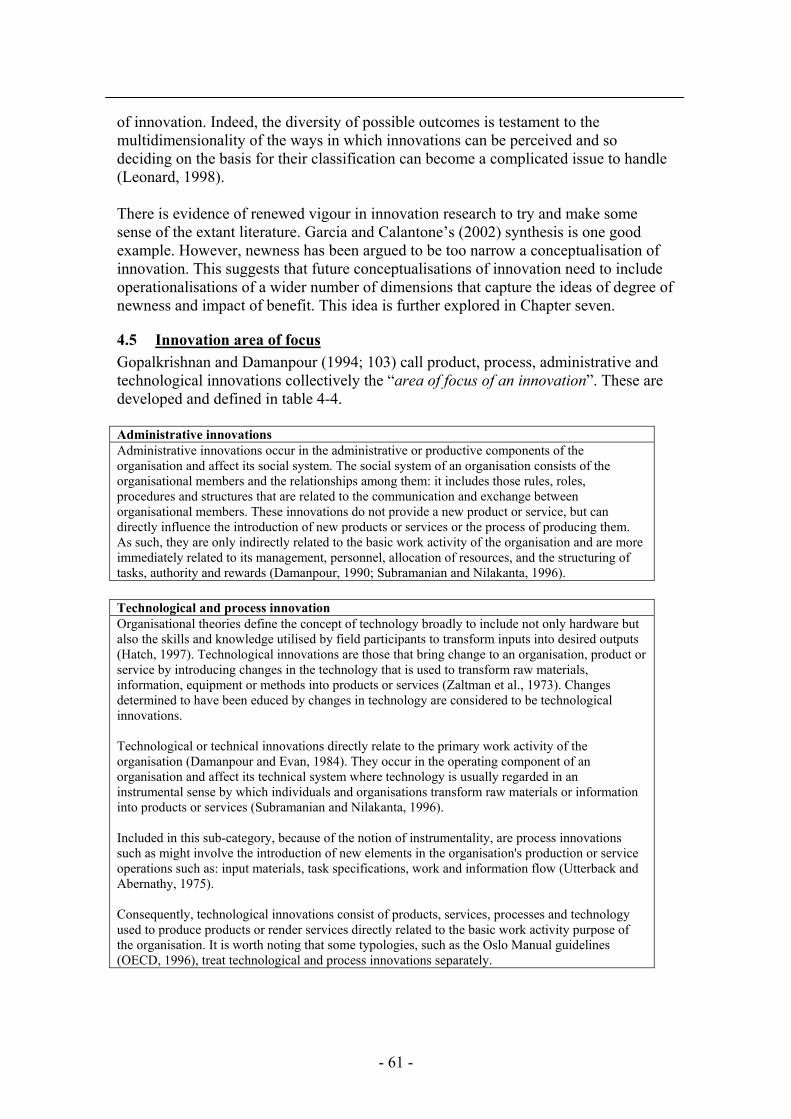
- 61 -
of innovation. Indeed, the diversity of possible outcomes is testament to the multidimensionality of the ways in which innovations can be perceived and so deciding on the basis for their classification can become a complicated issue to handle (Leonard, 1998). There is evidence of renewed vigour in innovation research to try and make some sense of the extant literature. Garcia and Calantone’s (2002) synthesis is one good example. However, newness has been argued to be too narrow a conceptualisation of innovation. This suggests that future conceptualisations of innovation need to include operationalisations of a wider number of dimensions that capture the ideas of degree of newness and impact of benefit. This idea is further explored in Chapter seven.
4.5 Innovation area of focus Gopalkrishnan and Damanpour (1994; 103) call product, process, administrative and technological innovations collectively the “area of focus of an innovation”. These are developed and defined in table 4-4. Administrative innovations Administrative innovations occur in the administrative or productive components of the organisation and affect its social system. The social system of an organisation consists of the organisational members and the relationships among them: it includes those rules, roles, procedures and structures that are related to the communication and exchange between organisational members. These innovations do not provide a new product or service, but can directly influence the introduction of new products or services or the process of producing them. As such, they are only indirectly related to the basic work activity of the organisation and are more immediately related to its management, personnel, allocation of resources, and the structuring of tasks, authority and rewards (Damanpour, 1990; Subramanian and Nilakanta, 1996). Technological and process innovation Organisational theories define the concept of technology broadly to include not only hardware but also the skills and knowledge utilised by field participants to transform inputs into desired outputs (Hatch, 1997). Technological innovations are those that bring change to an organisation, product or service by introducing changes in the technology that is used to transform raw materials, information, equipment or methods into products or services (Zaltman et al., 1973). Changes determined to have been educed by changes in technology are considered to be technological innovations. Technological or technical innovations directly relate to the primary work activity of the organisation (Damanpour and Evan, 1984). They occur in the operating component of an organisation and affect its technical system where technology is usually regarded in an instrumental sense by which individuals and organisations transform raw materials or information into products or services (Subramanian and Nilakanta, 1996). Included in this sub-category, because of the notion of instrumentality, are process innovations such as might involve the introduction of new elements in the organisation's production or service operations such as: input materials, task specifications, work and information flow (Utterback and Abernathy, 1975). Consequently, technological innovations consist of products, services, processes and technology used to produce products or render services directly related to the basic work activity purpose of the organisation. It is worth noting that some typologies, such as the Oslo Manual guidelines (OECD, 1996), treat technological and process innovations separately.

- 62 -
Product / service innovation The introduction of new or amended products or services to meet a user or market need (Utterback and Abernathy, 1975), in effect this is what the customer sees.
Table 4-4: Classification by innovation area of focus Classification by area of focus is less commonly used in the innovation literature than classifications based on newness but still underpins a large proportion of innovation research (Appendix two details 13 studies). The classification is used principally in two domains of innovation research. First, in process research, particularly with regard to the adoption and diffusion of innovations (Daft, 1978; Kimberly and Evanisko, 1981; Damanpour, 1990; Chesborough and Teece, 1996; Sirilli and Evangelista, 1998; Damanpour and Gopalakrishnan, 2001) in which adoption processes reportedly differ according to area of focus and organisational factors. The second field of use has been in that which considers the determinants of organisational change and performance (Burns and Stalker, 1961; Damanpour, 1990; Subramanian, 1996). Results of this second element of research have been inconsistent and contradictory at a macro level, clarity only seemingly able to be established at a micro level (Subramanian and Nilakanta, 1996). Categorising according to area of focus would intuitively seem to make sense within the context of the phenomenon. Simultaneously the approach generates a manageable typology. However, the approach assumes discreteness between the categories of area of focus and also their immutability. There is, in the approach, the implicit assumption that all innovations that belong to any category are homogenous. That is, for example, all ‘technological’ innovations are equally ‘technological’. This is a limitation of the approach and, researchers who contend that the boundaries between categories of area of focus are in fact blurred, increasingly challenge these assumptions (Bhoovaraghavan et al., 1996; Osborne, 1998). The notion that innovations are rarely, if ever, the same in different contexts supports the assertions of blurring. Apparently identical innovations initiated and implemented separately in organisations A and B could, quite feasibly, differ markedly from each other in terms of their newness and area of focus characteristics. For example, the introduction of an information technology innovation into organisation A might be considered a low degree of change from the preceding condition and be considered a technological innovation. In organisation B, however, the same innovation could conceivably be construed as a high degree of change from the previous state and concurrently an administrative innovation. This begs the question, ‘to what extent could these innovations be considered the same?’. This is an enduring problem with the area of focus approach. It is most apparent when trying to distinguish between technological and non–technological innovations but also, increasingly, the boundary between product and process innovations is becoming blurred. It may be the case that organisational, structural or managerial innovation follows from or is an inextricable part of technological change or, that product and process innovations are not independent phenomena. They may represent different

- 63 -
ends of a continuum, thereby implying that at a point around the centre it is difficult to discriminate between the two (Bhoovaraghavan et al., 1996). Warner (1974) attempts to tackle this problem of innovation classification. He argues that the physical or artefactual entity does not suffice as a descriptive definition of the innovation, and further dimensions are required to more fully describe it. He proposes ‘use’ and ‘value’ perspectives to help define and discriminate between innovations. However, although an advance in terms of framework sensitivity, these perspectives are confounded by problems of applying the constructs across multiple markets and the problems of measurability. Wilson et al. (1999) point out that innovations differ one from another because they do not share the same attributes, are not similarly affected by organisational factors nor, indeed, do they share similar processes of initiation or implementation. This suggests that categories of area of focus can be unstable across studies, possibly even within studies. Given the important role of innovation classifications (as either dependent or independent variable) in process, organisational change and performance research this observation poses a challenge to the validity of the area of focus approach.
4.6 Innovation attributes The observation that innovations differ one from another, and that they are rarely the same thing in two organisations, is not new (Downs and Mohr, 1976). As has been shown already efforts have been made to distinguish between innovations on the basis of classification by newness and area of focus. The third area uncovered in this review is that of innovation attributes, characteristics, or psychometric properties (Adams et al., 1992). An attribute is a descriptive property, quality or feature belonging to an entity (McCarthy, 1995) similarly, attributes are those qualities that individuals assign to innovations (Adams et al., 1992). Of the three approaches to classification identified in this review, classification by attribute or attributes is possibly the approach that is the least commonly utilised and has been subject to least scrutiny and conceptual development. In 1971 Rogers and Shoemaker noted that, compared to other aspects of innovation, relatively few empirical studies had directly addressed questions regarding the attributes of innovations, this continues to be the case, but it is not clear why this is so. Avlonitis et al. (2001) averred the suggestion that it might be due to the difficulties intrinsic within a diverse and multidimensional phenomenon. Nevertheless, classification by attributes has made an important contribution to innovation research. Tushman and Nadler (1986) argue that frequently innovations may not be reflected in tangible characteristics. Indeed, as products and services increasingly co-exist as part of a single offer, innovations may not exhibit any tangible qualities at all, rather the innovation is reflected in developer and user perceptions. Rogers (1983; 211) noted that perceptions have an important role in the study of innovation, “the crucial importance of perceptions in explaining human behaviour was emphasised by an early sociological dictum: ‘If men perceive situations as real, they are real in their consequences’”. For West and Anderson (1996; 681) the important thing is that which has actually been implemented, “[W]e believe that group

- 64 -
innovation should…be judged in terms of the content of the innovations implemented within the organization”. The value of understanding perceptions is in being able to elaborate a robust language and framework to talk at an abstract and comparative level about innovation. Two clear streams of attribute-centric research are evident in the literature: process research (Mohr, 1969; Zaltman et al., 1973; Rogers, 1983; Pelz, 1985; Meyer and Goes, 1988; Agarwal and Prasad, 1997; Meyer et al.,1997; Mukherjee and Hoyer, 2001; Danneels and Kleinschmidt, 2001) and conceptual development. (Warner, 1974; Downs and Mohr, 1976; Tornatzky and Klein, 1982; West, 1990; Moore and Benbasat, 1991; Wolfe, 1994; Shenhar et al., 1995). 19 illustrative attribute-centric studies are presented in Appendix three. In process research innovation attributes tend to take the part of the independent variable. The usefulness of research on the attributes of innovation has been mainly to explain and attempt to predict future rates of innovation adoption and diffusion. In this stream of research the adoption and diffusion of innovations can be understood and explained by the way in which the adopting unit perceives the innovation. Researchers place different emphasis on the particular attributes that are thought to be significant in different contexts. So it is that Rogers (1983) proposed five attributes as determinants of adoption, Meyer and Goes (1988) four, Moore and Benbasat (1991) eight, Agarwal and Prasad (1997) eight and Meyer and Johnson (1997) seven attributes4. Other researchers have been more selective (or less inclusive in terms of a multidimensional approach). Mohr (1969) assessed levels of slack and prestige associated with innovation adoption, Pelz (1985) considered innovation complexity and originality in relation to adoption, Adams et al. (1992) ease of use and usefulness, and Mukherjee and Hoyer (2001) novelty and complexity. Arguably ‘newness’ can be treated as a psychometric property of an innovation. However, in this review it has been treated as both a psychometric property and as a separate approach to classification, for two reasons: first, because it is so widely used in innovation research it warranted separate treatment merely by dint of its volume. Second, attribute-centric research adopts a subjectivist position which privileges the perceptions of individuals. This is in contrast to some nova-centric research which attempts to establish objective measures of newness. There is, of course, a body of research that treats newness as an attribute of an innovation (West, 1990; West and Anderson, 1996; Mukherjee and Hoyer, 2001; Danneels and Kleinschmidt, 2001) and these studies are included in this section of the review. Classically, empirical studies have tended to adopt a uni- or bi-dimensional approach as the means of distinguishing between innovations based on their attributes, for example Mohr (1969) slack and prestige; Adams et al. (1992) perceived ease of use and perceived usefulness; Shenhar et al. (1995) technological uncertainty; and Mukherjee & Hoyer (2001) novelty and complexity. As innovation has become increasingly important to organisational growth and survival, this dichotomised uni- or
4 These are further explored in Chapter five.

- 65 -
bi-dimensional categorisation is argued to be insufficient to capture the diversity inherent in individual innovations (Shenhar et al., 1995). A substantial proportion of empirical studies tend to be unidimensional, treating the innovation as a ‘dis-aggregated’ phenomenon (Tornatzky and Klein, 1982). It is against the tendency of these studies to produce unstable results that some conceptual studies rail and argue for holistic and constant frameworks in order to contribute to encouraging the generalisability of findings (Warner, 1974; Downs and Mohr, 1976; Tornatzky and Klein, 1982; Wolfe, 1994). There is a long history of calls in the literature for more substantial, sensitive and integrated frameworks of innovation characteristics. There has been some small response to these calls but evidence of integrative (by which is meant incorporating three or a greater number of attributes), operationalised measures of innovation attributes are hard to find. Of the literature reviewed, only seven published studies were identified that had operationalised and applied a multidimensional framework of innovation attributes: Fliegel and Kivlin (1966), Pelz (1985), Meyer and Goes (1988), Moore and Benbasat (1991), West and Anderson (1996), Agarwal and Prasad (1997) and Meyer et al. (1997), see table 5-5. This observation leads to the identification of the second stream of attribute-centric literature, that of conceptual and theoretical development as a response to instability and inconstancy in innovation research. Rogers and Shoemaker (1971) produced what appears to be the first aggregated conceptualisation to the study of attributes in innovation research. Prior to that the approach appears to have been utilised erratically. Early investigations appear to have been restricted to sector-specific studies on the adoption and diffusion of educational and agricultural innovation utilising context specific attributes. For example, Fliegel and Kivlin (1966) used the attribute ‘association with dairying’ in their study. In terms of theory development, the use of attributes in innovation research stagnated for a period (Fiol, 1996) and, notwithstanding some studies (Rogers (1983), Meyer & Goes (1998), Moore and Benbasat (1991), Agarwal and Prasad (1997) and Meyer and Johnson (1997)), the dis-aggregative tendency of selective study of selected attributes prevailed. Dis-aggregation of innovations into manageable units of analysis has, without doubt, eased the processes of research, but the approach is becoming increasingly redundant. Selective studies preclude both wide generalisation and comparisons across studies. Furthermore, theoretical development is necessarily restricted to a level governed by the exigency of the context in which research has been undertaken. The development of a context-independent, comprehensive classification scheme would directly confront these weaknesses. This problem has been recognised for some time. Downs and Mohr (1976) appealed for constancy within studies for, if innovations are under-specified or their attributes inconsistently applied then, there can be no confidence in the generalisability of results. Indeed, it is this threat to generalisability that Wolfe (1994) confronts and argues that a framework with a clear specification of attributes is necessary. Without such clarity our understanding of innovation will not advance substantially. As a consequence of inconstancy and inconsistency researchers’ ability to compare findings across studies has been hampered.

- 66 -
This review has indicated the importance of the role of different attributes in empirical work. Studies that focus on only a small number of attributes under-specify the innovation and render an incomplete picture of understanding. Research designs that consider innovations in terms of configurations of multiple attributes offer the opportunity to reach a finer-grained and more generalisable understanding of innovation. Having a standard classification scheme for describing the attributes of innovations in universal terms consequently becomes an important goal of innovation research. Multidimensional frameworks based on these perceptions offers the opportunity for polythetic, that is more sensitive, classifications of innovation. In such a case the interesting question might be, to what extent do perceptions of innovations cluster into groups where within groups, although innovations are different (process, product, technology and so forth), they are perceived as being similar? And, if innovations can be identified in terms of similarity, based on configurations of attributes, what are the implications of that for other classification systems? Individual perceptions of innovations differ one to another and a plethora of attributes of innovations can be identified in the literature, Tornatzky and Klein (1982) identify 30 and Wolfe (1994) identifies 18 (excluding synonyms). These are more fully explored in Chapter five. There is a real need, if attributes are to form the basis of any meaningful study of innovation, for these lists to be synthesised and for redundant or overlapping attributes to be removed. In studies, these elements have rarely been taken together. The basic premise of this research is that there are potentially different combinations of these elements which, as a more sensitive measure of innovation will provide us with a device to help better understand relations in the process outcome performance chain.
4.7 Discussion Innovations have been shown to differ one from another. They are not affected in similar ways by different organisational variables (Damanpour, 1996), they do not share the same processual origins (Pelz, 1983; Pelz, 1985; King, 1992), nor do they impact equally on organisational performance (Damanpour and Evan, 1984; Damanpour et al., 1989; Kleinschmidt and Cooper, 1995) or new product success (Booz-Allen and Hamilton, 1982; Cooper and Kleinschmidt, 1993; Lynn and Akgün, 2001). The concept of innovation is multidimensional and complex consisting of diverse but inter-related elements. Many attempts have been made in the literature to manage this complexity through the reduction of the diversity into manageable groups that distinguish between innovations. Three approaches to classification have been identified and these have been reviewed in terms of their origins, application and usefulness. In this review classification systems have been differentiated into three types: innovation newness, innovation area of focus, and innovation attributes. Occasionally studies cross the boundaries and integrate two of the classification systems. In such studies innovations tend to be categorised according to a perspective on newness in conjunction with an attribute, for example complexity (Pelz, 1985). Other studies

- 67 -
investigate newness in conjunction with innovation area of focus, for example product or process innovations (Tushman and Nadler, 1986). However, these studies are the exception. Underlying each of the classification systems is a drive for better understanding of the phenomenon innovation. The need for classificatory approaches is premised on the basis of a belief in the existence of different types of innovations, that these are the product of different processes and which have different impacts and implications on innovation adoption and diffusion and organisational performance. Each of the classificatory approaches described in this chapter share in common the objective of making sense of the phenomenon of innovation and managing large volumes of potentially unwieldy data. Nevertheless, limitations of each of the approaches have been identified. Existing classifications can over-simplify and fail to reflect the complexity and multidimensionality of innovations. Some of these limitations are summarised in table 4-5.
Approach Newness Area of focus Attribute Origins Conventionalism Intuitive Empirical
Classification output Monothetic Monothetic Monothetic & Polythetic
Conceptualisation Narrow to mid Narrow Narrow to broad Theoretical contribution
Limited by range of conceptualisation
Limited by range of conceptualisation Potentially wide
Table 4-5: Limitations of approaches to innovation classification Classificatory approaches based on innovation newness, innovation area of focus and innovation attributes have been identified and reviewed. In their operationalisation these approaches have been demonstrated to be principally monothetic in nature. That is, innovations are allocated to a category according to their value on a single variable. Consequently, categories contain cases which are identical on all dimensions being measured. This tends to be the rule in approaches to classification that privilege newness and area of focus. Clearly there are exceptions to this, not least of all the meta-analytical work of Damanpour (1988) and Damanpour and Szabat (1989). The advantage of monothetic classifications is that they are simple to understand and relatively easy to determine. However, given that they allocate membership according to the presence, absence or degree of a single criterion they risk ignoring salient and defining information and may even be misleading if the wrong criterion is chosen as the basis for classification. It has been argued that classification according to newness tends to be narrowly conceived and rather arbitrarily applied. Innovation area of focus, whilst intuitively attractive is too rigid an approach. By assuming that entities within a category are identical on all dimensions of the variables that define that category the inference is that these entities share the same relationships with other variables (Miller and Friesen, 1984). A significant critique of the newness and area of focus approaches is their

- 68 -
tendency to produce monothetic classifications, which fail to take account of the mutability of innovations. If the merit of any classification scheme is to be judged largely by its usefulness (Everitt and Dunn, 2001), the Downs and Mohr (1976), Wolfe (1994) and other (Tornatzky and Klein, 1982; Barclay, 1992) critiques of newness and area of focus approaches suggest, there is limited utility in them and they suffer from being under-specified, coarse and unsatisfactory. The recognition that, whilst unidimensional studies of innovation attributes has been a valuable basis on which to distinguish them, it is increasingly recognised that as multidimensional phenomena they are better studied as such. Recent classifications include (Shenhar et al., 1995; Veryzer, 1998; Garcia and Calantone, 2002; Gopalakrishnan and Bierly, 2001; Danneels and Kleinschmidt, 2001; Avlonitis et al., 2001). These classifications tend, however, to be typological, that is they are grounded in theories of innovation that can be traced back to some of the earliest characteristics studies. The original premises and assumptions underpinning these researches have remained undeveloped over the decades. It is part of the critique of this chapter that there has been a tendency toward conventionalism in innovation research. Conventionalism is manifested in an implicit assumption that extant bases for classification, perhaps due to their provenance or longevity, can be applied in studies without regard to the requisite demands of justification. None of the classificatory approaches identified appears to have its origins in a scientific approach to classification and this must further call into question their validity. However, the attribute approach is found to have the potential to offer a solution to the problems of narrow specification and mutability through a focus on developer and user perceptions. The approach though, is still relatively underdeveloped empirically. As has been noted, upward of 30 seemingly discrete attributes of innovation have been identified in the literature (Tornatzky and Klein, 1982). In studies, these attributes have rarely been taken together and yet it may be possible to combine these elements to provide a more sensitive measure of innovation. It is not suggested that as criteria newness or area of focus are wrong or inappropriate. Indeed their application in innovation research has made a substantial contribution. Rather, the suggestion is that, in order to move innovation research forward a more sensitive classification based on multiple criteria, or a polythetic approach, is needed. It is argued that a classification based on innovation attributes fits this requirement. Monothetic classifications are argued to be restrictive whilst a polythetic approach promises the opportunity for a more sensitive rendering of the phenomenon of interest and wider ranging comparative studies. Regardless of being monothetic or polythetic, each of these classifications is, however, united by the shared characteristic that there appears to be no scientific basis for its selection or generation. Early in this chapter it was argued that classifications should be based on scientific discovery and that rules and guidelines, now well established and practised in biological taxonomy and also in

- 69 -
some of the disciplines of the management sciences, might be adopted in order to provide such a scientific classification. There is clearly a need for a classification system that can accommodate this complexity. Such a system, providing a more sensitive measure of innovation, may use multiple variables to define and describe innovations. But, given the implicit difficulties associated with the study of phenomena characterised by a multiplicity of attributes, how might a comprehensive but parsimonious framework of innovation attribute, whose utility would be in facilitating comparative research, look? Any valid framework of innovation must be capable of capturing the complexity and multidimensionality of an innovation’s content and be applicable across cases. Innovation attributes form a reasonable basis on which to develop a valid framework for describing innovations. The objective would be to discover if innovators perceive in their innovations what Reger and Huff (1993) call ‘differentiating commonalities’. This would suggest a configurational approach to the study of innovation attributes. Configurations are collections into groups or clusters of the phenomenon of interest wherein the groups are bound together by commonality or similarity of specified, relevant characteristics (or attributes). At the heart of configuration analysis is the assumption that by identifying internally consistent and externally distinct groupings of the phenomena that hold across all instances of the phenomenon, better understanding can be achieved. The configurational approach is especially relevant to the study of multidimensional phenomena where the challenge is to manage multiple discrete data combinations along dimensions that provide a richer understanding or description of the phenomenon of interest (Ketchen et al., 1993). Multidimensional configurational studies have not been as widely utilised in innovation research as they have in other domains of the management sciences. The approach asks ‘What does the innovation look like?’, ‘What generates the configurations and what causes them to cluster?’. It is a perspective that requires the researcher to consider a whole different set of metrics and allows for the innovation to be assessed along a series of dimensions. The configurational approach will generate polythetic classifications, that is where membership of a class or group is based on entities sharing similarities across a large number of attributes. This contrasts with the monothetic classifications (where membership is determined by the presence or absence of a single characteristic) which the newness and area of focus approaches have been argued to generate. Innovation research has long used a classificatory approach, but classifications have been predominantly based on narrow conceptualisations. Existing classifications of innovation are argued to be unsatisfactory, not because important attributes and dimensions are ignored, but because they fail to be either comprehensive and/or lack any scientific basis or justification. It is proposed that a reasonable conceptualisation of innovation is polymorphic, that is innovations have or occur in several distinct forms and these forms are best circumscribed by an holistic conceptualisation based on the perceptions of those who develop and implement the innovation. The configurational perspective is holistic and asserts that innovations, their processes,

- 70 -
determinants and impact can be better understood as a whole rather than in component parts. If the basis for changing the manner in which innovations are classified (i.e. by establishing the validity of an approach based on an holistic attribute perspective as opposed to the narrow ‘nova-centric’ or area of focus approaches), then there is an imperative to revisit questions about the relationship between process and innovation type. Already, a number of researchers have turned their attention to alternative methods of exploring the relationship between process and output (the latter construed in terms of performance). For example Harmsen, et al. (2000) and West and Anderson (1992; 1996). Each of these argue that the characteristics of the innovation mediates the relationship between process and performance. A study based on a conceptualisation of innovation more sensitive to its multidimensionality will augment these existing studies. By empirically deriving a descriptive framework of innovations based on user-perceived attributes and, applying it to a wide range of innovations, it may be possible to identify discrete configurations. Assuming that such discrete configurations do exist and can be identified, it should be possible to determine whether or not these are underpinned by common characteristics of the innovation process. The following chapter begins to address how this might be accomplished.

- 71 -
5 THE NOTION OF ATTRIBUTES
5.1 Introduction Previous chapters have shown that approaches to innovation classification have been characterised as being one of three types: according to newness, area of focus and attributes. Newness and area of focus studies attempt to minimise subjectivity whilst the attributional approach recognises subjectivity as an important discriminating factor in innovation classification. These might be described as objective and perceptual approaches. The former is typified by the work of Damanpour (1988; 1990; 1991; 1992). The latter group argues that innovations possess attributes projected by and consequently measurable from the point of view of the innovator or potential user (Rogers, 1962; Fliegel and Kivlin, 1966; Rogers and Shoemaker, 1971; Rogers, 1983; Moore and Benbasat, 1991; Agarwal and Prasad, 1997). It has been argued that a classification of innovation based on configurations of innovations’ attributes has the potential to generate new insights and offer theory building opportunities. This research proposes exploring the extent to which such configurations can usefully be found to exist within a population of innovations. New insights into the relationship between innovations and processes can be developed if the concept of innovation is less narrowly conceived (Subramanian, 1996). The previous chapter closed with a reflective question on how such a classification might look. This chapter has two objectives. First it reviews previous studies in which innovation attributes have been operationalised. Two types of study are identified: those that operationalise uni- or bi-dimensional investigations and, multi-attribute studies in which three or more attributes are operationalised concurrently in more holistic frameworks. Empirical studies of the latter type are infrequently found. Second, it has the objective of gathering data to be the raw material for developing a framework of innovation based on attributes. As such it is an inductive study in its own right. The methodology is further developed in Chapter six, but it is important to note the ways in which this chapter differs from those that comprise the literature review. One objective of preceding chapters has been to map the world of innovation studies in order to identify a gap and locate this research within that wider context. Whilst one objective of this chapter is to map the domain of attribute research within the field of innovation the second is to undertake a rigorous and comprehensive thematic analysis. Consequently, this chapter reports on an inductive study of the literature looking for attributes in the original authors’ own language. These ‘first level codes’ (Miles and Huberman, 1994) will later (see Chapter seven) be subject to second level coding guided by the four key elements of the West and Farr (1990) definition of innovation that guides this research. This chapter is organised as follows. First, the significance of attributes in innovation research is briefly examined. Next follows a discussion of attributes found in the literature. The resultant analysis provides a basis for mapping the literature and
- 72 -
unearthing gaps, importantly it also generates a resource of theoretically-derived attributes which, later in this study, are used to populate a formal framework of innovation attributes. Finally, attributes are discussed in the context of the current research agenda and some methodological issues highlighted.
5.2 Attributes in innovation research The importance of attribute studies in innovation research has long been recognised but 40 years after Fliegel and Kivlin’s (1966) study there are still relatively few empirical studies, perhaps due to “the considerable complexity of the research task” (Fliegel and Kivlin, 1966; 236). There are several reasons why the perceptions of innovators and adopters continues to deserve attention. It is something of a convention in social psychology that an individual’s circumstances effect his subjective perceptions of objects and ideas. Rogers and Shoemaker (1971; 137) observe, “[I]t is the attributes of a new product, not as seen by experts but as perceived by the potential adopters, that really matters” (original emphasis). Amabile et al. (1996; 1180) confirm this in the context of creativity, suggesting that the “perceived work environment does make a difference in the level of creativity in organisations”. Furthermore, the concept (innovation attribute) is a recurring theme in innovation adoption and diffusion models. The usefulness of research on the attributes of innovation has mainly been to predict the future rate of innovation adoption. Attribute studies tend to be premised on the notion that attributes are a key independent variable in research into the adoption and diffusion of innovations. Empirical and theoretical scholarship would appear to support this assumption (Rogers and Shoemaker, 1971; Rogers, 1983; Moore and Benbasat, 1991; Agarwal and Prasad, 1997; Meyer et al., 1997). In spite of this, the field requires theoretical refinement due, in some part, to the limited empirical investigations to date and the existence of competing models of significant attributes. Finally, from a pragmatic management perspective, perceptions can be managed. An understanding of which perceptions are relevant or pertain during the innovation process would allow management attention to be focused on improving the conditions that govern those specific perceptions or the climate in which they become manifest (Agarwal and Prasad, 1997). Rogers (1983) adds another reason for why developing an understanding of the differences in innovations according to their attributes is important in being able to elaborate a robust language and framework to talk at an abstract and comparative level about innovation. Studies based on the attributes of innovation, specified in a more universal and parsimonious model, could offer a route to cumulative research and subsequent theory development by facilitating cross case comparisons. The importance of having a standard classification scheme for describing the attributes of innovations in universal terms is stressed. Curiously, compared to other aspects of innovation such as actors, context, organisation and communication, the innovation artefact itself is infrequently taken as

- 73 -
the unit of analysis. In the absence of a sufficient body of research on innovations themselves, it is difficult to adequately characterise or describe innovations in terms of their differences and similarities and this limits our ability to generalise from one innovation to others. Fliegel and Kivlin’s (1966; 236) observation that there is a need to put innovations on a “common footing, and thus generalise across innovations” still holds today. The inadequacy stems from a paucity of empirical multi-attribute studies. In spite of its demonstrated importance innovation theory lacks an empirically-grounded, general, formal framework that can describe a range of innovations in terms of attributes. A formal framework is constituted of categories generated at a higher level of generality and involves concepts that can be applied to a number of substantive areas. This contrasts with substantive frameworks which are generated for a specific or contextual area of social enquiry (Blaikie, 1993). Studies have variously researched the influence of single attributes on adoption and diffusion or process or, presented different ‘bundles’ of attributes to explain and predict adoptive behaviour. Multi-attribute studies of ‘bundles’ of attributes tend to be operationalised in substantive as opposed to formal research. Different researchers emphasise the role of different attributes across studies. Downs and Mohr (1976) describe two generic categories of attribute: primary and secondary attributes. Primary attributes, they argue are invariant, unchanging across cases. They are constant, regardless of context, an inherent part of an innovation, for which there would be “essentially no variation among the organizations studied in categorizing the innovation on that attribute” (Downs and Mohr, 1976; 703). They suggest cost or size as examples. Results of studies operationalising primary characteristics of innovation have been inconsistent because behaviour is predicated on perceptions, not inherent characteristics (Downs and Mohr, 1976). Tornatzky and Klein (1982) challenged the distinction between primary and secondary attributes as inappropriate because all attributes, they argue, vary perceptually. For example, Downs and Mohr (1976) suggest that the cost or price of an innovation should be regarded as a fixed intrinsic feature of the innovation. The impact of cost may, however, be differentially reified according to individuals’ perceptions in different contexts. That is, it might be construed as expensive in one context and inexpensive for another. So, it is argued, perceptual items that are relative to the innovator or adopter have a greater effect as determinants of innovation than do primary attributes. It is not the intrinsic properties of the primary attributes that are important but the way in which they are perceived that is the basis for action and behaviour: behaviour and sensemaking is predicated on perceptions (Reger and Huff, 1993). Downs and Mohr (1976) call those attributes that are determined by individual perceptions and subjectivity, secondary attributes. Tornatzky and Klein (1982) suggest Downs and Mohr underestimated the importance of perceived attributes. Downs and Mohr (1976; 703) though, do acknowledge that “most if not all characteristics upon which one might consider basing a typology turn out to be secondary attributes of innovations”. Because researchers place different

- 74 -
emphasis on the particular attributes that are thought to be significant, there is a lack of clarity about selection and operationalisation of attributes at a universal level. Although Rogers and Shoemaker (1971; 137) argued the need for a “standard classification scheme for describing the perceived attributes of innovation in universal terms”, arguably, no such scheme yet exists. This research has identified seven empirical multi-dimensional studies of innovation attributes published since 1966 (see table 5-5). Each study is underpinned, to a greater or lesser extent, by Rogers’ (1983) five factor framework. Notwithstanding its obvious merits (see below) there are two problems with Rogers’ general framework. The first is that the scheme was developed from a meta-analysis of previous studies grounded principally in rural sociology, and so runs the risk of context specificity. The second, and more significant weakness is, as Rogers and Shoemaker admit (Rogers and Shoemaker, 1971; 171), that the postulation of five attributess is logical but empirically indefensible. Future studies should, therefore, be cautious about operationalising studies based on the unthinking adoption of extant frameworks. The remainder of this chapter is dedicated to a review of attributes identified in the literature and serves two purposes. First, it provides a review and critique of attribute-centric studies. Second it is an inductive investigative study in its own right. One objective of the current research is to generate a formal framework of innovation. The constructs that populate the framework may be theoretically- and/or empirically-derived. One output of this review is an extensive list detailing attributes that have been operationalised in innovation research. These may be considered a resource to populate a formal framework. This process begins with a review of singular attributes used in studies, this is then followed by a review of multi-attribute studies.
5.3 Theoretically-derived attributes
5.3.1 Singular items Table 5-1 itemises 55 attributes of innovations identified from the literature. It is evident that many of them are virtual synonyms and there is clearly a lack of conformity in the labelling and definition of attributes. Garcia and Calantone (2002) suggest that such a state of affairs may be attributable to the fact that innovations are researched in a variety of disciplines and language develops differentially within the confines of each.

- 75 -
Attribute Observations Indicative literature
Adaptability The degree to which an innovation can be modified to fit local needs. Similar to flexible, mutual adaptation.
Holloway, 1977; Wolfe, 1994; Meyer et al., 1997; Leonard-Barton and Sinha, 1993
Applicability The degree to which an innovation is communicated as having more than one use in more than one context. Dearing and Meyer, 1994
Architectural
Architectural vs. modular or component: architectural innovation is that which changes the way the components of a product are linked together whilst leaving the core design concept untouched. It destroys architectural knowledge but leaves intact component knowledge. Once a dominant design is accepted within the industry architectural knowledge becomes stable, encoded and implicit. Incremental innovation occurs within the context of stable architectural knowledge.
Henderson and Clark, 1990
Association with dairying Relatedness to the core activity of the adopter. Fliegel and Kivlin, 1966
Autonomous
Autonomous innovations can be pursued independently from other innovations. Similar to component innovation (part of the system can be redesigned without necessity of redesigning the whole, see also Architectural). Goodman (1981) counterpoises autonomous with systemic innovations. The benefits of a systemic innovation can only be realised in conjunction with related, complementary innovations for example, Polaroid camera and film (Chesborough and Teece, 1996). Autonomous innovations directly replace an existing product or process whereas a systemic innovation requires other products or processes to adapt significantly in order for the subject innovation to be effective. Similar to individual and instrumental innovation..
Goodman, 1981; Chesborough and Teece, 1996
Centrality Central vs. peripheral: the degree to which innovation concerns the major day to day work of the organisation and involves activities critical to organisational performance.
Nord and Tucker, 1987; Wolfe, 1994
Communicability The degree to which aspects of an innovation may be conveyed to others, positively related to rate of adoption.
Zaltman et al., 1973; Tornatzky and Klein, 1982; Rogers, 1983; Dearing and Meyer, 1994; Meyer et al., 1997; Zaltman et al. 1973; Tornatzky and Klein, 1982; Meyer et al., 1997
Commutuality The degree to which an innovation is communicated as exhibiting a complementary relationship with other innovations. Dearing and Meyer, 1994
Compatibility
The degree to which an innovation is perceived as consistent with the existing values, past experiences, and needs of potential adopters. The degree of difference from previous ways of doing the job. The degree to which an innovation is communicated as being consistent with past experiences, existing practices and the needs of potential adopters. The degree to which an innovation is perceived as consistent with the existing values of the receivers, and is positively related to rates of adoption. Frequently used in studies but mostly inferred rather than measured. Positively related to adoption.
Rogers, 1962; Zaltman et al., 1973; Fliegel and Kivlin, 1966; Rogers and Shoemaker, 1971; Rogers, 1983; Tornatzky and Klein, 1982; Moore and Benbasat, 1991; Dearing and Meyer, 1994; Agarwal and Prasad, 1997; Meyer et al., 1997
Complexity
Embraces multiple concepts but mostly derived from techno-centric view of innovations, the idea origins of the innovation and organisational complexity. Relates to the ease of understanding and use; the degree to which an innovation is communicated as being relatively difficult to use; the degree to which an innovation is perceived to be difficult to understand and use, and is negatively related to rates of adoption.
Rogers, 1962; Fliegel and Kivlin, 1966; Rogers and Shoemaker, 1971; Tornatzky and Klein, 1982; Rogers, 1983; Pelz, 1985; Gopalkrishnan and Damanpour, 1994; Dearing and Meyer, 1994; Meyer et al., 1997

- 76 -
Continuous improvement
Can be understood in several ways: to improve; as a core value for organisational renewal; as a process for incremental change. The objective is the attainment of advantage either through efficiency or, improvements.
Bessant and Caffyn, 1997
Cost
Various perspectives on cost, but principally financial: how much, running costs, initial cost, continuing cost, rate of cost recovery, negatively associated with adoption, relatively easy to measure. Social cost, affecting power and status is the principal non-financial perspective.
Fliegel and Kivlin, 1966; Zaltman et al., 1973; Tornatzky and Klein, 1982
Discontinuous Fundamental changes in the organisation and a large departure from existing practice.
Lambe and Spekman, 1997; Rice et al., 1998; O'Connor, 1998
Divisibility
The extent to which an innovation can be tried on a small scale prior to adoption, research results inconsistent; the degree to which an innovation is communicated as allowing incremental implementation of its components. The degree to which the innovation is a tight package of inter-linked parts as opposed to being a loose composite of independent parts that could be adopted separately. Similar to status quo ante and reversibility.
Rogers, 1962; Zaltman et al., 1973; Tornatzky and Klein, 1982; Dearing and Meyer, 1994; Wolfe, 1994
Ease of operation Similar to complexity in that it articulates users’ views on the ease or difficulty in making use of the innovation.
Tornatzky and Klein, 1982; Moore and Benbasat, 1991; Adams et al., 1992; Agarwal and Prasad, 1997
Economic advantage
The innovation is more cost effective than that which it supersedes. Similar to relative advantage.
Zaltman et al., 1973; Dearing and Meyer, 1994
Effectiveness
The degree to which an innovation is communicated as being relatively more capable of achieving an ideal end-state. Relates to the extent to which the innovation addresses the problem for which it was initiated. Perceived effectiveness of innovations influence rates of adoption and contribute to the organisation’s ability to fulfil its mission and achieve its objectives.
Pelz, 1985; West and Farr, 1990; West, 1990; Dearing and Meyer, 1994; West and Anderson, 1996
Flexible The ability to modify an innovation according to needs of the implementor. Similar to adaptability, reversibility, mutual adaptation.
Tornatzky and Klein, 1982; Wolfe, 1994
Image Innovation motivated by prestige and social status. Enhanced social status of user through adoption. Had been subsumed within relative advantage by Rogers (1983).
Mohr, 1969; Rogers, 1983; Moore and Benbasat, 1991; Agarwal and Prasad, 1997
Incremental Those that result in a low degree of departure from existing practices. Similar to continuous improvement. Damanpour, 1996
Individual
Individual vs. synergistic: individual innovations affect only a single functional area and do not affect other functions or cause wider change. A synergistic innovation is one that requires that many functions are affected.
Goodman, 1981
Instrumental Instrumental vs. ultimate: ultimate innovations are ends in themselves, instrumental innovations are necessary to facilitate the introduction of the ultimate.
Zaltman et al., 1973; Wolfe, 1994
Interpersonal relationships
The potential of innovations to have consequences for individuals and their relationships. Zaltman et al. (1973) describe a disruptive-integrative continuum along which to conceptualise impact.
Zaltman et al., 1973
Magnitude
The degree of displacement of existing organisational states that the innovation implies – structural, personnel, financial etc. Operationalised by West and Anderson (1996) as the perceived consequence of the change in comparison to other changes.
Wolfe, 1994; West and Anderson, 1996

- 77 -
Mechanical attraction Personal interest in the technology. Fliegel and Kivlin, 1966;
Tornatzky and Klein, 1982
Mutual adaptation The degree to which users refine a system to fit their particular need. Similar to adaptability, flexible, reversibility.
Leonard-Barton and Sinha, 1993
Newness and novelty
Principally perceived from one of two perspectives. Newness to the context of application (firm, market etc) or according to component parts (e.g. technology). Dimensionalised along continua typically ranging from new to the world to style changes.
Heany, 1983; West, 1990; Leonard, 1998; Tatikonda and Rosenthal, 2000; Avlonitis et al., 2001; Danneels and Kleinschmidt, 2001; West, 1990; Krippendorff, 1997; Leonard, 1998; Tatikonda and Rosenthal, 2000; Avlonitis et al., 2001; Danneels and Kleinschmidt, 2001
Observability
The degree to which the results of an innovation are visible to others, and is positively related to rates of adoption; it is not clear whether or not observability per se is being assessed or the observability of different attributes; the degree to which the results of an innovation are communicated as being visible to others. Similar to visibility.
Rogers and Shoemaker, 1971; Rogers, 1983; Tornatzky and Klein, 1982; Meyer and Goes, 1988; Dearing and Meyer, 1994; Meyer et al., 1997
Originality
Different levels of originality exist : ‘originated’ (developed entirely in-house and are wholly original); ‘borrowed’ (copied from outside with no modification); ‘adapted, (prior solutions identified and modified to fit the local context).
Pelz, 1983; Pelz, 1985; Amabile et al., 1996
Payoff Financial return from adoption. Fliegel and Kivlin, 1966; Tornatzky and Klein, 1982
Pervasiveness
The proportion of total behaviours occurring within an organisation that are expected to be affected by the innovation. Pervasiveness is a function of how many organisational members are expected to change their behaviours due to the innovation and for how much time those involved will be behaving in new ways. Does it lead to other change or practice.
Fliegel and Kivlin, 1966; Becker and Whisler, 1973; Beyer and Trice, 1978; Tornatzky and Klein, 1982; Wolfe, 1994
Point of origin Origins of the innovation - endogenously developed or exogenously derived.
Zaltman et al., 1973; Pelz, 1983; Pelz, 1985
Profitability The level of profit gained from adoption of the innovation, may not be appropriate for all innovations. Tornatzky and Klein, 1982
Quality Consists of magnitude, radicalness and novelty. West and Anderson, 1996
Radical
The degree to which an innovation is communicated as being different from existing innovations. Radical vs. incremental: radical innovation, a new paradigm, the ‘next killer application’ all point to the same thing – fundamental change in the activities of the organisation and a large departure from existing practices. Lambe and Spekman (1997) called it discontinuous technological change (DTC) and suggested that it poses a significant challenge for the companies operating in the affected industry. The concept tends to have been applied to technological innovation. Operationalised by West and Anderson (1996) as the perceived changes in the status quo resulting from adoption.
Numerous, including: Zaltman et al., 1973; Tornatzky and Klein, 1982; Dearing and Meyer, 1994; West and Anderson, 1996; Lambe and Spekman, 1997; Wilson et al., 1999
Relative advantage
The degree to which an innovation is perceived as being better than the idea it supersedes or, is better than alternative solutions and is positively related to rate of adoption. Tornatzky and Klein (1982) were critical of the vagueness of the construct, indeed some studies have disaggregated it into sub-attributes, but it is, nevertheless, a frequently used attribute.
Rogers, 1962; Zaltman et al. 1973; Rogers and Shoemaker, 1971; Tornatzky and Klein, 1982; Rogers, 1983; Moore and Benbasat, 1991; Adams et al., 1992; Agarwal and Prasad, 1997; Meyer et al. 1997; Wilson et al., 1999
Reliability The degree to which an innovation is communicated as being consistent in its results.
Tornatzky and Klein, 1982; Dearing and Meyer, 1994

- 78 -
Result demonstrability The tangibility of the results of using an innovation. Moore and Benbasat, 1991;
Agarwal and Prasad, 1997
Returns to investment
Varies across organisations and sectors depending on resource availability and policy on investment return. Difficult to determine in non-profit organisations.
Zaltman et al., 1973
Reversibility The degree to which an innovation can be reversed. Similar to status quo ante and divisibility. Zaltman et al., 1973
Revolutionary Evolutionary vs. revolutionary: continuous improvement or paradigm/system changing. Similar to radical. Rabson and DeMarco, 1999
Risk
Often associated with uncertainty, varies across organisational contexts and perceived in different ways. E.G. the degree to which the medical profession accepted the equipment as safe and efficacious; the level of risk liability to which an adopting organisation is exposed; the degree to which organisational members perceive the new interventions to be risky. The greater the uncertainty of the outcome the greater the degree of perceived risk. Risk can be at its least where market, product and process repercussions are non-existent or minimised. Operationalised risk by pooling the judgements of a panel of experts.
Zaltman et al., 1973; Heany, 1983; Bommer and Jalajas, 1999; Taggart and Blaxter, 1992; Tornatzky and Klein, 1982; Meyer and Goes, 1988; Meyer et al., 1997
Saving discomfort Discomfort prevented following adoption. Fliegel and Kivlin, 1966; Tornatzky and Klein, 1982
Saving time Time saved following adoption. Fliegel and Kivlin, 1966; Tornatzky and Klein, 1982
Scientific status Reliability, validity, generality and internal consistency important as a knowledge component of innovation. Similar to uncertainty. Zaltman et al., 1973
Scope
Linkage between innovation and its environment. That is, to what extent can the innovation stand-alone and be pursued independently or, does its introduction require changes elsewhere in the system? Similar to autonomous and architectural.
Goodman, 1981; Henderson and Clark, 1990; Chesborough and Teece, 1996
Skill The extent of specialised expertise or training needed for a typical specialist to begin using the equipment. Meyer and Goes, 1988
Social approval
A non-financial aspect of reward emanating from association with the innovation. Status gained in one’s reference group. Are people likely to look up to the farmer because he uses it (Fliegel and Kivlin, 1966)? Similar to image.
Fliegel and Kivlin, 1966; Tornatzky and Klein, 1982
Status The extent to which an innovation is adopted in the quest of prestige rather than organisational profit or effectiveness. Mohr, 1969; Wolfe, 1994
Status quo ante The degree to which and the ease with which the status quo ante can be restored, positively related to adoption. Similar to reversibility.
Zaltman et al., 1973
Susceptibility to successive modification
Degree to which the innovation can be modified in response to technological change or other requirements. Similar to adaptability. Zaltman et al., 1973
Terminality A point in time beyond which adoption would appear to be less rewarding. Number and spacing of terminal points may have significant impact on adoption.
Zaltman et al., 1973
Trialability
Various conceptualisations: ease of trial ; the degree to which an innovation may be experimented with on a limited basis; the degree to which an innovation is communicated to allow experimentation on a limited basis; the degree to which an innovation may be experimented with on a limited basis. Those that can be trialed will be adopted more quickly, though results are ambiguous, as trial reduces uncertainty.
Fliegel and Kivlin, 1966; Rogers and Shoemaker, 1971; Rogers, 1983; Tornatzky and Klein, 1982; Moore and Benbasat, 1991; Dearing and Meyer, 1994; Agarwal and Prasad, 1997; Meyer et al., 1997

- 79 -
Uncertainty Knowledge concerning the link between the innovation's inputs, processes, and outcomes.
Zaltman et al. 1973; Souder and Moenaert, 1992; Wolfe, 1994; Deyle, 1994; Shane, 1995; Brouwer, 2000
Visibility The extent to which potential adopters see the innovation as being visible in the adoption context. Similar to observability.
Tornatzky and Klein, 1982; Moore and Benbasat, 1991; Agarwal and Prasad, 1997
Table 5-1: Innovation attributes, singular items (after Wolfe, 1994) Because of labelling, issues of similarity of attributes and, cognisant of the guidelines for classification outlined in the previous chapter, it is considered inadvisable to operationalise the list of attributes from table 5-1 in this study. Similarly the numbers involved would make such a study impractical within the constraints of this research. However, the list constitutes a valuable resource for a descriptive framework of innovations based on their attributes. The inclusion of any attributes in a framework must be justifiable and, the basis on which attributes are incorporated into or rejected from the framework developed in the current research is described in Chapter seven. The following section reviews multi-attribute studies.
5.3.2 Multi-attribute empirical studies As was noted earlier in the chapter, seven empirical multi-attribute studies have been identified and these draw heavily on the influence of Rogers’ (1983) five factor framework. Rogers’ work is not empirical but is a synthesis of previous studies. However, because his studies are central to any discussion of research utilising attributes of innovation a discussion of Rogers’ framework opens this section. Rogers’ (1983) view of innovation is as an innovation-decision process that commences at the convergence of awareness of a problem or issue with first knowledge of the existence of a potential innovation solution. His process begins with the knowledge of “when an individual is exposed to the innovation’s existence” (Rogers, 1983; 164). The view appears to privilege exogenously derived innovations. This perhaps best explains his assertion of the importance of perceptions to adoption and diffusion. Rogers (1962; 1983) and Rogers and Shoemaker (1971) drew heavily on innovation studies in agriculture and, to some extent education, to develop a five-factor framework of innovation attributes said to influence rates of adoption. In the first study Rogers (1962) categorised the attributes as relative advantage, divisibility, complexity, compatibility and, communicability. In subsequent publications, modifications to divisibility (becoming trialability) and communicability (becoming observability) reflected a concern for descriptive precision. These factors are detailed in table 5-2. Rogers’ (1962; 1983) and Rogers and Shoemaker’s (1971) objective was to present five conceptually distinct but empirically interrelated attributes of innovation that were as mutually exclusive and universally relevant as possible. They argue that their five

- 80 -
Attribute Description Relative Advantage
The degree to which an innovation is perceived as being better than the idea it supersedes. Advantage can take several forms, particularly economic and social factors. Because of the economic factor, diffusion researchers are not surprised to find relative advantage a good predictor of adoption.
Compatibility The degree to which an innovation is perceived as being consistent with the existing values, needs, and past experiences of potential adopters. Change agents find it difficult in promoting innovations that run counter to strongly held values. The more compatible the more likely to be accepted but 100% compatibility implies that the degree of change would be marginal.
Complexity The degree to which an innovation is perceived as being difficult to understand and use, classified on a complexity-simplicity continuum.
Observability: The degree to which the results of an innovation are observable to others, the more observable the more likely adoption.
Trialability: The degree to which an innovation may be experimented with on a limited basis before adoption. Those that can be trialed will be adopted more quickly as trial reduces uncertainty.
Table 5-2: Rogers’ (1983) framework factors are the most important attributes as most other attributes can be subsumed within their meanings. In subsequent studies this has led to some difficulties as researchers have tried to extract from Rogers’ attributes further characteristics that appear to be subsumed within the meaning but appear to differentially explain rates of adoption and diffusion (Tornatzky and Klein, 1982; Meyer et al., 1997). Indeed, some studies have shown that the five attributes may only partially account for varying rates of diffusion (Tornatzky and Klein, 1982). Although studies that specifically focus on attributes of innovation are comparatively infrequent in the great corpus of innovation studies, a large number of attributes can be identified. In most cases these attributes are studied as determinants of an adoption or rejection decision and, Rogers (1983) argues, can generally be subsumed under the five attributes he proposes as a general framework. Rogers noted, from early sociological studies of innovation in agricultural and educational contexts, that similar attributes may be important for predicting rates of adoption in both contexts. Citing these earlier empirical studies, Rogers finds some support for the general framework that he proposes, particularly for relative advantage, compatibility and complexity, but less so for trialability and observability, though each of the attributes features to a greater or lesser extent. It is evident, then, that in multi-attribute frameworks different innovations are reflected in different configurations of attributes according to the presence, absence or degree of that attribute. Evidence of the strength of the influence of Rogers’ (1983) work is amply demonstrated in table 5-3. In total Rogers’ (1962; 1983) and Rogers and Shoemaker’s (1971) works have generated 299 citations. The next best total is 31, shared between Agarwal and Prasad (1997) and Wilson et al. (1999). Clearly, it is to their (i.e. Rogers and Shoemaker) advantage, in terms of numbers of citations, that their books have
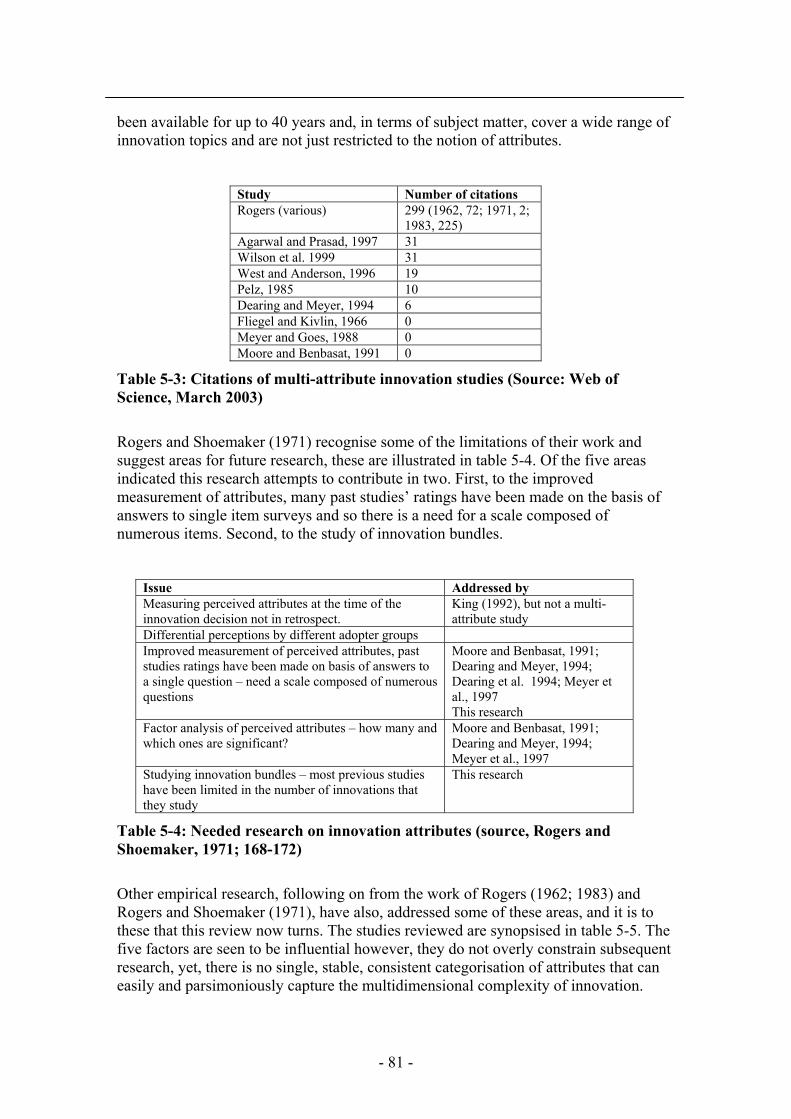
- 81 -
been available for up to 40 years and, in terms of subject matter, cover a wide range of innovation topics and are not just restricted to the notion of attributes.
Study Number of citations Rogers (various) 299 (1962, 72; 1971, 2;
1983, 225) Agarwal and Prasad, 1997 31 Wilson et al. 1999 31 West and Anderson, 1996 19 Pelz, 1985 10 Dearing and Meyer, 1994 6 Fliegel and Kivlin, 1966 0 Meyer and Goes, 1988 0 Moore and Benbasat, 1991 0
Table 5-3: Citations of multi-attribute innovation studies (Source: Web of Science, March 2003) Rogers and Shoemaker (1971) recognise some of the limitations of their work and suggest areas for future research, these are illustrated in table 5-4. Of the five areas indicated this research attempts to contribute in two. First, to the improved measurement of attributes, many past studies’ ratings have been made on the basis of answers to single item surveys and so there is a need for a scale composed of numerous items. Second, to the study of innovation bundles.
Issue Addressed by Measuring perceived attributes at the time of the innovation decision not in retrospect.
King (1992), but not a multi-attribute study
Differential perceptions by different adopter groups Improved measurement of perceived attributes, past studies ratings have been made on basis of answers to a single question – need a scale composed of numerous questions
Moore and Benbasat, 1991; Dearing and Meyer, 1994; Dearing et al. 1994; Meyer et al., 1997 This research
Factor analysis of perceived attributes – how many and which ones are significant?
Moore and Benbasat, 1991; Dearing and Meyer, 1994; Meyer et al., 1997
Studying innovation bundles – most previous studies have been limited in the number of innovations that they study
This research
Table 5-4: Needed research on innovation attributes (source, Rogers and Shoemaker, 1971; 168-172) Other empirical research, following on from the work of Rogers (1962; 1983) and Rogers and Shoemaker (1971), have also, addressed some of these areas, and it is to these that this review now turns. The studies reviewed are synopsised in table 5-5. The five factors are seen to be influential however, they do not overly constrain subsequent research, yet, there is no single, stable, consistent categorisation of attributes that can easily and parsimoniously capture the multidimensional complexity of innovation.

- 82
-
Stud
y Fo
cus
Uni
t of a
naly
sis
Att
ribu
tes o
pera
tiona
lised
N
atur
e of
stud
y
Flie
gel a
nd
Kiv
lin, 1
966
Proc
ess o
f inn
ovat
ion
diff
usio
n.
Inno
vatio
n. 3
3 fa
rm
inno
vativ
e pr
actic
es fr
om
a lis
t of 5
9 dr
awn
up b
y 22
9 da
iry o
pera
tors
.
Initi
al c
ost,
cont
inui
ng c
ost,
rate
of c
ost
reco
very
, pay
off,
soci
al a
ppro
val,
savi
ng o
f tim
e, sa
ving
of d
isco
mfo
rt, re
gula
rity
of
rew
ard,
div
isib
ility
for t
rial,
com
plex
ity,
clar
ity o
f res
ults
, com
patib
ility
, ass
ocia
tion
with
dai
ryin
g, m
echa
nica
l attr
actio
n,
perv
asiv
enes
s. 4
poin
t sca
le to
refle
ct d
egre
e of
pos
sess
ion
of th
e at
tribu
te (i
nfer
s ran
ge o
f ch
arac
ter s
tate
s).
Sele
cted
"tho
se a
ttrib
utes
of i
nnov
atio
ns w
hich
hav
e be
en s
ugge
sted
or s
how
n to
hav
e so
me
bear
ing
on
the
diffu
sion
pro
cess
" (p
p237
). So
me
wer
e ge
nera
l ot
hers
spec
ific
to th
e co
ntex
t. R
ate
of a
dopt
ion
of 3
3 fa
rm p
ract
ices
. Mos
t rea
dily
acc
epte
d in
nova
tions
are
ch
arac
teris
ed b
y be
ing
perc
eive
d to
be
leas
t ris
ky a
nd
mos
t rew
ardi
ng. R
espo
nden
ts w
ere
inte
rvie
wed
.
Hol
low
ay,
1977
(u
npub
lishe
d Ph
D th
esis
)
Deg
ree
to w
hich
ado
pter
s' an
d po
tent
ial a
dopt
ers'
perc
eptio
ns o
f an
inno
vatio
n re
late
d to
ad
optio
n de
cisi
on.
Inno
vatio
n. S
peci
fied
educ
atio
nal i
nnov
atio
n.
Rel
ativ
e ad
vant
age
(cos
t) 4
item
s, re
lativ
e ad
vant
age
(sta
tus)
4 it
ems,
com
patib
ility
5
item
s, ob
serv
abili
ty 4
item
s, si
mpl
icity
(or
com
plex
ity) 3
item
s, tri
alab
ility
2 it
ems.
Exte
nds R
oger
s (19
62) w
ith a
dditi
on o
f ite
ms r
elat
ing
to st
atus
and
pre
stig
e in
clud
ed u
nder
the
rubr
ic o
f re
lativ
e ad
vant
age.
22
Like
rt ite
ms t
o in
vest
igat
e ad
optio
n of
spec
ified
edu
catio
nal i
nnov
atio
n. E
arly
ad
opte
rs a
re d
iffer
ent f
rom
late
ado
pter
s.
Pelz
, 198
5
Inve
stig
atio
n of
stag
es
mod
el o
f inn
ovat
ion
proc
ess a
nd re
latio
n w
ith
orga
nisa
tiona
l and
in
nova
tion
attri
bute
s.
Res
pond
ents
inte
rrog
ated
on
ado
ptio
n of
one
of
thre
e ki
nds o
f tec
hnic
ally
-ba
sed
inno
vatio
n.
Tech
nica
l com
plex
ity, o
rgan
isat
iona
l co
mpl
exity
, orig
inal
ity (b
orro
wed
, ada
pted
, or
igin
al).
Res
earc
hers
rank
ed in
nova
tions
on
dim
ensi
ons o
f at
tribu
tes f
ollo
win
g un
stru
ctur
ed in
terv
iew
s.
Mey
er a
nd
Goe
s, 19
88
Ass
imila
tion
of
inno
vatio
ns in
to
orga
nisa
tions
.
12 M
edic
al in
nova
tions
(s
igni
fican
t dep
artu
re
from
pre
viou
s tec
hniq
ues
for d
iagn
osis
, tre
atm
ent o
r pr
even
tion)
. Ex
pert
pane
l.
Inve
stig
ate
attri
bute
s of i
nnov
atio
ns a
nd,
envi
ronm
ent,
orga
nisa
tiona
l lea
ders
and
de
cisi
on p
roce
sses
. Inn
ovat
ion
attri
bute
s: ri
sk,
skill
, obs
erva
bilit
y.
Ris
k &
skill
by
pool
ed o
pini
on o
f exp
ert j
udge
s on
7 po
int L
iker
t sca
le. O
bser
vabi
lity
by im
pact
on
patie
nt
flow
s. A
ssim
ilatio
n is
a 9
-ste
p pr
oces
s. 25
hos
pita
ls
and
12 in
nova
tions
ove
r 6 y
ear p
erio
d.
Moo
re a
nd
Ben
basa
t, 19
91
Dev
elop
and
val
idat
e an
in
stru
men
t to
mea
sure
in
divi
dual
per
cept
ions
of
info
rmat
ion
tech
nolo
gy
inno
vatio
n.
Info
rmat
ion
tech
nolo
gy
inno
vatio
n.
Vol
unta
rines
s 4 it
ems,
rela
tive
adva
ntag
e 9
item
s, co
mpa
tibili
ty 4
item
s, im
age
5 ite
ms,
ease
of u
se 8
item
s, re
sult
dem
onst
rabi
lity
4 ite
ms,
visi
bilit
y 5
item
s, tri
alab
ility
5 it
ems.
(als
o pr
opos
e a
shor
ter 2
5 ite
m sc
ale)
.
Ado
pts v
iew
of s
econ
dary
attr
ibut
es (a
fter D
owns
and
M
ohr,
1976
). Ex
tend
s Rog
ers (
1962
) with
oth
er
attri
bute
s tha
t wer
e "d
eem
ed n
eces
sary
" (p
p. 1
95).
Synt
hesi
s of e
xist
ing
mea
sure
s and
new
mea
sure
s. 3
stag
es o
f ins
trum
ent d
evel
opm
ent:
item
cre
atio
n;
scal
e de
velo
pmen
t; in
stru
men
t tes
ting.
Dea
ring
and
Mey
er, 1
994
Dev
elop
attr
ibut
e-ba
sed
pred
ictio
n to
ol fo
r ad
optio
n of
inno
vatio
n.
Inno
vatio
n. H
azar
dous
w
aste
cle
an-u
p te
chno
logy
an
d pr
oces
s inn
ovat
ions
, n=
9.
Econ
omic
adv
anta
ge, e
ffec
tiven
ess,
obse
rvab
ility
, tria
labi
lity,
com
plex
ity,
com
patib
ility
, rel
iabi
lity,
div
isib
ility
, ap
plic
abili
ty, c
omm
utua
lity,
radi
caln
ess.
Attr
ibut
e se
lect
ion
just
ified
in te
rms o
f prio
r em
piric
al w
ork
(Dea
ring,
Mey
er a
nd K
azm
ierc
zak,
19
94).
Res
pons
es o
n 7
poin
t Lik
ert s
cale
.

- 83
-
Stud
y Fo
cus
Uni
t of a
naly
sis
Att
ribu
tes o
pera
tiona
lised
N
atur
e of
stud
y
Wes
t and
A
nder
son,
19
96
Inve
stig
atio
n of
top
man
agem
ent t
eam
s and
in
nova
tion.
Inno
vatio
n. 2
05
inno
vatio
ns in
27
hosp
itals
.
Mag
nitu
de, r
adic
alne
ss, n
ovel
ty, b
enef
it to
ad
min
istra
tive
effic
ienc
y, b
enef
it to
pat
ient
ca
re, b
enef
it to
staf
f wel
l-bei
ng (1
item
for
each
fact
or).
Inno
vatio
ns ra
ted
on d
imen
sion
s of a
ttrib
utes
by
dom
ain-
rele
vant
exp
erts
. Rat
ing
on a
1-5
scal
e.
Aga
rwal
and
Pr
asad
, 199
7
Ado
ptio
n of
an
inno
vatio
n: in
itial
use
and
in
tend
ed c
ontin
ued
use
of
the
Wor
ld W
ide
Web
. Are
th
e pe
rcep
tions
that
pr
edic
t ini
tial u
se th
e sa
me
as th
ose
that
pre
dict
co
ntin
ued
use?
Inno
vatio
n, u
se o
f the
W
orld
Wid
e W
eb.
Rel
ativ
e ad
vant
age
5 ite
ms,
ease
of u
se 4
ite
ms,
com
patib
ility
3 it
ems,
imag
e, 3
item
s, re
sult
dem
onst
rabi
lity
4 ite
ms,
visi
bilit
y 2
item
s, tri
alab
ility
2 it
ems.
Use
r per
cept
ions
dem
onst
rate
d to
be
inst
rum
enta
l in
expl
aini
ng a
subs
tant
ial p
ropo
rtion
of t
he v
aria
nce
in
both
cur
rent
use
and
futu
re in
tent
ions
: par
ticul
arly
, co
mpa
tibili
ty, t
riala
bilit
y an
d vi
sibi
lity.
O
pera
tiona
lisat
ion
of sl
ight
ly m
odifi
ed M
oore
and
B
enba
sat (
1991
) ins
trum
ent.
7 po
int L
iker
t sca
le
anch
ored
with
stro
ngly
agr
ee/d
isag
ree.
Mey
er e
t al.,
19
97
Impl
emen
tatio
n of
m
ultip
le in
nova
tions
into
a
new
org
anis
atio
nal
form
.
Inno
vatio
n, th
ree
cont
rast
ing
heal
th se
rvic
e in
nova
tions
.
Rel
ativ
e ad
vant
age
5 ite
ms,
com
patib
ility
2
item
s, ob
serv
abili
ty 3
item
s, co
mpl
exity
4
item
s, tri
alab
ility
5 it
ems,
adap
tabi
lity
5 ite
ms,
riski
ness
4 it
ems.
Con
stru
ct id
entif
icat
ion
thro
ugh
a th
eory
-driv
en
proc
ess.
Self
repo
rted
ques
tionn
aire
am
ongs
t key
de
cisi
on m
aker
s (n=
89).
Tab
le 5
-5: E
mpi
rica
l mul
ti-at
trib
ute
stud
ies o
f inn
ovat
ion

- 84 -
It was noted earlier that Fliegel and Kivlin (1966) attributed the shortage of multi-attribute studies of innovation to the complexity of the task. They operationalised 15 attributes on the basis that they “have been suggested or shown to have some bearing on the diffusion process” (Fliegel and Kivlin, 1966; 237). The selected attributes include those that are highly context specific (e.g. association with dairying) those that are economically-oriented (e.g. cost and profitability) and those that are somewhat general in nature (complexity, compatibility, trialability), the latter ‘bundle’ betraying the influence of Rogers (1962). The Fliegel and Kivlin (1966) study was limited to only 33 innovative farm practices. They described this as a manageable number but observed that “the prospects for including substantially larger numbers of innovations in a meaningful research design are not bright until some progress is made toward establishing comparability among these innovations” (Fliegel and Kivlin, 1966; 239). Dearing and Meyer (1994) developed interesting tools to enable the comparison of innovations. They develop and describe the ‘attribute matrix’ and the ‘innovation profile’. The former is a representation of both innovator perceptions and those of potential adopters about the attributes of an innovation selected a priori by the researchers. It was generated from the innovator’s and potential adopter’s responses to a questionnaire relating to each of the 11 operationalised attributes scored on a seven-point Likert scale. The two sets of scores were then ranked alongside each other and the differences (or similarities) investigated in terms of the evaluative communications (positive or negative) about the innovation made by the innovator. The innovation profile is a composite description of innovators' perceptions and communications about their innovations. It is an instrument that assigns a value to potential adopter's perceptions about an innovation by summing an innovator's score for each attribute and calculating the mean. Innovation profiles for nine functionally similar innovations, described as ‘high-risk’, were developed. To develop the innovation profiles, the study operationalised 11 attributes, in terms of how information about the innovation is communicated, in the form of a questionnaire. Six of the attributes were drawn from the Rogers (1983) framework (relative advantage having been disaggregated into economic advantage and effectiveness). The remaining five attributes (reliability, divisibility, applicability, commutuality and radicalness) were included on the basis of the researchers’ expectation that these factors would be significant to adopters in thinking about high-risk innovations. It is not clear though, why a factor ‘risk’ was not included, although, arguably, ‘risk’ might be subsumed within the factor ‘reliability’. The study concludes that diffusion is dependent on the perceptions of both innovator and adopter moderated by the 'evaluative communication' sent by the innovator. Meyer et al. (1997; 123), describe the innovation profile as "… a promising tool to assess organisational members' perceptions of innovation attributes". They extend the work on multi-attribute measures of innovation in a study of three health service innovations. In their selection of salient attributes Meyer et al. (1997) were influenced

- 85 -
by both Rogers’ (1983) Dearing and Meyer (1994) and Dearing, Meyer and Kazmierczak (1994). However, they introduce two further attributes alongside modified conceptualisations of Rogers’ original five: risk and adaptability. The study though is limited by its failure adequately to justify the selection of attributes on which its case is built. Also, the study sample of three innovations is small and context specific to an emergent organisational form (a network of contractors providing services for a federal government agency), thereby limiting the generalisability of results. The research employed diffusion of innovations theory to contrast three different preventive health interventions by their innovation attributes. In doing so it continues empirically to develop the field opened up5 by Dearing and Meyer (1994) of instrument development for the comparison of innovations. However, the results of the study are limited by the size of sample and single organisational context. Nevertheless, they report two interesting (for this research) findings. First, the three innovations were rated differentially, and so are discrete from each other, according to degrees of difference in attributes. For example “…project 3 had significantly higher levels of relative advantage than project 2. Project 2 was rated more highly than project 1 or project 3 in terms of risk…” (Dearing and Meyer, 1994;124), and so on. Meyer and Goes (1988), too, noted different configurations of attributes resulting from their study. Innovations that were highly observable, carried low risks and required relatively little skill to use were more readily assimilated than were other innovations. This lends support to one of the assumptions underpinning this research that attributes configure differently for different innovations, thereby distinguishing innovations from each other. It is proposed that these configurations could lead to the development of a novel taxonomy of innovation developed from a large sample of innovations. The second interesting finding is the support, or not, that the research uncovered for the operationalised attributes. Support was found for riskiness, adaptability and effectiveness however, observability and trialability did not appear to affect innovation acceptance. On the other hand, Agarwal and Prasad’s (1997) study of initial use and intended continued use of the World Wide Web found support for each of the seven attributes they operationalised. However, support differed according to initial use or intended continued use. In fact, Agarwal and Prasad (1997) operationalised an eighth attribute, ‘perceived voluntariness’, the extent to which potential adopters perceive the adoption decision to be non-mandated. In the context of this research, however, this item was considered not to be an attribute of the innovation but reflected organisational climatic conditions, and is thus discounted from this review. Agarwal and Prasad (1997) operationalised a slightly modified version of Moore and Benbasat’s (1991) instrument to measure the perceptions of adopting an information technology innovation. Moore and Benbasat’s (1991) work appears to have been motivated by their observation that most existing instruments lack reliability and
5 Moore and Benbasat (1991) pre-date Dearing and Meyer, but they did not apply the framework that they had developed other than in rounds of validation.

- 86 -
validity and that no comprehensive instrument to measure the variety of perceptions of innovations had been found to exist. The instrument they develop is wholly theoretically-derived. They rely on four unpublished PhD theses, one personal communication, one conference paper and one (empirical) journal paper, as well as drawing on Rogers (1983), to provide the attributes that comprise their instrument. The extent to which they trawled outside the mainstream journal sources for evidence from empirical studies lends support to their assertion that no valid or reliable instrumentation for the operationalisation of Rogers' model existed. Ultimately they rely on attributes identified in Rogers (1983) and by the meta-analysis of Tornatzky and Klein (1982) to populate their instrument. As has been seen in the other studies reviewed here they chose to disaggregate the attribute relative advantage, extracting from it the attribute ‘image’. Their instrument, whilst comprehensive within the frame of reference they set themselves, is limited in two ways. First, the study appears restrictive, limited, principally, to a small number of published studies, one of which describes its framework as empirically indefensible (Rogers and Shoemaker, 1971; 171). Second, instrument development is restricted by both context (limited to information technology innovation) and by stage of innovation process (adoption based on perceptions of individual users). Tornatzky and Klein (1982) undertook a review and meta-analysis of 75 studies concerned with innovation attributes and their relation to innovation adoption and diffusion. Many of the studies they review form the basis of Rogers’ (1962, 1983) framework, and so are not included in this review. They describe the measurement of potential adopters' perceptions of innovation as a classic issue in the innovation literature (pp. 28). The assertion of this study, that the majority of studies in this area operationalise relatively few attributes, is supported by Tornatzky and Klein’s (1982) observation that less than one-third of the studies they analysed had investigated four or more attributes. Their study concluded with the identification of the 10 most frequently referred to attributes, these were: cost, communicability, divisibility, profitability, social approval, observability, trialability, compatibility, relative advantage and complexity. Of these, compatibility, relative advantage and complexity had the most consistent significant relationships with innovation adoption. Pelz (1985) and West and Anderson (1996) take slightly different perspectives from the studies reviewed thus far. The former, Pelz (1985), considers the relation between attributes and innovation process, the latter (West and Anderson, 1996) the relationship between innovation quality and team composition and social processes. In both of these studies the influence of Rogers’ framework is, once again, evident. Pelz (1985) operationalised three attributes (technical complexity, organisational complexity and origination) and West and Anderson (1996) four (magnitude, radicalness, novelty and benefit). Pelz (1985) concludes that for those innovations that are ‘originated’ (originates within the organisation as opposed to being exogenously derived) the sequence of events in the process overlaps in time, is muddled and disorderly. For simple innovations that are ‘borrowed’, a moderately clear succession

- 87 -
of stages may appear. The answer to the question “are there innovating stages?” is contingent. That is the resolution of the edges between one stage and another depends on the complexity and/or originality of the innovation. That is not to say though that, a muddled or disorderly process will culminate in an original or complex innovation nor, indeed, that an orderly process in which the stages are relatively clear cannot culminate in an original innovation. The research is inconclusive as regards normative statements about what sort of configuration of attributes is related to any particular process patterns: “apparently, an effective innovation could occur in either an orderly or muddled fashion, and so could an ineffective one” (Pelz, 1985; 66). West and Anderson’s (1996) longitudinal study of the functioning of top management teams in 27 hospitals concluded that the degree of radicalness might be predicted by group processes that encourage or discourage members to propose new ways of doing things. However, they draw no conclusions regarding innovations conceptualised in terms of configurations of the attributes they operationalise.
5.4 Discussion Innovation research is, in some quarters, characterised by the use of attributes and this review has demonstrated the importance of their role in contributing to understanding key aspects of innovation theory. Empirical and theoretical studies in this domain regard individuals’ perceptions of innovations as important in understanding, explaining and predicting adoption and diffusion patterns. They lend support to the theoretical relationships between innovation attributes and adoption and diffusion behaviour (Dearing and Meyer, 1994; Meyer et al., 1997), initial use and routinisation of innovations (Agarwal and Prasad, 1997), innovation processes (Pelz, 1985) and, team social processes (West and Anderson, 1996). Several multi-attribute studies have noted that innovations differ one from another according to different configurations of bundles of attributes. Furthermore, they note that these innovations exhibit different characteristics in terms of their rate of adoption (Meyer et al., 1997) and relation with process (Pelz, 1985; Schroeder et al., 1989; King, 1992). However, in spite of the large debt that the field of attribute studies owes to Rogers’ (1983) framework, a widely accepted, valid, robust formal framework appears not to exist. In order to offer a more holistic view of the innovation a synthesis is needed. In spite of its putative empirical indefensibility, Rogers’ (1962; 1983) framework appears to have developed the status of sine qua non of attribute research. However, in empirical studies, support for all attributes is not constant and innovation research is still some distance from a universally applicable framework. Some attributes have been shown to be study specific, sector specific, or context specific. This inconsistency makes it difficult to envisage how any extant framework might usefully be operationalised as a general formal framework applicable across cases. A large majority of studies tend only to operationalise a small number of attributes. Kimberly and Evanisko (Kimberly and Evanisko, 1981) are critical of research that focuses on a single innovation or a single class of innovation as this hampers opportunities for generalisation. The consequence is that little is known about the

- 88 -
influence of variability of type (where type is construed in terms of attributes) of innovation on adoption and process. Also they note that sample sizes tend to be small in innovation research, and there is evidence of this in the studies of multi-attribute research reviewed above, thus precluding the opportunity of employing multivariate analytical techniques. That is, there is an absence of systematic quantitative comparative analysis of the characteristics of different innovations within an organisational context. In terms of attributional studies of innovations, Rogers’ (1983) framework provides a useful conceptual scheme of factors. Subsequent empirical and theoretical work has applied, tested, modified and continued to suggest alternative schema, but none of these appear to have taken the notion to its logical conclusion. That is, if innovations can be conceptualised in forms determined by their attributes then, to what extent does this reconceptualisation of the form of innovations support or challenge existing theories about the process origins of innovations that are differentiated according to different schema? Without a shared set of definitions, topics and concepts there can be no cumulative tradition and any cumulative tradition has to be based on “well-defined constructs...based on theory, and the operationalisation of these constructs through measures with high degrees of validity and reliability” (Moore and Benbasat, 1991; 193). Whilst a large number of attributes can be identified in the literature, many are synonyms and are not conceptually distinct and others may be study-specific (for example Fliegel & Kivlin’s (1966) ‘association with dairying’). A logical approach can produce a synthesis of these attributes refining a long list into a, relatively speaking, parsimonious and generalised list. But given this difficulty and the multiplicity of attributes theorised and operationalised in the literature, what would a comprehensive but parsimonious framework of innovation outcome, whose utility would be in facilitating comparative research, look like? In the light of this review the literature that focuses on multi-attribute studies of innovation can therefore be considered to be deficient in the following areas: dimensionality, constancy, scope and operationalisation (see table 5-6).
Dimensionality: Tendency to apply constructs in a seemingly ad hoc fashion and singly. The consequence has been the development of multiple contextual theories of innovation and the confounding of attempts at cumulative research. Constancy: There is evident overlap between many of the attributes identified in the literature but apparently little effort has been made to present clear, constant and consistent definitions of attributes within and across studies. Efforts at cumulative research confounded. Scope: Majority of attributes are found principally in one domain of innovation literature, organisational innovativeness (adoption, implementation and diffusion) and technological innovations. Suggestive of incompleteness and that any framework developed from these may be under-specified. It might be postulated that existing literature overlooks some practitioner views. Operationalisation: Evidence of few empirically-applied, multidimensional frameworks in the literature.
Table 5-6: Problematising attribute-centric studies

- 89 -
5.5 Conclusion Despite an extensive body of research that theorises and operationalises attributes of innovation, the literature is characterised by inconsistent and conflicting findings. Arguably, this problem stems from the lack of a generally accepted measure of innovation attributes. This research proposes a formal framework of innovation attributes that is theoretically derived and empirically developed. So the question at the end of this review is, in terms of a study of attributes of innovation in the NHS, in order to compare across a wide body of innovations which attributes should be included in the framework? There is no shortage of attributes from which to choose and, there is even a short history of operationalised multi-attribute studies. It is, however, difficult to make a choice, from either the long list of individual attributes or, from those operationalised frameworks, that can be justified in terms of the guidelines for classificatory studies outlined in the previous chapter. Whilst not producing an infinite number, the 55 attributes identified in table 5-1 could conceivably be arranged into 55! (factorial) different combinations each presenting a profile of a different type of innovation – even more if attributes are considered in terms of degree (e.g. high, medium, low) in addition to presence or absence. So many configurations could, arguably, not lead to synthesis or higher level theory but would contribute to increased diversity in innovation research. However
“this potential variety is limited by the attributes' tendency to fall into coherent patterns...The upshot is that just a fraction of the theoretically conceivable configurations are viable and apt to be observed empirically” (Meyer et al., 1993; 1176).
On the assumption, then, that it is an inherent quality of attributes to configure into manageable and coherent patterns, this research can continue in its objective of developing a formal framework to be applied to a sample of innovations to discern if discrete types can be identified. Tornatzky and Klein (1982; 39) note that an “ideal innovation characteristics study” should include the following: • It must consider more than one innovation attribute so as to fully describe the
innovation and also allow for comparison to other attributes. • It should utilise replicable measures of innovation attributes, and data gathered
from participants in the process. Simply inferring the level of certain innovation attributes is not adequate.
• It should study more than one innovation. Single innovation studies are not sufficiently robust to permit generalisation to a population of innovations.
This review has provided a valuable resource that can contribute partially to satisfying their recommendations. The issue becomes one of deciding which attributes, on what basis and how should they populate the framework. The previous chapter has provided some guidelines these and other methodological issues are addressed in the following chapter.

- 90 -

- 91 -
6 METHODOLOGY AND RESEARCH DESIGN
6.1 Introduction Previous chapters have asserted both the multidimensionality of innovation, which makes its study both interesting and challenging, and the need for a synthesised framework of innovation attributes. A synthesised framework of innovation attributes would offer a new conceptual approach to the study of innovation and has the potential to offer the opportunity to generate new insights into the relationships between innovation types and other domains of innovation study (for example process and performance). The principal focus of this research is, therefore, to develop a synthesised, formal framework of innovation based on users’ and innovators’ perceptions, and to consider its utility in the context of innovation process. The perceptual approach requires careful consideration of ontological and epistemological issues. This chapter focuses on these issues and charts a course that locates the research in the realist tradition as described by Bhaskar (1978). Subsequently, research design issues are discussed. This chapter has three objectives. First, it reviews philosophical perspectives and their implications in the context of the aims of the current research. Second, it builds a research design consistent with the adopted philosophical approach and overall research aim. Third, three phases of empirical research, data collection and analysis are briefly outlined. The organisation of the chapter broadly follows this order of objectives, and begins with a brief review of ontology and epistemology in management research.
6.2 Ontology and epistemology in management research Tuchman (1994; 306) reminds us that methodology means, not the application of a specific data collection method such as survey or interview but, “the study of the epistemological assumptions implicit in specific methods”. Arguably, there is no solid enough foundation from which we can begin any consideration of our knowledge of knowledge (Johnson and Duberley, 2000). We have no ‘neutral’ ground on which to stand to evaluate the relative merits of different ontological and epistemological perspectives (Blaikie, 1993) because they are all human constructions. Popper (1991; 111) noted that the “empirical basis of science has nothing ‘absolute’ about it. Science does not rest upon solid bedrock”. Consequently, different philosophical assumptions compete for primacy in the way in which we engage with social enquiry. So-called ‘warranted knowledge’ is framed by the researcher’s ontological and epistemological persuasions and, consequently, it is incumbent on the researcher to articulate his own position regarding of what it is that reality consists (ontology) and how he believes he may come to know that reality (epistemology). Explorations of competing philosophical perspectives tend to begin with a review of positivism. Positivism was, for centuries, the single and then dominant (in that challengers were few and minor) method of scientific enquiry, derived from the study

- 92 -
of natural sciences, and whose tenets remain embedded in the western psyche. The ontological position of positivism is that reality is ‘out there’, it is single, objective and can be accessed by the researcher who can remain independent and neutral. The objective of positivism is to seek and understand causal relationships in natural phenomena and to explain and predict events. Similarly, in the fields of organisational and management enquiry, the objective of positivism is the discovery of fundamental laws which govern the ways in which organisations operate (Johnson and Duberley, 2000). Temporal primacy (in that it was first) and longevity (in that it has demonstrated enduring utility), appear to have affirmed the place of the positivistic scientific method as the ‘superior’ process for generating high quality, warranted knowledge (i.e. in meeting the objectives of understanding, explanation and prediction). Thus positivism has earned the status of referent against which other positions must be judged. Positivism often becomes the ‘default’ position for which justification for considering alternatives must be given. However, the pre-eminence of the positivist approach in the social sciences should not be confused with any overarching legitimacy as a way of discovering truths. Other, legitimate, competing perspectives have emerged each of which reject, to a greater or lesser extent, some or all of the tenets of positivism. These perspectives are classically represented along a continuum extending from positivism at one end to constructivism at the other. Constructivism exists at the other end of the continuum from positivism. It conceives of a world that is socially constructed in which meanings are produced by people:
“It takes…the meanings and interpretations, the motives and intentions, which people use in their everyday lives, and which direct their behaviour – and elevates them to the central place in social theory and research” (Blaikie, 1993; 176).
For constructivists, reality is a product of social interactions, and consequently there is no single but multiple realities constructed in multiple contexts. That is, there is no objective reality that can be discovered by researchers. The view is a radical departure from the detached positivist perspective. It privileges subjectivity as the observer/researcher is concerned with how social objects are made meaningful by actors in the ‘life world’ (Holstein and Gubrium, 1994). Between the poles of positivism and constructivism, perspectives that do not wholly reject all tenets of either can be identified. These perspectives attack positivism’s adherence to the view that reality is objective and external arguing, instead, that reality is socially constructed and given meaning by people (Easterby-Smith et al. 1994; Guba and Lincoln, 1994; Denzin and Lincoln, 1994). Concurrently, they challenge the interpretivist notion of only a socially-constructed reality (Johnson and Duberley, 2000). Table 6-1 illustrates the extremes of this continuum and suggests implications for management research. Having thus circumscribed the philosophical field, delimited by positivism and social constructivism, it is necessary to outline wherein the current research is located.

- 93 -
Characteristics of positivism Characteristics social constructivism
Ontological position: the nature of reality
• External and independent of the observer
• Objective and ordered • Single reality • Belief in laws, uniformity
and generalisability of knowledge
• Reductionist and deterministic
• Reality is socially constructed and apprehendable in multiple forms
• Interpretive: socially and experientially based
• Changing realities • A product of human minds and has
no independent status of its own, reality is determined by meanings individuals give to experience
Epistemological position: acquiring knowledge of reality
• Value free acquisition of sense data accessible by the scientific process which is the only reliable foundation for knowledge
• Neutrality • Dualism: researcher remains
objective and exterior to the subject.
• Reduction of the natural world
• Nomothetic (law giving) generalisations
• Direct experience • Sense data • Empirical verification
• There is no neutral ground for knowledge since all observation is value laden
• Observer becomes part of what is observed
• Getting close to the subject • Adopting a holistic view of social
phenomena • View social phenomena in their
natural environments • Idiographic (relating to
individuals) generalisations
Aim of the research
• Suited to the study of “It” beings to generate causal and fundamental laws of human behaviour
• Explanation, prediction, control
• Suited to the study of human beings
• Those metaphysical things that positivism discounts or cannot access through empirical facts, such as values
• Understanding, exploration, emancipation
Attitude of the researcher
• Detached, independent, impartial
• Involved, interacts with the subject in order to gain understanding of the phenomenon
Methods
• Natural sciences methods • Measuring operationalised
concepts • Use of large samples • Manipulation and control of
isolated variables for the measurement of their relationships with others
• Uniformity and generalisability of knowledge
• Multiple methods to establish different views of the same phenomena
• Small samples investigated in depth over time
• Social constructions can be elicited and refined through interaction between the researcher and the respondent
Table 6-1: Continuum extremes of competing philosophical perspectives and implications for management research (adapted from: Blaikie, 1993; Denzin and Lincoln, 1994; Easterby-Smith et al. 1994; Johnson and Duberley, 2001)
- 94 -
Blaikie (1993) proposes that choice of research perspective can be legitimised in several ways: matching perspective to research project in a pragmatic fashion; driven by a particular worldview, for example deontological or relativist; the consequence of personality factors that determine a preference for ‘insider’ or ‘outsider’ status; or, the social context of the researcher and the researched. The perspective adopted for this research is justified in terms of pragmatism, a rationale for which is developed in the following section.
6.2.1 Realism Empirical observation is central to the traditional scientific, and therefore also positivist, method. Positivism asserts that direct experience, accumulated in the form of data through the observer’s senses, is the only reliable and legitimate basis for knowledge. However, social research frequently encounters phenomena that are not easily observed, and are consequently discounted from the positivist epistemology (Johnson and Duberley, 2000), for example ‘values’ or ‘trust’ or ‘culture’. Similarly, innovation is not easily observed, and a conceptualisation of innovation rooted in the experiences and perceptions of third parties disqualifies itself from embracing a wholly positivist approach. It has been suggested in previous chapters that one limitation of innovation studies is the difficulty of generalising and undertaking comparative analysis due to inconsistencies in the application of characteristics of innovations. Research, in both its method (small sample narrative studies) and results (innovation is contingent and context dependent), up until the last years of the twentieth century, has been characterised by a predilection for the idiographic over the nomothetic (Poole et al., 2000). A developing momentum for more generalisable research results has though, been traced in the literature (Wolfe, 1994; Garcia and Calantone, 2002). Generalisability is one preoccupation of the positivist position and so this might be interpreted as a move toward a positivistic approach to innovation research. However, the case has been made that innovation research, grounded in the perceptions of individuals, is unlikely comfortably to fit in a wholly positivist tradition. It is a seemingly contradictory position: a research framework constructed on the positivist preoccupations of representative samples and generalisability (with concomitant implications for replicability and validity6), but rooted in a (largely) interpretivist tradition and with a conceptualisation of innovation that privileges innovator and user perceptions. A complete swing to positivism would invoke unmanageable tensions in this research: it would suggest a single, uniform, concrete innovation reality that denies the socially constructed meanings assigned by individuals and would be in conflict with the definition of innovation guiding this research. Yet Bhaskar (1978) and others describe (Trigg, 1980) and argue (Margolis, 1986; Blaikie, 1993) that the existence of an independent reality is not necessarily inconsistent with the notion of individual conceptions of it. This, so-called, realist perspective is underpinned by the ontological position that the world and the universe exist without any human awareness of this
6 Issues of reliability and validity are addressed in each of the chapters reporting empirical work.

- 95 -
existence being necessary (Connelly, 2000), but that real phenomena may exist that cannot be measured by our senses. Bhaskar (1978) calls those phenomena which are independent of identification by human enquiry ‘intransitive objects’. Conversely, ‘transitive objects’ are those that are socially constructed and allow us to make sense of the social world. Realism has been depicted as a middle ground between the philosophical polar extremes of positivism and social constructivism in that it rejects subjectivist ontologies by asserting the existence of a single concrete reality and rejects positivism in that, concurrently, reality is a social construction. Bhaskar (1978) resolves this apparent ontological paradox through an explication of the principles that the social and natural sciences hold in common whilst recognising the potential divergence in methods that necessarily results from differences in phenomena of interest. This explication is made manifest in the notion of three overlapping domains of reality: the empirical, the actual and the real (see table 6-2).
Domain of reality Explication Consisting of
Empirical Events which are directly experienced by the observer
Experiences
Actual
Events whose existence is granted regardless of whether or not they are observed
Experiences Events
Real
The processes that generate the events, the underlying generative mechanisms
Experiences Events Mechanisms
Table 6-2: Bhaskar’s overlapping domains of reality (adapted from Bhaskar, 1978; Blaikie, 1993; 60) In the Realist perspective, reality is underpinned by generative mechanisms (labelled the ‘real’), which produce events (the ‘actual’) which may, or may not, be experienced (the ‘empirical’). Further,
“… the first stage in the process of Realist science is to produce critical descriptions of non-random patterns by ‘exploration’- to extend what is known by common observation – and by ‘experiment’ to check critically the authenticity of what is thought to be known. In carrying out exploration, a scientist may have some idea about the direction in which to go but no very clear idea of what to expect. This critical descriptive phase is referred to as empirical studies and is followed by theoretical studies which are concerned with producing a rational explanation of the non-random patterns found in empirical studies” (Blaikie, 1993; 60 original emphases).
Realism shares the same underlying ontology of positivism in that it accepts the notion of reality existing independently of the observer, yet it attempts to transcend

- 96 -
positivism’s thesis that positivistic methods are the only legitimate ways of coming to know something of reality. The methods themselves are not rejected, only the absolutism that comes with positivism (Johnson and Duberley, 2000). The aim of the Realist approach is to ‘dig deeper’ to improve understanding of mechanisms that underlie phenomena through processes of critical exploration. This objective may be realised through the application of a strategy of retroduction, one objective of which
“…is to generate a set of categories based on theory and then refine and adjust them as they are applied to data. This permits the theoretically driven scheme to grow and to adapt in response to the exigencies of the data” (Poole et al., 2000; 143).
The logic of retroduction is one in which new insights relating to the observed phenomenon can be sought through a process of model building and testing, a process of description, explanation and redescription (Blaikie, 1993). In this instance, the retroductive strategy commences with a description of the phenomenon in terms of attributes and moves to a description of innovations in terms of the relation of processes to types of innovations predicated on configurations of attributes. That is, a preliminary descriptive and exploratory stage based on empirical data forms the basis for a scheme that, it is postulated, firstly describes and taxonomises innovations and has the potential to offer new insights into underlying processes. The Realist approach and retroductive strategy are felt to be consistent with the objectives of this research.
6.2.2 Philosophical perspective The basis and overarching aims of this research are: • To develop a conceptualisation of innovation types based on innovators’
perceptions; and, • To explore the utility of such a conceptualisation in the relationship between
emergent types and the processes that underpin them Ultimately, realism aims to explain and predict, however this research holds back from these objectives and is restricted to exploration with a view to informing future explanatory studies. Exploration, then, is the first step in a process leading to explanation and prediction and implies a study in the domain of the empirical in which events and phenomena are investigated based on the recollections of those who have experience of them. So, in Blaikie’s (1993) terms, the realist approach adopted for this research is legitimised by the pragmatic matching of project and philosophy. It is pragmatic, also, in a sense suggested by Johnson and Duberley (2000; 174). It is intended that resultant knowledge should be

- 97 -
“evaluated in the context of how successfully it may guide action towards the realisation of particular objectives which express particular interests: that is in terms of what it does for, and to, various groups of human actors”.
6.3 Research design
6.3.1 Introduction Any research design adopted should reflect, and be appropriate to, the research question being addressed (Yin, 1994). The overarching aim of this research is exploratory and so, an approach suited to exploration is required. Both qualitative and quantitative research methods offer opportunities for exploration. It is difficult to define concisely the terms quantitative and qualitative as each has long traditions associated with them (Schwandt, 1997). The two approaches may be simply differentiated by the former’s emphasis on numeric data and the latter’s on non-numeric data in the form of words. Denzin and Lincoln (1994) develop this and suggest that quantitative studies emphasise the measurement and analysis of causal relationships between variables. On the other hand, qualitative research stresses the socially constructed nature of reality. Qualitative methods may be used to study, in-depth, settings that are inaccessible to other research methods, in areas that are sensitive to enquiry or those where the intention is to reach perceptions that might be expected to be difficult to articulate. Qualitative analysis provides local groundedness, its focus on naturally occurring ordinary events in natural settings generates rich, ‘thick descriptions’. Qualitative studies also emphasise the lived experience and this suits them for exploratory studies that precede the generation of hypotheses. They do, however, tend to be limited in the conclusions and inferences that can be drawn from typically small samples but are, useful for supplementing, validating, explaining or illuminating quantitative data (Miles and Huberman, 1994). Quantitative studies, on the other hand, offer greater opportunity for generalisation as the research tends to involve a larger number of individuals (items, entities, instances of the phenomena and so on), drawn from a wider, or even the whole, population. Quantitative methods can be fast and economical, provide wide coverage of the range of situations, and can be of considerable relevance to policy makers when statistics are aggregated. But they can be inflexible and artificial, and may not be very effective in understanding the processes or the meanings that people attach to events or incidents (Easterby-Smith et al., 1994). Each of the approaches has different strengths and weaknesses. Indeed, almost all methodological tools are in some way flawed. However, a mixed-method approach prevents the research becoming method-bound and allows the strengths and weaknesses of methods to be counterbalanced (Easterby-Smith et al., 1994). This research combines qualitative and quantitative methods. Easterby-Smith et al. (1994) also caution against the combined use of the techniques in that they have the potential to give different results. However, because the qualitative and quantitative approaches

- 98 -
are adopted in separate phases in this study the caveat is not held to apply. The three phases are outlined in table 6-3. Phase I Phase II Phase III Date and duration May-September 2001 May-November
2002 February-April 2003
Data collection method
Inductive content analysis of literature* Semi-structured interviews, repertory grid technique and documentary analysis
Postal questionnaire
Semi-structured interview
Sample 4 case studies of successful innovation in NHS. (23 interviewees)
310 innovations in the NHS
9 interviews with respondents identified from Phase II
Data analysis Content analysis facilitated by NVivo® software and triangulation
Cluster analysis facilitated by SPSS® software
Content analysis and comparative method
*Ongoing from June 2000, rigorous thematic analysis
Table 6-3: Three exploratory phases of empirical research Previous chapters have argued that the state of our knowledge regarding different types of innovation artefact, specified by multiple attributes, is low. Under these circumstances an inductive/retroductive qualitative strategy was adopted for the first empirical phase. The output of the first phase is a multi-item descriptive framework of innovations (see Chapter seven). The framework is subsequently operationalised into a 56-item questionnaire. In the second phase of empirical research the questionnaire is applied to 310 NHS innovations and data subject to quantitative statistical analysis to determine the existence of identifiable clusters of discrete innovation types (see Chapters eight and nine). The final phase of empirical research was an inductive study whereby exemplar cases identified from phase two were qualitatively analysed (see Chapter ten). The following three sub-sections debate the selection of methods for each phase of the research.
6.3.2 Phase I: How do innovators perceive innovations? A satisfactory, justifiable framework of innovation attributes could not be identified from an initial literature review. It was imprudent to operationalise individual attributes that emerged from the review, there were several reasons for this. First, as has been demonstrated, the few multi-dimensional models that exist are strongly grounded in the original work of Rogers (1962) which is later described as empirically indefensible (Rogers and Shoemaker, 1971). Second, there would appear not to be any overall guiding principles to justify the operationalisation of items selected from the list of singular items. Indeed, selected attributes selectively studied is a characteristic of the dis-aggregative tendency in innovation research already noted (Adams and Tranfield, 2002). Finally, Sneath and Sokal (1973) alert against over-reliance on conceptual studies as the basis for empirical classification because of the danger of inordinately favouring conceptual characters. This view is largely in accord with that of McKelvey (1975) whose guidelines for classification (see Chapter four) include the

- 99 -
recommendation to define as inclusive a population of characters as possible. This would imply the usefulness of a round of empirical verification and development. In order to resolve the framework ‘selection’ dilemma, two options were available. The first was to derive one from a synthesis of theoretically derived attributes based on the four key dimensions of innovation (novelty, benefit, application and ideas) in the definition that guides this research. This option was discounted on the basis of McKelvey’s (1975) advice (above) and also on the basis of several informal, unstructured exploratory conversations. These conversations suggested that the list of items generated from the literature may not be complete. That is, practitioners may perceive their innovations in ways that were not reflected in the literature. Consequently, the second option for developing a justifiable framework was to undertake an empirical exploration of the way practitioners thought about their innovations. In a sense such a study would test the exhaustiveness of the theoretically-derived items and, if there were gaps, suggest new areas for conceptual development. Yin (1994) argues for a priori theory development as a starting point in order to frame research. Eisenhardt (1989) advocates adopting a ‘theory-neutral’ state in research where the objective is to find new variables and explanations. Such a posture though, can be difficult to maintain when the research is underpinned by a priori awareness of theory – as was the case in this instance, and, clearly, complete objectivity is impossible. In phase one, therefore, the role of theory was to provide a loose frame for the study in the process of developing the descriptive framework, cycling between theory and empirical data in a process of discovery, refinement, verification, rediscovery and validation. An inductive/retroductive approach utilising mixed methods was felt to be consistent with these objectives. Inductive reasoning entails making general inferences about a phenomenon through the observation of particular instances of the phenomenon (Johnson and Duberley, 2000). The inductive approach allows the researcher to avoid being predisposed to a priori patterning of the data. Rather, the data is left ‘to speak’ to the researcher with patterns emerging (or possibly not), but not being imposed (Miles and Huberman, 1994), see figure 6-1. Four case studies are used as an exploratory device in phase one. Casework has been criticised in past innovation studies for being superficial (in terms of analysis) and founded on convenience sampling (Poole et al., 2000). However, case studies are well suited to the task of unearthing a wealth of detail and richness of story on both process and outcome and, where the purpose is exploratory and descriptive, a case study approach is recommended (Yin, 1994). The core of the case studies was to tap multiple sources of evidence to investigate a contemporary phenomenon consisting of multiple dimensions, in its real-life context informed, but not steered, by a theoretically derived framework.

- 100 -
Figure 6-2: Inductive/retroductive research approach 6.3.2.1 Sample Miles and Huberman (1994) detail a range of purposive sampling techniques for qualitative research. The technique favoured in this research is that which they call extreme or deviant case sampling, the purpose of which is to enable learning from highly unusual manifestations of the phenomenon. It is evident though, that judgements about success are likely to be conditional on who is doing the assessment and when the judgements are made (Pettigrew et al., 2001). Each of the teams sampled in phase one is a winner or runner-up in recent (in the year 2000) independent awards for teamworked innovation and problem solving7. Sample selection based on the assessment of domain relevant experts is well precedented in the research literature (West and Anderson, 1996; Neely and Hii, 1998). Arguably though, each of the applicants for the award considered themselves a success in their own right, it would be the logic behind their application. The advantage of this sample of face valid exemplars is that the selection process has been taken out of the hands of the researcher and the possibility of researcher bias, at least in this domain, is averted. The difficulties of drawing generalisations from single or small numbers of case studies are well documented in the management literature. However, the approach has been argued to provide an appropriate vehicle in support of exploratory and indicative studies (Yin, 1994), particularly in situations where cases can be justified in terms of
7 Awarding bodies were the British Association for Medical Management and the European Forum for Teamwork. The sample consisted of winners of both awards and the two runners-up from the British Association for Medical Management award.
How do innovators perceive their innovations?
Which are the salient attributes to
operationalise?
‘Discover’ attributes not covered in the
literature
Return to the literature for refined keyword searches
Literature provides a range of attributes
Verify & empirically develop theoretically-derived attributes in
exploratory empirical study
Synthesise into comprehensive and
parsimonious framework by comparative method
Semi-structured interviews
Repertory grid technique
Documentary analysis
- 101 -
outlier status as having exemplary or unusual characteristics which might provide insight to both academics and practitioner audiences. However, Pettigrew et al. (2001) highlight a weakness of small sample studies of exemplars. Citing what they call the rise and fall of credibility of Peters and Waterman’s (1982) ‘In Search of Excellence’, they highlight the vulnerability of generalisations based on narrow samples. Consequently, they advise one of two strategies to avoid that weakness: first, carry out large sample studies over time. Second, carry out associated sets of longitudinal comparative case studies of matched pairs with high/low performance, success/failure etc. Neither of these strategies is felt to be appropriate in this instance because the study has been an exercise in exploration and verification. Further, Eisenhardt (1989) commends the selection of extreme cases when the phenomenon of interest is transparently observable and notes that the selection of a sample from a single, consistent context is useful in reducing extraneous variation. 6.3.2.2 Data collection The range of choice of data collection method was delimited both by the historical element of the study and the requirement to elicit perceptions and understandings from informants. The historical element indicated that a longitudinal study was infeasible. Observation and survey were discounted as methods as both are inappropriate for accessing deeper or normally unarticulated understandings. The range of alternative methods from which to choose includes analysis of archival and documentary data and, interviewing. Both methods were used in combination, a technique, strongly recommended by Yin (1994) for case study designs, that permits triangulation of data sources. Interviewing took two forms: semi-structured and the application of repertory grid technique. Interviews range in type from those that are highly formalised and structured to those that are unstructured, free ranging and conversation-like. The latter will tend to be adopted where the primary purpose
“is to understand the meanings interviewees attach to issues and situations in contexts that are not structured in advance by the researcher’s assumptions” (Easterby-Smith et al., 1994; 73).
Consistent, then, with the objectives of phase one of the research, with the objective of probing deeply to uncover new clues, insights and dimensions of the ways in which innovations were perceived a less formal approach to the interview was demanded (Lofland and Lofland, 1995), (see Appendix four for interview protocol). Repertory grid technique, as a device for collecting and analysing open-ended interview data, has been widely used in a variety of fields such as: educational research (Baxter et al., 1998), leadership in palliative care units (Barker, 2000), decision making in health care (Baker, 1996), counselling and psychotherapy (Neimeyer, 1989), systems design and artificial intelligence (Batty and Kamel, 1995; Latta and Swigger, 1992; Gronstedt and Thorson, 1996) and for market research for the identification of product attributes (Goffin, 1994; Marsden and Littler, 2000). It seems however, to be

- 102 -
infrequently used in the management sciences in spite of its value in uncovering the difficult to articulate views of respondents. Repertory grid technique is predicated on Kelly’s (1955) theory of personal constructs which suggests that sense is made of the world through the constant formation and testing of hypotheses about it. It is based on the assumption that individuals act on their perceptions of an objective world filtered through their own construct systems (Reger and Huff, 1993). The repertory grid is a technique for eliciting knowledge about these personal world-views that gets beyond the words (Fransella and Reed, 1998), it confronts the informant directly with the phenomenon of interest and asks them to specify how they construe it (Langan-Fox and Tan, 1997). The power of the repertory grid is in its stimulation of many possible levels of exploration and learning. At its most simple, it is a conversational device that helps respondents access and articulate views on complex topics. In its full application, rich qualitative interview data and matrices of quantitative data are conjointly developed (Goffin, 2002). The former provide detail about the world through the eyes of the informant. The latter permit the application of
“…numbers to the relationships between psychological views, perceptions, feelings and so forth…[to]…yield information about the degree to which some of the personal constructs (views, perceptions) relate closely together and have similar meaning and are, thereby, different from other ways of viewing the same event” (Fransella and Reed, 1998; pages not numbered).
Repertory grid technique was selected as a data gathering and analytic method because of the perceived benefits it brought to investigating and making sense of the complexity inherent in the multi-dimensionality of innovations whilst, at the same time, seeking to avoid the dangers of introducing researcher bias from a pre-existing theoretical framework. The flexible, comprehensive, and highly individualised nature of repertory grid technique makes it possible for the interviewer to enter more readily and rapidly into the informant's frame of reference. Rapidity of access to difficult to articulate conceptualisations of the informants’ world-views is clearly also a benefit in time-limited interviews. Repertory grid technique also offered the potential to triangulate against other data sources. Finally the analysis, using the construing of those who perceive the innovation (as creators and users), provides a useful basis for designing questions for surveys (Hutchinson, 1998). The empirical component of Phase I, analysis of data and development of the framework are more fully explored in Chapter seven.
6.3.3 Phase II: Applying the framework, an exploratory survey Phase two is concerned with the question ‘do attributes cluster into discrete configurations whereby different types of innovation can be identified?’ The question remains exploratory as in Phase I; however, the question takes on a slightly different character and reflects a distinction that Yin (1994) develops. The question in Phase I explores the diversity of ways in which the phenomenon may be perceived. From this, a generalised framework for describing the phenomenon is refined. The question in

- 103 -
phase II is a form of that which Yin (1994; 7) calls ‘prevalence’, and asks about specific instances of that phenomenon to be described within the new framework. The second phase of the research develops and then applies an operationalised version of the framework in the form of a 56-item survey instrument. The development of the survey instrument, item-generation and so forth, is described in Chapter seven. This section focuses, instead, on a justification of a postal survey instrument as the adopted method of administration. In the early stages of research and, where the objective is to become more familiar with a topic, exploratory and descriptive surveys can help to identify concepts that need to be better understood and measured (Malhotra and Grover, 1998). This view accords with that of Yin (1994) who commends a survey approach to the asking of exploratory questions. With the objective of identifying and isolating distinct configurations or types of innovation the framework is subsequently applied in the form of a survey instrument to a second, wider, sample of innovating teams within the NHS. Further, McKelvey’s (1975) guidelines (see Chapter four) advocate that in classification studies as wide a range of entities (instances of the phenomenon of interest) as possible be investigated. Survey research, particularly postal surveys, allow access to the widest potential sample of entities (de Vaus, 1996). Finally, survey questionnaires are commonly used when the items can be clearly defined (de Vaus, 1996) for example departmental customer relationship performance in accordance with pre-specified criteria (Vyakarnam and Adams, 2001). A survey approach is therefore identified as the most appropriate method for the second stage of the research. Kerlinger and Lee (1999) posit two major types of survey research – exploratory and explanatory – this research is clearly identified as exploratory and descriptive in which the resulting data is used to explore the possibility of attributes configuring to generate a taxonomy of innovation. Surveys are distinguished from other methods of social research not so much by a particular technique of data collection but by the structured, systematic data set generated. de Vaus (1996; 3) calls this output a “variable by case data matrix”. Survey research is characterised by its, usually, quantitative method that requires data to be collected by asking questions of people in a standardised or structured format in order to define or describe variables. Further, information is gathered via a sample, a fraction of the population, from which conclusions can sometimes be generalised to the whole population (Malhotra and Grover, 1998). Various survey techniques are available. Widely used are questionnaires, which may be administered by mail, over the telephone or face-to-face in interviews of varying degrees of structure. For the design and administration of a survey de Vaus (1996) draws our attention to five important considerations:
1) response rates; 2) ability to produce representative samples;

- 104 -
3) limitations on questionnaire design; 4) quality of responses, and; 5) implementation problems.
It has been argued that because exploratory surveys are generally used to formulate propositions which can be tested in further research, sample representativeness is less important than in explanatory surveys (Malhotra and Grover, 1998). Similarly, low response rates are not considered to be critical to exploratory research (Oke, 1999). Indeed, the potential for low response rates may be counteracted where the topic under investigation is of particular relevance to the target group and, the response rates for mailed surveys can be as good as for any other technique (de Vaus, 1996). Administrative decisions, for this exploratory research are therefore be justified in terms of items 3, 4 and 5 (above). These are more fully explored in table 6-4. Consideration Face-to-face
interview Telephone interview Mail survey Preferred
technique
Limitations on questionnaire design
Provides greatest flexibility of question design and for dealing with complex research topics. Can last longer than other techniques.
As with face-to-face but less well able to deal with complexity and possibly of shorter duration.
Performs poorly in handling long, complex, and open-ended questions.
1. Face-to-face 2. Telephone 3. Mail survey
Quality of responses
Performs least well in obtaining accurate answers due to dangers of: social desirability bias: influence of observable characteristics of interviewer, and: interviewer contamination.
Better than face-to-face in that there is less opportunity for interviewer contamination.
Best performer in obtaining accurate answers. Remoteness of interviewer avoids undue influence. Allows respondent time and space to answer.
1. Mail survey 2. Telephone 3. Face-to-face
Implementation problems
Difficulties in obtaining suitable staff can lead to implementation problems. Can be costly and slow to mobilise.
Prone to same difficulties as face-to-face, but less markedly so.
Least onerous implementation method in terms of staffing, speed and cost.
1. Mail survey 2. Telephone 3. Face-to-face
Table 6-4: Comparison of approaches to questionnaire administration (after de Vaus, 1996; Oke, 1999) Mail surveys are recognised to perform best in terms of quality of response and overcoming problems in implementation. The performance of mail surveys in handling open-ended and complex questions is not considered to be a problem as the ‘questions’ (or more accurately, statements) developed in Chapter seven, are neither complex nor open-ended. In fact the questionnaire consists of a series of statements with which respondents are requested to indicate the extent to which they agree/disagree. Logistical issues such as the potential for wide geographic dispersion of the sample

- 105 -
and the potentially large number of respondents also commend a mail survey as the most appropriate technique. Having selected a mailed questionnaire as the most appropriate administrative method one other important question needs to considered, specifically ‘To whom will the questionnaire be addressed?’. This necessitates consideration of two things: the sample frame and the qualifications of respondents to answer the questions. As has been established already, the purpose of the research is exploratory and the sample consisted of applicants to competitions or receivers of awards (see table 6-5). There are clearly limitations to this sample and this impacts generalisability. There are dangers of inherent bias in self-selection, questions are begged about innovations from other successful and, indeed, less successful teams who, for a variety of reasons, have chosen not to enter for the awards. In spite of the inherent dangers of skewing, the sample is legitimised by the exploratory nature of the research (Malhotra and Grover, 1998). 2002 2001 2000 Source Mailed Responded Mailed Responded Mailed Responded British Association of Medical Managers (BAMM)
4 3 8 3 27 8
British Journal of Renal Medicine 4 3 - - - -
Hospital Doctor (magazine) 105 79 13 9 - -
Doctor (magazine) 54 33 16 4 - - British Medical Association (BMA) 79 54 - - - -
Total 246 172 37 16 27 8
Table 6-5: Phase II sample There are various approaches to determining informant selection, the most competent person to act as informant who is best placed to pass comment on the innovation. Tornatzky and Klein (1982) suggest that several ratings from several echelons within an organisation should be gathered, with respondent selection perhaps guided by Hage’s (1980) notion of the ‘dominant coalition’. However, there may be disagreement amongst respondents on the rating of attributes, thereby producing unmanageable divergences in responses. The experience of the first phase of empirical research suggested, however, that the team leader was the most knowledgeable with the widest purview of the innovation. Huber and Power (1985) advocate that where only one respondent is selected then that respondent should be the individual most knowledgeable about the subject matter. The key criterion, therefore, for selection of competent witness is significant experience of the innovation. This was generally assumed to be the project leader as specified on application forms. Data collection in Phase II relies, therefore, on the recall, and possibly idiosyncratic view, of single respondents. This individual though, is judged to be best informed of potential candidates and sufficiently near in time (in that all the innovations studied are relatively recent) to the innovations to provide data pertaining to the attributes of their
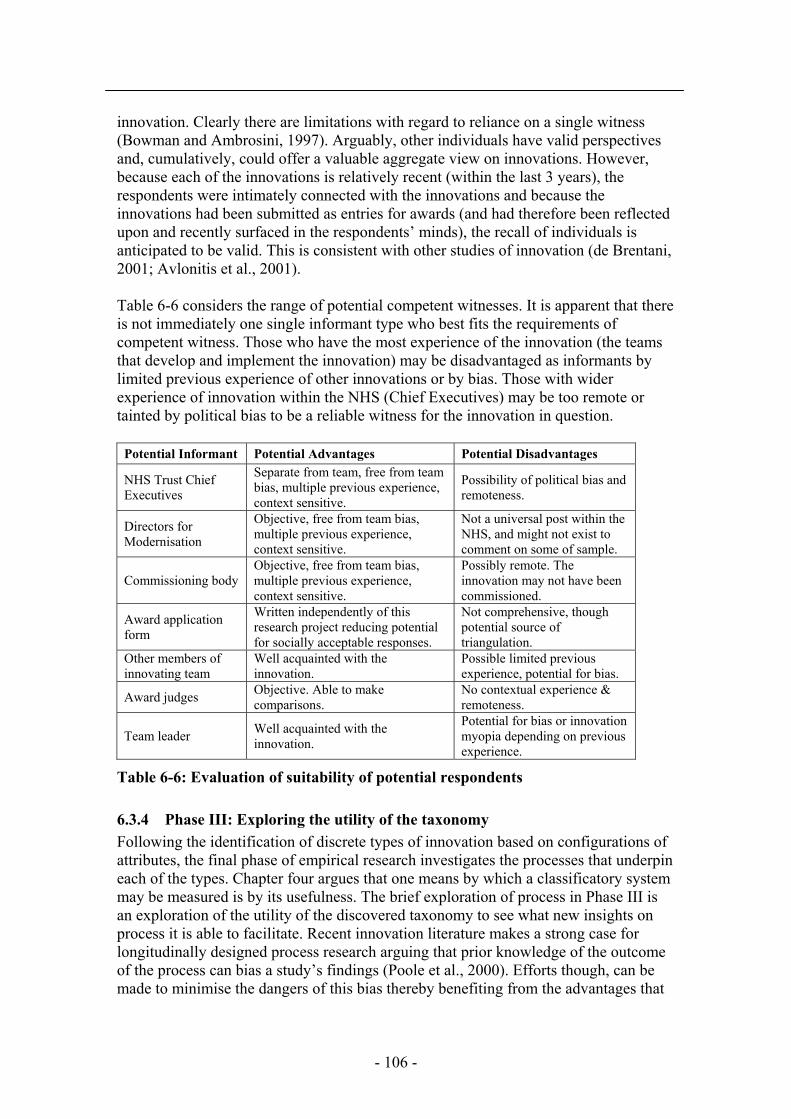
- 106 -
innovation. Clearly there are limitations with regard to reliance on a single witness (Bowman and Ambrosini, 1997). Arguably, other individuals have valid perspectives and, cumulatively, could offer a valuable aggregate view on innovations. However, because each of the innovations is relatively recent (within the last 3 years), the respondents were intimately connected with the innovations and because the innovations had been submitted as entries for awards (and had therefore been reflected upon and recently surfaced in the respondents’ minds), the recall of individuals is anticipated to be valid. This is consistent with other studies of innovation (de Brentani, 2001; Avlonitis et al., 2001). Table 6-6 considers the range of potential competent witnesses. It is apparent that there is not immediately one single informant type who best fits the requirements of competent witness. Those who have the most experience of the innovation (the teams that develop and implement the innovation) may be disadvantaged as informants by limited previous experience of other innovations or by bias. Those with wider experience of innovation within the NHS (Chief Executives) may be too remote or tainted by political bias to be a reliable witness for the innovation in question.
Potential Informant Potential Advantages Potential Disadvantages
NHS Trust Chief Executives
Separate from team, free from team bias, multiple previous experience, context sensitive.
Possibility of political bias and remoteness.
Directors for Modernisation
Objective, free from team bias, multiple previous experience, context sensitive.
Not a universal post within the NHS, and might not exist to comment on some of sample.
Commissioning body Objective, free from team bias, multiple previous experience, context sensitive.
Possibly remote. The innovation may not have been commissioned.
Award application form
Written independently of this research project reducing potential for socially acceptable responses.
Not comprehensive, though potential source of triangulation.
Other members of innovating team
Well acquainted with the innovation.
Possible limited previous experience, potential for bias.
Award judges Objective. Able to make comparisons.
No contextual experience & remoteness.
Team leader Well acquainted with the innovation.
Potential for bias or innovation myopia depending on previous experience.
Table 6-6: Evaluation of suitability of potential respondents
6.3.4 Phase III: Exploring the utility of the taxonomy Following the identification of discrete types of innovation based on configurations of attributes, the final phase of empirical research investigates the processes that underpin each of the types. Chapter four argues that one means by which a classificatory system may be measured is by its usefulness. The brief exploration of process in Phase III is an exploration of the utility of the discovered taxonomy to see what new insights on process it is able to facilitate. Recent innovation literature makes a strong case for longitudinally designed process research arguing that prior knowledge of the outcome of the process can bias a study’s findings (Poole et al., 2000). Efforts though, can be made to minimise the dangers of this bias thereby benefiting from the advantages that

- 107 -
a historical perspective offers, which is to understand patterning and significance of events in the development process, in the context of the ‘big picture’. Contextual issues at this phase are similar to those encountered in Phase I and the focus of the enquiry is on capturing historical data on process. Innovation theory on process tends to focus principally on temporal aspects, but new insights on process have recently emerged from psychology, for example the team climate inventory (Anderson and West, 1996), and from chaos theory (Koput, 1997; Cheng and Van de Ven, 1996), and also the large body of work that looks at group and team processes (Cohen and Bailey, 1997). Chapter ten describes in greater detail the theoretical underpinnings of the research frame for Phase III, however, it remains consistent with the overall philosophical approach to explore process retroductively, cycling between theoretical perspectives and empirical data, on case study basis, using extreme case sampling as the basis for case selection.
6.4 Validity and reliability The multi-method approach adopted for the current research demands special consideration of issues of validity and reliability. Specific issues are dealt with in subsequent chapters as they occur. The objective of this section is to outline some guiding principles. Validation is about limiting the risk that the findings of the research are erroneous (Murphy et al., 1998). Validation, argues de Vaus (1996), is a difficult area, and the method(s) chosen will depend on circumstances and the situation. The nature of this research is to propose a framework for which well-established referents appear not to exist. That is to say, there is no well-established model against which to validate results. In these circumstances de Vaus (1996; 57) recommends that
“ …if all else fails we have to say ‘this is how the concept is defined and these measures, on the face of it, seem to cover the concept’, and to give the measure to other people to see what they think".
What there are though, are competing typologies of innovation which form the basis for theorising about process, organisational performance and so forth. The taxonomy resulting from this study can be mapped against these alternatives in an exploration of similarity and difference. In the context of health service research Murphy et al. (1998) argue that the validity of qualitative research is partly determined by the extent to which users can be confident in the knowledge generated and in which findings are relevant to policy makers and practitioners (qualitiative research has not been widely endorsed or practised in health care research, it is however increasingly utilised as researchers are increasingly concerned with the social processes that operate within health care systems (McNulty and Ferlie, 2002). Various perspectives on reliability exist but tend, principally, to revolve around the issue of whether or not the same results would be reached by different researchers using the same tools and data on different occasions. However reliability, a concern

- 108 -
with the consistency of results obtained in research, arguably a preoccupation of the positivist perspective, is incommensurate with intrepretive approaches. That is not to say the preoccupation is inconsequential, and, interpretivists have developed alternative criteria against which levels of confidence in the dependability or auditability of qualitative research can be assessed (Miles and Huberman, 1994). Thus an alternative schema as represented in table 6-7 guides the validation and reliability in this research.
Concern for Rigour
Internal validity
Do measures measure what they are supposed to measure? Have the correct operational measures been established? Use multiple sources of evidence, have key informants review cases, make explicit theoretical bases, have a clearly specified structure to the collection and analysis of data.
External validity Establishing the domain to which a study’s findings can be generalised, though arguably not applicable in exploratory research.
Reliability or, dependability and auditability
Demonstrate that the operations of a study – such as data collection procedures – can be repeated, with the same results. Use if interview and case study protocols. Ensure consistency and stability of research over time. Congruency of research question and research design. Data collected across appropriate settings, times etc. Make coding checks. Check data for bias, deceit etc.
Table 6-7: Validity and reliability, guiding principles (adapted from Yin, 1994; Miles and Huberman, 1994) Different authorities place different emphasis on the different methods of ensuring validity and reliability. For qualitative research Yin (1994) advocates strongly the use of triangulation and regular reviews by key informants. Conversely, Murphy et al. (1998) discount respondent validation and triangulation as ‘sure-fire’ routes to validation. Instead they emphasise a clear exposition of the processes of data collection and analysis, in which data are related to the circumstances of their production. The risk of error, they continue, will be further reduced where the researcher pays systematic attention to the analysis of negative cases.
6.5 Summary The research design described in this chapter cycles from case-oriented to variable oriented and back to case-oriented. Phase I utilises qualitative and quantitative techniques and multiple methods in order to explore difficult-to-articulate perceptions of a multi-dimensional phenomenon. Phase II is a quantitative process using multivariate statistical techniques to manage and investigate many data sets. The objective of the third phase is to explore the utility of the taxonomy developed in Phase II through its application in the context of process and returns to a qualitative interview-based approach for this brief investigation. The method is applied within the context of a logic described earlier in the chapter as an inductive/retroductive strategy in the Realist convention. Reasoning from the particular to the general and cycling between the empirical and theoretical successively

- 109 -
modifying the framework forms the basis for the investigation into innovation classification in this research. Realism recognises the qualitative differences between the natural and social sciences and, because of this, appropriate methods for data collection and analysis, appropriate to the particular subject matter, must be designed (Blaikie, 1993; 58). The Realist perspective and the research design are argued to be consistent with the pragmatic exploratory approach underpinning the current research. This chapter has described the philosophical position and design proposed for this research. The following chapter describes the first phase of the empirical process, the development of the framework of attributes whose component parts are drawn from an extensive study of the literature and four case studies of successful innovation.

- 110 -

- 111 -
7 PHASE I, DEVELOPING THE SURVEY INSTRUMENT
7.1 Introduction Preceding chapters have located innovation in a social context, where it originates and has impact. They illustrated the importance of classification to current understanding and theory development but highlighted limitations of the three dominant approaches to classification: newness, area of focus and attributes. A case has subsequently been made for the necessity of a comprehensive framework of innovation whose utility would be in facilitating comparative research and a contribution of possible new insights into and understanding innovation. Further, it was suggested that such a framework should be multidimensional and based on innovators’ and users’ perceptions. Several extant frameworks have been identified and these have been discounted from operationalisation in this research for several reasons: • Absence of empirical justification for extant models; • Extant models applied to relatively small samples of innovations of a particular
type. Moore and Benbasat (1991) developed their instrument with regard to a personal (computer) workstation, Meyer et al. (1997) to three preventive health innovations, Wilson et al. (1999) to the adoption of imaging technology innovations, Agarwal and Prasad (1997) to the usage of the Internet amongst a sample of MBA students, and Dearing and Meyer (1994) to nine hazardous waste bioremediation technologies;
• In strategic management studies researchers have found that managers tend to group, and therefore think about, firms differently from researchers (Friar, 1995). It is not unreasonable to expect that a similar condition prevails in innovation research, a view reinforced by the absence of any strong empirical support for frameworks reviewed in previous chapters;
• Personal experience and a series of unstructured interviews in the period preceding the design and commencement of Phase I suggested that innovators thought differently and that the literature review, at that date, had failed to deliver a comprehensive list of perceptions;
• Distance between context of this study (NHS) and context of majority of innovation literature (NPD, research and development, commercial sector, profit-driven).
The key question remains, then: which characters should be selected to comprise the framework in this research? This chapter reports on the process by which characters were selected for and incorporated into the framework that underpins further stages of this research. Empirical investigation (Phase I of this research) using innovators’ experiences and recollections provides triangulation for attributes identified in the literature. In this chapter, a framework consisting of 13 innovator- and user-perceived attributes is described and operationalised into a survey instrument. de Vaus (1996) describes the process of operationalisation as the process of translating abstract concepts into something more concrete and directly observable. Malhotra and Grover (1998)

- 112 -
commend that, where possible, in order to create a cumulative tradition of research, existing and pre-validated scales should be adopted. However, there is a general lack of scale development in the literature (Meyer et al., 1997). Those scales that do exist tend to be study-specific and consequently problematic to apply in new studies. It was necessary, therefore, to develop some new scales for this study, some measures were also drawn from previous research. The basic approach for the operationalisation of constructs outlined by Churchill (1979) was followed (see below).
7.2 Paradigm for framework development The basis for the development of the framework and the survey instrument was Churchill’s (1979) paradigm for developing better measures of constructs (see figure 7-1). This enabled the integration of both theoretical and empirical attributes into a single framework. The process of developing construct measures involves eight steps. This chapter focuses on stages 1, 2, 3 and 4 of Churchill’s paradigm. Stage 1, ‘specification of the domain’ has been achieved by the identification of four categories from West and Farr (1990), an indicator level classification (Bailey, 1994): newness, ideation, application and benefit. Subsequently, these are further populated by constructs derived from the literature and empirical work. The domain of the study is circumscribed by the four categories derived from West and Farr (1990) and defined in table 7-1. Following the broad specification the next stage necessitated populating each of the categories with attributes of innovations drawn from an ongoing review of the literature and an empirical study. Element Recognised as
Newness The extent of the difference from previous state and repercussions of that difference.
Ideation
The information, idea and knowledge origins of the innovation. From where do they originate?
Application The innovation in action, what is it like to live with?
Benefit
Planned and unplanned consequences, including degree to which original objectives have been met.
Table 7-1: Component parts of innovation (after West and Farr, 1990) As the circulating arrows in figure 7-1, depict the process was not linear, the literature was not ‘left behind’ but continued to play a significant informative role. As the empirical investigation progressed attributes identified in the literature form the starting point for empirical investigation of innovators’ perceptions. Similarly, ‘discoveries’ in the empirical field spark further rounds of investigation of the literature. Attributes derived from these conjoint studies are the raw material for the development of the framework.

- 113 -
Figure 7-1: Paradigm for the better measurement of constructs (adapted from Churchill, 1979)
7.2.1 Domain specification The data from the empirical study are described in greater detail below. Criteria were drawn up to determine inclusion of attributes in the framework. In order to merit inclusion attributes had to be: • Consistent with one of the four categories derived from West and Farr (1990). This
is consistent with Downs and Mohr (1976; 702) who argue that any “typology dividing innovation into groups or categories must itself be based on a characteristic or attribute of the innovation”.
• Evident in both the literature and each of the four cases of the empirical study. • Capable of independent measurement (not synonymous with other items). • Made reference to by the majority of informants in each team. Attributes that did not meet these criteria were excluded. Ultimately, a framework consisting of 13 sub-categories was drawn up, this is summarised below in table 7-2.
1. Specify domain of construct
2. Generate sample of items
6. Assess reliability
4. Purify measure
5. Collect data
8. Develop norms
3. Collect data
7. Assess validity
Literature search – limitations of existing classification systems
Experience survey – why, what, how, where Insight stimulating examples Refined literature review Synthesis and integration of attributes
Peer and respondent feedback Pre-validated measures, face valid measures, criterion and content validity Peer and respondent validation Likert scaling Statistical summary of configurations
This chapter
Subsequent chapters

- 114 -
First-order Categories Sub-category Definition Indicative previous research
Novelty The extent of change represented by the innovation compared to what preceded it.
Continuous improvement (Bessant and Caffyn, 1997), evolutionary & revolutionary (Rabson and DeMarco, 1999), incremental & radical (King, 1992; Damanpour, 1988; Damanpour, 1991; Zaltman et al., 1973; Schroeder et al., 1989; Nahapiet and Ghoshal, 1998), magnitude (West, 1990)
Departure The extent of change to existing practice, routines, behaviour.
Pervasiveness (Tornatzky and Klein, 1982; Zaltman et al., 1973; Beyer and Trice, 1978)
Disruption The extent to which the departure from prevailing practice occurred in a disruptive manner.
Capacity and unknown potential to affect everyone and everything (Danneels and Kleinschmidt, 2001), impacting in a disruptive manner (Rabson & DeMarco, 1999)
Newness
Risk
The extent to which the innovation is inherently risky or threatens individuals, the institution or user base
Risk (Meyer and Goes, 1988; Heany, 1983; Mohr, 1969), social cost (Zaltman et al., 1973)
Ideation Ideation
Innovation is the consequence of combinations of existing and new knowledge. 3 levels of ideation: ‘originated’ (wholly original); ‘borrowed’ (copied, with no modification); ‘adapted’ (modified to fit the local context).
Originality (Pelz, 1983; Amabile et al., 1996), origination (Pitt and Clarke, 1999; Nonaka and Takeuchi, 1995; Utterback and Abernathy, 1975; Leonard and Sensiper, 1998; Boisot et al., 1996)
Uncertainty Knowledge concerning the link between innovation inputs, processes, and outcomes.
Communicability (Tornatzky and Klein, 1982; Zaltman et al., 1973), uncertainty (Wolfe, 1994; Tatikonda and Rosenthal, 2000; Shane, 1995)
Scope
The extent to which the innovation stands-alone (within the context of its application), or requires changes elsewhere (outside the group).
Architectural, modular (Henderson and Clark, 1990), autonomous (Chesborough and Teece, 1996; Goodman, 1981), centrality (Wolfe, 1994), individual, synergistic (Goodman, 1981)
Complexity
The extent to which the innovation, regardless of scope, by dint of its connections (inherent or in terms of other social units) to other parts, renders it difficult to understand and use.
Complexity (Pelz, 1983; Pelz, 1985; Tornatzky and Klein, 1982; Rogers, 1983; Zaltman et al., 1973; Tatikonda and Rosenthal, 2000), divisibility (Wolfe, 1994), instrumental, ultimate (Zaltman et al., 1973)
Application
Adaptability
The extent to which the innovation can be refined, elaborated and modified according to the needs and objectives of the group.
Compatibility (Tornatzky and Klein, 1982; Rogers, 1983; Zaltman et al., 1973)
Relative Advantage
The extent to which an innovation is perceived as being better than the condition it supersedes.
Effectiveness (West, 1990; West and Farr, 1990; West and Anderson, 1992; Anderson and West, 1996; Anderson and West, 1998; Meyer et al., 1997), market merit, operational merit (White and Graham, 1978), relative advantage (Rogers, 1962; Rogers and Shoemaker, 1971; Rogers, 1983; Tornatzky and Klein, 1982; Dearing and Meyer, 1994; Meyer et al., 1997)
Benefit
Actual operation
The extent to which the innovation is perceived to have satisfied original objectives set for it.
Actual operation (Pelz, 1983), execution-oriented outcome (Tatikonda and Rosenthal, 2000)

- 115 -
Observability The extent to which the innovation is observable by others.
Observability (Tornatzky and Klein, 1982; Rogers, 1983; Zaltman et al. 1973), visibility (Tornatzky and Klein, 1982; Moore and Benbasat, 1991; Agarwal and Prasad, 1997)
Profile The extent to which the innovation raises personal, group or institutional profile.
Slack (Mohr, 1969), social approval (Tornatzky and Klein, 1982)
Table 7-2: Framework definitions and antecedent literature
7.2.2 Item generation Following the specification of the framework with 13 attributes, the objective was to create pools of items from previous studies as measures for each of the attributes within the framework, or identify gaps where previous studies had failed to operationalise measures. Measurement of innovation is a complex issue and various approaches are evident in the literature. In success studies of innovation the metrics frequently used to determine success (construed in terms of organisational or innovation performance) are financial and economic. Cooper (1998), for example, measures performance across 10 criteria which factor analysis then reduces to two substantial underlying performance dimensions: profitability and impact on the business. However, not all innovations are easily assessed in economic terms nor, indeed are economic and financial metrics always particularly meaningful. Financial and market performance measures could suggest a preoccupation with efficiencies in the processes of innovation or with economic indicators and pay less attention to what it actually is that the processes of innovation produce. Dubiety also exists about the extent to which the relationship between organisational performance and an individual innovation can be determined. Where the innovation is of a social nature economic metrics might be inadequate to describe them and their benefit be better expressed in non-economic terms (Rogers and Shoemaker, 1971). Qualitative and semi-quantitative measures are also useful because, as Rothwell (1992) points out, it seems that it is the intangibles that are more significant in innovation than the tangibles, that is, it is the strategic, behavioural and cultural features that are less easily amenable to managerial control. There are fewer measures of intangibles, which are, arguably, the more significant features of innovation. This might reasonably be assumed to be the case in health care innovation. Results from Phase I of this research appear to endorse that assumption that a broad conceptualisation of benefit beyond financial or performance metrics is required. The view is consistent with that of Warner (1974) who argues for a consideration of value or worth. Werner and Souder (1997) have classically described methodological approaches to measurement of innovation in terms of the orthogonalisation of qualitative/quantitative techniques and subjective/objective perspectives – the latter in the sense of relationship to the organisation, i.e. non-organisational members (for example independent judges) could provide objective measures. The orthogonalisation leads to the description of three methodological approaches: quantitative-objective metrics; quantitative-

- 116 -
subjective metrics; and, qualitative metrics (clearly a category ‘qualitative-objective’ is ontologically unsustainable). Measures of attributes predominantly fall into the quantitative-subjective category. Quantitative-subjective metrics, or semi-quantitative metrics as Pappas and Remer (1985) call them, are based on subjective judgements then converted into numbers. Reliability is promoted by the collection of multiple opinions that are then aggregated. The merit of this approach is, for this study, that the semi-quantitative metrics provide a rich in-depth perspective on the phenomenon of interest and interrogation methods can encourage informants to reflect deeply. Several items were discarded due to context specificity or double-barrelling (e.g. “To what extent is the innovation intellectually sophisticated or difficult to implement?” (Gopalakrishnan and Bierly, 2001; 128)). After developing new items, the instrument finally comprised of 64 items.
7.2.3 Purification of measures The method of purification of measures was to determine the face validity of the instrument by testing amongst panels of judges and to test for internal consistency by statistical procedures. The former objective was achieved but, for reasons that are elaborated below, not the latter. The purification of measures through pre-testing is a key element of the survey design process in which potential problems with data collection, inconsistencies in respondent interpretations of questions and/or statements and the mechanics of analysis can be identified and rectified. Pre-testing, therefore, offers the opportunity to refine questions and to check the reliability and validity of the instrument. Various authors offer different strategies for pre-testing. de Vaus (1996), for example, suggests a strategy might consist of ‘declared’ or ‘participating’ pre-testing and/or ‘undeclared’ pre-testing. The former is a strategy that makes explicit the expectation of feedback from panels of experts, colleagues and/or proxy-respondents in terms of their experiences of completing the questionnaire, meaning and interpretation of items, flow, redundancy and timing. The latter, in order to simulate actual conditions of administration, requires that respondents are not told that the instrument is still under development. Undeclared testing requires access to a naïve sub-group of the sample – naïve in the sense that they are unaware of the test in process. Three rounds of instrument pre-testing were designed. In the event two took place, between April and June 2002. A round of declared domain expert pre-testing was followed by one of declared proxy-respondent pre-testing. The expert category consisted of scholars from the Centre for Research in Innovation Management at the University of Brighton, the Innovation Management Project at the University of Bradford and Cranfield School of Management (n=7). Individuals were expert in innovation and/or the process and management of surveys. Revisions following consultations with the experts reduced the number of items from 64 to 56, and refinements were made to individual items to address issues of variation, meaning and redundancy that had been highlighted.

- 117 -
The revised version of the questionnaire was subsequently sent to known health care professionals, clinicians and managers, (n=13). 12 returns were received from these proxy respondents. Where appropriate, telephone conversations took place to clarify certain issues. The response, on the whole, from health care professionals was that presentation and flow were clear, though small amendments were suggested. There was a commonly held view amongst proxy respondents that a thinly veiled tension exists between clinicians and ‘management-speak’. By way of coincidental independent corroboration, the title of the 2001 Rock Carling Lecture8 was “Fads in medical care policy and politics: the rhetoric and reality of managerialism” (Marmor, 2001). It argued that clinicians are sceptical of managerial interventions, that managerial jargon threatens the clear thought and reasoned argument of clinical approaches. From the point of view of this study then, it was necessary to carefully target sympathetic respondents in non-jargonistic language. Failure so to do would have led to low response rates. Whilst every attempt was made to ensure a large response rate, it could not be guaranteed. The two rounds of pre-testing appeared to establish acceptable levels of validity of constructs and items. A third round of validity testing by statistical method had been planned. Churchill (1979) advocates a measure of internal consistency through the application of alpha coefficient and factor analysis. However, it was felt unwise to cull a sub-sample from the 310 potential respondents in order to run a round of undeclared testing. Drawing off a proportion of these for undeclared pilot-testing would jeopardise opportunities of maximising response rates from a relatively small population. A statistical test of internal consistency was, however, applied following the completion of the main survey (Phase II of this research). Cronbach’s alpha is a measure of internal consistency based on the correlations between the variables concerned, and is particularly important in determining whether or not multiple sub-dimensions cohere to form a single dimension (Peter, 1979). That is, do the items operationalised to measure ‘novelty’, for example, correlate more highly with each other than they do any other attribute. If they do, then we can reasonably assume that they form a discrete factor. As has been described, statistical tests of reliability where not run prior to the application of the instrument in the main survey for reasons of protecting a limited sample. Cronbach’s alpha was, however, run on the returns from the main survey (See table 7-3). There is some discrepancy in the literature as to what value of Cronbach α indicates internal consistency. A reasonably widely accepted limit appears to be 0.7 and above, set by Nunnally (1967), though Inandi et al. (2002) suggest that a level of 0.6 is satisfactory. Meyer et al. (1997) describe values of below 0.45 as problematic. According to these criteria two of the items in the framework may be described as problematic (relative advantage and uncertainty) and four sub-categories in the grey area between 0.45 and 0.6 (novelty, ideation, adaptability and observability). This suggests moderate levels of internal consistency for the measures, which is tolerable 8 The Rock Carling Fellowship is awarded by the Nuffield Trust to a distinguished individual who is invited to review the current state of knowledge in a field of UK health care (see http://www.nuffieldtrust.org.uk).

- 118 -
for exploratory research, but that they would benefit from further development and refinement in future research. Further, the analysis would appear partially to endorse Agarwal and Prasad’s observation that scales comprising only two items tend to be unreliable. Four factors are measured by two items (adaptability, relative advantage, actual operation and observability) three of which achieve low alpha values. However, an alpha value of 0.791 was achieved for the actual operation scale.
Construct
Items
Alpha coefficient
Novelty 5 .579 Departure 7 .671 Disruption 6 .920 Risk 5 .823 Ideation 5 .458 Adaptability 2 .471 Uncertainty 5 .446 Scope 4 .699 Complexity 7 .736 Actual operation 2 .791 Relative advantage 2 .366 Profile 4 .642 Observability 2 .508
Table 7-3: Alpha coefficients of framework scales In summary, conscious efforts have been made, in line with recommendations by Yin (1994) and Miles and Huberman (1994), to ensure that construct validity and the dependability of the study are maintained. The diversity of sources and data gathering methods overcome threats of common method and same source bias. Data and method diversity are employed in a strategy of triangulation to ensure construct validity. The final version of the questionnaire is presented in Appendix five with a sample cover letter and completion instructions. Individual items are also presented in the second section of this chapter. In order to avoid the use of potentially confusing statements some statements are reverse coded, in the tables that follow in this chapter these are marked with an asterisk (*).
7.3 Case histories
7.3.1 Introduction The sample for Phase I consisted of four successful innovating teams in the NHS. This is purposive sampling in order to permit insightful examples from empirical data to provide a level of purification and finer-grained insight than reliance on a literature review alone could achieve (Churchill, 1979). Access to award winners and runners-up was facilitated through the British Association of Medical Managers (BAMM) and, the European Forum for Teamwork (EFT). Choice of informant was restricted to those who had played a significant role in the determination of each of the innovations. BAMM or EFT facilitated contact with key individuals. The key contact subsequently recommended other individuals from the team for inclusion in the research, a technique commonly known as snowballing

- 119 -
(Miles and Huberman, 1994). This research takes the position that it is unlikely that every actor will have made a significant contribution to the development of the innovation nor, will use it or will have been impacted by it to any great extent. Some individuals, that is, will have been involved in more significant ways than others. These significant individuals, it was assumed, would be identified by informants during the data collection process and that the researcher, would be guided to these significant individuals during the data collection process until such point that there was no one left to interview. Interviewing would stop when there were no remaining players to see or where a point of data saturation (i.e. no new insights being generated) reached. Documentary data also provided names of key individuals and validated the recommendations of the initial key contact. Innovation case histories were written for each team on a specially designed pro forma summarising the main events and outcomes (see Appendix six). Data were noted onto the pro forma as they became available through any of the capture techniques described below. The case histories developed over time as new data were added, new insights gained and conundrums resolved. The activity of producing innovation case histories was an important part of the sense-making process. It served as a means data reduction, which Miles and Huberman (1994) describe as being part of the analysis not separate from it, and, through which, an almost overwhelming amount of data could be kept in check. Each of these teams (Team A, Team B, Team C and Team D) comprised to a greater or lesser extent a group of ‘unsocialised’ (Jones and Jordan, 1998) individuals drawn vertically from the hierarchies and horizontally from across institutional and role boundaries of the NHS. The teams bear some similarities to Goodman and Wilson’s (2000) exocentric teams in that they were time-limited and task-focused. The singular product of the activity of each of the teams was the resolution of the issue that caused the team to assemble in the first instance. Teams’ case histories are briefly profiled below. Teams were interviewed and data gathered over a five month period between May and September 2001.
7.3.2 Team A Team A was responsible for the redesign and re-launch of palliative care in one English county. Palliative care is the active total care of patients whose disease is not responsive to curative treatment. Control of pain, of other symptoms and of psychological, social and spiritual problems is paramount. The goal of palliative care is achievement of the best quality of life for patients and their families. Two national events played a significant part in creating a climate in which palliative care services were encouraged to change. First, an Executive Letter from 1996 calling for, amongst other things, specialist palliative teams to be designed to work across organisational, departmental and specialist boundaries in order to achieve the best results for patients. Second, the Calman-Hine Report sought to establish, for England and Wales, the policy framework for commissioning cancer services. Specifically addressing palliative care, the report stated that care

- 120 -
“teams …should integrate in a seamless way with all cancer treatment services…work in close collaboration with their colleagues…be involved in regional audit and developing integrated operational policies and protocols…[and that] there should be a smooth progression of care between home, hospital and hospice” (Calman and Hine, 1995; 18).
At a local level, the results of an audit of provision provided further impetus. Palliative care has only been recognised as a speciality in the last 40 years or so. For some practitioners palliative care, as a speciality, is a difficult concept to grasp, after all, they reason, it is already practised within existing disciplines. Conversely, the patient, relatives and wider society tend to be very supportive of the concept. So, palliative care occupies a perhaps unique position within the context of the NHS. It has been relatively poorly understood within the NHS, but widely supported by the layman who tends to regard practitioners as ‘saintly’ and supports the delivery of care through considerable charitable and voluntary activity. The consequence has been that palliative care has developed in a fragmented fashion in the UK. For example, independent hospices tend not to be located at points of greatest need but at the seat of fund-raising efforts, that is, where people have cared enough to make an effort. Palliative care in the case under study has been characterised by the range and depth of service. Care is provided by a range of personnel, from generalist staff to specialist care, by expert multi-disciplinary teams, and is delivered in a range of contexts from the patient’s home to NHS hospitals, to independent hospices. The service has a wide remit and does not discriminate on the basis of age, sex, condition or institution. Three key groups dominate palliative care in this English county: Specialist NHS palliative care teams; Independent Hospices; Charities and Voluntary Groups. By the early to mid 1990s it was apparent that palliative care in the county was not working as well as it might. Over a period of years delivery of palliative care and relationships between the providers had stagnated, or so some felt, and it became increasingly apparent that something needed to be done. The convergence of separate national, regional, county and local level agendas stimulated the commencement of a process to create a cohesive, integrated service to which there was equity of access for all the county’s population. A core team of three, senior clinical and management personnel, was responsible for the development and implementation of the Integrated Service Directorate but, on its own, this team was not sufficient to ensure it saw the light of day. Rather like a planet’s gravity attracts satellites, so too the concept and implementation of the Integrated Service Directorate drew other players into the team’s orbit. So, with a stable core the team was dynamic, multi-disciplinary, cross-institutional (vertically and horizontally) and had a county wide remit. Over a period of approximately two and a half years, culminating in a launch ceremony in April 2000, the concept of palliative care in the county was reconfigured as the Integrated Service Directorate for Palliative Care. The Integrated Service Directorate for Palliative Care has achieved Beacon Status within the NHS and was runner-up in the British Association of Medical Managers team of the year awards in

- 121 -
2000. The case has been published in the journal Clinician in Management (Adams et al., 2003).
7.3.3 Team B At the time of the research, this NHS Trust Hospital oversaw a 420 bed general and acute unit, with approximately 1,500 staff, a budget of nearly £50 million, completed approximately 15,000 surgical procedures annually and had140,000 outpatient attendances a year. Over a period of years the hospital faced increasing numbers of emergencies, increasing demand for elective surgery and pressure to reduce costs. Problems were identified in the existing system which included: too many visits for patients and an inequitable system for booking operations, which was costly and not consumer-oriented. A massive hospital rebuilding programme provided the context in which a radical review of healthcare was undertaken. An emergent multi-disciplinary, multi-level modernisation team addressed these problems. A clear focus on the ‘patient-journey’, underpinned by a commonly shared set of guiding principles and an information management and technology strategy, putting data capture at the heart of the clinical process, sustained the vision that inspired three innovative projects. At the core of these was a research and development project to re-design the patient journey, from GP referral to operation to discharge with supporting client/server ITC systems. The team developed a modified form of Business Process Re-engineering as the technique for exploring new dimensions of hospital service which gave them the opportunity to ask the question, “if we were designing the hospital from scratch, how would it look?” The answer was, “not the way it looks at the moment” and the team developed a strong idea that it would be impossible to create and sustain service excellence in the context of the NHS without fundamental redesign of operational processes. The first project ran from September 1995 to September 1997. At its conclusion (determined by a European Commission funding stream) the technology had not been delivered (though it did arrive at a later date and formed the technological basis of subsequent innovations), and so in those terms the project arguably failed. However, the project was widely hailed as a success, not least because of a series of unanticipated spin-off benefits. As the team leader remarked:
“…but now we have an organisation that is willing to make change” [B1]9 The team was winner of the British Association of Medical Managers Team of the year award in 2000. The innovations proved significant in that they enabled first the modernisation team and subsequently the wider hospital community to conceive that fundamental redesign was a possibility within a large NHS Trust.
9 In order to maintain confidentiality and individual anonymity informants are referred to in the text by team affiliation (A,B,C or D) and an identity number.

- 122 -
7.3.4 Team C Team C formed to address concerns regarding the nutritional intake of inpatients at an NHS Trust hospital. The hospital has some 550 beds and over 2,000 staff providing acute and rehabilitation services and serves over 1,800 meals a day. The concurrence of national and local drivers provide the context for the innovation. In the mid-to-late 1990s the national press reported stories of patients starving to death in the NHS, whilst Trust hospital audits strongly suggested that patients were not having their nutritional requirements met and that provision was fragmented and insufficient. Prior to the establishment of a team to address these issues, it was recognised in some quarters that the possibility of malnutrition had been an issue at this hospital for several years. In the absence of an interested and supportive senior medical practitioner, however, the initial, ad hoc nutritional team lacked the gravitas or authority to persuade board-level management of the criticality of their concern. The team consisted of a core membership of medical/nutrition, dietetic and catering specialists but drew, also, on the knowledge and skills of a range of external experts in various medical, catering and nutritional specialisms. A wide-ranging consultation exercise and a series of audits of the problem preceded the development of a project plan and a bid for funding support. The consequent ‘Eating Matters Project’ made a significant improvement in nutrition awareness and screening in the Trust. One unexpected, but welcome, outcome was the restoration of relations between catering department and the wards. Historically perceived as providers of ‘hotel-type’ services catering had become dislocated from the caring-type roles, the renewed focus on patient-benefit was instrumental in enabling catering to be reconceived by users and managers as part of the care infrastructure. Team C won the team of the year award from the European Foundation for Teamwork
7.3.5 Team D Team D, whose membership is dynamic, is a small multidisciplinary service delivery unit and orbits around a dynamic and inspirational senior anaesthetist. Team membership tends to be drawn from departments of anaesthesia, operating theatres and day case units. Team D is active in an acute hospital that operates somewhat in the shadow of a proximal major teaching hospital of international reputation, with which it recently became integrated. The hospital has been responsible for some significant patient-focused innovations. Examples include an early example of nurse-led pre-assessment, which involves taking patient histories, social as well as medical, in order to assess implications of their treatment beyond their time at the hospital and, organising investigations such as blood tests and x-rays. The consequence is that patients are seen quicker, they are better educated about their contact with the hospital (easing levels of distress), patient-flow is improved and a substantial reduction in cancellations on the day of operation have been achieved. The team was successful in winning funding to help in the establishment of an acute pain service. The acute pain service was a significant departure from conventional pain management techniques in which patient controlled analgesia is facilitated in all post-operative patients by daily pain rounds of surgical wards. The team also developed a novel technique for patient control epidurals. For the pain service work the team has received commendation from the Audit Commission and, is actively diffusing their experience to the proximal teaching hospital.

- 123 -
7.4 Data collection and analysis
7.4.1 Collection and analysis of interview data In order for a question/answer session to make sense, it seems reasonable to ensure that informants understand the question (Foddy, 1993). An interview protocol, that attempted to promote a uniformity of understanding amongst informants was, therefore, established. Each informant received prior notice of the substantive interest of the research in the form of background documentation (see Appendix four). Interviews lasted between 40 minutes and 3 hours and each was opened with a sequence of introduction, explanation and assurances as recommended by (Lofland and Lofland, 1995). Interviews were semi-structured around issues of innovation processes and attributes but allowed for other lines of inquiry to be pursued as dictated by exigencies of the circumstances. The protocol remained consistent within and across cases. Interviews were transcribed and then coded, the process being facilitated by the use of NVivo® software. Data were analysed using the well-documented method of data categorisation, sub-categorisation and constant comparison (Glaser and Strauss, 1980; Miles and Huberman, 1994). Coding was accompanied by extensive annotation describing why an item had been coded in each particular way. This transparency was particularly useful later in synthesising findings across the various interview transcripts. Achieving synthesis from the diverse datasets represented by the empirical data from the interviews in the name of objectivity and representativeness posed a challenge. It is always problematic to generalise findings from a series of interview data which are unique. Systematically coding interview responses enabled a clear audit trail for findings and conclusions drawn from the data. Coded items were assigned to a pre-existing category (or ‘node’ in NVivo®) from Rogers’ (1983) framework. Alternatively, a new category or sub-category was developed. As new items were categorised, category labels and definitions were re-evaluated in a process that gradually focussed the coding and winnowed out unproductive categories as others assumed the status of overarching ideas or propositions. The process resulted in the development of a thirteen-item framework of innovation attributes, incorporating and supplementing Rogers’ work. In addition to tape recording the interviews, notes were taken and interview reflections captured on a pro forma at the earliest opportunity following the conclusion of the interview. The aim was to record not only what was said but also contextualise the interview in terms of demeanour of the informant and responsiveness. Further, the significant issues, those that had been overlooked or that warranted further exploration and so forth were highlighted. A recording malfunction resulting in two inaudible cassettes confirmed the value of this. Both tapes were subjected to forensic audio techniques and were partially recovered which, when combined with the notes and reflections, covered the gaps and averted a potentially problematic situation. Subsequently interviews were transcribed for content analysis with the aid of NVivo® software.

- 124 -
7.4.2 Collection and analysis of repertory grid data The repertory grid constitutes a mechanism for both the elicitation and the representation of cognitive models, emphasising the idiographic characteristics of personal construct systems (See Chapter six). It is necessary to make two points here. First, repertory grid technique was adopted as an elicitation mechanism not particularly for the facility of cognitive representation. Second, the technique has a weakness in dealing with groups, it does not provide a direct method for eliciting team mental models (Lambe and Spekman, 1997), as different people construe the same things in different ways. From the point of view of developing a framework capable of describing innovations, the idiosyncrasy of perspective is advantageous as it provides volume and the technique captures the diversity of views. The question, therefore, that needs to be addressed is how to synthesise this diversity into a valid, parsimonious framework. In other words, rather than trying to establish some sort of commonality of construing within the project teams, the objective was to continue to develop and modify the emergent framework in such a way that the framework could capture, concisely, that diversity of view. The execution of the technique requires some elaboration. The following description is adapted from Goffin (2002). The technique takes the form of a conversation that is structured by conceptualisations of the subject under discussion. In the case of this research the subject, for each team, was innovation. In order to uncover the ways in which informants think about the phenomenon of interest they are forced to compare and contrast different manifestations of the phenomenon and describe the ways in which they are similar and different. The repertory grid technique terms these manifestations of phenomena ‘elements’. The elements in this research were innovations with which team members were familiar. The name of each element is written on separate, numbered cards, each card having been pre-numbered in a random sequence. Once all elements have been annotated onto separate cards the informant is presented with a set of three cards, which, in the terminology of repertory grid technique, is called a ‘triad’. The informant is then asked, ‘In what way are two of these innovations similar to each other and different from the third?’ A typical response – termed a ‘construct’ – could be that two innovations are simple and the third complex. The construct forms a bi-polar scale (in this example ‘simple…complex’) and informants are asked to rate each element on a five-point scale against this construct and pole. These ratings are recorded on a pro forma (see figure 7-2). Often, the reflection that is the consequence of comparing and contrasting elements in this way, causes informants to ‘think aloud’ and explore the different dimensions of innovations. This articulated reflection is a valuable source of qualitative data. Under time-limited conditions repertory grid technique proved a useful elicitation device and conversations invariably sparked from the comparing and contrasting elements. Further triads, in which at least two elements must be different from those contained in the previous triad, are then presented to the informant and the process repeated. Informants are not permitted to repeat constructs and so, each presentation of a triad results in the elicitation of a new construct and pole and, fresh, insightful reflections. The process continues until a stopping point is reached, this is usually when the

- 125 -
informant struggles to find any meaningful ways in which to discriminate between elements. Frequently, this point is reached at between seven and 12 constructs. Figure 7-2 usefully illustrates the technique in action. Nine elements (innovations with which team members were familiar) were identified from secondary data and confirmed in conversations with team members. In the first triad, informant C2 was asked to consider elements 1, 2 and 3 and describe how two were similar to each other and different from the third. The construct that was chosen to discriminate between elements was ‘simple’ and as its pole, ‘complex’. Subsequently each element was rated on the 1-5 scale. The next triad consisted of elements 4, 5 and 6 and elicited the construct and pole ‘people’ and ‘project’. The process continued, with informant C2, until seven constructs had been elicited, after which no new meaningful constructs could be identified. Tape ref: C2 Elements by card number Date: 18 05 01
Construct (1) 1 2 3 4 5 6 7 8 9 Pole (5) triad
Simple 3 5 3 2 4 5 2 3 4 Complex 123
People 3 4 3 1 2 5 2 2 1 Project 456
Beliefs 3 4 4 4 2 3 4 2 1 Action 789
Staff's expressed wishes 1 2 2 1 5 3 1 4 3 Nutrition team's wants 245
Low combinatorial newness 2 3 4 1 2 5 1 2 2 High combinatorial newness 369
Focused 5 5 4 1 4 5 3 5 5 Trust-wide 234
Small numbers of staff required 3 2 4 2 5 5 2 5 5 Large numbers
required 157
Figure 7-2: Repertory grid, informant C2 Elicitation of the construct led to a debate regarding the nature of this newness and its relation to the Eating Matters Project, for example:
“…you could say none of these ideas are new, they are a rehash of what has gone before, so we have made something new come out of the whole” [C2].
Repertory grid technique was applied to each of the teams as an elicitation technique apart from to team A. Team A was excluded from the process because it proved impossible to identify a set of elements that could be commonly recognised by all informants.
7.4.3 Collection and analysis of documentary data Documentary texts, for qualitative research, are important “because…in general, access can be easy and low cost, because the information provided may differ from and may not be available in spoken form, and because texts endure and thus give historical insight” (Hodder, 1994; 393). The use of documents is also an important method of triangulation (Easterby-Smith et al., 1994).

- 126 -
Documentary and archival data were available in several forms across each of the teams. Teams A and D were able to provide supporting documentation from archived files – relating more to process than to outcome. Extensive documentary data existed for team B: detailed records had been maintained as part of the EU audit process. Team B had also written up some of their experience in the form of journal articles. EFT competition rules stipulated maintenance of a detailed log of team activities for all applicants, access was granted to that for Team C, who also had achieved some press coverage. Documentation proved to be an important source of insight into both the processes and the outcomes of the innovating, they provided a means of triangulation and verification for the spoken ‘recalled’ evidence.
7.4.4 Data coding In constructing the framework, transcript management and coding was facilitated by the use of NVivo® software. Codes are “tags or labels for assigning units of meaning to the descriptive or inferential information compiled during a study” (Miles and Huberman, 1994; 56). In NVivo® codes are stored in ‘nodes’ which can be organised and presented graphically in a hierarchical tree-like structure showing relationships between nodes. Further, nodes can be given properties, the rules that govern or text that describes the code allocation criteria. Node properties in this instance were described by the four categories derived from West and Farr (1990). Sub-categories were then drawn from the literature and the empirical study with modification taking place at sub-category, but not over-arching category, level. Thus was it possible to synthesise data from the literature and empirical studies. Copies of coding, nodes, and properties were printed off at regular stages facilitating reviews of the state of play and, also, providing an audit trail for the development of the framework Tentative categories already existed prior to transcription and analysis so coding commenced with a provisional list of high level categories (newness, ideation, benefit and application). Data were categorised, sub-categorised and compared as they emerged. Data from interviews, repertory grid analysis, documentary sources and theoretically-derived attributes were synthesised into these four categories. Definitions of each of the attributes found in the literature, where available, were examined and grouped according to their similarities. Some attributes are common across a number of studies, some bore similarities and others are unique to specific studies. New categories were elicited from the empirical data, which sparked further rounds of investigation of the literature. Data that did not fit within the categories derived from West and Farr (1990), or the criteria established for inclusion, were discarded. Coding of the transcripts and grids began with what Lofland and Lofland (1995) call a ‘broad-brush’ approach where early analytic coding can be emergent, venturesome and experimental. Broad-brush coding was accompanied by extensive annotation describing why the item had been coded in such a way. Coded items were then assigned to a pre-existing category (node) in NVivo® or, a new category or sub-category was developed. As new items were categorised, category labels and definitions were re-evaluated in a process that gradually focused the coding and winnowed out unproductive categories as others “assume[d] the status of overarching ideas or propositions” (Lofland and Lofland, 1995; 193). The process was highly

- 127 -
iterative and continued until saturation was reached and additional data no longer contributed to the refinement of concepts (Eisenhardt, 1989). This point was reached during the fourth case-study. The objective was not though, the formation of propositions but validating, modifying and dimensionalising a descriptive framework of innovation. The process of populating a pre-existing category is illustrated in table 7-4 and, table 7-5 illustrates the emergence of a sub-category unsupported in the pre-existing framework. Fuller examples are presented in Appendix seven and Appendix eight.
Interview ‘raw’ data
Paper protocols never work. They get developed and put on shelves, they become too difficult to use. So we pinched these, I made…it wasn't sort of plagiarism, but we used somebody else's piece of work -- they gave us the idea. And we developed it ourselves, we developed paper protocols but in such away that they have to use them because this is the only process that they can use for that disease. So the old medical records, we didn't use it. And we developed this patient record that was... maps out their disease…[B4].
Broad brush coding and annotation
Newness derived from combinations of new knowledge or recombinations of existing knowledge that can exist within or be drawn from outside the group. Similarities to attributes revealed in the literature: originality (Pelz, 1985), inventive merit (White and Graham, 1978)
Coded to category Newness Sub category Ideation: origins of the idea
Table 7-4: Data analysis, coding to a pre-existing sub-category
Interview ‘raw’ data
We probably haven't delivered as much as people would like us to. What we haven't delivered is the holy grail which is reduced cost, reduced patient stay, reduced incidence of pressure sores, and reduced antibiotic use [C2]. Yes, that is about as good as you get. Highly successful project, beacon status for doing it. Were there any weaknesses? No, we did it all. [B1]. I think more [patients] are being seen and they are being seen quicker. The access to the service is better and clearer [A7].
Broad brush coding and annotation
The extent to which the innovation addressed and solved the problem that triggered the whole process. Different from relative advantage in that it considers the innovation in the context of its original aim. An innovation may not have achieved all that was intended for it (in its actual operation) though it may be a considerable improvement on what went before (relative advantage). This is about the effectiveness of the innovation but does not seem adequately to fit existing sub-dimensions. Seems similar to relative advantage in as much as the innovations appear to be better than the conditions they supersede. However, they also include a sense of the ‘innovation-in-use’
Coded to category Benefit
Sub category Actual operation
Table 7-5: Data analysis, coding to emergent sub category Check-coding, say Miles and Huberman (1994) aids definitional clarity and is a good reliability check but, they also make the point that this sort of analysis is inescapably a

- 128 -
selective process and, in any transcript, people ‘see’ the same things differently. Nevertheless, check-coding and feedback from informants can contribute to the dependability of the study. Two forms of check-coding were used in this study. First, feedback from the informants on the results of the analysis. This was generally positive as the excerpt below illustrates:
“[the draft]…was the best bit of ‘he’s got no clothes on!’ I’ve read in a while. I got defensive when I read it but actually it is closer to the truth I lived than anything I’m allowed to say. I’ve been normalised into the way the NHS works…Can’t tell you how good it is to have you doing this…I sort of feel you are giving me an external reference point if only in my head” [A1]
The second form of check-coding was with a fellow doctoral student. Consensus though, was not the objective but rather as a check against unconscious bias.
7.5 Framework elaboration Following the collection, analysis and synthesis of the data a framework consisting of 4 categories and a total of 13 sub-categories was developed, this is presented in figure 7-3. The framework changed considerably over the lifetime of its development, reflective of the iterative nature of its construction. Two previous renditions are illustrated in Appendix nine.
Figure 7-3: Framework of attributes of innovation
The following sections describe in greater detail the theoretical and empirical synthesis for each of the 13 sub-categories of the framework.
7.5.1 Newness In previous chapters newness has been identified as a significant construct in innovation research and it features as one of the four factors in the West and Farr definition (1990). Multiple conceptualisations of newness are evident in both empirical data and the literature. Indeed, when one thinks of "newness" it is not the absolute or objective sense of the word that counts. It is the relative newness of an idea in the context of its use that determines perceptions (Mohr, 1969; 114).
Adaptability Scope Uncertainty Complexity
Application Newness Novelty Departure Disruption Risk
Relative advantage Actual operation Profile Observability
Ideation Original Adapted Borrowed
Benefit
Attributes of innovation

- 129 -
Early iterations of the coding framework dimensionalised newness in accordance with a common approach found in the literature, by the sub-categories of radical and incremental. However, it became apparent that this was insufficient to capture the ways in which informants thought about newness. Significantly ‘newness’ was found to contain dual notions. First, there is the view of newness strictly in terms of novelty (the extent of the difference between the innovation and some pre-innovation state). Second, a broader conceptualisation in which newness implies change in the existing structure, functioning, behaviours and practices of any particular social context. Indeed, in the broader conceptualisation of innovation some studies use proxies such as risk, departure and disruption to investigate newness (Damanpour, 1988). For Wilson et al. (1999) a radical innovation is one that breaks new ground, requires new skills to implement and operate and causes significant departure from previous practice (Wilson et al., 1999). It seems clear that the greater the degree of newness then the greater is the challenge to existing structures and behaviours within the adopting social unit. Thus, the ‘newness’ category of the framework can be sub-categorised as presented in table 7-6. Illustrative excerpts from the case studies are presented below with supporting discussion drawn from the literature.
Risk The extent to which the innovation is inherently risky or threatens individuals, the institution or user base.
Novelty This item assesses the extent of change represented by the innovation compared to what preceded it, the level of difference between the before and after.
Departure
The extent to which the innovation results in changes in prevailing practice in the group and social contexts in which it is implemented.
Newness
Disruption The extent to which the departure from prevailing practice occurred in a disruptive manner.
Table 7-6: Sub-categories of innovation category newness 7.5.1.1 Novelty Previous chapters have already discussed the concept of novelty in innovation literature and it is not proposed to repeat that discussion here. The following excerpts though, illustrate innovators’ thinking in terms of a continuum of degrees of novelty.
“…and said “Tell us what your vision is and how we can do it”, well, we didn’t know how we could do it, to be frank. We knew that we needed somehow to intertwine everybody that was part of palliative care, and that was a completely alien concept, particularly here” [A3]. “she was the one who converted us completely to the concept that doctors don't make decisions at all, and that the whole process actually depends on patients making decisions and having sufficient support, information, guidance, and counselling for the patient to make the decision. Well for me that was a complete shift in mindset” [B1]. “…but, how can toast be radical?” [C2].

- 130 -
This sub-category captures the notion of degree of change from a pre-existing state, the level of difference between the before and after. It draws heavily on the ideas of newness and novelty from previous research identified in table 5-1, and incorporates the dichotomisations and continua implicit in continuous improvement, incremental, radical, evolutionary and revolutionary innovation. 7.5.1.2 Operationalising novelty The terms novelty, newness and innovativeness are often used synonymously to describe the extent of change from some pre-existing condition. The variety of approaches to its measurement has been alluded to in Chapter four. In the literature attempts have been made to establish objective, quantitative measures of novelty such as Garcia and Calantone’s (2002) typology of innovativeness based on context (macro or micro) and marketing and technological discontinuity (present/absent). Nevertheless, the commentator plays a significant role in determining the degree of novelty (Danneels and Kleinschmidt, 2001) and this sort of measure can, at best be described as semi-quantitative (Pappas and Remer, 1985), in that they are based on subjective judgements and converted into numbers. Some measures, however, determine innovativeness by quantity of innovations, for example percent of significant product innovations that were first to the market (Loch et al., 1996), number of new major products compared to industry average (Loch et al., 1996) or the number of incrementally or radically innovative products introduced in the past 3 years (Souitaris, 2002) or, simply counts of innovations (Hauser and Zettelmeyer, 1997). However, in practice the vast bulk of measures of novelty rely on the perceptions of individuals and take the form of statements against which respondents are asked to rank (a) specific innovation(s), usually on a Likert-type scale. Statements range from the very context-specific, for example ‘The degree to which the product was new to the firm in terms of new engineering skills for the firm’ (Cooper and Kleinschmidt, 1990; 109) to the general such as ‘How new in general was the innovation?’ (West and Anderson, 1996; 686). Consistent with the objective to produce a formal framework, constituted at a higher level of generality, this research draws on and adapts generally-framed statements from previous research to develop five items to interrogate novelty (see table 7-7). • There is a high degree of similarity between the innovation and that which it
replaces* • The innovation has allowed the adopting unit to provide (a) new service(s) for the
first time
• The innovation consists only of minor changes*
• The innovation supplemented, but did not replace, an existing service*
• The innovation represents a major change in what the adopting unit is able to offer
Table 7-7: Operationalising novelty 7.5.1.3 Departure Lambe and Spekman (1997) describe discontinuous technological change as that in

- 131 -
which fundamental change in the activities of the organisation and a large departure from existing practices result. Rabson and DeMarco (1999) dichotomise newness in terms of revolutionary and evolutionary, the former being radical shifts in processes and technologies, the latter being continuous improvements through changes that are small enough to be made with minimal disruption. Beyer and Trice (1978) describe this shift as ‘pervasiveness’, the proportion of total behaviours occurring within an organisation that are expected to be affected by the innovation. For Dewar and Dutton (1986) radicalness is the extent to which an innovation represents technological changes and thus implies new behaviours for organisational subsystems and / or members. Damanpour (1996) describes radical innovations as those that produce fundamental changes in the activities of the organisation and represent a large departure from existing practices, whilst incremental innovations result in a lesser degree of departure from existing practices. West and Anderson (1996; 686) distinguish between the novelty of an innovation (how new in general was the change), its impact (the extent to which a change to the status quo would be likely to result) and its magnitude (how great would be the consequence of the change). The data illustrates how the teams were confronted with new ways of working, or conceived of their work that represented a departure from that which preceded the innovation:
“Oh enormous [emphasised]. Even though the scale was not large, conceptually this is massively challenging, massively. Like, you know, it contradicts so many cultural things about the way in which the NHS has worked. From strategic bodies like health authorities right down through to operational staff” [A3].
“And so that was very different to…there was new challenges there because we were looking at the whole process, looking at different ways of working and looking at different things” [B4].
“…the catering staff, the ones at ground level, they had much more work to do. They had to change the whole process, I mean not the process of presentation or the process of food delivery because it was all there. But they had to increase the number of dishes that each meal had, they had to increase the number of meals that they served, you know how many stations they have on a belt they had to provide additional sets, they had to provide additional hot evening meals where it had previously dwindled to nothing. So basically they are busier at all times of the day, doing various different things in addition to the main job that they were always there doing” [C2].
“Here, people tend to stay here and never move. So I did get a lot of ‘Well, we’ve done it like this for 10 years, why do we suddenly have to change?’ so you have got to keep making yourself visible” [D1].
Departure is, therefore, conceived as the extent to which the innovation results in
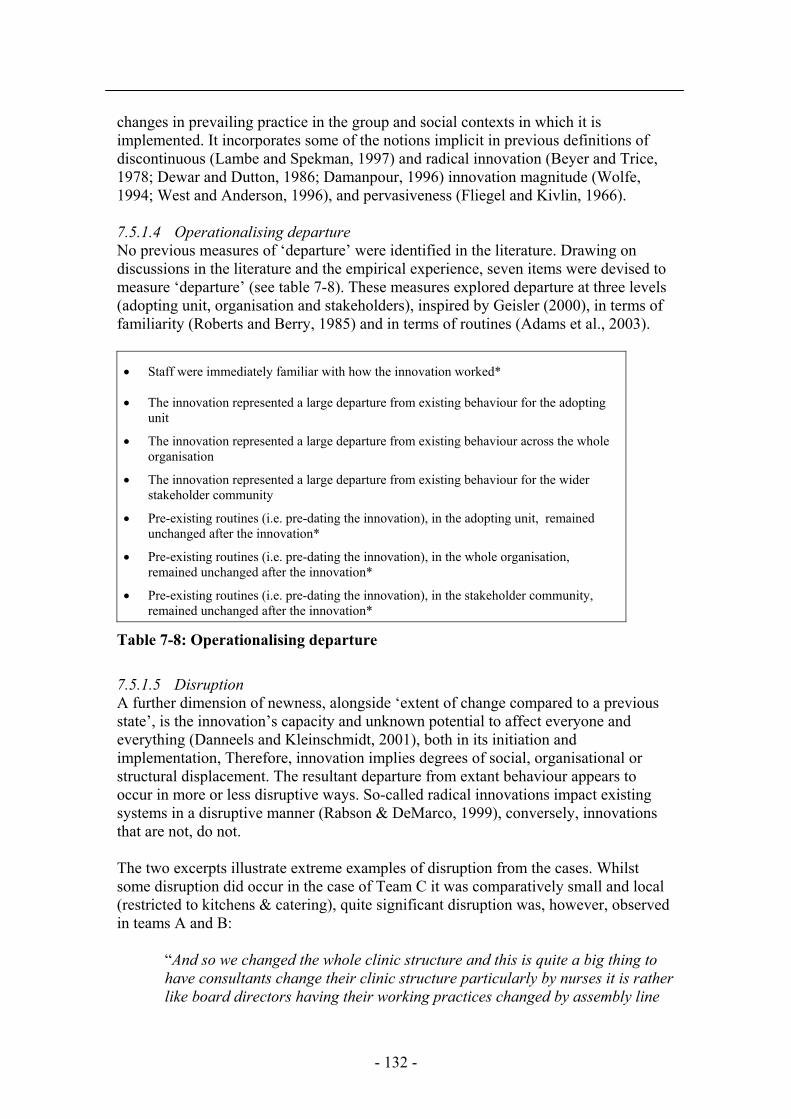
- 132 -
changes in prevailing practice in the group and social contexts in which it is implemented. It incorporates some of the notions implicit in previous definitions of discontinuous (Lambe and Spekman, 1997) and radical innovation (Beyer and Trice, 1978; Dewar and Dutton, 1986; Damanpour, 1996) innovation magnitude (Wolfe, 1994; West and Anderson, 1996), and pervasiveness (Fliegel and Kivlin, 1966). 7.5.1.4 Operationalising departure No previous measures of ‘departure’ were identified in the literature. Drawing on discussions in the literature and the empirical experience, seven items were devised to measure ‘departure’ (see table 7-8). These measures explored departure at three levels (adopting unit, organisation and stakeholders), inspired by Geisler (2000), in terms of familiarity (Roberts and Berry, 1985) and in terms of routines (Adams et al., 2003).
• Staff were immediately familiar with how the innovation worked*
• The innovation represented a large departure from existing behaviour for the adopting unit
• The innovation represented a large departure from existing behaviour across the whole organisation
• The innovation represented a large departure from existing behaviour for the wider stakeholder community
• Pre-existing routines (i.e. pre-dating the innovation), in the adopting unit, remained unchanged after the innovation*
• Pre-existing routines (i.e. pre-dating the innovation), in the whole organisation, remained unchanged after the innovation*
• Pre-existing routines (i.e. pre-dating the innovation), in the stakeholder community, remained unchanged after the innovation*
Table 7-8: Operationalising departure 7.5.1.5 Disruption A further dimension of newness, alongside ‘extent of change compared to a previous state’, is the innovation’s capacity and unknown potential to affect everyone and everything (Danneels and Kleinschmidt, 2001), both in its initiation and implementation, Therefore, innovation implies degrees of social, organisational or structural displacement. The resultant departure from extant behaviour appears to occur in more or less disruptive ways. So-called radical innovations impact existing systems in a disruptive manner (Rabson & DeMarco, 1999), conversely, innovations that are not, do not. The two excerpts illustrate extreme examples of disruption from the cases. Whilst some disruption did occur in the case of Team C it was comparatively small and local (restricted to kitchens & catering), quite significant disruption was, however, observed in teams A and B:
“And so we changed the whole clinic structure and this is quite a big thing to have consultants change their clinic structure particularly by nurses it is rather like board directors having their working practices changed by assembly line

- 133 -
workers” [B2]. For team A, the disruptive implications impacted more broadly:
“But what they did not want to do was to let go of it. And there we were, suddenly talking about moving people into a single managed team and actually taking them out of their employer Trust to put them into a different one” [A3].
‘Disruption’ is, therefore, conceived as the extent to which the departure from prevailing practice occurred in a disruptive manner, and incorporates some of the notions implicit in previous definitions of discontinuous (Lambe and Spekman, 1997) and radical (Beyer and Trice, 1978; Dewar and Dutton, 1986; Damanpour, 1996) innovation, and magnitude (Wolfe, 1994; West and Anderson, 1996). 7.5.1.6 Operationalising disruption Six measures of ‘disruption’ were devised (see table 7-9). As with ‘Departure’ three levels were explored (adopting unit, organisation and stakeholders), at stages of innovation initiation/development and implementation (Zaltman et al., 1973). • Developing the innovation caused disruption in the adopting unit
• Developing the innovation caused disruption in the wider organisation
• Developing the innovation caused disruption in the stakeholder community
• Implementing the innovation caused disruption in the adopting unit
• Implementing the innovation caused disruption in the wider organisation
• Implementing the innovation caused disruption in the stakeholder community
Table 7-9: Operationalising disruption 7.5.1.7 Risk Mohr (1969) warns that the introduction of something new entails resource, organisational or social risk of some sort. Burns and Stalker (1961) note that all novelty includes some degree of risk. Heany (1983) describes product innovation along a continuum of newness, anchored by ‘least risky’ style changes in established products, and major innovations, that have the potential to place major strains on all or most functional areas. Heany (1993) conceives organisational risk to be at its least where market, product and process repercussions are minimised or non-existent. In a similar vein, Meyer and Goes (1988) describe risk to the adopting organisation as the level of risk liability to which it is potentially exposed. Bessant and Caffyn (1997) suggest that for some organisations, unaccustomed to the innovation process, mobilising high levels of participation can be a risky business, not least of all because of the factors that militate against it such as fear of change, lack of innovation skills or inappropriate organisational structures. It has become almost a taken-for-granted that risk and innovation, like risk and entrepreneurship, go hand-in-hand. An atmosphere where risk-taking is encouraged

- 134 -
has often been linked with innovative environments and, a willingness to take risks. This is widely regarded as characteristic of innovative and entrepreneurial behaviour at the level of the individual (Bommer and Jalajas, 1999), the group (West, 1990) and the organisation (Casson, 1993). Risk, too, is associated with the innovation outcome both in terms of development processes and, ultimate application. West (1990) notes that work group members are more likely to take the risk of proposing new and improved ways of working in a climate which they perceive as personally non-threatening and supportive. Characteristics of such climates include participative safety and support for innovation. The former describes an environment that is perceived as interpersonally non-threatening, where trust and support thrive, the latter being one in which the expectation, approval and practical support of attempts to introduce new and improved ways of doing things in the work environment (West, 1990). In circumstances of threat or insecurity risk-taking is likely to be diminished and the failure to make people feel safe in their jobs or experimentation can lead to a tendency to avoid risk-taking or experimentalism and so militate against innovating. Individuals may also be sensitive to moral and ethical risk factors. It is arguable that in the medical and related fields there is a greater potential for exposure to these types of risk, for example the dilemma of prescribing high risk drugs to treat serious illness (Peay and Peay, 1994) or, the development, application and introduction of organ replacement strategies (Sass, 1997), Taggart and Blaxter (1992) assess pharmaceutical firms’ attitude to risk on dimensions of technical and market risk. Technical risk is the failure of the development process that is determined, largely, by approach to the research and development (technique) and the conceptual newness of the project. Market risk is the risk of an unsuccessful launch mediated by the context of application, the innovator’s experience of that context and, the level and nature of competitive forces in that context. The excerpts illustrate risk at both individual and organisational levels.
“There were problems particularly when we got to [name of innovation] and we tried to move waiting lists to booking lists, and there was a fundamental move where you were taking the waiting list management away, and therefore the power, away from the surgeons and away from their secretaries, they weren’t very happy about that and some people said I will not do it” [B2].
“I got warned by the health authority that I might get suspended and [that] if I was asked to go to a meeting with my chief executive and medical director [I should] say no and ring us. And I had a gagging letter from [senior manager] with whom my boats were burned really so I wrote back a brave letter… she said if I talked out of turn she would have to take it to the chief executive of the region” [A1].
“…we had quite a strict regime of deprivation before anaesthetic, we actually realised after a literature search that the risks that we were concerned about were actually non existent, well not non existent but so small that…” [D1].

- 135 -
Consequently, risk is conceived as the extent to which the innovation is inherently risky or threatens individuals, the institution or user base, and finds support in previous studies that consider risk (Zaltman et al. 1973; Heany, 1983; Bommer and Jalajas, 1999; Taggart and Blaxter, 1992). 7.5.1.8 Operationalising risk Five items measure ‘risk’ (see table 7-10) and these reflect risk inherent in the innovation, risk to individuals, risk to the organisation and risk at stages of the innovation process. • The innovation is inherently risky
• The innovation has been widely accepted as safe*
• Individuals took risks in developing the innovation
• Individuals took risks in implementing the innovation
• The innovation represents a risk for the organisation
Table 7-10: Operationalising risk
7.5.2 Ideation Successful innovation can have its roots in creativity but originality in the sense of ‘new to the world’ is not a necessary antecedent. At the heart of innovation are combinations of new knowledge or re-combinations of existing knowledge (Nonaka, 1990; Boisot, 1995; Pitt and Clarke, 1999) so it is, that innovation can be conceived to embody different configurations of new and existing knowledge that exist/existed endogenously or exogenously to the group. These configurations of knowledge can be conceived of as different levels of originality. Originality is distinguished from newness in that it is concerned with the source of the ideas and knowledge that feed newness as opposed to a relative measure of the novelty of an innovation, see table 7-11.
Origination
A first time solution to a problem without benefit of similar, prior examples.
Adaptation
A few prior solutions have been identified and these are modified to fit the particular situation.
Ideation
Borrowing
Well developed solutions to the problem are found elsewhere and are copied with little or no change.
Table 7-11: Sub-categories of innovation category ideation Pelz’s (1983, 1985) work focuses on the extent to which disorderliness of process is related to different levels of a range of innovation attributes. For those innovations that are ‘originated’ (developed entirely in-house and are wholly original) the sequence of events in the process overlaps in time, is muddled and disorderly. For simple innovations that are borrowed (copied from outside with little change), a moderately clear succession of stages may appear. The research is inconclusive as regards normative statements about processes and outcomes, an effective innovation could occur in either an orderly or muddled fashion, and so could an ineffective one (Pelz,

- 136 -
1985). Nevertheless, the dimensionalisation is a useful means of classifying the idea sources of innovation artefacts. The evidence of the empirical work corroborates this view of a scale of origin of ideas ranging from new to the world ideas to imported ideas and that the material sources of new knowledge components that make up the innovation artefact form a significant part of the perception of it. Further, it is reminiscent of Pelz’s (1983) dimensionalisation of originality. Pelz’s (1983) three dimensions of originality (source of idea) are: origination, adaptation, borrowing. Original innovations are first time solutions to a problem without benefit of similar, prior examples. In the development of the innovations for which they won awards teams B and C pursued a series of smaller, contributory innovations, some of which were borrowed, others, wholly original.
“…that [the innovation] I know is very original because, having spoken to many people from many different Trusts they have never heard of something like this. In fact, nobody other than the nursing staff feeds patients. So this is original, it is original on the national scale, nationally it is very original” [C4].
Team A doggedly pursued an original innovation for 2 years:
“…how [we] integrated it was ours, self-generated. And it grew from thinking ‘well instead of having Macmillan nurses in 5 Trusts let’s have them in one…actually give them some specialist management so that they have got a manager who knows what it is they do and understands what the pressures are’, it grew from that” [A2].
Adapted innovations are those where a few prior solutions have been identified and these are modified to fit the particular situation.
“Paper protocols never work. They get developed and put on shelves, they become too difficult to use. So we pinched these, I made…it wasn't sort of plagiarism, but we used somebody else's piece of work -- they gave us the idea. And we developed it ourselves, we developed paper protocols but in such away that they have to use them because this is the only process that they can use for that disease. So the old medical records, we didn't use it. And we developed this patient record that was... maps out their disease…” [B4].
Borrowed innovations, well developed solutions to the problem, are imported from elsewhere and are copied with little or no change. The data seems to suggest that Team C’s innovation was borrowed compared to those of A and B which relied more on adaptation and their own origination.
“Nutrition as treatment: well it is not an original idea, but it was not used very widely and we borrowed it only for the benefit of our patients” [C4].
“…I mean when you say innovation…you go back to Florence Nightingale,

- 137 -
that is what they used to do. That was considered their most prime nursing function. And there is lots of evidence that if you don’t do it then people take longer to recover etc. but it still feels like we have got an uphill battle to maintain where we are” [C1].
7.5.2.1 Operationalising ideation The knowledge origins of the innovation are measured by five items (see table 7-12) which determine whether or not the innovation is borrowed, adapted or original (Pelz, 1983; Pelz, 1985).
• The innovation was developed entirely in-house*
• The innovation required significant external input
• The innovation required minimal external input*
• The innovation was copied from an external source*
• The innovation was modified from external examples*
Table 7-12: Operationalising ideation
7.5.3 Application The category ‘application’ describes perceptions of the innovation ‘in use’, what it is like to live with it. Warner (1974; 442) describes use and application as a factor of “obvious import” and that usage is essential for meaningful analysis. Warner’s (1974) argument is that a technological perspective on innovations, which can be hard (physical objects), or soft (organisational changes) does not suffice to define or bound the innovation and that the multidimensionality of the innovation, based on its use (application) or profitability (value, worth or benefit), provides more sensitive analysis. In this study four sub-categories of application are presented: uncertainty, scope, complexity and adaptability, see table 7-13.
Uncertainty Knowledge concerning the link between innovation inputs, processes, and outcomes.
Scope The extent to which the innovation stands-alone or requires changes elsewhere.
Complexity The extent to which the innovation, regardless of scope, by dint of its connections to other parts, is difficult to use.
Application
Adaptability The extent to which the innovation can be refined, elaborated and modified according to the needs and objectives of the group.
Table 7-13: Sub-categories of innovation category application 7.5.3.1 Uncertainty Uncertainty, in respect of innovation, tends to be discussed as a contextual or environmental factor. Shane (1995) established that the cultural value of uncertainty acceptance is significantly associated with innovating, and that uncertainty-accepting societies may be more innovative than uncertainty-avoiding societies. A level of

- 138 -
uncertainty is an important precondition for innovation to take place (Brouwer, 2000) and innovating has been conceived of as a process of reducing those uncertainties. Uncertainty reduction is an information-processing activity in which novel combinations of existing and new knowledge are made: individuals and groups tap a pool of knowledge in order to deal with uncertainties in unrealised user requirements (Souder and Moenaert, 1992). Deyle (1994) describes this as ‘innovation by groping along’ in which there are echoes of Zaltman et al.’s (1973) scientific status. Tatikonda and Rosenthal (2000) describe uncertainty as the difference between the amount of information required to perform a particular task and, the amount of information already possessed by the organisation. Uncertainty can be reduced by experimentation, piloting or trialing innovations (Fliegel and Kivlin, 1966). Divisibility is similar to trialing (Rogers, 1962). Although trialing did feature in some respondents’ perceptions, it did not satisfy all the criteria for inclusion in the framework. There was, however, sufficient evidence of the notion of uncertainty in terms of imperfect or incomplete knowledge with regard to the inputs, processes and outcomes of the innovation to warrant the inclusion of uncertainty in the framework.
“Well, before I came they [the Health Authorities and other local stakeholders] went down to Southampton to look at palliative care services there…they also went to Oxfordshire…but the honest answer is: No, there was nobody that I could sort of think ‘Gosh, I will find out what they do and I will do it the same way that they do it.’ There was nobody” [A1].
“The whole concept was really difficult to get your head around, and sometimes I struggle as well and think ‘What the hell am I doing sat here?’, but I do…as long as I can hang on to the fact that at the end of the day whatever it is we are trying to do now is going to make a difference to patients then I can hang in there” [D2].
7.5.3.2 Operationalising uncertainty ‘Uncertainty’ is operationalised by five items devised for this research as no previous measures were identified in the literature (see table 7-14).
Users are well informed about the origins of the innovation*
Users are well informed about expectations of the innovation
The feasibility of the innovation was frequently called into question*
We were not aware of appropriate external solutions to the initial problem
The innovation is effective in its use*
Table 7-14: Operationalising uncertainty

- 139 -
7.5.3.3 Scope The fundamental notion underpinning the scope of an innovation is the nature of the linkage between an innovation and its environment. That is, to what extent can the innovation stand-alone and be pursued independently or, does its introduction require changes elsewhere in the system? Chesborough and Teece (1996) call these autonomous and systemic innovations. Goodman (1981) suggests individual and synergistic innovations. ‘Individual’ innovations affect only a single functional area and do not affect other functions or cause wider change. A synergistic innovation is one that affects many functions. Henderson and Clark (1990) describe component and architectural innovations. With the former, one component simply replaces another, but architectural innovations require that whole systems be reconfigured.
“But in the teaching side of it that is my job now, many of the aspects of teaching about it are still ongoing, I am still talking about [innovation name]…But actually it becomes part of [the NHS Trust] nutritional care philosophy: that this is it, this is what we do now…this is now the way that we want to run our nutritional care” [C4].
“And a lot of things came out of that for us in redevelopment, you know we designed a slightly different day surgery, we have got a pre-assessment unit, we have got different people working in different ways we have got a whole different process for our patients” [B4].
“So the notion of them all coming into the room and…writing it up on the board which patients need to be seen today and who is going to see them -- you know that is a level of collaboration at an operational level that the service had never known” [A1].
“Oh enormous [change]. Even though the scale was not large, conceptually this is massively challenging, massively. Like, you know, it contradicts so many cultural things about the way in which the NHS has worked. From strategic bodies like health authorities right down through to operational staff” [A2].
These excerpts illustrate examples of scope. Excerpt C4 illustrates the extent to which the innovation has become embedded as organisational philosophy, and extends beyond the innovating group. Similarly B4, shows wide ranging repercussions at an institutional level, beyond the context of the group. Conversely, A1 suggests a narrower scope in that behaviour change has happened within the context of the innovating group. However, A2 alerts us to be aware that although there is evidence to suggest narrow scope, other evidence might indicate a dispersed and wider significance. Some innovations require changes in the system in which they operate, others may stand alone directly replacing that which preceded it and requiring no adaptation on the part of the system (Goodman, 1981).

- 140 -
“So…we were starting to challenge that by saying ‘if you direct book you do not need waiting lists’. So, you had this direct access which was eliminating the waiting list but it reduced the flexibility of theatres because, with a waiting list you can cancel…So there was on the one hand the benefits of not having a waiting list and on the other the disbenefits of not having the flexibility - so the system had to make sure it could accommodate that” [B3]. “[The] clinic co-ordinator flexes the clinic according to the needs, using capacity demand analysis, because it’s a single consultant speciality so if he’s away you can get queues forming again and she has the knowledge to change the clinic and flex it with the radiology department” [B2].
7.5.3.4 Operationalising scope ‘Scope’ is measured by four items (see table 7-15) adapted from conceptualisations in the literature, notably Henderson and Clark’s (1990) ideas of architectural and component innovations. These are adapted for more general usage, the extent to which the innovation stands-alone (within the group), or requires changes elsewhere (outside the group), as opposed to their techno-centric view.
The innovation is self-contained within the adopting unit*
The impact of the innovation has been limited to the whole organisation*
The impact of the innovation has been widely felt beyond the whole organisation
The innovation has required changes to be made or accommodations sought in the wider stakeholder environment
Table 7-15: Operationalising scope 7.5.3.5 Complexity The notion of complexity articulates innovators’ and users’ views on the ease or difficulty of making use of the innovation, and in this respect is similar to the attribute ‘ease of operation’ (Tornatzky and Klein, 1982; Adams et al., 1992). Complexity has received considerable attention in the management literature, particularly in recent times where it has been used as a lens through which to study and understand the dynamism of organisational change (Brown and Eisenhardt, 1997). Cilliers (1998) argues that complexity results from the nature and level of the interaction between components of the system and can be determined by the analysability of that system at the level of the system. Thus, he suggests, a jumbo jet is not complex, because it is analysable and fully understandable, but is rendered complicated by the volume of relationships within the system. On the other hand, a mayonnaise is complex because it defies analysability, exact description and understanding. This conceptualisation is echoed in the data:
“…it is very complex…there are a variety of dimensions to that. The number of different stakeholders, the number of different types of process that we are

- 141 -
dealing with, the number of aspects of that process that we need to do something about…it is all of those” [B2].
Tornatzky and Klein’s (1982) meta-analysis of 75 studies rated complexity (along with compatibility and relative advantage) as one of three consistently significant factors influencing adoption rates. It is generally assumed negatively to influence rates of adoption and can be a major reason for project delay (Griffin, 1997b). Hobday (1998) postulates complex innovations differ from conventional goods in terms of the complexity of both their origination (process) and outcome. He describes a complex innovation as many customised, interconnected control units, sub-systems and components rather than smaller numbers of mostly standardised components used in commodity products. In terms of process, complex innovations may be characterised by multiple design paths, concurrent development activity, multiple skills input and the application of a breadth of knowledge. The richness of these interactions and the interconnectedness between components and sub-systems can be embodied in the outcome (Henderson and Clark, 1990). Pelz (1985) differentiated between technical and organisational complexity. The former recognises a continuum from loose to tight, describing the nature of the connectedness of the component parts of an innovation. Pelz (1985) defines organisational complexity in terms of numbers of units involved in the adoption of the innovation. It is clear though, that complexity is not simply a function of numbers but also about the nature of and uncertainties in the links between the units or component parts. Complexity can therefore be considered to be a function of the nature, quantity and magnitude of the units involved in its development and implementation, and of the component parts of the innovation rendering it difficult to understand or use. Empirical data illustrate how informants perceive complexity in their innovations:
“I think it is the closed universe wherein they bring everybody together in palliative care. And the thing that the hospices particularly like is that they are given a stake and some say in the whole of the way in which palliative care works not just their hospice bit of it. So they have some say in the way NHS resources are used and Macmillan resources are used, not just how other hospice resources are used. And I think it is that holistic approach” [A5].
“What tends to happen now is that catering staff deliver the food that they have prepared to a nationally agreed standard and monitored it and cooked it to the right temperature for the right time and made it presentable… and it gets up to the ward, and somebody pushes the trolley into the ward, and that is the end of it, catering do not see the end user enjoy the product or even eat the product. So the idea of having the housekeeper or ward hostesses there was to complete that bit of the process and with the same kind of care” [C2].
“One and two [the informant is speaking of elements 1 and 2 in the repertory grid] require components of lots of individual people to achieve i.e. menu review, detailed discussions with dieticians, head of kitchen and chef team, suppliers etc., making compromises, checking out the menu clerks office, call it

- 142 -
popularity of dishes, changes to food provisions, lots of parts to that, costings, financial implications, quality implications, the delivery time implications, food hygiene education...” [C3].
7.5.3.6 Operationalising complexity ‘Complexity’ is measured by seven items (see table 7-16) principally adapted from Pelz (1985) but abstracted from technological interdependence to a more general view such that the greater the levels of interdependence, the more complex the innovation.
The innovation consists of modified existing components*
A large number of specialists (clinical and/or non-clinical) were involved in developing the innovation A large number of specialists (clinical and/or non-clinical) were involved in implementing the innovation
The innovation requires co-ordination amongst many units
The innovation has been highly customised for local use
A large number of organisational units were involved in developing the innovation
A large number of organisational units were involved in implementing the innovation
Table 7-16: Operationalising complexity 7.5.3.7 Adaptability ‘Adaptability’ is the extent to which the innovation can be refined, elaborated and modified according to the needs and objectives of the group. Implicit within the definition are notions of ‘applicability’ (Dearing and Meyer, 1994), ‘susceptibility to successive modification’ (Zaltman et al., 1973), ‘mutual adaptation’ (Leonard-Barton and Sinha, 1993) and ‘compatibility’ (Rogers, 1962). Susceptibility to successive modification is the degree to which the innovation can be modified in response to technological change or other requirements. Mutual-adaptation, the degree to which users refine a system to fit their particular need, is a key factor in the innovation/technology transfer process (Leonard-Barton and Sinha, 1993). Compatibility is the degree to which the innovation is perceived as consistent with the existing values, past experiences, and needs of potential adopters (Rogers, 1983). The more compatible the innovation is with existing contextual factors the more likely it is to be accepted. Lower degrees of compatibility imply potentially disruptive effects. The empirical data confirms adaptability as an attribute of innovations:
“…and what we have decided to do is we are going to buy into the health service package (database system) and adapt it to suit ourselves as best we can. It is not a perfect solution but I firmly believe it is the nearest we are going to get and, from a financial point of view we are going to save ourselves £100,000 a year on software – and that is a lot of coffee mornings!” [A3].

- 143 -
“So, you had this direct access which was eliminating the waiting list but it reduced the flexibility of theatres because, with a waiting list you can cancel. If you are booking patients and you are booking them fast now and you are filling slots, then there is a danger of creating total efficiency because you would have no one you can bring in just like that - but with a waiting list you can put someone else on. So there was on the one hand the benefits of not having a waiting list and on the other the disbenefits of not having the flexibility - so the system had to make sure it could accommodate that” [B3].
7.5.3.8 Operationalising adaptability Two items relating to ‘adaptability’ were operationalised for use in the survey instrument (see table 7-17).
The innovation fits comfortably with existing organisational values Where necessary it has been possible to modify the innovation to suit local requirements
Table 7-17: Operationalising adaptability
7.5.4 Benefit Geisler (2000) conceives of a series of outputs from stages of the innovation process that bring benefit to increasingly widely constituted communities as the process progresses. Innovations are generally regarded to have beneficial impact for an identifiable social unit (though that is not to deny that there may be negative impacts elsewhere). These benefits may be planned or unplanned and are determined, as is novelty, relative to initial prevailing conditions. Therefore, this category considers the planned and unplanned beneficial consequences of the innovation, including the degree to which original objectives have been met. Four sub-categories are identified: actual operation, relative advantage, profile and observability. These are defined in table 7-18.
Relative advantage
The extent to which an innovation is perceived as being better than the idea it supersedes.
Actual operation
The extent to which the innovation is perceived to have satisfied original objectives.
Observability The extent to which the innovation is observable by others.
Benefit
Profile The extent to which the innovation raises personal, group or institutional profile.
Table 7-18: Sub-categories of innovation category benefit
7.5.4.1 Actual operation and relative advantage ‘Relative advantage’, the extent to which an innovation is perceived as being better than the idea it supersedes and ‘actual operation’, the extent to which the innovation is perceived to have satisfied original objectives appear, arguably, to be similar constructs. After all, if the innovation satisfies the objectives originally set for it (actual operation) then, ipso facto, it would satisfy the criteria of relative advantage of being better than the idea it supersedes. However, evidence from empirical and

- 144 -
literature studies met the criteria for inclusion and justifies treating the two attributes as discrete. Of the five atributes first proposed by Rogers (1962, 1983) and Rogers and Shoemaker (1971) relative advantage has been subject to most critical debate. Tornatzky and Klein (1982; 35) described it as the garbage can of attribute research into which non-specific characteristics can be dumped, and they dismiss it as being perhaps too broad and amorphous to be of much use. This is largely because of the diversity of ways in which relative advantage has been operationalised and measured, measured as it is on occasion by quantitative economic and financial metrics or qualitative metrics of perceived benefits (Utterback et al., 1976). Further, Dearing et al. (1994) noted that more than two-thirds of the comments they recorded in their study were related to non-economic factors. For example, the relative advantage of a technical process innovation has been defined in context-specific terms as its ability to (1) foster superior service, (2) enhance productivity, (3) improve efficiency, (4) reduce costs, (5) ensure reliability and consistency, (6) enable intangible benefits – e.g. image (Wilson et al., 1999). Or, it has been more broadly conceived in terms of effectiveness. Effectiveness relates to the extent to which the innovation addresses the problem for which it was initiated. Damanpour (1990) reported on the extent to which the perceived effectiveness of innovations influences rates of adoption and contributes to an organisation’s ability to fulfil its mission and achieve its objectives. West and Anderson (1996) located effectiveness in the context of the application of the innovation in relation to the problem for which it was developed to resolve, but operationalised it quite narrowly. Informants from the current study certainly conceptualise innovations having impact in the context for which they were developed but have a broader conceptualisation of effectiveness than did West and Anderson. Innovations typically are developed with certain purposes in mind, and they must be perceived to fulfil their intended purposes better than their precursors if they are to be adopted. Thus the concept of relative advantage has significant intuitive appeal as it is a very generalisable concept (Moore and Benbasat, 1991; 198). That is, the advantage is always ‘relative’ to the particular context of the innovation, and hence the perceptions of the innovators and/or adopters and users are important. This comparative perspective, the innovation relative to the preceding condition, permits a richer understanding of the innovation itself. White and Graham (1978) identify market and operational merit. The former assesses end user advantages and the latter considers the effect on a company’s existing business practices. Pelz (1983), as one dimension of the effectiveness of an innovation, operationalised actual operation, the extent to which an innovation achieved its purpose. Tatikonda and Rosenthal (2000) employ a measure they call execution-oriented outcome, the degree to which an individual project achieves its original objectives. Their operationalisation of execution-oriented outcome (i.e. technical functionality, product quality, product unit cost, and time-to-market) belies its origins in the product development,

- 145 -
technological change and project management literature, but this does not preclude the application of the concept in non-production environments. The excerpts presented below illustrate this comparative perspective in which innovators perceive their innovations in terms of actual operation and relative advantage.
“…but I think the other huge plus that I think we feel that we have achieved is that we have re-established relations between the nurses and the catering department. That we have actually re-established a dialogue and we feel that we are working with the catering department which before we weren't. You can't put it down as a specific ‘we did this in order to re-establish the relationship’ it is a consequence, it was a consequence of the improvements we sought to make” [C1].
This was unplanned but nonetheless significantly beneficial in the social context. It is a clear articulation of the outcome being better than that which preceded it but not necessarily in the manner in which the benefit was envisaged at the start of the innovating process. Contrast this with the commentary from team B informant 1 who was reflecting on two different innovations and considers them, quite clearly, in terms of the original project objectives:
“yes that's about as good as you get. Highly successful project, beacon status for doing it. Were there any weaknesses? No, we did it all … On reflection … outpatient modernisation … there are some things that we haven't achieved within the time frame we wanted to -- there are some elements of it that we haven't implemented perhaps as fully as we wanted to and stuff like that. So it is not quite all perfect” [B1].
Consequently, both actual operation and relative advantage are included in the framework. Actual operation assesses the extent to which the innovation achieved its original objectives, relative advantage assesses the extent to which the innovation is perceived as being better than that which it replaces. Actual operation is different from relative advantage in that it considers the innovation in the context of its original aim. An innovation may not have achieved all that was planned for it in addressing and solving the problem that triggered the process (its actual operation) though it may be an improvement on what went before even though it bears little resemblance to initial terms of reference (relative advantage). 7.5.4.2 Operationalising actual operation/relative advantage ‘Actual operation’ and ‘relative advantage’ are each measured by two items (see tables 7-19 and 7-20) drawing on the various conceptualisations in the literature and notions of effectiveness (Pelz, 1983; Pelz, 1985; Wolfe, 1994).

- 146 -
The innovation has satisfied all the original objectives set for it at the start of its development
The innovation solves the problem that originally stimulated its development
Table 7-19: Operationalising actual operation
The innovation represents an improvement on the pre-existing situation
The innovation has achieved unplanned-for benefits
Table 7-20: Operationalising relative advantage 7.5.4.3 Profile Several studies consider ‘profile’, the extent to which the innovation raises personal, group or institutional profile, as a factor in understanding innovation. It is similar to and variously labelled as ‘image’ or ‘status’ (Mohr, 1969) and ‘social approval’ (Fliegel and Kivlin, 1966). Innovations may be pursued for the sake of ‘profile’ that can contribute to enhancing the social status of the adopter (Moore and Benbasat, 1991; Agarwal and Prasad, 1997) or be motivated by the desire for prestige and professional status, sometimes at the cost of organisational goals (Mohr, 1969). The only indication of personal aggrandisement in the empirical data is ambivalent:
“…yes, I think it was [the pursuit of personal ambition]…I think for [name] it was. And I think that that may be unfair…But I think it was thought that it was there to make a name, to make a difference, to make a change and that it was not about patient care” [A4].
On the other hand, the empirical data suggests an alternate view, one in which the profiles of individuals, groups or institutions may be raised by association with the innovation.
“the [innovation] to me, professionally, was a huge achievement and I got all the accolades for that. Nationally we got awarded beacon status and it was my name that was up there - so for me professionally that was quite important turning point” [B2]. “Because it’s raised the profile of the catering services department and very, very significantly” [C3].
Further, innovation driven by a quest for prestige can be profoundly wasteful, and it is from this that the pejorative view derives. Wolfe (1994) differentiates the two types of slack by labelling the ‘prestige-type’ slack status. However, the term profile is preferred here as it more adequately captures the ideas uncovered in the empirical data and places less emphasis on the notion of personal aggrandisement.

- 147 -
7.5.4.4 Operationalising profile ‘Profile’ is measured by four items, two of which assess the motivations for pursuing the innovation in terms of organisational or individual prestige, and the remaining two the extent to which organisational or individual profiles have been raised by the innovation (see table 7-21).
The innovation was pursued for reasons of…
…organisational prestige
…personal prestige
The innovation has raised the profile of…
…the organisation
…individuals
Table 7-21: Operationalising profile 7.5.4.5 Observability ‘Observability’, the extent to which the results of an innovation are visible to others echoes profile but the two are differentiated by their focus: the former considers individuals, the group or the organisation whereas the latter is concerned only with the visibility of the innovation itself – i.e. object focused. The terms ‘observability’ and ‘visibility’ appear to be synonymous. Tornatzky and Klein’s (1982) review (of 75 studies) found only seven studies in which ‘observability’ or ‘visibility’ featured. There is, however, strong evidence in the empirical data for observability as an attribute of innovations.
“So, the hospital food as treatment thing happened, and there was all the razzmatazz around that…then in 2000 in June I was asked to go and talk to the Prime Minister about hospital food and hospital cleanliness…it was in 10 Downing Street in the Cabinet Office…and there were just a few of us…and, we have been briefed ‘this is your one opportunity, don't waste it’, so I thought let's go for it. The Prime Minister was very open and asked brilliant questions and…I had lots of opportunity to tell him what the real problems were and make suggestions. Virtually everything I suggested ended up in the NHS plan” [C2].
“I think it is not so much what they will notice it is what they will not notice…I don’t particularly ever want again to have a patient ever say to me ‘don’t all you people talk to each other?’” [A1].
7.5.4.6 Operationalising observability ‘Observability’ is measured by two items (see table 7-22) and is developed from the measure suggested in Wolfe (1994).

- 148 -
The innovation has…
…gained recognition within the NHS
…gained recognition outside the NHS
Table 7-22: Operationalising observability
7.6 Discussion Frameworks define ‘the territory’ and bring us a step closer to theory (Crossan et al., 1999). Any valid framework of innovation must be capable of capturing its complexity and multidimensionality and be applicable across cases. The framework developed in this chapter starts with four high level categories drawn from the synthesis of data from the literature and an empirical study. The framework is populated with 13 innovator- and user-perceived attributes. The objective of Phase I of this research has been to devise and operationalise a comprehensive but parsimonious framework that captures these perceptions and, through an iterative process cycling between theory and empirical research such a framework has been developed. The first part of this chapter has discussed this development process and acknowledged the debt owed to previous research in constructing the framework. The framework, and its heritage, is summarised and presented in table 7-23, this illustrates how the framework generated in this research is generally able to subsume previous frameworks into its ambit, with the exception of the attributes commutuality and reliability from Dearing and Meyer’s (1994) study. How is it possible to know that these are the ‘right’ attributes to have chosen to operationalise the framework? In developing a comprehensive parsimonious classification system, how is it possible to establish that the ‘right’ attributes have been selected? Two rounds of testing have established a degree of face, construct and content validity that is felt to be acceptable. Subsequent statistical testing has indicated a tolerable level of reliability (see table 7-3). The ‘rightness’ of attributes included in the framework may also be determined by the utility of the results that the instrument delivers. The variables chosen to populate any framework or describe configurations will differ according to the research task at hand (Miller and Friesen, 1984). The task in this instance is exploratory so, in a sense, the ‘rightness’ of the attributes populating the framework will not be known until the final analysis. Arguably, it may have been reasonable to have operationalised an existing framework (Rogers, 1983; Moore and Benbasat, 1991; Dearing and Meyer, 1994; Meyer et al., 1997), or to synthesise a framework from the attributes identified in table 5-1 for this study. The critic might legitimately argue that the framework presented in this research is not significantly different, other than in terms of numbers of attributes that comprises it, from other empirical studies (see table 7-23). This begs the question ‘why the need for the four in-depth case studies?’. The case studies can be justified in terms of the context of this study. Most of the attributes drawn from the literature have their intellectual heritage in the techno-centric NPD literature. There were legitimate concerns about the generalisability of these constructs to the non-profit, health care sector. It has been the contention of this thesis that conceptualisations of innovation in

- 149 -
research studies have been narrow and contextual, the corollary of which is that operationalisations have, too, been narrow and contextual. Consequently, the survey instrument developed for this research adopts and refines pre-existing measures in the light of the process of synthesising extant constructs with the findings of the pilot study.
This study Holloway (1977) Moore and Benbasat (1991)
Dearing and Meyer (1994)
Agarwal and Prasad (1997)
Meyer et al. (1997)
Relative advantage – economic (4), status
(4) Relative advantage (5) Economic advantage Relative
advantage (5) Relative
advantage (5) Relative advantage (2)
Effectiveness
Result demonstrability (4)
Result demonstrability
(4)
Actual operation (2)
Ease of use (4) Ease of use (4)
Observability (2) Observability (4) Visibility (2) Observability Observability (3)
Complexity (7) Complexity (3) Complexity
Trialability (2) Trialability (2) Trialability Trialability (2) Trialability (5)
Compatibility (5) Compatibility (2) Compatibility Compatibility (3) Adaptability (5) Adaptability (2)
Applicability
Reliability Commutuality
Novelty (5) Radicalness Departure (7) Disruption (6)
Risk (5) Riskiness (5)
Uncertainty (5) Divisibility Scope (4)
Ideation (5) Profile (4) Image (3) Image (3)
Figures in parentheses indicate number of items in each instrument
Table 7-23: Comparison of multi-attribute innovation studies Phase I of this research, including the systematic review of the literature, has provided the empirical underpinning for the development of a framework for describing innovations. The criteria against which attributes were judged for inclusion in the framework were (1) there was support for the attribute in the literature (2) there was evidence of the innovation being perceived that way in the pilot data and, (3) the attribute fitted within the boundaries of the definition of innovation underpinning this study (4) That the majority of informants in each team made reference to the attribute. Only if the attribute satisfied all four criteria was it eligible for inclusion. Framework validity is considered to be tolerable for exploratory research but it is felt that item scales might need to be revisited for future research. The instrument combines measures derived from the literature and newly developed for this study. There is a small history of item and instrument development in the

- 150 -
literature. Moore and Benbasat (1991) subjected their perception scales to intense validity and reliability testing and were assumed, therefore, by Agarwal and Prasad (1997) to be a satisfactory basis for further studies. From the point of view of this study many of Moore and Benbasat’s (1991) items are too context-specific to their study of the adoption of an information technology innovation to be considered useful in developing a formal framework. Moore and Benbasat (1991) developed their instrument with regard to a personal (computer) workstation, Meyer et al (1997) three preventive health innovations, Wilson et al. (1999) the adoption of imaging technology innovations, Agarwal and Prasad (1997) usage of the Internet amongst a sample of MBA students, and Dearing and Meyer (1994) nine hazardous waste bioremediation technologies. The framework has been developed as a sensitive measure of innovation with high potential for general application, where previously none has been found to exist. It presents a conceptualisation of innovation based on a synthesis of existing literature, developed and validated empirically, as a basis for the comparison of innovations across cases. Innovations are characterised in the framework in four distinct categories: newness, ideation, application and benefit. Each of the four categories is composed of a number of sub-categories. None of these categories or sub-categories is new or previously unknown to the innovation literature, though they differ one from another in terms of the attention accorded them in the literature. What is new though, is the attempt to deal with them simultaneously, in order that innovations may be classified according to differences in configurations. Such classification is a precursor to generating possible new insights into the phenomenon of innovation (Crossan et al., 1999). It is an assumption of this research that it might be reasonable to assume the existence of different types of innovation based on different configurations of the presence, absence or degree of each of the 13 attributes that make up the framework when applied to a sample of innovations. These attributes have been operationalised into a 56-item survey instrument which has been applied to a sample of 310 innovations in the NHS. The process by which the instrument is applied, the method of analysis and results are the subjects of the following two chapters.

- 151 -
8 CLASSIFICATION BY CLUSTER ANALYSIS
8.1 Introduction Through the discovery and explication of a taxonomy based on a multidimensional conceptualisation of innovation, one objective of this research is to develop new insights into the processes of innovation. The underlying logic of this research is based on the proposition that in much of the innovation literature the innovation as unit of analysis has been under-specified. The argument, developed in previous chapters, suggests that a comprehensively specified unit of analysis, more capable of capturing the multiple ways in which innovations are perceived, will liberate researchers from understandable, but arguably limited, conceptualisations of innovation. Underpinning the research is a theoretically developed and empirically validated framework of innovation artefact. The framework has been operationalised by combining new measures with pre-existing, pre-validated scales in a 56-item survey instrument (see Appendix five) based on Likert responses on a scale of 1-7. 310 copies of the instrument were distributed to innovators in the NHS and met with a 63.2% (n=196) response rate. A data matrix of 10,976 data points from 196 responses across 56 variables has consequently been generated. As demonstrated in the pilot study, repertory grid technique also generates such data matrices. Both qualitative (e.g. visual inspection) and statistical analyses can be performed on informants’ grids in order to identify patterns in the data (Langan-Fox et al., 2000). However, grids generated by repertory grid technique generally are of manageable proportions, as both elements and constructs tend to be limited in number, and amenable to at least cursory visual inspection. The largest data matrix generated in Phase I of the study consisted of seven elements and 12 constructs, a total of 84 data points. With 10,976 data points generated in Phase II, a more sophisticated approach to pattern searching in large quantities of data is needed. Cluster analysis is one such technique and offers the researcher significant benefits in managing large amounts of data and reducing it into meaningful categories or groups about which observations might be made or hypotheses developed. Cluster analysis is a generic term for a collection of statistical methods for dealing with multivariate data pertaining to individual entities (or cases, objects, items or members) in order to assign entities from a population to clusters (or groups, categories or classes) (Everitt et al., 2001). Unlike other statistical methods for classification, such as discriminant analysis, cluster analysis makes no prior assumptions about important differences within a population. Cluster analysis is a purely empirical method of classification and as such is an inductive technique that explicitly attempts to classify. Aldenderfer and Blashfield (1984) describe four principal applications for cluster analysis: • The development of a typology or classification; • Investigation of useful conceptual schemes for grouping entities;

- 152 -
• Hypothesis generation through data exploration; and, • Hypothesis testing. In this research the objective is to develop a classification of innovation artefact based on attributes and use that classification as the conceptual basis for further research. This objective reflects the first two applications identified in Aldenderfer and Blashfield’s (1984) list. Whilst cluster analysis is a powerful exploratory tool for determining patterns or structures in quantities of multivariate data, it has been criticised for lacking any strong statistical basis and is therefore vulnerable to researcher subjectivity. Users are strongly recommended to make explicit the steps they take in applying the technique, why certain selection(s) have been made and the implications for research results (Aldenderfer and Blashfield, 1984). This chapter reviews the techniques of cluster analysis and, in doing so, specifies the design of cluster analysis for this particular study.
8.2 Cluster analysis Classification, through the identification of structuring or patterning in data, is one means by which sense can be made out of diversity in the natural and social sciences. Unlike many other statistical procedures, cluster analysis methods are mostly used when a priori hypotheses regarding that diversity are not available, and when research is still in the exploratory phase. Its origins are somewhat obscure, some authorities claiming that it originates in the biological sciences (Hair et al., 1998) others in psychology (Bailey, 1994). Aldenderfer and Blashfield (1984) attribute the credit for stimulating the development of many clustering methods to Sokal and Sneath (1963), two biologists, following the publication of their book Principles of Numerical Taxonomy in 1963. It is clear that the approach has been used in a variety of different contexts including engineering and the management sciences. Each application of the method has the common objective of partitioning data observations into homogenous groups (clusters) based on their proximity to each other in order to find distinct groupings or natural relationships (Hair et al., 1998). Cluster analysis seeks to maximise homogeneity within clusters whilst simultaneously maximising heterogeneity between clusters. In the resultant clustering, individuals within a cluster are more similar to each other than they are to individuals in other clusters. Cluster members will share characteristics in common and so it is that clusters describe, in terms of the input data, the class to which its members belong. It is then possible to make inferences about the characteristics of members and, what distinguishes one cluster from another. Clustering techniques use measures of distance (dissimilarity) or resemblance (similarity) between objects, which can be either individual entities or the emergent groupings. As a measure of correspondence between objects to be clustered, the concept of ‘similarity of’ or ‘distance between’ items, is central to the process. These ideas are more fully developed in Chapter four but, in brief, two cases are identical where they share the same scores on the range of variables. Absence of

- 153 -
correspondence of variables can be construed as distance or dissimilarity. These distances can be based on a single dimension or multiple dimensions. There are so many disparate approaches to cluster analysis (Bailey, 1994) that it is impossible to evaluate each one of them in this chapter. As Sneath and Sokal (1973; 202) suggest “The difficulty of outlining the major kinds of approaches to clustering biological data is compounded by the inability of workers in the field to arrive at a logical system of classification of clustering methods”. Discussion of approaches to cluster analysis must perforce be abbreviated. Cluster analysis can be characterised by two dominant technical methods: hierarchical and non-hierarchical methods10. The former method groups individual members into clusters on the basis of shared characteristics so that within clusters homogeneity is sought. The latter method assigns new observations to one of a known number of groups whose existence has been established a priori (for example on the basis of theory). Both approaches are discussed below.
8.2.1 Hierarchical techniques Hierarchical techniques make no a priori assumptions regarding numbers or structures of groups present in the raw data, their objective is, instead, to identify structure and groups on the basis of similarities observable in the sample. Hierarchical techniques, so-called because they construct in step-like fashion, tree-and-branch-like graphical representations (see figure 8-1) of data based on combining or dividing entities into clusters, can be either agglomerative or divisive. Agglomerative techniques begin with each entity as an individual existing in a cluster that comprises only itself. That is, a sample comprising n entities will, prior to the first iteration of the clustering algorithm, consist of n clusters. After the first iteration there will be n-1 clusters, as the two entities judged to be in closest proximity to each other are fused into a single cluster. Following the second application of the amalgamating algorithm, n-2 clusters will be formed, and so forth ultimately reaching the point at which all entities within the population have been joined into a single cluster, all previous results having become progressively nested in the results of later stages. As the process progresses, internal homogeneity within clusters (within-cluster variance) and external heterogeneity between clusters (between-cluster variance) is sacrificed. Divisive techniques share a similar approach but the process operates in reverse, starting with n entities grouped into a single cluster and then dividing to two, three and finally to n clusters. The (de-)clustering algorithm sheds those entities that are most dissimilar from those in the parent cluster(s) into smaller clusters. Both agglomerative and divisive techniques can be diagrammatically represented by the dendrogram (see figure 8-1) which is an important graphical aid to interpreting the output of the clustering process. In fact, the dendrogram is a graphical representation
10 There are other quantitative techniques of cluster analysis, space though, does not permit a full discussion. However, Bailey (1994) provides excellent background on alternative and more specialist approaches.

- 154 -
Figure 8-1: Dendrogram illustrating hierarchical clustering (fictional data) of the ‘agglomeration schedule’ which is a numerical expression of the cluster solution. Table 8-1 presents an illustrative agglomeration schedule comprising fictional data. Column number 1 gives each stage in the clustering process a number. So, at stage 1, the first iteration of the process, the first items to be clustered are items 6 and 10 which are judged, according to pre-specified criteria, to be most similar. As items that have been clustered items 6 and 10 now come to be regarded as a single cluster. This new cluster retains the label of the lowest numbered item to have been clustered and so, retains the label ‘6’. It will be noted that cluster 6 reappears at stages 3 and 11. At stage 3 it is clustered with item 9, and retains the label 6 (so after stage 3, the cluster
0
5
10
15
20
25
Item number
Dis
tanc
e be
twee
n cl
uste
rs
1
2
3
4
5
Num
ber of cluster solutions
14
Agglomerative
Divisive
6 10 9 1 3 7 2 14 8 11 12 13 4 5

- 155 -
Cluster
Combined Stage Cluster First Appears
Stage Cluster 1
Cluster 2
Agglomeration (similarity) Coefficient Cluster
1 Cluster 2
Next Stage
% change in agglomeration coefficient
Number of cluster solutions
1 6 10 5.000 0 0 3 190.00 13 2 3 7 14.500 0 0 4 66.67 12 3 6 9 24.167 1 0 11 51.72 11 4 2 3 36.667 0 2 6 45.00 10 5 8 11 53.167 0 0 7 34.80 9 6 2 14 71.667 4 0 9 28.14 8 7 8 12 91.833 5 0 8 33.30 7 8 8 13 122.417 7 0 9 28.28 6 9 2 8 157.042 6 8 10 27.35 5 10 2 4 200.000 9 0 12 102.92 4 11 1 6 405.833 0 3 12 69.19 3 12 1 2 686.615 11 10 13 61.89 2 13 1 5 1111.571 12 0 0 -- 1 1 2 3 4 5 6 7 8 9
Column number
Table 8-1: Illustration of an agglomeration schedule (fictional data)
contains items 6, 9 and 10, and retains the label ‘6’). At stage 11 cluster 6 is fused with item 1. Stage 11 is the first appearance of item 1. This is self evident in a short agglomeration schedule as in this example. However, where there are many hundreds of stages an item’s first appearance can also helpfully be recognised by a ‘0’ in either column 5 or column 6. Thus, it can be seen from column 6 that item 5 makes its first appearance in the final clustering stage of the process. That is, item 5 exists on its own until the very last stage of clustering. And so, columns 5 and 6 are useful in identifying the occurrence of outliers. When the data contain a clear ‘structure’, in terms of clusters of objects that are similar to each other, then this clarity of structure will be reflected in the numerical representation. Analysis of the agglomeration schedule can uncover any such structure. Column 8 presents the percentage change in the agglomeration coefficient as the process moves from stage to stage. A large jump in the value of the percentage change, compared to previous values, indicates a possible cluster solution. This can be further graphically represented as a plot (see figure 8-2). The approach claims that the point immediately preceding steep upward curve gradients of the distance coefficient (or downwards for similarity coefficients) indicates the optimal stopping point for cluster solutions. Prior to this ‘kink’ in the data curve, flatness of the curve indicates that rules governing heterogeneity are not being relaxed and that objects being fused are similar to each other. The steepness of the gradient, which is a graphical representation of a large change in the amalgamating coefficient, is indicative of the rate of change in distance between the two clusters being fused. That is, it suggests that for the two clusters to be fused the rules governing between-group heterogeneity must be relaxed more than was the case in previous iterations, thereby indicating greater levels of distance between clusters. This may provide a useful visual aid in the identification of discrete groups or clusters.

- 156 -
Figure 8-2: Graphical plot of agglomeration schedule (fictional data) Through the analysis of dendrogram, agglomeration schedule and graphical plot, possible cluster solutions may be identified. In the instance of the fictional presentation from figure 8-2, the steepness of the gradient would suggest a 5-cluster solution. However, the 5-cluster solution in this case would comprise one cluster with eight members (items 2, 3, 7, 8, 11, 12, 13 and 14), one with three members (items 6, 9 and 10) and three clusters each with one member (items 1, 4 and 5), see figure 8-1. Whether or not such a solution makes sense will depend on the nature of the data, the objectives of the study and the interpretation of the researcher. As a rule of thumb though, such a preponderance of outliers in the final solution would be cause for a re-examination of the analysis. All solutions are plausible depending on the context of the data and the method. Importantly though, guidelines exist to assist the researcher in deciding upon a preferred solution; these are discussed later in this chapter.
8.2.2 Non-hierarchical techniques Hair et al. (1998) report that hierarchical procedures are giving way to non-hierarchical procedures in popularity of application. This is partly due to advances in computing power but also because of limitations of hierarchical techniques (see section 8.10, limitations of cluster analysis). Hierarchical processes start without any strong theoretical underpinning, rather the algorithm is left to determine the extent and nature of clustering. Non-hierarchical methods may be underpinned by theory and are iterative. Data are partitioned into a pre-specified number of clusters that have been determined a priori. The ‘seed points’ from which clusters are initially developed originate either from theoretical
0
20
40
60
80
100
120
2 3 4 5 6 7 8
Number of cluster solutions
Perc
enta
ge c
hang
e in
agg
lom
erat
ion
coef
ficie
nt
Agglomeration coefficient

- 157 -
justification, the use of a solution from a hierarchical process or by educated guesswork. Observations are assigned and reassigned to clusters whose centroid (mean of variables within the cluster) they most closely match. Centroids are recalculated following each new iteration (assignment of an object to a cluster) according to a clustering algorithm, until the process is terminated by the application of a stopping rule (e.g. all items are assigned to clusters). K-means clustering is a popular non-hierarchical method, so-called because it partitions data into a set of ‘k’ clusters so as to minimise the distance of cases from cluster means. The standard approach to K-means clustering was first described by MacQueen (1967) and is as follows: • Select initial seed-points. This determines the initial centres around which clusters
are formed and specifies the final number of cluster solutions. • Calculate the distance of each entity from the cluster mean point and assign entities
to clusters where that distance is the minimal. • Following the assignment of new entities to any cluster, re-calculate the cluster
mean. • Continue to repeat steps 2 and 3 until such time that all entities are assigned and
cluster means have stabilised. K-means analysis clusters on the basis of establishing minimum distances of cases from cluster means in a way that hierarchical methods cannot achieve. K-means manages this by recalculating cluster means after each iteration. This contrasts with the static nature of some hierarchical processes in which cluster means are not recalculated. For this reason many authorities (Belson, 1986; Friar, 1995; Milligan, 1996; Ketchen and Shook, 1996; Hair et al., 1998) recommend the use of non-hierarchical clustering to refine solutions derived from a hierarchical process. This research proposes to follow this recommendation. Decisions, therefore, need to be made with regard to which hierarchical clustering method(s) to use and the determination of similarity. The options are discussed in the following sections.
8.3 Selection of (Dis)Similarity Measures Hair et al. (1998) identify three approaches to measuring similarity: correlational, distance and association measures. Correlational and distance measures require metric data where data are continuous, association measures are suited to nonmetric data. The use of Likert scaling, conceived of as quasi-interval data, (see section – standardisation of variables, below) dictates a choice between correlational and distance measures. The difference between correlational and distance measures is that the former measure patterns across variables, the latter magnitudes. Correlational and distance measures require different interpretations because distance-based clusters have similar values across the set of variables, but not necessarily sharing any similarity of pattern (curve shape on a graph, i.e. relationship) whereas correlational-based measures have similar patterns but not necessarily the same values. These are illustrated in figure 8-3, below.

- 158 -
Figure 8-3: Comparison of distance and correlational measures
Correlational measures tend to be less frequently used in cluster analysis because researcher interest tends to be in similarities in the magnitude of responses to variables rather than curve relationships (Hair et al., 1998). However, the current research makes no assumptions about the nature of the optimal solution whether or not it is based on magnitude (the mean score of the variables over the whole case) or on profile (the shape of the curve describing variables across the case). And, so, for this exploratory study both approaches are considered valid. The most commonly utilised distance measure for cluster analysis is Euclidean distance, or its variant Squared Euclidean distance (which tends to emphasise the influence of outliers). These simply measure the geometric distance in a multidimensional space.
(A) Magnitude similarity, similar means
0
1
2
3
4
5
6
7
1 2 3 4 5 6 7 8 9 10
Variables
Like
rt s
core
Item 1 (mean=4) Item 2 (mean=4)
(B) Correlational similarity, similar curves
0
1
2
3
4
5
6
7
1 2 3 4 5 6 7 8 9 10
Variables
Like
rt s
core
Item 1 (mean=1.5) Item 2 (mean=5.5)

- 159 -
Euclidean distance is a dissimilarity measure for continuous data which can be used for measuring distances based on Likert scale data. The distance between two items i and j (dij) is the square root of the sum of the squared differences in values for each variable and is defined as: where dij = the distance between items i and j, xik and xjk = the kth variable value of the p-dimensional observations for individuals i and j, respectively. The only way dij can be zero is if the two objects are identical in value on all variables. As dij gets larger it signifies that i and j are farther apart on one or more of the variables, and so increasingly dissimilar. Euclidean (and squared Euclidean) distances are usually computed from raw data. Depending on the nature of the raw data this can be problematic. Where raw data combines several different scales among the dimensions from which the distances are computed (e.g. height, weight, marital status) the measure can be sensitive to scalar differences. Under such circumstances algorithms exist that permit the standardisation of scales and variables. This method has certain advantages (specifically, the distance between any two objects is not affected by the addition of new objects to the analysis, which may be outliers). Milligan’s (1996) comparison of similarity measures reported Euclidean distance measures and its variant to provide consistently acceptable results, which, in large part, may explain their widespread use as the distance measure of choice in many cluster analyses.
8.4 Selection of Amalgamation Rules
8.4.1 Hierarchical methods Having established how similarity is to be determined, a decision must be taken on the rules that govern the way in which items are joined together. Several alternatives exist and these are synopsised in table 8-2. Each strives, in a different way, to maximise the distance between clusters whilst simultaneously minimising the distance between items within clusters. Milligan (1996) reviews the recovery performance (the ability of the process to surface clusters from raw data) of a wide range of clustering methods under error-free (data with a known, clear structure) and error-perturbed conditions and suggests that the preferred method is Ward's method (Ward, 1963) used in conjunction with Squared
∑ (xik - xjk)
2
p
k=1 dij =

- 160 -
Euclidean measure of distance. Ward’s method and squared Euclidean distance are therefore adopted as the favoured approach for this analysis. Cluster Method Description Nearest neighbour or single-linkage
The shortest distance between any two clusters is the distance between any point in one cluster to any point in another cluster (i.e. nearest-neighbours). Objects separated by the shortest distance are joined together to form a cluster. Biggest disadvantage of the technique is its tendency to string objects together to form clusters, and the resulting clusters tend to be ‘string-like chains’ that can be indistinct. Also exhibits an item rather than cluster orientation. It is commonly used with standardised data.
Furthest neighbour or complete linkage or diameter method
The distances between clusters is determined by the greatest distance between any two objects in the different clusters (i.e. ‘furthest neighbours’). The method performs well when the objects form naturally distinct groups. However, the method determines similarity based on the similarity of the least similar pair of objects within a cluster. This is suggestive of an item rather than cluster orientation.
Averaging methods Attempts to overcome item-oriented bias of nearest and furthest neighbour methods by obviating reliance on extreme (nearest/furthest) measures. Calculates distance based on comparison of average distances between objects within clusters. Average linkage techniques from which to select include: Between-groups linkage – average distance calculated from the distance between each point in a cluster and all other points in a cluster. The two clusters with the lowest average distance are joined to form a new cluster. Within-groups linkage – clusters are fused so that within-cluster variance is minimised. Tends to produce tighter clusters than between-group linkage. Centroid clustering - Identifies the ‘centre-point’ within a cluster from the mean values of observations in the cluster. Each time a new cluster is formed a new centroid is formed. Can produce messy and confusing results but is less affected by outliers than other hierarchical methods. Distances between clusters measured from centroid to centroid. Very efficient when objects form distinct clusters, also performs well with ‘chain-like’ clusters.
Ward’s method Each object is initially treated as a cluster of one. Then objects are successively combined. The criterion for combination is that the within-cluster-variation as measured by the sum of within-cluster deviation from cluster means (error sum of squares) is minimised. Thus, the average distances among all members of the cluster are minimised (Bailey, 1994). Tends to be regarded as a very efficient method, though does also tend to be biased toward producing clusters of approximately the same size which often are small.
Table 8-2: Comparison of popularly used11 clustering procedures (adapted from Aldenderfer and Blashfield, 1984; Milligan, 1996; Hair et al., 1998)
8.4.2 Non hierarchical methods The literature on non-hierarchical methods is not as extensive as that for hierarchical methods. Milligan (1996) once again provides advice. His observation is that K-Means algorithms differ in their recovery quality depending on the quality of the initial seed points. When rational12 starting seeds were used recovery performance was greatly improved (Milligan, 1996; 360). This was confirmed in Roth’s (1992) study of configuration and co-ordination archetypes for medium-sized firms. Thus, the preferred cluster solution from a hierarchical method may be refined by K-Means analysis. Having selected the rules that will govern the assignment of individual entities to clusters the process of their application needs to be explicated. 11 Aldenderfer & Blashfield (1984) identify 12 different approaches 12 Rational seeds are centroids recovered from a hierarchical process

- 161 -
8.5 Processes of Cluster Analysis Authors are mostly consistent in their prescriptions of the process of cluster analysis. Discrepancies can often be accounted for in terms of different research objectives and/or differences in data. Table 8-3 compares the cluster analysis design proposed for the current research against the prescriptions of Hair et al. (1998) and Milligan (1996). Because of the range of methods from which to choose and the absence of clear rules for making decisions regarding method selection Milligan (1996; 342) strongly recommends that “applied users of clustering technology clearly indicate in their reports the specific actions taken for each step in a cluster analysis” as this provides an audit trail. The remainder of this chapter elaborates on those stages of the proposed design not already discussed, specifically stages 1, 2, 3, 6 and 7 as illustrated in table 8-3.
Stage Hair et al. (1998) Milligan (1996) Proposed design (1) Research problem,
defining objectives, select clustering variables
Select clustering elements: what are the entities that are going to be clustered
Specification of research objective: an empirically based classification of innovation
(2) Address research design issues: treatment of outliers, standardisation of measures
Select clustering variables Select variables: Variables drawn from theoretically-derived and empirically developed framework of innovation form the basis for clustering
(3) Clarification of assumptions: representativeness, multicollinearity
Variable standardisation: do variables need to be standardised to a scale
Clarify cluster analysis design issues: Sample issues Standardisation of measures Multicollinearity Outliers Stopping rules Competing methods Stability of solutions
(4) Select clustering algorithm Select measure of association (similarity)
Selection of similarity measure: Squared Euclidean Distance
(5) Interpret the clusters: of what do they consist?
Select clustering method Selection of amalgamation rules: Hierarchical (furthest neighbour, within-groups, Ward’s method, Pearson correlation) Select preferred solution Refine with non-hierarchical (K-means)
(6) Validate and profile clusters
Identify number of cluster solutions: a priori or by stopping rules
Analysis and validation: Monte Carlo simulations Split-half test/replication ANOVA
(7) - Interpretation, testing, and replication.
Interpretation and profiling
Table 8-3: Comparisons of cluster analysis design in this research against the prescriptions of Hair et al. (1998) and Milligan (1996)
8.6 Specification of Research Objective The research objective has already been established in previous chapters. The objective is to develop from unclassified data an empirically based classification of innovation artefact based on a theoretically derived and empirically developed sensitive measure. This new taxonomy will form the basis of further study into relations between process and innovation type where ‘type’ is construed in terms of configurations of attributes of artefact.

- 162 -
8.7 Selection of Variables Because cluster analysis derives the most internally consistent groups across all variables, erroneous, aberrant or irrelevant variables can cause a deterioration of a solution's validity (Ketchen and Shook, 1996). The choice of the variables by which clusters will be formed is, therefore, one of the most important steps in the process of cluster analysis (Aldenderfer and Blashfield, 1984). As Milligan (1996; 348) states “a variable should be included only if a strong justification exists that the variable helps define the underlying cluster”. Previous chapters attempt to establish that attributes are a warranted basis for describing and discriminating between innovations. The origination of the selected variables is described fully in these chapters. These are items that have been developed through the synthesis of empirical and theoretical attributes of innovation into sensitive framework that strikes a balance between parsimony and maximising the likelihood of discovering meaningful differences through the operationalisation of multiple valid variables.
8.8 Cluster Analysis Design Issues This sub-section describes factors that have to be taken into account in designing a cluster analysis procedure. The sub-section concludes with a brief discussion of the chosen cluster analysis design.
8.8.1 Sample issues Cluster analysis is not a widely used method in innovation studies and so it has been necessary to look to studies in other areas of the management sciences, where it has been used, for guidance as to appropriateness of sample size. It is a method that has some history of use in strategic management research and also in organisational research. In two separate studies of strategic groups Reger and Huff (1993) performed cluster analysis on the repertory grids of 23 informants and Harrigan (1985) ran cluster analysis on 92 retail establishments. In organisational research Roth (1992) clustered 126 medium-sized firms and identified 5 distinct archetypes whilst Ketchen et al.’s (Ketchen and Shook, 1996) longitudinal study of organisational configuration and performance analysed data from between 69 and 85 hospitals. Bierly and Chakrabarti (1996) use cluster analysis in a longitudinal study of 21 pharmaceutical companies to identify groups of firms with similar generic knowledge strategies, determine how these strategies change over time, and compare profit margins of the groups. In innovation studies Poole et al. (2000) commend cluster analysis for identifying patterns in process studies, de Brentani (1995) clustered 276 cases of project success and failure, Joyce and Stivers (1999) 254 firms according to knowledge/innovation relationships and, Teng et al. (2002) 20 information technology innovations across 313 large American firms. Finally, Avlonitis et al. (2001) identified six distinct types of service innovativeness from the analysis of 132 service cases. From this short review it would appear that the literature is not prescriptive about sample size. Ketchen and Shook’s (1996) authoritative review of the application of cluster analysis in strategic management research makes no mention of the subject, nor do authorities such as Sneath and Sokal (1973) or Aldenderfer and Blashfield (1984). Wishart (1987) provides some guidance on sample size, inferring that fewer than 40 cases is small and that more than 150 is large. Clearly this is an observation made in

- 163 -
the context of the ability of individual techniques to deal with small or large numbers of data. The method is principally associated with exploratory research and is not an inferential technique, so, arguably, sample size is not particularly an issue. Instead the criterion by which assurance of confidence would seem to be established is the appropriateness of the sample size and response rates for the sort of investigation being undertaken. Even so, it should be noted that small samples are vulnerable to the influence of outliers, whereas large samples generate data matrices that may be difficult to manage. Of the sample being used in this study no claims of representativeness can or will be made other than to say it is representative of itself. The view of Hair et al. (1998; 490) is that cases are obtained and clusters derived “in the hope that they represent the structure of the population”. The view appears to be based on the assumption that the population and its structure are known a priori in order that a representative sample can be generated. This seems rather to overlook one of the principal applications of cluster analysis, which is as an exploratory device or, as Bailey (1994) describes it, pre-theoretical. This research locates itself as exploratory and contends that the sample is sufficient for exploratory purposes. Efforts have been made to draw the sample from a variety of sources and response rate has been encouraging (63.2%). As such, and notwithstanding issues of non-response bias, we can be confident that the results generated are likely to reflect the structure to be found in the sample population. As such results may form the basis for a series of propositions about innovation types that can be explored, refined and tested in future research.
8.8.2 Standardisation of measures 8.8.2.1 Variables Hair et al. (1998) report that distance measures are sensitive to the scales describing variables because these analyses utilise standard deviations and squared values. Where different variable scales are employed this can be a significant issue. For example, scales that included income in thousands of pounds, perceptions on a 1-7 scale and age in years will produce variances that are likely to differ markedly, and, possibly, unduly weight one variable at the expense of others. In such circumstances rescaling of data to a standard measure is thought to be appropriate. The basis for measuring perceptions of outcome throughout the survey instrument is a seven-point Likert scale. This establishes constancy of scale and so neither standardisation nor manipulation are thought to be necessary. However, the use of Likert scaling raises another important issue (see subsection Scales, below). 8.8.2.2 Weighting The research instrument probes the 13 attributes of innovation as described in the innovation framework. A series of statements (ranging from two to seven) is attached to each attribute to which responses are solicited. Undue influence in the cluster analysis process may be exerted by those attributes to which a larger number of statements is attached. For example, the attribute ‘observability’, to which two statements are attached, exerts a weaker influence in the clustering process than does

- 164 -
the attribute ‘complexity’, to which seven statements are attached. That is, the variables in the instrument are unevenly weighted. One method of reducing variables to an equal number is to subject them to principal component analysis with orthogonal rotation and using the resultant uncorrelated factor scores for each observation as the basis for clustering (Hair et al., 1998). Such an approach may result in a less than optimal set of clusters and consequently the technique is not strongly recommended (Ketchen and Shook, 1996). A simpler and less controversial approach is adopted for this study and the means of the statements attached to each attribute will form the basis of initial hierarchical clustering. This reduces the number of variables from 56 to 13 and results in a matrix of 2,548 data points (13 variables x 196 responses). Analyses will, however, also be run on the unconsolidated data (56 items) of the survey instrument. These analyses will provide a touchstone against which to compare the results of the consolidated analyses. Arguably, if there is clear structure in the data, the results of unconsolidated and consolidated analyses might be expected to have some features in common and the underlying structure be evident in both analyses. Unconsolidated data therefore has a role in validating the analysis. 8.8.2.3 Scales Likert scales are non-parametric or categorical scales. Strictly speaking the mathematical processes of cluster analysis are based on the presumption of interval data (a fixed zero point and a constant interval between points). Likert scales generate ordinal data in which the different values of the scale are not separated by equal increments. This begs the question, ‘To what extent can Likert data justifiably be used as a basis for cluster analysis?’. First, Abelson and Tukey (1970) argued that ordered metric data, where absolute differences between categories are not clear, can be considered as interval level data for most statistical purposes. Second, there appears to be a convention in cluster analysis to treat Likert scales as though they were interval scales. Precedents have been established in the literature for the treatment of categorical scales as 'being like' interval scales, (for example Roth, 1992). Additionally, some statistical authorities condone the approach (Norman and Streiner, 2000). The ‘help’ files in SPSS® v11.0 (the software used for the analysis in this research) state that Likert-type scales are 'close enough' to interval data to make the assumption reasonable and that strong relationships will not be distorted no matter what technique is used. It might be further argued that strong anchoring at the end and mid-points helps contribute an interval-type quality to the scale. The end-point anchors in this instrument are ‘strongly agree’ and ‘strongly disagree’, with ‘neutral’ as the mid-point. Clearly these are not absolute points, but they do provide a largely stable template for the framing of responses. In order to further ensure the validity of treating Likert scales as interval data, separate enquiries were made of SPSS® technical help, Cranfield University and, the

- 165 -
Department of Applied Statistics at the University of Reading. With permission, their responses were, first from SPSS®:
Ordinal variables like 1-5 rating scales are often used in Clustering as they are generally considered 'close enough' to interval data, and there seems to be no problem with this. Therefore, I guess it won't affect the validity at all (especially as it appears to be quite a statistically vague technique anyway) Evi Pournara MSc. Technical Support Analyst
Second, from Cranfield University:
I don’t see a problem with regarding these scales as being quasi-interval. They are well anchored at either end. I think there are more important issues in cluster analysis than whether or not the scales can be regarded as interval.
Dr J Towriss Lecturer in Logistics and Transportation
Third, from The University of Reading:
If the seven point scale is ordinal and you have coded the seven possible answers as 1,2,....,7, there is no serious problem in using it as an interval scale for the purpose of cluster analysis. I myself would be happy to use even a 5-point ordered scale as interval scale for cluster analysis. Remember that cluster analysis is just a descriptive technique and as such I don't see a great problem in simple approximations of this sort. Dr S. Abeyasekera Principal Statistician
Treating Likert scales as interval data seems, therefore, to be acceptable for the purposes of cluster analysis, indeed no objections have been found. The debate regarding the use of Likert scaling in Cluster Analysis has been deliberately laboured to this point in order to highlight a limitation of the Cluster Analysis method. Limitations are dealt with more fully in section 8.10, but the previous debate is illustrative of the extent to which researchers must be cautious not to over-claim on the basis of results found. 8.8.2.4 Item reversal The innovator’s perception of his or her innovation in this study is described by Likert scores on each of the 13 attributes of the framework. However, in order to avoid the use of potentially confusing statements some statements are reverse coded. High attribute scores (i.e. closer to 7 on the Likert scale), as rated by individual innovators, reflect the perception that the innovation has relatively more or a higher level of that attribute (for example, the innovation is perceived to be very complex or to have a higher profile). See tables in Chapter seven for details of reversed items.

- 166 -
8.8.3 Multicollinearity Multicollinearity exists where correlation amongst independent variables is strong, it is the extent to which a variable can be explained by other variables in the analysis. Norman and Streiner (2000) suggest that where the multiple correlation between one variable and a set of others is in the range of 0.9 or greater then multicollinearity can be said to exist. In cluster analysis multicollinearity can be problematic because it may exert undue influence on or over-emphasise one or more underlying construct (Ketchen and Shook, 1996) thereby distorting the shape of clusters. If multicollinearity or uneven weighting is thought to be problem two options exist: • Reduce variables to an equal number (Hair et al., 1998). • Use a compensatory distance measure such as Mahalanobis distance (Ketchen and
Shook, 1996; Hair et al., 1998).
8.8.4 Outliers Outliers are those items that do not fit easily into any cluster (though cluster analysis will ultimately force membership upon them), typically characterised by extreme values on one or more of the variables (Hair et al., 1998). These are unique profiles that distinguish the outlying item from other items. Outliers can be identified by visual scanning of the data prior to analysis, inspection of the graphical output (see figures 8-1 and 8-2) and examination of the agglomeration schedule (see table 8-1) for entities that make their first appearance late in the process (e.g. item 5 in the fictional presentation). There are two possible reasons for the appearance of outliers. First, that they are aberrant observations and not truly representative of the sample. Second, it might be that the sample is incomplete and that under-sampling has caused an under-representation of groups. If, during the process of analysis, significant numbers of outliers are observed it may become necessary to respecify the clustering rules. Options for dealing with outliers include: • If outliers are considered to be unrepresentative of the population then they should
be eliminated from the data set - but this biases the sample (Hair et al., 1998). Not relevant as representativeness is not an issue.
• Use a clustering method that is resistant to the presence of outliers such as Ward’s method (Hair et al., 1998).
• If the first pass identifies a large number of outliers remove the outliers from the data set and run the test again (Ketchen and Shook, 1996).
Average linkage methods and Ward’s method are reported to perform best at structure recovery in data where outliers are present (Aldenderfer and Blashfield, 1984).
8.8.5 Stopping Rules Hierarchical methods are not designed to determine a specific number of clusters in the data and consequently methods, so-called ‘stopping rules’, for determining a level of

- 167 -
cluster solution are necessary. The hierarchical method results in a number of solutions, from one (1) cluster to as many entities (n) as there are in the sample. As the number of solutions moves from n to 1, homogeneity within clusters decreases. Homogeneity is at its maximum with n clusters (i.e. all entities exist in their own individual cluster) and at its minimum with 1 cluster. Neither a maximum nor minimum solution reveals much regarding the structure or types within a sample, however the reasons for selecting a solution that lies anywhere between n and 1 need to be explicated. Choice of stopping rule is largely subjective and tends to be guided by rules of thumb. These rules of thumb tend, largely, to revolve around the tension between delivering a parsimonious manageable cluster solution, that favours fewer clusters, and maintaining a realistic perspective on homogeneity within clusters that favours more clusters. Milligan and Cooper (1985) identify and review over 30 different stopping rules. The study concluded that there was a wide range of effectiveness of the rules and that no single rule has been shown to be better in all circumstances than any other. There are various heuristic aids to making stopping decisions: visual inspection of the dendrogram, interpretation of graphical presentations of number of cluster solutions against changes in agglomeration coefficients and visual inspection of agglomeration schedule. In the absence of any completely satisfactory methods for determining the number of clusters for analysis decisions for this study are made on the following grounds: • Parsimony and Manageability. A manageable cluster solution of between two and
six clusters is preferred, though as well as being manageable the solution must also make sense within the context of the data (Milligan, 1996).
• Patterning. Decisions can be taken where distinct kinks in the data patterns are
observable. Visual inspection of a dendrogram, searching for differentiation in its branches, will indicate sudden jumps in the level of similarity as dissimilar groups are fused. Small coefficients and small increments between coefficients in the agglomeration schedule indicate that relatively homogenous clusters are being merged. However, two very different clusters being merged would result in either a large coefficient or, a noticeably large increase in the distance between the previous and following coefficient (compared to size of previous transitions). A large increase implies that dissimilar clusters have been merged thus the number of clusters prior to the merger suggests the possibility of an appropriate solution.
Non-hierarchical techniques pre-specify the number of clusters to be formed according to a priori criteria and consequently stopping rules do not become an issue. In one sense, the problem of the absence of clear stopping rules is not as intractable as first it might seem. It has been argued (Aldenderfer and Blashfield, 1984) that, in instances where the goal of the technique is to explore patterns, structures and relationships in the data, weak solution prescription should not be considered a hindrance as it allows the researcher some latitude in uncovering the most meaningful

- 168 -
solution. However, the range of solution possibilities afforded by the techniques requires that the researcher be explicit about (1) how the preferred solution was selected and (2) the validation of the selected solution.
8.8.6 Competing solutions Arabie and Hubert (1996) remind the researcher that most methods of clustering are deterministic and will produce a cluster solution regardless of natural structure existing in the data. Furthermore, different methods will produce different solutions based on the same data (Aldenderfer and Blashfield, 1984). It is reasonable, therefore, that different solutions will be generated by different methods, from the same raw data. Aldenderfer and Blashfield (1984) present worked examples of four agglomeration techniques with data whose structure is known a priori. They illustrate that each technique generates a different solution and that Ward’s method performs best at group recovery, though not perfectly. Consequently, different solutions does not necessarily mean unstable solutions, though it may suggest that solution reliability is lessened. Reger and Huff (1993) use cluster analysis to determine the existence of strategic groups. As a control against the tendency of cluster analysis to reduce data to the status of discrete groups regardless, or not, of the existence of such structure in the data, they report using three different clustering methods. The test is against one asserted weakness of the cluster approach in that the resultant clusters are an artefact of the clustering process rather than a reflection of data structure. The multiple approach adopted by Reger and Huff is a common and recommended strategy. The approach is justified that “[I]f all three clustering methods give similar results using multiple criteria, confidence that the groups are an inherent part of the data and not an artifact of the particular clustering algorithm is increased” (Reger and Huff, 1993; 109). This justification arguably suggests a difference of opinion amongst users of cluster analysis. It has been suggested that, because they are underpinned by different assumptions, different techniques result in different cluster solutions (Aldenderfer and Blashfield, 1984; Hair et al., 1998). That is to say, groupings resulting from different clustering methods may differ from one another but the divergence does not necessarily imply the absence of a grouping reflecting ‘reality’ rather than groupings that are artefacts of the process. Conversely, Reger and Huff (1993) appear to suggest that constancy of solution across methods increases our confidence that the groups are ‘real’ and not an artefact of the data. Because of the different assumptions underpinning each of the clustering techniques it is reasonable to expect some variance between cluster solutions, but data with strong underlying structure might also be expected to retain its fundamental shape regardless of the chosen technique. Both arguments are persuasive. If the data is strongly structured it would appear reasonable to expect that structure to be evident in the results of different techniques, yet Aldenderfer and Blashfield’s (1984) experimentation suggests this need not necessarily be the case. Satisfactory analysis is therefore dependent, to an extent, on the subjective interpretation of the researcher being able to make sense of the results in the context of the data. This is consistent with Arabie and Hubert (1996) who suggest analysis by ‘relative criteria’ in which the researcher must decide which of the various

- 169 -
structures is better, in some sense, than other structures. Nevertheless, robustness and stability of a solution imputed by consistency across analyses cannot be gainsaid.
8.8.7 Stability of solutions Everitt et al. (2001; 4) define stability as the condition when the “classification remains the same under a wide variety of additions of organisms13 or new characteristics describing them”. Stability is particularly vulnerable where analysis is based on a small number of cases (Aldenderfer and Blashfield, 1984). Stability can be tested by dropping cases from or adding cases to the data set, or by applying a split-half test. Ketchen and Shook (1996) criticise cluster analysis because algorithms will always provide some form of hierarchical classification and so it is difficult to establish whether or not the observed clusters are ‘real’ or are just an artificial structure imposed on the data. Their critique, that solutions may not reflect real conditions but may rather be nothing more than a statistical coincidence, does not discredit the technique. Monte Carlo simulations provide some remedy as does split-half testing. Indeed, adherents to Everitt and Dunn’s (2001) maxim that the merit of any classification scheme is in its usefulness might argue the spuriousness of the critique if fresh understanding can be demonstrated to have been derived from an ‘artificial’ cluster solution.
8.9 Validation Milligan (1996; 366) suggests that many researchers fail to validate solutions “because they bring to the analysis an assumption that clusters actually do exist in the data”. But, validation needs to be conducted in order to ensure that the cluster solution is not an artefact of either the clustering procedure or of the sample (Wyatt, 2000). Indeed, the researcher must be prepared to recognise that one legitimate solution from the cluster analysis process is that the data does not structure into discrete and distinct groups – that there is no cluster solution (Everitt et al., 2001). This though, is a difficult solution to reach given the deterministic nature of the approach. A number of methods, which can be described as heuristic or formal, for the validation of solutions can be identified in the literature. Formal, statistical validation techniques are not widely used because they tend to be unreliable. Aldenderfer and Blashfield (1984; 64-65) describe two statistical techniques, cophenetic correlation (which attempts to analyse the accuracy of the dendrogram as a representation of the pattern of dis/similarity amongst the entities) and Significance tests on variables used to create the clusters. The former they describe as a “generally misleading indicator” and the latter as “useless at best and misleading at worst”. Thus both are discounted for this study. A third statistical test is significance testing on variables not used to generate the cluster solution (see chapter nine). This test is useful under certain conditions – for example investigating the nature of sub-types within an existing classification. But, given the exploratory nature of cluster analysis it might be reasonable to expect that preferred solutions do not compare favourably to existing classifications. Given that
13 They are writing from the perspective of biological and zoological taxonomic development.

- 170 -
this research is founded, at least partly, on the contention that existing classifications of innovation are under-specified, then it would be reasonable to expect that the classification generated in this study would not conform with those extant in the literature. Incongruity between the two will not necessarily invalidate either. This research will however compare against the conventional classifications of innovation (novelty and area of focus – see Chapters four and ten) and against demographic data captured by the survey instrument. A final statistical test, which is utilised in this study, is to compare variable means across clusters and against variable means for the full data set. In strongly structured data one would expect to find within-cluster variance to be minimised and between-cluster variance to be maximised, whilst also being separate from the full data set mean. Everitt et al. (2001) suggest that for non-hierarchical K-means analysis cluster solutions should not be significantly affected by selection of different seed points for the initial clusters. Though this advice might appear to contradict that of Milligan (Milligan, 1996) with regard to quality and rationality of seed point selection (see above). Consequently, the three heuristic validation techniques used in this research are, running multiple methods, a form of replication (split-half testing) and Monte Carlo simulations. Multiple methods are selected from the similarity rules and amalgamation techniques described above. Consistency of cluster solution across these tests will be taken to indicate the existence of an underlying structure in the data and imply robustness and stability of the solution. Replication and Monte Carlo simulations are described below.
8.9.1 Replication One test of the integrity of the cluster solution is to replicate the study with a second data set. The collection of two separate data sets is impractical within the parameters of this research. Split-half testing in which data are divided and subjected to the same analytic processes as the full data set overcomes this logistical limitation. Replication by split-half testing validates (or otherwise) the underlying structure of the data recovered in the analysis of the full data set. Analysis will therefore consist of two split-half tests and the full data set. Recovered patterns are compared one against the other. In order to establish the extent to which patterns are an artefact of the process they can also be compared against patterns recovered from random data, a process known as Monte Carlo simulation. Variations of replication methods, specifically tests of ‘robustness’ and ‘influence’, are recommended by Everitt et al. (2001). Robustness refers to the impact of errors in the data or missing values, and changes in data and methods. In this study entities with missing data are not included in the analysis but robustness is tested by a mixed method approach. Influence refers to the deletion of entities from the analysis and the impact of that on consequent cluster formation. It is considered that this test replicates the split-half test.

- 171 -
8.9.2 Monte Carlo Simulations Milligan (1996) describes as Monte Carlo simulations the process of running dummy data through planned cluster analysis techniques. Milligan reports these mostly in terms of testing the recovery rates of the different methods with different data types. However, they are also a useful technique as a check against the deterministic tendency of cluster analysis as they test against the possibility that similar patterns to those found in the raw data might not also be found in random data. If patterns do appear in the empirical data, how do we know that similar patterns would not also be found in random data? Using dummy data generated by Microsoft Excel® Monte Carlo simulations are run replicating the tests run on the full empirical data set. Thus the data input and processes of analysis for the Monte Carlo procedure will mimic, as closely as is possible, that for the empirical data. A number, equivalent to the number of usable returns, of dummy responses are generated and be subject to the same statistical methods and the results compared to those for the empirical analysis.
8.9.3 ANOVA analysis Comparison of variable means across clusters and against variable means for the full data set has already been identified as one test of the stability of solutions. In this test if variable means are significantly different across clusters and from the grand mean then cluster distinctiveness is indicated (Wyatt, 2000). This can be corroborated by a measure of cluster separation. In addition, the f-ratio (the ratio of cluster variance to error variance) indicates the variables that are significant in separating the clusters one from the other, the larger the f-ratio the more significant is that variable for differentiating clusters. However, the F tests are indicative only. The whole purpose of cluster analysis is to pattern heterogeneous data. As such one might expect significant f-ratios. Because the clusters have been chosen to maximize the differences among cases in different clusters, f-ratios should be used only for descriptive purposes and should not be interpreted as proofs of hypotheses.
8.10 Limitations of Cluster Analysis Simply, cluster analysis is the grouping of objects according to pre-specified criteria of proximity. Hair et al. (1998) describe the approach as atheoretical, Arabie and Hubert (1996; 7) suggest that “[f]or many statisticians, the shady history of cluster analysis is an ongoing cause for suspicion”. There is a range of limitations that has come to be associated with cluster analysis, particularly with the hierarchical approach: • In the absence of a definitive, single method there is a diversity of measures of
similarity and distance and, of amalgamation algorithms. • Different approaches are deterministic and likely to generate different cluster
solutions. • Subjectivity is required in order to select the most appropriate cluster solution. • Cluster analysis has no statistical basis on which to draw statistical inferences from
samples to populations - there is no unifying theory of clustering. Results must therefore be treated with caution.

- 172 -
• There is no universally accepted definition of the term ‘cluster’, and so a variety of techniques have been employed to determine at which point in the analysis a solution is sought (Milligan, 1996).
Any of these limitations could lead to misleading analyses and erroneous conclusions being drawn from raw data. It is down to the researcher to identify the appropriate procedure amongst competing approaches that deliver competing classifications (Hair et al., 1998). Strategies to minimise the impact of these limitations are considered in table 8-4. Weakness of the method
Implications for research Counter measure
Diversity of methods Accusations of subjectivity. Different methods offer different solutions
• Be explicit in all decision-making • Choose methods appropriate to the circumstances • Run a selection of methods concurrently
Deterministic clustering Cluster analysis will force data into clusters regardless of whether or not a natural type exists
• Apply validity testing and Monte Carlo simulations. • Replicate the analysis on subsets of the data to see if the
structures emerge consistently.
Absence of unifying theory of Cluster Analysis
Statistical inference back to a population not possible
• Inference back to a population is not a significant issue in this research, which is exploratory.
Absence of a statistical basis
Cannot make statistical inferences from a sample to a population
• Be cautious in drawing conclusions based on the sample • Do not ‘overclaim’ on the basis of the analysis
Absence of single cluster solution decision making rule
Range of techniques leads to different solution possibilities. Loss of definition at highest levels of aggregation
Be explicit in decision-making. Make stop decisions according to: • Jump method: examines the distance between clusters at each
successive step when that measure exceeds a pre-determined (according to an idiosyncratic ‘local’ rule) value or appears to make a sudden jump then this point might be deemed appropriate to identify a cluster solution. Hair et al. (1998) report that this method has been shown to provide fairly accurate decisions in empirical studies. This is really looking at the stability of the structure over distance. This can be done by eye or by reference to agglomeration coefficient.
• Statistical methods: several are available but are reportedly overly complex compared to the jump method for the marginal benefits that they bring.
• Appropriateness or Usefulness – makes sense within context of the data (Everitt and Dunn, 2001) or cluster groupings that agree with existing or expected structures.
• Manageability and utility of cluster solution
Table 8-4: Counter measures to weaknesses of cluster analysis Non-hierarchical procedures do not suffer from these limitations nor do they involve the treelike construction process. The limitations of cluster analysis oblige the researcher to endeavour to establish as rigorously as possible the validity of the results of cluster analysis in order not to detract from the valuable role the approach has in exploratory research as the basis from which propositions may be developed and hypotheses tested.
8.11 Cluster analysis design specification Ultimately, Hair et al. (1998; 499) conclude that in the final analysis “it is probably best to compute a number of different cluster solutions and then decide among the alternative solutions by using prior criteria, practical judgement, common sense or

- 173 -
theoretical foundations”. This view is widely supported in the literature, (for example Reger and Huff, 1993). The preceding discussion has highlighted the key features of undertaking a cluster analysis and their significance in terms of the results generated by the process. In the light of this discussion, this section details the design specification for the cluster analysis process for this research. Table 8-5 details this specification. Issue Selection Comments Choice of approach. Hierarchical or non-hierarchical
Both Hierarchical: to investigate existence of underlying structure in the data accounted for by configurations of variables. Non-hierarchical: to refine preferred solution generated by hierarchical technique; to explore cluster formation based on a priori classifications
Choice of distance measure
Squared Euclidean Distance
Comparison of similarity measures reported Euclidean distance measures to provide consistently acceptable results.
Choice of amalgamating rules
Ward’s method, Within-groups linkage, Furthest neighbour, Pearson correlation
Ward’s method is the method of choice for this research. It has consistently been shown to perform well at structure recovery (Aldenderfer and Blashfield, 1984). Additionally it is selected because of its reported efficiency, minimisation of within-cluster differences, ability to produce distinct clusters and avoidance of problems of chaining of the observations found in the single-linkage method. To satisfy the requirement of testing with a number of cluster solutions three further methods are proposed: Within-groups linkage is selected because it fuses clusters so that within-cluster variance is minimised and tends to produce tighter clusters than between-group linkage. Furthest-neighbour method is selected as an item-focused method as a contrast to the two cluster-focused methods. Finally, Pearson’s method will be used as the correlational method.
Selection of preferred solution
Relative criteria, manageability, visual inspection, stopping rules
Selection by ‘relative criteria’ requires the researcher to decide which of the various structures is better in some sense, such as being more stable or appropriate for the data (Gordon, 1996). A manageable solution will consist of between 2 and 6 clusters. Visual inspection of dendrograms and agglomeration matrices for jumps in the data.
Non-hierarchical analysis: selection of seed points
Preferred solution from hierarchical analysis
To refine the preferred cluster solution.
Testing (1)Validation (Monte Carlo, Replication, ANOVA) (2)Multiple analyses (3)Expert opinion
(1) Monte Carlo: run simulations with dummy data to provide test against hierarchical clusters and chance of results being artefacts of the algorithm. Replication: split-half test to test integrity of solutions. ANOVA: to test stability of solution. (2) The degree of consistency of solutions can indicate reliability (Hair et al.,1998), though absence of consistency does not imply a necessarily weak solution. (3) Expert opinion can also establish the practical value of a study, when the experts are relevant practitioners their views can establish the 'real world' value of a set of results. That is, their opinion can help to validate results (Ketchen and Shook, 1996).
Analysis Interpretation and profiling
Comparison against variables not used as the basis for clustering.
Table 8-5: Cluster analysis research design
8.12 Summary One objective of this research is to identify clear and distinct groups of innovations, should they be present in the data. A strategy based on cluster analysis techniques has been proposed as the appropriate means by which these groups can be identified.

- 174 -
Cluster analysts tend to be united by the common objective of developing a sensible and informative classification out of initially unclassified data (Everitt, 1995). Hair et al. (1998) describe cluster analysis as more of an art than a science wherein a diversity of methods exist and choices must be made and explicated in undertaking an analysis. Because of the diversity of methods that exist within cluster analysis authorities (Everitt, 1995; Hair et al., 1998; Belson, 1986) recommend running several of the methods concurrently in order that classifications with greatest potential value for understanding or further study can be identified. This chapter has reviewed the options available and decision criteria necessary for undertaking a cluster analysis. A design specification has been proposed at the core of which are four hierarchical methods (Ward’s, furthest neighbour, within-groups linkage and Pearson’s correlation) followed by K-means refinement of the preferred hierarchical solution. Cluster analysis has its limitations. Issues such as subjectivity in cluster solution selection or opacity of stopping rule decisions have been discussed. In the final analysis decisions are made based on the utility of the output and the confidence one can have in using that output as a basis for further action, decision making and understanding. Confidence has been illustrated to be a product of tests of validity and the sense solutions make within the context of the data. Notwithstanding the choices that must be made and its deterministic tendency cluster analysis is objective, empirical, elegant and neutral. Real theoretical or conceptual importance is not gifted to the data by the process of cluster analysis, whether or not these exist is the consequence of subsequent interrogation of the clusters and characteristics of and between groups made by the analyst in the context of the data. The following chapter attempts this task.

- 175 -
9 PHASE II, SURVEY RESULTS AND ANALYSIS
9.1 Introduction This chapter presents the analysis and interpretation of the data as specified in the previous chapter. Initially, four separate hierarchical cluster analyses are run: Ward’s method, furthest neighbour, within-groups-linkage, and Pearson correlation. Each of these analyses is presented in the following format: - Textual commentary on unconsolidated (56 variables) and consolidated (13
variables) data plots. - Table summarising possible cluster solutions (where appropriate). - Graphical plots of percentage change in agglomeration coefficients for
unconsolidated. - Monte Carlo and empirical data (full data set and split-half tests). - Graphical plots of percentage change in agglomeration coefficients for
consolidated . - Monte Carlo and empirical data (full data set and split-half tests). - Dendrogram illustrating possible cluster solutions (where appropriate). Following a brief discussion of these analyses, a selection of a preferred cluster solution is made and justified in the context of the data. This solution is subsequently subjected to non-hierarchical refinement by K-means analysis. However, prior to the analysis a brief description and justification of the use of the statistical software package (SPSS®) used in the process is provided.
9.2 Software for statistical analysis SPSS® for Windows (Statistical Processes for Social Scientists) is a well-established statistical software package with a broad range of capabilities. Version 11.0 was used for this analysis. The software was chosen in preference to other software specifically designed to perform cluster analysis, for example CLUSTAN® (Wishart, 1987), for the following reasons: - The author had a degree of familiarity with SPSS® but no experience with other packages. - SPSS® was readily available on a single-user licence through the researcher’s academic institute. - SPSS® provides a wide range of statistical functions including, but not exclusively, some of the most popular, and some of the less frequently used, clustering
methods. - Technical support was readily available via email contact with SPSS®. - SPSS® provides readily interpretable output in the form of tables and graphics.

- 176 -
There are, however, limitations to the SPSS® package when compared against software specifically designed for the task of cluster analysis. The most significant of these it was felt, was the absence from the SPSS® armamentarium of Mahalanobis distance as a measure of distance. As noted above (Chapter eight) Mahalanobis distance is a useful measure of distance where multicollinearity is a feature of the data matrix and high correlations amongst variables may exert undue influence on one or more underlying construct (Ketchen and Shook, 1996). Multicollinearity was not found to be present in the data and so the unavailability of Mahalanobis distance did not become an issue. Other statistical packages, notably CLUSTAN®, provide a wider range of clustering methods and a more sophisticated representation of output, particularly in terms of graphics, than does SPSS®. This graphical output can be an aid in validating cluster solutions. However, the review of the literature on clustering methods led to the conclusion that the methods available in SPSS® were sufficient for the clustering task in hand. The difference between graphical output capability was not felt to be a significant issue. The difference in terms of aesthetics was tolerable in the context of the analysis. Whilst the absence of enhanced ease of interpretation that clear graphical representation of data offers, opportunities for interpretation and analysis were not felt to be diminished by the use of SPSS®. It was felt, on balance, that the advantages of proceeding with SPSS® outweighed the disadvantages.
9.3 SPSS® procedure SPSS® requires that separate files are created for each body of data that is to be analysed. Initially, therefore, 12 separate files were created, these are detailed in table 9-1.
Monte Carlo data Empirical data
Unconsolidated data File 1 – Full data set (FDS) File 2 – Split Half 1 (SH1) File 3 – Split Half 2 (SH2)
File 4 – Full data set (FDS) File 5 – Split Half 1 (SH1) File 6 – Split Half 2 (SH2)
Consolidated data File 7 – Full data set (FDS) File 8 – Split Half 1 (SH1) File 9 – Split Half 2 (SH2)
File 10 – Full data set (FDS) File 11– Split Half 1 (SH1) File 12 – Split Half 2 (SH2)
Table 9-1: SPSS® data files The Monte Carlo analyses were run prior to analysing the raw empirical data. This served two purposes. First, to re-familiarise the author with some of the more specialist features of running an SPSS® cluster analysis and resolve any technical issues with regard to the matrix template. Second, it served to permit running a Monte Carlo simulation analysis without the risk of interpretation being prejudiced by prior analysis and understanding of the empirical data. Arguably, it may have predisposed the researcher to attempting to fit the results of the analysis of empirical data to that of the Monte Carlo simulation.

- 177 -
9.3.1 File template Two file templates were created, both according to the same principles, one for unconsolidated data the other for consolidated data. The convention in SPSS® is for rows to represent the items or entities (in this case individual innovations) and for columns the variables (in this instance, innovation attributes) that are the basis for clustering. Consequently in both templates the matrix initially consisted of 196 rows (the total number of responses, and reduced to 171 after accounting for missing data) but the number of columns differed between unconsolidated data template (56 variables) and consolidated data (13 variables). Additionally, a further four columns were created to include variables not used as a basis for the initial clustering: respondent identity code, innovation area of focus, data source, functional type and clinical type. In creating a file template the user is required to specify certain characteristics of the data and assign descriptive labels and formatting to columns and cells. In total ten labelling and formatting decisions must be made, the salient ones for this study are illustrated in table 9-2.
(Variable) Name: a maximum of eight characters available to label a column head, e.g. novelty. (Variable) Type: a selection of eight types defining the data as numeric, scientific, currency, alpha string etc. Each variable in this study was assigned a numeric value. (Variable) Label: supplementary to ‘Name’ (above) provides the opportunity for fuller description of variables (256 characters available), but does not appear as a column heading. (Variable) Values: specify the (numeric) values that cover the range of data. For this study this range was 1,2,3,4,5,6,7 representing all possible responses on the Likert scale. Missing: missing data was assigned the value ‘9’. (Variable) Measure: what sort of data is being used: nominal, ordinal or scale? Variables in this study comprised both scale (Likert responses) and nominal (e.g. respondent name).
Table 9-2: SPSS® labelling and formatting
9.3.2 Data integrity Data input integrity was confirmed by running checks of descriptive statistics (maxima, minima, standard deviations and data range). This is a useful check against the possibility of large values being erroneously entered into cells. Random audits of data entry were also undertaken to ensure accurate transposition. Table 9-3 details the descriptive statistics for the survey response: of 310 mailed questionnaires, 196 were returned by the deadline of which 171 were usable.

- 178 -
Data were checked for signs of multicollinearity. No correlations equal to or greater than 0.9, Norman and Streiner’s (2000) test of multicollinearity, were found in the consolidated data set. In the full data set, however, multicollinearity was found, but only between items 4.3 and 4.4 (individuals took risks in developing the innovation and, individuals took risks in implementing the innovation), with a correlation coefficient of 0.907. A less stringent r-value of 0.7 was also applied. No correlations were found in the consolidated data, 12 correlations were found in the unconsolidated data. It is, though, unsurprising to have found some level of correlation in the unconsolidated data, where attributes are interrogated by multiple items. Consequently multicollinearity is not considered to be an issue for this research.
Sample size 310 Total response 196 (63.2%) Missing items 25 (12.8% of total response, 8.1% of total
sample) Total usable responses
171 (87.2% of total response, 55.2% of total sample)
Table 9-3: Survey response descriptive statistics
9.3.3 Data analysis Following the specification of the file template and data entry SPSS®’s statistical processes were invoked in order to generate cluster solutions. Using the Analyze function the procedure is illustrated in table 9-4.
• Select Analyze, Classify, Hierarchical Cluster. At which point the Hierarchical Cluster Analysis dialogue box appears.
• Select the variables to be used as basis for cluster analysis (56 or 13 variables for the
two analyses).
• Select statistical output options and specify number of cluster solutions: agglomeration schedule and range of 2 to 6 cluster solutions selected.
• Select graphical plot output from choice of dendrogram and icicle plots. With large
quantities of data dendrograms are more manageable and were, therefore, selected.
• Specify cluster method and distance measure from range of options.
• Stipulate whether the cluster membership output should be saved as a new variable. This new variable will be the variable data used to seed initial cluster centres in the K-means refinement.
Table 9-4: SPSS® analysis procedure

- 179 -
9.4 Analysis 1: Ward’s method
9.4.1 Unconsolidated data Visual inspection of the curves (figure 9-1) illustrating the Monte Carlo and empirical data indicates: - Shape and magnitude of Monte Carlo and empirical curves approximate to each
other from 10- to 6-cluster solution, though empirical magnitudes are greater. Beyond the 6-cluster solution gradients of the empirical curves begin to rise steeply in comparison to those of Monte Carlo.
- The internal relationships of empirical curves remain largely consistent. This -indicates that the structure recovered from full data set is also recovered in split-half tests. Steep gradient changes suggest solutions of 3- or 4-clusters.
9.4.2 Consolidated data Visual inspection of the curves (figure 9-1) illustrating the Monte Carlo and empirical data indicates: - Results similar to those of the unconsolidated analysis confirming underlying
structure in the data. - Steep gradients suggest rules determining uniqueness having to be greatly relaxed
and 3-, 4- and 5- cluster solutions are suggested.
9.4.3 Comment Analysis of consolidated and unconsolidated data recovers possible 3-, 4- and 5-cluster solutions. Differences in gradient and magnitude between Monte Carlo and empirical plots suggests that those solutions are not artefacts of the statistical process. Validity is further supported by synchronicity of full data set and split-half curves in the two empirical analyses. 3- and 4- cluster solutions also generate well-distributed cluster membership which are largely consistent across consolidated and unconsolidated analyses (see table 9-5). This is confirmed by analysis of the dendrogram (see figure 9-2) which illustrates clear clusters with many items having clustered at an early stage (indicating tightness of clusters). The possible 5-cluster solution is rejected on the basis of its less evenly distributed cluster membership. For these reasons the 3- and 4-cluster solutions are retained for later analysis.
Cluster Number 1 2 3 4 5
Consolidated data 62 45 64 Unconsolidated data 108 37 26 Consolidated data 62 45 38 26 Unconsolidated data 53 56 26 36 Consolidated data 62 12 33 38 26 Unconsolidated data 39 56 26 14 36
Table 9-5: Summary of cluster membership. Ward’s method, 3-, 4- and 5-cluster solutions, consolidated and unconsolidated data.

- 180
-
Figu
re 9
-1: P
erce
ntag
e ch
ange
s in
aggl
omer
atio
n co
effic
ient
. Ana
lysi
s by
War
d’s m
etho
d. C
onso
lidat
ed a
nd u
ncon
solid
ated
Mon
te
Car
lo a
nd e
mpi
rica
l dat
a.
246810121416
23
45
67
89
10
Num
ber o
f clu
ster
sol
utio
ns
Percentage change
Full d
ata
set
Split
half
1Sp
lit ha
lf 2
024681012
23
4 5
67
89
10N
umbe
r of c
lust
er s
olut
ions
Percentage Change
FDS
SH1
SH2
0246810121416
23
45
67
89
10
Percentage change
024681012
23
45
67
89
10
Percentage changeM
onte
Car
lo (u
ncon
solid
ated
)
Empi
rical
(unc
onso
lidat
ed)
Mon
te C
arlo
(con
solid
ated
)
Empi
rical
(con
solid
ated
)

- 181
-
Figu
re 9
-2: D
endr
ogra
m sh
owin
g su
gges
ted
3-cl
uste
r so
lutio
n fr
om W
ard’
s met
hod,
con
solid
ated
dat
a N
ote:
The
den
drog
ram
is re
prod
uced
del
iber
atel
y in
smal
l sca
le in
ord
er to
fit o
n a
sing
le p
age.
It is
incl
uded
for t
he p
urpo
se o
f illu
stra
ting
the
dist
inct
ness
of c
lust
ers
and
early
clu
ster
ing
only
. At t
his s
tage
in th
e an
alys
is th
e ite
m n
umbe
rs th
at ru
n al
ong
the
x-ax
is a
re n
ot re
leva
nt.
Rescaled Distance Cluster Combine C A S E 0 5 10 15 20 25 Label Num +---------+---------+---------+---------+---------+ 48 òø 123 òôòø 111 òú ó 153 ò÷ ó 35 òø ó 174 òôòôòòòø 165 ò÷ ó ó 134 òòò÷ ó 68 òûòø ùòø 120 ò÷ ó ó ó 69 òø ó ó ó 166 òú ùòòò÷ ó 175 òú ó ó 190 òú ó ó 15 òôò÷ ó 137 òú ó 97 òú ó 104 òú ùòòòòòø 6 òú ó ó 50 òú ó ó 91 òú ó ó 67 ò÷ ó ó 4 òø ó ó 178 òú ó ó 87 òôòø ó ó 49 òú ó ó ó 161 òú ó ó ó 3 òú ùòòòòò÷ ùòòòòòòòòòòòòòòòòòòòòòòòòòòòòòòòòòø 71 ò÷ ó ó ó 106 òø ó ó ó 191 òôò÷ ó ó 80 òú ó ó 143 ò÷ ó ó 84 òûòòòø ó ó 90 ò÷ ó ó ó 122 òø ó ó ó 179 òôòø ó ó ó 157 ò÷ ó ùòòòòòòòòò÷ ó 30 òø ó ó ó 47 òú ó ó ó 22 òôòú ó ó 181 òú ùò÷ ó 2 òú ó ó 34 ò÷ ó ó 173 òòò÷ ó 131 òø ó 139 òôòø ó 101 ò÷ ó ó 51 òø ùòòòø ó 154 òú ó ó ó 100 òôò÷ ó ó 135 òú ó ó 52 òú ó ó 7 ò÷ ó ó 86 òø ó ó 124 òú ùòòòòòø ó 126 òú ó ó ó 189 òú ó ó ó 77 òú ó ó ó 103 òôòø ó ó ó 70 òú ó ó ó ó 118 ò÷ ó ó ó ó 60 òø ùòòò÷ ó ó 89 òú ó ó ó 27 òú ó ó ó 39 òú ó ó ó 102 òôò÷ ó ó 155 òú ó ó 177 òú ó ó 116 òú ùòòòòòòòòòòòòòòòòòòòòòòòòòòòø ó 176 ò÷ ó ó ó 99 òø ó ó ó 163 òú ó ó ó 186 òôòø ó ó ó 44 òú ó ó ó ó 188 ò÷ ó ó ó ó 64 òø ùòòòòòòòòòú ó ó 168 òú ó ó ó ó 96 òôòú ó ó ó 65 ò÷ ó ó ó ó 88 òø ó ó ó ó 160 òú ó ó ó ó 95 òú ó ó ó ó 1 òôò÷ ó ó ó 10 òú ó ó ó 110 òú ó ó ó 12 ò÷ ó ó ó 20 òø ó ó ó 159 òú ó ó ó 75 òú ó ó ó 92 òôòòòø ó ó ó 115 ò÷ ó ó ó ó 21 òø ó ó ó ó 171 òú ùòòòòòòò÷ ó ó 79 òôòø ó ó ó 11 òú ó ó ó ó 66 ò÷ ó ó ó ó 56 òø ùò÷ ó ó 132 òú ó ó ó 93 òú ó ó ó 72 òú ó ó ó 8 òôò÷ ó ó 152 òú ó ó 45 òú ùòòòòòòò÷ 121 òú ó 170 òú ó 150 ò÷ ó 108 òø ó 169 òôòø ó 54 òú ó ó 57 òú ùòòòø ó 59 ò÷ ó ó ó 149 òø ó ó ó 162 òôò÷ ó ó 136 òú ó ó 151 òú ó ó 36 ò÷ ó ó 42 òûòø ùòø ó 144 ò÷ ó ó ó ó 16 òø ó ó ó ó 147 òú ó ó ó ó 141 òú ó ó ó ó 40 òôòú ó ó ó 98 òú ó ó ó ó 125 òú ùòòò÷ ùòòòòòòòòòø ó 19 òú ó ó ó ó 83 òú ó ó ó ó 129 òú ó ó ó ó 193 ò÷ ó ó ó ó 195 òûòú ó ó ó 196 ò÷ ó ó ó ó 145 òòò÷ ó ó ó 26 òòòòòòòòò÷ ó ó 33 òø ó ó 180 òú ó ó 117 òôòø ó ó 14 ò÷ ùòòòø ó ó 25 òûòú ó ó ó 63 ò÷ ó ó ùòòòòòòòòòòòòòòòòòòòòò÷ 78 òø ó ó ó 130 òôò÷ ó ó 112 òú ó ó 142 òú ùòòòø ó 31 ò÷ ó ó ó 23 òø ó ó ó 109 òú ó ó ó 156 òôòòòø ó ó ó 55 ò÷ ó ó ó ó 5 òø ó ó ó ó 32 òú ùò÷ ó ó 41 òú ó ó ó 82 òôòø ó ó ó 182 òú ó ó ùòòòòòòò÷ 94 ò÷ ùò÷ ó 38 òø ó ó 81 òôò÷ ó 127 ò÷ ó 24 òø ó 53 òú ó 184 òôòø ó 43 ò÷ ùòòòø ó 194 òòò÷ ó ó 138 òø ó ó 146 òôòø ùòòò÷ 187 ò÷ ó ó 62 òø ùòø ó 158 òú ó ó ó 29 òôò÷ ùò÷ 17 òú ó 192 ò÷ ó 172 òòòòò÷
Clu
ster
1
Clu
ster
2
Clu
ster
3

- 182 -
9.5 Analysis 2: Furthest neighbour
9.5.1 Unconsolidated data Visual inspection of the curves (figure 9-3) illustrating the Monte Carlo and empirical data indicates: - That both Monte Carlo and empirical plots appear moderately erratic, though less
so in the case of Monte Carlo curves. - Symmetry in the Monte Carlo curves from 10- to 4-cluster solutions after which symmetry lessens. - Little symmetry between empirical curves except for 3- and 4-cluster solutions. - A rise in gradient of empirical curves at 5-clusters suggesting a possible solution,
but not sufficient to suggest a strong underlying structure exists in the data. - Erratic movement of empirical curves relative to each other suggesting that no
solution is validated.
9.5.2 Consolidated data Visual inspection of the curves (figure 9-3) illustrating the Monte Carlo and empirical data indicates: - Moderately erratic curves in both plots. - Empirical curves rise steeply at 3- and 5-cluster solutions. This rise is mimicked in
the Monte Carlo plot at the 3-cluster solution. This may imply the influence of the clustering algorithm rather than a strong structure within the data.
9.5.3 Comment The analysis shows very erratic clustering of unconsolidated data, possibly reflecting the item-specific focus of the method and the multiple variables under consideration. There are some similarities in curve movements between plots (e.g. at the 5-cluster solution in figure 9-3, consolidated data), which might suggest the influence of the clustering algorithm rather than underlying data structure. The plots are considered sufficiently different in other respects to give confidence that the empirical data set is dissimilar from the randomly generated data set.
Cluster Number 1 2 3 4 5
Consolidated data 145 24 2 Unconsolidated data 72 83 15 Consolidated data 39 24 99 7 2 Unconsolidated data 72 33 22 28 15
Table 9-6: Summary of cluster membership. Furthest neighbour method, 3- and 5-cluster solutions, consolidated and unconsolidated data. Although a 5-cluster solution might be indicated, validation methods do not give it strong support. There is discrepancy between consolidated and unconsolidated plots and Monte Carlo plots are not sufficiently different to discriminate between empirical and random data. Further the empirical full data set and split-half 1 and 2 curves are also dissimilar. Further, as table 9-6 shows, the furthest neighbour method produces an uneven membership distribution. The stability of a 5-cluster solution by the furthest neighbour method must, therefore, be called into question.

- 183
-
Figu
re 9
-3:
Perc
enta
ge c
hang
es in
agg
lom
erat
ion
coef
ficie
nt. A
naly
sis b
y fu
rthe
st n
eigh
bour
met
hod.
Con
solid
ated
and
un
cons
olid
ated
Mon
te C
arlo
and
em
piri
cal d
ata.
0102030405060
23
45
67
89
10N
umbe
r of c
lust
er s
olut
ions
Percentage Change FD
SS
H1
SH
2
04812162024
23
45
67
89
10
Num
ber o
f clu
ster
sol
utio
ns
Percentage change
FDS
SH1
SH2
0102030405060
23
45
67
89
10
Percentage change
04812162024
23
45
67
89
10
Percentage change
Mon
te C
arlo
(unc
onso
lidat
ed)
Empi
rical
(un
cons
olid
ated
)
Mon
te C
arlo
(con
solid
ated
)
Empi
rical
(co
nsol
idat
ed)

- 184 -
9.6 Analysis 3: Within-groups linkage
9.6.1 Unconsolidated data Visual inspection of the curves (figure 9-4) illustrating the Monte Carlo and empirical data indicates that: - The Monte Carlo and empirical curves have neither shape nor magnitude in
common leading to the conclusion that the empirical plot is unlikely to be an artefact of the clustering process and that empirical and random data are differently structured.
- Both empirical and Monte Carlo plots are erratic, though there is moderate synchronicity between empirical curves between 5- and 3-cluster solutions. - 3-, 4- and 5-cluster solutions seem plausible.
9.6.2 Consolidated data Visual inspection of the curves (figure 9-4) illustrating the Monte Carlo and empirical data indicates: - That both representations appear to be erratic, though dissimilarly shaped. - A possible 5-cluster solution as the gradients of each of the empirical curves
steepen markedly and in concert, which is in contrast to the Monte Carlo plot.
9.6.3 Comment The within-groups linkage method hints weakly at a possible 5-cluster solution from the consolidated data and possible solutions of 3-, 4- or 5-clusters from the unconsolidated data. Cluster membership for each of these solutions is presented in table 9-7. Because of the imbalance in cluster membership across each of these solutions, and particularly because cluster 5 of the consolidated analysis contains only a single item, these solutions are considered unsatisfactory.
Cluster 1 Cluster 2 Cluster 3 Cluster 4 Cluster 5 Consolidated data 98 46 27 Unconsolidated data 55 67 47 Consolidated data 49 46 27 49 Unconsolidated data 28 67 47 28 Consolidated data 49 46 27 48 1 Unconsolidated data 28 43 47 28 24
Table 9-7: Summary of cluster membership. Within groups linkage 3-, 4- and 5-cluster solutions. Consolidated and unconsolidated data.

- 185
-
Figu
re 9
-4: P
erce
ntag
e ch
ange
s in
aggl
omer
atio
n co
effic
ient
. Ana
lysi
s by
with
in g
roup
s lin
kage
met
hod.
Con
solid
ated
and
un
cons
olid
ated
Mon
te C
arlo
and
em
piri
cal d
ata.
0246810
23
45
67
89
10
Num
ber o
f clu
ster
sol
utio
nsPercentage change
FDS
SH
1S
H2
02468
23
45
67
89
10
Num
ber o
f clu
ster
sol
utio
ns
Percentage change
FDS
SH
1S
H2
0246810
23
45
67
89
10
Percentage change
02468
23
45
67
89
10
Percentage change
Mon
te C
arlo
(unc
onso
lidat
ed)
Empi
rical
(un
cons
olid
ated
)
Mon
te C
arlo
(con
solid
ated
)
Empi
rical
(con
solid
ated
)

- 186 -
9.7 Analysis 4: Pearson correlation Pearson correlation is a measure of similarity, therefore the agglomeration coefficient decreases and so the vertical scale moves from zero to a series of negative points. Potential cluster solutions can, once again, be recognised by kinks in the curve.
9.7.1 Unconsolidated data Visual inspection of the curves (figure 9-5) illustrating the Monte Carlo and empirical data indicates: - The difference in magnitude between the two plots. The Monte Carlo appears to be more erratic than empirical plot. This suggests that the data underpinning the
Monte Carlo plot exhibits less similarity than does that for the empirical plot. - That, because of the differences in magnitude and shape between empirical and
Monte Carlo plots, the empirical presentation is unlikely to be an artefact of the statistical process.
- That the Y-axis scale manipulation allows for finer-grained analysis of empirical curves. Absence of any synchronicity between empirical curves suggests no strong cluster solution.
9.7.2 Consolidated data Visual inspection of the curves (figure 9-6) illustrating the Monte Carlo and empirical data indicates: - That the plots mimic those found in the analysis of unconsolidated data with clear differences in both shape and magnitude between the Monte Carlo and empirical
plots. - The empirical curves following Y-axis scale manipulation allows for finer-grained analysis. This shows some modest symmetry between the curves up to the 6-cluster solutions, after which symmetry is less pronounced. The absence of a clearly
apparent, synchronous change in gradient suggesting no predominant cluster solution.
9.7.3 Comment Analysis by the Pearson correlation does not suggest any clearly distinctive cluster solutions. Inspection of the dendrogram (see figure 9-7) indicates clustering takes place late in the process (which suggests large within-group distances, i.e. weak internal homogeneity). Inspection also confirms clusters to be string-like with a large number of possible solutions, several outliers and no clear structure (particularly when compared against Ward’s method dendrogram, figure 9-2). Correlational analysis appears not to offer any promising solution and for this reason the method is discounted.

- 187 -
Figure 9-5: Percentage changes in agglomeration coefficient. Analysis by Pearson correlation. Unconsolidated Monte Carlo and empirical data.
-100
-80
-60
-40
-20
02 3 4 5 6 7 8 9 10
Perc
enta
ge c
hang
e
Number of cluster solutions
-100
-80
-60
-40
-20
0 2 3 4 5 6 7 8 9 10
Perc
enta
ge c
hang
e
FDS SH1 SH2
-10
-9
-8
-7
-6
-5
-4
-3
-2
-1
02 3 4 5 6 7 8 9 10
Perc
enta
ge c
hang
e
Monte Carlo (unconsolidated)
Empirical (unconsolidated, re-scaled)
Empirical (unconsolidated)

- 188 -
Figure 9-6: Percentage changes in agglomeration coefficient. Analysis by Pearson Correlation method of consolidated Monte Carlo and empirical data.
Number of cluster solutions
-120
-100
-80
-60
-40
-20
0 2 3 4 5 6 7 8 9 10 Pe
rcen
tage
cha
nge
Monte Carlo (consolidated)
-16 -14 -12 -10
-8 -6 -4 -2 0 2 3 4 5 6 7 8 9 10
Perc
enta
ge c
hang
e
Empirical (consolidated, re-scaled)
-120
-100
-80
-60
-40
-20
0 2 3 4 5 6 7 8 9 10
Perc
enta
ge c
hang
e
FDS SH1 SH2
Empirical (consolidated)

- 189
-
Figu
re 9
-7: P
ears
on c
orre
latio
n de
ndro
gram
(em
piri
cal,
cons
olid
ated
) N
ote:
The
den
drog
ram
is re
prod
uced
del
iber
atel
y in
smal
l sca
le in
ord
er to
fit o
n a
sing
le p
age.
It is
incl
uded
for t
he p
urpo
se o
f illu
stra
ting
the
lack
of d
istin
ctne
ss o
f cl
uste
rs a
nd st
ring-
like
clus
terin
g on
ly. A
t thi
s sta
ge in
the
anal
ysis
the
item
num
bers
that
run
alon
g th
e x-
axis
are
not
rele
vant
.
Rescaled Distance Cluster Combine C A S E 0 5 10 15 20 25 Label Num +---------+---------+---------+---------+---------+ 64 òûòø 168 ò÷ ùòòòø 186 òòò÷ ó 65 òòòòòòòôòø 1 òòòòòòò÷ ùòø 96 òòòòòòòòò÷ ùòø 99 òòòòòòòûòòò÷ ùòø 163 òòòòòòò÷ ó ùòø 108 òòòòòòòòòòòòò÷ ó ùòø 169 òòòòòòòòòòòòòòò÷ ó ó 188 òòòòòòòòòòòòòòòòò÷ ùòø 44 òòòòòòòòòûòòòòòø ó ó 83 òòòòòòòòò÷ ùòòò÷ ùòø 19 òòòòòòòòòòòòòòò÷ ó ó 69 òòòòòòòòòòòòòòòòòòòòò÷ ó 12 òòòòòòòûòø ùòòòø 110 òòòòòòò÷ ó ó ó 88 òòòòòòòûòôòòòø ó ó 160 òòòòòòò÷ ó ùòòòø ó ùòø 95 òòòòòòòòò÷ ó ùòòòòò÷ ó ó 10 òòòòòòòòòòòòò÷ ó ó ùòòòòòòòø 192 òòòòòòòòòòòòòòòòò÷ ó ó ó 149 òòòòòòòòòòòòòòòòòòòòòòòòòòò÷ ó ùòòòòòø 190 òòòòòòòòòòòòòòòòòòòòòòòòòòòòò÷ ó ó 141 òòòòòòòòòòòòòòòòòòòòòòòòòòòòòòòòòòòòò÷ ó 49 òòòòòòòòòòòûòòòø ó 161 òòòòòòòòòòò÷ ùòòòø ó 71 òòòòòòòòòòòòòòò÷ ùòòòòòòòòòø ó 3 òòòòòòòòòòòòòòòòòòò÷ ó ó 54 òòòòòòòòòòòòòûòòòòòòòø ó ó 82 òòòòòòòòòòòòò÷ ó ùòòòòòø ó 38 òòòûòòòòòø ùòòòø ó ó ó 41 òòò÷ ùòø ó ó ó ó ó 130 òòòòòòòòò÷ ùòòòòòø ó ùòòò÷ ó ó 81 òòòòòòòòòòò÷ ùòòò÷ ó ó ó 59 òòòòòòòòòòòòòòòòò÷ ó ó ó 25 òòòòòòòòòòòòòòòòòòòòòòòòò÷ ó ó 20 òòòûòòòø ó ó 159 òòò÷ ùòø ó ó 92 òòòòòòò÷ ùòòòø ùòòòø ó 97 òòòòòòòòò÷ ùòòòø ó ó ó 8 òòòòòòòòòòòòò÷ ùòòòø ó ó ó 193 òòòòòòòòòòòòòòòòò÷ ùòòòòòòòø ó ó ó 162 òòòòòòòòòòòòòòòòòòòòò÷ ó ó ó ó 5 òòòòòûòòòòòø ó ó ó ùòø 32 òòòòò÷ ùòòòòòø ó ó ó ó ó 11 òòòòòòòòòòò÷ ó ó ó ó ó ó 79 òòòòòòòûòø ó ó ó ó ó ó 180 òòòòòòò÷ ùòø ó ùòòòòò÷ ó ó ó 45 òòòòòòòòò÷ ùòòòòòôòòòòòø ó ó ó ó 14 òòòòòòòòòòò÷ ó ó ó ó ó ó 66 òòòòòòòòòòòòòòòòò÷ ùòø ó ó ó ó 121 òòòòòòòòòûòòòòòòòòòø ó ó ó ó ó ó 170 òòòòòòòòò÷ ó ó ó ó ó ó ó 4 òòòòòòòûòòòø ùòòò÷ ùòòò÷ ó ó ó 178 òòòòòòò÷ ùòòòø ó ó ó ó ó 91 òòòòòòòòòòò÷ ùòòò÷ ó ó ó ó 87 òòòòòòòòòòòòòòò÷ ó ó ó ó 144 òòòòòòòòòòòòòòòòòòòòòòòòò÷ ó ó ó 56 òòòòòûòòòø ó ó ó 132 òòòòò÷ ùòø ó ó ó 116 òòòòòòòòò÷ ùòø ó ó ó 176 òòòòòòòòòòò÷ ùòòòø ó ó ó 23 òòòòòòòòòòòòò÷ ó ó ó ó 155 òòòòòòòûòòòø ó ó ó ó 177 òòòòòòò÷ ùòòòø ó ó ó ó 27 òòòòòûòòòø ó ó ó ùòòò÷ ó 158 òòòòò÷ ùò÷ ó ó ó ó 60 òòòòòûòø ó ùòôòòòø ó ó 89 òòòòò÷ ùò÷ ó ó ó ó ó 39 òòòòòòò÷ ó ó ùòø ó ó 72 òòòòòòòòòòòòòòò÷ ó ó ó ó ó 31 òòòòòòòòòòòòòòòòò÷ ó ùòòòø ó ó 16 òòòòòòòòòòòòòòòòòòòòò÷ ó ó ó ó 55 òòòòòòòòòòòòòòòòòòòòòòò÷ ó ó ó 29 òòòûòòòòòòòø ó ó ó 109 òòò÷ ó ó ó ó 86 òûòø ùòø ó ó ùòòòø 124 ò÷ ùòòòø ó ó ó ó ó ó 103 òòò÷ ùòø ó ùòòòø ó ó ó ó 102 òòòòòòò÷ ùò÷ ó ó ó ó ó ó 70 òòòòòòòòò÷ ó ó ó ó ó ó 156 òòòòòòòòòòòòò÷ ó ùòø ó ó ó 75 òòòûòòòòòòòòòø ùòø ó ó ó ó ó 115 òòò÷ ó ó ó ó ó ó ó ó 126 òø ó ó ó ó ó ó ó ó 189 òôòòòø ùòø ó ó ó ó ó ó ó 77 ò÷ ùòø ó ó ó ùòø ó ó ó ó ó 150 òòòòò÷ ùòø ó ùò÷ ó ó ó ùòø ó ó ó 118 òòòòòòò÷ ùòòò÷ ó ó ó ó ó ó ó ó ó 111 òòòòòòòòò÷ ó ó ùòòòø ó ó ó ó ó ó 152 òòòòòòòòòòòòòòò÷ ó ó ó ó ó ó ó ó ó 147 òòòòòòòòòòòòòòòòòòò÷ ó ùò÷ ó ùòòòø ó ó ó 94 òòòòòòòòòòòòòòòòòòòòò÷ ó ó ó ó ó ó ó 172 òòòòòòòòòòòòòòòòòòòòòòòòò÷ ó ó ùòòò÷ ó ó 195 òòòòòòòòòòòòòòòòòòòòòòòòòòòòò÷ ó ó ó ó 42 òòòòòòòòòòòòòòòòòòòòòòòòòòòòòòò÷ ó ó ó 26 òòòòòòòòòòòòòòòòòòòòòòòòòòòòòòòòòòò÷ ó ó 80 òòòòòòòûòòòòòòòø ó ó 143 òòòòòòò÷ ùòòòòòòòòòø ó ó 78 òòòòòòòòòòòòòòò÷ ó ó ó 24 òòòòòûòòòø ó ó ó 53 òòòòò÷ ùòòòø ó ó ó 184 òòòòòòòòò÷ ùòø ó ó ó 43 òòòòòòòòòûòòò÷ ó ùòòòø ó ó 182 òòòòòòòòò÷ ùòø ó ó ó ó 138 òòòòòûòòòø ó ó ó ó ó ó 146 òòòòò÷ ùòòòø ó ùòòòø ó ó ó ó 187 òòòòòòòòò÷ ùò÷ ó ó ó ùòòòø ó ó 17 òòòòòòòòòòòòò÷ ó ùòòò÷ ó ó ó ó 62 òòòòòòòòòòòòòòòòò÷ ó ó ùòòòòòòòòòòò÷ ó 194 òòòòòòòòòòòòòòòòòòòòò÷ ó ó ó 196 òòòòòòòòòòòòòòòòòòòòòòòòòòòòò÷ ó ó 145 òòòòòòòòòòòòòòòòòòòòòòòòòòòòòòòòò÷ ó 106 òòòòòòòòòòòòòòòûòòòòòòòòòòòø ó 125 òòòòòòòòòòòòòòò÷ ùòòòòòòòòòø ó 63 òòòòòòòòòòòòòòòòòòòòòòòòòòò÷ ó ó 50 òòòòòòòûòòòòòø ó ó 191 òòòòòòò÷ ùòòòòòòòø ó ó 166 òòòòòòòòòòòòò÷ ó ó ó 15 òòòûòòòòòòòø ó ùòòòòòòòòòø ó 137 òòò÷ ùòø ùòòòø ó ó ó 104 òòòòòòòòòòò÷ ùòòòø ó ó ó ó ó 6 òòòòòòòòòòòòò÷ ùòø ó ùòòòòòø ó ó ó 120 òòòòòòòòòòòòòòòòò÷ ùò÷ ó ó ó ó ó 68 òòòòòòòòòòòòòòòòòòò÷ ó ùòòòòò÷ ó ó 40 òòòòòòòòòòòòòòòòòòòòòòòòò÷ ó ó ó 98 òòòòòòòòòòòòòòòòòòòòòòòòòòòòòòò÷ ó ó 35 òòòòòòòòòûòòòòòòòø ó ó 174 òòòòòòòòò÷ ùòòòø ó ó 165 òòòòòòòòòòòòòòòòò÷ ùòòòòòòòòòòòòòø ó ó 36 òòòòòòòòòòòòòòòòòòòòò÷ ó ó ó 48 òòòòòòòûòòòòòòòø ó ó ó 123 òòòòòòò÷ ùòòòòòòòø ó ó ó 127 òòòòòòòòòòòòòòò÷ ùòòòòòø ùòòòòòø ùò÷ 153 òòòòòòòòòòòòòòòòòòòòòòò÷ ó ó ó ó 21 òòòòòòòûòòòø ó ó ó ó 171 òòòòòòò÷ ùòòòòòø ó ó ó ó 57 òòòòòòòòòòò÷ ùòòòòòòòø ó ó ó ó 157 òòòòòòòòòòòòòòòòò÷ ó ùòòòòò÷ ó ó 131 òûòø ó ó ó ó 135 ò÷ ùòø ó ó ó ó 51 òòò÷ ó ó ó ó ó 100 òòòòòôòø ó ó ó ó 139 òòòòò÷ ó ó ó ó ó 52 òòòòòòòôòø ùòòò÷ ó ó 7 òòòòòòò÷ ó ó ó ó 154 òòòòòòòòòôòø ó ó ó 101 òòòòòòòòò÷ ùòø ó ó ó 33 òòòòòòòòòòò÷ ùòø ó ùòòòòò÷ 136 òòòòòòòòòòòòò÷ ùòòòø ó ó 151 òòòòòòòòòòòòòòò÷ ùòø ó ó 142 òòòòòòòòòòòòòòòòòòò÷ ùòòò÷ ó 117 òòòòòòòòòòòòòòòòòòòòò÷ ó 30 òòòòòòòûòø ó 84 òòòòòòò÷ ùòòòòòòòø ó 173 òòòòòòòòò÷ ùòòòòòø ó 175 òòòòòòòòòòòòòòòòò÷ ó ó 93 òòòòòòòûòòòø ùòòòø ó 112 òòòòòòò÷ ùòòòòòòòø ó ó ó 47 òòòòòòòòòòòú ùòòò÷ ó ó 90 òòòòòòòòòòò÷ ó ùòòòòòòòø ó 129 òòòòòòòòòòòòòòòòòòò÷ ó ó ó 122 òòòòòòòòòòòòòòòûòòòòòòòòòø ó ó ó 179 òòòòòòòòòòòòòòò÷ ó ó ó ó 22 òòòòòòòòòø ùò÷ ùòòòòò÷ 181 òòòòòòòòòôòòòòòø ó ó 2 òòòòòòòòò÷ ùòòòòòø ó ó 34 òòòòòòòòòòòòòòò÷ ùòòò÷ ó 67 òòòòòòòòòòòòòòòòòòòòò÷ ó 134 òòòòòòòòòòòòòòòòòòòòòòòòòòòòòòòòòòò÷

- 190 -
9.8 Preferred solution Four different analyses have been run. Three of these are underpinned by measures of distance (dissimilarity), the fourth analysis (Pearson correlation) is underpinned by a similarity measure. Of the three distance measures one is item-focused (furthest neighbour) and the remaining two cluster-focused. All of the distance analyses suggest a 4-cluster solution, though some only very weakly. The Pearson correlation method did not strongly suggest any solution. Whilst solutions do not indicate strong levels of structure in the data as suggested by Reger and Huff’s (1993) test of constancy across different methods, several features are apparent. In each case empirical and Monte Carlo representations differ sufficiently enough to give confidence that clusters identified in the empirical data are unlikely merely to be artefacts of the statistical process. Furthermore, methods consistently suggest cluster solutions in the range from 3 to 5 which permits confidence that there is an underlying natural structure to the data. The plots and dendrograms solutions from furthest-neighbour clustering and Pearson’s correlation have been discounted due to the unbalanced string-like clusters that they have produced and indistinct cluster solutions. The two cluster-focused analyses have been demonstrated to recover the most stable solutions. Of these, Ward’s method appears to have recovered the most stable solutions. At this stage either the 3- or 4-cluster solution from Ward’s method would seem acceptable. As such both will be subjected to further analysis starting with K-means refinement. K-means refinement is a non-hierarchical method of assigning items to a pre-specified number of clusters whose centroids (cluster means) are already established. K-means refinement is an iterative method, it makes repeated passes through the data each time recalculating the value of the centroid. The distance of each item from the centroid is then calculated and that item whose distance is minimal is assigned to the cluster. The method thus compensates for poor initial partitioning of the data, which may happen with hierarchical methods, and in this sense is regarded as an elegant refinement of hierarchical solutions (Aldenderfer and Blashfield, 1984). Mindful of the advice from the previous chapter, that no cluster solution is a legitimate solution and that stability is enhanced when the same cluster solution presents itself across different methods, the author is cautious not to over-claim on the basis of the previous analysis.
9.9 Non hierarchical refinement As commended by various authorities (Milligan, 1996; Hair et al., 1998) the preferred cluster solutions derived from hierarchical methods are subject to a process of refinement by non-hierarchical methods.
9.9.1 SPSS® procedure Having selected the 3- and 4-cluster solutions derived from Ward’s method as the preferred solutions for further analysis it was next necessary to refine the solution by running K-means analysis.

- 191 -
The hierarchical process was run as described above, though with additional actions: Two hierarchical analyses using Ward’s method were repeated and each made distinct from the other by the addition of a new variable (column) comprising 3- and 4-cluster solutions data respectively, and saved as separate files. For both the 3- and 4-cluster solution files containing the newly created variable, the variable data initially used as the basis for running the hierarchical analysis is aggregated according to cluster membership. In essence this process determines the mean values of each variable for each cluster solution and generates a table such as these shown in table 9-8 and 9-9. The values in the individual cells are then used as the seed-points for the K-means clustering process. The process is as follows: - K-means cluster analysis is run using the aggregated file to provide seed-point
data: - Select Analyze, Classify, K-means cluster analysis - Select variables to be used in the analysis (these are the same 13 variables as used
for the hierarchical analysis) - Select other options required (e.g. ANOVA analysis) - Select and open the aggregated data file - Run K-means cluster analysis K-means was also run with unspecified seed-points. This is a final validation technique, commended by Hair et al. (1998), to test the consistency of cluster membership across and within solutions.
Cluster Variables
Nov Dep Dis Risk Idea Adap Uncer Scope Compl AcOp RelAdv Profile Observ
1 3.89 4.29 1.65 3.16 3.67 6.46 5.21 4.13 3.79 6.35 6.31 4.6 5.61
2 3.68 3.88 4.56 4.35 3.92 5.84 5.44 4.36 4.68 6.32 6.20 4.86 5.51Cluster
3 3.88 4.01 2.62 3.95 3.94 5.53 4.70 3.95 3.66 5.42 5.73 3.78 3.84
Table 9-8: Initial cluster centres (seed points) 3-cluster solution Cluster Variables
Nov Dep Dis Risk Idea Adap Uncer Scope Compl AcOp RelAdv Profile Observ
1 3.89 4.30 1.65 3.16 3.67 6.46 5.21 4.13 3.79 6.35 6.31 4.60 5.61
2 3.68 3.88 4.56 4.35 3.92 5.84 5.44 4.36 4.68 6.32 6.20 4.86 5.51
3 3.88 3.76 2.31 3.68 3.92 6.13 4.71 3.65 3.24 5.74 5.78 3.60 3.28Cluster
4 3.89 4.37 3.07 4.33 3.97 4.65 4.68 4.39 4.29 4.96 5.65 4.05 4.65
Table 9-9: Initial cluster centres (seed points) 4-cluster solution K-means refinement was run twice. For each iteration the 3- and 4-cluster solutions suggested by Ward’s method for consolidated data provided the seed points. The results of the analysis were used as the basis for selecting between the 3- and 4- cluster

- 192 -
solutions and then, for the profiling of clusters. This activity is described in the following section.
9.10 Comparison of K-Means analyses Table 9-10 compares membership distribution for the Ward’s method and two K-means solutions (one seeded, one unseeded) for a 3-cluster solution. Table 9-11 presents the same information for the 4-cluster solution. Hair et al. (1998) argue that if cluster membership is consistent across three such analyses then the solution may be considered stable. The distribution of items across clusters in table 9-10 is consistent across the clustering approaches. It is notable in table 9-11 that the K-means analysis with unspecified seed points generates a cluster with single-item membership. This suggests that the 4-cluster solution is less stable or meaningful than the 3-cluster solution.
Cluster Number 1 2 3
Ward’s method 62 45 64
K-Means analysis 65 55 51
K-Means analysis (unspecified seed points) 65 36 70
Table 9-10: Comparison of cluster membership for 3-cluster solution. Analysis by Ward’s method and K-Means.
Cluster Number 1 2 3 4
Ward’s method 62 45 38 26
K-Means analysis 59 42 40 30
K-Means analysis (unspecified seed points) 1 43 56 71
Table 9-11: Comparison of cluster membership for 4-cluster solution. Analysis by Ward’s method and K-Means. There is no single universally agreed definition of what clusters are, though they are all united by two common themes: internal cohesion and external isolation. For example - the distance between any two points in a set is less than the distance between any point in the set and any not in it (Cormack, 1971). Cluster analysis is a technique that seeks to maximise heterogeneity between clusters and minimise homogeneity within clusters. The tightest cluster solutions will exhibit low values of within-cluster variance and high values of between-cluster variance. That is, looser clusters are distinguished by larger internal distances (within-cluster variance values) between members whilst, larger between-cluster variance values indicate greater distance between separate clusters (Harrigan, 1985). Harrigan (1985) calls the presentation of these data ‘interdifference matrices’ and, tables 9-12 and 9-13 present interdifference matrices for the refined 3- and 4-cluster solutions.

- 193 -
Cluster Number 1 2 3
1 1.397 3.367 3.095 2 0.820 3.652 Cluster
Number 3 0.978 Shaded cells = cluster tightness (within-cluster-variance) Non-shaded cells = cluster separation (between-cluster-variance)
Table 9-12: Interdifference matrix for 3-cluster solution Cluster Number 1 2 3 4
1 1.410 3.571 3.230 3.237 2 0.891 4.417 2.943 Cluster
Number 3 1.134 2.960 4 0.609 Shaded cells = cluster tightness (within-cluster-variance) Non-shaded cells = cluster separation (between-cluster-variance)
Table 9-13: Interdifference matrix for 4-cluster solution Values for within-cluster-variance and between-cluster-variance for the 3- and 4-cluster solutions as illustrated in tables 9-12 and 9-13 are remarkably consistent with each other. Given the nature of the clustering process the expectation would be that, as the number of clusters in a solution increases, within-cluster-variance values decrease (as rules governing uniqueness are more strictly enforced). Similarly, as the number of clusters in a solution rises the value of between-cluster-variances will also rise as clusters become increasingly distinct from one another. In tables 9-12 and 9-13 the within-cluster-variances for the two proposed solutions show no significant differences one from the other. Their between-cluster-variances also are similar, with the exception of the high between-cluster-variance value that distinguishes between clusters 2 and 4 (between-cluster-variance 4.417). On the basis of the interdifference matrices it is difficult to select and justify either solution ahead of the other for further analysis and profiling. However, validation by comparison to K-means solutions by unseeded analysis (see tables 9-10 and 9-11) would suggest rejecting the 4-cluster solution in favour of the 3-cluster solution. The profiling that follows will therefore be based on the 3-cluster solution specified by refined K-means analysis of the Ward’s method solution.
9.11 Cluster profiles Cluster analysis has identified three discrete innovation types. Each type is populated by empirical instances each of which share a set of characteristics in common. The profiles of the types (and by extension members of the population) may be described in two ways. The first is according to differences in the expression of the variables that were used as a basis for the clustering. The second method is according to variables not used in the process of clustering. These two profiling techniques will be addressed in turn, first profiling according to characteristics of clusters from variable data.
9.11.1 Profiling by cluster variables Cluster analysis has generated a cluster solution of 3 clusters. These clusters are not concepts, or constructs, or theories but remain for the moment simple empirical groupings, one containing 65 items, one containing 55 items and the final cluster
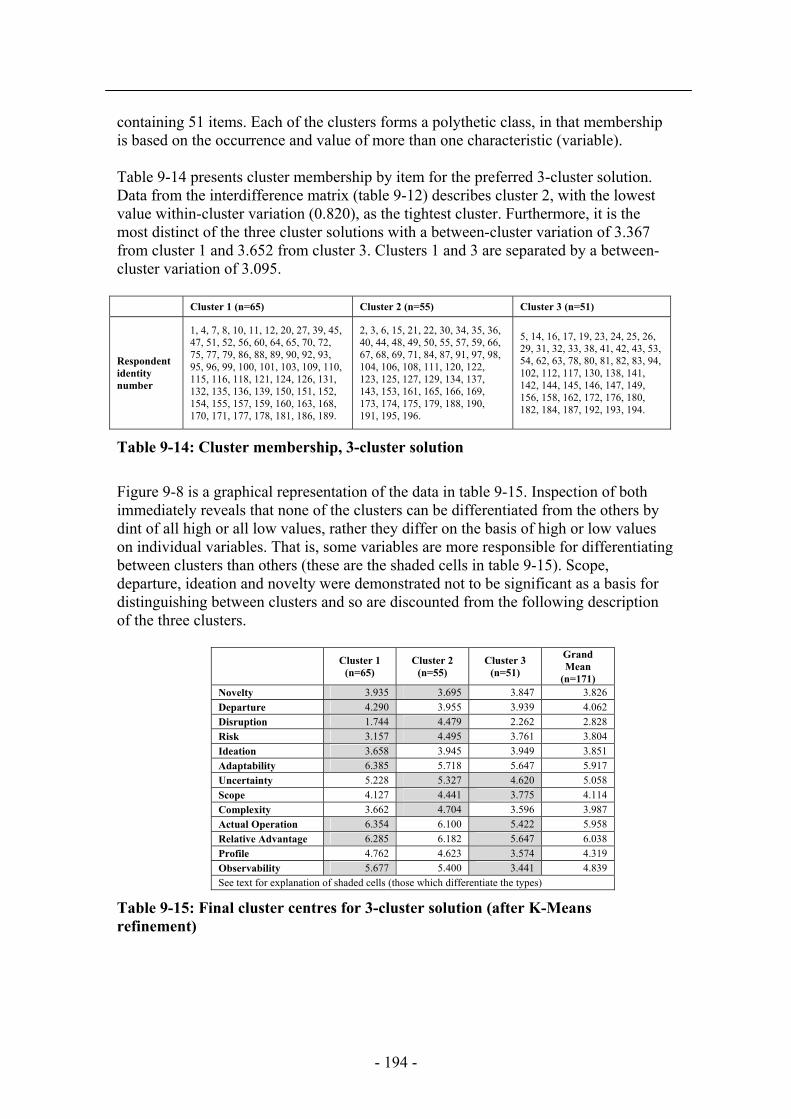
- 194 -
containing 51 items. Each of the clusters forms a polythetic class, in that membership is based on the occurrence and value of more than one characteristic (variable). Table 9-14 presents cluster membership by item for the preferred 3-cluster solution. Data from the interdifference matrix (table 9-12) describes cluster 2, with the lowest value within-cluster variation (0.820), as the tightest cluster. Furthermore, it is the most distinct of the three cluster solutions with a between-cluster variation of 3.367 from cluster 1 and 3.652 from cluster 3. Clusters 1 and 3 are separated by a between-cluster variation of 3.095. Cluster 1 (n=65) Cluster 2 (n=55) Cluster 3 (n=51)
Respondent identity number
1, 4, 7, 8, 10, 11, 12, 20, 27, 39, 45, 47, 51, 52, 56, 60, 64, 65, 70, 72, 75, 77, 79, 86, 88, 89, 90, 92, 93, 95, 96, 99, 100, 101, 103, 109, 110, 115, 116, 118, 121, 124, 126, 131, 132, 135, 136, 139, 150, 151, 152, 154, 155, 157, 159, 160, 163, 168, 170, 171, 177, 178, 181, 186, 189.
2, 3, 6, 15, 21, 22, 30, 34, 35, 36, 40, 44, 48, 49, 50, 55, 57, 59, 66, 67, 68, 69, 71, 84, 87, 91, 97, 98, 104, 106, 108, 111, 120, 122, 123, 125, 127, 129, 134, 137, 143, 153, 161, 165, 166, 169, 173, 174, 175, 179, 188, 190, 191, 195, 196.
5, 14, 16, 17, 19, 23, 24, 25, 26, 29, 31, 32, 33, 38, 41, 42, 43, 53, 54, 62, 63, 78, 80, 81, 82, 83, 94, 102, 112, 117, 130, 138, 141, 142, 144, 145, 146, 147, 149, 156, 158, 162, 172, 176, 180, 182, 184, 187, 192, 193, 194.
Table 9-14: Cluster membership, 3-cluster solution Figure 9-8 is a graphical representation of the data in table 9-15. Inspection of both immediately reveals that none of the clusters can be differentiated from the others by dint of all high or all low values, rather they differ on the basis of high or low values on individual variables. That is, some variables are more responsible for differentiating between clusters than others (these are the shaded cells in table 9-15). Scope, departure, ideation and novelty were demonstrated not to be significant as a basis for distinguishing between clusters and so are discounted from the following description of the three clusters.
Cluster 1 (n=65)
Cluster 2 (n=55)
Cluster 3 (n=51)
Grand Mean
(n=171) Novelty 3.935 3.695 3.847 3.826 Departure 4.290 3.955 3.939 4.062 Disruption 1.744 4.479 2.262 2.828 Risk 3.157 4.495 3.761 3.804 Ideation 3.658 3.945 3.949 3.851 Adaptability 6.385 5.718 5.647 5.917 Uncertainty 5.228 5.327 4.620 5.058 Scope 4.127 4.441 3.775 4.114 Complexity 3.662 4.704 3.596 3.987 Actual Operation 6.354 6.100 5.422 5.958 Relative Advantage 6.285 6.182 5.647 6.038 Profile 4.762 4.623 3.574 4.319 Observability 5.677 5.400 3.441 4.839 See text for explanation of shaded cells (those which differentiate the types)
Table 9-15: Final cluster centres for 3-cluster solution (after K-Means refinement)

- 195
-
Figu
re 9
-8: C
lust
er p
rofil
es b
y va
riab
le m
eans
1234567
Novelt
y
Depart
ure
Disrup
tion
Risk
Ideati
on
Adapta
bility
Uncert
ainty
Scope
Comple
xity
Actual
opera
tion Rela
tive a
dvan
tage
Profile
Observ
abilit
y
Clu
ster
Var
iabl
es
Likert Score (Cluster Centre)
Clu
ster
1C
lust
er 2
Clu
ster
3
FDS

- 196 -
This is confirmed by the ‘f-ratio’ statistic (see table 9-16). With larger values for the f-ratio indicating greater importance of that variable as a discriminating factor between variables. ‘Disruption’ and ‘observability’ are the most significant differentiating variables with f-ratios of 135.089 and 65.438 respectively. The variables ‘profile’, ‘actual operation’, ‘uncertainty’, ‘risk’, ‘adaptability’ and ‘complexity’ each have f-ratios greater than 10 and can, too, be considered as significant in differentiating between clusters. The variables ‘scope’, ‘relative advantage’, ‘departure’, ‘ideation’ and ‘novelty’ are not seen as significant in differentiating between clusters given their relatively low f-ratios. It is interesting to note that the variable ‘novelty’ has the lowest f-ratio in table 9-16.
F Sig.
Cluster Mean Square df
Error Mean Square Df
Disruption 121.152 2 0.896 168 135.089 0.000
Observability 80.722 2 1.233 168 65.438 0.000
Profile 22.910 2 1.129 168 20.276 0.000
Risk 26.653 2 1.339 168 19.895 0.000
Uncertainty 7.795 2 0.489 168 15.931 0.000
Complexity 21.443 2 1.387 168 15.460 0.000
Actual operation 12.873 2 0.861 168 14.941 0.000
Adaptability 9.956 2 0.913 168 10.903 0.000
Scope 5.876 2 0.622 168 9.443 0.000
Relative advantage 6.395 2 0.769 168 8.3093 0.000
Departure 2.373 2 0.578 168 4.106 0.020
Ideation 1.679 2 0.564 168 2.977 0.053
Novelty 0.872 2 0.672 168 1.295 0.276
Table 9-16: ANOVA analysis, 3-cluster solution Based on the data in tables 9-14 and 9-15, and figure 9-8, the three clusters can be described as follows: Cluster 1 is characterised by relatively high values for ‘adaptability’, ‘actual operation’, and ‘observability’ (and marginally higher values for ‘novelty’, ‘departure’, ‘profile’ and ‘relative advantage’), and relatively low values for ‘risk’ and ‘disruption’. Cluster 2 is characterised by relatively high values for ‘risk’, ‘disruption’, ‘scope’, ‘complexity’ and, marginally, ‘uncertainty’. Cluster 2 innovations also have relatively low values for ‘novelty’. Cluster 3 is characterised by relatively low values for ‘uncertainty’, ‘scope’, ‘actual operation’, ‘relative advantage’, ‘profile’ and ‘observability’.
9.11.2 Profiling by non-cluster (independent) variables The final profiling task is to describe the clusters in terms of variables not included in the clustering procedure. The basis of this profiling is four further variables: innovation area of focus, item source, clinical type and functional type. Two further variables, five and six, based on conceptualisations of novelty are extracted from the

- 197 -
framework. Novelty is a theoretically-based variable commonly used as a measure of innovation in a variety of studies. The basis for the four non-clustering variables is as follows: Innovation area of focus: The sample (n=171) was divided amongst four categories: technical, administrative/process, product/service and hybrid14 innovations (see Chapter four, table 4-4). Item source: The items in the sample were drawn from five different sources. Arguably each of these sources has unique characteristics. ‘Hospital Doctor’ and ‘Doctor’ magazines cater for discrete readerships in secondary and primary care. The ‘British Journal of Renal Medicine’ has a clinical specialist readership whereas the ‘British Association of Medical Managers’ (BAMM) has a focus on health management and the role of clinicians in health care management. Finally, the ‘British Medical Association’ (BMA) publication Pioneers in patient care: consultants leading change (BMA, 2001) profiles the work of medical consultants. Given the different focuses of each of these sources, it might be argued that items originating from each might share certain characteristics in common. However, the boundaries between the constituencies that each of these sources serve are grey. Some innovators have submitted applications to more than one of the sources and so the results must be interpreted with caution. Clinical type: the distinction between primary and secondary care is one of the most fundamental in health care provision in the UK. Items from the sample were categorised as primary, secondary or, in boundary-spanning cases, hybrid. Functional type: the final categorisation derives from the functional application of the innovations construed in the context of health care delivery. The 171 usable returns were synthesised into a list of eight functional types of innovation, these are described below in table 9-17. Device Physical medical apparatus or device introduced to effect a
specific purpose. N=9
Facility
The establishment of a unit for the delivery of care regimen to niche users. Might be bricks and mortar or the reallocation of resources to form an integrated approach. Includes improved pathway management. N=54
Appeal Fundraising and profile raising, communication to patients. N=5
Cyber-Medicine Provision of remote healthcare support and consultation facilitated by the use of ICT. N=6
Clinic Establishing a clinic dedicated to a defined condition. N=46
Nurse-led Delegation of aspects of clinical responsibilities to empowered nurses. N=11
Education / training Training for staff and for patients. N=19 Treatment A treatment previously unavailable in the local context. N=21
Table 9-17: Innovation functional types
14 The category hybrid was developed to accommodate those innovations that had blurred boundaries.

- 198 -
Novelty: the fifth and sixth variables employed were conceptualisations of novelty. Both were derived from aggregating and averaging responses to the survey instrument statements. Firstly, novelty is construed narrowly, simply in terms magnitude of change represented by the innovation. Variable values for this conceptualisation are derived from items 1.1 to 1.5 of the survey instrument. The sixth variable is a broader conceptualisation of newness comprising the dimensions novelty, disruption, departure and risk. Variable values for this broad conceptualisation are drawn from the items attached to statement groups 1, 2, 3 and 4 in the survey instrument. The response possibilities on the Likert scale range from 1 (strongly disagree) to 7 (strongly agree). Dividing the range of possible responses into three equal sets generates three possible degrees of novelty. Thus responses that fall into the 1.0 to 2.3 range are categorised as low, from 2.4 to 4.7 as medium and from 4.8 to 7.0 as high. A chi-squared test was run on data from variables not used for clustering in order to ascertain the significance of association between the non-clustering variables and cluster membership. The chi-squared test is mainly used to investigate whether proportions of certain categories are different in different groups. The chi-squared test compares the extent to which observed values differ from expected values, and is a ‘measure of association’ (Norman and Streiner, 2000). The results of this test are detailed in tables 9-18 to 9-23, below.
9.12 Results and discussion In this section the results of the cluster analysis and profiling are discussed. Innovation area of focus: The chi-square value for the association between ‘Innovation area of focus’ and ‘Cluster Membership’ was obtained as 2.303 with 6 degrees of freedom and a significance probability of 0.889 (not significant). On the basis of this data there would appear not to be an association between ‘Innovation area of focus’ and ‘Cluster Membership’ in the population from which this sample of 171 respondents was drawn. None of the clusters appear to have a distinctive profile based on the distribution of innovation types. Cluster 3, though, contains fewer product/service innovations than do clusters 1 and 2, and cluster 2 relatively fewer administrative/process innovations than clusters 1 and 3.
Cluster Membership Variable
1 2 3 N=
Chi-Square
Sig.
Innovation type 14 11 12 Technical 21 39 20 28 24 32 37
25 18 22 Administrative/process 38 38 33 28 43 51 65
25 25 16 Product/service 38 38 45 38 31 24 66
1 1 1 Hybrid 2 33 2 33 2 33 3
N= 65 55 51 171 2.303 0.889 (numerals in italics are percentages, vertical and horizontal)
Table 9-18: Chi squared test, association between cluster membership and innovation area of focus.

- 199 -
Source: The chi-square value for the association between ‘Source’ and ‘Cluster Membership’ was obtained as 12.307 with 8 degrees of freedom and a significance probability of 0.138 (not significant). On the basis of this data there would appear not to be an association between ‘Source’ and ‘Cluster Membership’ in the population from which this sample of 171 respondents was drawn. Notwithstanding the caveat made above, and although no strikingly distinctive profiles are evident, some features do emerge. Clusters 1 and 3 can be characterised as drawing relatively low proportions (16% each) of the total BAMM population and relatively high proportions (46% and 32% respectively) of the BMA population. Conversely, cluster 2 can be characterised as drawing a relatively high proportion (66%) of the total BAMM population and relatively low proportion (21%) of the BMA population. Cluster 2 is further differentiated from clusters 1 and 3 by the relatively low proportion (25%) originating from ‘Doctor’ magazine.
Cluster Membership Variable
1 2 3 N=
Chi-Square
Sig.
Source 2 8 4 BAMM 3 17 15 66 4 17 12
1 1 1 BJRM 2 33 2 33 2 33 3
22 10 15 BMA 39 47 18 21 29 32 47
31 27 20 Hospital Doctor 48 40 49 35 39 26 78
9 9 13 Doctor 13 29 16 29 25 42 31 12.307 0.138
N= 65 55 51 171 (figures in italics are %ages vertically and horizontally)
Table 9-19: Chi squared test, association between cluster membership and source. Clinical type: The chi-square value for the association between ‘Clinical type’ and ‘Cluster Membership’ was obtained as 4.973 with 4 degrees of freedom and a significance probability of 0.290 (not significant). On the basis of this data there would appear not to be an association between ‘Clinical type’ and ‘Cluster Membership’ in the population from which this sample of 171 respondents was drawn. No distinctive profiles emerge. However, a high proportion (55%) of primary care innovations are found in cluster 1.

- 200 -
Cluster Membership
Variable 1 2 3
N= Chi-Square
Sig.
Clinical type 16 6 7 Primary care 25 55 11 21 14 24 29
45 43 39 Secondary care 69 35 78 34 76 31 127
4 6 5 Cross-boundary hybrid 6 27 11 40 10 33 15 4.973 0.290
N= 65 55 51 171 (figures in italics are %ages vertically and horizontally)
Table 9-20: Chi squared test, association between cluster membership and clinical type. Functional type: The chi-square value for the association between ‘Functional type’ and ‘Cluster Membership’ was obtained as 14.216 with 14 degrees of freedom and a significance probability of 0.433 (not significant). On the basis of this data there would appear not to be an association between ‘Functional type’ and ‘Cluster Membership’ in the population from which this sample of 171 respondents was drawn. No distinctive profiles emerge. However, cluster 1 contains 46% of facility innovations, cluster 2 23% of clinic innovations and cluster 3, 63% of nurse-led innovations.
Cluster Membership Variable
1 2 3 N=
Chi-Square
Sig.
Function 2 4 3 Device 3 22 7 44 6 34 9
25 17 12 Facility 38 46 31 32 24 22 54
1 2 2 Appeal 2 20 2 40 4 40 5
2 3 1 Cyber-medicine 3 33 5 50 2 17 6
19 11 16 Clinic 29 41 20 24 31 35 46
1 3 7 Nurse-led 2 9 5 27 14 64 11
6 8 5 Education / training 9 32 15 42 10 26 19
9 7 5 Treatment 13 43 13 33 10 24 21 14.216 0.433
N= 65 55 51 171 (figures in italics are %ages vertically and horizontally)
Table 9-21: Chi squared test, association between cluster membership and functional type. Novelty: The chi-square value for the association between ‘Novelty’ and ‘Cluster Membership’ was obtained as 3.788 with 4 degrees of freedom and a significance

- 201 -
probability of 0.435 (not significant). On the basis of this data there would appear not to be an association between ‘Novelty’ and ‘Cluster Membership’ in the population from which this sample of 171 respondents was drawn. No distinctive profiles emerge.
Cluster Membership Variable
1 2 3 N=
Chi-Square
Sig.
Novelty (narrow) 7 3 7 High (4.8 - 7) 11 41 5 18 14 41 17
57 50 41 Medium (2.4 – 4.7) 88 39 91 34 80 28 148
1 2 3 Low (1- 2.3) 1 17 4 33 6 50 6 3.788 0.435
N= 65 55 51 171 (figures in italics are %ages vertically and horizontally)
Table 9-22: Chi squared test, association between cluster membership and novelty. Newness: The chi-square value for the association between ‘Newness’ and ‘Cluster Membership ‘was obtained as 12.313 with 4 degrees of freedom and a significance probability of 0.015 (significant). On the basis of this data there would appear to be an association between ‘Newness’ and ‘Cluster Membership’ in the population from which this sample of 171 respondents was drawn. However, 6 of the 9 cells on which the chi-squared analysis is based have an expected frequency of less than 5 thereby jeopardising the reliability of the test. The most striking observation is that all those innovations ranked as high in terms of a broad conceptualisation are found in cluster 2.
Cluster Membership Variable
1 2 3 N=
Chi-Square
Sig.
Newness (4 dimensions) 0 5 0 High (4.8 - 7) 0 0 9 100 0 0 5
63 49 51 Medium (2.4 – 4.7) 97 39 89 40 100 31 163
2 1 0 Low (1- 2.3) 3 67 2 33 0 0 3 12.313 0.015
N= 65 55 51 171 (figures in italics are %ages vertically and horizontally)
Table 9-23: Chi squared test, association between cluster membership and newness. This analysis would suggest that there is no pattern of relationship between alternative approaches to classification of innovation (‘Innovation area of focus’, ‘source’, ‘clinical type’, ‘functional area’ or ‘novelty’) and classification based on attributes. There is a weak suggestion that a relationship might exist between classification based on attributes and a wider conceptualisation of newness.

- 202 -
There are two caveats on this last point. First, the relatively large number of low value (<5) cells weakens the statistical process. Second, some relationship might be expected as the values on which chi-squared testing have been drawn from four of the 13 statement groups that form the survey instrument and on which cluster analysis was based.
Cluster variables Non cluster variables High Low Adaptability Actual operation Observability
Risk Disruption
High proportion of primary care (55%) and facility (46%) innovations. Low proportion of members originating from BAMM evident in the cluster (17%), but accounts for a high proportion of members originating from BMA (47%). Relatively even distribution of innovation type within the cluster. Only 1 of 11 nurse-led innovations is found in this cluster.
Table 9-24: Overview of type 1 innovations
Cluster variables Non cluster variables High Low Risk Disruption Scope Complexity
Novelty (marginal)
Contains the highest proportion of members originating from BAMM (66%) and lowest (21%) from BMA. Relatively high proportion (40%) of hybrid clinical type. A high proportion of the following functional innovations are found in cluster 2 devices (44%), cyber-medicine (50%) and education/training 42%. However, has only a small proportion of clinic innovations (24%). Where newness is conceptualised broadly, in terms of 4 dimensions, all high scoring innovations are found in cluster 2, consistent with the attributes in the adjoining columns.
Table 9-25: Overview of type 2 innovations
Cluster variables Non cluster variables High Low - Uncertainty
Scope Actual operation Relative advantage Profile Observability
Cluster 3 appears to occupy a middle ground between clusters 1 and 2 and has few distinguishing characteristics based on non-cluster variables. Innovations in this cluster are mostly administrative/process innovations and account for the largest proportion originating from Doctor magazine. Cluster 3 accounts for 64% of all nurse-led innovations and 50% of those innovations characterised as low novelty according to the narrow conceptualisation.
Table 9-26: Overview of type 3 innovations
The absence of strong relationships would suggest that the innovation framework operationalised in its current form describes innovation in a different way from previous approaches. As a means of classification a framework based on attributes

- 203 -
generates a taxonomy constituted differently from more conventional approaches. Ketchen and Shook (1996) argue that emergent clusters should be examined for their degree of concurrence with theory-based typologies in order to provide evidence of a cluster-solution’s descriptive validity. By this measure the descriptive validity of the 3-cluster solution would be low. It neither supports nor is supported by existing typological approaches. It does, however, indicate that the taxonomy that has been produced based on configurations of attributes presents a series of categories the contents of which differ from extant classifications. This research is underpinned by the argument that existing approaches are under-specified and so it is to be expected that the results of the cluster analysis will not be congruent with existing typologies. The attribute-based approach has generated an alternative taxonomy of innovation. To that extent this part of the research has achieved a useful result in the context of its underpinning research questions. The effect is that a classification based on attributes provides an alternate perspective in thinking about innovations. The innovations under examination in this study are conferred with attributes by innovators to the extent that three discrete types of innovation, differentiated by configurations of the presence, absence or value of the attributes, appear to exist. Although the analysis has shown that ‘departure’, ‘ideation’ and ‘novelty’ were not significant in this study, that is not to suggest that as factors they should be discounted in future studies. Indeed Phase I of this research established that they are attributes held by innovators, and this is supported by a long history of published research (particularly in support of ‘novelty’).
9.13 Summary A sample of 171 innovations in the UK NHS, drawn from five different sources, was subjected to a range of cluster analysis procedures. Innovations were clustered according to configurations of attributes as specified in the framework. Specifically cluster analysis has made possible the inclusion of multiple variables as sources of configuration definition (Ketchen and Shook, 1996) and permitted a holistic conceptualisation of innovation artefact.
Of the clustering procedures employed Ward’s method was shown to best satisfy the criteria laid down in Chapter eight for selecting cluster solutions and to provide the most stable and valid cluster solutions. Two cluster solutions, a 3-cluster solution and 4-cluster solution derived from Ward’s method, were then subject to non-hierarchical refinement in order to select the optimum solution. From this analysis a 3-cluster solution, based on innovators’ perceptions of their innovations, was selected as the preferred solution. The 3-cluster solution was then characterised in terms of variables used as a basis for cluster analysis and, also, in terms of a second set of variables not used as a basis for cluster analysis. Profiling according to variables not used as a basis for cluster analysis is important in assessing both the practical significance and theoretical basis of the cluster solution (Hair et al., 1998). By profiling by non-cluster variables two things have been demonstrated. First, that an approach based on the perceived attributes of

- 204 -
innovation recovers clusters with internal configurations of members that differ from those which may be generated by the conventional approaches to innovation typologising, namely by area of focus and novelty. Second, non-cluster variable profiling has demonstrated a weak relationship between a theoretically broad construct of novelty and the 3-cluster solution. In sum, innovation attributes provide an alternative framework for describing the properties of innovations in this particular sample. Meyer et al. (1997) argue that it is not enough to study the attributes of only one innovation within an organisation. There is a need to look at the nature of contrasting innovations in the context of the larger organisation to understand the extent and nature of innovation within that organisation. That is, we need knowledge about the fit between organisational processes of innovation and, members’ perceptions of innovations in order to advance theory and begin to understand the sorts of management environments in which innovations are initiated and implemented. The following chapter explores briefly some of the process characteristics associated with exemplars drawn from each of the three clusters.

- 205 -
10 PHASE III, THE TAXONOMY IN THE CONTEXT OF INNOVATION PROCESS
10.1 Section 1 - Introduction A case has been made for the conceptualisation of innovation based on attributes described by innovators’ and users’ perceptions. A framework composed of 13 discrete factors has been devised as a measure of these attributes and operationalised in a 56-item survey instrument. Following the application of the instrument to a sample of 310 innovations in the NHS and investigation by cluster analysis, three distinct clusters or types of innovation (type 1, type 2 and type 3) have been identified. It has been argued that the merit of any classification scheme is in its utility, in its contribution to help better understand a phenomenon, explain it or predict future behaviour (Everitt and Dunn, 2001). This chapter, in two sections, assesses the utility of the taxonomy in the context of an exploration of innovation processes. Innovation processes are chosen as the context for this exploration because, as the following review demonstrates, previous research has uncovered relationships between aspects of process and innovation outcomes. In the first section and, on the basis of a review of the literature and corroborating evidence from Phase I of this study, three perspectives of process are considered. First, process as a series of events that occur in more or less discrete, linear sequences. Second the individual activities of process. Third, process within the context of climate or enabling conditions. These three perspectives form the basis of a theoretical framework for the investigation of a sample of innovations drawn from each of the three types of the taxonomy. The second section of this chapter describes the data, analysis and results for Phase III. A study of process characteristics amongst a sample of innovations drawn from each of the clusters is evaluated and the chapter concludes with a discussion of process in the context of the new taxonomy. Again, the exploratory nature of the research drives the enquiry. The objective of this chapter is to seek new insights into the innovation process by regarding it through the lens of the new taxonomy.
10.2 Process Research Increasingly it has become the generally accepted position that innovation is not simply the serendipitous happenstance of the conjunction of new ideas and customer needs. It is, instead, regarded as a process that can be managed and improved, made better in terms of its effectiveness and efficiency. Studies of the success of innovations therefore tend to assume some sort of relationship between the process of innovation and the degree of successful outcome. These studies are notable by their focus on the presence or absence of process activities. Several major research studies have been undertaken to explore process factors associated with success: Project SAPPHO (Rothwell et al. 1974; Rothwell, 1974; Rothwell, 1985), project NewProd (Cooper, 1979b; Cooper, 1980; Cooper, 1986; Cooper and Kleinschmidt, 1987a; Cooper and Kleinschmidt, 1987b) and the Project Development Management Association studies on new product development practices

- 206 -
(Griffin and Page, 1996; Griffin, 1997b). There have also been numerous other studies that replicate or confirm much of this previous work (for example Maidique and Zirger, 1984; Balachandra and Friar, 1997; Lynn and Akgün, 2001; Danneels and Kleinschmidt, 2001; Storey and Easingwood, 1998; de Brentani and Ragot, 1996; Loch et al., 1996). There is broad agreement across these studies with regards to the correlates of success. Innovators must understand user needs, pay attention to market factors, make use of external advice and technology, use technology and scientific advice that is connected to experience, be efficient in development work and, assign senior individuals with authority. Chapter three describes two distinct perspectives on innovation process, the activity perspective (which sub-divides to studies of individual, discrete activities, such as idea generation and, holistic studies of the whole process as a sequence of activities) and enabling conditions. Processes, at the most fundamental level, can be thought of as that collection of tasks or activities which, together, and only together, transform inputs into outputs (Garvin, 1993). Lofland and Lofland (1995) describe process as a time-ordered sequence of steps or phases, a set of discrete, linear events. However, while individual, sequential events might be recognisable, in and of themselves, they are incomplete as process theories. To be considered as process theories, lists of activities must be supplemented by detailed description of the interaction of activities. Further, process theories obtain their fullest meaning when the richness of the process is captured and the range of interlinked activities and reciprocal impacts felt throughout the group are elucidated (Garvin, 1993). This is a view of process as a series of activities that take place in the context of an enabling environment, one which Pentland (1995) illustrates with the metaphor of grammar. While individual actions (‘words’ in the metaphor) can be recognised and have meaning in and of themselves, they give only the vaguest of clues to the outcome of their aggregation (the sentence). It is in the aggregation of the actions (words) into a unitary phenomenon (the sentence) that their sum, enabled and constrained by the environment (syntax), come to deliver a particular outcome (meaning) not evident from analysis of individual actions (words) in and of themselves. The metaphor is illuminating. There are three ways in which meaning can be derived from actions and events (words in the grammar metaphor). The first is by the inherent meaning of each activity (word). Second, by the aggregation of activities into processes (the sentence). Third, by understanding activities and processes in terms of their context (the syntax employed to construct the sentence). Extending the metaphor into the study of innovation process it could be argued that individual actions and events aggregate to compose the core process of innovating, activities central to the process of innovating. These activities and events can be understood to take place within the context of an enabling or constraining environment. Phase I of this research, in which data were also collected on teams’ processes (see Appendix four), confirmed the duality of activity and enabling climate, see table 10-1.

- 207 -
Perspective Category Factor
Triggers
Serendipity Critical moments Conjunctions Opportunism Problem recognition
Idea management
Information gathering Sifting Integration/combination Selection, Proliferation
Process formality Degree of planning Existing process Sequence of events
Testing Piloting
Activity
Implementation Launch Foisted implementation
Managerial commitment
Top management support Resource availability
Enabling conditions Group factors
Visions and guiding principles Champions and leadership Safety Challenge the orthodoxy Innovators tolerated/supported Making space Risk taking Empowerment/autonomy Tolerance of uncertainty Mutual support Peer group credibility
Table 10-1: Process factors uncovered in Phase I The notion of duality also finds support in the literature, not least of all Chiesa et al.’s (1996) technical innovation audit that discriminates between core and enabling processes. Other authors make similar distinctions, some taking an holistic approach, others disaggregating to studies of enabling climate, activity sequencing or individual activities. Rothwell (1992) describes five generations of perspectives on process (see table 10-2). Implicit within the later models is the notion of enabling conditions, in which factors such as collaboration, flexibility, integration and speed are increasingly emphasised. Rothwell’s (1992) review moves, across the decades, from 'first generation' linear and sequential technological push and needs-pull models to third, fourth and fifth generation integrated and networked models of innovation process. Technological-push and need-pull models, are essentially simple linear, sequential models with an emphasis respectively on research and development push or the market as a source of ideas. The third generation ‘coupling model’ reflects a view of process as being more interactive, characterised by feedback loops and push/pull combinations. The fourth generation marks a shift in thinking about innovation in strictly sequential terms to one in which process is conceived as a parallel phenomenon where activities may occur simultaneously. Schroeder et al.’s (1989) model, for example (see figure 10-1), can be thought of as representative of this transitional phase in thinking about innovation process. Rothwell (1992; 236) describes his fifth generation model as a “somewhat idealised model of the integrated (fourth generation) model” in which innovators

- 208 -
develop strategic integration in the form of inter company collaborations. The corollary of this increasingly complex First generation: Technology push: Simple linear sequential process, emphasis on research and development. The market is the passive receiver of fruits of research and development Second generation: Need-pull: Simple linear sequential process, emphasis on marketing. Research and development is reactive. Third generation: Coupling model: sequential but with feedback loops, research and development and marketing more in balance. Integration at the research and development and marketing interface. Fourth generation: Integrated model: Parallel development with integrated development teams. Strong upstream supplier linkages. Close coupling with leading edge customers. Emphasis on integration between research and development and manufacturing. Fifth generation: Systems integration and networking models: Fully integrated parallel development, strong linkages with leading edge customers, strategic integration with primary suppliers including co-development of new products. Horizontal linkages: joint ventures; collaborative research groupings; collaborative marketing arrangements. Emphasis on flexibility and speed of development.
Table 10-2: Five generations of innovation process (Source: Rothwell, 1992) innovation process is that managing innovation is a conspicuously exacting task and that organisations need to be flexible and adaptable, in short innovation friendly if they are to succeed in enabling the processes of innovation to take place productively (Rothwell, 1992). Whatever the actual sequence of events and the degree of feed-back and feed-forward cycles, it is clear that the path from initiation to implementation presents both managerial and research problems. Indeed, it is difficult to prescribe normatively a single set of activities or the order in which they occur as necessary in the fulfilment of the innovation process. The extent to which Rothwell’s five generations reflect the actuality of process in both its temporal context and complexity, or is merely an artefact of the methodological approaches contemporaneous with each generational type, is unclear. Nevertheless, it is a useful map of the different perspectives of process. Early research sought to establish the individual activities that comprise the innovation process and the order in which the activities appeared to occur, which would explain the linear simplicity of Rothwell’s (1992) first and second generation models. Figure 10-1 summarises 50 years’ of this research activity. Wolfe (1994) populated a similar map with seven ‘stages models’, figure 10-1 incorporates and extends this original work. This presents the models of process in a linear fashion, but it would be incorrect to assume that innovation process is as neat as the table might imply. It is clear from table 10-2 and figure 10-1that innovation processes may occur differently across innovating groups and that in the process of innovation multiple factors interact. The level and complexity of that interaction differs across cases (King, 1992), so not all

- 209 -
innovators manifest a process that is identifiable as a fifth generation process. It is not inconceivable for some innovation to occur in a first generation fashion. Three things are apparent from the tables: first, that process research has attracted considerable interest over the last five decades. Second, process is conceptualised in terms of two high level categories, innovation initiation and innovation implementation, for which Zaltman et al. (1973) are generally credited. Third, there would appear to be a high degree of consensus over the constituent parts, the discrete, individual activities that need to take place, of the innovation process. Further, these activities are variously labelled throughout the literature but several generic process models have been described. In the first section of this chapter three process perspectives are reviewed, event sequences, process activities and enabling climate. Event sequences are divided into three sub-types: linear, recursive and chaotic. Linear models are characterised by their sequential nature and have been demonstrated to best describe less radical or complex innovations. Recursive models are discussed and demonstrated to display apparently random characteristics in which activity is multiple, concurrent, and divergent in which the process includes feed back and feed forward loops. Finally, chaotic models are introduced. Empirically these are reckoned to be hard to identify. Clearly the process of innovation is a complex affair and, as figure 10-1 attests, consists of many activities. There would appear, however, to be relatively high level of consensus about the core process activities and, for the purposes of this study a simplified generic model of process activities is preferred. As the basis for the analysis of process activities a modified version of Avlonitis et al.’s (2001) generic process is used. It is preferred for this research for two reasons. First, in the absence of a model specific to the NHS a generic model is preferred to one that is oriented toward manufacturing industry. This model is less overtly product-oriented and techno-centric. Second, the model consists of four broadly defined categories idea generation and screening, business analysis, technical development and testing and, innovation launch. In terms of the objectives of Phase III, a broad exploration of the utility of the innovation taxonomy by its application in the context of innovation process, four activities were considered to be a manageable research proposition. Clearly, a generic model consisting of only four activities is a broad conceptualisation and may not be sensitive to idiosyncrasies of innovation processes in the health or service sector. There is, therefore, a trade-off between sensitivity of the model and research manageability which may limit the extent to which conclusions can be drawn from the study. Finally, the first section reviews the literature with regard to enabling climate which is held to consist of management commitment and group factors. Climate is generally regarded as playing the part of an intervening variable which affects the results of the operations of the innovators (Cebon and Newton, 1999). Climates are socially constructed and change over time as the patterns of interactions amongst members change (Fahey and Prusak, 1998). It is the proximal work group that represents the primary medium through which shared climates will evolve through active social interaction and ultimately become embedded in the fabric of the group (Mir and
- 210 -
Watson, 2001). However, senior management set the conditions within which climate develops (West and Anderson, 1996) and need to accept the need for change in order that innovation may be facilitated (Johne and Snelson, 1988a). These three perspectives form the basis for the investigation and analysis of the innovation processes underpinning the innovation types identified in Phase II.
10.3 Event sequence models
10.3.1 Linear Innovation is clearly regarded as a temporal phenomenon in that it takes place over time. Early process models (for example Zaltman et al., 1973) strongly imply a sense of linearity to the events and activities that together make the process. That is, not only cannot event B happen until after event A has happened, but all events take place in a sequential, orderly, linear fashion. Linear models tend to be built on the premise of the two high-level processes underpinning innovation. Firstly, ‘initiation’, this refers to those activities relating to issue identification and specification, information gathering, attitude formation and evaluation, resource attainment, and finally leading to a decision to adopt or reject the innovation. This may be an individual undertaking at first but gradually or rapidly becomes a multi-party activity as initiation develops and moves to the second stage, implementation (Damanpour, 1996). During implementation all events and actions pertaining to modification of both the innovation and the organisation occur, until the innovation becomes a routine feature of the organisation. Zaltman et al. (1973) are generally credited with introducing the initiation/implementation concept. These they call the major stages of the innovation process. In their model initiation is composed of three sub-stages (knowledge awareness, formation of attitudes and decision), the latter of two sub-stages (initial and then continued/sustained innovation). The major stages therefore are seen to consist of sets of temporally-linked, sequential, reciprocal, dependent phases or events. From this rather generic model of the innovation process other studies have developed variants reflecting context specific factors. The earliest process research tended to focus on the implementation (adoption and diffusion) of innovations and paid scant regard to the processes of creativity or invention. Innovation and invention and creativity were kept separate, the assumption being that innovations were largely ‘imported’ into an organisation. Little attention was paid to the emergence of novelty or generative processes by which social units initiated and then implemented ‘home-grown’ innovations. The first phase of Rogers and Shoemaker’s (1971; 100) 4-phase model, for example, is ‘awareness’ which they describe as “The individual learns of the existence of the new idea but lacks information about it”. The assumption here is clear, that they are considering only those innovations that are imported into the social unit.

- 211
-
In
itiat
ion
activ
ities
– C
omm
enci
ng w
ith p
robl
em o
r opp
ortu
nity
aw
aren
ess
Im
plem
enta
tion
activ
ities
- C
ulm
inat
es w
ith w
ides
prea
d co
ntin
ued
use
Ush
er, 1
954
Perc
eptio
n of
th
e pr
oble
m
Setti
ng th
e st
age
Act
of i
nsig
ht
C
ritic
al re
visi
on
Wils
on, 1
966
C
once
ptio
n of
the
chan
ge
Prop
osin
g th
e ch
ange
Ado
ptio
n an
d im
plem
enta
tion
Hag
e an
d A
iken
, 19
67
Ev
alua
tion
Initi
atio
n
Impl
emen
tatio
n R
outin
isat
ion
Shep
ard,
196
7
Idea
gen
erat
ion
A
dopt
ion
Im
plem
enta
tion
Rog
ers a
nd
Shoe
mak
er,
1971
A
war
enes
s In
tere
st
Ev
alua
tion
Tria
l
Ado
ptio
n
Mili
o, 1
971
C
once
ptua
lisat
ion
Tent
ativ
e ad
optio
nR
esou
rce
getti
ng
Im
plem
enta
tion
Inst
itutio
nalis
atio
n
Zaltm
an e
t al.,
19
73
Kno
wle
dge
or a
war
enes
s Fo
rmat
ion
of a
ttitu
des
Dec
isio
n
In
itial
impl
emen
tatio
n
Con
tinue
d, su
stai
ned
impl
emen
tatio
n
Daf
t, 19
78
Id
ea c
once
ptio
n Pr
opos
al
A
dopt
ion
- rej
ectio
n Im
plem
enta
tion
Ettli
e, 1
980
Aw
aren
ess
Eval
uatio
n Tr
ial
A
dopt
ion
- rej
ectio
n Im
plem
enta
tion
Torn
atzk
y, 1
983
Aw
aren
ess
M
atch
ing
or se
lect
ion
Ado
ptio
n - r
ejec
tion
Impl
emen
tatio
n R
outin
isat
ion/
com
mitm
ent
Rog
ers,
1983
Age
nda
setti
ng
Mat
chin
g
Red
efin
e &
rest
ruct
ure
Cla
rify
Rou
tinis
e
Pelz
, 198
3 C
once
rn
Sear
ch
A
ppra
isal
Se
lect
or r
ejec
t
Com
mitm
ent
Im
plem
enta
tion
Inco
rpor
atio
n D
iffus
ion
Mey
er a
nd
Goe
s, 19
88
Kno
wle
dge
or a
war
enes
s
Eval
uatio
n or
cho
ice
A
dopt
ion
Im
plem
enta
tion
Expa
nsio
n
Coo
per,
1988
a
In
itial
scre
enin
g Pr
elim
inar
y m
arke
t as
sess
men
t
Prel
imin
ary
tech
nica
l as
sess
men
t
Det
aile
d m
arke
t st
udy
and
mar
ketin
g re
sear
ch
Bus
ines
s and
fin
anci
al
anal
ysis
Prod
uct
deve
lopm
ent
In-h
ouse
pro
duct
te
stin
g C
usto
mer
test
s of
pro
duct
Te
st m
arke
t or
trial
sell
Tria
l pr
oduc
tion
Pre-
com
mer
cial
isat
ion
busi
ness
ana
lysi
s
Prod
uctio
n st
art-u
p M
arke
t lau
nch
John
e an
d Sn
elso
n, 1
988b
N
ew p
rodu
ct
plan
ning
Id
ea g
ener
atio
n Sc
reen
ing
D
evel
opm
ent
Con
curr
ent t
echn
ical
and
mar
ketin
g pr
otot
ypin
g ev
alua
tion
La
unch
Ang
le a
nd V
an
de V
en, 1
989
Star
t per
iod
M
iddl
e pe
riod
En
d pe
riod
Schr
oede
r et a
l.,
1989
Sh
ocks
Id
ea p
rolif
erat
ion
Se
tbac
ks &
su
rpris
es
Deg
ree
of li
nkin
g ol
d an
d ne
w
Res
truct
urin
g H
ands
-on
top
man
agem
ent
Coo
per a
nd
Zmud
, 199
0 In
itiat
ion
(pus
h or
pul
l)
A
dopt
ion
Ada
pt, d
evel
op,
inst
all
Acc
epta
nce,
usa
ge
Inco
rpor
atio
n/
rout
inis
atio
n In
fusi
on

- 212
-
Wes
t, 19
90
Rec
ogni
tion
Initi
atio
n
Im
plem
enta
tion
St
abili
satio
n
Bar
clay
, 199
2 N
PD
stra
tegy
Id
ea g
ener
atio
n Sc
reen
ing
and
eval
uatio
n B
usin
ess a
naly
sis
Dev
elop
men
t Te
stin
g
C
omm
erci
alis
atio
n
Rot
hwel
l, 19
92
Id
ea g
ener
atio
n
Dev
elop
men
t Pr
otot
ype
prod
uctio
n
M
anuf
actu
ring
M
arke
ting
and
sale
s M
arke
t pla
ce
Wol
fe, 1
994
Id
ea c
once
ptio
n A
war
enes
s M
atch
ing
App
rais
al
Pers
uasi
on
Impl
emen
tatio
n C
onfir
mat
ion
Rou
tinis
atio
n In
fusi
on
Chi
esa
et a
l.,
1996
Con
cept
gen
erat
ion
Pr
oduc
t de
velo
pmen
t Pr
oces
s inn
ovat
ion
Tech
nolo
gica
l acq
uisi
tion
Che
ng a
nd V
an
de V
en, 1
996
Cha
otic
star
t-up
perio
d
D
evel
opm
ent p
erio
d (p
erio
dici
ty)
Coo
per a
nd
Mer
rill,
1997
Res
earc
h an
d de
velo
pmen
t
Ado
ptio
n an
d ad
apta
tion
of
new
tech
nolo
gyD
esig
n Tr
aini
ng li
nked
to
inno
vatio
n To
olin
g up
and
star
t up
activ
ities
M
arke
ting
Inve
stm
ent i
n m
achi
nery
and
eq
uipm
ent
Prod
uctio
n en
gine
erin
g
Ver
yzer
, 199
8
C
once
pt e
valu
atio
n C
once
pt
refin
emen
t Te
chni
cal f
easi
bilit
y
Prod
uct d
esig
n
Song
and
M
onto
ya-W
eiss
, 19
98
Stra
tegi
c pl
anni
ng
Idea
dev
elop
men
t and
sc
reen
ing
Bus
ines
s and
mar
ket o
ppor
tuni
ty a
naly
sis
Tech
nica
l dev
elop
men
t
Prod
uct c
omm
erci
alis
atio
n
Rab
son
and
DeM
arco
, 199
9
Find
ing
Dev
elop
ing
Eval
uatin
g
Im
plem
entin
g
Fern
ánde
z, 2
001
Prop
osal
Ado
ptio
n D
evel
opm
ent
Impl
emen
tatio
n
Avl
oniti
s et a
l.,
2001
Idea
gen
erat
ion
and
scre
enin
g B
usin
ess a
naly
sis
and
mar
ketin
g st
rate
gy
Tech
nica
l de
velo
pmen
t ac
tiviti
es
Test
ing
La
unch
Kim
and
W
ilem
on, 2
002
Fuzz
y fr
ont e
nd
Figu
re 1
0-1:
50
year
s of i
nnov
atio
n pr
oces
s mod
els,
afte
r W
olfe
(199
4)

- 213 -
Linear models depict innovation happening in a series of discrete, sequential stages (Zaltman et al., 1973). Each is characterised by the first activity/event being a form of evaluative awareness of both an existing problem and extant external solution. As they say, “potential adopters must be aware that the innovation exists and that there is the opportunity to utilize the innovation within the organisation” (Zaltman et al., 1973; 62). The approach is somewhat at odds with their stated view that “the importance of new ideas cannot be overstated” (Zaltman et al., 1973; 8), but would explain the conceptualisation of the innovation process as an exogenous search for potential solutions. However, it is around the ‘idea’ that collective action mobilises, it is the rallying point that “provides the vehicle for otherwise isolated, disconnected, or competitive individuals to come together and […] contribute to the innovation process” (Van de Ven, 1986; 593). Both original and imported innovations are legitimate and should be included in any exploratory modelling. Over the next two decades variants of the linear model were developed. Daft (1978) produced a framework of process in which organisations are conceptualised as having two cores (hence ‘dual-core’ model), one technical and one administrative. In his retrospective study of 13 high schools he found strong support for the conclusion that the process of innovation appears to be contingent upon both the type of innovation (technical or administrative) and the professional level of employees. That is, innovative ideas follow different paths from conception to approval depending on the origin of idea. For example, they may trickle down from top administrators or may trickle up from technical personnel. Damanpour (1991) extended the initiation/implementation and dual-core models to produce the ambidextrous model. In doing so he provides further evidence of the contingent and contextual nature of innovation and the relationship between process and outcome. The ambidextrous model indicates that organic organisations15 tend to facilitate the initiation of technical innovations and that mechanistic organisations facilitate the implementation of administrative innovations. Damanpour provides weaker evidence that organic and mechanistic companies are better able to implement and initiate (respectively) technical and administrative innovations. Holbek (1988) called this split in innovation capability between organisational types the ‘innovation design dilemma’, and he proposed a solution. Holbek (1988) suggested that, although organisations can be characterised as organic or mechanistic, none is uniformly so across its whole range of activities, and so, administrative innovations can be initiated within mechanistic organisations but, the likelihood is that the initiating sub group will be characteristically organic. In Holbek’s (1988) solution there is the early recognition of the role of groups to the innovation process and some sense of enabling conditions. Initiation and implementation, he argued, can take place within the same organisation but by different sub groups, and the major stages differentiated in time and space.
15 After Burns and Stalker’s (1961) mechanistic and organic organisations, see Chapter three.

- 214 -
Rabson and DeMarco (1999) developed Holbek’s (1988) thesis. They envisage innovation taking place within a system or several systems. Still though, they adopt a sequential, linear model of process in which events and requisite activities are clearly identifiable. Organisations, they argue, face a predictable series of crises as they grow, and innovate, through the passage of time: revolutions interspersed with periods of relative calm evolution. Recognising these different events in the history of an organisation, they suggest a range of structural responses to deal with the different events. For example, they call for 'targeted innovation' systems for generating ideas (e.g. team brainstorming) or, 'venturing systems' for the commercial implementation of the innovation (e.g. independent start up businesses). The merit of the linear model is in identifying the different activities that groups engage in when tasked with being innovative and the different tasks needed to be performed at each of the identified phases. Further, implicit in the models is the idea that as processes appear to differ across cases so do the resultant innovations. Clearly the approach has limitations, not least the view of process as a discrete and orderly sequence of activities. Nevertheless, the approach predominated in the literature until around the time of the seminal Minnesota Studies (Van de Ven et al., 1989), which recognised and mapped out some of the discrepancies between extant innovation theory and practice. Within this corpus, Schroeder et al. (1989) are amongst the first to include endogenous generative (creativity, invention, idea generation) processes as part of the innovation process, and they strongly challenge the idea of orderly sequences. More recent literature suggests innovation is not the stable phenomenon that linear models imply (for example Wolfe, 1994); increasingly, the simple, unitary progression models have been discredited because of their lack of empirical validity. King (1992) demonstrates empirically that the Zaltman model is not well supported by the evidence. Such findings undermine, to some extent, the validity of all models built on the principle of linear, sequential stages. Linear models tend to be highly context specific and, useful in explaining only simple, incremental innovation. Whilst linear models provide a framework for understanding innovation their linear, sequential simplicity can deliver false hope in the attempt to understand what is increasingly regarded as a complex, iterative, recursive process. Non-linear perspectives of innovation describe a process that is fluid and dynamic, sometimes even random in which there is no apparent sequence of stages but is characterised by feed-back and feed-forward loops (Schroeder et al., 1989). The following sub-sections describe recursive and chaotic models of process, which are considered (the former, particularly) to be better representations of what actually happens.
10.3.2 Recursive At best the linear models pay only cursory attention to turbulent creative activity, at worst the creative front end of the innovation process is ignored, thereby rendering linear process models incomplete representations of the innovation process. It is possibly the exclusion of generative activity from the conceptualisation of innovation that renders early models amenable to linear representation. However, although innovation has been cast as a process consisting of a collection of identifiable events or stages it is not always a simple linear process. The notion of necessary antecedents notwithstanding, evidence suggests that, at a fine-grained level of analysis, any of the

- 215 -
identified events may happen at any time during the process of innovation (e.g. West, 1990). Later models include ideation, creativity and novelty generation in their purview and, characteristically, represent process as a more disorderly phenomenon, hence Kim and Wilemon’s (2002) conceptualisation of a ‘fuzzy front end’. Two things are noticeable about these models, first, as a collection of models they present a more disorderly aggregation of activities in which boundaries between events are less clear. Second, they describe a process that appears to commence in an informal and fluid state to one that ultimately becomes more formal and rigid (Cheng and Van de Ven, 1996). Pelz (1983) identified eight stages in his empirical study of the innovation process (see figure 10-1). In Pelz’s study 2000 innovation episodes inducted from the study of 18 innovations were refined into 276 categories from which, ultimately the eight stages of the innovation process were identified. Pelz’s answer to the question “are there innovating stages?” is contingent. For those innovations that are ‘originated’ (original) the sequence of events in the process overlap in time, is muddled and disorderly. For simple innovations that are borrowed, a moderately clear succession of stages appears. In a later study Pelz (1985) concluded with a contingent view of process, in which innovations with medium originality and low complexity display the highest resolution of stage identification. That is the resolution of the boundaries between one stage of the process and another appeared to depend on the complexity and/or originality of the innovation. That is not to say that, a muddled or disorderly process will necessarily culminate in an original or complex innovation. Nor, indeed, that an orderly process, in which the stages are relatively clear, cannot culminate in an original innovation: “apparently, an effective innovation could occur in either an orderly or muddled fashion, and so could an ineffective one” (Pelz, 1983; 66). The data gave no support for a normative view that stages should occur in a certain fashion to assure a particular outcome. The conclusion is that there appears to be a relationship between process and artefact though the exact nature of that relationship remains to be answered (Smith, 1998). In 20 years though, innovation research has not moved much beyond Pelz’s (1985) observation that technically simple innovations are installed with a more discrete succession of stages than are complex innovations.
Schroeder et al.'s (1989) view of innovation is that invention is the creation of ideas, but innovation is more encompassing and includes the process of developing and implementing the new idea. The organic model they describe comes close to a 'big bang' theory of innovation. A single large shock stimulates an innovative response from which many future outcomes are possible, which they describe as “multiple, divergent, parallel and convergent progressions of activities over time” (Schroeder et al., 1989; 132). The model comprises of six events, which are not discrete or linearly sequential (see figure 10-1). The principal benefit of Schroeder's model is that it recognises the untidy nature of the innovation process. The evidence of Schroeder et al suggests that back-tracking of the process and overlap of stages is likely to prove the norm not the exception.

- 216 -
In a separate and later study, using data from seven innovations in a hospital geriatric ward, King (1992) compared Schroeder et al.'s (1989) model with that of Zaltman et al. (1973). He suggests that neither model gives a wholly accurate representation of the data, though the Schroeder model is shown to outperform that of Zaltman. The Schroeder model is better able to offer an explanation of radical innovations than for relatively simple innovations, for which the Zaltman model performs better. King argues that there is greater support for dynamic models that recognise the untidy nature of the innovation process and that stage-based models are probably not very useful as descriptions of how the innovation process proceeds in real world cases. The study confirms Pelz's (1983) observations that innovation process phases are most discernible in the least radical innovations. It is evident, King concludes, that further research exploring whether or not the descriptive model of process changes according to the type of innovation under consideration. Recursive models stand up robustly against linear models (King, 1992), especially in understanding more complex or radical innovations (Schroeder et al., 1989). It would be wrong to assume a priori that innovation takes place in discrete stages even though it appears to comprise identifiable events. It seems safe to assume that the process is much more fluid than linear modelists have averred, but the extent of that fluidity is related to certain attributes of the innovation. The longitudinal, recursive modelists attempt to capture those factors in iterations of input-process-output models that generally adopt an individual or group cognition perspective. In doing so they recognise the holistic, social, path-dependant but untidy nature of innovating.
10.3.3 Chaotic A recent theme in exploring the dynamic nature of the innovation process in the theoretical mode of enquiry is the idea of chaos (Cheng and Van de Ven, 1996; Koput, 1997). Cheng and Van de Ven (1996) conceptualise four principal temporal pattern types borrowed from dynamical systems theory: fixed, periodic, chaotic and random. Using time series longitudinal data for two biomedical innovations, they produce phase plots to examine whether or not the patterns produced conform to patterns produced by systems that are known to exhibit properties of the four temporal types. Their study is limited by, amongst other things, sample size, short and ‘noisy’ time-series data and the ultimate failure of the innovations under study. However, that does not detract from their interesting observations on the innovation process, that it consists of a non-linear dynamic system which is neither orderly and predictable nor is it stochastic and random. Innovation process was found to exhibit a chaotic pattern in the initial developmental stages and an orderly, periodic pattern in the late and closing activities of development. The point at which behaviour shifts from chaotic to periodic, however, remains elusive. Indeed, we are no clearer, as a result of these studies, as to what a “chaotic model of innovation would look like if it were instantiated in an organisation”(Koput, 1997; 540). For this research, at least, the concept of chaotic process appears not very useful nor, indeed, easy to operationalise in a cross-sectional study. The few empirical studies in which chaos has been ‘discovered’ have utilised a longitudinal methodology and time
- 217 -
series data, this is an option that is not available in this study. Further, in the absence of a generic descriptive model of chaotic process (see Koput, 1997 in the previous paragraph) there is no referent against which the recollections of respondents can be assessed. Consequently, chaos is not included as part of the framework for analysis. Regardless of whether or not the process of innovation occurs in a linear, recursive or chaotic fashion it comprises sets of identifiable activities. The following section reviews the activities of a modified version of Avlonitis et al.’s (2001) generic process.
10.4 Process activities
10.4.1 Idea generation and screening Ideas are the raw materials for innovation and it is relatively inexpensive to generate and screen ideas (Smith, 1998). Song and Montoya-Weiss (1998) advocate an early cull of ideas in order to maintain control of costs. Successful idea generation is an important component of the process (Johne and Snelson, 1988b) and a variety of tools, techniques and procedures have been identified to encourage idea generation (Rochford, 1991; Smith, 1998; Thompson, 2003). An assumption appears to be that, through the use of generative tools, the objective is to generate as many ideas as possible yet, if it is done badly, it can have significant impact on ultimate success or failure (Cooper 1988). Formal techniques and procedures for screening tend to be invoked at the business analysis stage when the concepts and ideas are more fully developed (Cooper et al., 2001). Further, a close connection with the organisation’s marketplace is frequently cited as an important source of ideas (Cebon and Newton, 1999; Maylor, 2001; Parthasarthy and Hammond, 2002), with the clear implication that good innovation practice has some roots in being able to understand and assess customer needs. Similarly, external networks and linkages through participation in research projects or attendance at trade shows and so forth are important to idea generation (Cebon and Newton, 1999). Finally, close internal collaboration and communications have been positively associated with innovation (Damanpour, 1991; Lee and Xon, 1996; Anderson and West, 1998).
10.4.2 Business analysis At the business analysis stage individual ideas, propositions for new products, are evaluated in the local context: for example, cost-benefit analysis of the project, analysis of customer needs and so forth. Most conventionally the evaluation is described as taking place within the context of a manufacturing organisation’s product portfolio (Cooper et al., 1999, 2000, 2001). The importance of portfolio management to successful innovation has recently emerged as a key theme in the literature (Cooper et al., 1999) and is an important for the effectiveness of innovation process because of the rapidity at which resources are consumed during innovation and the need for this to be managed (Cebon and Newton, 1999). The focus of portfolio management is about the effective use of resources for innovation, the relationship between some future expected value of the innovation and resource utilisation. It is about making strategic, technological and resource choices

- 218 -
that will govern the future shape of the organisation (Cooper et al., 1999). Consequently, the effectiveness with which an organisation manages its research and development portfolio is often a key determinant of its competitive advantage (Bard et al., 1988) and a variety of tools and techniques have been developed to help in the process. The problem of allocation of resources, project-evaluation, selection and termination to arrive at an optimal balanced product portfolio has been extensively investigated over the last 50 years. The earliest approaches used financial measures such as return on investment as the primary decision criteria (Bard et al., 1988). Subsequently, increasingly sophisticated mathematical tools were developed to resolve what Schmidt and Freeland (1992) describe as the constrained optimisation problem, that is, to maximise the output (according to specified criteria) from a subset of available inputs. Partly due to the inherent complexity of the methods many of these project selection models “have been virtually ignored by industry” (Schmidt and Freeland, 1992; 190). This emphasis on quantitative methods failed to take into account qualitative aspects of the decision such as organisational (strategic, process, communication, climatic) factors. More recently models have tried to take account of more qualitative factors involved in decision processes. The range of methodological approaches to project selection is illustrated in table 10-3.
Increasingly quantitative………………...……………………………………………………………increasingly qualitativeHenriksen and Traynor, 1999
Mathematical programming
Economic models
Portfolio optimisation
Artificial intelligence
Decision analysis
Interactive methods Scoring Unstructured
peer review
Cooley, Hehmeyer, et al., 1986
Economic models
Portfolio optimisation Risk and decision analysis
models Scoring models
Hall & Nauda, 1990
Mathematical programming
Economic benefit Cognitive
emulation Comparative approaches
Scoring models
Ad hoc methods
Cooper, Edgett, et al., 1999
Financial Strategic optimisation techniques Bubble Scoring
Cooper, Edgett, et al., 2001
Mathematical optimisation
Financial and economic Probabilistic financial models
Decision support systems
Mapping Behavioural approaches
Scoring and checklists
Table 10-3: Methodological approaches to project selection In spite of the wide array of approaches to portfolio management in the literature there is little evidence of them having transferred into management practice (Henriksen and Traynor, 1999) and that there is a major gulf between theory and practice (Cooper et al., 1999). The most frequently used approaches they find are financial, but these are not associated with success (Cooper et al., 2000). Veryzer (1998) and Guellec and Pattinson (2001) report that since the 1990s highly structured approaches for managing the new product development process have emerged. Included in this are stage gate systems that divide the innovation process into a pre-determined set of stages. The number of stages varies across models, Barth (1998) describes five, Cooper (1990) seven. Each stage is composed of a group of

- 219 -
prescribed, related and often parallel activities. The “gates” function as quality control checkpoints at which stop/go decisions are made with regard to the progress of the project. Stage gates are really only a decision stage as opposed to an algorithm, though there is a history in the literature of algorithmic approaches to decision making in project evaluation and selection. It is widely recommended that organisations seeking to innovate establish formal processes for innovating and make use of tools and techniques that may facilitate the endeavours (Cooper et al., 1999). However, many of the tools devised for portfolio management appear not to be widely used in the context (research and development and NPD in commercially oriented organisations) for which they were developed. It might, therefore, be unreasonable to expect to find much, if any, evidence of their use in the NHS. Indeed, the extent to which the concept or practice of portfolio management has relevance in the context of innovation in the NHS is not clear. However, it would not be unreasonable to expect to find innovators making use of some aids to decision-making (though how they might look is difficult to gauge) and some variance in the degree of formality of the process.
10.4.3 Technical development and testing Avlonitis et al. (2001) describe this stage as relating to the design and development of process procedures and systems design. The stage is concerned with issues of designing both the innovation and also the means by which it will be brought to fruition. This is easier to conceptualise in product innovation processes where the product must be designed, as must the manufacturing and/or engineering processes that will make it, than it is in non-product sectors. Testing or trialing is the application of the new idea on a small scale in order to determine its utility (Rogers and Shoemaker, 1971), test production processes (Cooper, 1988a) and provide for market and technological testing (Johne and Snelson, 1988b). These can be in-house or market tests of an innovation’s operational and market aspects (Avlonitis et al., 2001)
10.4.4 Innovation launch The literature on launching innovations, possibly because it deals with the culmination of the innovation process, is rather thin. Activity at this stage tends to centre around post-launch analyses of the success or effectiveness of the process that brought about the innovation and/or evaluations of the contribution of the innovation to organisational performance. Infrequently issues with regard to the co-ordination and implementation of the launch get coverage.
10.5 Enabling climate Several models of innovation process distinguish themselves from others by taking account of the internal organisational environment that pertains during innovation. These tend to be in the minority, but would include the studies synopsised in table 10-4. These studies share in common the conclusion that by creating a facilitating environment innovation can flourish.

- 220 -
Study Enabling conditions Corporate conditions (Rothwell, 1992)
Management commitment, long term strategy, long-term commitment to major projects, corporate flexibility and responsiveness to change, acceptance of risk, innovation accepting entrepreneurship-accommodating culture
Team Climate Inventory (West and Anderson, 1996; Anderson and West, 1998; Anderson and West, 1998)
Vision, participative safety, task orientation, support for innovation
Enabling Processes (Chiesa et al., 1996)
Leadership, deployment of resources, use of appropriate systems and tools
Organisational Climate (Ekvall, 1996)
Challenge, freedom, idea support, trust/openness, dynamism/liveliness, playfulness/humour, debates, conflicts, risk-taking, idea time
Group Climate for Creativity (Amabile et al., 1996)
Encouragement, autonomy, resources, pressures, organisational impediments
Norms for Innovation and Change (O'Reilly and Tushman, 1997).
Norms for creativity: support for risk-taking and change, tolerance of mistakes. Norms for implementation: effective team functioning, speed of action
Table 10-4: Enabling conditions of innovative organisations Every group occupies some setting that affects the behaviour of its occupants in some way. No group can be fully understood unless its setting is analysed, this setting has been called ‘climate’ and ‘climate’ is the commonly used metaphor to describe these facilitating conditions. Both Ekvall (1996) and Anderson and West (1998) provide useful discussions of the use of climate as a construct. Climate is different from culture and context, it is more specific than either of these constructs. Hatch (1997; 205) provides several definitions of culture one of which suggests it to be “the glue that holds an organisation together through the sharing of patterns of meanings…[it] focuses on the values, beliefs and expectations that members come to share”. Climate is not glue, it is more like lubricant. It describes perceptions within a context. In effect climate is a construct which describes a range of variables that collectively contribute to melding an individual’s beliefs about the permissibility of (in this case) innovation in an organisation (Evangelista et al. 1998). To allow for innovation, Leonard and Sensiper (1998) demand a climate conducive to producing a wide and healthy proliferation of ideas and a successful divergent and convergent process. Abbey and Dickson (1983) suggest that innovative organisations are characterised by an organisational willingness to experiment with new ideas; an orientation toward creativity and innovative change; support for members in functioning independently in the pursuit of new ideas; a tolerance of diversity among members; and adequate supplies of resources and equipment. Whilst the components of climate would seem to relatively widely agreed upon it is in the nature of climate to be hard to access in measurement terms other than through people’s perceptions. Behaviour and sense-making are predicated on perceptions (Reger and Huff, 1993) and, it is evident that the perceived and experienced work environment does make a difference to levels of innovation and creativity in organisations (Amabile et al., 1996).

- 221 -
For the purposes of analysis in this research, to permit re-engagement with the sample, a simplified conceptualisation of climate is adopted: management commitment, consisting of top management support, allocation of resources and norms, and group factors consisting of champions & leadership, autonomy, social factors and group orientation.
10.6 Management commitment Management commitment, tolerance and lacking fear of change can create a climate conducive to innovation. This is especially important at the implementation stage of innovation, where conflict resolution might be necessary (Damanpour, 1991). It has been shown elsewhere that supportive attitudes are also necessary at the initiation stage. Dougherty and Cohen (1995) found the behaviour of senior managers to be influential. A culture of managing for efficiency presented itself as a barrier to being able to behave innovatively. Core ‘efficiency’ competencies can become core rigidities when the need to change behaviour and innovate was recognised (Leonard, 1998).
10.6.1 Norms Managerial commitment is reflected in norms or support for innovation. These are influenced by expectations, approval and practical support for the introduction of new and improved ways of doing things in the work environment. West (1990) distinguishes between articulated and enacted support for innovation, where there are high levels of both, in combination, attempts to introduce significant innovations are more likely. Indicators include: verbal support (in and outside group meetings); co-operation (group and interpersonal) in the development and application of new ideas; time and resource provision; tolerance of error; top management's (outside the group) support for innovation.
10.6.2 Top management support Implicit in studies of top management support is the distinctness of senior or top management and the innovating group, a distinction that was echoed in Phase I of this research. Top management sets the internal context for innovation or, the organisation’s strategic orientation. Ramanujam and Mensch (1985) defined innovation strategy as a timed sequence of internally consistent and conditional resource allocation decisions that are designed to fulfil an organisation's objectives. Strategy, therefore, defines the parameters within which innovation takes place and is made manifest: the setting of innovation goals and objectives, the marshalling and apportionment of resources, the initiation and supervision of activities, management leadership, attitude and support.
10.6.3 Resource allocation Brown and Svenson (1988; 30) describe the inputs into the research and development system as “the raw materials or stimuli a system receives and processes”, these include people, information, ideas, equipment, facilities, specific requests and funds. Other authors appear to be in agreement with this list of items, though use different labels and/or focus on particular items within the list. The broad range of inputs into the innovation process are illustrated in table 10-5.

- 222 -
Study Input factors Brown and Svenson, 1988
People, information, ideas, equipment, facilities, funds, specific requests
Ekvall, 1996 People, buildings, machinery, know-how, patents, funds and material concepts.
Lee et al., 1996 Research and development investment and facilities Research and development personnel
Chiesa et al., 1996 Resourcing, systems and tools Bontis, 2001 Structural capital, hardware, software, databases,
organisational structure, patents, trademarks, buildings, machinery
Geisler, 2002 People and skills, funding, guidance and gain, other resources and restraints
Table 10-5: Inputs to the innovation process Chiesa et al.’s (1996) notion of ‘resourcing’ combines adequacy of funding and people, specifically people with a range of experience in more than one function. This implicitly suggests that a range of skills and experience is an important input to the innovation process. Other studies endorse these observations. Clearly, adequate funding is important for innovation (Kerssens-van Drongelen and Bilderbeek, 1999; Geisler, 1995) as are the skills and experience of individuals (Merrill and McGeary, 2002; Kraft, 1990).
10.7 Group factors Scott and Bruce (1994) report that the nature of social relationships is important in developing an environment conducive for innovation. West and Anderson (1996) argue that team climate, characterised by levels of trust, autonomy, safety, discretion and group orientation, facilitate the establishment of a benign and supportive climate from which it is perceived possible for innovation to emerge. The importance of innovation champions whose role includes the promotion of the innovation both within the group and externally is also considered an important factor to group innovation processes (Dougherty and Hardy, 1996; Kleinschmidt and Cooper, 1991).
10.7.1 Champions and leadership According to Shane et al. (1995) a champion is an individual who promotes the development of an innovation within an organisation, particularly where organisational resistance to innovation exists. Champions can adopt different strategies to overcome resistance, these might include overcoming inertia by violating organisational norms, rules and procedures or, by making cross-functional appeals for support from organisational members (Shane et al., 1995). There is general agreement on the positive influence of leadership on innovation (Scott and Bruce, 1994; Amabile, 1998). The literature identifies two roles for leaders in the innovation process. The first might be defined as the leader-to-innovation role, a participative and collaborative style allowing for autonomy and latitude and, also, direction and control. Control though must be moderate and balance absolute freedom with support (King and Anderson, 1990). In a cross cultural study of innovation in the scientific instrument industry, Madhavan and Grover (1998) found the role of the

- 223 -
leader, particularly leaders with A-shaped skills16, to be important and conducive to innovation. Centralised leadership or low degrees of participation in decision making inhibits initiation of innovation but will facilitate implementation (West, 1990), Feldman’s (1988) study provides evidence of this. Zien and Buckler (1997) found successful leaders using story telling of innovative experiences and exploits as a useful motivational and climate setting tool. The second role of the leader could be defined as leader-to-environment role in which the leader is representative of the innovation project to the external environment, for example champions act as advocates to overcome organisational resistance, sell the project, get resources, motivate participants, co-ordinate and communicate (Kessler and Chakrabarti, 1996).
10.7.2 Autonomy There is general agreement on the importance of individual and group autonomy in the innovation process (Amabile 1998). Zien and Buckler (1997) assert the need for the freedom to experiment and, the creation of centres of safe havens without which innovation might be constrained. Different degrees of autonomy may be required at different phases through the innovation process. Whilst Autonomy is important for keeping innovative spirit alive (Zien and Buckler, 1997), it must be in balance with control. Feldman (1989) argued that autonomy is needed during the formulation phase of innovation, and control is needed during the implementation phase. This view requires that autonomy and control exist independently of each other within an organisation. For Feldman (1989) neither autonomy nor innovation can exist without the other. In the same way that day needs night to define it, so autonomy needs control: autonomy assumes independence from something, control assumes restrictions on liberty. In order to meet organisational goals the relation between autonomy and control must be properly balanced (see also Holbek’s (1988) resolution of the innovation design dilemma). Too great a level of autonomy can impact negatively on the implementation stage of an innovation though high levels of autonomy may have a positive impact on innovativeness. However, Feldman showed that this level of innovativeness was unusable by other departments in the organisation and, that greater levels of control exercised during initiation would have constrained the innovation process within the operational parameters of the organisation. Discretion, or empowerment for decision making is important too, and has been construed as existing on a continuum from none to self-management (de Leede et al., 1999). Fully empowered groups can challenge any extant status quo, be fully involved in the project and have strong commitment to it. High levels of empowerment limit the number of bureaucratic approvals that can change the shape of the innovation which can be demotivating (Gold, 2002). The view is supported by Dougherty and Cohen’s (1995) case study of Machco. The two innovations from which senior management remained operationally distant performed better, in terms of team satisfaction, time to market, project and product
16 Depth of expertise in two different disciplines enabling combinations of insights from multiple knowledge sets.

- 224 -
cost, customer acceptance and overall project success, than did those with a high level of senior management intervention.
10.7.3 Social factors Involvement in decision-making is encouraged, motivated and reinforced while occurring in an environment which is perceived as inter-personally non-threatening. The environment is characterised by non-judgemental, supportive, socio-emotional cohesiveness (West, 1990). This view is widely held in the literature. Pelz (1983) sees supportive climates as those encouraging interaction, autonomy, and the production of knowledge-generated achievement. Cohesiveness facilitates innovation because it enables high degrees of participative safety (Anderson and West, 1996), which permits the uncovering and articulation of personal, experiential, difficult to articulate tacit knowledge, which Nonaka (1995), amongst others (Leonard and Sensiper, 1998: Pitt and Clarke, 1999), argue is key to innovation. Networks of relationships constitute a valuable resource for the conduct of social affairs providing members with collectively owned social capital (Nahapiet and Ghoshal, 1998), much of which is embedded within networks of mutual acquaintance and recognition. Social capital is the “sum of the actual and potential resources embedded within, available through, and derived from the network of relationships” (Nahapiet and Ghoshal, 1998; 243) and is argued to be central to encouraging co-operative behaviour the enactment of which is important to innovation. Social interaction is important for collectives of individuals responsible for delivering new products, services and organisational processes (Leonard and Sensiper, 1998). Collaborative structures and processes provide the framework for the combination and exchange of knowledge and the creative solving of problems. In mature organisations structures and practices are frequently not designed for organisation-wide collaboration and problem solving (Cooper, 1979a), thereby hindering innovation. Rather, mature organisations are designed for co-ordination and efficiency: for example, reward systems that punish people for stepping outside established work roles and organisational routines that limit inter-functional interaction (Cooper, 1979a). Perry-Smith and Shalley (2003) argue that weaker social ties are generally, but not always, beneficial for creativity. While open communication between individuals helps develop trust, it is the organisational form and management philosophies that influence the openness of such communications. Trust is the reciprocal faith team members have in one another to complete the tasks in their areas of expertise successfully and, is important for cross functional team working (Madhavan and Grover, 1998). Trust allows for questioning, that may normally be perceived as aggressive or hostile, to be accepted with relative equanimity and, is an important lubricant in the social system (Nonaka, 1990). In a study of four Fortune 500 companies, Madhavan and Grover (1998) propose two types of team trust, trust in team orientation and trust in technical competence. Trust in team orientation being the reciprocal faith in others’ intentions and behaviour. Trust in technical competence, a cognitive variant of trust, is the extent to which team members are trusted to be competent to handle the challenges. Trust is a time-earned feature of relationships. Ruppel and Harrington (2000) suggest it evolves over time through the development of shared perceptions and, eventually leads to commitment, effort and

- 225 -
ultimately creativity and innovation. In short-lived groups an individual’s history, for example prior record of publications or record of successful projects completed, may serve as a proxy for trust.
10.7.4 Group orientation Anderson and West (1996) describe group orientation as climate for excellence, the shared concern with excellence of quality of task performance in relation to shared vision or outcomes, characterised by evaluations, modifications, control systems and critical appraisals. It allows for divergent thinking and competing perspectives particularly important for generation of creativity. Indicators of climate for excellence include: individual and team accountability; critical approaches to quality of task performance; inter-team advice, feedback and co-operation; mutual monitoring; appraisal of performance and ideas; clear outcome criteria; exploration of opposing opinions and constructive controversy. Where participants are in a co-operative context of emphasising mutually beneficial goals and, groups with a climate for excellence will demonstrate the kind of tolerance for diversity which "group think" disallows (West, 1990).
10.7.5 Vision Vision is an idea of a valued outcome which represents a higher order goal and motivating force at work (West, 1990). Pinto and Prescott (1988), in a study of 418 research teams, found a clearly stated vision to be the only factor having predictive power in terms of potential for success at all stages of the innovation process (conception, planning, execution & termination). To facilitate innovation successful visions must be clearly communicated, and understood collectively. They must also be valued and attainable (West, 1990). It has been argued that the clearer the vision (defined, shared, attainable, and valued team’s objectives) the more effective it is as a facilitator of innovation, as it enables focused development of new ideas that can be assessed more precisely (West, 1990). However, Leonard and Sensiper (1998) suggest that the more innovative the new product the less likely it is that the objectives have been spelled out in detailed specifications in advance. This is because it is more difficult to anticipate all needs and possible interactions in a radically new product or process. Therefore, the more clear and specific the explication of purpose the less likely the innovation is to score highly in terms of radicalness. Ambiguous project concepts allow for more speculation and creative abrasion (e.g. unsatisfactory understanding of the task, early misunderstandings) about what is to be produced but allow greater autonomy to exploit the cognitive processes that lead to radical innovation. For Kessler and Chakrabarti (1996) clarity of goals (clear specific time based objectives and clear specific product concept) is positively related to innovation speed. However, the need to balance specification of purpose with autonomy of cognitive processes suggests that there might be a curvilinear relationship between the explicitness of clarity of purpose and innovation outcome.

- 226 -
10.8 Section 2 - Investigating process amongst exemplar teams The objective of this section is to report on the short empirical investigation of process for each of the three innovation types identified in Phase II. This study provides the context for an evaluation of the taxonomy developed from Phases I and II. It is not an exhaustive study, rather it aims to identify which of the factors described in section one of this chapter are reported by innovators to have been important to their innovation process. First, the approach to research method, data collection and analysis are described. The presentation of a series of brief case histories and a discussion of the findings follow this. Finally, the section and chapter conclude with a discussion of the findings within the wider context of this research.
10.9 Research method Overall, the objective was briefly to explore the utility of the taxonomy of three clusters in the context of innovation processes. Choice of research strategy was limited by the historical nature of the phenomenon, as the innovation process had already been completed. Consequently, the recall of team leaders was relied upon. A semi-structured interview protocol, based on the review of process literature (above), was developed to guide this research (see Appendix ten). The interview protocol was designed to allow specific process issues, as described in the previous section, to be investigated. Rapidity was a significant issue partly because of time constraints on both the researcher and respondents’ sides and, as this was the second approach to respondents, it was important not to test respondents’ tolerance with a request for too long an interview. Respondents were asked to allocate approximately half an hour for the interview, some of which took place by telephone and others face-to-face. Some interviews (telephone and face-to-face) lasted for longer than half an hour, where respondents became particularly engaged in the topic. This allowed for more extensive data to be gathered and finer-grained exploration of some of the process issues. Two interviews lasted less than half an hour, where respondents were particularly pressed for time. The data collection exercise was closed with personal letters to each respondent thanking them for their co-operation. A number of requests have been received at each Phase of this research to keep respondents informed of the progress and outcomes of the study.
10.9.1 Data collection and sample The sampling frame consisted of nine innovations. The objective was to recruit an exemplar and a contrasting innovation from each cluster. To maximise the chances of this, three exemplars from each innovation type (the three innovations with least distance from cluster centres) and a further three, selected by random number generation, were selected and approached. The justification of the selection of exemplars is found in their tendency to generate unusual or amplified manifestations of the phenomenon of interest. Non-exemplar cases were sought in order to provide contrast to, and therefore help understand, the exemplar cases (Miles and Huberman, 1994). Team leaders were approached by post with a letter requesting a short interview. Included with the letter was a brief outline of the focus of the enquiry (See Appendix

- 227 -
eleven). Of the 18 team leaders approached, nine responded positively, six chose not to participate and three were unavailable. The nine who positively responded are unevenly distributed across the three clusters (see table 10-6). Exemplar innovations were recruited for types two and three, but none responded positively from type one. The characteristics of the sample are described in table 10-6 (the number in brackets indicates the distance of each innovation from its cluster centre).
Type 1 (distance) Exemplar = 1.492
Type 2 (distance) Exemplar = 1.892
Type 3 (distance) Exemplar = 1.606
126 (2.099) Technological Mental health Newness: 3.02
6 (1.892) Technological Mental health Newness: 4.47
180 (1.606) Technological Communication with patients Newness: 3.59
178 (2.415) Product/Service Mental health Newness: 3.33
22 (2.306) Administrative Staff recruitment and retention Newness: 3.54
32 (2.268) Technological Mental health Newness: 3.68
122 (2.934) Administrative Accident and emergency Newness: 4.30
108 (3.029) Technological Mentoring network Newness: 3.79
188 (3.200) Administrative Interventional radiology Newness: 3.81
Table 10-6: Phase III sample, characteristics
10.9.2 Data analysis Data were analysed according to the broad categories identified in the first section of this chapter. In Phase I of this research NVivo® software was used to facilitate document management and to facilitate the coding process. In Phase III documents were fewer in number and shorter in length than in Phase I. Consequently, interview transcripts were manually coded. The objective was to get a ‘feel’ for significant process issues and, subsequently, to look for patterns of significant process issues within and across clusters. Respondents were invited to tell the story of the process by which the innovation was developed and implemented in terms of the three categories of process already described. They were particularly requested to reflect on any significant moments or relationships with regard to the process that they felt were notable.
10.10 Results Short case histories are presented below for each of the nine innovations investigated. Each case is introduced by a selected quote from the respondent that the researcher

- 228 -
considers reasonable to summarise the history. An analysis and discussion follow these histories.
10.10.1 Type 1 Innovations Type 1 innovations have been characterised by relatively low values for ‘disruption’ and ‘risk’ and, high values for ‘adaptability’, ‘actual operation’ and ‘observability’. 10.10.1.1 Innovation 126 “I cannot say it was because of the people that were around us who were supporting us – that was not the case really”. Innovation 126 is a psychiatric rehabilitation unit, established following the closure of a traditional mental hospital that provided patients suffering from severe mental illness with 24-hour residential care. In order to provide this service, resources within the region were redistributed. This required the development of a service that enabled people currently benefiting from, but who did not need, 24-hour care to have a more independent lifestyle in the community. Resources were therefore freed to be targeted to younger, less chronic patients, but requiring 24-hour care, in order to ensure that they do not become chronic. The innovation was triggered by the conjunction of several events. First, the arrival of a new consultant. Second, a review of 24-hour rehabilitation care driven by the realisation that the wrong people (patients) were occupying a facility that was needed to meet the needs of younger people who needed 24-hour care. Finally, the development of a partnership with a housing association able to provide buildings development expertise. The innovation represented a challenge to the existing configuration of treatment of mentally ill patients that came from a newly appointed consultant. The consultant was able rapidly to construct a reasonably close-knit multi-disciplinary team around the idea of reorganisation of mental health care provision, but received little support from outside this team. Although guided by a vision of the mentally ill being better engaged into a good quality of life, the project had no clear vision of how this might be achieved or of the final outcome. No clearly discernible process could be identified other than one characterised by adaptability and flexibility, in being able to change direction and modify plans and expectations as the exigencies of resources and infrastructure demanded. 10.10.1.2 Innovation 178 “…a response to an area of need, and done in the form of a small pilot and adapted all the time and reviewed regularly”. Innovation 178 was developed and implemented by a team with an impressive track record of local innovation in community mental health. This particular innovation enabled the provision of targeted care to a population of dementia sufferers whose needs had, for some time, been inadequately catered for. Although the existing system

- 229 -
of care was widely recognised as being problematic the trigger for some sort of resolution did not appear until after the abnormally unsatisfactory experience of one patient. A series of inter-disciplinary and inter-institutional meetings scoped the problem. The lack of availability of long stay beds and limited financial resources necessitated an unorthodox solution to the problem. Following a feasibility study and small-scale piloting of the concept, over a two-year period, a new specialist service for dementia care became operational in 2000. Not only is the service reportedly distinct in terms of the nature of the service offered but also because in its operation it cuts across the boundaries of two NHS Trusts and draws funding from both health and social services. No clearly discernible sequence of activities was derived from the data. Certainly there appeared to be no formulaic or algorithmic approach to the management of the process of the innovation. Clearly discernible activities though, could be identified, notably: problem-scoping, idea generation, extensive internal and external collaboration and a market (patient) focused orientation. One process activity stood apart from the rest by dint of its embeddedness in the practice of the group: 6-weekly review meetings to assess the state of service provision and care performance. This is suggestive of a team oriented to a state of continuous improvement. Indeed, factors relating to enabling climate are repeatedly emphasised in the data. Significant amongst these factors are support within the innovating group and championing. Longevity and familiarity appear to have endowed the team with requisite levels of trust and individual professional credibility that created an enabling climate. Not that the original concept did not have to be ‘sold-in’ to the team at the start of the process as some felt the idea to be infeasible because of the demands that would be placed on it from patients suffering from similar but ineligible (in terms of the remit of the service) conditions. A strong champion with significant professional clinical credibility steered the innovation to its point of implementation at which point operational personnel took over responsibility. However, the champion built protective boundaries around the service to prevent it from becoming dissipated into the general provision of psychiatric and mental health services, thus ensuring continuity of care for the population of young dementia sufferers.
10.10.2 Type 2 Innovations Type 2 innovations have been characterised by relatively high values for ‘disruption’, ‘risk’, ‘scope’ and ‘complexity’. 10.10.2.1 Innovation 6 “It was a simple process of actually binding people and getting things done”. Innovation 6 is an IT-based register of treatment of mental illness for patients with a learning disability. The treatment has a narrow therapeutic range and blood monitoring is essential to ensure levels are appropriate. Although not wilfully neglectful of their health, patients with learning disability could not be relied upon to attend monitoring clinics. This sub-optimal level of monitoring was revealed in an audit of service delivery. Creating safe and effective systems, which enhance co-operation and

- 230 -
communication between health care professionals that result in improved patient monitoring is therefore important. Several process activities are clearly identifiable which appear to have occurred in a sequence. The use of formal idea generation techniques (brainstorming) led to further information gathering and idea generation to resolve the problem in the context of limited resources. As a result of resource limitations a clear process of options appraisal with business type criteria (cost, time, performance, IT resource availability) was undertaken. Concurrently options were reviewed in the context of the customer (patient with mental health problems) and the extent to which each option would meet their requirements. Ultimately the team was able to modify an existing IT system to satisfy its and its users’ requirements. The process appears to have occurred in a generally supportive environment, multidisciplinary team-working characterised by high levels of internal collaboration. Indeed, the team formally constitutes meetings on a regular basis to scan their operating environment and highlight gaps in their practice. However, the initiation and implementation of the innovation was largely an extramural activity that took place “…in the spaces between the day job”. 10.10.2.2 Innovation 22 “We took a stand and wanted to do this for ourselves” Innovation 22 is a recruitment and retention strategy devised and implemented at the level of the directorate17 that was a challenge to and in contrast to that which prevailed at the level of the Hospital Trust. In order to achieve its recruitment and retention objectives, this critical care directorate usurped the authority of the Trust’s personnel department. Indeed, part of the trigger for the innovation had been the slow turnaround of job applicants, from enquiry to job offer. So slow that it had frequently been the case that the applicant had found employment elsewhere by the time an offer had been made. The trigger for the innovation was the need to address the issue of staff retention and recruitment following the merger of two hospitals. A clinically trained member of the directorate staff had recently completed an MBA degree and was able to conceptualise the problem in terms of change management. With the professional assistance of an external clinical psychologist the directorate management team galvanised around the criticality of the issue and “provided massive support for the initiative”. Conversely, little support was received from the Trust’s management where the attitude toward the innovation appears to be one that conceived it as a threat to the due process of recruitment. The initiative also created tensions at a regional level where the sense of competition for recruitment of staff to critical care posts intensified. 17 Clinical directorates are management models in health care that aspire to involve clinicians in management, give a patient-centred approach to management with a business overview and tend to be organised around clinical specialities – for example palliative care (See section 7.3.2, Team A) (Rea, 1993).

- 231 -
The tension was managed by an open communications policy, the innovating team going to some lengths to keep stakeholders informed of what they were doing and why they were doing it. In no sense did the respondent consider the team to have been engaged in a process, rather there was a series of different problems for which solutions needed to be found. What followed, then, was a series of incremental innovations (for example raising the profile of the critical care directorate by branding and merchandising and, running recruitment stalls at national conferences) which together resolved the recruitment and retention problems. Success was attributed to the backing of directorate management, which consisted of individuals with clinical training. And the clinical psychologist who focused on team building amongst both clinical directorate management and directorate staff. 10.10.2.3 Innovation 108 “We felt that if we had gone up to the medical director and asked him if he wanted a mentoring network it would have been like asking him if he would like some bizarre south Indian dish that he had never heard of…so it was a process of looking and watching and influencing” Innovation 108 is the development and implementation of a mentoring network to support newly appointed consultants in one Hospital Trust. The role of consultant has historically brought with it a sense of machismo, according to the respondent, and consultants participating in mentoring schemes could potentially be seen as a sign of weakness. Mentoring had a stigma attached to it. Nevertheless, a small group had trained in mentoring skills and acted for each other in the manner of an informal network. In the year 2000, when the appraisal of consultants became a legislative requirement, senior management of the Hospital Trust were faced with a problem. What was an appraisal and who was going to do it? It was evident that medical consultants did not want to be appraised by (non-medically trained) managers. The mentoring group recognised that some of the skills they had developed as mentors were directly transferable to the appraisal process. Thus it was that the benefits of mentoring were introduced to consultants with the sanction of senior management. As the quote at the top of this section illustrates, the respondent considered it unlikely that any formal proposal for a mentoring scheme would have been well received. There was no senior management support (initially), though implementation was facilitated after the buy-in of one senior manager. However, implementation was only possible after opportunely demonstrating mentoring as a valuable tool for the Trust. Clearly the success of the innovation owes much to this opportunism. Indeed, there was no plan for the active promotion and dissemination of mentoring through the Trust. However, success was also attributed to the long period of trialing (since 1994) and piloting the process of mentoring and the use of external support (organisational psychologists and academics) to help the users of mentoring devise an approach that was adapted to fit their particular context.

- 232 -
10.10.2.4 Innovation 122 “…one of the factors that made setting up this group easier was that things were more in place here and I felt more in a position of permanence”. Innovation 122 was a community-wide, multi-agency violence prevention group, this was the initiative of a senior consultant, with its genesis in research he had conducted some 20 years previously. The traditional clinical ‘envelope’ begins with patient admission and ends with discharge. This innovation significantly expanded the boundaries of that envelope into the wider community. Following an epidemiological study of “…why people end up on my operating table with busted jaws, cut faces and all the rest” it became apparent that only about one quarter of (violent) offences that resulted in NHS casualty treatment appeared in police records. There was the realisation that there were perpetrators putting casualties on the operating table every day of the week who were not being investigated and were left free to re-offend, and the concomitant psychological distress of the victims that triggered this innovation. In the same way that the epidemiological studies of cancer have identified smoking as a risk factor, so innovation 122 sought to identify and reduce the risk factors associated with this form of injury. The innovation was clearly driven by the joint goals of reducing violence in the community and providing an integrated service for the victims. Understanding the histories of violence required a multi-agency approach, which included the police, judiciary and local authorities. Interested parties began to be recruited in 1996. This clinician had trialed a multi-agency approach to the reduction of violence in a previous geographical location. That initiative had not been sustained, it was suggested, because the organisational goals had been directed elsewhere at the time. A greater degree of independence in a subsequent post and the combination of academic and clinical roles allowed greater attention to be focused on its development and implementation. Trust senior management were reportedly very supportive of the innovation, but this was not felt (by the respondent) to be a significant factor in the process of the innovation. The significant factors were: collaborating with external agencies, A-shaped skills and hands-on involvement of the champion. Further, the Crime and Disorder Act was enacted in 1998 in which tackling crime became a multi-agency responsibility. Within this legislation health is included as a statutory partner. Innovation 122 was instrumental in helping to shape this legislation and, once enacted, a legislative framework for a multi-agency approach legitimised and helped embed the practice in the local community. 10.10.2.5 Innovation 188 “We never thought that we would be quite in the position that we are now. It was quite unintended”

- 233 -
Innovation 188 is described as an interdisciplinary communication strategy that has ultimately resulted in the development of a care procedure that is unique in the country. The label ‘interdisciplinary communication strategy’ masks the significant consequence of the innovation in that the team responsible devised a new protocol for the insertion and management of lines18 that predates, by two years, the guidelines issued by NICE (the National Institute for Clinical Excellence). The innovation is characterised, not by a clearly identifiable process as described above, but by a sequence of problem or issue awareness-issue resolution (see table 10-7). There was no apparent guiding vision apart from the “natural instincts” of one senior nurse who asked to take on the responsibility of line insertion and management for the patients under her care. Whilst this type of nurse responsibility was not practised in this particular unit it was, reportedly, not uncommon in hospitals in the UK. Indeed, before responsibility was delegated to the nurse (and training given etc.) literature reviews were undertaken to identify current best practice. As each subsequent issue became apparent then again best practice would be identified and implemented within the context of the unit. Each individual step of what was done had been carried out in other hospitals. For each change that was made supportive evidence of it having been done successfully and beneficially nationally or internationally was found. The result of this series of small innovations was a line insertion and management protocol unique in the UK. Issue Solution Need to check that central lines are appropriately positioned
Rapid radiological reporting
Lines need to be inserted into jugular Use of ultrasound to guide insertion Volume of line insertions per year using too much radiological resource
Delegation to nurses
Nurses lack appropriate training Training course developed for nurse and other non-specialist personnel
District nurses unfamiliar with management of lines (e.g. flushing)
Training of district nurses
Different lines and procedures used in different departments of same hospital
Reduce number of different types of line to 4 or 5
Table 10-7: Innovation 188, issue-solution cycle Principal contributory factor to the success was attributed to the informal nature of cross-disciplinary communication (radiology, oncology, nursing staff, external suppliers), accessibility of specialist personnel, all team members considered to be on a par and each knows what the others can do and, top management support. The Trust was supportive, in as much as what was being proposed by the team was felt to be 18 ‘Lines’ are the tubes inserted into the vascular system for the administration of, amongst other things, blood products and drugs. They can be inserted peripherally (e.g. hand), centrally (chest) or centrally via peripheral access. The latter alternative offers many advantages over the other two and is often the preferred method. However, radiological (x-ray, ultrasound) support is necessary in order to ensure that the line is correctly placed.

- 234 -
congruent with the criteria the Trust had established to streamline services and use the skill mix more effectively.
10.10.3 Type 3 Innovations Type 3 is characterised by relatively low values for ‘uncertainty’, ‘actual operation’, ‘relative advantage’, ‘profile’, ‘scope’ and, ‘observability’. 10.10.3.1 Innovation 32 “As always happens in the health service the true innovative processes are not at all related to the bureaucratic services” Prior to the publication of NICE guidelines some anti-dementia drugs had not been available nationally. These drugs were ‘post-code prescribed’, which meant that decisions were taken at a local level as to whether or not they should be made available to patients on the NHS. Criteria for this decision included affordability, perceived efficacy and availability of local expertise to administer the drugs. Innovation 32 is a service that was developed to facilitate the introduction of these drugs into practice in an effective and efficient way into an area covered by one NHS Trust with no experience of using the drugs, in accordance with NICE guidelines. At the request of the public health physician at the Health Authority the respondent, who had had experience of prescribing the drugs in a previous position, was asked to develop a protocol for their use. There followed a systematic approach of evidence gathering, review of alternative methods and local consultation that is suggestive of process as a linear sequence of activities. The protocol achieved early buy-in from potential users (prescribing clinicians) in primary and secondary care. At the time considerable reorganisation was taking place at an institutional level, Health Authorities were being replaced by NHS Trusts. In two and a half years the respondent’s employer changed three times as institutions merged, de-merged and then re-merged. As a consequence of the institutional instability, the adoption of the innovation in the region overtook the committee review due process procedure that existed to implement NICE guidelines. The development of the innovation and its implementation took place, therefore, out of the sight of senior management. In fairness it was not the sort of innovation that would normally require an unusual level of attention from the Health Authority chief executive, but the instability created a difficult environment in which to innovate. There was a confused period of business analysis (likely resource consumption implications resulting from prescription) due to changes at the institutional level in terms of commissioning arrangements and, lack of clarity about the availability of supplementary resources. This ambiguity and absence of extra resources required a flexible implementation from the multi-disciplinary team. Resources had to be cannibalised from other parts of the service (e.g. seconding nurses) and pharmacy “…just had to cope with any extra cost”. Two process factors were highlighted as being significant in successfully implementing innovation 32. The first was management support at the local level, management that was prepared to tolerate the ambiguity and sanction explorations of the unorthodox. The second was the

- 235 -
preparedness of the multi-disciplinary steering group to take the risk of avoiding due process “…if we had gone through all the due processes and followed the proper lines and so on we might well have not started using these drugs yet”. 10.10.3.2 Innovation 180 “… and I distinctly remember the occasional patient saying to me ‘Did you say I had an 80% chance of living or of dying?’”. In discussions of life and death in oncology clinics it became apparent, in this case, that there was a high tendency amongst patients to forget what had been said during consultations. This can be understandable in terms of distress felt because of the condition, complexity of the issues being discussed, possible range of alternatives, alien environment and so forth. At best this meant that the consultant had to repeat himself at a later date, at worst patients’ decision-making could be based only on partial remembrance. Innovation 180 is a simple patient communications strategy consisting of audio-tape recording and documentation of consultations developed to ensure that patients are able to reflect, at a later time, on the substance of the consultation and be appraised of potential future outcomes. Although the issue of patient consultation recollection might be supposed to be quite widespread anecdotal evidence suggests that taped records are infrequently used. Anecdotal evidence, again, suggests also that this may be because of issues of risk management and potential for litigation against clinicians. So it was that this inexpensive approach to solving patient consultation recollection found little support in the Trust in which it was being implemented (by a single user). However, experience had taught this innovator that soliciting institutional approval for behavioural or practice change was a cumbersome and ineffective approach. Consequently the innovation occurred within the user’s consulting rooms and, on occasion, funded by the user. Amongst the patient and primary care community the innovation has been readily accepted: patients, their families and GPs remain fully informed with regard to the patient’s condition and better placed to discuss and make decisions. Some clinicians were, reportedly, horrified at the notion but, following support from the Trust Chief Executive the innovation has become a routinised practice for at least one consultant.
10.11 Findings Visual inspection of table 10-8 reveals only a moderate degree of patterning of process factors between the three innovation types. Type 1 innovations are characterised by their relatively low values for ‘disruption’, ‘risk’ and ‘ideation’ and high values for ‘adaptability’, ‘actual operation’ and ‘observability’. Internally, type 1 innovations (items 126 and 178) do not appear to share very much in common in terms of process factors. Both though, report on the presence of idea generation and analysis activities, which distinguishes them from type 2 and type 3 innovations. In contrast to type 2 and type 3 innovations there does appear to be a greater emphasis on the front end of the innovation process. For type 1

- 236 -
innovations, fewer factors are remarked to be notable (either by their presence or absence) than is the case for types 2 and 3. Type 2 innovations are characterised by relatively high values for ‘disruption’, ‘risk’, ‘scope’ and ‘complexity’. Internally, there is some patterning of process factors for type 2 innovations. However, type 2 innovations reportedly emphasise group factors, particularly autonomy, Social factors and orientation. One notable exception is item 108 where ‘hospital machismo’ reportedly generated a climate in which it was felt unsafe to innovate. To a lesser extent, type 2 innovations exhibit some commonality of activity, reporting little emphasis on initiation activities (ideas and analysis) and some focus on implementation activities (technical development and launch). A final notable observation regarding the internal patterning of process factors related to type 2 innovations is the dissimilarity of factors related to management commitment. Norms and top management support were notably absent for items 22 and 108 as was resource allocation for item 188. The absence of a pattern suggests that each item is underpinned by different manifestations of management commitment. Type 3 innovations are characterised by relatively low values for ‘uncertainty’, ‘scope’, ‘actual operation’, ‘relative advantage’, ‘profile’ and ‘observability’. Internally, there is little obvious patterning immediately evident from visual inspection. Whilst there is no clear pattern of group factors, the activities and sequence of the innovation process are, reportedly, not notable and, there is a notable absence of management commitment (specifically norms and resource allocation). Visual inspection also fails to identify any strong external patterning of process factors that would clearly discriminate between types. The sequence in which activities occur appears not to be notable or to discriminate between innovation types. Two innovations (188 and 32) exhibit linear characteristics and two (126 and 108) exhibit recursive characteristics. For five of the innovations sequence of events was not considered a notable factor (either by its presence or absence). The two innovations that noted the presence of a linear sequence of events (32 and 188) do not noticeably share other characteristics. The two that reported a recursive sequence (126 and 108) share little in common, other than a noted absence of there being any formal or planned process. Group factors are notable across each of the clusters. Several studies have demonstrated that enabling climates are associated with successful innovation (West, 1990; Ekvall, 1996; Chiesa et al., 1996) and so, it is perhaps not surprising to find that group factors are notably present rather than absent or not mentioned given that each of these innovations can be considered in some sense a success (an assumption on the researcher’s part based on entry to awards). Five dimensions of group factors were investigated (champion, vision, autonomy, Social factors and orientation), none appears to be more significant than any other. The internal consistency of pattern configuration of each of the innovation types appears, on visual inspection, to be only moderate. This is also the case for external patterning. Visual inspection, therefore, provides modest support for the notion of the

- 237
-
In
nova
tions
Type
1
Type
2
Type
3
Proc
ess F
acto
rs
126
178
6#
22
108
122
188
32
180#
Idea
C
onju
nctio
n of
eve
nts
trigg
ers i
deas
Form
al
expl
orat
ion
of
pote
ntia
l so
lutio
ns to
tri
gger
issu
e
Form
al
tech
niqu
es
Exte
rnal
st
imul
i N
/A
Aca
dem
ic
rese
arch
N
/A
N/A
N
/A
Ana
lysi
s W
ith e
xter
nal
partn
er
Feas
ibili
ty
stud
ies a
nd
pilo
ting
Opt
ions
ap
prai
sal
N/A
N
/A
N/A
N
/A
Pilo
ting
N/A
Tech
nica
l de
velo
pmen
t N
/A
N/A
M
odifi
catio
n of
reso
urce
s
Test
ing
pote
ntia
l so
lutio
ns
Long
per
iod
of in
form
al
deve
lopm
ent
Pilo
ting
N/A
N
/A
N/A
Laun
ch
N/A
N
/A
N/A
Pr
ofile
bu
ildin
g
Form
ally
ap
plie
d to
m
ains
tream
ac
tiviti
es
Form
al h
igh
prof
ile la
unch
N
/A
N/A
N
/A
Act
ivity
Form
ality
N
o fo
rmal
pr
oces
s in
exis
tenc
e
Form
al
initi
atio
n
Form
ally
co
nstit
uted
re
view
s N
/A
No
form
al
proc
ess i
n ex
iste
nce
Mul
tiple
pa
rtner
s
No
form
al
proc
ess i
n ex
iste
nce
Reg
ular
ised
st
eerin
g gr
oup
N/A
Line
ar
N/A
N
/A
N/A
N
/A
N/A
N
/A
Serie
s of
disc
rete
ac
tiviti
es (b
ut
not
form
alis
ed)
Serie
s of
disc
rete
ac
tiviti
es (b
ut
not
form
alis
ed)
N/A
Act
ivity
an
d se
quen
ce
Sequ
ence
Rec
ursi
ve
Ada
ptab
le,
flexi
ble
and
able
to
mod
ify
N/A
N
/A
N/A
Ada
ptab
le,
flexi
ble
and
able
to
mod
ify
N/A
N
/A
N/A
N
/A C
ontd
/…

- 238
-
Inno
vatio
ns
Ty
pe 1
Ty
pe 2
Ty
pe 3
Pr
oces
s Fac
tors
12
6 17
8 6#
22
10
8 12
2 18
8 32
18
0#
Nor
ms
N/A
N
/A
N/A
N
ot
enco
urag
ed
Not
en
cour
aged
N
/A
N/A
N
ot
enco
urag
ed
Not
en
cour
aged
R
esou
rce
allo
catio
n
Div
erte
d fr
om
exis
ting
reso
urce
s N
/A
N/A
D
iver
ted
from
ex
istin
g re
sour
ces
N/A
D
iver
ted
from
ex
istin
g re
sour
ces
Div
erte
d fr
om
exis
ting
reso
urce
s
Lack
of
clar
ity
Self-
fund
ed
Man
agem
ent
com
mitm
ent
Top
man
agem
ent
supp
ort
N/A
N
/A
N/A
M
oder
atel
y ho
stile
Pa
ssiv
e Su
ppor
tive
Supp
ortiv
e Su
ppor
tive
N/A
Cha
mpi
on
New
co
nsul
tant
ch
ampi
ons t
he
inno
vatio
n
Con
sulta
nt-
led
Con
sulta
nt-
led
N/A
C
onsu
ltant
-le
d C
onsu
ltant
-le
d N
/A
Con
sulta
nt-
led
Con
sulta
nt-
led
Vis
ion
Vis
ion
of
dest
inat
ion
but n
ot o
f the
jo
urne
y
N/A
N
/A
N/A
Y
es
Yes
Y
es
N/A
Y
es
Aut
onom
y N
/A
N/A
In
depe
nden
t de
cisi
on
mak
ing
Dep
artm
enta
l au
tono
my
Yes
Y
es
Yes
Y
es
Yes
Soci
al fa
ctor
s N
/A
Long
evity
and
fa
mili
arity
Mul
ti di
scip
linar
y co
llabo
rativ
e te
am
Fam
iliar
ity
Hos
pita
l m
achi
smo
Perm
anen
ce
Info
rmal
and
cr
oss-
disc
iplin
ary
N/A
Y
es
Enab
ling
clim
ate
Gro
up fa
ctor
s
Orie
ntat
ion
N/A
N
/A
Reg
ular
re
view
s Sh
ared
ob
ject
ives
Sh
ared
ob
ject
ives
Sh
ared
ob
ject
ives
Fl
exib
ility
To
lera
nce
of
ambi
guity
C
halle
nge
to
orth
odox
y
Tab
le 1
0-8:
Com
pari
son
of in
nova
tions
’ pro
cess
cha
ract
eris
tics
# D
enot
es ty
pe e
xem
plar
s
Fact
or is
not
ably
abs
ent
Fa
ctor
is n
otab
ly p
rese
nt
Fa
ctor
is n
ot a
pplic
able
(N/A
)

- 239 -
three different innovation types being underpinned by different process factors. In order to test this conclusion cluster analysis was applied to the data, using Ward’s method and squared Euclidean distance19. The results of this analysis are presented in figure 10-2. Rescaled Distance Cluster Combine C A S E 0 5 10 15 20 25 Label Num +---------+---------+---------+---------+---------+ 178 2 òûòòòòòòòø 6 3 ò÷ ùòòòòòòòòòòòòòø 126 1 òòòòòòòòò÷ ùòòòòòòòòòòòòòòòòòòòòòòòòòø 122 6 òòòòòòòòòûòòòòòòòòòòòòò÷ ó 188 7 òòòòòòòòò÷ ó 32 8 òòòòòòòûòòòòòòòòòòòòòòòòòòòòòòòø ó 180 9 òòòòòòò÷ ùòòòòòòòòòòòòòòòòò÷ 22 4 òòòòòòòòòòòòòòòûòòòòòòòòòòòòòòò÷ 108 5 òòòòòòòòòòòòòòò÷
Figure 10-2: Dendrogram showing clusters of innovation types according to process factors The cluster analysis confirms the conclusion of the visual inspection that patterning according to process factors is moderate. It is evident that the process of cluster analysis has not generated 3 clusters comprised of items that make up the three innovation types. However, three clusters do appear to have been generated: • Cluster 1: items 6, 122, 126, 178 and 188 • Cluster 2: items 32 and 180 • Cluster 3: items 22 and 108 The membership of items according to their innovation type and the process cluster to which they belong, is illustrated in table 10-9. Innovation type Type 1 Type 2 Type 3 Item 126 178 6 122 188 22 108 32 180 Process cluster Cluster 1 Cluster 2 Cluster 3
Table 10-9: Item process and type membership The items in process cluster 1 (126, 178, 6, 122, and 188) are items that are drawn from both type 1 and type 2 innovations. Process cluster 2 contains only two items (22 and 108), both type 2 innovations. Finally, process cluster 3 contains two items (32 and 180), these are both type 3 innovations. There would appear to be some support,
19 See Chapter eight for full discussion of cluster analysis.

- 240 -
therefore for the distinctness of type 3 innovations on the basis of process factors. However, the degree of overlap between type 1 and type 2 innovations suggests that the two types may not be clearly discriminated in terms of their underlying processes. It is notable that the exemplar from type 2 (item 6) clusters with items from type 1 innovations. Using process factors as the cluster variables, the two items that comprise the sample of type 1 innovations cluster together as do the two items that comprise the type 3 sample. This suggests that there is some pattern of process that is common to type 1 innovations and is different from type 3 innovations. However, given that items comprising the sample drawn from type 2 innovations do not all cluster together weakens the claim of process separability. Three type 2 items (6, 122 and 188) cluster with items from type 1 innovations, and two items (22 and 108) form a separate cluster of which they are the only members. Cluster analysis, therefore, provides moderate support for the notion that innovations, distinguished from each other according to configurations of user perceptions, can be discriminated from each other according to process factors underpinning their development.
10.12 Summary Innovation is conceived of as a multi-stage process characterised by multiple concurrent and divergent activities that may or may not occur in discrete sequential stages (Schroeder et al., 1989) on which many social factors impinge (Scott and Bruce, 1994). The general conclusion of process theorists is that the fundamental components of the innovation process remain constant. However, there can be considerable variation across projects in terms of the nature and sequence of activities and the conditions in which innovation takes place, from which innovations that differ one from another in several respects may result. Empirical studies have suggested that innovation processes differ according to differences in selected attributes of the innovation (Pelz, 1983; Pelz, 1985; Schroeder et al., 1989; King, 1992). Although labels exist that describe the activities (processes) by which innovations are generated and implemented and, schemata that articulate the sequences of their occurrence, we know little and with little certainty, how different configurations of these activities might be associated with different types of innovation. Some authors suggest connections between processes and outcomes, Pelz (1983, 1985) connects disorderly processes with complexity and originality of outcome, Schroeder et al. (1989) and King (1992) connect disorderliness and the rated novelty of the outcome. It is on this basis that this chapter aims to build. On the basis of these observations this chapter has explored the utility of the innovation taxonomy developed in the previous chapter in terms of underlying process factors. The chapter commenced with a review of process literature, identifying three key themes: sequence of events, activities and enabling climate. A sample consisting of nine innovations drawn from each of the innovation types (two exemplars and seven contrasting innovations) was interrogated on these key themes. Following content analysis of qualitative data visual inspection and cluster analysis were used to identify

- 241 -
the extent to which the three innovation types exhibited internal homogeneity in terms of process factors and external heterogeneity between types. These results could be interpreted in several ways and should be treated with caution. It was not the objective of this research to investigate the nature of any relationships between innovation processes and types of innovation as described by the novel taxonomy. Rather, the objective was to explore the potential utility of the taxonomy in generating new insights into the nature of innovation. In applying the taxonomy to an investigation of process there appears to be moderate support for the proposition that innovation types 1, 2 and 3 can be discriminated according to underlying process factors. Type 1 innovations appear to be associated with an emphasis on factors relating to initiation and innovation championing, type 2 with factors relating to implementation and notably dissimilar instances of management commitment and, types 2 and 3 with enabling group factors. This research does not attempt to explain why this might be the case, that must be left for future research. However, it does demonstrate the utility of the taxonomy. Further, these results come with a caveat attached. First, the sample of innovations drawn from each of the types is not representative. Consequently it is difficult to generalise from the results of Phase III to the whole population of innovations that comprised the sample for Phase III. Second, the sample is unevenly distributed across the three innovation types, two items come from each of type 1 and type 3 and five items from type 2. Third, it is difficult to draw any firm conclusions with regard to the nature of internal patterning in a group when that group consists of only two items. Notwithstanding these limitations the results indicate that the taxonomy may provide a useful alternative perspective on the classification of innovations. The following chapter addresses this in greater detail.

- 242 -

- 243 -
11 CONCLUSION
11.1 Introduction The concept of innovation is complex and is not adequately explored in unidimensional studies. Slow progress in the development of innovation theory has been attributed to inconsistencies in the labelling of innovations (Garcia and Calantone, 2002). Consequently, innovation studies lack a shared set of concepts and definitions that, to an extent, promulgates context dependent, contingent theorising. The consequence is that opportunities for a cumulative tradition based on well-defined constructs and the operationalisation of these constructs are restricted (Moore and Benbasat, 1991). Past authors have chosen to distinguish between innovations according to different criteria such as newness or ‘radicalness’ (for example Damanpour, 1988), or innovation type such as technical, administrative…and so forth (for example Subramanian and Nilakanta, 1996). However, it cannot be assumed that all radical innovations are equal in their ‘radicalness’, or that one organisation’s administrative innovation would be similarly construed by another, though these are assumptions that underpin many previous studies. Extant classification systems can therefore be criticised for their tendency to assume that entities within a category of the classification system are identical on all dimensions (of the variables) that define that category. They may also be criticised for failing to take account of the mutability of innovations. Extant classification systems often lack generalisability because they fail to take account of the different ways in which innovations are perceived in different contexts and their labels are inconsistently defined and applied (Afuah and Bahram, 1995). This observation reflects Whitley’s (1984) wider critique of management research in which problems and approaches are selected in an ad hoc and opportunistic fashion. Without a clear specification of concepts and constructs it is unlikely that theory development in innovation studies could develop beyond Pinder and Moore’s (1979) notion of low level theory. There have been calls for a change of emphasis in the unit of analysis that places the innovation artefact at the centre of innovation studies. Wolfe (1994) argues for a move away from organisational innovation to ‘innovation-in-an-organisation’. This would help in the analysis of organisation specific innovation attributes and in investigating the nature of, and factors that influence, innovation processes within organisations. Calvert et al. (2002) argue for a more holistic approach to the study of innovation and the development of instruments that allow wider generalisability and comparative research. Such perspectives permit greater sensitivity to the multi-dimensionality of innovation. This research addresses the issue of non-comparability due to the absence of a scientifically grounded formal framework of innovation. The importance of scientifically determined classifications, as a basis for the advancement of knowledge,

- 244 -
is well established (Bailey, 1994). At the heart of this research is the objective of developing a generalisable formal framework of innovation, enabling the comparison of innovations across cases. This research conceives of innovations as consisting of diverse bundles of attributes. The notion of configurations provides a conceptual and theoretical starting point for operationalising a multi-attribute framework of innovation. Configurations are used to describe broad, natural bundles of the different elements that comprise an innovation, so that distinct types can be identified. Importantly, configurations do not specify direct causal relationships among the individual elements (Manu and Sriram, 1996) and the contribution of this research is not in explaining relationships but exploring aspects of their existence. A discussion of the three dominant approaches to the classification of innovations based on newness, area of focus and attributes is presented and their limitations are discussed. A novel system of classification of innovations based on a comprehensive conceptualisation of innovator and user perceptions of the innovation artefact is then proposed. In so doing, this research has drawn on the biological sciences’ approach to classification, a discipline that has long struggled with its own ‘species problem’, the problem of classifying diversity (Hey, 2001). Innovation researchers are required, at some point in their studies, to make a choice between breadth and depth of study. Straddling the two presents significant challenges within the context of a PhD. This research consists of three empirical phases, the first two are in-depth and the third broad. The research commenced with in-depth inductive empirical and literature studies designed to generate both a framework and a survey instrument to provide a sensitive measure of innovation, with high potential for general application. In Phase II, the survey instrument was distributed to a sample of 310 innovations from the NHS, drawn from examples of best practice and entrants to competitions. The framework and survey tool were designed as formal instruments (Blaikie, 1993) and may be generalised to other studies. From the survey, 171 usable returns were subjected to cluster analysis from which three clusters of innovation type emerged. The utility of this taxonomy is subsequently examined in Phase III by means of a brief exploration of process factors in a sample drawn from each of the three categories of innovation. The taxonomy provides a useful abstraction of the empirical observations of 171 innovations and identifies key variables describing the artefact/process relationship. In focusing on concepts of interest to innovators (in a single sector) the research contributes a synthesis of a wide variety of NHS innovating situations, and is consequently readily applicable in the context of practice. The triad of this study’s conceptual analysis, abstraction and the field of practice helps to close the theory-practice gap. However, the study is limited by its exploratory nature. Consequently, from its final phase it is difficult to draw widely generalisable conclusions. Analysis in this phase has been based on interpretations of the significance attributed by respondents to different parts of the process underpinning their innovations. Future studies might consider operationalising more robust measures of process in order that a more

- 245 -
objective understanding of the significance of process factors might be elucidated. However, in spite of these limitations, the findings provide a useful basis for discussion and future research and it is to these that this chapter now turns, first with a consideration of contribution.
11.2 Research contribution This research contributes to the existing body of knowledge in three areas: to academic theory, to the methodology of innovation research, and to the theory of practice. These contributions are reviewed below.
11.2.1 Contribution to academic theory The overarching objective of this research was to develop and investigate the utility of a classification of innovation based on a more sensitive and robust measure of the innovation artefact. Implicit within this objective was the requirement to address and overcome the conceptual and methodological limitations of previous research. Specifically, six major issues were identified in the literature: • The narrow conceptualisation of innovation artefact. • The empirical indefensibility of Rogers’ (1983) framework, on which a large
proportion of subsequent studies have been based. • The absence of systematic quantitative comparative analysis of the attributes of
different innovations. • The narrow scope of previous applications of multi-dimensional instruments. • Class homogeneity within existing typologies. • The problem of panel members ‘assigning’ attributes to others’ innovations (see
section: Contribution to the methodology of innovation research). Each of these issues is fully addressed below. The first issue identified was the problem of the narrow conceptualisation of innovation artefact. There have been relatively few empirical studies of attributes of innovation not least of all because of the conceptual and methodological complexity that such an approach implies (Fliegel and Kivlin, 1966). One contribution of this study is to that developing body of theory that adopts the innovation artefact as the unit of analysis and, importantly, attempts to treat it holistically rather than disaggregating it into its component parts. The argument for an holistic approach in organisational studies was laid down by the work of the Aston Group in the 1960s (Pugh and Hickson, 1996). They argued that the complexity and changing nature of organisations could best be understood by consideration of the working whole. Miller and Mintzberg (1983) developed the argument by suggesting that the analysis of organisations by their disintegration into component parts has not helped the resolution of key issues in organisation theory. Indeed, configurational thinking extends the tendency of contingency theorists to make disaggregated, one-to-one comparisons of variables to more holistic and aggregated comparisons of whole types (Pettigrew et al. 2001). The benefit of the holistic approach in innovation research is that it enables those items that have traditionally been viewed as discrete (i.e. multiple attributes) to be meshed in a powerful integrating device. In this instance that device is the framework of innovation attributes.

- 246 -
Through the exploration of attributes in the empirical study, this research addresses the second issue identified from the literature, the empirical indefensibility of Rogers’ (1983) framework, on which a large proportion of subsequent studies have been based. The role of attributes in innovation research is well-established (see Chapter five). The results of Phase II of this research suggest that ten of the 13 attributes operationalised appear significant to innovators in discriminating between innovations. Seven of these feature prominently in previous studies and so the results support earlier findings that ‘observability’ (Rogers and Shoemaker, 1971; Rogers, 1983; Tornatzky and Klein, 1982), ‘risk’ (Tornatzky and Klein, 1982), ‘uncertainty’ (Zaltman et al. 1973), ‘complexity’ (Rogers and Shoemaker, 1971; Rogers, 1983), ‘adaptability’ (Rogers and Shoemaker, 1971; Rogers, 1983), ‘scope’ (Goodman, 1981) and ‘relative advantage’ (Rogers and Shoemaker, 1971; Rogers, 1983; Tornatzky and Klein, 1982) play an important role in understanding innovation. ‘Departure’, ‘novelty’ (a narrow conceptualisation based on degree of change from pre-existing conditions) and ideation did not find wide support as distinguishing factors. This research offers the attributes ‘disruption’, ‘profile’ and ‘actual operation’ as salient in the perceptions of innovators as characteristics according to which they distinguish between innovations. These three attributes have little in the way of empirical or theoretical history in the innovation literature. It is further interesting to note the absence from the framework of factors significant in previous studies. Notable amongst these are ‘trialability’ and ‘cost’ (Rogers and Shoemaker, 1971; Rogers, 1983; Tornatzky and Klein, 1982). The absence of ‘trialability’ is a reflection of the selection criteria for the inclusion of attributes in the framework laid down in Phase I of the study. The absence, too, of an economic or financial perspective in the framework of attributes is notable. Downs and Mohr (1976) describe ‘cost’ as a primary attribute, one that is invariant across cases, though it is argued in Chapter 5 that the attribute ‘cost’ might be differentially reified according to individuals’ perceptions in different contexts. That is, it might be construed as expensive in one context and inexpensive in another. Nevertheless, Downs and Mohr note it to be a significant attribute. Frequently economic and financial factors are subsumed within the construct ‘relative advantage’ which comes to reflect social and financial benefits (Tornatzky and Klein, 1982). The absence of ‘cost’ from the framework of attributes can be explained by the rigidity of the selection criteria. The strict criteria were instrumental in helping to develop a rigorous and parsimonious framework and were important in addressing the third identified issue, the problem of the absence of systematic quantitative comparative analysis of the attributes of different innovations. This was addressed by the development of an instrument to measure individuals’ perceptions of innovations. It was developed from a general/formal framework and thus distinguishes itself from other instruments that measure perceptions. It contrasts with the innovation specificity of other multi-attribute research (for example, Moore and Benbasat (1991), Meyer et al. (1997), Agarwal and Prasad (1997), and Dearing and Meyer (1994)). Dearing and Meyer (1994) develop a conceptual tool to aid the prediction of which innovations, amongst a set of

- 247 -
functionally similar innovations, are most likely to be adopted, based on innovator and adopter perceptions. This research extends previous work by suggesting that a configuration based on attributes offers potentially richer opportunities for understanding than do classifications based on functionally similar innovations. By investigating a broad range of innovations, this research addresses the fourth key issue to be identified in the literature, the narrow scope of previous applications of multi-dimensional instruments. Importantly, this research moves attributes research away from narrow studies of single innovations in an organisation to a study of a range of contrasting innovations within the context of arguably the largest employer in western Europe. It is evident from the case histories in Phase III of the research that ‘piloting’ and ‘trialing’ and financial factors (in terms of resource allocation) were prominent features of some innovators’ processes (and not for others). This is the perennial problem of operationalising constraining frameworks, that one finds what one is looking for. As Rogers (1983; 177) notes, “when investigations are designed with the concept of re-invention in mind, a certain degree of reinvention is usually found”. One consequence of the strict selection criteria was that some attributes, potentially significant from the point of view of classification variables, were excluded. These selection criteria stipulated that, to be included in the framework, evidence of the attribute must be present in the majority of responses and in each of the case studies. The output of cluster analysis is immediately constrained by the selection of variables used to characterise the item, any derived structures are therefore only reflections the structure of the data that has been defined by the initial variables (Hair et al., 1998). The consequence is that variables with value as a discriminating factor may have been excluded, clearly this will have to be tested in future research. Therefore, it might be argued that the conceptualisation remains narrow and therefore the patterns identified within the data are incomplete because (important) dimensions may have been excluded. It may be that the absence of these partly contributes to the only modest relationships found between innovation and process in Phase III. Further, it limits any claims regarding the formal and generalisable qualities of the framework. The framework, its operationalisation and the subsequent emerging innovation types address the fifth issue identified in the literature, that of class homogeneity within existing typologies. This research has contributed to a finer-grained, ‘nuanced’ investigation of innovation process than other classifications of innovation permit. The finding that innovators’ perceptions vary is not original. What is new is the discovery that these variations configure into three discrete types of innovation. This extends Meyer et al.’s (1993) observation in strategic management research that there is a tendency of multiple attributes to fall into coherent patterns, into the domain of innovation. The finding that a narrow conceptualisation of novelty was not a useful factor in the perceptions of innovators to discriminate between innovations may represent something of a challenge to the orthodox approach to the classification of innovations. It may be the case that the borders between innovation types are blurred, and that they

- 248 -
cannot easily be classified. But, the value of this analysis has not been to assert the existence of ‘natural’ types of innovation but the provision of an approach and nascent framework that is a useful tool for communication and exploration. That is, attributes provide a useful framework for examining the properties of innovations and as a basis for their classification. This study also makes a contribution to innovation process research. The utility of the new taxonomy was explored in the context of innovation processes. Phase III considered three aspects of process: activities, sequencing and enabling climate. The framework for the analysis of process was drawn from existing theory and was broadly scoped. On the basis of the analysis of data, drawn from nine cases from the three innovation types discovered in Phase II, no new elements of process were unearthed, which confirms the completeness and endurance of extant models. However, different process elements were found to be emphasised in each of the three innovation types. Innovation types 1 and 2 were distinguished from each other in terms of their emphasis on activities associated with the initiation and implementation of innovations. The requisite group and organisational characteristics appropriate for initiating and implementing innovations have long been considered to be different (Burns and Stalker, 1961; Holbek, 1988; Rabson and DeMarco, 1999). This research provides empirical support for that dichotomisation but, for the first time, relates it to the characteristics of the artefact, not of the organisation. The high relative value for ‘adaptability’ that characterises type 1 innovations may reflect the focus on initiation activities, particularly idea screening and business analysis, where solutions that have the potential to be moulded to specific local circumstances are selected. Type 2 innovations, on the other hand, are characterised by high values for ‘disruption’, ‘risk’, ‘scope’ and ‘complexity’, which may explain the apparent focus on implementation activities. Type 3 innovations did not exhibit any clear activity patterns. Type 3 innovations were notable for the reported absence of management commitment (that is, senior management external to the management within the innovating group). Management commitment has been positively associated with innovation success (Amabile, 1983; West and Anderson, 1996). Arguably, all the innovations in the Phase III sample are ‘successes’, an assumption based on the fact that each was an applicant for an award. It is interesting, therefore, to notice the absence of management commitment in these successful innovations. For innovation types 2 and 3 group factors were reportedly notable and appear to confirm the work of Anderson and West (1996; 1998), West and Anderson (1992; 1996) and Ekvall (1996). Why it is that type 1 innovations do not report either the notable presence or absence of group factors is unclear. Both type 1 innovations report the notable presence of a champion. Presence of a single product champion differentiates successful innovations from failures. The champion is the individual whose presence differentiates most strongly for success. They are generally individuals who are enthusiastic towards the innovation, but who also have sufficient authority and power to affect the course of the innovation. The role is one of communication and co-

- 249 -
ordination, to organise the marketing, production and research and development functions and to integrate them into a continuous innovation process (Rothwell et al., 1974). This may suggest the presence of an heroic, lone innovator for type 1 innovations, supporting the work of Schon (1963). This was a plausible explanation for innovation 126, but innovation 178 was clearly a group effort. Innovation 22 represents an interesting contrast to Daft's (1978) dual-core model of innovation. Ostensibly recruitment and retention would be considered to be administrative innovations, originating in the administrative core of the organisation. This was not the case in this instance. The administrative core had reportedly failed to innovate and it was this failure that stimulates the technical core to develop its own innovation in response to the perceived failures of the administrative system. The administrative core then proceeded to try and claim the innovation for its own with the resultant consequence that once taken away from the technical core, from which it originated, the innovation failed to deliver any of its earlier benefits. Finally, this research makes a contribution to that body of research that investigates organisational climates for innovation. The predominant theme in this body of literature is to identify optimum or ideal characteristics of innovation climate (Anderson and West, 1998; Ekvall, 1996). Whilst these studies describe climates that managers might strive to emulate or promulgate, this research describes the lived-experiences of clinicians and managers in the NHS. As such it provides them with a road map of issues to be alert to in undertaking the process of innovation.
11.2.2 Contribution to the methodology of innovation research In the preceding chapters much has been made of the need for methodologies and conceptual frameworks that will enable innovation research to be broadened and shared across cases and across studies. The diversity of operational definitions and different disciplines’ analytical and methodological assumptions has created richness in innovation studies but makes comparison problematic. This issue of unstable frameworks has been addressed through the systematic quantitative comparative analysis of the different attributes of innovations facilitated by cluster analysis. One objective of this research was to develop a taxonomy of innovation based on users’ and innovators’ perceptions. No studies with this objective, either in the NHS, or indeed any other sector, have been discovered. In order to achieve this objective, principles and methods of numerical taxonomy elucidated by Sneath and Sokal (1973), see table 11-1 have been employed. This approach marks something of a departure in innovation research. The introduction into the management sciences of statistical tools for systematic classification has provided the opportunity to explore the existence of types based on configurations of their attributes. It is uncommon for innovators and users to rate innovations according to their perceptions, in this case elicited by the use of Likert scales. More commonly, panels of judges assign scores to an innovation or series of innovations, (for example (Wilson et al., 1999; West and Anderson, 1996), and these scores are then held to be constant across adopting organisations. This seems a rather remote way of assessing

- 250 -
Practice of numerical taxonomy
Research question and objective
Research method
Organisms and characters are chosen and recorded.
How do users and innovators perceive their innovations? Identify and catalogue attributes from previous research and validate them in the context of empirical study.
Inductive empirical (4 case studies combining interview, repertory grid technique and analysis of documentary data) and literature studies.
The resemblances between organisms are calculated. Taxa are based upon these.
Do attributes configure into discrete taxa? Create parsimonious framework based on strict selection criteria. Explore whether or not innovations can be clustered according to different configurations of attributes.
Utilise Churchill’s (1973) paradigm as a guide for synthesis and instrument development. Apply survey instrument to sample of innovations and calculate degrees of similarity through cluster analysis. Stopping rules establish number of taxa (i.e. number of innovation types).
Generalisations are made about the taxa (such as inferences about their phylogeny, choice of discriminatory characters etc).
To what extent can differences in process be recognised for each of the types of innovation? Explore utility of the taxonomy in the context of innovation process.
Cross-sectional exploration of process in sample drawn from each taxa (innovation type) by telephone interview. Content analysis for identification of process factors.
Table 11-1: Sequence of operations in numerical taxonomy developed in biological sciences and applied in innovation research (after Sneath and Sokal, 1973; 5) perceptions that are normally assumed to change across individuals. The problem of panel members ‘assigning’ attributes to innovations was held to be the sixth issue identified in the literature. The method employed in this research accommodates the variation of perceptions across individuals and permits a method of comparison of innovations that share and have in common configurations of attributes. Arguably, this creates an analytically more relevant dimensionalisation of innovation than those based on judges’ assessments (Warner, 1974). As such, the research design adds to earlier research into perceptions in innovation by developing and operationalising the multi-dimensional configurational approach.
11.2.3 Contribution to the theory of practice The issue of innovation is currently significant in the NHS, and this research makes a contribution to those involved in the tasks associated with it. The NHS is characterised as a political and politicised organisation, influenced by multiple and often conflicting interest groups and stakeholders. Further, attempts to bridge the often tense power relation dynamics between clinicians and managers have been made with the development of the hybrid clinician-as-manager (Fitzgerald and Dufour, 1998). McNulty and Ferlie (2002) draw attention to the changing context of the UK health care sector and argue that change cannot and should not be abstracted from the context from the context in which it occurs. Thus, the characteristics of the milieu are likely to be important to an understanding of the processes of innovation. Shifts in political ideologies since the 1980s have led to processes of managerialisation and

- 251 -
marketisation of the health service, but not fully to the extent that the NHS has converged with private sector organisations in terms of behaviours, drivers, and practices. Individual clinicians are increasingly being asked to take on managerial roles in the NHS for which they have little training. This research exposes, for the first time, the ways in which they perceive one aspect of that role. One interesting outcome of this research is that, although the innovation artefact was specified as the unit of analysis, respondents seemed unable easily to distinguish the artefact from arguably contextual or environmental factors. That is, they did not perceive their innovations as existing independently from the context of their development and ultimate application. Consequently, the framework developed as the empirical survey instrument for this research cannot be accurately described as a framework describing output or outcome in the conventional uses of the terms. Thus confirming Dearing and Meyer’s (1994) conclusion that when answering questions about innovation attributes, respondents do consider broader contextual issues. It is apparent from this study that innovators in the NHS are not well informed of the output of several decades worth of innovation research. In recent years some attempt has been made to inform change agents, increasingly clinicians tasked with management responsibilities, with some of the output of this research (for example Iles and Sutherland (2001). However, the development of management skills is not prioritised in the general education of clinicians. Consequently, this research offers a useful contribution to the education of innovators in the NHS. In narrow terms, a number of innovators who participated in the research found the process educative and informative, for example:
“…the (innovation) process we are going through is not working (because of the debate initiated by repertory grid technique) I am really beginning to understand why some of our projects are going better than others... the methodology we are using in that is really not going very well... we haven't really got the methodology … the problem is that there isn't really a defined methodology and it is becoming evident” [B1].
More widely, by synthesising the perceptions of 171 innovators into three innovation types, the research contributes by elucidating innovation environments in which, in this single sector, innovators may potentially find themselves operating. Unique process profiles have been suggested for each of the three types of innovation developed in this research. This may provide a valuable framework for generating additional insights into management needs and techniques necessary for different innovation types. For example, type 2 innovations are characterised by relatively high values for ‘risk’, ‘disruption’, ‘scope’ and, ‘complexity’. There are echoes in the type 2 processes of discontinuous innovation. Veryzer (1998) described discontinuous innovation as being characterised by high levels of uncertainty, an exploratory less-customer-driven process that, because of its uneven iterative nature, is less well-suited to formalised highly-structured processes or systems. As Veryzer (1998; 318) notes “It is important…that the development process for these types of [innovations] allows for

- 252 -
the ‘unconventional’ progression of activities inherent in discontinuous innovation”. It may be that innovations occur without the commitment of senior management and that, under such conditions, innovating is inherently risky, disruptive and uncertain. Case study A in Phase I suggested that this may particularly be the case where innovations are confrontational. Clinicians engaged in the dual role of clinical care and management process can struggle with the complexity of conflicting demands (Weight, 2001). The three emergent innovation types and the associated processes imply different innovation contexts across organisations. By recognising differences between them it may be possible to describe generic management responses to each of these conditions. This would be particularly important in the case of clinicians with little managerial experience. Consequently the research makes a contribution to enabling more prudent and better-informed management decisions, with regard to innovation, amongst a community that is now encouraged to solve problems and work in ways for which it has no particular training. Further, a taxonomy based on attributes offers a more plausible basis for comparison and generalisation because it does not rely on the assumption of constancy as do typologies based on area of focus. As Meyer et al. (1997) note, managers need to be aware that contextual factors impact the ways in which innovation attributes affect innovation outcomes. Within the context of the NHS such an understanding of the different ways in which innovations are perceived can help managers be more prepared for the issues that they may encounter when tasked with being innovative. Such an approach to measurement may possibly be extended to other sectors. Through its Beacon Status programme the NHS tends to encourage organisational learning on a functional basis, that is palliative care teams will learn from other palliative care teams. This is clearly a legacy of the clinical prioritisation that has characterised health care. This research has demonstrated that an innovation in palliative care may have more in common with an innovation in, say accident and emergency or primary care than with another innovation in palliative care (expressed in terms of configurations of attributes). A final contribution of this research then, is to ease this complexity through the articulation of the process-artefact relationship. This broadens the scope for organisational learning in the NHS.
11.3 Validity, limitations and future research This alternative approach to classification of innovations supplements the more orthodox views based on newness and area of focus and offers a more sensitive facility to investigate the nuances and complexities of innovation. Nevertheless, the study does have some limitations. The overall research objective of this study has been accomplished through a series of projects, described as phases, each following a different research strategy. The principal contribution of this research lies in the first two phases in which the taxonomy is developed. The third phase offers a brief exploration of process, and illustrates a potential application of the taxonomy. Each of the three phases can be conceived to stand alone as a discrete project. They are all, however, underpinned by a realist perspective, justified in terms of facilitating the exploration of people’s difficult to articulate perceptions. The notion of reproductive

- 253 -
compatibility appears to be a natural basis on which to ground the species concept in the biological sciences. The equivalent in innovation research appears to be the notion of newness. The sufficiency of newness has been challenged in this research and an alternative scheme based on innovators’ perceptions has been proposed. This has provided some utility for generating insights into the artefact-process relationship. Ultimately, however all classification schemes might be described as arbitrary, the products of people’s linguistic or epistemic predilections and measurement efforts too often create boundaries where none apparently exist (Gold, 2002). Whilst these are credible positions to maintain from the realist standpoint, the issues of validity and reliability are sensitive ones for research orientations that reject positivism’s implied methodological correctness. The positivistic preoccupations of validity and reliability are argued to be inappropriate in qualitative research (Kincheloe and McLaren, 1994). Consequently, Schwandt (1994) wonders ‘in what sense can knowledge that is socially constructed (as realism allows) and residing in the minds of individuals reasonably be said to be verifiable or testable?’ That is not to say though, that the confidence that validity and reliability impart to a piece of research is inconsequential. Alternative criteria for qualitative and interpretive research, against which levels of confidence can be appraised, have been suggested (Yin, 1994; Mark and Lynch, 2000; Kincheloe and McLaren, 1994). Case studies underpin Phase I of the research and Yin (1994) recommends three tactics to ensure construct validity in support of this strategy. The findings of this stage are based on multiple sources of evidence, there is a clear and auditable chain of evidence and informants have been involved in reviewing the analysis. Component parts for the framework were drawn from 23 semi-structured interviews, 16 applications of repertory grid technique and archival data from four cases of successful innovation. These data were subject to content analysis and reduced by the method of constant comparison as elaborated by Glaser and Strauss (1980) and Miles and Huberman (1994). The data were synthesised with that drawn from the extensive, systematic and ongoing thematic investigation of the literature. The practice of 'systematic review' is relatively long-established in disciplines such as medicine where it has been described as a "fundamental scientific activity" (Mulrow, 1994; 597). One objective of systematic review is to provide a synthesis of otherwise unmanageable volumes of research studies which, through the use of explicit methods, aims to limit bias and improve the reliability and accuracy of conclusions (Mulrow, 1994). In management research, however, it is relatively untried and a methodology has only recently been proposed (Tranfield et al., 2003). This research pre-dates Tranfield et al.'s (2003) process and some of the features of systematic review were not adopted. In particular, the review was not driven by a review panel and was not pre-planned. However, in all other respects, the principles of systematic review were adhered to. This review employed a comprehensive search to locate all relevant studies, the relevance and quality of these studies was appraised and key descriptive findings presented. Key attributes of innovations were then extracted from individual studies and, by identifying patterns and making connections, these were synthesised into a framework of innovations based on attributes. As Campbell et

- 254 -
al. (2003; 672) suggest, the aim of any synthesis is to "achieve a greater level of understanding and attain a level of conceptual or theoretical development beyond that achieved in any individual empirical study". This review represents a theoretical development and formed the basis for the formal framework of innovation used in the empirical study. Subsequently, the framework was drawn up subject to specified criteria and, as the research moved from a qualitative to quantitative approach the survey instrument was developed according to Churchill’s (1973) paradigm. The framework is developed from high quality underlying data characterised by a rich and elaborate dialogue between cases and attributes derived from the literature that allowed for a meaningful analysis and interpretation of innovations. It goes someway to achieving its objective of a standardised tool generalisable across fields and disciplines but remains in need of further development. A further component of instilling confidence in research results is ‘trustworthiness’ (Lincoln and Guba, 1985). Trustworthiness is argued to be a more appropriate construct in qualitative research than internal validity (are the researcher’s observations and measurements a true description of a particular reality?) and external validity (the generalisability of results to other domains). One criterion for critical trustworthiness involves the credibility of portrayals of constructed realities (Kincheloe and McLaren, 1994). The nature of the PhD process demands that a single individual conduct the research and analysis. There are of course opportunities for validating and ensuring the reliability of the research or, for qualitative approaches, ensuring the credibility, transferability, dependability and confirmability of the research (Lincoln and Guba, 1985). The credibility of the portrayals can, therefore, be assessed in these terms: by their plausibility to those who constructed them (respondents); by peer review from domain relevant experts in learned journals and at conferences; by the use of multiple coders; by testing and developing instruments in the context of their application; and, the support infrastructure (supervisors, seminars, discussion groups and so forth) that exists at the researcher’s institution to air and test ideas. Trustworthiness may also be achieved through the rigorous application of procedures designed to combat common method and same source bias (Howell and Shea, 2001). In this research, these include use of different sources of data and the use of mixed data gathering tools. Whilst all these have been utilised in this research it remains the case that a single objective ‘truth’ is unlikely ever to be the outcome of qualitative research and there is space in the approach for disagreements to exist. As such, whilst the approach might be considered a limitation of this research it is also responsible for generating the richness of perspective. A significant limitation is one of generalisability. The research was conducted in a single national context (Great Britain) and in a single sector (health). Furthermore the research was exploratory and, legitimately, compromises were made with regard to sampling in each of the three phases. A further issue is that the samples in each of the phases might be considered to consist of only successful innovations. There are no examples of failure. Cases of failure would have generated a useful sample against which to contrast the observations made of successful innovations, a method that was

- 255 -
adopted to particularly good effect in the pair-wise sampling of Project SAPPHO (Rothwell, 1985). The survey instrument was then made available to accessible and elite informants (Miles and Huberman, 1984). By choosing to comply with the request to participate in the research, the sample consisted of self-selected groups. Consequently, each sample is representative only of itself, and so opportunities for generalisation to other contexts is limited. Within the context of exploratory research this is felt to be legitimate. Clearly paths for future research are opened up and the approach could be repeated in other national contexts and industrial sectors. Additionally, future research could usefully explore the extent, if any, to which less successful innovations configure differently from successful ones. The framework has been developed based on the mature perceptions of innovators and users. This means the research was conducted at a point when innovations had been adopted and were in regular use. The cross-sectional nature of the research enables a constancy of perspective (all respondents respond from a position of post-adoption), but the framework fails to take account of the changeable quality of perceptions over time. That is, in the development or pre-adoption stages innovations may be perceived more favourably because they will not have been applied in a normal work situation (Dearing et al., 1994). Similarly, Phase III is limited by its cross-sectional nature. Longitudinal strategies are commonly recommended for process research because of the necessity of capturing event sequence data (Poole et al. 2000; Pettigrew, 1990). Future research should consider longitudinal measurement of attributes in order that data may be compared and contrasted for different stages of the innovation process in order to provide further insights into the nature of the relations between the two. Table 7-3 indicates values for reliability for several attributes which would be unacceptably low in studies other than exploratory research. There is clearly scope for improvement of the instrument. This could be achieved in future studies by the addition of further items and testing in samples before doing the main survey. The framework variables have though, been partly derived from an empirical study of innovators’ perceptions of innovations. This method, where the expert not the researcher is the arbiter of importance (notwithstanding the constraints of the definition of innovation that specified the initial dimensions of the framework), is recommended as a means of enhancing confidence that the variables in a particular data set are important (Ketchen and Shook, 1996). Indeed, requisite degrees of reliability differ according to the needs of different research objectives. For the purposes of this exploratory research reliability levels were felt to be tolerable (Moore and Benbasat, 1991). This research has, ultimately, identified three types of innovation described by configurations of attributes according to an individual’s evaluation of the presence, absence, or degree of those attributes. Chapter four described Sneath and Sokal’s (1973) seven principles guiding the operation of a classification exercise (see page 55). The degree to which any classification exercise complies with these will vary across studies; it may be that some of the guidelines are inappropriate or even impossible to comply with given the context of any particular study. In this thesis, for example, it has

- 256 -
not been possible to draw any phylogenetic inferences from the emergent classification given the cross-sectional nature of the study. The notion of types of innovations, distinguished from one another on the basis of attributes, having an evolutionary ancestry is problematic. Conceptually, it is not difficult to envisage ancestral lineages for individual entities such as submarines and helicopters (Griffin, 2002) or manufacturing systems (McCarthy et al., 1997) etc. However, where innovations in a manufacturing system and a helicopter belong to the same category, as defined by innovator- and user-perceptions, common ancestry is less discernible. However, it is only on the basis that phylogenetic inference cannot be drawn that this study significantly deviates from Sneath and Sokal’s (1973) guidelines.
The taxonomy emerging from this study has been deliberately pursued as an empirical science. More properly the resultant classification scheme might be described as a hybrid of typology and taxonomy (see table 4-1, page 51). The first-order categories that formed the organising framework were drawn from the West and Farr (1990) definition of innovation and were populated with data drawn, in part, from the rigorous thematic analysis of the literature. Subsequently, the framework, in which a balance between comprehensiveness and parsimony was sought, was developed and validated in an empirical context. The subsequent identification of three types of innovation, in which types are recognised by internal similarities between the variables that form the basis for classification and external heterogeneity between configurations, further demonstrates the empirical grounding of this study’s classification. An interesting question, then, would be with regard to the extent and nature of configurations based on the evaluations of multiple innovators within a single or multiple innovating groups. The emergence from such a study of three types, broadly similar to those described in this research, would lend some validation to the results of this study. Additionally, these discovered types would be the embodiment of multiple innovators’ perceptions, and as such might be construed as archetypes. The concept of archetypes has been developed by Hinings and Greenwood (1988), building on the work of Miller and Friesen (1980), as a heuristic device for understanding organisational phenomena. At its core is the idea that an archetype is a set of structures and systems that consistently embodies a single interpretive scheme. It is a reflection of a set of beliefs and values (Greenwood and Hinings, 1993), and as such is important for understanding change. By reflecting beliefs, archetypes adequately accommodate the notion of perceptions as drivers of behaviour (Rogers, 1983). Consequently, the notion of archetypes of innovation artefact would provide a useful device for focusing on key issues of its management. Importantly, the notion of archetypes introduces the issue of giving names to types. McCarthy and Ridgway (2000) stress the importance of labelling the groups uncovered in classification exercises and that they should be labelled in accordance with the groups’ defining characteristics. Labels, they argue, should not only provide a means of reference, but act as a “vehicle for communication [which is] unambiguous and universal” (McCarthy & Ridgway, 2000; 25), and a process for labelling is specified in McCarthy et al. (1997). Notwithstanding the communicative advantages of labelling, this research deliberately avoids developing labels based on the constitutive attributes

- 257 -
that describe the emergent categories. The key reason for this is that formalised labelling implies some fixity of categories, this may be particularly so where the basis of classification is phenetic which, as opposed to phylogenic, is cross-sectional and takes no account of evolutionary mutability. In the light of this and the exploratory nature of the research reported here, its limitations and the possible instability of the emergent types any implied fixity was felt to be unwarranted. Considerable utility for the framework has been demonstrated, but its further development and validation in different contexts are considered to be the minimum requirements before useful descriptive, unambiguous and universal labels can confidently be applied. More research is required to further validate the perceptual approach to innovation research and perhaps modify the framework in the light of experience in other organisational sectors.
11.4 A final thought This final chapter has reflected on the contribution of this research, the opportunities for further research that it has generated and, its limitations. In building the framework of innovation attributes, this work has drawn heavily on previous studies. These studies have been marked, not by any internal inadequacies but by a failure at the level of synthesis characterised by classification systems that limit opportunities for wider abstraction The legacy of those past studies is readily acknowledged, and the absence of synthesis has presented the opportunity for this research. This research has achieved its objective of developing a new, useful and viable taxonomy predicated on innovation attributes. The limitations of the classical, narrow classifications based on a high-low dichotomisation of newness or area of focus asserted in previous studies (Wolfe, 1994; Downs and Mohr, 1976; Tornatzky and Klein, 1982) has been confirmed. A more “realistically delicate” (Shenhar et al., 1995; 195) or sensitive taxonomy better reflects the multi-dimensional diversity of innovation and widens the scope of innovation beyond its conventional categories. The research also offers additional theoretical insights into the relationship between types of innovations and their processual origins. Previous research has indicated that different innovation types are associated with different processes and outcomes (see Chapters three and four), this research extends these findings. The framework may usefully be used in theory-building, relating innovation types to process factors, and could be extended into other domains such as outcome and success. As this has been an exploratory study, more research is needed to establish the validity of the framework. It is presumed that, for sector specific reasons, some attributes may be under-represented in the framework. However, the evidence does suggest that differences between innovations exist along the dimensions specified, thereby demonstrating the utility of the approach and warranting further study. Researchers often believe that their work is new and important when instead it re-labels, redefines or reiterates findings from previous studies (Garcia and Calantone, 2002). Researchers in innovation are particularly susceptible to the danger of making exaggerated claims with regard to the output of their work because of the breadth and depth of previous studies emanating from a variety of disciplines. Indeed, there have been many studies of innovation, studies in which the sample comprised of award

- 258 -
winners and studies operationalising attributes as the dependent or independent variable. This research has confirmed some of the findings from these previous studies. The results of this previous research have strongly suggested that innovation is context dependent and contingent. In order to make a contribution, new research must either replicate previous studies, discover new contexts and contingencies or, challenge the prevailing orthodoxy. This research has attempted the latter. Replication studies and the discovery of new contexts and contingencies continue to build low level theory (Pinder and Moore, 1979). The development of a framework of innovation that is truly generalisable across studies, that will enable the identification of clearly, comprehensively specified and, more importantly, constant innovation types will contribute to the development of middle range theory. This research has delivered neither the framework nor the middle range theory. It has though begun the journey with the discovery of discrete clusters of innovations, described by configurations of attributes that is considered to be unprecedented in the literature. However, in the light of the limitations of this research the taxonomy cannot currently be regarded as stable. But, no matter, to complete the quote from Kierkegaard that began this thesis:
“… When a classification does not ideally exhaust its object, a haphazard classification is altogether preferable, because it sets imagination in motion” (Kierkegaard, 1941; 56).
Classification has played a crucially important role in the history of innovation research. Knowledge about the relationships and fit between contrasting and different types of innovation and innovation inputs, processes and outputs is required if headway is to be made into the complex business of understanding and managing innovations more effectively. It seems that the possibilities of classification of innovation are not yet exhausted. By suggesting a classification of innovation based on a polythetic approach this research has provided for the first time a multi-dimensional classification based on empirical investigation and also provides a language for practitioners and academics to use. This research offers a supplement to the conventional class labels that have governed thinking in the past. This approach to the classification of innovation, according to innovators’ perceptions, has been shown to be a stimulating perspective for the study of innovation. It is intended that this research complements and extends that which has preceded it and, sets imagination in motion.

- 259 -
12 REFERENCES
Abbey, A. and Dickson, J. (1983) R&D work climate and innovation in semi-conductors. Academy of Management Journal 26(2), 362-368.
Abelson, R.P. and Tukey, J.W. (1970) Efficient conversion of non-metric information into metric information. In: Tufte, E.R., (Ed.) The quantitative analysis of social problems, pp. 407-417. Reading, Mass: Addison Wesley.
Adams, D.A., Nelson, R.R. and Todd, P.A. (1992) Perceived usefulness, ease of use, and usage of information technology: a replication. MIS Quarterly 16(2), 227-247.
Adams, R.J., Meystre, C. and Tranfield, D. (2003) Social and organisational innovation in the NHS: the case of Warwickshire's Integrated Service Directorate for Palliative Care. Clinician in Management 11(4), 185-197.
Adams, R.J. and Tranfield, D.R. (2002) Developing a formal framework of innovation outcome. Proceedings, 9th International Product Development Management Conference, Sophia Antipolis, France, May 27-28.
Afuah, A.N. and Bahram, N. (1995) The hypercube of innovation. Research Policy 24(1), 51-76.
Agarwal, R. and Prasad, J. (1997) The role of innovation characteristics and perceived voluntariness in the acceptance of information technologies. Decision Sciences 28(3), 557-582.
Agrell, A. and Gustafson, R. (1994) The team climate inventory (TCI) and group innovation: a psychometric test on a Swedish sample of work groups. Journal of Occupational and Organizational Psychology 67(2), 143-151.
Ahuja, G. (2000) Collaboration networks, structural holes, and innovation: a longitudinal study. Administrative Science Quarterly 45(3), 425-456.
Aldenderfer, M.S. and Blashfield, R.K. (1984) Cluster analysis (Sage University Paper Series on Quantitative Applications in the Social Sciences, No. 07-004). Beverley Hills, CA.: Sage.
Aldrich, H. (1999) Organizations evolving, London: Sage Publications.
Ali, A., Krapfel, R.. and LaBahn, D. (1995) Product innovativeness and entry strategy: impact on cycle time and break-even time. Journal of Product Innovation Management 12(1), 54-69.
Amabile, T.M. (1983) The social psychology of creativity: a componential conceptualization. Journal of Personality and Social Psychology 5, 357-376.
Amabile, T.M. (1988) A model of creativity and innovation in organizations. In: Staw,

- 260 -
B.M. and Cummings L.L., (Eds.) Research in organizational behaviour, Greenwich, Conn.: JAI.
Amabile, T.M. (1998) How to kill creativity. Harvard Business Review (5, Sept-Oct) 77-87.
Amabile, T.M., Conti, R., Coon, H., Lazenby, J. and Herron, M. (1996) Assessing the work environment for creativity. Academy of Management Journal 39(5), 1154-1184.
Anderson, H. and Larsson, A. (1998) Projects as an arena for innovation - images of projects and their implications. In: Lundin, R.A. and Midler, C., (Eds.) Projects as arenas for renewal and learning processes, pp. 145-156. Kluwer Academic Publishers.
Anderson, N. and West, M.A. (1996) The team climate inventory: development of the TCI and its applications in teambuilding for innovativeness. European Journal of Work and Organizational Psychology 5(1), 53-66.
Anderson, N.R. and West, M.A. (1998) Measuring climate for work group innovation: development and validation of the team climate inventory. Journal of Organizational Behavior 19(3), 235-258.
Angle, H.L. and Van de Ven, A.H. (1989) Managing the innovation journey. In: Van de Ven, A.H., Angle, H.L. and Poole, M.S., (Eds.) Research on the management of innovation: the Minnesota studies, New York: Harper & Row.
Angle, H.L. (1989) Psychology and organizational innovation. In: Van de Ven, A.H., Angle, H.L. and Poole, M.S., (Eds.) Research on the management of innovation: the Minnesota studies, New York: Harper & Row.
Arabie, P. and Hubert, L.J. (1996) An overview of combinatorial data analysis. In: Arabie, P., Hubert, L.J. and de Soete, G., (Eds.) Clustering and classification, pp. 5-65. River Edge, NJ: World Scientific Publishing Co. Pte.
Arndt, M. and Bigelow, B. (2000) Presenting structural innovation in an institutional environment: hospitals' use of impression management. Administrative Science Quarterly 45 (3), 494-522.
Atuahene-Gima, K. (1995) An exploratory analysis of the impact of market orientation on new product performance: a contingency approach. Journal of Product Innovation Management 12(4), 275-293.
Atuahene-Gima, K. (1996) Differential potency of factors affecting innovation performance in manufacturing and services firms in Australia. Journal of Product Innovation Management 13(1), 35-52.
Audi, R. (1999) The Cambridge Dictionary of Philosophy, 2nd edn. Cambridge, UK.: Cambridge University Press.

- 261 -
Avermaete, T., Viaene, J., Morgan, E.J. and Crawford, N. (2003) Determinants of innovation in small food firms. European Journal of Innovation Management 6(1), 8-17.
Avlonitis, G.J., Papastathopoulou, P.G. and Gounaris, S.P. (2001) An empirically-based typology of product innovativeness for new financial services: success and failure scenarios. Journal of Product Innovation Management 18(5), 324-342.
Bagchi-Sen, S. (2001) Product innovation and competitive advantage in an area of industrial decline: the Niagara region of Canada. Technovation 21(1), 45-54.
Bailey, A. and Johnson, G. (1995) Strategy development processes: a configurational approach. Academy of Management Journal Special issue, best papers proceedings.
Bailey, K.D. (1994) Typologies and taxonomies: an introduction to classification techniques (Sage University Paper series on Quantitative Applications in the Social Sciences, series no. 07-102). Thousand Oaks, CA: Sage.
Baker, D. (1996) Understanding the basis of treatment choices for varicose veins: a model of decision making with the repertory grid technique. Quality in Health Care 5(3), 128-133.
Balachandra, R. and Friar, J. (1997) Factors for success in R&D projects and new product innovation: a contextual framework. IEEE Transactions on Engineering Management 44(3), 276-287.
Baldridge, J.V. and Burnham, R.A. (1975) Organizational innovation - individual, organizational and environmental impacts. Administrative Science Quarterly 20(2), 165-176.
Bantel, K.A. and Jackson, S.E. (1989) Top management and innovations in banking: does the composition of the top team make a difference? Strategic Management Journal 10(1), 107-124.
Barclay, I. (1992) The new product development process: past evidence and future practical application. Part 1. R&D Management 22(3), 255-264.
Bard, J.F., Balachandra, R. and Kaufmann, P.E. (1988) An interactive approach to R&D project selection and termination. IEEE Transactions on Engineering Management 35(3), 139-146.
Barker, L. (2000) Effective leadership within hospice and specialist palliative care units. Journal of Management in Medicine 14(5/6), 291-309.
Barney, J. (1991) Firm resources and sustained competitive advantage. Journal of Management 17(1), 99-120.
Barney, J. (1986) Organizational culture: can it be a source of sustained competitive

- 262 -
advantage? Academy of Management Review 11(3), 656-665.
Barth, T.A. (1998) The complimentary roles of stage gate business process, conventional project management, and metrics in new product development. Proceedings of the 29th Annual Project Management Institute 1998 Seminars & Symposium.
Basberg, B. (1987) Patents and measurement of technological change: a survey of the literature. Research Policy 16(2-4), 131-141.
Batty, D. and Kamel, M.S. (1995) Automating knowledge acquisition - a propositional approach to representing expertise as an alternative to repertory grid technique. IEEE Transactions on Knowledge and Data Engineering 7(1), 53-67.
Baxter, I.A., Jack, F.R. and Schroder, M.J.A. (1998) The use of repertory grid method to elicit perceptual data from primary school children. Food Quality and Preference 9(1), 73-80.
Becker, S.W. and Whisler, T.L. (1973) The innovative organization: a selective view of current theory and research. In: Wills, G., Hayhurst, R. and Midgley, D., (Eds.) Creating and marketing new products, 1st edn. Crosby Lockwood Staples.
Belson, W.A. (1986) Validity in survey research, Aldershot, UK: Gower Publishing Company Limited.
Bessant, J. and Caffyn, S. (1997) High-involvement innovation through continuous improvement. International Journal of Technology Management 14(1), 7-28.
Beyer, J.M. and Trice, H.M. (1978) Implementing Change, New York: Free Press.
Bharadwaj, S.G., Varadarajan, P.R. and Fahy, J. (1993) Sustainable competitive advantage in service industries: a conceptual model and research propositions. Journal of Marketing 57(Oct), 83-99.
Bhaskar, R. (1978) A realist theory of science, Brighton: Harvester.
Bhoovaraghavan, S., Vasudevan, A. and Chandran, R. (1996) Resolving the process vs product innovation dilemma: a consumer choice theoretic approach. Management Science 42(2), 232-246.
Bierly, P. and Chakrabarti, A. (1996) Generic knowledge strategies in the US pharmaceutical industry. Strategic Management Journal 17(Special issue), 123-135.
Biswas, P.K. (2001) A classificatory scheme of technological innovations in rural industries. Journal of Scientific & Industrial Research 60(3), 232-242.
Blaikie, N. (1993) Approaches to social enquiry, Cambridge, MA.: Polity Press.

- 263 -
BMA (2001) Pioneers in patient care: consultants leading change, London: British Medical Association Public Affairs Division.
Boisot, M. (1995) Is your firm a creative destroyer? Competitive learning and knowledge flows in the technological strategies of firms. Research Policy 24(4), 489-506.
Boisot, M., Griffiths, D. and Mole, V. (1996) Theory and practice: an exploration of the concept of core competence in BPX and Courtaulds. Management School, Imperial College: Management School, Imperial College.
Bolton, M.K. (1993) When is necessity the mother of invention? Organizational innovation in successful and unsuccessful firms. In: Cozijnsen, A. and Vrakking, W., (Eds.) Handbook of Innovation Management, pp. 14-41. Oxford: Basil Blackwell Ltd.
Bommer, M. and Jalajas, D.S. (1999) The threat of organizational downsizing on the innovative propensity of R&D professionals. R&D Management 29(1), 27-34.
Bonner, R.E. (1964) On some clustering techniques. International Business Machines Journal of Research and Development 8, 22-32.
Bontis, N. (2001) Assessing knowledge assets: a review of the models used to measure intellectual capital. International Journal of Management Reviews 3(1), 41-60.
Booz-Allen and Hamilton (1982) New products management for the 1980s, New York: Booz-Allen and Hamilton Inc.
Bowen, H.K., Clark, K.B., Holloway, C.A. and Wheelwright, S.C. (1994) The Perpetual Enterprise Machine: Seven Keys to Corporate Renewal Through Successful Product and Process Development, New York: Oxford University Press.
Bowman, C. and Ambrosini, V. (1997) Using single respondents in strategy research. British Journal of Management 8(2), 119-131.
Brouwer, M. (2000) Entrepreneurship and uncertainty: innovation and competition among the many. Small Business Economics 15(2), 149-160.
Brown, J.S. and Duguid, P. (1991) Organizational learning and communities-of-practice: toward a unified view of working, learning and innovation. Organization Science 2(1), 40-57.
Brown, M.G. and Svenson, R.A. (1988) Measuring R&D productivity. Research Technology Management July-August, 11-15.
Brown, S.L. and Eisenhardt, K.M. (1997) The art of continuous change: linking complexity theory and time-paced evolution in relentlessly shifting

- 264 -
organizations. Administrative Science Quarterly 42(1), 1-34.
Buchanan, D.A. (1997) The limitations and opportunities of business process re-engineering in a politicized organisational climate. Human Relations 50(1), 51-72.
Burningham, C. and West, M.A. (1995) Individual, climate and group interaction processes as predictors of work team innovation. Small Group Research 26(1), 106-117.
Burns, T.R. and Stalker, G.M. (1961) The Management of Innovation., London: Tavistock Publications.
Calman, K. and Hine, D. (1995) A policy framework for commissioning cancer services, http://www.doh.gov.uk/cancer/calmanhine.htm:
Calvert, J., Ibarra, C., Patel, P. and Pavitt, K. (2002) EIMS studies. Innovation outputs in European industry: results from the CIS: summary. http://www.cordis.lu/eims/src/eims-r34.htm: European Innovation Monitoring System .
Cameron, M., Cranfield, S., Iles, V. and Stone, J. (2001) Managing change in the NHS. Making informed decisions on change, London: NCCSDO, National Co-ordinating Centre for NHS Service Delivery and Organisation R&D (www.sdo.lshtm.ac.uk).
Campbell, R., Pound, P., Pope, C., Britten, N., Pill, R., Morgan, M. and Donovan, J. (2003) Evaluating meta-ethnography: a synthesis of qualitative research on lay experiences of diabetes and diabetes care. Social Science & Medicine 56(4), 671-684.
Cardinal, L.B. (2001) Technological innovation in the pharmaceutical industry: the use of organizational control in managing research and development. Organization Science 12(1), 19-36.
Carroll, G.R. and Hannan, M.T. (1995) Organizations in industry: strategy, structure, and selection, New York: Oxford University Press.
Casson, M.C. (1993) Cultural determinants of economic performance. Journal of Comparative Economics 17(2), 418-442.
Cebon, P. and Newton, P. (1999) Innovation in firms: towards a framework for indicator development. Melbourne Business School Working Paper No. 99-9.
Cheng, Y.-T. and Van de Ven, A. (1996) Learning the innovation journey: order out of chaos? Organization Science 7(6), 593-614.
Chesborough, H.W. and Teece, D.J. (1996) When is virtual virtuous? Organizing for innovation. Harvard Business Review (1, Jan-Feb), 65-73.

- 265 -
Chiesa, V., Coughlan, P. and Voss, A. (1996) Development of a technical innovation audit. Journal of Product Innovation Management 13(2), 105-136.
Churchill, G.A. (1979) A paradigm for developing better measures of marketing constructs. Journal of Marketing Research 16(1), 64-73.
Cilliers, P. (1998) Complexity and postmodernism: understanding complex systems, London: Routledge.
Cohen, S.G. and Bailey, D.E. (1997) What makes teams work: group effectiveness research from the shop floor to the executive suite. Journal of Management 23(3), 239-290.
Connelly, J. (2000) A realistic theory of health sector management: the case for critical realism. Journal of Management in Medicine 14(5/6), 262-271.
Coombs, R. and Hull, R. (1998) Knowledge management practices and path-dependency in innovation. Research Policy 27(3), 237-253.
Coombs, R., McMeekin, A. and Pybus, R. (1998) Toward the development of benchmarking tools for R & D project management. R & D Management 28(3), 175-186.
Cooper, R. (1986) New product performance and product innovation strategies. Research Technology Management 29(3), 17-25.
Cooper, R. (1998) Benchmarking new product performance: results of the best practices study. European Management Journal 16(1), 1-17.
Cooper, R.B. and Zmud, R.W. (1990) Information technology implementation research: a technological diffusion approach. Management Science 36(2), 123-139.
Cooper, R.G. (1979a) The dimensions of industrial new product success and failure. Journal of Marketing 43(3), 93-103.
Cooper, R.G. (1979b) Identifying industrial new product success: Project NewProd. Industrial Marketing Management 8(2), 124-135.
Cooper, R.G. (1980) Project NewProd: factors in new product success. European Journal of Marketing 14(5), 277-292.
Cooper, R.G. (1988a) The new product process: a decision guide for management. Journal of Marketing Management 3(3), 238-255.
Cooper, R.G. (1988b) Predevelopment activities determine new product success. Industrial Marketing Management 17(2), 237-247.
Cooper, R.G. (1990) Stage-gate systems: a new tool for managing new products. Business Horizons 33(3), 44-56.

- 266 -
Cooper, R.G., Edgett, S.J. and Kleinschmidt, E.J. (1999) New product portfolio management: practices and performance. Journal of Product Innovation Management 16(4), 333-351.
Cooper, R.G., Edgett, S.J. and Kleinschmidt, E.J. (2000) New problems, new solutions: making portfolio management more effective. Research Technology Management 43(2), 18-33.
Cooper, R.G., Edgett, S.J. and Kleinschmidt, E.J. (2001) Portfolio management for new products, 2nd edition, Cambridge, MA: Perseus Publishing.
Cooper, R.G. and Kleinschmidt, E.J. (1987a) What makes a new product a winner - success factors at the project level. R&D Management 17(3), 175-189.
Cooper, R.G. and Kleinschmidt, E.J. (1987b) Success factors in product innovation. Industrial Marketing Management 16(3), 215-223.
Cooper, R.G. and Kleinschmidt, E.J. (1990) New product success factors: a comparison of 'kills' versus successes and failures. R&D Management 20 (1), 47-64.
Cooper, R.G. and Kleinschmidt, E.J. (1993) Major new products: what distinguishes the winners in the chemical industry? Journal of Product Innovation Management 10(2), 90-111.
Cooper, R.G. and Kleinschmidt, E.J. (1995) Performance typologies of new product projects. Industrial Marketing Management 24(5), 439-456.
Cooper, R.S. and Merrill, S.A. (1997) Industrial research and innovation indicators: report of a workshop, Washington DC: National Academy Press.
Coopey, J., Keegan, O. and Emler, N. (1998) Managers’ innovations and the structuration of organizations. Journal of Management Studies 35(3), 263-284.
Cormack, R.M. (1971) A review of classification. Journal of the Royal Statistical Society (Series A) 134(3), 321-369.
Crossan, M.M., Lane, H.W. and White, R.E. (1999) An organizational learning framework: from intuition to institution. Academy of Management Review 24(3), 522-537.
Daft, R. (1978) A dual-core model of organizational innovation. Academy of Management Journal 212(2), 193-210.
Daft, R.L. and Becker, S.W. (1978) Innovation in organizations, New York: Elsevier.
Daghfous, A. and White, G.R. (1994) Information and innovation: a comprehensive representation. Research Policy 23(3), 267-280.

- 267 -
Damanpour, F. (1988) Innovation type, radicalness, and the adoption process. Communication Research 15(5), 545-567.
Damanpour, F. (1990) Innovation effectiveness, adoption and organizational performance. In: West, M.A., (Ed.) Innovation and creativity at work: psychological and organizational strategies., Chichester, England: John Wiley & Sons Ltd.
Damanpour, F. (1991) Organizational innovation: a meta-analysis of effects of determinants and moderators. Academy of Management Journal 34(5), 555-590.
Damanpour, F. (1992) Organizational size and innovation. Organization Studies 13(3), 375-402.
Damanpour, F. (1996) Organizational complexity and innovation: developing and testing multiple contingency models. Management Science 42(5), 693-716.
Damanpour, F. and Evan, W. (1984) Organizational innovation and performance: the problem of organizational lag. Administrative Science Quarterly 29(3), 392-409.
Damanpour, F. and Gopalakrishnan, S. (2001) The dynamics of the adoption of product and process innovations in organizations. Journal of Management Studies 38(1), 45-65.
Damanpour, F., Szabat, K.A. and Evan, W.M. (1989) The relationship between types of innovation and organizational performance. Journal of Management Studies 26(6), 587-601.
Danneels, E. and Kleinschmidt, E.J. (2001) Product innovativeness from the firm's perspective: Its dimensions and their relation with project selection and performance. Journal of Product Innovation Management 18(6), 357-373.
Dawson, S., Sutherland, K., Dopson, S. and Miller, R. (1999) Changing clinical practice: views about the management of adult asthma. Quality in Health Care 8(4), 253-61.
de Brentani, U. (1991) Success factors in developing new business services. European Journal of Marketing 25(2), 33-60.
de Brentani, U. (1995) New industrial service development - Scenarios for success and failure. Journal of Business Research 32(2), 93-103.
de Brentani, U. (2001) Innovative versus incremental new business services: different keys for achieving success. Journal of Product Innovation Management 18(3), 169-187.
de Brentani, U. and Ragot, E. (1996) Developing new business-to-business professional services: what factors impact performance. Industrial Marketing

- 268 -
Management 25(6), 517-530.
de Leede, J., Nijhof, A.H. and Fisscher, O.A. (1999) The myth of self managing teams: a reflection on the allocation of responsibilities between individuals, teams and the organisation. Journal of Business Ethics 21(2/3), 203-215.
de Vaus, D.A. (1996) Surveys in Social Research, 4th edn. Australia: Allen & Unwin.
Dearing, J.W. and Meyer, G. (1994) An exploratory tool for predicting adoption decisions. Science Communication 16(1), 43-57.
Dearing, J.W., Meyer, G. and Kazmierczak, J. (1994) Portraying the new: communication between university innovators and potential users. Science Communication 16(1), 11-42.
Dennett, D.C. (1996) Darwin's dangerous idea: evolution and the meanings of life, New York, NY: Touchstone.
Denzin, N.K. and Lincoln, Y.S. (1994) Handbook of qualitative research, Thousand Oaks, CA: Sage Publications.
Dewar, R.D. and Dutton, J.E. (1986) The adoption of radical and incremental innovations: an empirical analysis. Management Science 32(11), 1422-1433.
Deyle, R.E. (1994) Conflict, uncertainty, and the role of planning and analysis in public-policy innovation. Policy Studies Journal 22(3), 457-473.
DHSS (1983) Management inquiry (The Griffiths Report). London: HMSO.
Doty, D.H. and Glick, W.H. (1994) Typologies as a unique form of theory building: toward improved understanding and modeling. Academy of Management Review 19(2), 230-251.
Dougherty, D. and Cohen, M. (1995) Product innovation in mature firms. In: Bowman, E. and Kogut, B., (Eds.) Redesigning the firm, New York: Oxford University Press.
Dougherty, D. and Hardy, C. (1996) Sustained product innovation in large, mature organizations: overcoming innovation-to-organization problems. Academy of Management Journal 39(5), 1120-1153.
Dougherty, D. (1992) A practice-centered model of organizational renewal through product innovation. Strategic Management Journal 13(Special issue), 77-92.
Downs, G.W. and Mohr, L.B. (1976) Conceptual issues in the study of innovation. Administrative Science Quarterly 21(4), 700-714.
DTI (1998) An audience with innovation: innovation in management. URN 98/688, London: DTI.

- 269 -
Easterby-Smith, M., Thorpe, R. and Lowe, A. (1994) Management research: an introduction. Easterby-Smith, M., Thorpe, R. and Lowe, A., (Eds.) London: Sage Publications Ltd.
Edwards, P., Collinson, M. and Rees, C. (1998) The determinants of employee responses to total management: six case studies. Organisation Studies 19(3), 449-75.
Eisenhardt, K.M. (1989) Building theories from case study research. Academy of Management Review 14(4), 532-550.
Ekvall, G. (1996) Organizational climate for creativity and innovation. European Journal of Work and Organizational Psychology 5(1), 105-123.
Ettlie, J.E. (1980) Adequacy of stage models for decisions on adoption of innovation. Psychology Reports 46, 991-995.
Evangelista, R., Sirilli, G. and Smith, K. (1998) Measuring innovation in services. IDEA paper series No. 6. http://www.sol.no/step/IDEA: STEP group.
Everitt, B. (1974) Cluster Analysis, London: Heinemann.
Everitt, B.S. (1995) Commentary: Classification and cluster analysis . British Medical Journal 311(7004), 535-536.
Everitt, B.S. and Dunn, G. (2001) Applied multivariate data analysis, London: Arnold.
Everitt, B.S., Landau, S. and Leese, M. (2001) Cluster Analysis, London: Arnold.
Fahey, L. and Prusak, L. (1998) The eleven deadliest sins of knowledge management. California Management Review 40(3), 265-276.
Faulkner, W. (1994) Conceptualizing knowledge used in innovation: a second look at the science-technology distinction and industrial innovation. Science Technology and Human Values 19(4), 425-458.
Feldman, M.P. and Ronzio, C.R. (2001) Closing the innovative loop: moving from the laboratory to the shop floor in biotechnology manufacturing. Entrepreneurship and Regional Development 13(1), 1-16.
Feldman, S.P. (1988) How organizational culture can affect innovation. Organizational Dynamics 17(1), 57-69.
Feldman, S.P. (1989) The broken wheel: the inseperability of autonomy and control in innovation within organizations. Journal of Management Studies 26(2), 83-102.
Ferguson, E. and Cheyne, A. (1995) Organizational change: main and interactive effects. Journal of Occupational and Organizational Psychology 68(2), 101-

- 270 -
107.
Fernández, A.M. (2001) Innovation processes in an accident and emergency department. European Journal of Innovation Management 4(4), 168-178.
Fernandez, P. and McCarthy, I.P. (2002) An evolutionary classification of electronics manufacturers. Manufacturing Network Complexity Conference, 1-10 April, Downing College, Cambridge, UK .
Figueroa, E. and Conceiçâo, P. (2000) Rethinking the innovation process in large organizations: a case study of 3M. Journal of Engineering and technology Management 17(1), 93-109.
Fiol, C.M. (1996) Squeezing harder doesn't always work: continuing the search for consistency in innovation research. Academy of Management Review 21(4), 1012-1021.
Fitzgerald, L. and Dufour, Y. (1998) Clinical management as boundary management: a comparative analysis of Canadian and UK health-care institutions. Journal of Management in Medicine 4(5), 199-214.
Fitzgerald, L., Ferlie, E., Wood, M. and Hawkins, C. (2002) Interlocking interactions, the diffusion of innovations in health care. Human Relations 55(12), 1429-1449.
Fliegel, F.C. and Kivlin, J.E. (1966) Attributes of innovations as factors in diffusion. American Journal of Sociology 72(3), 235-248.
Foddy, W. (1993) Constructing questions for interviews and questionnaires: theory and practice in social research, Cambridge University Press.
Fransella, F. and Reed, N. (1998) The power of a good theory. Paper delivered at the Business Psychology Conference, University of Westminster, UK.
Friar, J.H. (1995) Competitive advantage through product performance innovation in a competitive market. Journal of Product Innovation Management 12(1), 33-42.
Fulop, N., Allen, P., Clarke, A. and Black, N. (2001) Studying the organisation and delivery of health services: research methods, London: Routledge.
Gallouj, F. and Weinstein, O. (1997) Innovation in services. Research Policy 26(4), 537-556.
Garcia, R. and Calantone, R. (2002) A critical look at technological innovation typology and innovativeness terminology: a literature review. Journal of Product Innovation Management 19(2), 110-132.
Garvin, D.A. (1993) Building a learning organization. Harvard Business Review (4, Jul/Aug), 78-91.

- 271 -
Geisler, E. (1995) An integrated cost-performance model of research-and- development evaluation. Omega-International Journal of Management Science 23(3), 281-294.
Geisler, E. (2000) The metrics of science and technology, Westport, CT: Quorum Books.
Geisler, E. (2002) The metrics of technology evaluation: where we stand and where we should go from here. International Journal of Technology Management 24(4), 341-374.
Giaoutzi, M., Nijkamp, P. and Storey, D.J. (1988) Small is beautiful - the regional importance of small-scale activities. In: Giaoutzi, M., Nijkamp, P. and Storey, D.J., (Eds.) Small and medium sized enterprises and regional development, London: Routledge.
Glaser, B.G. and Strauss, A.L. (1980) The discovery of grounded theory: strategies for qualitative research. Glaser, B.G. and Strauss, A.L., (Eds.) New York: Aldine Publishing.
Goes, J.B. and Ho Park, S. (1997) Interorganizational links and innovation: the case of hospital services. Academy of Management Journal 40(3), 673-696.
Goffin, K. (1994) Repertory grids in market research: an example. Cranfield School of Management. Working Paper SWP 1/94.
Goffin, K. (2002) Repertory grid technique. In: Partington, D., (Ed.) Essential Skills for Management Research, pp. 199-225. Sage Publications Ltd.
Goffin, K., Szwejczewski, M. (2001) Revenues from new products - an empirical investigation of their importance, Proceedings 8th International Product Development Conference, European Institute for Advanced Studies in Management.
Goffin, K., Szwejczewski, M. and New, C. (1997) How innovative are UK manufacturing companies? Cranfield School of Management - working paper SWP 8/97:
Gold, B. (2002) Epistemology among the lumpers and splitters. Human Nature Review 2, 135-143.
Goldenberg, J., Lehmann, D.R. and Mazursky, D. (1999) The primacy of the idea as a predictor of new product success. Marketing Science Institute Working Paper.
Good, I.J. (1965) Categorization and classification. In: Good, I.J., (Ed.) Mathematics and computer science in medicine and biology, pp. 115-128. London: HMSO.
Goodman, P.S. and Wilson, J.M. (2000) Substitutes for socialization in exocentric

- 272 -
teams. In: Griffith, T.L., (Ed.): Research on managing groups and teams (vol 3), Stamford, Connecticut: JAI Press Inc.
Goodman, R.A. (1981) Temporary systems: professional development, manpower utilization, task effectiveness, and innovation, New York: Praeger Publishers.
Gopalakrishnan, S. and Bierly, P. (2001) Analyzing innovation adoption using a knowledge-based approach. Journal of Engineering and Technology Management 18(2), 107-130.
Gopalkrishnan, S. and Damanpour, F. (1994) Patterns of generation and adoption of innovation in organizations: contingency models of innovation attributes. Journal of Engineering and Technology Management 11(2), 95-116.
Gordon, A.D. (1996) Hierarchical classification. In: Arabie, P., Hubert, L.J. and de Soete, G., (Eds.) Clustering and classification, pp. 65-121. River Edge, NJ: World Scientific Publishing Co. Pte. Ltd.
Grant, R.M. (1996) Toward a knowledge-based theory of the firm. Strategic Management Journal 17(Special issue), 109-122.
Greenwood, R. and Hinings, C.R. (1993) Understanding strategic change: the contribution of archetypes. Academy of Management Journal 36(5), 1052-1081.
Griffin, A. (1997a) The effect of project and process characteristics on product development cycle time. Journal of Marketing Research 34(1), 24-35.
Griffin, A. (1997b) PDMA research on new product development practices: updating trends and benchmarking best practices. Journal of Product Innovation Management 14(6), 429-458.
Griffin, A. (2002) From the editor. Journal of Product Innovation Management 19(2), 107-109.
Griffin, A. and Page, A.L. (1993) An interim report on measuring product development success and failure. Journal of Product Innovation Management 10(4), 291-308.
Griffin, A. and Page, A.L. (1996) PDMA success measurement project: recommended measures for product development success and failure. Journal of Product Innovation Management 13(6), 478-496.
Gronstedt, A. and Thorson, E. (1996) Five approaches to organize an integrated marketing communications agency. Journal of Advertising Research 36(2), 48-58.
Guba, E.G. and Lincoln, Y.S. (1994) Competing paradigms in qualitative research. In: Denzin, N.K. and Lincoln, Y.S., (Eds.) Handbook of qualitative research, pp.
- 273 -
105-117. Thousand Oaks, CA: Sage Publications.
Guellec, D. and Pattinson, B. (2001) Innovation surveys: lessons from OECD countries’ experience. STI Review 27, 77-10.
Hage, J. (1980) Theories of organization, New York: Wiley.
Hage, J. and Aiken, M. (1967) Program change and organizational properties: a comparative analysis. American Journal of Sociology 72(5), 503-519.
Hair, J.F., Anderson, R.E., Tatham, R.L. and Black, W.C. (1998) Multivariate data analysis , New Jersey: Prentice-Hall International, Inc.
Hanks, P. (1979) Collins dictionary of the English language, London: Collins.
Hannan, M.T. and Freeman, J. (1984) Structural inertia and organizational change. American Sociological Review 49(April), 149-164.
Hannan, M.T. and Freeman, J.H. (1977) The population ecology of organisations. American Journal of Sociology 82(March), 929-964.
Harmsen, H., Grunert, K.G. and Declerck, F. (2000) Why did we make that cheese? An empirically based framework for understanding what drives innovation activity. R&D Management 30(2), 151-166.
Harrigan, K.R. (1985) An application of clustering for strategic group analysis. Strategic Management Journal 6(1), 55-73.
Hatch, M.J. (1997) Organization theory: modern, symbolic, and postmodern perspectives. New York: Oxford University Press.
Hauser, J.R. and Zettelmeyer, F. (1997) Metrics to evaluate R,D&E. Research Technology Management 40(4), 32-38.
Heany, D.F. (1983) Degrees of product innovation. The Journal of Business Strategy 3(4), 3-14.
Henderson, R.M. and Clark, K.B. (1990) Architectural innovation:the reconfiguration of existing product technologies and the failure of established firms. Administrative Science Quarterly 35 (Special issue), 9-30.
Henriksen, A.D. and Traynor, A.J. (1999) A practical R&D project-selection scoring tool. IEEE Transactions on Engineering Management 46(2), 158-170.
Hey, L. (2001) Genes, categories and species. The evolutionary and cognitive causes of the species problem, New York: Oxford University Press.
Hinings, C.R. and Greenwood, R. (1988) The dynamics of strategic change, Oxford: Blackwell.

- 274 -
HMSO (2000) The NHS Plan. A plan for investment. A plan for reform. London: HMSO.
Hobday, M. (1998) Product complexity, innovation and industrial organisation. Research Policy 26(6), 689-710.
Hobday, M. and Rush, H. (2000) Innovation in complex systems. Research Policy 29(7/8), 793-804.
Hodder, I. (1994) The interpretation of documents and material culture. In: Denzin, N.K. and Lincoln, Y.S., (Eds.) pp. 393-402. Thousand Oaks: Sage.
Holbek, J. (1988) The innovation design dilemma: some notes on its relevance and solutions. In: Grønhaug, K. and Kaufmann, G., (Eds.) Innovation: a cross-disciplinary perspective, pp. 253-277. Norwegian University Press.
Holloway, R.E. (1977) Perceptions of an innovation: Syracuse University Project Advance. Unpublished PhD Dissertation, Syracuse University.
Holstein, J.A. and Gubrium, J.F. (1994) Phenomenology, ethnomethodology and interpretive practice. In: Denzin, N.K. and Lincoln, Y.S., (Eds.) Handbook of qualitative research, pp. 262-272. Thousand Oaks, CA: Sage Publications.
Howell, J.M. and Shea, C.M. (2001) Individual differences, environmental scanning, innovation framing, and champion behavior: key predictors of project performance. Journal of Product Innovation Management 18(1), 15-27.
Huber, G.P. and Power, D.J. (1985) Retrospective reports of strategic-level managers: guidelines for increasing their accuracy. Strategic Management Journal 6(2), 171-180.
Hull, R., Coombs, R. and Peltu, M. (2000) Knowledge management practices for innovation: an audit tool for improvement. International Journal of Technology Management 20(5-8), 633-656.
Hutchinson, J.R. (1998) Using the role repertory grid technique for item generation in a survey of knowledge use. Journal of Constructivist Psychology 11(2), 149-162.
Iles, V. and Sutherland, K. (2001) Managing change in the NHS. Organisational change: a review for health care managers, professionals and researchers, London: NCCSDO, National Co-ordinating Centre for NHS Service Delivery and Organisation R&D (www.sdo.lshtm.ac.uk).
Inandi, T., Sahin, N. and Guraksin, A. (2002) A preliminary study for the development of a scale to assess perceptions about physicians. Journal of Evaluation in Clinical Practice 8(1), 71-75.
Janis, I.L. (1971) Groupthink. Psychology Today Magazine November, 43-46.

- 275 -
Johannessen, J.A., Olsen, B. and Olaisen, J. (1999) Aspects of innovation theory based on knowledge management. International Journal of Information Management 19(2), 121-139.
Johne, A. and Snelson, P. (1988a) Auditing product innovation activities in manufacturing firms. R&D Management 18(3), 227-233.
Johne, A. and Snelson, P. (1988b) Success factors in product innovation: a selective review of the literature. Journal of Product Innovation Management 5(1), 114-128.
Johnson, P. and Duberley, J. (2000) Understanding management research, London: Sage Publications Ltd.
Jones, P. and Jordan, J. (1998) Knowledge orientations and team effectiveness. International Journal of Technology Management 16(1), 152-161.
Jordan, J. and Jones, P. (1997) Assessing your company's knowledge management style. Long Range Planning 30(3), 392-398.
Joss, R. (1994) What makes for successful TQM in the NHS? International Journal of Health Care Quality Assurance 7(7), 4-9.
Joyce, T. and Stivers, B.P. (1999) Knowledge and innovation focus: a classification of US and Canadian firms. International Journal of Technology Management 18(5-8), 500-509.
Keeble, D. and Wilkinson, F. (1999) Collective learning and knowledge development in the evolution of regional clusters of high technology SMEs in Europe. Regional Studies 33(4), 295-304.
Keller, R.T. (1986) Predictors of performance of project groups in R&D organizations. Academy of Management Journal 29(4), 715-726.
Keller, R.T. and Holland, W.E. (1978) A cross-validation study of the Kirton Adaption-innovation Inventory in three research and development organizations. Applied Psychological Measurement 2, 563-570.
Kelly, G.A. (1955) The psychology of personal constructs, New York: Norton.
Kerlinger, F. and Lee, H. (1999) Foundations of behavioral research, Thomson Learning.
Kerssens-van Drongelen, I.C. and Bilderbeek, J. (1999) R & D Performance measurement: more than choosing a set of metrics. R & D Management 29(1), 35-46.
Kessler, E.H. and Chakrabarti, A.K. (1996) Innovation speed: a conceptual model of context, antecedents and outcomes. Academy of Management Review 21(4), 1143-1191.

- 276 -
Ketchen, D.J. and Shook, C.L. (1996) The application of cluster analysis in strategic management research: an analysis and critique. Strategic Management Journal 17(6), 441-458.
Ketchen, D.J., Thomas, J.B. and Snow, C.C. (1993) Organizational configurations and performance: a comparison of theoretical approaches. Academy of Management Journal 36(6), 1278-1313.
Kierkegaard, S. (1941) Repetition (Trans. Lowrie, W.), Princeton, NJ: Princeton UP.
Kim, J. and Wilemon, D. (2002) Strategic issues in managing innovation's fuzzy front-end. European Journal of Innovation Management 5(1), 27-39.
Kimberly, J. and Evanisko, M. (1981) Organizational innovation: the influence of individual, organizational and contextual factors on hospital adoption of technological and administrative innovations. Academy of Management Journal 24(4), 689-713.
Kimberly, J.R., Renshaw, L.R., Schwartz, J.S., Hillman, A.L., Pauly, M.V. and Teplensky, J.D. (1990) Rethinking organizational innovation. In: West, M.A., (Ed.) Innovation and creativity at work: psychological and organizational strategies., Chichester, England: John Wiley & Sons Ltd.
Kincheloe, J.L. and McLaren, P.L. (1994) Rethinking critical theory and qualitative research. In: Denzin, N.K. and Lincoln, Y.S., (Eds.) Handbook of qualitative research, pp. 138-157. Thousand Oaks, CA: Sage Publications.
King, N. (1990) Innovation at work: the research literature. In: West, M.A., (Ed.) Innovation and creativity at work: psychological and organizational strategies., Chichester, England.: John Wiley & Sons Ltd.
King, N. (1992) Modelling the innovation process: an empirical comparison of approaches. Journal of Occupational and Organizational Psychology 65(2), 89-100.
King, N. and Anderson, N. (1990) Innovation in working groups. In: West, M.A., (Ed.) Innovation and creativity at work: psychological and organizational strategies., Chichester, England.: John Wiley & Sons Ltd.
King's Fund (2003) Shaping the new NHS, London (www.kingsfund.org.uk): King's Fund.
Kirton, M.J. (1976) Adaptors and innovators: a description and measure. Journal of Applied Psychology 61(5), 622-29.
Kirton, M.J. (1980) Adaptors and innovators in organisations. Human Resources 33, 213-224.
Kirton, M.J. (1988) Adaptors and innovators: problem solvers in organizations. In: Grønhaug, K. and Kaufmann, G., (Eds.) Innovation: a cross-disciplinary

- 277 -
perspective, pp. 65-86. Norwegian University Press.
Kirton, M.J. (1994) Adaptors and innovators at work. In: Kirton, M.J., (ed.) Adaptors and Innovators: Styles of Creativity and Problem Solving, pp. 51-71. London: Routledge.
Kleinschmidt, E.J. and Cooper, R.G. (1991) The impact of product innovativeness on performance. Journal of Product Innovation Management 8(4), 240-251.
Kleinschmidt, E.J. and Cooper, R.G. (1995) The relative importance of new product success determinants - perception versus reality. R&D Management 25(3), 281-298.
Koput, K. (1997) A chaotic model of innovative search: some answers, many questions. Organization Science 8(5), 528-542.
Kraft, K. (1990) Are product and process innovations independent of each other? Applied Economics 22(8), 1029-1038.
Kreiner, K. and Schultz, M. (1995) Soft cultures: the symbolism of cross-border organizing. Studies in Cultures, Organizations and Societies. 1(1), 63-81.
Krippendorff, K. (1997) The construction of social reality, Communication Theory 7(1), 81-85.
Lambe, C.J. and Spekman, R.E. (1997) Alliances, external technology acquisition, and discontinuous technological change. Journal of Product Innovation Management 14(2), 102-116.
Langan-Fox, J. and Tan, P. (1997) Images of a culture in transition: personal constructs of organizational stability and change. Journal of Occupational and Organizational Psychology 70(3), 273-293.
Latta, G.F. and Swigger, K. (1992) Validation of the repertory grid for use in modeling knowledge. Journal of the American Society for Information Science 43(2), 115-129.
Lawson, C. and Lorenz, E. (1999) Collective learning, tacit knowledge and regional innovative capacity. Regional Studies 33(4), 305-317.
Lee, J.S. and Xon, Y.X. (1996) A customer service process innovation using the integration of data base and case base. Expert Systems With Applications 11(4), 543-552.
Lee, M., Son, B. and Lee, H. (1996) Measuring R&D effectiveness in Korean companies. Research-Technology Management 39(6), 28-31.
Lengnick-Hall, C.A. (1992) Innovation and competitive advantage - What We Know and What We Need to Learn. Journal of Management 18(2), 399-429.

- 278 -
Leonard-Barton, D. (1992) Core capabilities and core rigidities: a paradox in managing new product development. Strategic Management Journal 13(Special issue), 111-125.
Leonard-Barton, D. and Sinha, D.K. (1993) Developer-user interaction and user satisfaction in internal technology transfer. Academy of Management Journal 36(5), 1125-1139.
Leonard, D. (1998) Wellsprings of Knowledge: building and sustaining the sources of innovation., Harvard Business School Press.
Leonard, D. and Sensiper, S. (1998) The Role of tacit knowledge in group innovation. California Management Review 40(3), 112-132.
Leverment, Y., Ackers, P. and Preston, D. (1998) Professionals in the NHS - a case study of business process re-engineering. New Technology Work and Employment 13(2), 129-139.
Levinthal, D.A. and March, J.G. (1993) The myopia of learning. Strategic Management Journal 14(8, special issue), 95-112.
Levitt, B. and March, J.G. (1988) Organizational learning. Annual Review of Sociology 14, 319-340.
Lincoln, Y.S. and Guba, E.G. (1985) Naturalistic inquiry, Beverly Hills, CA: Sage.
Llewellyn, S. (2001) 'Two-way windows': clinicians as medical managers. Organization Studies 22(4), 593-623.
Loch, C., Stein, L. and Terwiesch, C. (1996) Measuring development performance in the electronics industry. Journal of Product Innovation Management 13(1-3), 3-20.
Lofland, J. and Lofland, L.H. (1995) Analyzing social settings: a guide to qualitative observation and analysis, 3rd edn. Wadsworth Publishing Company.
Lynn, G.S. and Akgün, A.E. (2001) Project visioning: its components and impact on new product success. Journal of Product Innovation Management 18(4), 374-387.
MacQueen, J. (1967) Some methods for classification and analysis of multivariate observations. In: Cam, L.M. and Neyman, J.E.e., (Eds.) Proceedings 5th Berkeley Symposium on Mathematical Statistics and Probability, pp. 281-297. University of California Press, Berkeley, CA.
Madhavan, R. and Grover, R. (1998) From embedded knowledge to embodied knowledge: new product development as knowledge management. Journal of Marketing 62(4), 1-12.
Maidique, M.A. and Zirger, B.J. (1984) A study of success and failure in product

- 279 -
innovation: the case of the US electronics industry. IEEE Transactions on Engineering Management EM-31(4), 192-203.
Malach, J.D. (1998) Phase gate management-best practices and methods. Proceedings 29th Annual Project management Institute Seminars and Symposium.
Malhotra, M.K. and Grover, V. (1998) An assessment of survey research in POM: from constructs to theory. Journal of Operations Management 16(4), 407-425.
Manu, F.A. and Sriram, V. (1996) Innovation, marketing strategy, environment, and performance. Journal of Business Research 35(1), 79-91.
Margolis, J. (1986) Pragmatism without foundations, Oxford: Blackwell.
Mark, A. and Lynch, R. (2000) What's new in strategic thinking? Recent developments and their implications for NHS strategy. Clinician in Management 9(2), 132-138.
Marmor, T. (2001) Fads in medical care policy and politics: the rhetoric and reality of managerialism. Rock Carling Fellowship Lecture, www.lse.ac.uk/Depts/lsehsc/pdf_files/fadsandfashions.pdf2001. 2002.
Marsden, D. and Littler, D. (2000) Exploring consumer product construct systems with the repertory grid technique. Qualitative Market research: An International Journal 3(3), 127-144.
Marshall, J.G. (1993) Issues in clinical information delivery. Library Trends 42(1), 83-107.
Martins, E.C. and Terblanche, F. (2003) Building organisational culture that stimulates creativity and innovation. European Journal of Innovation Management 6(1), 64-74.
Maylor, H. (2001) Assessing the relationship between practice changes and process: improvement in new product development. Omega-International Journal of Management Science 29(1), 85-96.
McAdam, R. and McClelland (2002) Individual and team-based idea generation within innovation management: organisational and research agendas. European Journal of Innovation Management 5(2), 86-97.
McAdam, R.M.S. (1999) The process of knowledge management within organizations: a critical assessment of both theory and practice. Knowledge and Process Management 6(2), 101-113.
McCann, J.E. and Selsky, J. (1984) Hyperturbulence and the emergence of type 5 environments. Academy of Management Review 9(3), 460-470.
McCarthy, I., Leseure, M., Ridgway, K. and Fieller, N. (1997) Building a

- 280 -
manufacturing cladogram. International Journal of Technology Management 13(3), 269-286.
McCarthy, I. and Ridgway, K. (2000) Cladistics: a taxonomy for manufacturing orgnizations. Integrated Manufacturing Systems 11(1), 16-29.
McCarthy, I.P. (1995) The development of a manufacturing classification using concepts from organisational systematics and biological taxonomy. Unpublished Ph.D. Dissertation, University of Sheffield, UK
McCarthy, I.P., Ridgway, K., Leseure, M. and Fieller, N. (2000) Organisational diversity, evolution and cladistic classifications. Omega: The International Journal of Management Science 28(1), 77-95.
McKelvey, B. (1975) Guidelines for the empirical classification of organizations. Administrative Science Quarterly 20(4), 509-525.
McKelvey, B. (1978) Organizational systematics: taxonomic lessons from biology. Management Science 24(13), 1428-1440.
McNulty, T. and Ferlie, E. (2002) Reengineering health care: the complexities of organizational transformation, New York: Oxford University Press.
Merrill, S.A. and McGeary, M. (2002) Using human resource data to track innovation: summary of a workshop, Washington DC: National Academy Press.
Meyer, A., Chase, R., Roth, A., Voss, C., Sperl, K.-U., Menor, L. and Blackmon, K. (1999) Service competitiveness: an international benchmarking comparison of service practice and performance in Germany, UK and USA. International Journal of Service Industry Management 10(4), 369-379.
Meyer, A.D. and Goes, J.B. (1988) Organizational assimilation of innovations: a multilevel contextual analysis. Academy of Management Journal 31(4), 897-923.
Meyer, A.D., Tsui, A.S. and Hinings, C.R. (1993) Configurational approaches to organisational analysis. Academy of Management Journal 36(6), 1175-1195.
Meyer, M., Johnson, J.D. and Ethington, C. (1997) Contrasting attributes of preventive health innovations. Journal of Communication 47(2), 112-131.
Miles, M.B. and Huberman, M.A. (1994) Qualitative data analysis: an expanded source book. Miles, M.B. and Huberman, M.A., (Eds.) Thousand Oaks, CA.: Sage.
Milio, N. (1971) Health care organizations and innovation. Journal of Health and Social Behavior 12(June), 163-173.
Miller, D. and Friesen, P. (1980) Archetypes of organizational transition.

- 281 -
Administrative Science Quarterly 25(2), 268-299.
Miller, D. and Friesen, P.H. (1982) Innovation in conservative and entrepreneurial firms: two models of strategic momentum. Strategic Management Journal 3(Jan-Mar), 1-24.
Miller, D. and Friesen, P.H. (1984) Organizations: a quantum view, New Jersey: Prentice-Hall Inc.
Miller, D. and Mintzberg, H. (1983) The case for configuration. In: Morgan, G., (Ed.) Beyond method: strategies for social research, pp. 57-73. Sage.
Milligan, G.W. (1996) Clustering validation: results and implications for applied analyses. In: Arabie, P., Hubert, L.J. and De Soete, G., (Eds.) Classification and clustering, pp. 341-375. River Edge, NJ: World Scientific Publishing Co Pte Ltd.
Milligan, G.W. and Cooper, M.C. (1985) An examination of procedures for determining the number of clusters in a data set. Psychometrika 50, 159-179.
Mingers, J. (1990) The philosophical implications of Maturana's cognitive theories. Systems Practice 2, 569-591.
Mintzberg, H. (1979) The structuring of organizations: a synthesis of the research., Englewood Cliffs, NJ: Prentice Hall.
Mintzberg, H., Ahlstrand, B. and Lampel, J. (1998) Strategy safari: a guided tour through the wilds of strategic management, Hemel Hempstead, UK: Prentice Hall.
Mintzberg, H., Raisinghani, D. and Theoret, A. (1976) The structure of unstructured decision processes. Administrative Science Quarterly 21(2), 246-275.
Mir, R. and Watson, A. (2001) Critical realism and constructivism in strategy research: toward a synthesis. Strategic Management Journal 22(12), 1169-1173.
Mohr, L.B. (1969) Determinants of innovation in organizations. American Political Science Review 63, 111-126.
Montgomery, K. (1990) A prospective look at the specialty of medical management. Work and Occupations 17(2), 178-198.
Moore, G.C. and Benbasat, I. (1991) Development of an instrument to measure the perceptions of adopting an information technology innovation. Information Systems Research 2(3), 192-222.
Mukherjee, A. and Hoyer, W.D. (2001) The effect of novel attributes on product evaluation. Journal of Consumer Research 28(3), 462-472.

- 282 -
Mulrow, C.D. (1994) Rationale for systematic reviews. British Medical Journal 309(6954), 597-599.
Murphy, E., Dingwall, R., Greatbach, D., Parker, S. and Watson, P. (1998) Qualitative research methods in health technology assessment: a review of the literature. Health Technology Assessment 2(16), Health Technology Assessment, University of Southampton: NCCHTA.
Nahapiet, J. and Ghoshal, S. (1998) Social capital, intellectual capital, and the organizational advantage. Academy of Management Review 23(2), 242-266.
Neely, A. and Hii, J. (1998) Innovation and business performance: a literature review. www.cranfield.ac.uk/som/cbp.
Neimeyer, G.J. (1989) Applications of repertory grid technique to vocational assessment. Journal of Counseling and Development 67(June), 585-589.
Nelson, R. and Winter, G. (1982) An evolutionary theory of economic change, Cambridge, MA.: Belknap Press.
NHS (2000) The NHS Plan: a plan for investment, a plan for reform. London: HMSO (Cm 4818-I).
NHS (2002) Delivering the NHS Plan: next steps on investment, next steps on reform. London: HMSO (Cm 5503).
Noci, G. and Verganti, R. (1999) Managing green product innovation in small firms. Research and Development Management 29(1), 3-15.
Nohria, N. and Gulati, R. (1996) Is slack good or bad for innovation? Academy of Management Journal 39(5), 1245-1264.
Nonaka, I. (1990) Redundant, overlapping organization: a Japanese approach to managing the innovation process. California Management Review (Spring), 27-38.
Nonaka, I. and Takeuchi, H. (1995) The knowledge creating company: how Japanese companies create the dynamics of innovation., New York: Oxford University Press.
Nonaka, I. and Yamanouchi, T. (1989) Managing innovation as a self-renewing process. Journal of Business Venturing 4(5), 299-315.
Nord, W.R. and Tucker, S. (1987) Implementing routine and radical innovations, Lexington: DC: Heath and Company, Lexington Books.
Norman, G.R. and Streiner, D.L. (2000) Biostatistics: the bare essentials, 2nd edn. Hamilton, Ontario: B.C. Decker Inc.
Normann, R. (1971) Organizational innovativeness: product variation and

- 283 -
reorientation. Administrative Science Quarterly 16(2), 203-215.
Nunnally, J.C. (1967) Psychometric theory, New York: McGraw-Hill.
O'Connor, G.C. (1998) Market learning and radical innovation: a cross case comparison of eight radical innovation projects. Journal of Product Innovation Management 15(2), 151-166.
O'Reilly, C.A. and Tushman, M.L. (1997) Using culture for strategic advantage: promoting innovation through social control. In: Tushman, M.L. and Anderson, P., (Eds.) Managing strategic innovation and change: a collection of readings, pp. 200-216. New York: Oxford University Press.
O'Shea, A. (2002) The (R)evolution of new product innovation. Organization 9(1), 113-125.
OECD (1996) The measurement of scientific and technological activities: proposed guidelines for collecting and interpreting technological innovation data. Oslo Manual. Available at http://www.oecd.org/pdf/M00018000/M00018312.pdf. European Commission, Eurostat.
Oke, A. (1999) Analysis and implementation of volume flexibility in manufacturing plants. Cranfield University School of Management, unpublished PhD thesis.
Ondøej, L. (1993) Innovating organizations and managerial culture in Czech and Slovak organizations. In: Cozijnsen, A. and Vrakking, W., (Eds.) Handbook of Innovation Management, 1st edn. pp. 71-89. Oxford, England.: Basil Blackwell Ltd.
Osborne, S.P. (1998) Naming the beast: defining and classifying service innovations in social policy. Human Relations 51(9), 1133-1154.
Packendorff, J. (1995) Inquiring into the temporary organization: new directions for project management. Scandinavian Journal of Management 11(4), 319-333.
Packwood, T., Pollitt, C. and Roberts, S. (1998) Good medicine? A case study of business process re-engineering in a hospital. Policy and Politics 26(4), 401-415.
Page, A.L. (1993) Assessing new product development practices and performance: establishing crucial norms. Journal of Product Innovation Management 10(4), 273-290.
Pappas, R.A. and Remer, D.S. (1985) Measuring R&D productivity. Research Technology Management 28(3), 15-22.
Parthasarthy, R. and Hammond, J. (2002) Product innovation input and outcome: moderating effects of the innovation process. Journal of Engineering and Technology Management 19(1), 75-91.

- 284 -
Pavitt, K. (1991) Key characteristics of the large innovating firm. British Journal of Management 2(1), 41-50.
Peay, M.Y. and Peay, E.R. (1994) Innovation in high-risk drug-therapy. Social Science & Medicine 39(1), 39-52.
Peck, E., Towell, D. and Gulliver, P. (2002) Innovations in health and social care in England: exploring the exemplar of the Somerset Partnerships NHS and Social Care Trust. 3rd International Conference on Organizational Behaviour in Health Care, 20-22 March, Saïd Business School, University of Oxford.
Peckham, M. (1998) Future health scenarios and public policy. In: Marinker, M. and Peckham, M., (Eds.) Clinical futures, London: BMJ Books.
Peckham, M. (1999) Developing the National Health Service: a model for public services. The Lancet 354(9189), 1539-1545.
Peckham, M. (2000) A model for health: Innovation and the future of health services, London: The Nuffield Trust.
Pelz, D.C. (1983) Quantitative case histories of urban innovations: are there innovating stages? IEEE Transactions on Engineering Management EM 30(2), 60-67.
Pelz, D.C. (1985) Innovation complexity and the sequence of innovating stages. Knowledge-Creation Diffusion Utilization 6(3), 261-291.
Pentland, B.T. (1995) Grammatical models of organizational processes. Organization Science 6(5), 541-556.
Pentland, B.T. and Rueter, H.H. (1994) Organizational routines as grammars of action. Administrative Science Quarterly 39(3), 484-510.
Perry-Smith, J.E. and Shalley, C.E. (2003) The social side of creativity: a static and dynamic social network perspective. Academy of Management Review 28(1), 89-106.
Peter, J.P. (1979) Reliability: A review of psychometric basics and recent marketing practices. Journal of Marketing Research 16(1), 6-17.
Peters, T.J. and Waterman, R.H. (1982) In search of excellence: lessons from America's best run companies, New York: Harper & Row.
Pettigrew, A. (1990) Longitudinal field research on change: theory and practice. Organization Science 1(3), 267-292.
Pettigrew, A.M., Woodman, R.W. and Cameron, K.S. (2001) Studying organizational change and development: challenges for future research. Academy of Management Journal 44(4), 697-713.

- 285 -
Pinch, T., Collins, H. and Carbonne, L. (1996) Inside knowledge: second order measures of skill. The Sociological Review 44(2), 163-187.
Pinder, C.C. and Moore, L.F. (1979) The resurrection of taxonomy to aid the development of middle range theories of organizational behaviour. Administrative Science Quarterly 24(1), 99-118.
Pinto, J.K. and Prescott, J.E. (1988) Changes in critical success factors over the stages in the project life cycle. Journal of Management 14(1), 5-18.
Pitt, M. and Clarke, K. (1999) Competing on competence: A knowledge perspective on the management of strategic innovation. Technology Analysis and Strategic Management 11(3), 301-316.
Poole, M.S., Van de Ven, A.H., Dooley, K. and Holmes, M.E. (2000) Organizational change and innovation processes: theory and methods for research, New York: Oxford University Press.
Popper, K.R. (1991) Conjectures and refutations: the growth of scientific knowledge., 5th edn. London: Routledge & Kegan Paul plc.
Potter, C., Morgan, P. and Thompson, A. (1994) Continuous quality improvements in an acute hospital: a report of an action research project in three hospital departments. International Journal of Health Care Quality Assurance 7(1), 4-29.
Pouder, R. and St John, C.H. (1996) Hot spots and blind spots: geographical clusters of firms and innovation. Academy of Management Review 21(4), 1192-1225.
Powell, W.W. (1987) Hybrid organizational arrangements: new form or transitional development. California Management Review (Fall), 67-87.
Pugh, D.S. and Hickson, D.J. (1996) Writers on organizations, 5th edn. Penguin Books.
Pugh, D.S., Hickson, D.J., Hinings, C.R. and Turner, C. (1968) Dimensions of organization structure. Administrative Science Quarterly 13(1), 65-105.
Punj, G. and Stewart, D.W. (1983) Cluster analysis in marketing research: review and suggestions for application. Journal of Marketing Research 20(2), 134-148.
Quintas, P., Taylor, P., and Storey, J. (1997) Innovation and contracts: individuals, organisations and networks. Open University Business School Working paper series.
Rabson, J.D. and DeMarco, D.A. (1999) A model of innovation systems with links to creative style and psychological type. International Journal of Technology Management 18(5-8), 627-647.
Ramanujam, V. and Mensch, G.O. (1985) Improving the strategy-innovation link.

- 286 -
Journal of Product Innovation Management 2(4), 213-223.
Rea, C. (1993) Managing clinical directorates, Harlow, Essex: Longman.
Reger, R.K. and Huff, A.S. (1993) Strategic groups: a cognitive perspective. Strategic Management Journal 14(2), 103-124.
Rice, M.P., O'Connor, G.C., Peters, L.S. and Morone, J.G. (1998) Managing discontinous innovation. Research Technology Management 41(3), 52-58.
Rivett, G. (1998) From cradle to grave: fifty years of the NHS, London: The King's Fund.
Robb, F.F. (1989) On the application of the theory of emergence and of the law of maximum entropy production to social processes. Systems Practice (2), 389-399.
Roberts, E.B. and Berry, C.A. (1985) Entering new businesses: strategies for success. Sloan Management Review 26(3), 3-17.
Rochford, L. (1991) Generating and screening new product ideas. Industrial Marketing Management 20(4), 287-296.
Rogers, E.M. (1962) Diffusion of innovations, New York: The Free Press.
Rogers, E.M. (1983) Diffusion of innovations, 3rd edn. New York: The Free Press.
Rogers, E.M. and Shoemaker, F.F. (1971) Communication of innovations: a cross-cultural approach, New York: The Free Press.
Roth, K. (1992) International configuration and coordination archetypes for medium-sized firms in global industries. Journal of International Business Studies 23(3), 533-549.
Rothwell, R. (1974) The 'Hungarian SAPPHO': some comments and comparisons. Research Policy 3(1), 30-38.
Rothwell, R. (1985) Project Sappho - a comparative study of success and failure in industrial innovation. Information Age 7(4), 215-219.
Rothwell, R. (1992) Successful industrial innovation: critical factors for the 1990s. R & D Management 22(3), 221-239.
Rothwell, R., Freeman, C., Horseley, A., Jervis, V.T.P., Robertson, A.B. and Townsend, J. (1974) SAPPHO updated - Project SAPPHO phase II. Research Policy 3(3), 258-291.
Ruppel, C.P. and Harrington, S.J. (2000) The relationship of communication, ethical work climate, and trust to commitment and innovation. Journal of Business Ethics 25(4), 313-328.

- 287 -
Ruttan, V.W. (1997) Induced innovation, evolutionary theory and path dependence: sources of technical change. Economic Journal 107(444), 1520-1529.
Sass, H.M. (1997) Moral aspects of risk and innovation. Artificial Organs 21(11), 1217-1221.
Sastry, M.A. (1997) Problems and paradoxes in a model of punctuated organizational change. Administrative Science Quarterly 42(2), 237-263.
Schmidt, R.L. and Freeland, J.R. (1992) Recent progress in modelling R&D project-selection processes. IEEE Transactions on Engineering Management 39(2), 189-201.
Schon, D. (1963) Champions for radical new inventions. Harvard Business Review 41(2), 77-86.
Schroeder, R.G., Van de Ven, A.H., Scudder, G.D. and Polley, D. (1989) The development of innovation ideas. In: Van de Ven, A.H., Angle, H.L. and Poole, M., (Eds.) Research on the management of innovation: the Minnesota studies, pp. 107-133. New York: Harper & Row.
Schumpeter, J. (1934) Theory of Economic Development, Cambridge, MA: Harvard University Press.
Schwandt, T.A. (1994) Constructivist, interpretivist approaches to human enquiry. In: Denzin, N.K. and Lincoln, Y.S., (Eds.) Handbook of qualitative research, Thousand Oaks, CA: Sage Publications.
Schwandt, T.A. (1997) Qualitative enquiry: a dictionary of terms, Thousand Oaks, CA: Sage Publications.
Scott, S. and Bruce, R. (1994) Determinants of innovative behaviour: a path model of individual innovation. Academy of Management Journal 37(3), 580-607.
Shane, S. (1995) Uncertainty avoidance and the preference for innovation championing roles. Journal of International Business Studies 26(1), 47-68.
Shane, S., Venkataraman, S. and MacMillan, I. (1995) Cultural differences in innovation championing strategies. Journal of Management 21(5), 931-952.
Shenhar, A.J., Dvir, D. and Shulman, Y. (1995) A two-dimensional taxonomy of products and innovations. Journal of Engineering and Technology Management 12(3), 175-200.
Shepard, H.A. (1967) Innovation-resisting and innovation producing organizations. Journal of Business 40(4), 470-477.
Sheth, J.N. and Ram, S. (1987) Bringing innovation to market: how to break corporate and customer barriers, New York: John Wiley & Sons, Inc.

- 288 -
Simpson, G.G. (1945) The principles of classification and a classification of mammals. Bulletin of the American Museum of Natural History 85.
Sirilli, G. and Evangelista, R. (1998) Technological innovation in services and manufacturing: results from Italian surveys. Research Policy 27(9), 881-899.
Smith, G.F. (1998) Idea-generation techniques: a formulary of active ingredients. Journal of Creative Behaviour 32(2), 107-133.
Smith, K. (2000) Innovation as a systemic phenomenon: rethinking the role of policy. Enterprise and innovation management studies 1(1), 73-102.
Smith, K.K. (1982) Philosophical problems in thinking about organizational change. In: Goodman and Associates, (Ed.) Change in Organizations, pp. 316-374. San Francisco and London: Jossey Bass.
Sneath, P. and Sokal, R. (1973) Numerical taxonomy: the principles and practice of numerical classification, San Francisco: W.H. Freeman.
Sokal, R. and Sneath, P. (1963) Principles of numerical taxonomy, San Francisco: W.H. Freeman.
Song, X.M. and Montoya-Weiss, M.M. (1998) Critical development activities for really new versus incremental products. Journal of Product Innovation Management 15(2), 124-135.
Souder, W.E. and Moenaert, R.K. (1992) Integrating marketing and research-and-development project personnel within innovation projects - an information uncertainty model. Journal of Management Studies 29(4), 485-512.
Souitaris, V. (2002) Firm-specific competencies determining technological innovation: a survey in Greece. R & D Management 32(1), 61-77.
Spurgeon, P. (1998) The new face of the NHS, London, UK: Royal Society of Medicine Press Ltd.
Stacey, R. (1993) Strategy as order emerging from chaos. Long Range Planning 26(1), 10-17.
Storey, C. and Easingwood, C.J. (1998) The augmented service offering: a conceptualisation and study of its impacts on new service success. Journal of Product Innovation Management 15(4), 335-351.
Subramanian, A. (1996) Innovativeness: redefining the concept. Journal of Engineering and Technology Management 13(3-4), 223-243.
Subramanian, A. and Nilakanta, S. (1996) Organizational innovativeness: exploring the relationship between organizational determinants of innovation, types of innovations, and measures of organizational performance. Omega-International Journal of Management Science 24(6), 631-647.

- 289 -
Sundbo, J. (1997) Management of innovation in services. Service Industries Journal 17(3), 432-455.
Taggart, J.H. and Blaxter, T.J. (1992) Strategy in pharmaceutical R&D: a portfolio risk matrix. R&D Management 22(3), 241-254.
Tatikonda, M.V. and Montoya-Weiss, M.M. (2001) Integrating operations and marketing perspectives of product innovation: the influence of organizational process factors and capabilities on development performance. Management Science 47(1), 151-172.
Tatikonda, M.V. and Rosenthal, S.R. (2000) Technology novelty, project complexity, and product development project execution success: a deeper look at task uncertainty in product innovation. IEEE Transactions on Engineering Management 47(1), 74-87.
Teece, D.J. (1998) Research directions for knowledge management. California Management Review 40(3), 289-293.
Teece, D.J., Pisano, G. and Shuen, A. (1997) Dynamic capabilities and strategic management. Strategic Management Journal 18(7), 509-533.
Teng, J.T.C., Grover, V. and Guttler, W. (2002) Information technology innovations: general diffusion patterns and its relationships to innovation characteristics. IEEE Transactions on Engineering Management 49(1), 13-27.
Tether, B.S. (1998) Small and large firms: sources of unequal innovations. Research Policy 27(7), 725-745.
Thomas, J.L. (1998) Making sense of project management. Proceedings, IRNOP 3 - the nature and roles of projects in the next 20 years: research issues and problems.
Thompson, L. (2003) Improving the creativity of organizational work groups. Academy of Management Executive 17(1), 96-109.
Tidd, J. (2001) Innovation management in context: environment, organizational and performance. International Journal of Management Reviews 3(3), 169-183.
Tornatzky, L.G. and Klein, K.J. (1982) Innovation characteristics and innovation adoption implementation: a meta-analysis of findings. IEEE Transactions on Engineering Management EM 29(1), 28-45.
Tranfield, D., Denyer, D. and Smart, P. (2003) Towards a methodology for developing evidence-informed management knowledge by means of a systematic review. British Journal of Management 14(3), 207-222.
Tranfield, D. and Smith, S. (1998) The strategic regeneration of manufacturing by changing routines. International Journal of Operations and Production Management. 18(2), 114-129.

- 290 -
Tranfield, D., Smith, S., Foster, M., Wilson, S. and Parry, I. (1998) Teamworked organisational engineering: getting the most out of teamworking. Management Decision 36(6), 378-384.
Trigg, R. (1980) Reality at risk: a defence of realism in philosophy and the sciences, Brighton: Harvester.
Tuchman, G. (1994) Historical social science: methodologies, methods and meanings. In: Denzin, N.K. and Lincoln, Y.S., (Eds.) Handbook of Qualitative Research, Thousand Oaks: Sage.
Tushman, M.L. and Nadler, D.A. (1986) Organizing for innovation. California Management Review 28(3), 74-92.
Usher, A.P. (1954) A history of mechanical inventions, Harvard University Press.
Utterback, J. and Abernathy, W. (1975) A dynamic model of process and production innovation. Omega-International Journal of Management Science 3(6), 639-656.
Utterback, J.M., Allen, T.J., Hollomon, H. and Sirbu, M.H. (1976) The process of innovation in five industries in Europe and Japan. IEEE Transactions on Engineering Management 1(Feb), 3-9.
Van de Ven, A.H., Angle, H.L. and Poole, M.S. (1989) Research on the management of innovation: the Minnesota studies, New York: Harper & Row.
Van de Ven, A.H. and Poole, M.S. (1989) Toward a theory of innovation processes. In: Van de Ven, A.H., Angle, H.L. and Poole, M.S., (Eds.) Research on the management of innovation: the Minnesota studies., New York: Harper & Row.
Van de Ven, A. (1986) Central problems of the management of innovation. Management Science 32(5), 590-607.
Veryzer, R.W. (1998) Discontinuous innovation and the new product development process. Journal of Product Innovation Management 15(4), 304-321.
von Bertalanffy, L. (1962) General system theory - a critical review. General Systems Yearbook 7, 1-20.
von Hippel, E. (1994) Sticky information and the locus of problem solving: implications for innovation. Management Science 40(4), 429-439.
Voss, C., Chase, R. and Roth, A. (1999) International service study. Decision Line (May) 4-7.
Vyakarnam, S. and Adams, R.J. (2001) Institutional barriers to enterprise support: an empirical study. Environment and Planning C: Government and Policy 19(3), 335-353.

- 291 -
Walston, S.L., Kimberly, J.R. and Burns, L.R. (2001) Institutional and economic influences on the adoption and extensiveness of managerial innovation in hospitals: the case of reengineering. Medical Care Research and Review 58(2), 194-228.
Ward, J. (1963) Hierarchical grouping to optimize an objective function. Journal of the American Statistical Association 58, 236-244.
Warner, K.E. (1974) The need for some innovative concepts of innovation: an examination of research on the diffusion of innovations. Policy Sciences 5, 433-451.
Warren, W.E., Abercrombie, C.L. and Berl, R.L. (1989) Adoption of a service innovation: a case study with managerial implications. Journal of Services Marketing 31(1), 21-33.
Weick, K.E. and Roberts, K.H. (1993) Collective mind in organizations: heedful interrelating on flight decks. Administrative Science Quarterly 38(3), 357-381.
Weight, P. (2001) Strategic and professional leadership: the challenge of role duality. Cranfield University School of Management, unpublished PhD thesis.
Werner, B.M. and Souder, W.E. (1997) Measuring R&D performance - state of the art. Research-Technology Management 40(2), 34-42.
West, M.A. (1990) The social psychology of innovation in groups. In: West, M.A. and Farr, J.L., (Eds.) Innovation and creativity at work: psychological and organizational strategies., pp. 309-333. Chichester, UK: John Wiley & Sons Ltd.
West, M.A. and Anderson, N. (1992) Innovation, cultural values, and the management of change in British Hospitals. Work and Stress 6(3), 293-310.
West, M.A. and Anderson, N.R. (1996) Innovation in top management teams. Journal of Applied Psychology 81(6), 680-693.
West, M.A. and Farr, J.L. (1990) Innovation at work. In: West, M.A. and Farr, J.L., (Eds.) Innovation and creativity at work: psychological and organizational strategies , pp. 3-13. Chichester, England: John Wiley & Sons.
White, G.R. and Graham, M.B.W. (1978) How to spot a technological winner. Harvard Business Review 56(2, March-April), 146-152.
Whitley, R. (1984) The fragmented state of management studies: reasons and consequences. Journal of Management Studies 21(3), 331-348.
Wilson, A.L., Ramamurthy, K. and Nystrom, P.C. (1999) A multi-attribute measure for innovation adoption: the context of imaging technology. IEEE Transactions on Engineering Management 46(3), 311-321.

- 292 -
Wilson, J.Q. (1966) Innovation in organization: notes toward a theory. In: Thompson, J.D., (Ed.) Approaches to organizational design, pp. 193-218. Pittsburgh: University of Pittsburgh Press.
Wishart, D. (1987) Clustan user manual, Edinburgh: Clustan Ltd.
Wolfe, R.A. (1994) Organizational innovation: review, critique and suggested research directions. Journal of Management Studies 31(3), 405-431.
Wood, M., Ferlie, E. and Fitzgerald, L. (1998) Achieving clinical behaviour change: a case of becoming indeterminate. Social Sciences and Medicine 47(11), 1729-1738.
Woodman, R.W., Sawyer, J.E. and Griffin, R.W. (1993) Toward a theory of organizational creativity. Academy of Management Review 18(2), 293
Wyatt, J.C. (2000) Practice guidelines and other support for clinical innovation. Journal of the Royal Society of Medicine 93(June), 299-304.
Yin, R.K. (1994) Case study research: design and methods. Yin, R.K., (Ed.) 2nd edn, London: Sage.
Zaltman, G., Duncan, R. and Holbek, J. (1973) Innovations and organisations, New York: John Wiley & Sons, Inc.
Zien, K.A. and Buckler, S.A. (1997) From experience: dreams to market: crafting a culture of innovation. Journal of Product Innovation Management 14(4), 274-287.

- 293
-
APP
EN
DIX
ON
E: I
NN
OV
AT
ION
NE
WN
ESS
St
udy
Focu
s C
lass
ifica
tion
syst
em
Nat
ure
of st
udy
Obs
erva
tions
1934
, Sch
umpe
ter
Inno
vatio
n, w
hich
is d
istin
ct
from
inve
ntio
n an
d im
itatio
n,
is c
ruci
al to
eco
nom
ic
deve
lopm
ent.
5 di
ffer
ent a
reas
of n
ewne
ss: 1
. in
trodu
ctio
n of
a n
ew g
ood
or o
f a n
ew
qual
ity o
f a g
ood,
2. I
ntro
duct
ion
of a
new
pr
oduc
tion
proc
ess,
3. O
peni
ng u
p of
a
new
mar
ket,
4. D
evel
opm
ent o
f a n
ew
sour
ce o
f inp
ut su
pplie
s, 5.
Cha
nges
in
indu
stria
l org
anis
atio
n.
Econ
omic
theo
rist u
sing
inno
vatio
n to
hel
p ex
plai
n bu
sine
ss c
ycle
s.
Inno
vatio
n ca
uses
cyc
lical
fluc
tuat
ions
or w
aves
. In
trodu
ced
notio
n of
'cre
ativ
e de
stru
ctio
n', t
he
repl
acem
ent o
f the
old
with
the
new
thro
ugh
the
test
ing
and
appl
icat
ion
of n
ew id
eas.
Inno
vatio
n is
the
fund
amen
tal i
mpu
lse
that
star
ts a
nd m
otiv
ates
the
capi
talis
t mac
hine
.
1961
, Bur
ns &
St
alke
r
An
expl
orat
ion
of th
e re
latio
nshi
p be
twee
n or
gani
satio
ns a
nd th
eir
envi
ronm
ent.
Sugg
est
envi
ronm
enta
l cha
nge
prom
pts r
ealig
nmen
t of t
he fi
t be
twee
n st
rate
gy a
nd
stru
ctur
e.
New
ness
(rad
ical
, inc
rem
enta
l).
Larg
ely
conc
eptu
al.
Cha
lleng
ed th
e vi
ew th
at th
ere
is 'o
ne b
est w
ay' t
o m
anag
e an
d of
fers
the
typo
logy
of o
rgan
ic v
s m
echa
nist
ic o
rgan
isat
ions
. Org
anis
atio
nal
char
acte
ristic
s inf
luen
ce in
nova
tiven
ess.
Mec
hani
stic
or
gani
satio
ns a
re b
est s
uite
d to
stab
le c
ondi
tions
and
in
nova
te in
crem
enta
lly. O
rgan
ic o
rgan
isat
ions
are
ap
prop
riate
for c
hang
ing,
uns
tabl
e co
nditi
ons a
nd
yiel
d m
ore
radi
cal i
nnov
atio
ns.
1978
, Whi
te &
G
raha
m
Dev
elop
ing
a fr
amew
ork
to
eval
uate
the
mer
it of
radi
cal
tech
nolo
gica
l inn
ovat
ion.
N
ewne
ss (r
adic
al).
Con
cept
ual.
It is
the
disc
ontin
uous
, rev
olut
iona
ry
inno
vatio
n th
at a
ffect
s a c
ompa
ny's
fate
(pp.
14
7).
Fram
ewor
k co
nstru
cted
aro
und
issu
es o
f cor
e te
chno
logy
(inv
entiv
e m
erit
and
embo
dim
ent m
erit)
an
d im
plic
atio
ns fo
r bus
ines
s pra
ctic
e (o
pera
tiona
l m
erit
and
mar
ket m
erit)
. For
erun
ner o
f fam
iliar
ity
mat
rix (s
ee R
ober
ts &
Ber
ry, 1
985)
.
1982
, Boo
z-A
llen
et
al.
New
pro
duct
s man
agem
ent
for t
he 1
980s
.
New
ness
(6 c
ateg
orie
s ran
ging
from
new
-to
-the-
wor
ld p
rodu
cts t
o si
mpl
e co
st
redu
ctio
ns).
Cat
egor
ises
new
pro
duct
s on
2 di
men
sion
s of n
ewne
ss: t
o th
e de
velo
ping
fir
m a
nd to
the
mar
ket.
Inve
stig
atio
n in
to ro
le a
nd im
pact
of p
rodu
ct
inno
vativ
enes
s. Fi
ndin
gs su
gges
t tha
t inn
ovat
ive
prod
ucts
are
mor
e su
cces
sful
and
that
firm
s sh
ould
pur
sue
such
pro
duct
s.
Mor
e in
nova
tive
cate
gorie
s yie
ld a
hig
her p
ropo
rtion
of
'suc
cess
es'.
1983
, Hea
ny
To re
-exa
min
e so
me
of th
e 'se
man
tic in
flatio
n an
d di
stin
ctio
ns' a
ssoc
iate
d w
ith
prod
uct i
nnov
atio
n.
New
ness
(sty
le c
hang
e, p
rodu
ct-li
ne
exte
nsio
n, p
rodu
ct im
prov
emen
t, ne
w
prod
uct,
star
t-up
busi
ness
, maj
or
inno
vatio
n).
Pres
crip
tive
prac
titio
ner-
orie
ntat
ion.
Pro
duct
in
nova
tion
focu
s. Su
gges
ts p
olar
ext
rem
es o
f ne
wne
ss a
nd p
opul
ates
the
inte
rmed
iate
spac
e w
ith a
furth
er 4
cat
egor
ies o
f new
ness
. Abs
ence
of
just
ifica
tion
for a
ny o
f the
labe
ls -
they
mus
t be
take
n as
'giv
en'.
Plea
for c
onsi
sten
cy o
f lan
guag
e an
d la
bel.
Link
s eac
h of
6 ty
pes w
ith d
iffer
ent b
usin
ess s
trate
gy a
nd ta
ctic
s.

- 294
-
1985
, Rob
erts
&
Ber
ry
Fram
ewor
k de
sign
ed to
hel
p se
lect
ent
ry st
rate
gy fo
r new
bu
sine
ss a
reas
.
New
ness
: fra
mew
ork
is b
ased
on
a 2-
dim
ensi
onal
"Fam
iliar
ity m
atrix
" ba
sed
on
corp
orat
e fa
mili
arity
- na
mel
y m
arke
t se
rved
and
tech
nolo
gy e
mpl
oyed
.
Prac
titio
ner-
orie
nted
pre
scrip
tive
revi
ew a
nd
synt
hesi
s of l
itera
ture
.
Nat
ure
of o
ppor
tuni
ties w
ill v
ary
depe
ndin
g on
"f
amili
arity
" co
ncep
t, an
d so
stra
tegi
c re
spon
ses n
eed
to v
ary:
1) s
tep-
out p
rodu
ct d
evel
opm
ent,
2) n
ew
busi
ness
and
new
ven
ture
s, 3)
new
item
s in
exis
ting
lines
, 4) m
arke
t dev
elop
men
t, 5)
def
end
or p
enet
rate
, 6)
mar
ket e
xpan
sion
thro
ugh
cust
omer
app
licat
ion
proj
ects
). N
ew b
usin
ess d
evel
opm
ent n
ew m
arke
ts,
new
pro
duct
s or b
oth.
The
se a
reas
may
be
fam
iliar
or
unfa
mili
ar.
1986
, Tus
hman
&
Nad
ler
Expl
orat
ion
of o
rgan
isat
iona
l fa
ctor
s tha
t enh
ance
in
nova
tion.
New
ness
(inc
rem
enta
l, sy
nthe
tic,
disc
ontin
uous
) and
type
(pro
duct
, pro
cess
).Pr
escr
iptiv
e. A
t the
mos
t bas
ic le
vel t
here
are
two
kind
s of i
nnov
atio
n…(p
p. 7
5).
Sust
aine
d in
nova
tion
requ
ires s
tabi
lity
and
chan
ge,
inte
rpla
y of
deg
ree
of n
ovel
ty w
ith st
rate
gy o
ver
cour
se o
f pro
duct
life
cyc
le.
1986
, Dew
ar &
D
utto
n
Test
of m
odel
s for
the
adop
tion
of tw
o di
ffer
ent
type
s of i
nnov
atio
n.
New
ness
(rad
ical
, inc
rem
enta
l) an
d ty
pe
(tech
nica
l, pr
oces
s). V
aria
bles
cho
sen
that
ar
e w
idel
y re
gard
ed a
s bei
ng a
ssoc
iate
d w
ith in
nova
tion
adop
tion
and
revi
ewed
fr
om a
kno
wle
dge
pers
pect
ive.
6 te
chno
logi
cal i
nnov
atio
ns c
omm
on to
the
foot
wea
r ind
ustry
wer
e ra
ted
as in
crem
enta
l or
radi
cal b
y 56
judg
es. S
tratif
ied
rand
om sa
mpl
e (n
=40)
US
foot
wea
r man
ufac
ture
rs.
Ado
ptio
n of
radi
cal a
nd in
crem
enta
l inn
ovat
ion
has
diff
eren
t pre
dict
ors.
Res
earc
h ne
eds t
o ac
know
ledg
e di
ffer
ence
s acr
oss d
iffer
ent i
nnov
atio
ns.
1988
, Joh
ne &
Sn
elso
n Fa
ctor
s aff
ectin
g su
cces
s in
prod
uct i
nnov
atio
n.
New
ness
(new
pro
duct
line
s whe
re th
e or
gani
satio
n ha
s no
tech
nolo
gica
l ex
perti
se, e
xten
sion
s to
exis
ting
lines
ex
ploi
ting
curr
ent t
echn
olog
ical
exp
ertis
e,
deve
lopm
ents
of e
xist
ing
prod
uct l
ines
).
Lite
ratu
re re
view
. Foc
us o
n br
ead-
and-
butte
r…th
e di
ffere
nt ty
pes o
f pro
duct
inno
vatio
n op
en to
a m
anuf
actu
ring
bus
ines
s (pp
. 115
) in
nova
tions
: dev
elop
men
ts o
f exi
stin
g pr
oduc
t lin
es.
Ana
lyse
s suc
cess
fact
ors i
n te
rms o
f McK
inse
y's 7
S fr
amew
ork
(ski
lls, s
trate
gy, s
truct
ure,
shar
ed v
alue
s, st
aff,
styl
e, sy
stem
s).
Dam
anpo
ur 1
988
Stud
y of
the
impa
ct o
f or
gani
satio
nal f
acto
rs o
n th
e ad
optio
n of
inno
vatio
ns.
New
ness
(rad
ical
, inc
rem
enta
l) an
d ty
pe
(tech
nica
l, ad
min
istra
tive)
. M
eta-
anal
ysis
of p
revi
ous s
tudi
es. T
ypol
ogic
al.
Org
anis
atio
ns a
dopt
inno
vatio
ns o
f var
ious
"typ
es o
f ra
dica
lnes
s" (s
ic p
561,
the
expr
essi
on is
inte
rest
ing
beca
use
Dam
anpo
ur d
oes n
ot id
entif
y ty
pes o
f ra
dica
lnes
s at a
ny p
oint
. Pos
sibl
y "r
adic
alne
ss" i
s be
ing
used
as a
gen
eric
term
for n
ewne
ss [w
hich
m
ight
be
dich
otom
ised
radi
cal/i
ncre
men
tal]
in th
is
inst
ance
) to
resp
ond
to c
hang
es in
thei
r env
ironm
ent.
Cle
ar d
istin
ctio
n be
twee
n ca
tego
ries o
f inn
ovat
ion
help
reso
lve
inco
nsis
tenc
ies i
n pr
evio
us re
sear
ch.
Inno
vatio
ns d
o no
t sha
re id
entic
al a
ttrib
utes
. Te
chni
cal/a
dmin
istra
tive
dist
inct
ion
wel
l sup
porte
d in
th
e lit
erat
ure
and,
it re
flect
s a m
ore
gene
ral d
istin
ctio
n be
twee
n so
cial
stru
ctur
es a
nd te
chno
logy
.
1990
, Hen
ders
on &
C
lark
Trad
ition
al c
ateg
oris
atio
n ba
sed
on ra
dica
l/inc
rem
enta
l ar
gued
to b
e in
com
plet
e or
m
isle
adin
g. D
evel
op a
n ex
pand
ed c
once
ptua
l fr
amew
ork
of in
nova
tion
type
.
New
ness
(rad
ical
, inc
rem
enta
l) an
d ty
pe
(pro
duct
, arc
hite
ctur
al, m
odul
ar).
R/I
dich
otom
isat
ion
insu
ffic
ient
bec
ause
ap
pare
ntly
mod
est (
incr
emen
tal)
inno
vatio
ns a
re re
porte
d to
hav
e ha
d dr
amat
ic (r
adic
al) c
onse
quen
ces.
Prod
uct
conc
eive
d of
as a
syst
em c
ompr
isin
g co
mpo
nent
s, ch
ange
can
hap
pen
to th
e sy
stem
or t
o in
divi
dual
com
pone
nts.
Cas
e st
udy
of se
mic
ondu
ctor
pho
tolit
hogr
aphi
c al
ignm
ent e
quip
men
t to
test
val
idity
of
fram
ewor
k th
at su
gges
ts im
porta
nt im
plic
atio
ns
of c
once
pt o
f arc
hite
ctur
al in
nova
tion.
2-y
ear
field
stud
y in
pho
tolit
hogr
aphi
c al
ignm
ent
equi
pmen
t ind
ustry
.
Link
s arc
hite
ctur
al in
nova
tion
to o
rgan
isat
iona
l le
arni
ng. I
nnov
atio
ns h
ave
the
pote
ntia
l to
enha
nce
or
dest
roy
com
pete
nce
with
in a
firm
- ar
chite
ctur
al
inno
vatio
n ha
s the
cap
acity
to d
o bo
th. L
earn
ing
abou
t cha
nges
in a
rchi
tect
ure
(new
inte
ract
ions
acr
oss
com
pone
nts [
or b
ound
arie
s]) m
ay re
quire
exp
licit
atte
ntio
n, n
ew sk
ills e
tc...

- 295
-
1991
, Kle
insc
hmid
t &
Coo
per
The
role
and
impa
ct o
f pr
oduc
t inn
ovat
iven
ess o
n pe
rfor
man
ce.
New
ness
(new
-to-w
orld
, new
-to-f
irm,
addi
tions
to e
xist
ing
prod
uct l
ines
, im
prov
emen
ts to
exi
stin
g pr
oduc
ts, c
ost
redu
ctio
ns to
exi
stin
g pr
oduc
ts,
repo
sitio
ning
of e
xist
ing
prod
ucts
).
This
stud
y co
nden
sed
this
sche
ma
to 3
cat
egor
ies
of h
igh,
mod
erat
e an
d lo
w in
nova
tive
prod
ucts
ba
sed
on th
e pr
inci
pal o
f par
sim
ony.
195
new
pr
oduc
ts fr
om 1
25 in
dust
rial p
rodu
ct fi
rms.
Man
ager
s int
ervi
ewed
abo
ut a
succ
ess a
nd a
fa
ilure
and
on
mea
sure
s of i
nnov
ativ
enes
s.
Rel
atio
nshi
p be
twee
n pr
oduc
t inn
ovat
iven
ess a
nd
com
mer
cial
succ
ess i
s U-s
hape
d. T
hat i
s low
and
hi
ghly
inno
vativ
e pr
oduc
ts a
re m
ore
likel
y to
be
mor
e su
cces
sful
than
mod
erat
ely
inno
vativ
e pr
oduc
ts.
Prod
uct i
nnov
ativ
enes
s bas
ed o
n th
e B
ooz,
Alle
n &
H
amilt
on (1
982)
sche
ma
that
exp
licat
es 6
cat
egor
ies
from
new
-to-th
e-w
orld
to re
posi
tioni
ngs.
Dam
anpo
ur, 1
991
Org
anis
atio
nal a
dopt
ion
of
mul
tiple
inno
vatio
ns.
New
ness
(rad
ical
, inc
rem
enta
l) an
d ty
pe
(adm
inis
trativ
e, te
chni
cal,
prod
uct,
proc
ess)
.
Brie
fly re
view
s the
lite
ratu
re a
nd se
lect
s ty
polo
gies
that
hav
e ga
ined
the
mos
t atte
ntio
n (p
p. 5
5). M
eta
anal
ysis
of t
he li
tera
ture
usi
ng a
m
etho
d re
min
isce
nt o
f sys
tem
atic
revi
ew. S
ampl
e co
nsis
ted
of 2
3 em
piric
al st
udie
s, 21
arti
cles
and
2
book
s.
Type
s of i
nnov
atio
n fo
und
not t
o be
hig
hly
effe
ctiv
e m
oder
ator
s of o
rgan
isat
iona
l inn
ovat
ion,
rath
er
orga
nisa
tiona
l typ
e ac
coun
ts fo
r muc
h of
the
varia
nce.
In
nova
tion
type
is se
cond
ary.
1992
, Kin
g Em
piric
al te
st o
f mod
els o
f in
nova
tion
proc
ess.
New
ness
(rad
ical
ness
- co
nsis
ting
of
nove
lty a
nd ri
sk).
Long
itudi
nal s
tudy
of i
nnov
atio
n in
a si
ngle
ho
spita
l war
d. 1
7 in
nova
tions
iden
tifie
d of
whi
ch
7 fo
rm b
asis
of t
he a
naly
sis.
Inno
vatio
ns sc
ored
as
hig
h, m
ediu
m o
r low
on
risk
and
nove
lty b
y th
e au
thor
and
an
inde
pend
ent r
ater
. Ris
k di
ffic
ult
to d
eter
min
e re
trosp
ectiv
ely
by th
e in
depe
nden
t ra
ter.
Less
supp
ort f
or th
e rig
id, l
inea
r sta
ge-b
ased
mod
el
than
for t
he m
odel
cha
ract
eris
ed b
y fle
xibi
lity
and
diso
rder
lines
s. Te
stin
g lin
ear a
nd re
curs
ive
proc
ess
mod
els a
gain
st ra
dica
lnes
s and
out
put.
Mea
sure
of
radi
cal b
ased
on
Zaltm
an's
(197
3) c
once
ptua
lisat
ion.
1993
, Coo
per &
K
lein
schm
idt
Wha
t mak
es a
new
pro
duct
a
win
ner?
New
ness
(exi
sts o
n a
cont
inuu
m p
olar
ised
by
"tru
e in
nova
tions
" and
"fai
rly m
inor
m
odifi
catio
ns":
1) t
rue
inno
vatio
ns -
a to
tally
new
pro
duct
that
cre
ates
a to
tally
ne
w m
arke
t, 2)
tota
lly n
ew to
the
wor
ld
prod
ucts
, but
cat
ers t
o an
exi
stin
g m
arke
t, 3)
tota
lly n
ew to
the
com
pany
pro
duct
s -ne
w fe
atur
es v
s com
petit
ion/
exis
ting
mar
ket,
4) n
ew p
rodu
ct li
nes t
o th
e co
mpa
ny, 5
) new
item
s to
an e
xist
ing
prod
uct l
ine
for t
he c
ompa
ny, 6
) si
gnifi
cant
mod
ifica
tions
of e
xist
ing
com
pany
pro
duct
s, 7)
fairl
y m
inor
m
odifi
catio
ns o
f exi
stin
g co
mpa
ny
prod
ucts
.
Empi
rical
stud
y of
103
che
mic
al in
dust
ry
proj
ects
/ Com
paris
on o
f win
ners
and
lose
rs.2
98-
varia
ble
ques
tionn
aire
. New
pro
duct
per
form
ance
m
easu
red
pred
omin
antly
by
finan
cial
indi
cato
rs.
7 ca
tego
ries o
f new
ness
ope
ratio
nalis
ed, a
de
rivat
ive
of B
ooz
et a
l.'s (
1982
) 6-c
ateg
ory
typo
logy
.
Succ
ess r
ates
do
not d
epen
d al
l tha
t dra
mat
ical
ly o
n th
e na
ture
of t
he p
rodu
ct's
inno
vativ
enes
s (pp
100
). H
owev
er, t
ype
4 in
nova
tions
acc
ount
ed fo
r 26%
of a
ll fa
ilure
s (bu
t wer
e on
ly 1
7% o
f all
laun
ches
) and
type
5
inno
vatio
ns a
ccou
nted
for 1
2 %
of a
ll la
unch
es a
nd
achi
eved
an
83%
succ
ess r
ate.
Pro
duct
diff
eren
tiatio
n ba
sed
on a
rang
e of
fact
ors (
perf
orm
ance
, val
ue fo
r m
oney
, rel
ativ
e qu
ality
...) i
s a b
ette
r pre
dict
or o
f pe
rfor
man
ce.
1995
, Atu
ahen
e-G
ima
Expl
orat
ory
anal
ysis
of
impa
ct o
f mar
ket o
rient
atio
n on
new
pro
duct
per
form
ance
.
New
ness
(rad
ical
, inc
rem
enta
l - d
egre
e of
pr
oduc
t new
ness
to c
usto
mer
s and
firm
[th
e pr
oduc
er])
.
Cro
ss-s
ectio
nal s
urve
y of
600
firm
s (se
rvic
e an
d m
anuf
actu
ring)
. 275
usa
ble
resp
onse
s fro
m a
pre
-te
sted
and
val
idat
ed in
stru
men
t. N
ewne
ss
mea
sure
d by
7 it
ems.
Influ
ence
of m
arke
t orie
ntat
ion
on su
cces
s of n
ew
prod
ucts
mod
erat
ed b
y ne
wne
ss. G
roun
ded
in a
bod
y of
lite
ratu
re th
at is
div
ided
rega
rdin
g th
e re
latio
nshi
p be
twee
n ne
wne
ss a
nd m
arke
t orie
ntat
ion'
s inf
luen
ce
on p
erfo
rman
ce.

- 296
-
1996
, Man
u &
Sr
iram
To id
entif
y di
ffer
ent t
ypes
of
busi
ness
es b
ased
on
thei
r in
nova
tion
orie
ntat
ion
and
mul
tiple
dim
ensi
ons o
f in
nova
tiven
ess.
To c
ompa
re
each
type
on
the
basi
s of t
heir
envi
ronm
ent,
mar
ketin
g st
rate
gy a
ttrib
utes
and
, pe
rfor
man
ce le
vel.
New
ness
(Com
posi
te m
easu
re o
f in
nova
tiven
ess b
ased
on:
rate
of n
ew
prod
uct i
ntro
duct
ion,
tim
ing
of m
arke
t en
try, R
&D
exp
endi
ture
).
Taxo
nom
ic. C
lust
er a
naly
sis b
ased
on
the
3 di
men
sion
s of i
nnov
ativ
enes
s. St
oppi
ng ru
les
gove
rned
by
prac
tical
use
fuln
ess a
nd k
inks
in th
e cu
rve.
Ran
dom
sam
ple
of 3
50 b
usin
esse
s fro
m
PIM
S da
taba
se.
4 ty
pes o
f inn
ovat
ion
orie
ntat
ion
iden
tifie
d, e
ach
asso
ciat
ed w
ith d
iffer
ent k
inds
of e
nviro
nmen
t and
de
liver
ing
diff
eren
t typ
es o
f per
form
ance
. G
roun
ded
in p
revi
ous l
itera
ture
on
inno
vatio
n or
ient
atio
n.
1996
, Dam
anpo
ur
Test
of t
heor
ies t
hat p
urpo
rt to
exp
lain
the
rela
tions
hip
betw
een
orga
nisa
tiona
l co
mpl
exity
(siz
e an
d st
ruct
ure)
and
inno
vatio
n.
New
ness
(rad
ical
, inc
rem
enta
l) an
d ty
pe
(Adm
inis
trativ
e, te
chni
cal,
prod
uct,
proc
ess)
.
Typo
logi
cal.
Met
hod
of c
odin
g of
inno
vatio
n to
ty
pe a
ccor
ding
to sp
ecifi
catio
n in
the
orig
inal
ar
ticle
. 21
publ
ishe
d st
udie
s rel
atin
g st
ruct
ural
co
mpl
exity
or s
ize
to o
rgan
isat
iona
l inn
ovat
ion.
Mul
tiple
obs
erva
tions
on
the
stru
ctur
al c
ompl
exity
-in
nova
tion
and
size
-inno
vatio
n re
latio
nshi
ps b
ased
on
dim
ensi
ons o
f inn
ovat
ion.
Inno
vatio
n br
oadl
y co
ncep
tual
ised
as a
mea
ns o
f cha
ngin
g an
or
gani
satio
n, h
ence
bre
adth
of t
ypes
.
1996
, Sub
ram
ania
n R
econ
cept
ualis
atio
n of
the
theo
retic
al c
onst
ruct
of
inno
vativ
enes
s.
Inno
vativ
enes
s, th
ree
dim
ensi
ons
mea
sure
d: (1
) Mea
n nu
mbe
r of i
nnov
atio
n ad
optio
ns (o
ver 7
yea
rs -
perio
d va
ries
acro
ss st
udie
s), (
2) M
ean
time
of
inno
vatio
n ad
optio
n, (3
) Con
sist
ency
of
the
time
of a
dopt
ion
(wer
e th
e fir
ms
cons
iste
ntly
ear
ly o
r lat
e?).
Man
y un
idim
ensi
onal
stud
ies (
whi
ch re
nder
s st
udie
s inc
ompl
ete)
, but
con
tend
s tha
t a v
alid
m
easu
re o
f inn
ovat
iven
ess m
ust r
epre
sent
the
tem
pora
l dim
ensi
on -
inno
vativ
enes
s is a
n en
durin
g tra
it. D
iffer
ent m
easu
res o
f in
nova
tiven
ess l
ead
to a
var
iety
of d
iffer
ent
outc
omes
but
, by
adop
ting
inno
vatio
ns e
arly
and
co
nsis
tent
ly c
ompe
titiv
e ad
vant
age
mig
ht b
e ga
ined
.
164
usab
le re
spon
ses (
sam
ple
size
n=6
00) t
o qu
estio
nnai
re-b
ased
surv
ey in
the
bank
ing
indu
stry
. 8
bank
ing
indu
stry
inno
vatio
ns fo
rmed
bas
is o
f qu
estio
nnai
re to
ass
ess r
ates
of a
dopt
ion
etc.
1996
, Che
ng &
Van
de
Ven
Patte
rn-s
eeki
ng in
the
inno
vatio
n pr
oces
s: o
rder
ly,
rand
om-c
hanc
e or
, ran
dom
-ch
aotic
? Pr
opos
e th
at li
ttle
rese
arch
has
bee
n do
ne o
n th
e em
erge
nce
of n
ovel
ty.
New
ness
(nov
elty
).
Trac
ked
2 bi
o-m
edic
al in
nova
tions
from
star
t of
fund
ing
to im
plem
enta
tion
(inte
rvie
ws,
mee
tings
, ob
serv
atio
n…lo
ngitu
dina
l). N
o m
easu
res o
f no
velty
spec
ified
.
Inno
vatio
n as
a le
arni
ng e
xper
ienc
e in
whi
ch n
ovel
ty
deriv
ed fr
om a
star
ting
posi
tion
of p
rofo
und
igno
ranc
e. N
on li
near
dyn
amic
al sy
stem
, beg
inni
ng in
ch
aos e
ndin
g in
per
iodi
city
.
Bes
sant
and
Caf
fyn,
19
97
Impl
emen
tatio
n is
sues
in
cont
inuo
us im
prov
emen
t and
in
crea
sing
par
ticip
atio
n in
the
inno
vatio
n pr
oces
s.
New
ness
(con
tinuo
us im
prov
emen
t).
Long
itudi
nal (
5 ye
ar) a
ctio
n re
sear
ch p
roje
ct
com
pris
ing
appr
oxim
atel
y 10
0 co
mpa
nies
. Sy
nthe
sis o
f ide
as fr
om m
anuf
actu
ring
man
agem
ent,
orga
nisa
tiona
l lea
rnin
g, R
&D
m
anag
emen
t etc
.
Rep
orts
on
dive
rse
impl
emen
tatio
n ex
perie
nces
of
proj
ect p
artic
ipan
ts, b
ut c
ontin
uous
impr
ovem
ent
reco
gnis
ed to
be
abou
t beh
avio
ural
cha
nge
and
invo
lves
bot
h le
arni
ng a
nd u
nlea
rnin
g (p
p. 2
6).

- 297
-
1997
, Gal
louj
&
Wei
nste
in
Dev
elop
ing
a fr
amew
ork
for
the
expl
orat
ion
of in
nova
tion
proc
esse
s in
serv
ices
sect
or.
New
ness
(rad
ical
, im
prov
emen
t, in
crem
enta
l, ad
hoc
and
reco
mbi
nativ
e in
nova
tions
).
Theo
retic
al p
aper
and
con
cept
ual f
ram
ewor
k.
Arg
ues t
hat b
oth
prod
ucts
and
serv
ices
can
be
cons
trued
in te
rms o
f the
ir ch
arac
teris
tics.
Cla
ssifi
catio
n ba
sed
on q
ualit
ativ
e or
qua
ntita
tive
varia
tion
in te
chni
cal o
r ser
vice
cha
ract
eris
tics o
f th
e in
nova
tion.
For
mal
isat
ion
inno
vatio
n ba
sed
on th
e vi
sibi
lity
and
stan
dard
isat
ion
of th
ese
char
acte
ristic
s.
Prop
ose
an in
tegr
ativ
e ap
proa
ch to
the
stud
y of
in
nova
tion
base
d on
cha
ract
eris
tics o
f the
inno
vatio
n ra
ther
than
its e
ffec
t.
1997
, Sun
dbo
Do
serv
ice
firm
s inn
ovat
e? If
ye
s, ho
w d
o th
ey o
rgan
ise
for
it?
New
ness
(rad
ical
, lar
ge in
crem
enta
l, sm
all
incr
emen
tal,
gene
ral a
cts o
f lea
rnin
g,
indi
vidu
al a
cts o
f lea
rnin
g).
Mul
tiple
(n=2
1) c
ase
stud
y. S
urve
y an
d in
terv
iew
.
3 ty
pes o
f (se
rvic
e) in
nova
tion
orga
nisa
tion
iden
tifie
d.
Inno
vatio
n co
ncep
tual
ised
as a
pro
cess
of
orga
nisa
tiona
l cha
nge
and
lear
ning
1998
, Ric
e et
al.
Iden
tific
atio
n of
mec
hani
sms
and
prac
tice
to h
elp
man
age
the
proc
ess f
or d
isco
ntin
uous
in
nova
tion.
New
ness
(dis
cont
inuo
us, i
ncre
men
tal).
In-d
epth
inte
rvie
ws w
ith k
ey m
embe
rs o
f 11
proj
ect t
eam
s. O
pera
tiona
lises
dis
cont
inuo
us
inno
vatio
n: 5
-10
times
per
form
ance
im
prov
emen
t; or
, 30-
50%
cos
t red
uctio
n; o
r, ne
w-to
-the-
wor
ld fe
atur
es.
The
proc
ess f
or d
isco
ntin
uous
inno
vatio
n is
long
, un
certa
in, s
pora
dic,
non
-line
ar, s
toch
astic
and
con
text
de
pend
ent.
To fo
ster
dis
cont
inuo
us in
nova
tion
man
agem
ent m
ust a
ttem
pt to
cur
b its
nat
ural
tend
ency
to
redu
ce u
ncer
tain
ty. B
ecau
se d
isco
ntin
uous
in
nova
tions
are
crit
ical
for t
he re
new
al o
f a fi
rm's
com
petit
ive
posi
tion
it is
impo
rtant
to u
nder
stan
d ho
w
they
diff
er fr
om in
crem
enta
l inn
ovat
ions
.
1998
, O'C
onno
r
Inve
stig
atio
n of
the
role
of
mar
ket l
earn
ing
in N
PD
proj
ects
invo
lvin
g re
ally
new
pr
oduc
ts.
New
ness
(dis
cont
inuo
us).
Cas
e st
udie
s of 8
radi
cal i
nnov
atio
ns. S
urve
y,
inte
rvie
ws a
nd se
cond
ary
sour
ces.
Proc
ess f
or d
isco
ntin
uous
inno
vatio
n di
ffer
s dr
astic
ally
fro
m th
ose
asso
ciat
ed w
ith in
crem
enta
l in
nova
tions
. Dis
cont
inui
ty d
efin
ed in
term
s of a
rtefa
ct
bein
g ne
w to
bot
h th
e fir
m a
nd th
e m
arke
tpla
ce a
nd
cons
istin
g of
unp
rece
dent
ed p
erfo
rman
ce fe
atur
es.
1998
, Osb
orne
To
dev
elop
a ty
polo
gy o
f or
gani
satio
nal c
hang
e.
New
ness
(exi
stin
g se
rvic
e or
new
serv
ice,
to
the
firm
and
to th
e cl
ient
. Lea
ding
to 4
ty
pes o
f inn
ovat
ion
- exp
ansi
onar
y, to
tal,
deve
lopm
enta
l, ev
olut
iona
ry).
Post
al su
rvey
of v
olun
tary
& n
on-p
rofit
sect
or
(n=1
96).
Ric
her c
lass
ifica
tion
has a
llow
ed th
e is
sues
of s
ervi
ce
inno
vatio
n an
d of
serv
ice
deve
lopm
ent t
o be
mor
e cl
earl
y sp
ecifi
ed, a
nd h
ence
has
invi
ted
a m
ore
clea
r ex
plor
atio
n of
thei
r man
agem
ent (
pp. 1
150)
.
1998
, Ver
yzer
Doe
s the
NPD
pro
cess
for
disc
ontin
uous
pro
duct
s diff
er
from
the
proc
ess f
or
incr
emen
tal o
r con
tinuo
us
prod
ucts
?
New
ness
and
cha
ract
eris
tics (
Rad
ical
ity o
r di
scon
tinui
ty c
oupl
ed w
ith p
rodu
ct a
nd
tech
nolo
gica
l cap
abili
ty is
the
basi
s of a
4-
elem
ent c
ateg
oris
atio
n: c
ontin
uous
, co
mm
erci
ally
dis
cont
inuo
us,
tech
nolo
gica
lly d
isco
ntin
uous
, te
chno
logi
cally
and
com
mer
cial
ly
disc
ontin
uous
).
Crit
eria
and
met
hod
for a
ssig
nmen
t of e
ach
of th
e in
nova
tions
to a
ny o
f the
cat
egor
ies v
ague
. Fie
ld
stud
ies o
f 8 d
isco
ntin
uous
pro
duct
dev
elop
men
t pr
ojec
ts in
volv
ing
the
deve
lopm
ent a
nd
appl
icat
ion
of a
new
tech
nolo
gy. M
ulti-
leve
l, re
al
time
inte
rvie
win
g.
Proc
esse
s of c
ontin
uous
and
dis
cont
inuo
us in
nova
tion
diff
er. G
roun
ded
in (t
he c
onve
ntio
ns o
f) th
e lit
erat
ure.

- 298
-
1998
, Siri
lli &
Ev
ange
lista
An
inve
stig
atio
n of
the
role
an
d na
ture
of i
nnov
atio
n ac
tiviti
es in
the
serv
ice
sect
or
unde
rpin
ned
by a
te
chno
logi
cal p
ersp
ectiv
e of
in
nova
tion.
Serv
ice
inno
vatio
ns, n
otes
4 w
ays i
n w
hich
se
rvic
es d
iffer
from
pro
duct
inno
vatio
ns:
(1) C
o-te
rmin
ality
, clo
se in
tera
ctio
n be
twee
n pr
oduc
tion
and
cons
umpt
ion,
(2)
inta
ngib
ility
, ofte
n du
e to
hig
h in
form
atio
n/kn
owle
dge
cont
ent,
(3)
impo
rtant
role
of H
uman
Res
ourc
es a
s a
key
com
petit
ive
fact
or, (
4) c
ritic
al ro
le o
f or
gani
satio
nal f
acto
rs to
firm
per
form
ance
(e
.g. l
ow c
apita
l equ
ipm
ent c
osts
, non
-co
ntin
uous
nat
ure
of p
rodu
ctio
n, ro
le o
f th
e pr
oces
s of d
eliv
ery,
lim
ited
econ
omie
s of
scal
e,).
Cla
ssifi
catio
n ba
sed
on a
sser
ted
rele
vanc
e of
the
two
type
s to
the
anal
ysis
of i
nnov
ativ
e ph
enom
ena.
Sim
ilarit
ies e
xist
bet
wee
n se
rvic
e an
d m
anuf
actu
ring
sect
ors w
ith re
spec
t to
basi
c di
men
sion
s of p
roce
ss. S
ugge
st e
cono
mic
cr
iteria
, with
inte
rnal
and
ext
erna
l foc
i, to
hel
p di
stin
guis
h be
twee
n se
rvic
e an
d pr
oces
s in
nova
tions
.
Res
pond
ents
ask
ed to
spec
ify ty
pe o
f inn
ovat
ion
intro
duce
d. A
lso
aske
d to
indi
cate
whe
ther
or n
ot th
ey
had
intro
duce
d in
nova
tions
for w
hich
the
dist
inct
ion
was
not
app
licab
le. A
num
ber r
epor
t tha
t the
di
stin
ctio
n is
inap
prop
riate
. Sur
vey
of 6
,005
Ital
ian
mar
ket s
ervi
ce c
ompa
nies
em
ploy
ing
>20
empl
oyee
s.
1999
, Rab
son
&
DeM
arco
Rel
atio
nshi
p be
twee
n ps
ycho
logi
cal t
ype
and
diff
eren
t inn
ovat
ion
syst
ems.
New
ness
(rev
olut
iona
ry, e
volu
tiona
ry)
and
type
(pro
duct
, pro
cess
). Pr
opos
e a
conc
eptu
al m
odel
. D
iffer
ent b
ehav
iour
s req
uire
d at
diff
eren
t sta
ges o
f th
e in
nova
tion
proc
ess.
Gro
unde
d in
(the
con
vent
ions
of
) the
lite
ratu
re.
1999
, Wils
on e
t al.
Dev
elop
a f
ine-
grai
ned
mea
sure
of i
nnov
atio
n ad
optio
n, te
sted
in
expl
orat
ion
of re
latio
nshi
p be
twee
n or
gani
satio
nal
clim
ate
and
adop
tion.
New
ness
(rad
ical
, inc
rem
enta
l) an
d ch
arac
teris
tic (r
elat
ive
adva
ntag
e).
70 h
ospi
tals
inte
rrog
ated
on
list o
f 68
med
ical
im
agin
g in
nova
tions
.
Fine
r-gr
aine
d m
easu
re c
an a
id fi
rms …
to m
ake
mor
e pr
uden
t and
bet
ter i
nfor
med
ado
ptio
n de
cisi
on (p
p.
320)
. Gro
unde
d in
(the
con
vent
ions
of)
the
liter
atur
e,
one
mea
sure
is o
bjec
tive
the
othe
r per
cept
ual.
Bot
h w
ith a
sign
ifica
nt h
isto
ry a
s diff
eren
tiato
rs o
f in
nova
tions
.
2000
, de
Moe
rloos
eR
elat
ions
hip
betw
een
inno
vatio
n, p
roce
ss a
nd
succ
ess.
New
ness
(tec
hnol
ogic
al n
ewne
ss,
com
mer
cial
new
ness
, fun
ctio
nal n
ewne
ss,
cust
omer
gro
up n
ewne
ss).
87 u
sabl
e re
spon
ses f
rom
surv
ey o
f Bel
gian
ch
emic
al in
dust
ry.
11 fa
ctor
s tha
t inf
luen
ce su
cces
s ide
ntifi
ed w
hich
im
pact
eac
h of
the
4 ne
wne
ss c
ateg
orie
s in
diff
eren
t w
ays.
Gro
unde
d in
man
y ea
rlie
r stu
dies
(pp.
29)
.
2001
, de
Bre
ntan
i
The
influ
ence
of
inno
vativ
enes
s on
the
fact
ors
that
impa
ct su
cces
s and
fa
ilure
in th
e de
velo
pmen
t of
busi
ness
-to-b
usin
ess s
ervi
ces
New
ness
(of t
he te
chno
logy
and
to th
e m
arke
tpla
ce).
Met
a an
alys
is o
f pre
viou
s stu
dies
. Ite
ms a
nd
mea
sure
s der
ived
from
lite
ratu
re re
view
and
pe
rson
al in
terv
iew
. Sam
ple
of 2
76 p
roje
cts f
rom
11
5 C
anad
ian
firm
s. 10
4 ite
m in
stru
men
t (1-
7 Li
kert
scal
e) m
easu
ring
4 ca
tego
ries o
f suc
cess
an
d fa
ilure
and
als
o so
me
varia
bles
mea
surin
g de
gree
of i
nnov
ativ
enes
s.
Dis
cont
inuo
us a
nd in
crem
enta
l inn
ovat
ion
cons
titut
e su
bsta
ntia
lly d
iffer
ent d
evel
opm
ent s
cena
rios (
e.g.
va
riatio
ns in
clim
ate,
syst
emat
isat
ion
of p
roce
ss, f
it w
ith st
rate
gy a
nd so
forth
). G
roun
ded
in c
once
ptua
l de
velo
pmen
t of r
esea
rche
rs a
ddre
ssin
g re
ally
new
(p
p. 1
70) v
ersu
s inc
rem
enta
lly n
ew p
rodu
cts.

- 299
-
2001
, Avl
oniti
s et a
l.
Dev
elop
an
empi
rical
ly- b
ased
ty
polo
gy o
f inn
ovat
iven
ess
for n
ew fi
nanc
ial s
ervi
ces.
To
iden
tify
whe
ther
or n
ot
diff
eren
t inn
ovat
iven
ess t
ypes
ar
e as
soci
ated
with
diff
eren
t de
velo
pmen
t and
pe
rfor
man
ce sc
enar
ios.
New
ness
(ope
ratin
g/de
liver
y pr
oces
s ne
wne
ss, s
ervi
ce m
odifi
catio
n, se
rvic
e ne
wne
ss to
the
mar
ket,
serv
ice
new
ness
to
the
com
pany
).
Taxo
nom
ic. 1
7 ite
m q
uest
ionn
aire
, 5 p
oint
Lik
ert
scal
e. C
lust
er a
naly
sis (
War
d’s m
etho
d), 6
-clu
ster
so
lutio
n pr
efer
red.
80
busi
ness
es re
pres
entin
g 80
su
cces
sful
and
52
faile
d fin
anci
al se
rvic
es.
Inno
vativ
enes
s – c
once
ptua
lised
in te
rms o
f ne
wne
ss m
easu
red
acro
ss 4
dim
ensi
ons b
y 17
ite
ms.
Bas
ed o
n pa
st re
sear
ch a
nd a
pilo
t stu
dy.
Iden
tify
6 ty
pes o
f ser
vice
inno
vativ
enes
s ran
ging
fr
om n
ew-to
-the-
mar
ket s
ervi
ces t
o se
rvic
e re
posi
tioni
ngs.
Diff
eren
t typ
es a
ssoc
iate
d w
ith
diff
eren
t dev
elop
men
t pat
tern
s and
leve
ls o
f pe
rfor
man
ce.
2001
, Dan
neel
s &
Kle
insc
hmid
t
Cla
rifyi
ng th
e m
eani
ng o
f pr
oduc
t inn
ovat
iven
ess w
ith
rega
rd to
stop
/go
deci
sion
s an
d fir
m p
erfo
rman
ce.
5 di
men
sion
s of p
rodu
ct in
nova
tiven
ess:
(1
) mar
ket f
amili
arity
, (2)
tech
nolo
gica
l fa
mili
arity
, (3)
mar
ketin
g fit
, (4)
te
chno
logi
cal f
it, (5
) new
mar
ketin
g ac
tiviti
es. D
istin
guis
hes b
etw
een
firm
pe
rcep
tions
of i
nnov
ativ
enes
s (ba
sed
on
fam
iliar
ity a
nd fi
t of t
echn
olog
ical
and
m
arke
ting
aspe
cts)
and
cus
tom
er
perc
eptio
ns (b
ased
on
inno
vatio
n at
tribu
tes,
adop
tion
risks
and
leve
ls o
f be
havi
our c
hang
e im
plie
d).
Nee
d fo
r a c
onsi
sten
t, ex
plic
it an
d pr
ecis
e de
finiti
on o
f pro
duct
inno
vativ
enes
s. D
iffer
ent
dim
ensi
ons o
f pro
duct
inno
vativ
enes
s hav
e di
ffer
ent r
elat
ions
with
pro
duct
per
form
ance
. Fit
with
exi
stin
g m
arke
ting
and
tech
nolo
gica
l co
mpe
tenc
ies m
ore
impo
rtant
to fi
nanc
ial
perf
orm
ance
than
mar
ket o
r tec
hnol
ogic
al
fam
iliar
ity.
His
toric
al sa
mpl
e of
262
pro
ject
s kno
wn
as N
ewPr
od
II. F
ive
dim
ensi
ons o
f inn
ovat
iven
ess m
easu
red
on a
19
item
inst
rum
ent.
2001
, Car
dina
l
Exam
inat
ion
of th
e im
pact
of
orga
nisa
tion-
wid
e co
ntro
ls o
n in
nova
tiven
ess a
t the
firm
le
vel.
New
ness
(rad
ical
, inc
rem
enta
l).
Ret
rosp
ectiv
e st
udy
in U
S ph
arm
aceu
tical
in
dust
ry o
f 57
SBU
s usi
ng a
rchi
ves a
nd
ques
tionn
aire
to g
athe
r dat
a.
Proc
esse
s for
radi
cal a
nd in
crem
enta
l inn
ovat
ion
note
d to
be
sim
ilar.
Inpu
t and
out
put c
ontro
ls
impo
rtant
for i
ncre
men
tal i
nnov
atio
n. In
put,
beha
viou
r and
out
put c
ontro
ls im
porta
nt fo
r rad
ical
in
nova
tion.
Gro
unde
d in
lite
ratu
re o
n pr
ojec
t tea
m
rese
arch
and
inno
vatio
n ad
optio
n re
sear
ch.
2001
, Lyn
n &
A
kgün
Expl
orat
ion
of th
e im
pact
of
proj
ect v
isio
ning
on
succ
essf
ul n
ew p
rodu
ct
deve
lopm
ent.
New
ness
(Rad
ical
, evo
lutio
nary
mar
ket
inno
vatio
n, e
volu
tiona
ry te
chni
cal
inno
vatio
n, in
crem
enta
l).
2 ph
ase
empi
rical
stud
y. P
hase
1 e
xplo
rato
ry,
inte
rvie
ws a
nd d
ocum
enta
ry tr
iang
ulat
ion.
Pha
se
2 va
lidat
ion
surv
ey: s
cale
item
s dev
elop
ed fo
r qu
estio
nnai
re. U
sabl
e n=
509.
Vis
ion
clar
ity a
ssoc
iate
d w
ith N
P su
cces
s for
radi
cal
inno
vatio
ns, b
ut n
ot v
isio
n su
ppor
t or s
tabi
lity.
St
abili
ty &
supp
ort a
ssoc
iate
d w
ith su
cces
s of
incr
emen
tal i
nnov
atio
n. F
or e
volu
tiona
ry in
nova
tion
clar
ity is
pos
itive
ly a
ssoc
iate
d w
ith N
PS. G
roun
ded
in
the
'fam
iliar
ity' l
itera
ture
, but
con
ceiv
es o
f new
ness
in
term
s of u
ncer
tain
ty.
2001
, Fer
nánd
ez
Expl
orat
ory
rese
arch
of
inno
vatio
n de
velo
pmen
t pa
ttern
s.
New
ness
(rad
ical
, rou
tine)
and
type
(te
chni
cal,
adm
inis
trativ
e).
Empi
rical
. Inn
ovat
ions
cla
ssifi
ed b
y pa
nel o
f 3
expe
rts. 1
5 in
nova
tions
in a
hos
pita
l A&
E de
partm
ent m
onito
red
in si
tu.
Diff
eren
t inn
ovat
ions
hav
e di
ffer
ent d
evel
opm
ent
prof
iles.
Con
firm
s vie
w o
f rel
atio
nshi
p be
twee
n in
crem
enta
l/lin
ear a
nd ra
dica
l/dis
orde
rly p
roce
sses
.

- 300
-
2002
, Gar
cia
&
Cal
anto
ne
To c
larif
y co
nfus
ion
surr
ound
ing
mul
tiple
de
finiti
ons o
f inn
ovat
iven
ess
and
inno
vatio
n an
d de
velo
p a
met
hod
for c
lass
ifyin
g in
nova
tion.
New
ness
(rad
ical
, rea
lly n
ew, r
eally
new
, re
ally
new
, rea
lly n
ew, i
ncre
men
tal,
incr
emen
tal,
incr
emen
tal).
Theo
ry. P
ropo
ses i
nnov
atio
ns to
be
eval
uate
d on
a
set o
f com
mon
dim
ensi
ons.
Wid
e-ra
ngin
g lit
erat
ure
revi
ew id
entif
ying
con
cept
ualis
atio
ns o
f de
gree
s of n
ewne
ss d
escr
ibed
on
cont
inua
ra
ngin
g fr
om d
icho
tom
ous t
o th
ose
with
eig
ht
cate
gorie
s.
Slow
pro
gres
s in
theo
ry d
evel
opm
ent a
scrib
ed to
in
cons
iste
ncie
s of l
abel
ling
inno
vatio
ns. P
rovi
des a
fr
amew
ork
and
oper
atio
nalis
atio
n ba
sed
on d
egre
e of
ne
wne
ss. P
ropo
se a
typo
logy
bas
ed o
n ex
tant
lit
erat
ure
that
resu
lts in
a ty
polo
gy o
f 8 in
nova
tion
type
s by
degr
ee o
f new
ness
. Eac
h ty
pe is
ela
bora
ted
by th
e pr
esen
ce o
r abs
ence
of m
acro
and
mic
ro le
vel
mar
ketin
g an
d te
chno
logy
dis
cont
inui
ty. H
ence
4
type
s of '
real
ly n
ew' a
nd 3
type
s of '
incr
emen
tal'
inno
vatio
ns.

- 301
-
APP
EN
DIX
TW
O: I
NN
OV
AT
ION
AR
EA
OF
FOC
US
St
udy
Focu
s C
lass
ifica
tion
syst
em
Nat
ure
of st
udy
Obs
erva
tions
Daf
t, 19
78
Stud
y of
pro
cess
es le
adin
g to
in
nova
tion
adop
tion.
Typ
e is
a
sign
ifica
nt d
eter
min
ant o
f pr
oces
s.
Type
(adm
inis
trativ
e an
d te
chni
cal).
Dua
l cor
e m
odel
- in
itiat
ion
of a
dmin
istra
tive
inno
vatio
ns is
fa
cilit
ated
by
mec
hani
stic
rath
er th
an o
rgan
ic
orga
nisa
tions
. Def
initi
ons s
ourc
ed fr
om th
e lit
erat
ure.
Uni
t of a
naly
sis =
scho
ol d
istri
ct. 6
8 in
nova
tions
in
13
dist
ricts
.
Not
ion
of se
para
te o
rgan
isat
iona
l cor
es e
qual
ly
capa
ble
of in
itiat
ing
and
impl
emen
ting
inno
vatio
ns c
halle
nges
Zal
tman
et a
l. (1
973,
ab
ove)
. Ind
epen
dent
var
iabl
e. T
he p
roce
ss o
f in
nova
tion
appe
ars t
o be
con
tinge
nt u
pon
both
th
e ty
pe o
f inn
ovat
ion
(tech
/adm
in) a
nd, t
he
prof
essi
onal
leve
l of e
mpl
oyee
s.
1981
, Kim
berly
&
Eva
nisk
o
To e
xam
ine
the
com
bine
d ef
fect
of i
ndiv
idua
l, or
gani
satio
nal a
nd c
onte
xtua
l va
riabl
es o
n or
gani
satio
nal
adop
tion
of in
nova
tions
.
Type
(tec
hnol
ogic
al a
nd a
dmin
istra
tive)
. Te
chno
logi
cal a
nd a
dmin
istra
tive
inno
vatio
ns.
Def
ined
in re
latio
n to
an
(uns
peci
fied)
'ext
erna
l st
anda
rd'.
Ado
pts a
n ite
m-o
rient
ed p
ersp
ectiv
e in
pr
efer
ence
to p
erce
ptio
ns o
f uni
t of a
dopt
ion,
su
gges
ting,
impl
icitl
y, th
at in
nova
tions
hav
e im
mut
able
cha
ract
eris
tics t
hat r
emai
n co
nsta
nt
acro
ss o
rgan
isat
ions
.
Inno
vatio
ns in
US
heal
th se
ctor
from
exi
stin
g da
ta se
t (de
tails
not
spec
ified
). D
ata
colle
cted
fr
om h
ospi
tal a
dmin
istra
tor a
nd c
hief
of m
edic
ine
in e
ach
hosp
ital.
15 e
xper
ts id
entif
ied
300
inno
vatio
ns fr
om w
hich
12
(tech
nolo
gica
l) w
ere
chos
en a
s foc
us fo
r thi
s res
earc
h. C
onte
xt w
as
resp
irato
ry d
isea
se. A
furth
er 8
adm
inis
trativ
e in
nova
tions
iden
tifie
d ba
sed
on e
lect
roni
c da
ta
proc
essi
ng.
It is
not
obv
ious
that
diff
eren
t typ
es o
f inn
ovat
ion
have
the
sam
e or
gani
zatio
nal s
alie
nce
or e
ngag
e in
iden
tical
org
aniz
atio
nal p
roce
ss in
the
cour
se
of th
eir a
dopt
ion
(pp.
709
). Su
ppor
tive
of D
aft's
(1
976)
dua
l-cor
e m
odel
.
1988
, D
aman
pour
Synt
hesi
s of e
mpi
rical
wor
k on
ado
ptio
n in
ord
er to
mak
e ag
greg
ated
stat
emen
ts a
bout
ad
optio
n be
havi
our
Tech
nica
l and
adm
inis
trativ
e (ty
pe),
radi
cal a
nd
incr
emen
tal (
new
ness
).
Met
a-an
alys
is o
f pre
viou
s stu
dies
. Agg
rega
tes
prev
ious
rese
arch
on
3 di
men
sion
s of
orga
nisa
tiona
l inn
ovat
ion
that
are
felt
to b
est
expl
ain
adop
tion:
type
of i
nnov
atio
n; in
nova
tion
radi
caln
ess;
stag
e of
the
adop
tion
proc
ess.
Ado
ptio
n is
con
tinge
nt u
pon
com
pany
type
.
1990
, H
ende
rson
&
Cla
rk
Trad
ition
al c
ateg
oris
atio
n ba
sed
on ra
dica
l/inc
rem
enta
l ar
gued
to b
e in
com
plet
e or
m
isle
adin
g. D
evel
op a
n ex
pand
ed c
once
ptua
l fr
amew
ork
of in
nova
tion
type
.
Type
(pro
duct
, arc
hite
ctur
al, m
odul
ar) a
nd n
ewne
ss
(rad
ical
, inc
rem
enta
l). R
/I di
chot
omis
atio
n in
suff
icie
nt b
ecau
se a
ppar
ently
mod
est
(incr
emen
tal)
inno
vatio
ns a
re re
porte
d to
hav
e ha
d dr
amat
ic (r
adic
al) c
onse
quen
ces.
Prod
uct c
once
ived
of
as a
syst
em c
ompr
isin
g co
mpo
nent
s, ch
ange
can
ha
ppen
to th
e sy
stem
or t
o in
divi
dual
com
pone
nts.
Cas
e st
udy
of se
mic
ondu
ctor
pho
tolit
hogr
aphi
c al
ignm
ent e
quip
men
t to
test
val
idity
of
fram
ewor
k th
at su
gges
ts im
porta
nt im
plic
atio
ns
of c
once
pt o
f arc
hite
ctur
al in
nova
tion.
2-y
ear
field
stud
y in
pho
tolit
hogr
aphi
c al
ignm
ent
equi
pmen
t ind
ustry
.
Link
s arc
hite
ctur
al in
nova
tion
to o
rgan
isat
iona
l le
arni
ng. I
nnov
atio
ns h
ave
the
pote
ntia
l to
enha
nce
or d
estro
y co
mpe
tenc
e w
ithin
a fi
rm -
arch
itect
ural
inno
vatio
n ha
s the
cap
acity
to d
o bo
th. L
earn
ing
abou
t cha
nges
in a
rchi
tect
ure
(new
inte
ract
ions
acr
oss c
ompo
nent
s [or
bo
unda
ries]
) may
requ
ire e
xplic
it at
tent
ion,
new
sk
ills e
tc...

- 302
-
1990
, D
aman
pour
Stud
y of
the
cons
eque
nces
of
adop
tion
of in
nova
tion
for
orga
nisa
tions
.
Type
(tec
hnol
ogic
al, a
dmin
istra
tive,
anc
illar
y).
Ass
umpt
ion
appe
ars t
o be
that
the
rang
e of
type
s pr
ovid
es b
road
cov
erag
e of
var
ious
type
s of
inno
vatio
n. B
ased
on
prev
ious
def
initi
ons o
f in
nova
tion
type
. Cat
egor
isat
ion
met
hod
unde
fined
.
85
usab
le q
uest
ionn
aire
s ret
urne
d fr
om d
irect
ors
of li
brar
ies (
US)
. Lis
t of l
ibra
ry in
nova
tions
de
velo
ped
from
a li
tera
ture
sear
ch.
Tech
nolo
gica
l inn
ovat
ions
are
mor
e ef
fect
ive
than
adm
inis
trativ
e or
anc
illar
y in
nova
tions
. Si
mila
rly, r
ate
of a
dopt
ion
is h
ighe
r. H
owev
er,
adm
inis
trativ
e in
nova
tions
foun
d to
be
a hi
gher
co
rrel
ate
of o
rgan
isat
iona
l per
form
ance
than
te
chno
logi
cal o
r anc
illar
y.
1993
, Coo
per &
K
lein
schm
idt
Wha
t mak
es n
ew p
rodu
cts
win
ners
?
7 ne
w p
rodu
ct ty
pes t
hat e
xist
on
a co
ntin
uum
po
laris
ed b
y "t
rue
inno
vatio
ns" a
nd "f
airly
min
or
mod
ifica
tions
": 1
) tru
e in
nova
tions
, 2) t
otal
ly n
ew
to th
e w
orld
pro
duct
s, 3)
tota
lly n
ew to
the
com
pany
pro
duct
s (ne
w fe
atur
es v
s co
mpe
titio
n/ex
istin
g m
arke
t), 4
) new
pro
duct
line
s to
the
com
pany
, 5) n
ew it
ems t
o an
exi
stin
g pr
oduc
t lin
e fo
r the
com
pany
, 6) s
igni
fican
t mod
ifica
tions
of
exi
stin
g co
mpa
ny p
rodu
cts,
7) fa
irly
min
or
mod
ifica
tions
of e
xist
ing
com
pany
pro
duct
s.
Empi
rical
stud
y of
103
pro
ject
s in
Nor
th A
mer
ica
and
Euro
pe.
Typo
logy
has
its o
rigin
s in
the
Boo
z et
al s
ix
cate
gory
typo
logy
. Pro
duct
diff
eren
tiatio
n an
im
porta
nt fa
ctor
in su
cces
s, as
pect
s of t
he
exte
rnal
env
ironm
ent (
mar
ket a
ttrac
tiven
ess a
nd
com
petit
ive
situ
atio
n) le
ss so
.
1994
, Mon
toya
-W
eiss
&
Cal
anto
ne
Met
a-an
alys
is o
f de
term
inan
ts o
f new
pro
duct
pe
rfor
man
ce.
Type
(Hig
h, m
oder
ate,
low
inno
vatio
n).
Rev
iew
of 4
7 st
udie
s (cr
iteria
spec
ified
), th
e qu
antit
ativ
e cu
mul
atio
n an
d an
alys
is o
f sta
tistic
s ac
ross
stud
ies (
pp. 4
04).
Not
e th
at o
nly
15%
of
stud
ies p
rovi
ded
info
rmat
ion
on ty
pe o
f in
nova
tion.
Type
of i
nnov
atio
n m
ay b
e an
impo
rtant
m
oder
ator
var
iabl
e on
the
rela
tions
hip
betw
een
dete
rmin
ants
of p
erfo
rman
ce (s
trate
gic
fact
ors,
deve
lopm
ent p
roce
ss fa
ctor
s, m
arke
t env
ironm
ent
fact
ors,
orga
nisa
tiona
l fac
tors
).
1995
, She
nhar
et
al.
Con
cept
ual d
evel
opm
ent o
f cl
assi
ficat
ion
to o
verc
ome
sim
plis
tic m
odel
s.
2 di
men
sion
al ta
xono
my:
initi
al le
vel o
f te
chno
logi
cal u
ncer
tain
ty a
nd sy
stem
scop
e (p
rodu
ct le
vel o
n a
hier
arch
ical
ladd
er o
f sys
tem
s an
d su
bsys
tem
s).
Expl
orat
ory
stud
y, m
ixed
met
hod:
mul
tiple
cas
e st
udy
(n=2
6) a
nd q
uest
ionn
aire
(n=1
27).
Typo
logy
exh
ibits
the
exis
tenc
e of
subs
tant
ial
diff
eren
ces a
mon
g pr
oduc
t cha
ract
eris
tics o
f va
rious
kin
ds a
nd p
rovi
des a
bas
is fo
r add
ition
al
theo
retic
al d
evel
opm
ent o
f pro
duct
inno
vatio
ns.
1996
, Tee
ce
Expl
ores
the
prop
ertie
s of
diff
eren
t typ
es o
f firm
s with
re
spec
t to
the
gene
ratio
n of
ne
w te
chno
logy
.
Aut
onom
ous,
syst
emic
.
Rev
iew
s alte
rnat
ive
orga
nisa
tiona
l for
ms s
uite
d to
inno
vatio
n ha
ving
iden
tifie
d ch
arac
teris
tics o
f te
chno
logi
cal d
evel
opm
ent,
the
fact
ors a
ffec
ting
firm
-leve
l inn
ovat
ion,
and
firm
arc
hety
pes.
The
form
al a
nd in
form
al st
ruct
ures
of f
irms a
nd
thei
r ext
erna
l lin
kage
s hav
e an
impo
rtant
bea
ring
on th
e ra
te a
nd d
irect
ion
of in
nova
tion.
Var
ious
ar
chet
ypes
are
reco
gnis
ed a
nd a
n ef
fort
is m
ade
to m
atch
org
anis
atio
n st
ruct
ure
to th
e ty
pe o
f in
nova
tion.
The
fram
ewor
k br
oade
ns th
e fr
amew
ork
econ
omis
ts u
se to
iden
tify
envi
ronm
ents
that
ass
ist i
nnov
atio
n.

- 303
-
1996
, Su
bram
ania
n &
N
ilaka
nta
Use
a m
ultid
imen
sion
al
conc
eptu
alis
atio
n of
in
nova
tiven
ess i
n a
stud
y of
de
term
inan
ts, t
ypes
and
pe
rfor
man
ce to
cla
rify
conf
lictin
g re
sults
of p
revi
ous
stud
ies.
Type
(tec
hnic
al, a
dmin
istra
tive)
. Fol
low
s Daf
t's
(197
8) 'd
ual-c
ore'
dich
otom
isat
ion
betw
een
tech
nica
l and
adm
inis
trativ
e in
nova
tions
. C
once
ptua
lisat
ion
base
d on
qua
ntity
of i
nnov
atio
ns,
time
of a
dopt
ion
and
cons
iste
ncy
of a
dopt
ion
patte
rn.
List
of 8
tech
nica
l and
14
adm
inis
trativ
e in
nova
tions
com
pile
d w
ith a
id o
f dom
ain
rele
vant
ex
perts
. The
se fo
rmed
bas
is o
f que
stio
nnai
re-
base
d su
rvey
of b
ank
inno
vatio
ns v
ia si
ngle
co
mpe
tent
witn
ess,
143
retu
rned
.
Org
anis
atio
nal i
nnov
ativ
enes
s pos
itive
ly im
pact
s or
gani
satio
nal p
erfo
rman
ce w
hich
in tu
rn is
m
oder
ated
by
inno
vatio
n ty
pe. S
uch
obse
rvat
ions
de
pend
ent o
n m
ultid
imen
sion
al c
once
ptua
lisat
ion
of in
nova
tion.
1996
, C
hesb
orou
gh &
Te
ece
How
to o
rgan
ise
for
inno
vatio
n - d
ecen
tralis
ed v
s in
tegr
ativ
e st
rate
gies
.
Type
(aut
onom
ous,
syst
emic
). A
sser
ts th
at th
e di
stin
ctio
n be
twee
n au
tono
mou
s or s
yste
mic
in
nova
tion
is fu
ndam
enta
l to
the
choi
ce o
f or
gani
satio
nal d
esig
n.
Nar
rativ
e ca
se st
udie
s. Ty
pe o
f inn
ovat
ion
dict
ates
org
anis
atio
nal d
esig
n.
1998
, Siri
lli &
Ev
ange
lista
An
inve
stig
atio
n of
the
role
an
d na
ture
of i
nnov
atio
n ac
tiviti
es in
the
serv
ice
sect
or
unde
rpin
ned
by a
te
chno
logi
cal p
ersp
ectiv
e of
in
nova
tion.
Type
(ser
vice
[aka
pro
duct
], pr
oces
s).
Cla
ssifi
catio
n ba
sed
on a
sser
ted
rele
vanc
e of
the
two
type
s to
the
anal
ysis
of i
nnov
ativ
e ph
enom
ena.
Res
pond
ents
ask
ed to
spec
ify ty
pe o
f inn
ovat
ion
intro
duce
d. A
lso
aske
d to
indi
cate
whe
ther
or n
ot
they
had
intro
duce
d in
nova
tions
for w
hich
the
dist
inct
ion
was
not
app
licab
le. A
num
ber r
epor
t th
at th
e di
stin
ctio
n is
inap
prop
riate
. Sur
vey
of
6,00
5 Ita
lian
mar
ket s
ervi
ce c
ompa
nies
em
ploy
ing
>20
empl
oyee
s.
Sim
ilarit
ies e
xist
bet
wee
n se
rvic
e an
d m
anuf
actu
ring
sect
ors w
ith re
spec
t to
basi
c di
men
sion
s of p
roce
ss. S
ugge
st e
cono
mic
cr
iteria
, with
inte
rnal
and
ext
erna
l foc
i, to
hel
p di
stin
guis
h be
twee
n se
rvic
e an
d pr
oces
s in
nova
tions
.
2001
, D
aman
pour
&
Gop
alak
rishn
an
Stud
y of
dyn
amic
s of
adop
tion
of p
rodu
ct a
nd
proc
ess i
nnov
atio
ns.
Type
(pro
duct
, pro
cess
). G
roun
ded
in th
e lit
erat
ure.
D
istin
ctio
n is
impo
rtant
bec
ause
ado
ptio
n of
eith
er
requ
ires d
iffer
ent s
kills
.
Empi
rical
, bas
ed o
n pr
evio
us d
efin
ition
s of
inno
vatio
n ty
pe p
anel
of e
xper
ts a
lloca
ted
diff
eren
t inn
ovat
ions
to a
prio
ri ca
tego
ries.
Seco
ndar
y so
urce
s & q
uest
ionn
aire
for 1
01 U
S ba
nks.
Ado
ptio
n of
pro
duct
inno
vatio
ns is
em
phas
ised
, by
com
pani
es in
bot
h se
rvic
e an
d m
anuf
actu
ring
sect
ors,
over
that
of p
roce
ss in
nova
tions
.

- 304
-

- 305
-
APP
EN
DIX
TH
RE
E: I
NN
OV
AT
ION
AT
TR
IBU
TE
S
Stud
y Fo
cus
Cla
ssifi
catio
n sy
stem
N
atur
e of
stud
y O
bser
vatio
ns
Moh
r 196
9 To
iden
tify
the
dete
rmin
ants
of
inno
vatio
n in
pub
lic a
genc
ies.
Attr
ibut
e: S
lack
, an
inno
vatio
n ad
opte
d in
the
ques
t of p
rest
ige
rath
er th
an
orga
nisa
tiona
l pro
fit o
r eff
ectiv
enes
s.
94 h
ealth
dep
artm
ents
in 5
US
and
Can
adia
n St
ates
. A
poss
ible
exp
lana
tion
of p
rope
nsity
to a
dopt
larg
e nu
mbe
rs o
f inn
ovat
ive
prog
ram
mes
.
Org
anis
atio
nal s
ize
foun
d to
be
a si
gnifi
cant
pr
edic
tor o
f ado
ptio
n, b
ut o
nly
in a
s far
as i
t im
plie
s th
e pr
esen
ce o
f mot
ivat
ion,
obs
tacl
es a
nd re
sour
ces.
1973
, Zal
tman
et
al.
To in
tegr
ate
findi
ngs o
n in
nova
tion
rese
arch
from
di
ffer
ent p
ersp
ectiv
es o
n di
ffer
ent
type
s of o
rgan
isat
ion.
Attr
ibut
es (R
ever
sibi
lity,
Com
patib
ility
, C
ompl
exity
, Cos
t, N
ewne
ss, D
ivis
ibili
ty,
Dis
rupt
ive,
Vis
ibili
ty, I
mpa
ct, S
cope
, R
adic
al, R
elat
ive
Adv
anta
ge, S
cien
tific
St
atus
, Eff
icie
ncy,
Ris
k an
d un
certa
inty
, C
omm
unic
abili
ty, T
erm
inal
ity, S
tatu
s qu
o an
te, C
omm
itmen
t, In
terp
erso
nal
rela
tions
hips
, Pub
licne
ss v
s priv
aten
ess,
Gat
ekee
pers
, Sus
cept
ibili
ty to
succ
essi
ve
mod
ifica
tion)
.
Ove
rvie
w o
f inn
ovat
ion
in o
rgan
isat
ions
: nat
ure
of
inno
vatio
n, p
roce
sses
of i
nnov
atio
n, o
rgan
isat
iona
l ch
arac
teris
tics a
nd in
nova
tion,
and
theo
retic
al re
view
. In
tegr
atio
n of
pre
viou
s wor
ks, p
artic
ular
ly M
arch
&
Sim
on (1
958)
, Bur
ns &
Sta
lker
(196
1), H
arve
y &
M
ills (
1970
), W
ilson
(196
6), H
age
& A
iken
(196
7).
Attr
ibut
es o
f inn
ovat
ion
influ
ence
ado
ptio
n an
d re
ject
ion
deci
sion
s. O
rgan
ic st
ruct
ures
wou
ld b
ette
r fa
cilit
ate
initi
atio
n an
d m
echa
nist
ic o
rgan
isat
iona
l st
ruct
ures
impl
emen
tatio
n.
1974
, War
ner
Dis
cipl
inar
y pa
roch
ialis
m h
as le
d to
impr
ecis
ion
in u
se o
f lan
guag
e,
inco
mpa
tibili
ty o
f met
hodo
logi
es,
and
conf
lictin
g re
sults
in
inno
vatio
n re
sear
ch. A
ims t
o pr
ovok
e de
bate
abo
ut m
ore
inte
grat
ive
appr
oach
es.
Attr
ibut
es (h
ard,
soft,
use
, pro
fitab
ility
).
Theo
retic
al, d
raw
ing
toge
ther
stra
nds o
f rat
iona
l ec
onom
ics a
nd so
ciol
ogic
al p
ersp
ectiv
es o
n in
nova
tion.
Inno
vatio
ns h
ave
phys
ical
and
non
-ph
ysic
al p
rope
rties
.
Nee
d fo
r exp
lora
tion
of th
e 'an
alyt
ical
ly re
leva
nt
dim
ensi
ons o
f inn
ovat
ion'
. Tec
hnol
ogic
al
pers
pect
ive
on in
nova
tions
, whi
ch c
an b
e ha
rd
(phy
sica
l obj
ects
) or s
oft (
orga
nisa
tiona
l cha
nges
), bu
t the
se d
o no
t suf
fice
to d
efin
e or
bou
nd th
e in
nova
tion.
Mul
tidim
ensi
onal
ity o
f the
inno
vatio
n,
base
d on
its u
se (a
pplic
atio
n) o
r pro
fitab
ility
(val
ue,
wor
th o
r ben
efit)
pro
vide
mor
e se
nsiti
ve a
naly
sis.
1976
, Dow
ns &
M
ohr
Aut
hors
attr
ibut
e in
stab
ility
(v
aria
nce
in fi
ndin
gs) i
n in
nova
tion
rese
arch
(par
tly) t
o in
cons
iste
nt tr
eatm
ent o
f in
nova
tion
char
acte
ristic
s and
va
ryin
g op
erat
iona
lisat
ions
of
inno
vatio
n. P
ropo
se m
ove
tow
ard
deve
lopi
ng in
tegr
ativ
e th
eory
.
Attr
ibut
es (p
rimar
y an
d se
cond
ary
attri
bute
s). P
rimar
y at
tribu
tes a
re c
onst
ant
acro
ss c
ases
, sec
onda
ry a
ttrib
utes
var
y ac
cord
ing
to lo
cal p
erce
ptio
ns. T
hey
emph
asis
the
impo
rtanc
e of
con
stan
cy
acro
ss st
udie
s rat
her t
han
whe
ther
or n
ot
prim
ary
or se
cond
ary
attri
bute
s exi
st a
s na
tura
l or r
eal t
ypes
.
Theo
ry. P
ropo
sed
as a
bas
is fo
r mul
tiple
inno
vatio
n re
sear
ch, b
ut c
once
ived
onl
y in
term
s of s
tudy
of
sing
le a
ttrib
utes
. No
holis
tic a
ppro
ach.
Set o
f 7 p
resc
riptio
ns fo
r inn
ovat
ion
rese
arch
. A
ckno
wle
dge
inno
vatio
ns v
ary
acco
rdin
g to
di
ffer
ent a
ttrib
utes
and
that
diff
eren
t the
orie
s (a
bout
, say
, ado
ptio
n et
c) w
ill p
erta
in to
eac
h di
ffer
ent i
nnov
atio
n.

- 306
-
1982
, To
rnat
zky
&
Kle
in
Met
hodo
logi
cal p
rofil
ing
of
Attr
ibut
es' s
tudi
es. E
xplo
ratio
n of
th
e re
latio
nshi
p be
twee
n A
ttrib
utes
of i
nnov
atio
ns a
nd
adop
tion.
Attr
ibut
es (f
ocus
ed o
n co
mpa
tibili
ty,
rela
tive
adva
ntag
e, c
ompl
exity
, cos
t, co
mm
unic
abili
ty, d
ivis
ibili
ty,
prof
itabi
lity,
soci
al a
ppro
val,
trial
abili
ty,
obse
rvab
ility
- th
e m
ost f
requ
ently
oc
curr
ing
in th
e re
view
).
Met
a-an
alys
is o
f pre
viou
s Attr
ibut
es' s
tudi
es. 3
0 A
ttrib
utes
in to
tal u
ncov
ered
, whi
ch b
egs q
uest
ions
ab
out t
he in
depe
nden
ce o
f the
dim
ensi
ons.
75 a
rticl
es
revi
ewed
. 46.
7% o
f sam
ple
stud
ied
one
Attr
ibut
e on
ly, 8
2% st
udie
d 5
Attr
ibut
es o
r few
er.
Dev
elop
7 c
riter
ia fo
r the
hyp
othe
tical
ly 'i
deal
' in
nova
tion
Attr
ibut
es st
udy,
incl
udin
g: n
eed
for
cons
tanc
y in
app
roac
h to
Attr
ibut
es' s
tudi
es;
mea
sure
men
t of i
nnov
atio
n fr
om a
per
cept
ions
pe
rspe
ctiv
e.
1983
, Rog
ers
Attr
ibut
es o
f inn
ovat
ions
and
the
rate
of i
nnov
atio
n ad
optio
n.
Attr
ibut
es (t
riala
bilit
y, re
lativ
e ad
vant
age,
co
mpa
tibili
ty, c
ompl
exity
, and
ob
serv
abili
ty).
To id
entif
y th
ose
attri
bute
s tha
t inf
luen
ce th
e ra
te o
f in
nova
tion
adop
tion.
Indi
vidu
al’s
per
cept
ions
of t
he c
hara
cter
istic
s of
inno
vatio
n no
t the
cha
ract
eris
tics o
f the
inno
vatio
n af
fect
ado
ptio
n. P
ropo
sed
5 at
tribu
tes o
f inn
ovat
ion
as th
ose
that
exp
lain
ed in
nova
tion
adop
tion.
D
eriv
ed fr
om 1
2 pr
evio
us e
mpi
rical
stud
ies t
hat
stud
ied
betw
een
1 an
d 50
inno
vatio
ns a
nd m
easu
red
betw
een
2 an
d 16
diff
eren
t attr
ibut
es.
Pelz
, 198
5
The
rela
tions
hip
betw
een
prop
ertie
s of a
n in
nova
tion
and
time
sequ
ence
(sta
ges)
of
deve
lopm
ent.
Attr
ibut
es (o
rigin
ality
- id
ea o
rigin
s of
the
inno
vatio
n; c
ompl
exity
- co
mpr
isin
g te
chni
cal c
ompl
exity
and
org
anis
atio
nal
com
plex
ity).
3 re
sear
ch st
aff a
ssig
ned
inno
vatio
ns to
one
of
trich
otom
ous c
ateg
orie
s for
com
plex
ity a
nd
orig
inal
ity. 3
tech
nica
lly-b
ased
inno
vatio
ns
inve
stig
ated
in 1
8 lo
catio
ns v
ia u
nstru
ctur
ed
tele
phon
e in
terv
iew
s.
Tech
nica
lly si
mpl
e in
nova
tions
are
ado
pted
with
a
mor
e di
scre
te su
cces
sion
of s
tage
s tha
n ar
e co
mpl
ex
inno
vatio
ns.S
elec
tion
of o
rigin
ality
and
com
plex
ity
not j
ustif
ied
in te
rms o
f oth
er a
ttrib
utes
but
bec
ause
th
e se
quen
ce o
f inn
ovat
ing
stag
es in
this
stud
y ap
pear
ed c
ontin
gent
on
cert
ain
prop
ertie
s of t
he
inno
vatio
n its
elf (
pp. 2
62),
that
is, o
rigin
ality
and
co
mpl
exity
.
1988
, Mey
er &
G
oes
An
exam
inat
ion
of a
ssim
ilatio
n of
inno
vatio
ns in
to o
rgan
isat
ions
.A
ttrib
utes
(com
plex
ity, r
isk
and
skill
, ob
serv
abili
ty, c
ompa
tibili
ty).
12 m
edic
al in
nova
tions
in 2
5 ho
spita
ls, 2
06
info
rman
ts. I
nnov
atio
n va
riabl
es a
sses
sed
by e
xper
t-pa
nel j
udge
men
t.
Adv
ance
a m
odel
of a
ssim
ilatio
n an
tece
dent
s co
ntai
ning
3 c
lass
es in
clud
ing
inno
vatio
n at
tribu
tes.
Ass
imila
tion
is h
ighl
y de
pend
ent o
n an
inno
vatio
n's
attri
bute
s. In
nova
tions
rare
ly h
ave
inhe
rent
at
tribu
tes t
hat c
an b
e as
certa
ined
une
quiv
ocal
ly
with
out r
efer
ence
to it
s con
text
.
1990
, Wes
t A
theo
ry o
f gro
up in
nova
tion.
A
ttrib
utes
(qua
ntity
and
qua
lity
of
inno
vatio
ns).
Theo
retic
al. P
ostu
late
'vis
ion'
and
'clim
ate
for
exce
llenc
e' co
ntrib
ute
to q
ualit
y of
inno
vatio
n, a
nd
'par
ticip
ativ
e sa
fety
' 'nor
ms f
or in
nova
tion'
to q
uant
ity
of in
nova
tion.
Und
erst
andi
ng in
nova
tion
can
be c
onsi
dera
bly
enha
nced
by
psyc
holo
gica
l ana
lysi
s and
theo
risin
g.
Inno
vatio
n ca
n be
mea
sure
d in
term
s of b
oth
the
quan
tity
of in
nova
tions
intr
oduc
ed a
nd th
e qu
ality
(p
p. 3
10).

- 307
-
1991
, Moo
re &
B
enba
sat
Dev
elop
men
t of a
n in
stru
men
t to
mea
sure
per
ceiv
ed c
hara
cter
istic
s of
an
IT in
nova
tion.
Attr
ibut
es (t
riala
bilit
y, re
lativ
e ad
vant
age,
co
mpa
tibili
ty, r
esul
t dem
onst
rabi
lity,
vi
sibi
lity,
eas
e of
use
, vol
unta
rines
s, im
age)
.
Com
men
ced
with
set o
f ini
tial c
hara
cter
istic
s whi
ch
wer
e re
fined
, mod
ified
and
rela
belle
d in
the
light
of
addi
tiona
l dat
a, in
clud
ing
revi
ews o
f pre
viou
sly
oper
atio
nalis
ed in
stru
men
ts. I
nstru
men
t dev
elop
ed in
a
3-st
age
proc
ess:
item
cre
atio
n, sc
ale
deve
lopm
ent,
inst
rum
ent t
estin
g.
Exis
ting
clas
sific
atio
ns la
cked
val
idity
and
re
liabi
lity.
The
cla
ssifi
catio
n ul
timat
ely
deve
lope
d de
rived
from
a re
trodu
ctiv
e ap
proa
ch b
ased
on
theo
ry a
nd p
revi
ous e
mpi
rical
wor
k. D
evel
op a
pa
rsim
onio
us, 3
4-ite
m in
stru
men
t, co
mpr
isin
g 7
scal
es, a
ll w
ith a
ccep
tabl
e le
vels
of r
elia
bilit
y (p
p.
210)
.
1992
, Ada
ms e
t al
. Ev
alua
tion
of 'p
sych
omet
ric'
prop
ertie
s of a
n IT
inno
vatio
n.
Attr
ibut
e (p
erce
ived
eas
e of
use
, pe
rcei
ved
usef
ulne
ss).
2 e
mpi
rical
stud
ies.
(1) 1
18 re
spon
dent
s, 10
or
gani
satio
ns, q
uest
ionn
aire
con
tain
ing
60 it
ems o
n us
eful
ness
, 45%
resp
onse
. (2)
73
user
s rat
e IT
in
term
s of t
he tw
o ps
ycho
met
ric p
rope
rties
.
Rep
licat
ion
of a
n ea
rlier
stud
y th
at d
evel
oped
and
va
lidat
ed th
e tw
o ps
ycho
met
ric c
onst
ruct
s. U
sefu
lnes
s is a
n im
porta
nt d
eter
min
ant o
f (IT
) sy
stem
use
.
1994
, Wol
fe
To sp
ecify
a re
sear
ch d
esig
n di
rect
ion
for m
ore
gene
ralis
able
, cu
mul
ativ
e an
d co
mpa
rabl
e re
sear
ch b
ased
on
the
com
plex
, co
ntex
t-sen
sitiv
e na
ture
of
inno
vatio
n.
Attr
ibut
es (A
dapt
abili
ty, a
rchi
tect
ural
im
pact
, cen
tralit
y, c
ompa
tibili
ty,
com
plex
ity, c
ost,
divi
sibi
lity,
dur
atio
n,
mag
nitu
de, o
bser
vabi
lity,
org
anis
atio
nal
focu
s, pe
rvas
iven
ess,
phys
ical
pro
perti
es,
radi
caln
ess,
rela
tive
adva
ntag
e, ri
sk,
stat
us, u
ncer
tain
ty).
Con
cept
ual r
evie
w o
f the
inno
vatio
n lit
erat
ure
(par
amet
ers u
ndef
ined
). Th
ere
is n
o br
oadl
y ac
cept
ed
typo
logy
bas
ed o
n at
tribu
tes.
Pres
ents
a li
st o
f 18
grou
ps o
f attr
ibut
e ty
pes (
and
syno
nym
s) d
eriv
ed
from
pre
viou
s stu
dies
. Attr
ibut
es, i
t is a
rgue
d, a
re
unde
r-re
pres
ente
d in
inno
vatio
n re
sear
ch w
hich
has
le
d to
con
foun
ded
resu
lts in
diff
usio
n, p
roce
ss a
nd
orga
nisa
tiona
l inn
ovat
iven
ess r
esea
rch.
Iden
tific
atio
n of
inno
vatio
n by
cat
egor
isat
ion
of
attri
bute
s cou
ld c
ontri
bute
sign
ifica
ntly
to th
e ge
nera
lisab
ility
of r
esea
rch.
Nee
d to
det
erm
ine
empi
rical
inde
pend
ence
of a
ttrib
utes
.
1995
, She
nhar
et
al.
Con
cept
ual d
evel
opm
ent o
f cl
assi
ficat
ion
to o
verc
ome
sim
plis
tic m
odel
s.
Attr
ibut
e (4
leve
ls o
f tec
hnol
ogic
al
unce
rtain
ty, 3
leve
ls o
f sys
tem
scop
e).
Expl
orat
ory,
mix
ed m
etho
d ca
se st
udy
and
surv
ey, 2
6 an
d 12
7 in
nova
tions
resp
ectiv
ely
in v
ario
us Is
rael
i m
ilita
ry a
nd c
omm
erci
al in
dust
ries.
Empi
rical
ap
plic
atio
n of
pre
viou
sly
deve
lope
d co
ncep
tual
fr
amew
ork.
A m
ore
real
istic
ally
del
icat
e ty
polo
gy (p
p. 1
95)
prov
ides
add
ition
al th
eore
tical
insi
ghts
into
the
natu
re o
f pro
duct
s and
an
eval
uatio
n of
thei
r su
cces
s. Te
chno
logi
cal u
ncer
tain
ty h
as p
rove
d to
be
a vi
able
var
iabl
e fo
r dis
tingu
ishi
ng b
etw
een
varia
bles
.
1996
, Wes
t &
And
erso
n
Exam
inat
ion
of re
latio
nshi
ps
betw
een
grou
p an
d or
gani
satio
nal
fact
ors a
nd te
am in
nova
tion.
Attr
ibut
es (m
agni
tude
, eff
ectiv
enes
s) a
nd
new
ness
(nov
elty
, rad
ical
). Lo
ngitu
dina
l stu
dy o
f top
man
agem
ent t
eam
s in
27
hosp
itals
.
Cla
rity
of a
nd c
omm
itmen
t to
obje
ctiv
es,
parti
cipa
tion,
task
orie
ntat
ion,
supp
ort f
or
inno
vatio
n in
fluen
ce th
e ou
tcom
e. M
ore
impo
rtan
t th
an w
hat t
eam
s dec
ide
to d
o…is
wha
t the
y ac
tual
ly
impl
emen
t…In
nova
tiven
ess c
an th
en b
e ju
dged
by
dom
ain
rele
vant
exp
erts
on
a nu
mbe
r of d
imen
sion
s su
ch a
s mag
nitu
de, r
adic
alne
ss, n
ovel
ty a
nd
influ
ence
on
orga
niza
tiona
l effe
ctiv
enes
s (pp
. 681
).

- 308
-
1997
, Aga
rwal
&
Pra
sad
Use
r-pe
rcep
tions
of a
n in
nova
tion
as a
n ex
plan
ator
y an
d pr
edic
tor v
aria
ble
for a
ccep
tanc
e be
havi
our.
Attr
ibut
es (r
elat
ive
adva
ntag
e, e
ase
of
use,
com
patib
ility
, tria
labi
lity,
vis
ibili
ty,
resu
lt de
mon
stra
bilit
y, im
age,
vo
lunt
arin
ess)
.
Gro
unde
d in
(the
con
vent
ions
of)
the
liter
atur
e (e
.g.
Rog
ers,
1983
; Ada
ms e
t al.,
199
2; M
oore
& B
enba
sat
1991
). Em
piric
al te
st o
f inn
ovat
ion
Attr
ibut
es
rese
arch
mod
el in
con
text
of I
T in
nova
tion.
Sur
veye
d 73
mem
bers
of M
BA
cla
ss.
Perc
eptio
ns in
fluen
ce ra
tes o
f ado
ptio
n, sp
ecifi
cally
re
lativ
e ad
vant
age,
com
patib
ility
, vis
ibili
ty,
trial
abili
ty, r
esul
t dem
onst
rabi
lity,
vol
unta
rines
s.
1997
, Mey
er e
t al
.
Stud
y of
inno
vatio
n in
new
or
gani
satio
nal f
orm
s in
orde
r to
unde
rsta
nd o
rgan
isat
iona
l in
nova
tiven
ess.
Attr
ibut
es (t
riala
bilit
y, o
bser
vabi
lity,
re
lativ
e ad
vant
age,
com
plex
ity,
com
patib
ility
, ada
ptab
ility
, ris
kine
ss,
acce
ptan
ce).
Typo
logi
cal.
Stud
y of
thre
e in
nova
tions
acr
oss a
si
ngle
org
anis
atio
n. T
hree
dis
cret
e pr
ojec
ts. S
elf-
repo
rt qu
estio
nnai
re, k
ey d
ecis
ion
mak
ers N
=89.
Diff
eren
t inn
ovat
ions
hav
e di
ffer
ent (
rate
d)
attri
bute
s, w
hich
, in
turn
, im
pact
ado
ptio
n an
d im
plem
enta
tion.
7 fa
ctor
typo
logy
, add
ing
adap
tabi
lity
and
riski
ness
to R
oger
s' (1
983)
5
attri
bute
s. In
clud
es a
lso
1 be
havi
oura
l cha
ract
eris
tic
- acc
epta
nce.
2001
, M
ukhe
rjee
&
Hoy
er
Inve
stig
atio
n of
the
pres
umed
po
sitiv
e ef
fect
of t
he a
ttrib
ute
nove
lty (
or n
ovel
attr
ibut
es) o
n pr
oduc
t eva
luat
ion
and
sale
s.
Attr
ibut
es (n
ovel
ty, c
ompl
exity
). G
roun
ded
in (t
he c
onve
ntio
ns o
f) th
e lit
erat
ure.
Empi
rical
. Sam
ple
of 1
40 u
nder
grad
uate
s ask
ed to
re
ad a
nd e
valu
ate
prod
uct d
escr
iptio
ns in
whi
ch te
xt
had
been
man
ipul
ated
to re
flect
com
plex
ity a
nd
nove
lty v
aria
bles
.
Nov
elty
can
hav
e a
nega
tive
effe
ct a
nd g
ener
ate
tech
noph
obia
or c
onsu
mer
resi
stan
ce.
2001
, Dan
neel
s &
Kle
insc
hmid
t
Cla
rifyi
ng th
e m
eani
ng o
f pr
oduc
t inn
ovat
iven
ess w
ith
rega
rd to
stop
/go
deci
sion
s and
fir
m p
erfo
rman
ce.
Attr
ibut
es. D
istin
guis
hes b
etw
een
firm
pe
rcep
tions
of i
nnov
ativ
enes
s (ba
sed
on
fam
iliar
ity a
nd fi
t of t
echn
olog
ical
and
m
arke
ting
aspe
cts)
and
cus
tom
er
perc
eptio
ns (b
ased
on
inno
vatio
n at
tribu
tes,
adop
tion
risks
and
leve
ls o
f be
havi
our c
hang
e im
plie
d).
His
toric
al sa
mpl
e of
262
pro
ject
s kno
wn
as N
ewPr
od
II. F
ive
dim
ensi
ons o
f inn
ovat
iven
ess m
easu
red
on a
19
-item
inst
rum
ent.
Diff
eren
t dim
ensi
ons o
f pro
duct
inno
vativ
enes
s ha
ve d
iffer
ent r
elat
ions
with
pro
duct
per
form
ance
. Fi
t with
exi
stin
g m
arke
ting
and
tech
nolo
gica
l co
mpe
tenc
ies m
ore
impo
rtant
to fi
nanc
ial
perf
orm
ance
than
mar
ket o
r tec
hnol
ogic
al
fam
iliar
ity. N
eed
for a
con
sist
ent,
expl
icit
and
prec
ise
defin
ition
of p
rodu
ct in
nova
tiven
ess.
2001
, Bis
was
Atte
mpt
s to
form
ulat
e in
dica
tors
fo
r cla
ssify
ing
inno
vatio
ns in
low
te
chno
logy
rura
l ind
ustri
es b
y us
ing
com
posi
te c
riter
ia.
Com
posi
te (6
cat
egor
ies d
eriv
ed fr
om th
e fo
llow
ing
crite
ria: i
nnov
atio
n so
urce
, ar
tisan
par
ticip
atio
n, e
nter
pris
e si
ze,
natu
re o
f pro
mot
iona
l bod
ies,
Attr
ibut
es
and
effe
cts o
f inn
ovat
ion)
.
Con
cept
ual p
aper
with
em
piric
al o
bser
vatio
ns o
f rur
al
indu
stry
in W
est B
enga
l.
Prov
ides
bas
is fo
r dev
elop
ing
a se
t of q
uant
ifiab
le
indi
cato
rs. I
nade
quac
y of
con
vent
iona
l cl
assi
ficat
ions
that
der
ive
from
eco
nom
ics,
NPD
, in
nova
tion
diff
usio
n et
c lit
erat
ure
that
orig
inat
es in
de
velo
ped
'wes
tern
' eco
nom
ies.

- 309
-
2001
, G
opal
akris
hnan
&
Bie
rly
To d
evel
op a
cat
egor
isat
ion
of
inno
vatio
n in
corp
orat
ing
know
ledg
e el
emen
ts a
nd e
xplo
re
impa
ct o
f con
sequ
ent t
ypes
on
orga
nisa
tiona
l dec
isio
ns a
nd
outc
omes
.
Kno
wle
dge
(taci
t/exp
licit,
co
mpl
ex/s
impl
e an
d sy
stem
ic/a
uton
omou
s), t
ype
(tech
nica
l, ad
min
istra
tive,
pro
duct
, pro
cess
), ne
wne
ss (r
adic
al, i
ncre
men
tal).
C
lass
ifica
tion
base
d on
the
natu
re o
f the
kn
owle
dge
asso
ciat
ed w
ith th
e in
nova
tion
proc
ess.
Empi
rical
exp
lora
tion
of in
nova
tion
sour
ce (i
nter
nal
or e
xter
nal),
cos
t of i
mpl
emen
tatio
n an
d ef
fect
iven
ess
in su
stai
ning
com
petit
ive
adva
ntag
e. 1
01 u
sabl
e qu
estio
nnai
res f
rom
surv
ey o
f US
bank
s, ba
sed
on
expe
rt-de
rived
list
of 3
1 fin
anci
al se
ctor
inno
vatio
ns
cate
goris
ed b
y th
eir k
now
ledg
e co
nten
t. In
nova
tion
typo
logy
det
erm
ined
by
3 ite
ms f
or c
ompl
exity
and
4
item
s for
taci
tnes
s and
aut
onom
y.
Shed
s lig
ht o
n in
tegr
atio
n of
diff
eren
t kno
wle
dge
area
s dur
ing
the
inno
vatio
n pr
oces
s. Th
e di
stin
ctio
n be
twee
n pr
oduc
t and
pro
cess
inno
vatio
ns in
ex
plai
ning
the
3 de
pend
ent (
know
ledg
e) v
aria
bles
as
soci
ated
with
ado
ptio
n he
ld to
be
criti
cal.

- 310 -
APPENDIX FOUR: PHASE 1 INTERVIEW PROTOCOL Preamble Introduction of self Thanks for being available for interview Introduction to research, the objective of which is to explore the connectedness of innovation processes and outcomes. That is what sort of processes have delivered what sort of outcomes. The interview will last no longer than 1 hour and will be a fairly free ranging discussion of xxxxx innovation during which time there are 4 key areas that I would like to discuss: Team/innovation context Develop a picture of time line and process Identification of critical incidents Understand the outcome There is no judgemental aspect to the process. Answers cannot be right or wrong, good or bad. The objective is to establish what you (the team) did and what came out at the end of the process. Please do not feel abashed at mentioning something that might seem to you to be trivial or unimportant. Understanding the background to the founding of the team Prompts: - Why was the team put together? With what objective in mind? - Who was in the team and why? - Why did you enter for team of the year – a function of the outcome? - Level of respondent’s involvement. Level of team socialisation, communication. - Critical knowledge/individuals. Identification of critical incidents Prompts: - What were the important events in the duration of the process? Why were they significant? - Single or multiple triggers? Triggers along the time line? - Criticality of incidents to the outcome - How and where were key decisions made (directed vs autonomous), individual
reactions to decisions Building a picture and time line of process Prompts: - How did you start, what happened next, how did that come about? What were the
activities in which you engaged in order to deliver the innovation? - Was the process prescribed? Prescription vs discretionary, structure vs unstructure,
degree of routinisation (effortful accomplishment vs automatic response). - Negative and positive features of the process. - What did you do and why did you do it.

- 311 -
- Progressive revisions along the time line. - What would have made it better/worse? - When it was working well what was happening? - When it was not working well what was the block, was there an absence of
something? - Were there occasions when you did not know what to do next, what did you do? Understanding the outcome Prompts: - Describe the innovation – what was special about it? What quality does the
innovation have that, if it were absent, would render the innovation something other than it is?
- Newness, significance, effectiveness. An improvement, something completely new - The absence of what element from the process would have made it better/worse? - What were the key features of the process that enabled you to end up with what
you got? - What is it about your application to team of the year that made your application
successful? - Users’ perspective? Background documentation to informants The importance of innovative problem solving to competitive advantage and organisational survival is largely undisputed. Partly as a consequence of hyper-turbulent competition and demand for improved services, organisational capacity to deliver innovative solutions has come to be regarded as a critical competence. Research across several domains suggests that teams play a significant role in stimulating innovation. However, despite the growing use of teams as a vehicle for organisational functioning there is still little understanding of the input factors and group processes that determine levels of team innovation. The focus of management and academic attention appears largely to have been on making the processes of innovation more efficient (for example, faster or leaner through the application of tools such as TQM), or, understanding the impact on the organisation of introducing innovations from outside the organisation. Both of these approaches largely ignore the nature of the innovation itself. It is argued, for example, that the process for managing discontinuous (radical) innovation is different from that for managing incremental innovation. What is sound management practice for managing incremental innovation might actually hamper the process of radical innovation. In the absence of a critical understanding of the connection between process and outcome it is not clear how best, in successive projects, to organise for innovation. Part of the difficulty in forging a connection between process and outcome is the inadequacy of our language for talking about innovation. Historically, we have been restricted to talking in generalities about radical or incremental, administrative or

- 312 -
technical innovations, and so on. This framework fails to capture the richness of all that which contributes to an innovation, of all that that is embodied in the innovation. Our language simply fails to capture the essence of an innovation. The proposed research confronts this difficulty. In posing the question ‘What is it that makes the innovation outcome look like it does?’ the research addresses two key issues. Firstly, it seeks to specify a robust framework for talking about innovations. Secondly it will map out and categorise the processes, which at the most fundamental level are that collection of tasks or activities which, together, and only together, transform inputs into outputs, of innovation in project and team working. The assumption of the proposed research is that the processes of innovation in project teams can be understood from a holistic perspective in which the process elements are tightly interdependent and mutually supportive. Through the retrospective analysis of histories to discern commonalities (or not) in which the actors engage, which culminate (or not) in robustly specified innovation outcomes, the objective is to describe an innovation both in terms of its essential features and the process by which it came about. In the early stages of data collection three questions will be asked: ‘Why was the project team started (issue identification)?’ ‘What was the innovative outcome (its essence)?’ and, ‘How did it come about (the process)?’ along a time-line investigation (see below).
Start of PT, development triggered
End of PT, innovation delivered
Why was the project team (PT) formed?
What did you do? What did you do after that? etc…
Why did you do it?
What did the innovation look like?

- 313 -
APPENDIX FIVE: SURVEY INSTRUMENT AND COVERING DOCUMENTATION Dear [Name] Based on your participation in the [Award], I would like to ask for your co-operation in a research programme being undertaken by my research student, Richard Adams, as part of his doctoral studies. The research investigates the approaches NHS teams use to deliver different innovation outcomes in order to better understand the nature of the relationships between the two and the extent to which processes influence the nature of outcomes. Because existing research in this area is limited it is anticipated that the study will have significant learning applications in the current climate of change in the NHS. Enclosed is a short questionnaire, developed from case work in the NHS, which in trials has taken approximately 15-20 minutes to complete. We would sincerely appreciate your participation in this survey that we feel sure will be of mutual benefit. As a token of this appreciation we are happy to provide you with the results of this study. If you have any questions or would like to discuss the questionnaire further Richard can be contacted at the above address, via email ([email protected]) or by telephone (**********). I do hope that you will feel able to participate. Yours sincerely Professor David Tranfield Director of Research

- 314 -
Perceptions of Innovation Questionnaire This questionnaire considers the nature of innovations as part of a wider study into connections between innovation processes and outcomes. It is designed to discover your perceptions about a recent innovation in which you were involved, [INNOVATION] The questionnaire takes the form of a series of statements and should take between 15 and 20 minutes to complete. When considering these statements please: Consider them with respect to [INNOVATION] Evaluate each statement according to the extent to which you agree or disagree with it in relation to [INNOVATION] Thank you for your co-operation Richard Adams Guidelines for completion: Please answer all the statements by circling the appropriate number on the scale of 1 (you strongly disagree with the statement with regard to [INNOVATION]) to 7 (you strongly agree with the statement with regard to [INNOVATION]) Please return completed questionnaires to Richard Adams in the pre-paid envelope provided.
If you would like to receive a copy of the report emanating from this research please ensure that your contact details are correct and sign below
DETAILS
Yes, please send me a copy of the research report:……………………………………………….(signature)
Statement of Confidentiality Findings from this research will be presented in generalised form only and not in any way that would identify any specific individuals, teams or organisations.

- 315 -
Please circle the relevant number for each statement Strongly
disagree Neutral Strongly agree
1. Statements 1.1 – 1.5. How big was the change?
1.1 There is a high degree of similarity between the innovation and that which it replaces 1 2 3 4 5 6 7
1.2 The innovation has allowed the adopting unit* to provide (a) new service(s) for the first time 1 2 3 4 5 6 7
1.3 The innovation consists only of minor changes 1 2 3 4 5 6 7
1.4 The innovation supplemented, but did not replace, an existing service 1 2 3 4 5 6 7
1.5 The innovation represents a major change in what the adopting unit* is able to offer 1 2 3 4 5 6 7
*Adopting unit: the team, specialism, or medical or organisational unit that has adopted and is the principal user of the innovation.
2. Statements 2.1 - 2.7. Did innovating lead to changes in existing routines and behaviour?
2.1 Staff were immediately familiar with how the innovation worked 1 2 3 4 5 6 7
2.2 The innovation represented a large departure from existing behaviour for the adopting unit 1 2 3 4 5 6 7
2.3 The innovation represented a large departure from existing behaviour across the whole organisation 1 2 3 4 5 6 7
2.4 The innovation represented a large departure from existing behaviour for the wider stakeholder* community 1 2 3 4 5 6 7
2.5 Pre-existing routines (i.e. pre-dating the innovation), in the adopting unit, remained unchanged after the innovation 1 2 3 4 5 6 7
2.6 Pre-existing routines (i.e. pre-dating the innovation), in the whole organisation+, remained unchanged after the innovation 1 2 3 4 5 6 7
2.7 Pre-existing routines (i.e. pre-dating the innovation), in the stakeholder community, remained unchanged after the innovation 1 2 3 4 5 6 7
*Stakeholder community: the wider community that has an interest in the innovation, this might include patients, suppliers, government departments, charitable bodies etc +Whole organisation: the local organisation to which the adopting unit belongs. This might be a Primary Care Trust, Hospital Trust, Charitable body, Health Authority
3. Statements 3.1 – 3.6. To what extent was the innovation disruptive?
3.1 Developing* the innovation caused disruption in the adopting unit 1 2 3 4 5 6 7
3.2 Developing the innovation caused disruption in the wider organisation 1 2 3 4 5 6 7

- 316 -
3.3 Developing the innovation caused disruption in the stakeholder community 1 2 3 4 5 6 7
3.4 Implementing+ the innovation caused disruption in the adopting unit 1 2 3 4 5 6 7
3.5 Implementing the innovation caused disruption in the wider organisation 1 2 3 4 5 6 7
3.6 Implementing the innovation caused disruption in the stakeholder community 1 2 3 4 5 6 7
*Developing an innovation – those activities pertaining to problem identification, information gathering, attitude formation and evaluation, resource attainment, leading to a decision to adopt and implement an innovation +Implementing an innovation - the initial utilisation and then continued use of the innovation by the group or organisation until the innovation becomes a routine feature.
4. Statements 4.1 – 4.5 The extent of risk* to which individuals or the whole organisation were exposed in the development, implementation or use of the innovation.
4.1 The innovation is inherently risky 1 2 3 4 5 6 7
4.2 The innovation has been widely accepted as safe 1 2 3 4 5 6 7
4.3 Individuals took risks in developing the innovation 1 2 3 4 5 6 7
4.5 Individuals took risks in implementing the innovation 1 2 3 4 5 6 7
4.6 The innovation represents a risk for the organisation 1 2 3 4 5 6 7
*Risk: covers a range of factors and can include: clinical failure, legal action, degraded reputation, diminished career expectations, technical failure, threats to established power bases and so on.
5. Statements 5.1 – 5.5 The idea origins of the innovation
5.1 The innovation was developed entirely in-house 1 2 3 4 5 6 7
5.2 The innovation required significant external input 1 2 3 4 5 6 7
5.3 The innovation required minimal external input 1 2 3 4 5 6 7
5.4 The innovation was copied from an external source. 1 2 3 4 5 6 7
5.5 The innovation was modified from external examples 1 2 3 4 5 6 7
6. Statements 6.1 – 6.2 The extent to which the innovation can be refined, elaborated and modified according to the needs of the adopting unit 6.1 The innovation fits comfortably with existing organisational
values 1 2 3 4 5 6 7
6.2 Where necessary it has been possible to modify the innovation to suit local requirements 1 2 3 4 5 6 7

- 317 -
Strongly
disagree Neutral Strongly agree
7. Statements 7.1 – 7.4 Users’ (those members of the adopting unit) understanding of the origins of the innovation and the use to which it is put
7.1 Users are well informed about the origins of the innovation 1 2 3 4 5 6 7
7.2 Users are well informed about expectations of the innovation 1 2 3 4 5 6 7
7.3 The feasibility of the innovation was frequently called into question 1 2 3 4 5 6 7
7.4 We were not aware of appropriate external solutions to the initial problem 1 2 3 4 5 6 7
7.5 The innovation is effective in its use 1 2 3 4 5 6 7
8. Statements 8.1 – 8.4 Innovation scope. Does the innovation stand alone in the unit of adoption or does it have a wider reach? 8.1 The innovation is self-contained within the adopting unit 1 2 3 4 5 6 7
8.2 The impact of the innovation has been limited to the whole organisation 1 2 3 4 5 6 7
8.3 The impact of the innovation has been widely felt beyond the whole organisation 1 2 3 4 5 6 7
8.4 The innovation has required changes to be made or accommodations sought in the wider stakeholder environment 1 2 3 4 5 6 7
9. Statements 9.1 – 9.7 Innovation complexity. The multiple inter-dependant, inter-relating components* necessary for the functioning of the innovation. 9.1 The innovation consists of modified existing components* 1 2 3 4 5 6 7
9.2 A large number of specialists (clinical and/or non-clinical) were involved in developing the innovation 1 2 3 4 5 6 7
9.3 A large number of specialists (clinical and/or non-clinical) were involved in implementing the innovation 1 2 3 4 5 6 7
9.4 The innovation requires co-ordination amongst many units 1 2 3 4 5 6 7
9.5 The innovation has been highly customised for local use 1 2 3 4 5 6 7
9.6 A large number of organisational units were involved in developing the innovation 1 2 3 4 5 6 7
9.7 A large number of organisational units were involved in implementing the innovation 1 2 3 4 5 6 7
*Components: might be physical items – say a piece of technology – equally they might be ‘soft’ items such as social relationships. So, is the innovation a reconfiguration of existing resources?
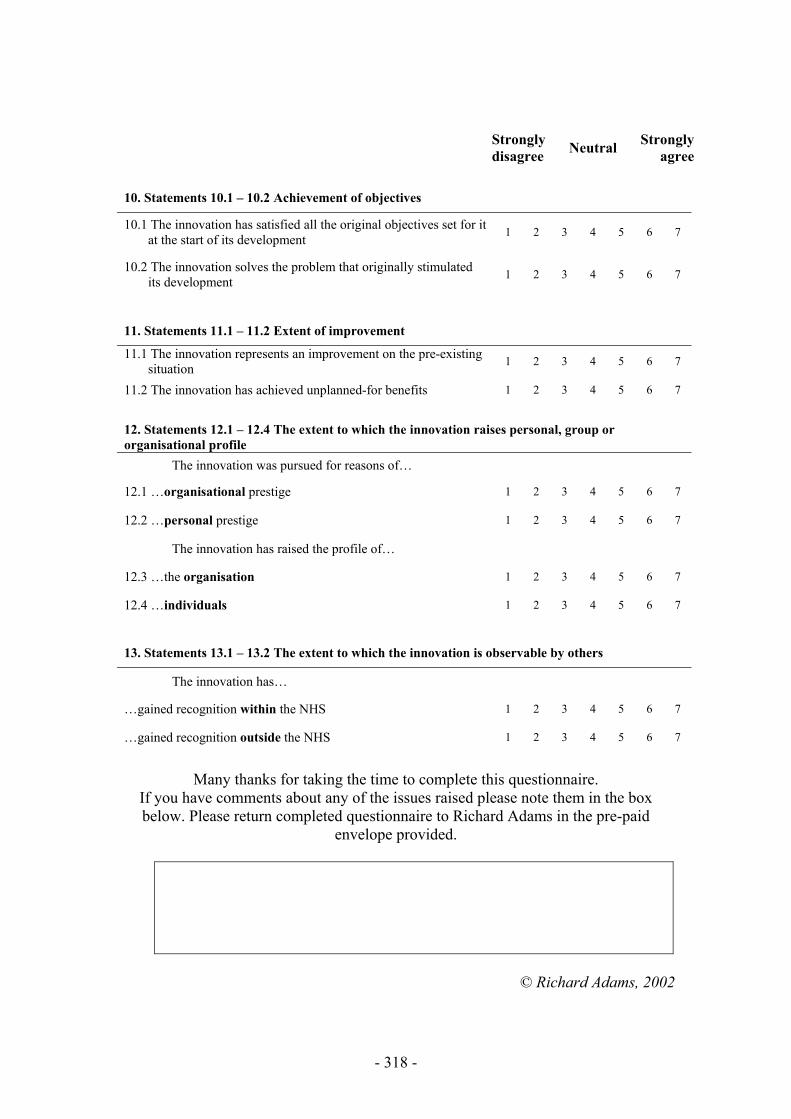
- 318 -
Strongly
disagree Neutral Strongly agree
10. Statements 10.1 – 10.2 Achievement of objectives
10.1 The innovation has satisfied all the original objectives set for it at the start of its development 1 2 3 4 5 6 7
10.2 The innovation solves the problem that originally stimulated its development 1 2 3 4 5 6 7
11. Statements 11.1 – 11.2 Extent of improvement
11.1 The innovation represents an improvement on the pre-existing situation 1 2 3 4 5 6 7
11.2 The innovation has achieved unplanned-for benefits 1 2 3 4 5 6 7
12. Statements 12.1 – 12.4 The extent to which the innovation raises personal, group or organisational profile The innovation was pursued for reasons of…
12.1 …organisational prestige 1 2 3 4 5 6 7
12.2 …personal prestige 1 2 3 4 5 6 7
The innovation has raised the profile of…
12.3 …the organisation 1 2 3 4 5 6 7
12.4 …individuals 1 2 3 4 5 6 7
13. Statements 13.1 – 13.2 The extent to which the innovation is observable by others
The innovation has…
…gained recognition within the NHS 1 2 3 4 5 6 7
…gained recognition outside the NHS 1 2 3 4 5 6 7
Many thanks for taking the time to complete this questionnaire.
If you have comments about any of the issues raised please note them in the box below. Please return completed questionnaire to Richard Adams in the pre-paid
envelope provided.
© Richard Adams, 2002

- 319 -
APPENDIX SIX: CASE HISTORY SUMMARY SHEET Interviewee name Tape reference
Role title/responsibilities Age
Interviewee code number Sex
Interview number Education
Date coded Date/time of interview
Place of interview
What were the main issues or themes that struck me in this contact:
Summary of data gathered (any notable gaps?) Process Outcome
What struck me as salient, interesting, illuminating or important in this interview:
As a result of this interview what new or alternative issues are raised for future contact at this site or, other sites?
Salient points emerging from coding:
Page Point Category/Theme
Reflections on the process of coding:

- 320
-
APP
EN
DIX
SE
VE
N: C
ON
TE
NT
AN
AL
YSI
S O
F R
EPE
RT
OR
Y G
RID
S, A
N E
XA
MPL
E F
RO
M T
EA
M D
Info
rman
t Gen
erat
ed
Con
stru
ct, a
nd
Dim
ensi
on
Raw
Dat
a In
itial
Ref
lect
ions
and
Ann
otat
ion
impr
ovin
g ex
istin
g ac
tiviti
es -
conc
rete
, ep
isod
ic
Invo
lves
impr
ovin
g ex
istin
g se
rvic
es o
r exi
stin
g ac
tiviti
es o
r par
ticip
atin
g in
exi
stin
g ac
tiviti
es a
nd it
is ju
st if
you
like
get
ting
a ne
w h
andl
e on
them
all
getti
ng a
new
ap
proa
ch o
r im
prov
ing
them
in so
me
way
. W
here
as (e
lem
ent)
1 se
ems t
o be
a m
uch
mor
e co
ncre
te, s
epar
ate,
epi
sodi
c --
ther
e se
ems t
o be
a d
efin
ite st
ep in
volv
ed a
s op
pose
d to
incr
emen
tal c
hang
e.
Deg
rees
of n
ewne
ss, e
choe
s of
radi
cal/i
ncre
men
tal d
icho
tom
isat
ion.
In
fact
, app
ears
to d
istin
guis
h be
twee
n ex
istin
g se
rvic
es a
nd se
rvic
es th
at a
re n
ew
to th
e ho
spita
l – lo
cate
d ne
wne
ss. M
akin
g th
e in
nova
tion
a ‘b
ette
r pla
ce to
be’
. C
aptu
res a
nd su
ppor
ts m
ultip
le
dim
ensi
ons.
med
ical
ly le
d, n
urse
le
d It
is d
eleg
atin
g pr
evio
us m
edic
al re
spon
sibi
lity
to n
ursi
ng st
aff.
Inte
rnal
role
s in
the
deliv
ery
of th
e ne
w
serv
ice.
Inte
rnal
loca
tion
of im
pact
. In
dica
tive
of in
nova
tion
type
and
dep
artu
re
from
pre
-exi
stin
g pr
actic
es.
mul
tidis
cipl
inar
y,
indi
vidu
al d
isci
plin
e Th
ey te
nd re
ally
to b
e m
uch
mor
e in
divi
dual
, all
base
d on
an
activ
ity b
y an
indi
vidu
al
or p
erha
ps tw
o pe
ople
. 5
is m
ore
a si
ngle
dis
cipl
ine.
...
Scop
e of
impa
ct, m
aybe
sugg
estin
g de
partu
re fr
om th
e w
ay th
ings
wer
e do
ne
befo
re e
ither
for a
smal
l num
ber o
r lar
ge
num
ber o
f peo
ple.
patie
nt fo
cus,
orga
nisa
tion
focu
s
I thi
nk to
the
patie
nt th
ose
2 (e
lem
ents
) are
exc
eptio
nally
sign
ifica
nt. T
he m
ulti-
disc
iplin
ary
team
s are
not
inte
rest
ed in
the
patie
nt a
nd e
lem
ent 1
scor
es 1
– th
ey d
on’t
care
wha
t is b
ehin
d it.
Ele
men
t 2 sc
ores
4 b
ecau
se a
lot o
f tha
t will
hav
e a
knoc
k on
ef
fect
for p
atie
nts –
big
tim
e.
They
(ele
men
ts 4
&5)
are
hig
hly
patie
nt fo
cuse
d, th
at o
ne (3
) isn
’t. W
ell,
I am
not
sa
ying
not
hing
but
, it d
oesn
’t af
fect
the
patie
nt. A
s far
as I
am
con
cern
ed 4
&5
are
very
pat
ient
focu
sed
and
scor
e 5
– th
e se
rvic
e fo
r the
pat
ient
, tha
t is w
hat w
e ar
e he
re
for.
At t
he e
nd o
f the
day
the
patie
nt d
oesn
’t ca
re w
ho’s
man
agin
g w
hat!
I thi
nk w
hen
it co
mes
to a
pat
ient
the
patie
nt is
inte
rest
ed in
the
serv
ice
they
get
, not
how
they
get
it
or w
ho’s
up
ther
e go
vern
ing
it. I
don’
t thi
nk th
ey lo
ok a
bove
the
cons
ulta
nt, a
nd I
don’
t put
con
sulta
nts i
n m
anag
emen
t. W
hen
I tal
k ab
out m
anag
emen
t I m
ean
peop
le
in th
eir o
ffic
es, n
ot d
eliv
erin
g m
edic
al se
rvic
es.
Var
ious
man
ifest
atio
ns o
f thi
s ide
a: p
atie
nt
focu
s con
trast
ed a
gain
st n
on-p
atie
nt fo
cus,
orga
nisa
tiona
l foc
us, d
imen
sion
alis
ed
high
/low
. Com
bine
s ide
as o
f loc
atio
n of
ne
wne
ss, a
nd th
e ex
tent
to w
hich
the
inno
vatio
n is
bet
ter t
han
the
situ
atio
n w
hich
pre
cede
d it.

- 321
-
Elem
ent o
ne is
mor
e or
gani
satio
n fo
cuse
d if
you
like
whe
reas
four
and
six
are
real
ly
muc
h m
ore
patie
nt fo
cuse
d.
sing
le/h
olis
tic a
spec
ts
of p
atie
nt e
xper
ienc
e ty
pe o
f pat
ient
inpa
tient
or
out
patie
nt
Elem
ents
5 a
nd 6
are
muc
h m
ore
abou
t a si
ngle
asp
ect o
f ser
vice
or a
ctiv
ity.
A
com
pone
nt if
you
like
. Th
ey a
re m
uch
mor
e ab
out a
com
pone
nt o
f the
pat
ient
’s
expe
rienc
e. W
here
as e
lem
ent 2
is m
uch
mor
e ab
out t
he w
hole
serv
ice
that
the
patie
nts e
xper
ienc
e is
rath
er th
an o
ne si
ngle
asp
ect o
f tha
t ser
vice
that
the
patie
nt o
r th
e st
aff e
xper
ienc
e
Inno
vatio
ns a
re m
ade
up o
f ele
men
ts,
som
e m
ore
than
oth
ers –
diff
eren
t deg
rees
of
con
nect
edne
ss b
etw
een
the
elem
ents
fr
om o
ne in
nova
tion
to th
e ne
xt.
stra
tegi
c, fu
nctio
nal
Prac
tical
asp
ect o
f ser
vice
del
iver
y w
here
as in
1 a
nd th
ree
invo
lve
a m
ore
stra
tegi
c ro
le --
that
is th
inki
ng a
bout
the
heal
th se
rvic
e as
a p
rovi
der.
So
we
are
look
ing
at
stra
tegi
c ve
rsus
pra
ctic
ality
.
Dim
ensi
ons o
f sol
utio
n to
the
initi
al
prob
lem
? M
ulti-
leve
ls o
f sol
ving
. C
ompo
nent
s and
com
plex
ity o
f som
e in
nova
tions
.
bene
fit to
pat
ient
s, be
nefit
to st
aff v
ia
stre
amlin
ing
Elem
ent 2
seem
s to
be m
ore
abou
t the
staf
f asp
ects
of a
ctiv
ity, i
n ot
her w
ords
they
w
ould
seem
to m
e to
ben
efit
staf
f alth
ough
they
pro
babl
y do
ben
efit
patie
nts b
ecau
se
we
actu
ally
had
to se
t up
the
com
mun
ity d
enta
l ser
vice
in h
ospi
tal t
o he
lp o
ut th
e co
mm
unity
bec
ause
they
wer
e ha
ving
pro
blem
cop
ing
with
it in
the
com
mun
ity.
So
that
is h
ow I
wou
ld p
ut it
, num
ber t
wo
wou
ld p
roba
bly
bene
fit st
aff w
orki
ng p
ract
ices
or
type
s of w
orki
ng p
ract
ices
whe
reas
num
bers
four
and
six
wou
ld p
redo
min
antly
be
nefit
pat
ient
s…W
hat I
thin
k I m
ean
is th
ey p
roba
bly
bene
fit sm
ooth
runn
ing
of th
e or
gani
satio
n in
the
sens
e, if
you
like
they
pro
babl
y do
not
dire
ctly
ben
efit
staf
f by
givi
ng th
em m
ore
time
off -
- I d
on't
real
ly m
ean
that
. So
wha
t the
y do
is p
rodu
ce
mor
e st
ream
lined
org
anis
atio
nal p
ract
ices
or s
tream
lined
org
anis
atio
nal w
orki
ng.
Cus
tom
er p
ersp
ectiv
e vs
inte
rnal
pe
rspe
ctiv
e. A
bet
ter p
lace
to b
e…
degr
ee o
f per
sona
l in
volv
emen
t (lo
-hi)
Elem
ents
1&
2 ar
e so
met
hing
that
I w
ould
pot
entia
lly b
e in
volv
ed in
, tha
t one
(3) i
s so
met
hing
I w
ould
n’t.
Rol
es a
nd b
ehav
iour
s?

- 322
-
degr
ee o
f nur
se
invo
lvem
ent a
t es
tabl
ishm
ent (
lo-h
i) de
gree
of c
onsu
ltant
in
volv
emen
t (lo
-hi)
degr
ee o
f man
agem
ent
invo
lvem
ent (
lo-h
i) nu
rses
/mul
tidis
cipl
inar
y
That
is a
tric
ky o
ne b
ecau
se th
ey a
re a
ll nu
rse
led,
they
all
depe
nd o
n m
edic
al st
aff
for h
elp.
I w
ould
say,
in th
eir s
ettin
g up
5&
4 ar
e m
ore
nurs
e le
d an
d 6
is a
naes
thet
ic
led.
The
y ar
e si
mila
r, al
thou
gh th
ey a
re a
sked
for b
y do
ctor
s the
y ha
ve re
ally
bee
n in
trodu
ced
by n
urse
s and
they
are
rath
er m
ore
nurs
e or
ient
ated
, whe
reas
the
acut
e pa
in se
rvic
e, a
lthou
gh it
is S
haro
n –
she
is th
e pa
in n
urse
– sh
e ha
s a te
am o
f an
aest
hetis
ts th
at sh
e al
way
s wor
ks w
ith. S
o al
thou
gh a
nur
se is
at t
he fo
refr
ont o
f th
at (w
hich
one
?) n
ow I
don’
t thi
nk sh
e w
as w
hen
it w
as se
t up.
I w
ould
say
2 ar
e m
ainl
y ei
ther
con
sulta
nt o
r man
agem
ent l
ed 1
is m
ore
nurs
ing
led.
I am
goi
ng to
cha
nge
my
min
d, I
am g
oing
to sa
y th
at th
at is
mor
e m
anag
emen
t led
an
d th
at is
mor
e nu
rsin
g le
d. S
o th
at is
the
degr
ee o
f man
agem
ent
Aga
in m
ainl
y nu
rse
led,
mai
nly
big
nurs
e in
volv
emen
t. I t
hink
that
that
one
relie
s on
cons
ulta
nt in
put,
cons
ulta
nt a
ppro
val.
Deg
ree
of c
onsu
ltant
invo
lvem
ent.
Th
at is
a c
linic
run
by n
urse
s prim
arily
– e
ven
thou
gh it
is a
mul
ti di
scip
linar
y it
is
mai
nly
a nu
rse-
led
(5).
Nur
se-le
d (s
core
1) m
ulti
disc
iplin
ary
(sco
re 5
)
In d
imen
sion
alis
ing
the
scal
e on
e in
form
ant w
as e
ager
to p
oint
out
that
it
was
at i
ntro
duct
ion
of th
e se
rvic
e, n
ot
nece
ssar
ily in
the
curr
ent r
unni
ng o
f the
se
rvic
e –
the
setti
ng u
p an
d in
trodu
ctio
n.
In e
ffec
t it i
s nur
se in
volv
emen
t aga
in, j
ust
the
emph
asis
has
cha
nged
and
the
scor
ing
mirr
ors v
ery
clos
ely
that
for c
onst
ruct
3. I
n fa
ct I
term
inat
ed re
perto
ry g
riddi
ng w
ith
info
rman
t qui
te q
uick
ly –
at l
east
in
form
ant g
ener
ated
con
stru
cts –
info
rman
t fo
und
it ve
ry d
iffic
ult t
o ge
nera
te m
ore
than
one
con
stru
ct (w
hich
was
in e
ffec
t de
gree
of n
urse
invo
lvem
ent).
effe
ctiv
enes
s to
Trus
t m
anag
emen
t (lo
-hi)
effe
ctiv
enes
s/in
effe
ctiv
enes
s to
the
hosp
ital
Patie
nt o
rient
ated
eff
ectiv
enes
s. N
o, e
ffec
tiven
ess t
o th
e m
anag
emen
t stru
ctur
e of
the
NH
S, n
o w
ithin
the
Trus
t. So
2&
1 sc
ore
high
ly
Inno
vatio
n ev
iden
tly h
as im
pact
in
diff
eren
t dom
ains
, but
info
rman
t app
ears
to
com
pare
and
con
trast
thes
e im
pact
s as
part
of th
e re
flect
ion
proc
ess o
f rep
erto
ry
grid
tech
niqu
e to
det
erm
ine
a pe
rspe
ctiv
e of
‘mos
t and
leas
t’
sign
ifica
nce
to p
atie
nt
(lo-h
i) Si
gnifi
canc
e? T
o th
e se
rvic
e, to
the
staf
f or t
o pa
tient
s? O
K, s
igni
fican
ce to
staf
f and
pa
tient
s
I fee
l une
asy
abou
t thi
s. Se
ems n
ot to
hav
e an
y m
eani
ng fo
r the
info
rman
t and
giv
es
the
impr
essi
on o
f jus
t ‘pl
ayin
g th
e ga
me’
incr
emen
tal/r
adic
al
I thi
nk th
at’s
a n
ew in
nova
tion
for t
he h
ospi
tal.
I wou
ld sa
y th
ose
thin
gs h
ave
perh
aps
alre
ady
been
ther
e or
cer
tain
ly o
ver t
he la
st 8
or 9
yea
rs. I
wou
ld sa
y th
at e
lem
ent 5
is
a ne
w in
itiat
ive,
a n
ew in
nova
tion
for u
s, I w
ould
say
thos
e (1
&2)
hav
e be
en th
ere
– th
ey m
ay h
ave
been
rein
vent
ed b
ut I
wou
ld sa
y th
ose
two
(1&
2) h
ave
alw
ays b
een
ther
e an
d th
at (5
) is a
new
one
. C
ard
1 is
abo
ut a
2, i
t has
alw
ays b
een
ther
e, it
is c
omin
g to
the
fore
fron
t now
and
we
are
chan
ging
the
way
the
mul
ti di
scip
linar
y te
am w
orks
toge
ther
. The
acu
te se
rvic
e is
ab
out 3
, alth
ough
it h
as a
lway
s bee
n he
re it
has
und
ergo
ne a
lot o
f cha
nge
rece
ntly
, or
In sp
ite o
f the
radi
cal/i
ncre
men
tal
dim
ensi
onal
isat
ion,
I th
ink
we
are
talk
ing
here
abo
ut w
hat h
as b
een
done
to e
xist
ing
know
ledg
e, b
ehav
iour
s and
so o
n, h
ow
they
hav
e be
en a
men
ded,
dev
elop
ed,
revi
talis
ed.

- 323
-
sinc
e S
cam
e in
to p
ost.
I wou
ld sa
y th
at (2
) is a
bout
a 5
bec
ause
I th
ink
that
a lo
t of
thos
e ar
e ne
w. C
ard
3, m
iddl
e of
the
road
on
that
one
bec
ause
I th
ink
it ha
s alw
ays
been
her
e, o
nly
now
is it
com
ing
up to
the
fore
fron
t, th
at w
e ar
e su
ppos
ed to
kno
w
abou
t the
se th
ings
. 5, p
roba
bly
a 3,
it h
as a
lway
s bee
n he
re b
ut a
gain
it is
und
ergo
ing
chan
ge a
nd th
e sa
me
for e
lem
ent 4
.
exis
ting
with
in/n
ew to
ho
spita
l
Elem
ents
2&
3 ar
e th
e sa
me,
just
bec
ause
you
par
ticip
ate
in so
met
hing
, you
are
one
of
man
y an
d…th
ey a
re m
ulti
disc
iplin
ary
prac
tice
area
s, so
met
hing
that
are
alre
ady
esta
blis
hed
anyw
ay, t
here
was
alre
ady
som
ethi
ng th
ere.
Set
ting
up o
f a m
ulti
disc
iplin
ary
day
case
man
agem
ent t
eam
that
was
setti
ng u
p so
met
hing
from
scra
tch
– so
you
are
beg
inni
ng w
ith a
bla
nk p
iece
of p
aper
, how
you
wan
t to
mov
e fo
rwar
d…
Elem
ent 2
…ab
out a
3 b
ecau
se e
ven
thou
gh y
ou h
ave
got t
hing
s exi
stin
g yo
u ar
e im
prov
ing
your
em
phas
is o
n fu
ture
…yo
u ar
e try
ing
to d
o ch
ange
as w
ell b
ecau
se
ther
e is
som
ethi
ng th
ere.
The
exte
nt o
f the
new
ness
? S
ome
star
t fr
om n
othi
ng –
the
blan
k pi
ece
of p
aper
–
othe
rs d
evel
op o
n pr
e-ex
istin
g th
ings
. Ex
istin
g vs
new
? N
ot n
eces
saril
y co
ntin
uous
impr
ovem
ent.
Con
text
loca
l, do
mai
n of
new
ness
.
indi
vidu
al/te
am
I wou
ld sa
y 2&
3 ar
e th
e sa
me
pure
ly b
ecau
se th
ey a
re d
iffer
ent s
ervi
ces,
but w
e ha
ve
had
that
one
. Can
we
have
intro
duct
ion
or is
that
the
sam
e as
new
? R
A: w
hat d
o yo
u w
ant t
o sa
y ab
out i
ntro
duct
ion?
W
ell i
t is a
new
serv
ice
but i
t is t
he in
trodu
ctio
n of
…so
may
be…
all t
he g
roun
dwor
k ha
s bee
n do
ne a
nd w
e ar
e ju
st a
bout
to ru
n w
ith it
whe
reas
thes
e ar
e al
read
y on
goin
g.
They
can
be
done
by
one
pers
on a
nd th
e ot
her h
as to
be
done
with
man
y pe
ople
- In
divi
dual
(1) t
eam
(5).
Ran
ge o
f im
pact
, num
bers
of p
eopl
e in
volv
ed, b
ehav
iour
s aff
ecte
d?
impa
ct o
f new
ness
to
patie
nt/s
taff
RA
: So,
new
to p
atie
nts t
hen?
N
ewne
ss to
the
patie
nt b
ecau
se n
ow th
at w
e ha
ve m
erge
d fr
om 5
hos
pita
ls to
1 a
nd
we
have
als
o go
t the
GPs
with
thei
r eve
r cha
ngin
g ro
les a
nd th
e in
patie
nt c
are
grou
p,
we
are
taki
ng p
atie
nts f
rom
furth
er a
field
esp
ecia
lly w
ith th
e ca
tara
cts.
RA
: And
wha
t cou
ld w
e ha
ve a
t the
oth
er e
nd?
Can
you
not
hav
e, h
ow d
o yo
u w
ord
it, I
wan
t a w
ord
goin
g fr
om, c
ould
you
hav
e lik
e pa
tient
s and
staf
f in
the
sam
e th
ing?
Wha
t I a
m tr
ying
to sa
y is
that
that
’s n
ew to
pa
tient
s tha
t…B
ut a
lso
from
our
poi
nt o
f vie
w w
e ha
ve n
ow g
ot su
ch a
larg
e ar
ea to
de
al w
ith th
at w
e…
Polit
ics a
nd p
lay.
The
juni
or p
artn
er in
a
trust
that
feel
s und
er-v
alue
d, ig
nore
d ev
en
bulli
ed a
nd c
oerc
ed b
y a
muc
h la
rger
pa
rtner
. See
ms a
cur
ious
con
stru
ct g
iven
th
e co
nver
satio
n th
at fo
llow
ed. O
rigin
of
the
cons
truct
in n
ew se
rvic
e fo
r the
pat
ient
, en
ds w
ith a
rant
abo
ut th
e ex
tent
to w
hich
th
ey a
re ‘p
erm
itted
’ to
deve
lop
thei
r ow
n id
eas f
or se
rvic
e im
prov
emen
t. Th
eir
initi
ativ
es w
ould
seem
, the
n, n
ot to
stan
d al
one
but b
e co
nnec
ted
by ‘i
nvis
ible
th
read
s’ th
roug
hout
the
trust
– w
hich
m
akes
the
oppo
rtuni
ty o
f inn
ovat
ing
and

- 324
-
RA
: Are
you
talk
ing
abou
t im
pact
of n
ewne
ss o
n pa
tient
s and
impa
ct o
f new
ness
on
staf
f?
Yes
, bec
ause
I th
ink
in th
is T
rust
as w
ell,
whi
ch h
ighl
ight
s the
poi
nt a
ctua
lly o
f one
of
the
thin
gs to
epi
dura
ls: t
hey
had
a pr
oble
m d
own
the
road
with
epi
dura
ls, s
udde
nly
it’s a
Tru
st w
ide
prob
lem
(i.e
. bec
ause
it is
a p
robl
em fo
r the
Hos
pita
l the
Hos
pita
l as
sum
es it
is a
pro
blem
for t
he w
hole
Tru
st) n
ot th
e fa
ct th
at w
e di
dn’t
have
a
prob
lem
, the
Hos
pita
l did
and
sudd
enly
“O
h m
y G
od, i
t is T
rust
-wid
e”. S
udde
nly
we
had
to h
ave
huge
blo
ody
wor
king
par
ties u
psta
irs, l
ike
30 o
dd p
eopl
e. A
nd w
e w
ere
like
“wel
l han
g on
a m
inut
e, w
e ar
e al
right
25
mile
s dow
n th
e ro
ad”,
but
sudd
enly
w
hat t
hey
are
tryin
g to
fois
t on
us w
e ha
ve h
ad to
real
ly sa
y “w
ell h
ang
on, w
e ar
e do
ing
it, w
e’ve
got
bes
t pra
ctic
e, u
se w
hat w
e us
e” a
nd th
at is
wha
t I w
ant a
m tr
ying
to
say
here
.
subs
eque
nt im
plem
enta
tion
very
com
plex
.
hosp
ital s
peci
fic, a
ny
Trus
t in
UK
C
ould
be
any
othe
r are
a, n
atio
n-w
ide
cont
ext –
ther
e ar
e lo
ts o
f ser
vice
s goi
ng o
n lik
e th
at, a
ll at
diff
eren
t sta
ges
It is
not
uni
que
to th
is te
am –
pos
sibl
y so
urce
s of o
rigin
atio
n of
idea
s.
pre
asse
ssm
ent,
no p
re
asse
ssm
ent
Dim
ensi
onal
ised
1 o
r 5 –
yes
or n
o –
Not
a h
elpf
ul d
imen
sion
oth
er th
an to
id
entif
y th
e co
nstru
ct?
No
disc
ussi
on. I
s ab
out s
ome
sort
of fo
cus o
f the
inno
vatio
n –
indi
vidu
al c
onsc
ious
ness
abo
ut th
e us
e to
w
hich
it is
put
. Wha
t is s
peci
al a
bout
pre
-as
sess
men
t? M
y fe
elin
g ab
out t
his
info
rman
t tha
t at t
he c
entre
of t
he
info
rman
t’s th
inki
ng is
not
the
inno
vatio
n bu
t rat
her t
he in
divi
dual
.
inpa
tient
/out
patie
nt
Thes
e pe
ople
…th
ey a
re c
omin
g to
be
in p
atie
nts…
othe
rs a
re ju
st b
eing
pre
-ass
esse
d
Loca
tion
of b
enef
it of
the
inno
vatio
n –
diff
eren
t con
stitu
enci
es o
f ben
efic
iary
.

- 325
-
APP
EN
DIX
EIG
HT
: PR
EL
IMIN
AR
Y C
OD
ING
TO
TH
E IN
NO
VA
TIO
N F
RA
ME
WO
RK
, IL
LU
STR
AT
IVE
E
XT
RA
CT
S FR
OM
TE
AM
A
C
ateg
orie
s and
D
imen
sion
s of
fram
ewor
k Li
tera
ture
and
com
men
tary
R
aw d
ata
trans
crip
t
New
ness
Ex
tent
Th
e di
chot
omis
atio
n ra
dica
l/inc
rem
enta
l is t
hat w
hich
is m
ost c
omm
only
ado
pted
in in
nova
tion
liter
atur
e to
des
crib
e th
e ex
tent
of n
ewne
ss. O
ther
sim
ilar l
abel
s inc
lude
: di
scon
tinuo
us c
hang
e(La
mbe
and
Spe
kman
, 199
7), c
ontin
uous
impr
ovem
ent (
Bes
sant
and
Caf
fyn,
199
7) a
nd re
volu
tiona
ry c
hang
e R
abso
n an
d D
eMar
co (1
999)
. The
ext
ent o
f an
inno
vatio
n is
the
degr
ee o
f cha
nge
repr
esen
ted
by th
e in
nova
tion.
Fou
r sub
-dim
ensi
ons o
f ext
ent h
ave
been
unc
over
ed in
the
empi
rical
dat
a: ri
sk, d
epar
ture
, dis
rupt
ion,
nov
elty
.
R
isk
The
inno
vatio
n lit
erat
ure
does
not
focu
s sig
nific
antly
on
the
conc
ept o
f ris
k,
Hea
ny (H
eany
, 198
3) is
a ra
re e
xam
ple,
for w
hom
risk
is a
t its
leas
t whe
re
mar
ket,
prod
uct a
nd p
roce
ss re
perc
ussi
ons a
re n
on-e
xist
ent o
r min
imis
ed.
I got
war
ned
by th
e he
alth
aut
horit
y th
at I
mig
ht g
et su
spen
ded
and
[that
] if I
was
ask
ed to
go
to
a m
eetin
g w
ith m
y ch
ief e
xecu
tive
and
med
ical
dire
ctor
[I sh
ould
] say
no
and
ring
us.
And
I ha
d a
gagg
ing
lette
r fro
m [s
enio
r man
ager
] with
who
m m
y bo
ats w
ere
burn
ed re
ally
so I
wro
te
back
a b
rave
lette
r… sh
e sa
id if
I ta
lked
out
of t
urn
she
wou
ld h
ave
to ta
ke it
to th
e ch
ief
exec
utiv
e of
the
regi
on. (
A1)
D
epar
ture
The
degr
ee o
f cha
nge
in th
e ac
tiviti
es o
f an
orga
nisa
tion
and
depa
rture
from
ex
istin
g pr
actic
es (L
ambe
& S
peke
man
, 199
7). I
ncre
men
tal i
nnov
atio
ns a
re
thos
e th
at re
sult
in a
low
deg
ree
of d
epar
ture
from
exi
stin
g pr
actic
es
(Dam
anpo
ur, 1
996)
. Whi
te a
nd G
raha
m (1
978)
con
side
r the
impa
ct o
f the
in
nova
tion
on b
usin
ess p
ract
ices
. Tor
natz
ky a
nd K
lein
(198
2) d
escr
ibe
this
as
the
degr
ee o
f con
sist
ency
with
exi
stin
g va
lues
, pas
t exp
erie
nces
and
nee
ds o
f ad
opte
r. B
eyer
and
Tric
e (1
978)
des
crib
ed th
is a
s ‘pe
rvas
iven
ess’
, the
pr
opor
tion
of to
tal b
ehav
iour
s occ
urrin
g w
ithin
an
orga
nisa
tion
that
are
ex
pect
ed to
be
affe
cted
by
the
inno
vatio
n, a
func
tion
of h
ow m
any
orga
nisa
tiona
l mem
bers
are
exp
ecte
d to
cha
nge
thei
r beh
avio
urs d
ue to
the
inno
vatio
n an
d ho
w m
uch
of th
e tim
e th
ose
invo
lved
will
be
beha
ving
in n
ew
way
s. It
is e
vide
nt th
at e
ach
of th
e in
nova
tions
in th
e sa
mpl
e re
pres
ent s
igni
fican
t de
partu
re fr
om e
xist
ing
prac
tice
– if
only
at t
he c
once
ptua
l lev
el
0h e
norm
ous [
emph
asis
ed].
Eve
n th
ough
the
scal
e w
as n
ot la
rge,
con
cept
ually
this
is m
assi
vely
ch
alle
ngin
g, m
assi
vely
. Li
ke, y
ou k
now
, it c
ontra
dict
s so
man
y cu
ltura
l thi
ngs a
bout
the
way
in
whi
ch th
e N
HS
has w
orke
d. F
rom
stra
tegi
c bo
dies
like
hea
lth a
utho
ritie
s rig
ht d
own
thro
ugh
to
oper
atio
nal s
taff
. (A
5)
D
isru
ptio
n
So-c
alle
d ra
dica
l inn
ovat
ions
impa
ct e
xist
ing
syst
ems i
n a
disr
uptiv
e m
anne
r (R
abso
n &
DeM
arco
, 199
9), c
onve
rsel
y, in
nova
tions
that
are
not
, do
not.
Sim
ilar t
o w
hat B
eyer
and
Tric
e (1
978)
cal
led
‘mag
nitu
de’:
the
degr
ee o
f di
spla
cem
ent o
f exi
stin
g or
gani
satio
nal s
tate
s tha
t the
inno
vatio
n im
plie
s -
stru
ctur
al, p
erso
nnel
, fin
anci
al e
tc.
But
wha
t the
y di
d no
t wan
t to
do w
as to
let g
o of
it [i
.e. m
aint
ain
the
stat
us q
uo].
And
ther
e w
e w
ere,
sudd
enly
talk
ing
abou
t mov
ing
peop
le in
to a
sing
le m
anag
ed te
am a
nd a
ctua
lly ta
king
th
em o
ut o
f the
ir em
ploy
er T
rust
to p
ut th
em in
to a
diff
eren
t one
. (A
2)

- 326
-
N
ovel
ty
Nov
elty
rece
ives
surp
risin
gly
little
dire
ct a
ttent
ion
in th
e lit
erat
ure,
per
haps
be
caus
e it
is a
take
n fo
r gra
nted
feat
ure
of in
nova
ting.
Whe
re it
is c
onsi
dere
d it
rece
ives
fairl
y co
nsis
tent
trea
tmen
t, th
at is
the
perc
eive
d ch
ange
s in
the
stat
us q
uo (Z
altm
an e
t al.
197
3; K
ing,
199
2; W
est a
nd A
nder
son,
199
6;
Mon
tgom
ery,
199
0; V
oss e
t al.
199
9). I
t tak
es a
bro
ader
per
spec
tive
than
de
partu
re a
nd c
onsi
ders
a w
ider
con
text
of i
nnov
atio
n th
an e
xist
ing
prac
tice.
…an
d sa
id “
Tell
us w
hat y
our v
isio
n is
and
how
we
can
do it
”, w
ell,
we
didn
’t kn
ow h
ow w
e co
uld
do it
, to
be fr
ank.
We
knew
that
we
need
ed so
meh
ow to
inte
rtwin
e ev
eryb
ody
that
was
pa
rt of
pal
liativ
e ca
re, a
nd th
at w
as a
com
plet
ely
alie
n co
ncep
t, pa
rticu
larly
her
e. (
A3)
Idea
tion
Wha
t are
the
orig
ins o
f the
idea
s tha
t for
m th
e ba
sis o
f the
inno
vatio
n? S
ucce
ssfu
l inn
ovat
ion
can
have
its r
oots
in c
reat
ivity
but
this
is n
ot a
nec
essa
ry a
ntec
eden
t (A
mab
ile e
t al.
19
96) s
o, th
e di
men
sion
s of i
deat
ion
rang
e fr
om a
who
lly o
rigin
al id
ea to
bor
row
ed id
eas.
Whi
te a
nd G
raha
m (1
978)
dev
elop
the
conc
ept ‘
inve
ntiv
e m
erit’
. At t
he h
eart
of
inno
vatio
n is
a c
ombi
natio
n of
new
kno
wle
dge
or re
com
bina
tion
of e
xist
ing
know
ledg
e (N
onak
a, 1
990;
Non
aka
and
Take
uchi
, 199
5; N
orm
an a
nd S
trein
er, 2
000)
. Pe
lz (1
983)
id
entif
ies t
hree
dim
ensi
ons o
f orig
inal
ity: o
rigin
atio
n, a
dapt
atio
n, b
orro
win
g.
O
rigin
atio
n
A fi
rst t
ime
solu
tion
to a
pro
blem
with
out b
enef
it of
sim
ilar,
prio
r exa
mpl
es.
In th
e de
velo
pmen
t of t
he in
nova
tions
for w
hich
they
won
aw
ards
team
s B &
C
did
smal
ler o
nes,
som
e of
whi
ch w
ere
borr
owed
, oth
er p
arts
who
lly
orig
inal
. Tea
m A
dog
gedl
y pu
rsue
d an
orig
inal
inno
vatio
n fo
r 2 y
ears
.
…ho
w [w
e] in
tegr
ated
it w
as o
urs,
self-
gene
rate
d. A
nd it
gre
w fr
om th
inki
ng “
wel
l ins
tead
of
havi
ng M
acm
illan
nur
ses i
n 5
Trus
ts le
t’s h
ave
them
in o
ne…
actu
ally
giv
e th
em so
me
spec
ialis
t m
anag
emen
t so
that
they
hav
e go
t a m
anag
er w
ho k
now
s wha
t it i
s the
y do
and
und
erst
ands
w
hat t
he p
ress
ures
are
. It g
rew
from
that
. (A
2)
Bor
row
ing
Wel
l dev
elop
ed so
lutio
ns to
the
prob
lem
are
foun
d el
sew
here
and
are
cop
ied
with
littl
e or
no
chan
ge.
The
data
seem
s to
sugg
est t
hat T
eam
C’s
inno
vatio
n w
as b
orro
wed
com
pare
d to
thos
e of
A &
B w
hich
relie
d m
ore
on a
dapt
atio
n an
d th
eir o
wn
orig
inat
ion.
Th
e da
ta g
athe
ring
thou
gh, d
id n
ot se
ek to
diff
eren
tiate
in te
rms o
f deg
ree,
ju
st to
iden
tify
salie
nt fe
atur
es fo
r a su
rvey
tool
. Thi
s I th
ink
it ha
s don
e.

- 327
-
Si
gnifi
canc
e
Scop
e
The
fund
amen
tal n
otio
n un
derp
inni
ng th
is d
imen
sion
of i
nnov
atio
n is
the
natu
re o
f th
e lin
kage
bet
wee
n th
e in
nova
tion
and
its e
nviro
nmen
t. Th
at is
, to
wha
t ext
ent c
an
the
inno
vatio
n st
and-
alon
e an
d be
pur
sued
inde
pend
ently
, doe
s its
intro
duct
ion
requ
ire c
hang
es e
lsew
here
in th
e sy
stem
? C
hesb
orou
gh a
nd T
eece
(199
6) c
all t
hese
au
tono
mou
s and
syst
emic
inno
vatio
ns. G
oodm
an (1
981)
spec
ified
indi
vidu
al a
nd
syne
rgis
tic in
nova
tions
. Ind
ivid
ual i
nnov
atio
ns a
ffec
t onl
y a
sing
le fu
nctio
nal a
rea
and
do n
ot a
ffec
t oth
er fu
nctio
ns o
r cau
se w
ider
cha
nge.
A sy
nerg
istic
inno
vatio
n is
on
e th
at re
quire
s tha
t man
y fu
nctio
ns b
e af
fect
ed. A
t a ra
ther
fine
r lev
el, u
sing
the
prod
uct a
s the
uni
t of a
naly
sis a
s opp
osed
to th
e or
gani
satio
n, H
ende
rson
and
Cla
rk
(199
0) d
escr
ibe
com
pone
nt a
nd a
rchi
tect
ural
inno
vatio
ns. W
ith th
e fo
rmer
, one
co
mpo
nent
sim
ply
repl
aces
ano
ther
, but
arc
hite
ctur
al in
nova
tions
requ
ire th
at w
hole
sy
stem
s be
reco
nfig
ured
Sim
ilarly
, Nor
d an
d Tu
cker
(Nor
d an
d Tu
cker
, 198
7)
desc
ribe
inno
vatio
ns b
y th
e de
gree
to w
hich
they
con
cern
the
maj
or d
ay to
day
wor
k of
the
orga
nisa
tion.
A
5.1
sugg
ests
a w
ide
scop
e in
that
beh
avio
ur c
hang
e ha
s hap
pene
d w
ithin
the
cont
ext o
f the
inno
vatin
g gr
oup.
How
ever
, A5.
2 al
erts
us t
o be
aw
are
that
alth
ough
th
ere
is e
vide
nce
to su
gges
t wid
e sc
ope,
oth
er e
vide
nce
mig
ht in
dica
te a
dis
pers
ed
and
wid
er si
gnifi
canc
e.
So th
e no
tion
of th
em a
ll co
min
g in
to th
e ro
om a
nd…
writ
ing
it up
on
the
boar
d w
hich
pa
tient
s nee
d to
be
seen
toda
y an
d w
ho is
goi
ng to
see
them
-- y
ou k
now
that
is a
leve
l of
colla
bora
tion
at a
n op
erat
iona
l lev
el th
at th
e se
rvic
e ha
d ne
ver k
now
n. (A
5.1)
0h
eno
rmou
s [em
phas
ised
]. E
ven
thou
gh th
e sc
ale
was
not
larg
e, c
once
ptua
lly th
is is
m
assi
vely
cha
lleng
ing,
mas
sive
ly.
Like
, you
kno
w, i
t con
tradi
cts s
o m
any
cultu
ral t
hing
s ab
out t
he w
ay in
whi
ch th
e N
HS
has w
orke
d. F
rom
stra
tegi
c bo
dies
like
hea
lth
auth
oriti
es ri
ght d
own
thro
ugh
to o
pera
tiona
l sta
ff. (
A5.
2)
Com
plex
ity
Pelz
(198
5) d
escr
ibes
com
plex
ity a
s “t
he d
egre
e to
whi
ch a
n in
nova
tion
is p
erce
ived
as
rela
tivel
y di
ffic
ult t
o un
ders
tand
and
use
” (p
p. 2
64) w
hich
itse
lf is
a fu
nctio
n of
its
com
posi
tion
(how
man
y pa
rts m
ake
it up
and
how
do
they
link
toge
ther
: so,
for
exam
ple,
the
com
plex
ity o
f a te
chni
cal i
nnov
atio
n co
uld
be a
sses
sed
alon
g a
cont
inuu
m fr
om ti
ght p
acka
ges o
f int
er-li
nked
par
ts to
tech
nica
lly lo
ose
com
posi
tes
of in
depe
nden
t par
ts th
at c
ould
be
adop
ted
sepa
rate
ly).
Sim
ilarly
adm
inis
trativ
e or
pr
oces
sual
com
plex
ity w
ould
rang
e fr
om h
omog
enou
s inn
ovat
ions
invo
lvin
g on
ly a
fe
w u
nits
to h
eter
ogen
eous
one
s req
uirin
g co
-ord
inat
ion
amon
g m
any
units
. Ex
cerp
t illu
stra
tes h
ow in
form
ants
per
ceiv
e co
mpl
exity
as s
omet
hing
that
em
anat
es
from
the
inno
vatio
n. E
ach
inno
vatio
n is
des
crib
ed a
s com
plex
bec
ause
of t
he ra
nge
of im
pact
, the
ripp
les f
rom
the
pebb
le in
the
pond
ext
end
a lo
ng w
ay a
nd re
quire
the
cons
ciou
s int
egra
tion
or in
corp
orat
ion
of o
ther
uni
ts a
nd c
onsi
dera
tions
.
I thi
nk it
is th
e cl
osed
uni
vers
e w
here
in th
ey b
ring
ever
ybod
y to
geth
er in
pal
liativ
e ca
re.
And
the
thin
g th
at th
e ho
spic
es p
artic
ular
ly li
ke is
that
they
are
giv
en a
stak
e an
d so
me
say
in th
e w
hole
of t
he w
ay in
whi
ch p
allia
tive
care
wor
ks n
ot ju
st th
eir h
ospi
ce b
it of
it.
So th
ey h
ave
som
e sa
y in
the
way
NH
S re
sour
ces a
re u
sed
and
Mac
mill
an re
sour
ces a
re
used
, not
just
how
oth
er h
ospi
ce re
sour
ces a
re u
sed.
And
I th
ink
it is
that
hol
istic
ap
proa
ch (A
5)
V
isib
ility
Th
e ex
tent
to w
hich
inno
vatio
n is
obs
erva
ble
by o
ther
s (W
olfe
, 199
4).
I thi
nk it
is n
ot so
muc
h w
hat t
hey
will
not
ice
it is
wha
t the
y w
ill n
ot n
otic
e…I d
on’t
parti
cula
rly e
ver w
ant a
gain
to h
ave
a pa
tient
eve
r say
to m
e “d
on’t
all y
ou p
eopl
e ta
lk to
ea
ch o
ther
?” (A
1)

- 328
-
Prof
ile
Prof
ile e
choe
s vis
ibili
ty, b
ut, w
here
as v
isib
ility
focu
ses o
n th
e in
nova
tion,
pro
file
cons
ider
s whe
re th
e in
nova
tion
rubs
off
on
peop
le, i
nstit
utio
ns a
nd so
forth
. The
re
flect
ed g
lory
. The
idea
rece
ives
littl
e tre
atm
ent i
n th
e lit
erat
ure,
thou
gh M
ohr’
s (1
969)
con
cept
of s
tatu
s cap
ture
s som
e of
the
idea
: the
ext
ent t
o w
hich
an
inno
vatio
n is
ado
pted
in th
e qu
est o
f pre
stig
e ra
ther
than
pro
fit o
r eff
ectiv
enes
s.
…ye
s, I t
hink
it w
as [t
he p
ursu
it of
per
sona
l am
bitio
n]…
I thi
nk fo
r [na
me]
it w
as.
And
I th
ink
that
that
may
be
unfa
ir…B
ut I
thin
k it
was
thou
ght t
hat i
t was
ther
e to
mak
e a
nam
e,
to m
ake
a di
ffer
ence
, to
mak
e a
chan
ge a
nd th
at it
was
not
abo
ut p
atie
nt c
are.
(A
4)
Effe
ctiv
enes
s
Ada
ptab
ility
The
abi
lity
to re
fine,
ela
bora
te a
nd m
odify
an
inno
vatio
n ac
cord
ing
to th
e ne
eds a
nd
obje
ctiv
es o
f the
impl
emen
tor,
can
be fl
exib
le o
r inf
lexi
ble
(Wol
fe, 1
994)
. Not
a
grea
t dea
l of e
vide
nce
of a
dapt
abili
ty b
eing
a fe
atur
e of
thes
e in
nova
tions
. Thi
s m
ight
sugg
est t
hat s
ucce
ssfu
l inn
ovat
ions
are
ver
y sp
ecifi
cally
targ
eted
to th
e pr
oble
m to
the
exte
nt th
at th
ey d
o no
t nee
d to
be
flexi
ble,
they
just
nee
d to
solv
e.
…an
d w
hat w
e ha
ve d
ecid
ed to
do
is w
e ar
e go
ing
to b
uy in
to th
e he
alth
serv
ice
pack
age
(dat
abas
e sy
stem
) and
ada
pt it
to su
it ou
rsel
ves a
s bes
t we
can.
It is
not
a p
erfe
ct so
lutio
n bu
t I fi
rmly
bel
ieve
it is
the
near
est w
e ar
e go
ing
to g
et a
nd, f
rom
a fi
nanc
ial p
oint
of v
iew
w
e ar
e go
ing
to sa
ve o
urse
lves
£10
0,00
0 a
year
on
softw
are
– an
d th
at is
a lo
t of c
offe
e m
orni
ngs!
(A3)
.
Rel
ativ
e ad
vant
age
The
exte
nt to
whi
ch a
n in
nova
tion
is p
erce
ived
as b
eing
bet
ter t
han
the
idea
it
supe
rsed
es (
Wol
fe, 1
994)
. Whi
te a
nd G
raha
m (1
978)
dev
elop
the
sim
ilar i
dea
of
mar
ket m
erit,
whe
ther
or n
ot fi
nal d
eman
d w
ill b
e ex
pand
ed b
y th
e in
nova
tion.
Fo
r the
inno
vatio
n th
at is
onl
y co
ncep
tual
(Tea
m A
) no
codi
ng to
this
nod
e –
seem
s re
ason
able
, so
a va
lidat
ion
of th
e co
nstru
ct a
nd it
s app
licat
ion?
…I h
ave
acce
ss to
the
heal
th se
rvic
e in
a w
ay th
at m
ost [
…] C
hief
Exe
cutiv
es d
o no
t ha
ve. I
hav
e ac
cess
to a
ll th
at h
ealth
serv
ice
mon
ey…
so I
have
muc
h be
tter a
cces
s to
the
peop
le I
need
to h
ave
acce
ss to
(A4)
.
Act
ual
Ope
ratio
n
The
exte
nt to
whi
ch th
e in
nova
tion
achi
eved
its p
urpo
se (P
elz,
198
3). D
iffer
ent f
rom
re
lativ
e ad
vant
age
in th
at it
con
side
rs th
e in
nova
tion
in th
e co
ntex
t of i
ts o
rigin
al
aim
. An
inno
vatio
n m
ay n
ot h
ave
achi
eved
all
that
was
inte
nded
for i
t (in
its a
ctua
l op
erat
ion)
thou
gh it
may
be
a co
nsid
erab
le im
prov
emen
t on
wha
t wen
t bef
ore
(rel
ativ
e ad
vant
age)
.
I thi
nk m
ore
[pat
ient
s] a
re b
eing
seen
and
they
are
bei
ng se
en q
uick
er.
The
acce
ss to
the
serv
ice
is b
ette
r and
cle
arer
. (A
7)

- 329 -
APPENDIX NINE: EARLY RENDITIONS OF THE FRAMEWORK
Category
Properties
Descriptive Categories, innovation type
Administrative, Social, Technical, Process, Product, Market, Ancillary, Programmed, Physical Properties.
Substantive Categories, innovation perceived to be about
Newness, Significance, Effectiveness.
Substantive sub-categories, perceptions consist of
Adaptability, Architectural, Autonomous, Central, Compatibility, Complexity, Component, Continuous improvement, Cost, Disruptive, Divisibility, Evolutionary, Incremental, Individual, Instrumental, Magnitude, Modular, Observability, Peripheral, Pervasiveness, Radical, Revolutionary, Risk, Scope, Synergistic, Systemic, Ultimate, Uncertainty.
First rendering (December 2000)
Innovation
type
Innovation
essence
Innovation
newness
Innovation significance
Innovation
effectiveness
Administrative Essentiality Architectural Centrality Adaptability
Process Autonomous Compatibility Systemic
Technical Radical Complexity Operational merit
Product Inventive merit Divisibility Market merit
Ancillary Embodiment merit Magnitude
Physical properties Observability
Programmed Pervasiveness
Risk
Status
Uncertainty
Second rendering (December 2001)

- 330 -
APPENDIX TEN: INTERVIEW PROTOCOL AND INDICATIVE LINES OF ENQUIRY, PHASE III Idea How did the idea develop? How did the idea change over time? Screening of ideas? Process - Characterise the process for me – linear, sequential, patterned, routine,
evolutionary, conflict ridden, confrontational, synthesising, goal driven… Was it at all predictable?
- Can you recall or describe a sequence of events/activities that you engaged in? Particularly with regard to core or enabling processes? Did individual events serve to motivate or demotivate?
- Put some date parameters on it? How long did it all take?- - Was this a formal project, what degree of structure did it have. It took place within
an existing team, not one that had been specifically established for the purpose. Any clear priorities? How much a part did deliberate activities play – were there any deliberate activities – did you set off in pursuit of deliberate change?
- Was there anything about the process that was recurrent – reviews, and so forth. What structure was built into the process
Climate - What’s the climate like for change and innovation – in the team and in the
hospital/trust. A creative environment? Senior management support. - Were there ever occasions when you did not know what to do next? Team - Internal and external team issues. Were you able to do this in isolation or was there
a reliance on external influences. What is and was team morale like during the process?
- As a clinician/consultant to what extent do you regard it as part of your job to bring about change. I would not, I don’t think, have expected to see it listed in a typical job description. Do you do it in extremis?
- Describe your personal style. Any significant personnel changes? - Is there anything that you would have done differently? Incidents - Recall any significant incidents. What hampered and what enabled? Can you say...
“If it were not for x y z we would not have been able to achieve what we did”? - Was there a path? Was it defined beforehand or only recognisable with hindsight? Interview guide (to respondent). Indicative lines of enquiry. Process research concerns understanding how things evolve over time and why they evolve in that way. Process data is essentially a story about what happened, and who did what and when and with what sort of impact. It is about events, activities and

- 331 -
choices made over time. I am interested in the sequence and nature of the events that lead to a specific outcome, in your case…NAME OF INNOVATION Innovation core processes: areas to explore - How did the need for an innovative solution manifest itself? Trigger
mechanisms. What were the origins of possible solutions? Where did the ideas come from, purposeful exploration, serendipity…?
- How were potential solutions tabled for consideration, appraised and evaluated? Intra-group communications and knowledge transfer, role of external influences…
- Nature of the selection/adoption decision. Basis for decision making – alignment with organisational imperatives, cost, utility, acceptability…
- How was the innovation implemented? Testing, pilot study, suck-it-and-see, routinisation of the change, co-existence of the old and the new…
- Description of overall process. What were the characteristics of the process: managed, random, straightforward, experimental, trial-and-error...? Are different phases identifiable? What distinguishes the phases one from the others?
Innovation enabling processes - Visioning. Was there a vision of the end-state that motivated the activities?
Where did this come from? Collective understanding and concurrence with vision? Evolution of vision as process progressed – did it change? How, why and with what consequences.
- Participative safety. Explore extent to which participants felt safe in engaging in a process of change. Nature of environmental characteristics: judgmental vs non-judgmental, supportive vs non supportive, cohesiveness vs non cohesiveness, level of collaboration, relative strength of social ties…
- Change orientation. Exploration of the way in which the team manifests its concern for the task. Can the team demonstrate tolerance of competing perspectives, divergent thinking, individuals empowered to challenge the status quo, independence from external interference?
- Support for innovation. Is there a climate that supports individuals and teams in thinking about and developing new and improved ways of doing things?
- Evidence of presence or absence of articulated or enacted support for innovation. Might exist at the level of the individual, intra-team or outside the team.