PERCEPTIONS OF HIGHWAY MAINTENANCE IN ... EXECUTIVE SUMMARY Trained interviewers at the Computer...
73
1 PERCEPTIONS OF HIGHWAY MAINTENANCE IN MONTANA IN 2000: THE RESULTS OF A TELEPHONE SURVEY FINAL REPORT Prepared for: STATE OF MONTANA DEPARTMENT OF TRANSPORTATION MAINTENANCE DIVISION Prepared By: Joe W. Floyd, Ph.D. Professor of Sociology Montana State University, Billings October, 2000
Transcript of PERCEPTIONS OF HIGHWAY MAINTENANCE IN ... EXECUTIVE SUMMARY Trained interviewers at the Computer...

1
PERCEPTIONS OF HIGHWAY MAINTENANCE IN MONTANA IN
2000: THE RESULTS OF A TELEPHONE SURVEY
FINAL REPORT
Prepared for:
STATE OF MONTANA
DEPARTMENT OF TRANSPORTATION MAINTENANCE DIVISION
Prepared By:
Joe W. Floyd, Ph.D. Professor of Sociology
Montana State University, Billings
October, 2000

ii
TECHNICAL REPORT DOCUMENTATION PAGE
1 Report No FHWA/MT-00/8136C 2. Government Accession No. 3. Recipient's Catalog No.
4 Title and Subtitle
Perceptions of Highway Maintenance in Montana in 2000: The Results of a Telephone Survey
5 Report Date October 2000
6 Performing Organization Code
7 Author(s)
Joe W. Floyd, Ph.D. 8 Performing Organization Report No
9 Performing Organization Name and Address
Department of Sociology Montana State University, Billings Billings MT 59101 -0298
10. Work Unit No
11. Contract or Grant No 8136C 12 Sponsoring Agency Name and Address Research, Development, & Technology Transfer Program Montana Department of Transportation 2701 Prospect Avenue P0 Box 201001 Helena MT 59620-1 001
13. Type of Report and Period Covered
Final September 2000 - October 2000
14. Sponsoring Agency code 5401 15. Supplementary Notes Research performed in cooperation with the Montana Department of Transportation and the US Department of Transportation, Federal Highway Administration.
16. Abstract Trained interviewers at the Computer Assisted Telephone Interviewing Laboratory at Montana State University, Billings completed 1,005 interviews with randomly selected adult residents of Montana between September 15th and September 17th 2000 and between September 29th and October 4th 2000 for the purposes of obtaining the perceptions the respondents held about the maintenance of interstate and state highways in Montana and comparing those perceptions to perceptions held by the respondents to a 1998 survey on the same topic. For the purposes of the survey, highway maintenance was divided into eight categories: winter maintenance, maintaining a smooth highway surface, maintenance of roadsides, maintenance of signs, debris removal, rest stop maintenance, striping maintenance, and winter road conditions reports.
When respondents were asked to rate the current state of each of these activities on a I to 4 scale where I = poor, 2 = fair, 3 good and 4 = excellent, signage was rated highest with a mean of 3.02, winter roadway information was rated second at 2.91, winter maintenance third at 2.77. roadside maintenance fourth at 2 71, striping fifth at 2.70, debris removal sixth at 2.65, rest stop maintenance third at 2.58, and smoothness of road surfaces last at 2.44. The rating for debris removal decreased significantly from 2.72 in 1998 to 2.64 in 2000. The rating for highway striping decreased significantly from 2.78 in 1998 to 2.70 in 2000. The rating for rest stop maintenance decreased significantly from 2.81 in 1198 to 2.58 in 2000. And, the rating for highway surfaces increased significantly from 2.31 in 1998 to 2.44 in 2000.
When respondents were asked how important each of these activities were to them on a scale of I to 4 where I = not important, 2 = somewhat important. 3 = important, and 4 = very important, winter maintenance was rated most important with a mean importance rating of 3.58, followed by striping maintenance (3.46), debris removal (3.37), surface smoothness (3.29), signage (3.28), winter roadway information (3.22), rest stop maintenance (3.07), and roadside maintenance (3.01). The mean perceived importance of debris removal increased significantly from 3.31 in 1998 to 3.37 in 2000; the mean importance of winter roadway information decreased significantly from 3.36 in 1998 to 3.22 in 2000; and the mean importance for rest stop maintenance decreased significantly from 3.20 in 1998 to 3.07 in 2000.
When respondents were asked to think about the allocation of MDT resources and assign a resource priority of low (1), medium (2), moderately high (3), or very high (4) to each activity, winter maintenance received the highest resource priority rating (3.54) followed by striping (3.27), winter roadway information (3.22), surface smoothness (3.12), debris removal (3.10), rest stop maintenance (3.00), signage (2.92) and roadside maintenance (2.59). The decreases from 1998 to 2000 in the priorities assigned to signage (3.03 to 2.92) and in the priorities assigned winter roadway information (3.32 to 3.22) were statistically significant.
Finally, these ratings were combined into a composite variable for each of the maintenance activities. The composite variable provides an indication of the level of attention and resources the respondents believed each maintenance activity should receive from MDT. According to the respondents, MDT should now pay attention and provide resources to maintenance activities on interstates and state highways in Montana in the following order: winter maintenance, highway striping, surface smoothness, debris removal, highway signage, winter roadway information, roadside maintenance and rest stop maintenance.
This represent a slight change from the order of composite variables resulting from the 1998 survey which was: winter maintenance, surface smoothness, highway striping, debris removal, signage, winter roadway information, roadside maintenance, and rest stop maintenance. The decrease in the mean value of the Surface Smoothness composite variable from 9.07 in 1998 to 8.92 in 2000 was statistically significant as was the increase in mean value of the Debris Removal composite variable from 8.56 in 1998 to 8.79 in 2000.
17 Key Words Montana, maintenance, survey, external customer, satisfaction, perception
18. Distribution Statement Unrestricted. This document is available through the National Technical Information Service, Springfield, VA 21161.
19 Security classif. (of this report) I 20. Security classif. (of this Unclassified I Unclassified
21. No. of Pages 76 22. Price

iii
DISCLAIMER STATEMENT
The opinions, findings, and conclusions expressed in this publication are those of the author and not necessarily those of the Montana Department of Transportation or the Federal Highway Administration.
ALTERNATIVE FORMAT STATEMENT
MDT attempts to provide reasonable accommodations for any known disability that may interfere with a person participating in any service, program, or activity of the Department. Alternative accessible formats of this document will be provided upon request. For further information, call (406) 444-6269 or TDD (406) 444-7696
iv
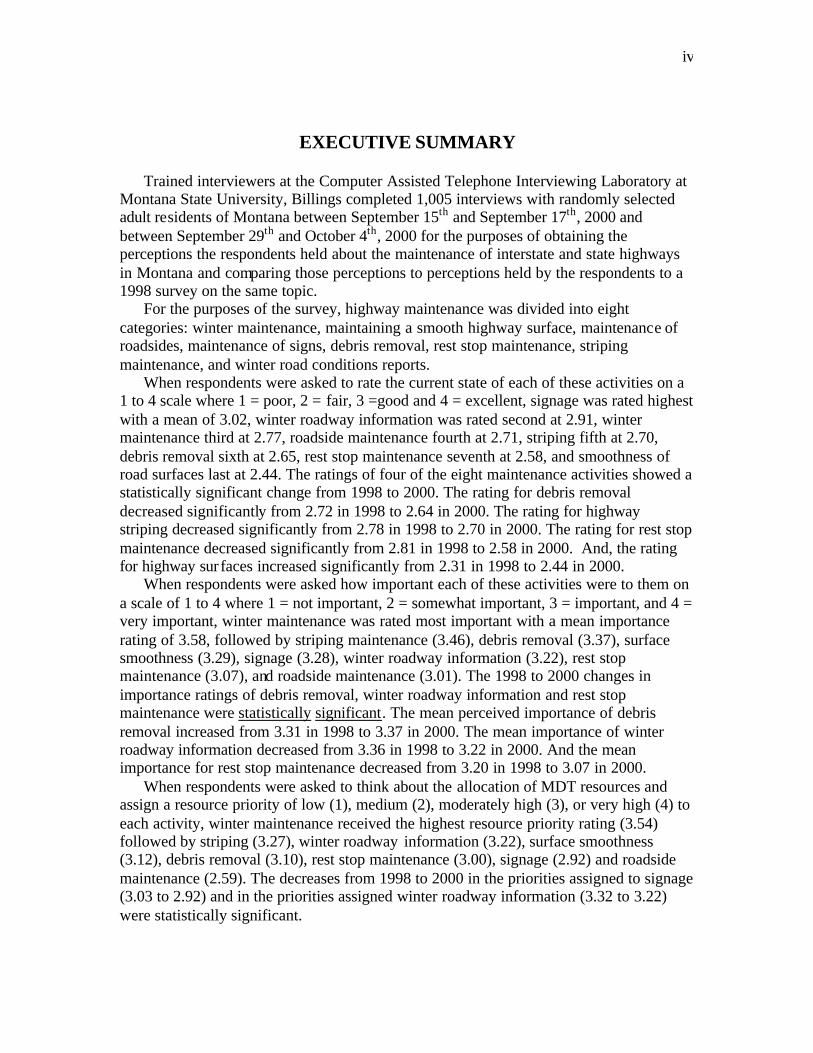
EXECUTIVE SUMMARY
Trained interviewers at the Computer Assisted Telephone Interviewing Laboratory at Montana State University, Billings completed 1,005 interviews with randomly selected adult residents of Montana between September 15th and September 17th, 2000 and between September 29th and October 4th, 2000 for the purposes of obtaining the perceptions the respondents held about the maintenance of interstate and state highways in Montana and comparing those perceptions to perceptions held by the respondents to a 1998 survey on the same topic. For the purposes of the survey, highway maintenance was divided into eight categories: winter maintenance, maintaining a smooth highway surface, maintenance of roadsides, maintenance of signs, debris removal, rest stop maintenance, striping maintenance, and winter road conditions reports. When respondents were asked to rate the current state of each of these activities on a 1 to 4 scale where 1 = poor, 2 = fair, 3 =good and 4 = excellent, signage was rated highest with a mean of 3.02, winter roadway information was rated second at 2.91, winter maintenance third at 2.77, roadside maintenance fourth at 2.71, striping fifth at 2.70, debris removal sixth at 2.65, rest stop maintenance seventh at 2.58, and smoothness of road surfaces last at 2.44. The ratings of four of the eight maintenance activities showed a statistically significant change from 1998 to 2000. The rating for debris removal decreased significantly from 2.72 in 1998 to 2.64 in 2000. The rating for highway striping decreased significantly from 2.78 in 1998 to 2.70 in 2000. The rating for rest stop maintenance decreased significantly from 2.81 in 1998 to 2.58 in 2000. And, the rating for highway sur faces increased significantly from 2.31 in 1998 to 2.44 in 2000. When respondents were asked how important each of these activities were to them on a scale of 1 to 4 where 1 = not important, 2 = somewhat important, 3 = important, and 4 = very important, winter maintenance was rated most important with a mean importance rating of 3.58, followed by striping maintenance (3.46), debris removal (3.37), surface smoothness (3.29), signage (3.28), winter roadway information (3.22), rest stop maintenance (3.07), and roadside maintenance (3.01). The 1998 to 2000 changes in importance ratings of debris removal, winter roadway information and rest stop maintenance were statistically significant. The mean perceived importance of debris removal increased from 3.31 in 1998 to 3.37 in 2000. The mean importance of winter roadway information decreased from 3.36 in 1998 to 3.22 in 2000. And the mean importance for rest stop maintenance decreased from 3.20 in 1998 to 3.07 in 2000. When respondents were asked to think about the allocation of MDT resources and assign a resource priority of low (1), medium (2), moderately high (3), or very high (4) to each activity, winter maintenance received the highest resource priority rating (3.54) followed by striping (3.27), winter roadway information (3.22), surface smoothness (3.12), debris removal (3.10), rest stop maintenance (3.00), signage (2.92) and roadside maintenance (2.59). The decreases from 1998 to 2000 in the priorities assigned to signage (3.03 to 2.92) and in the priorities assigned winter roadway information (3.32 to 3.22) were statistically significant.

v
Finally, these ratings were combined into a composite variable for each of the maintenance activities. The composite variable provides an indication of the level of attention and resources the respondents believed each maintenance activity should receive from MDT. The values of the composite variables as well as the rating of the components of each variable are summarized in the following table.
COMPOSITE VARIABLE MEAN BY RANK OF RATING, IMPORTANCE, AND PRIORITY
Composite Rating Importance Priority Mean Rank Rank Rank Winter Maint 9.10 3 1 1 Striping 8.99 5 2 2 Surface Smoothness 8.92 8 4 4 Debris Removal 8.79 6 3 5 Signage 8.14 1 5 7 Winter Road Info 7.96 2 6 3 Roadside Maint. 7.79 4 8 8 Rest Stop Maint. 7.76 7 7 6 According to the respondents, MDT should now pay attention and provide resources to maintenance activities on interstates and state highways in Montana in the following order: winter maintenance, highway striping, surface smoothness, debris removal, highway signage, winter roadway information, roadside maintenance and rest stop maintenance. This represent a slight change from the order of composite variables resulting from the 1998 survey which was: winter maintenance, surface smoothness, highway striping, debris removal, signage, winter roadway information, roadside maintenance, and rest stop maintenance. The decrease in the mean value of the Surface Smoothness composite variable from 9.07 in 1998 to 8.92 in 2000 was statistically significant as was the increase in mean value of the Debris Removal composite variable from 8.56 in 1998 to 8.79 in 2000.

vi
TABLE OF CONTENTS
Table of Tables …………………………………………………………………… xii Table of Figures …………………………………………………………………… xiii Introduction ………………………………………………………………………. 1 Methodology ………………………………………………………………………… 1 Findings ……………………………………………………………………………… 2 Who Are the Respondents ……………………………………………………….. 2 Demographic Characteristics ………………………………………………… 2 County and Administrative District of Residence …………………………… 4 Travel Characteristics ………………………………………………………… 7 General Perception of Montana Highways and Interstates ………………….. 9 Rating of Montana Highway Maintenance …………………………………… 9 Statistically Significant Relationships Between General Rating of Montana Highway Maintenance and Demographic/Travel Variables ……. 10 Comparison of 1998 and 2000 General Rating of Montana Highway Maintenance ………………………………………….. 11 Respondents’ Opinion of the Personal Importance of Highway Maintenance ……………………………………………………. 13 Statistically Significant Relationship Between Importance of Highway Maintenance and Demographic/Travel Variables ……………... 13 Comparison of 1998 and 2000 Importance of Montana Highway Maintenance Rating …………………………………. 14 General Comparison of Montana Highways with Highways in Other States … 14 Statistically Significant Relationships Between Comparison of Montana Highway Maintenance and Highway Maintenance in Other States and Administrative District ……….…………………………………………. 14 Statistically Significant Relationships Between Comparison of Montana Highway Maintenance and Highway Maintenance in Other States and Demographic/Travel Variables …………………………………………. 15 Comparison of 1998 and 2000 Assessment of Montana Highway Maintenance Versus Highway Maintenance in Other States ………………... 15

vii
Comparison of Montana Winter Maintenance with Winter Maintenance in Other States and Administrative Districts ………………………………… 15 Statistically Significant Relationships Between Comparison of Montana Highway Winter Maintenance and Highway Winter Maintenance in Other States and Administrative Districts .……………………15 Statistically Significant Relationships Between Comparison of Winter Maintenance and Demographic/Travel Variables …………………………… 15 Comparison of 1998 and 2000 Assessment of Montana Highway Winter Maintenance Versus Winter Maintenance in Other States …………... 15 Comparison of Montana Rest Area Maintenance and Rest Area Maintenance in Other States ……………………………………………….… 16 Statistically Significant Relationship Between Rest Area Maintenance Comparison and Demographic/Travel Variables ……………………………. 16 Comparison of 1998 and 2000 Assessment of Montana Rest Area Maintenance Versus Rest Area Maintenance in Other States ……………….. 16 Respondents Rating of Eight Maintenance Activities ……………………….. 16 Statistically Significant Relationships Between Rating of Maintenance Activities and Administrative District ………………………………………. 17 Statistically Significant Relationships Between Rating of Signage and Demographic/Travel Variables …………………………………………. 17 Statistically Significant Relationships Between Rating of Winter Roadway Information and Demographic/Travel Variables …………. 17 Statistically Significant Relationships Between Winter Maintenance and Demographic/Travel Variables …………………… 18 Statistically Significant Relationships Between Rating of Roadside Maintenance and Demographic/Travel Variables ………………… 18 Statistically Significant Relationships Between Rating of Highway Striping and Demographic/Travel Variables ……………………… 18 Statistically Significant Relationships Between Rating of Debris Removal and Demographic/Travel Variables ……………………….. 18

viii
Statistically Significant Relationships Between Rating of Rest Stop Maintenance and Demographic/Travel Variables …………………. 18 Statistically Significant Relationships Between Rating of Surface Smoothness and Demographic/Travel Variables …………………... 19 Comparison of 1998 and 2000 Ratings of the Eight Maintenance Activities … 19 Importance of Highway Maintenance Activities to the Respondents ……… 19 Statistically Significant Relationships Between Importance of Maintenance Activities and Administrative District ..……………………… 20 Statistically Significant Relationships Between Importance of Winter Maintenance and Demographic/Travel Variables …………………… 20 Statistically Significant Relationships Between Importance of Highway Striping and Demographic/Travel Variables ……………………… 21 Statistically Significant Relationships Between Importance of Debris Removal and Demographic/Travel Variables ……………………….. 21 Statistically Significant Relationships Between Importance of Surface Smoothness and Demographic/Travel Variables …………………… 21 Statistically Significant Relationships Between Importance of Highway Signage and Demographic/Travel Variables ……………………… 21 Statistically Significant Relationships Between Importance of Winter Roadway Information and Demographic/Travel Variables …………. 21 Statistically Significant Relationships Between Importance of Rest Stop Maintenance and Demographic/Travel Variables ………………... 22 Statistically Significant Relationships Between Importance of Roadside Maintenance and Demographic/Travel Variables ………………... 22 Comparison of 1998 and 2000 Importance Rating for Eight Maintenance Activities ……………………………………………….. 22 Respondents’ Perception of the Resource Priority Which Should Be Attached to Each Maintenance Activity ………………………………….. 23 Statistically Significant Relationships Between Resource Priorities Assigned to Maintenance Activities and Administrative District …………… 23

ix
Statistically Significant Relationships Between Resource Priority Assigned Winter Maintenance and Demographic/Travel Variables …………………… 24 Statistically Significant Relationships Between Resource Priority Assigned Roadway Striping and Demographic/Travel Variables ……………………… 24 Statistically Significant Relationships Between Resource Priority Assigned Winter Roadway Information and Demographic/Travel Variables …………. 24 Statistically Significant Relationships Between Resource Priority Assigned Surface Smoothness and Demographic/Travel Variables …………………… 24 Statistically Significant Relationships Between Resource Priority Assigned Debris Removal and Demographic/Travel Variables ……………………….. 25 Statistically Significant Relationships Between Resource Priority Assigned Rest Stop Maintenance and Demographic/Travel Variables ………………… 25 Statistically Significant Relationships Between Resource Priority Assigned to Signage and Demographic/Travel Variables ………………………………. 25 Statistically Significant Relationships Between Resource Priority Assigned Roadside Maintenance and Demographic/Travel Variables ……………….…25 Comparison of 1998 and 2000 Priorities Assigned to the Eight Maintenance Activities …………………………………………………26 Composite Variables for Each Maintenance Activity ………………………... 26 Statistically Significant Relationships Between Composite Variables and Administrative District …………………………………………………... 29 Statistically Significant Relationships Between Scores on Winter Maintenance Composite Variable and Demographic/Travel Variables .……………………………………………… 29 Statistically Significant Relationships Between Scores on Striping Composite Variable and Demographic/Travel Variables …….…….. 29 Statistically Significant Relationships Between Scores on Surface Smoothness Composite Variable and Demographic/Travel Variables ……..…………………………………………29 Statistically Significant Relationships Between Scores on Debris Removal Composite Variable and

x
Demographic/Travel Variables …….………………………………………… 29 Statistically Significant Relationships Between Scores on Signage Composite Variable and Demographic/Travel Variables …….………………………………………… 30 Statistically Significant Relationships Between Scores on Winter Roadway Information Composite Variable and Demographic/Travel Variables …….………………………………………… 30 Statistically Significant Relationships Between Scores on Roadside Maintenance Composite Variable and Demographic/ Travel Variables ………….…………………………………... 30 Statistically Significant Relationships Between Scores on Rest Stop Maintenance Composite Variable and Demographic/Travel Variables ……….……………………………………… 30 Comparison of 1998 and 2000 Composite Variable Means for the Eight Maintenance Activities …………………………………………………31 Respondents Perception of How the Montana Department of Transportation Could Do Better In the Area of Highway Maintenance …… 31 In What Maintenance Activities Does the Department of Transportation Currently Do a Good Job ………………………………………………………. 32 Willingness to Participate in a Follow Up Study …………………………….. 33 Summary …………………………………………………………………………… 34 The Respondents ………………………………………………………………… 34 General Perception of Highway Maintenance …………………………………… 35 Comparison of Highway Maintenance in Montana With Other States ………….. 35 Respondent Perception of Eight Maintenance Activities ………………………... 36 Winter Maintenance ……………………………………………………………… 37 Highway Striping ………………………………………………………………… 37 Highway Surface Smoothness …………………………………………………… 37 Debris Removal ………………………………………………………………..… 38 Highway Signage ………………………………………………………………… 38 Winter Roadway Information ………………………………………………….… 38 Roadside Maintenance …………………………………………………………… 39 Rest Stop Maintenance ……………………………………………………………39 1998 to 2000 Differences ………………………………………………………… 39 Conclusions and Implementation ………………………………………………….. 40
xi
References ………………………………………………………………………….. 41 Appendix One: Map Showing MDT Administrative Districts and Montana Counties ………………………………………………………….. 42 Appendix Two: Transportation Survey Questions ………………………………. 44
xii
TABLE OF TABLES Table One: Disposition of All Telephone Calls ..…………………………………… 2 Table Two: Location of Respondents’ Residences …………………………………. 5 Table Three: Rating of Maintenance Activities ………………………………………17 Table Four: Importance of Maintenance Activities ………………………………….. 20 Table Five: Resource Priorities ……………………………………………………… 23 Table Six: Values of Composite Variables ………………………………………….. 27 Table Seven: Composite Variable Mean by Rank of Rating, Importance and Priority …………………………………………………………… 28 Table Eight: What Could the Transportation Department Do Better in Terms of Maintenance ……..…………………………… 32 Table Nine: Maintenance Activities That Meet or Exceed Respondent’s Expectations ……….…………………………………… 33

xiii
TABLE OF FIGURES Figure One: Demographic Characteristics of the Respondents …………………….. 3 Figure Two: Administrative District …………………………………………….….. 6 Figure Three: Respondents’ Travel Characteristics ………………………………… 7 Figure Four: General Perception of Montana Roadways ……………………………. 8 Figure Five: Comparison of 1998 and 2000 General Rating of Montana Highway Maintenance ………………………………………………… 11 Figure Six: Comparison of 1998 and 2000 Importance of Montana Highway Maintenance Rating ……………………………………………14 Figure Seven: Comparison of 1998 and 2000 Ratings of Maintenance Activities ……19 Figure Eight: Comparison of 1998 and 2000 Perceptions of Importance of Maintenance Activities ……………………………………………….. 22 Figure Nine: Comparison of 1998 and 2000 Resource Priorities ……………………. 26 Figure Ten: Comparison of 1998 and 2000 Composite Variable Means …………….. 31 Figure Eleven: Willingness to Participate in Follow Up Study ……………………… 34

1
INTRODUCTION
This report summarizes the procedures and findings of a telephone survey conducted for the Montana Department of Transportation (MDT) by the Computer Assisted Telephone Interviewing Laboratory at Montana State University, Billings. This survey was a replication of an identical survey conducted in October of 1998 and a nearly identical survey conducted in September of 1996. The purposes of this survey were to determine the perceptions of the maintenance of state highways and interstates in Montana held by adult Montanans and to determine if those perceptions had changed in the last 2 years. The survey was conducted from September 15th through September 17th, September 29th, September 30th, and October 1st through October 4th, 2000. The results of the 1996 survey are contained in Perceptions of Highway Maintenance in Montana: The Results of a Telephone Survey, and the results of the 1998 study are contained in Perceptions of Highway Maintenance in Montana in 1998: The Results of a Telephone Survey, Final Report.
METHODOLOGY
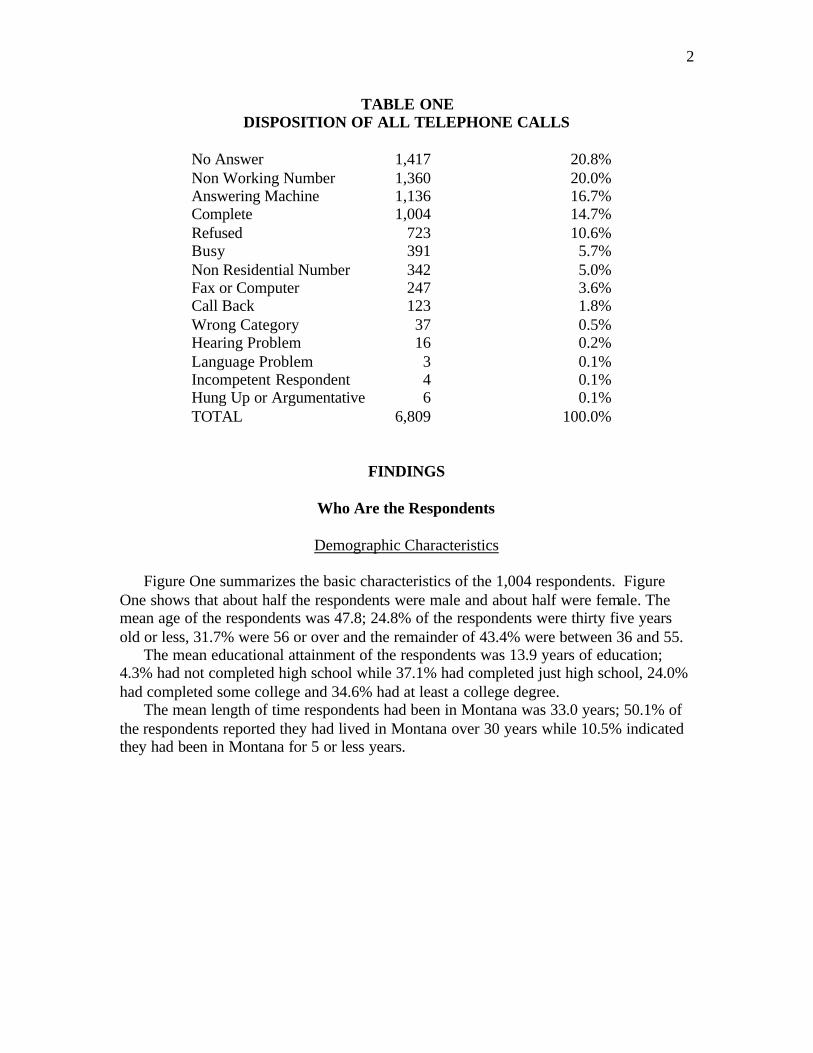
The survey was conducted by trained interviewers from the Computer Assisted Telephone Interviewing Laboratory (CATI Lab) at Montana State University, Billings. A random digit dialing sample was purchased from Genesys Sampling Systems (Ft. Washington, PA.) Telephone numbers were called back up to five times in an attempt to complete interviews. A total of 1004 interviews were completed requiring 6,809 telephone calls to 5,031 telephone numbers. Interviewers actually spoke to 1,727 eligible potential respondents and 1,004 or 58.1% of these potential respondents were successfully interviewed. Table One summarizes the disposition of each of all calls. Upon completion of all interviewing, the data was electronically transferred from the CATI computer system to the DEC Alpha computer system at Montana State University, Billings. The computer program Statistical Package for the Social Sciences (SPSS) was used to analyze the data. The results of the survey have a margin of error of about + 3% when generalized to the entire state. The MDT has divided the state in five administrative districts, and the margins of error within these districts vary from + 6% in the Missoula District to + 10% in the Glendive District (see Appendix One for map of districts).
2
TABLE ONE DISPOSITION OF ALL TELEPHONE CALLS
No Answer 1,417 20.8% Non Working Number 1,360 20.0% Answering Machine 1,136 16.7% Complete 1,004 14.7% Refused 723 10.6% Busy 391 5.7% Non Residential Number 342 5.0% Fax or Computer 247 3.6% Call Back 123 1.8% Wrong Category 37 0.5% Hearing Problem 16 0.2% Language Problem 3 0.1% Incompetent Respondent 4 0.1% Hung Up or Argumentative 6 0.1% TOTAL 6,809 100.0%
FINDINGS
Who Are the Respondents
Demographic Characteristics
Figure One summarizes the basic characteristics of the 1,004 respondents. Figure One shows that about half the respondents were male and about half were female. The mean age of the respondents was 47.8; 24.8% of the respondents were thirty five years old or less, 31.7% were 56 or over and the remainder of 43.4% were between 36 and 55. The mean educational attainment of the respondents was 13.9 years of education; 4.3% had not completed high school while 37.1% had completed just high school, 24.0% had completed some college and 34.6% had at least a college degree. The mean length of time respondents had been in Montana was 33.0 years; 50.1% of the respondents reported they had lived in Montana over 30 years while 10.5% indicated they had been in Montana for 5 or less years.

3
FIGURE 1
DEMOGRAPHIC CHARACTERISTICS OF THE RESPONDENTS
Gender
Female50.2%
Male49.8%
Age
14.8%
23.6%
15.7%
11.7%
5.2%
9.1%
19.8%
18-25 26-35 36-45 46-55 56-65 66-75 75+

4
Educational Attainment
1.5%2.8%
37.1%
24.0% 25.6%
9.0%
8th Grade orLess
Some HighSchool
High SchoolGraduate
Some College CollegeGraduate
Post GraduateEducation
Length of Montana Residence
16.2%
50.1%
10.5%14.0%
9.1%
1-5 Years 6-10 Years 11-20 Years 21-30 Years Over 30 Years
There were no statistically significant differences between the 1998 respondents and the 2000 respondents with respect to sex, age, educational attainment or length of residence in Montana.
County and Administrative District of Residence
Table Two summarizes the respondents’ county of residence, which was obtained by converting telephone prefixes. It was not possible to place 2 telephone numbers into counties. Table Two shows that respondents lived in 53 of Montana’s 56 counties. Only Wibaux, Petroleum and Carter Counties were not represented. Thirteen percent of the

5
respondents lived in Yellowstone County, 9.1% lived in Flathead County, 8.5% lived in Missoula County, 8.4% lived in Gallatin County, 8.2% lived in Cascade County, and 7.5% lived in Lewis and Clark County. Discrepancies between the percentages of the sample that reside in each county as compared with the percentage of the population of Montana in that county can be explained by a number of factors such as: differences in percentages of households with telephones, self selection biases that differ by county, and changes in actual population figures since the last measurement of such figures. Figure Two shows that 30.5% of the respondents lived in District 1, Missoula; 18.2% lived in 2, Butte; 22.2% in District 3, Great Falls; 9.2% in District 4, Glendive; and 20.0% District 5, Billings. A map showing the MDT Administrative Districts is included in this report as Appendix One. This survey was conducted by county line, as close to the Administrative Districts as possible. However, some counties are split between administrative districts, please refer to Appendix One.
TABLE TWO LOCATION OF RESPONDENTS’ RESIDENCES
County of Location
Beaverhead 8 .8% Big Horn 9 0.9% Blaine 9 0.9% Broadwater 6 .6% Carbon 12 1.2% Cascade 82 8.2% Chouteau 5 0.5% Custer 15 1.5% Daniels 4 0.4% Dawson 17 1.7% Deer Lodge 17 1.7% Fallon 3 0.3% Fergus 12 1.2% Flathead 91 9.1% Gallatin 84 8.4% Garfield 1 0.1% Glacier 14 1.4% Golden Valley 1 0.1% Granite 7 0.7% Hill 14 1.4% Jefferson 6 0.6% Judith Basin 3 0.3% Lake 40 4.0% Lewis and Clark 75 7.5% Liberty 2 0.2% Lincoln 21 2.1% McCone 1 0.1%

6
Madison 7 0.7% Meagher 1 0.1% Mineral 6 0.6% Missoula 85 8.5% Musselshell 8 0.8% Park 22 2.02 Petroleum 3 0.3% Phillips 5 0.5% Pondera 8 0.8% Powder River 3 0.3% Powell 8 0.8% Prairie 2 0.2% Ravalli 30 3.0% Richland 11 1.1% Roosevelt 8 0.8 % Rosebud 9 0.9% Sanders 18 1.8% Sheridan 3 0.3% Silver Bow 31 3.1% Stillwater 9 0.9% Sweetgrass 10 1.0% Teton 6 0.6% Toole 7 0.7% Treasure 2 0.2% Valley 10 1.0% Wheatland 3 0.3% Yellowstone 131 13.1% Unknown 2 .2% TOTAL 1004 100.0%
FIGURE 2
ADMINISTRATIVE DISTRICT
30.5%
18.2%22.2%
9.2%
20.0%
Missoula Butte Great Falls Glendive Billings

7
Travel Characteristics
The respondents were asked several questions about their vehicle travel patterns. Figure Three summarizes the results of these questions. Figure Three shows that 52.2% of the respondents indicated they drive more than 15,000 miles per year while 47.8% drove less than 15,000 miles. Figure Three shows the most common trips made by respondents were personal or family errands (52.2%), followed by commuting (22.4%) and then work related trips (16.5%). Figure Three also shows that 72.3% of the respondents had driven in other states in the last 12 months.
FIGURE 3
RESPONDENTS' TRAVEL CHARACTERISTICS
Drive More or Less Than 15,000 Miles Year
Less47.8%
More52.2%
Typical Trip
52.2%
22.5%
16.5%
2.8% 3.2% 2.7%
Personal/Family Commuting Work RelatedTrips
Other orCombinations
ProfessionalDriver
Agriculture
8
Driven in Other States in Last Twelve Months
Yes72.3%
No27.7%
General Perception of Montana Highways and Interstates
Rating of Montana Highway Maintenance
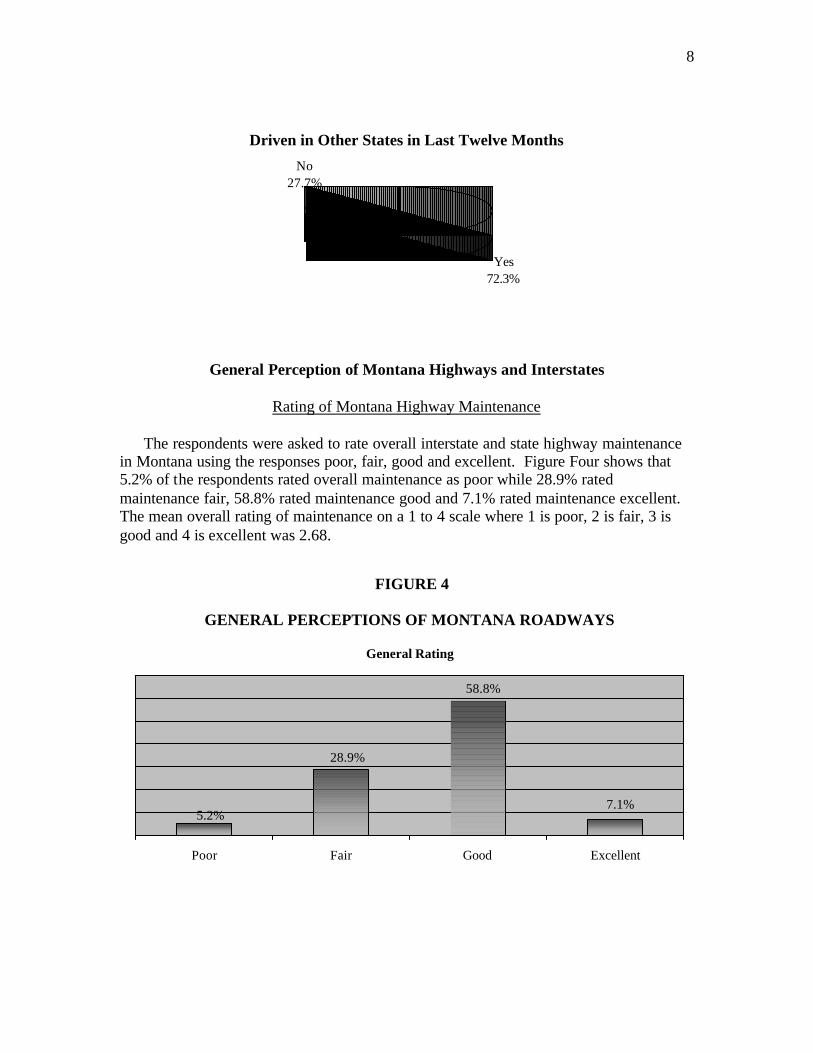
The respondents were asked to rate overall interstate and state highway maintenance in Montana using the responses poor, fair, good and excellent. Figure Four shows that 5.2% of the respondents rated overall maintenance as poor while 28.9% rated maintenance fair, 58.8% rated maintenance good and 7.1% rated maintenance excellent. The mean overall rating of maintenance on a 1 to 4 scale where 1 is poor, 2 is fair, 3 is good and 4 is excellent was 2.68.
FIGURE 4
GENERAL PERCEPTIONS OF MONTANA ROADWAYS
General Rating
5.2%
28.9%
58.8%
7.1%
Poor Fair Good Excellent

9
Importance of Highway Maintenance
0.0%
58.1%
5.7%
36.2%
Not Important Somewhat Important Important Very Important
Comparison of Montana Highways with Highways in Other States
30.4%
51.5%
18.1%
Montana Worse Same Montana Better

10
Comparison of Montana Winter Maintenance with Winter Maintenance in Other States
58.0%
17.3%24.7%
Montana Worse Same Montana Better
Comparison of Rest Area Maintenance in Montana with Rest Area Maintenance in Other States
13.4%
39.4%
47.1%
Montana Worse Same Montana Better
Statistically Significant Relationships Between General Rating of Montana Highway
Maintenance and Demographic/Travel Variables
To further investigate the perceptions of the respondents, all rating questions were crosstabulated with Administrative District, sex, age, educational attainment, length of Montana residence, the respondent’s typ ical trip, whether the respondent had driven more or less than 15,000 miles, and whether or not the respondent had driven in other states within the last 12 months. A statistically significant relationship was deemed to exist when the probability of getting the observed outcome by chance was less than 5%. Only statistically significant relationships are reported in this report.
11
Statistically significant relationships were found between the respondents' general rating of highway maintenance and whether or not the respondent had driven in other states and whether or not the respondent had driven more or less than 15,000 miles in the last year • Respondents who had driven in other states rated general maintenance lower than
respondents who had not driven in other states. • Respondents who had driven more than 15,000 miles in the last year rated general
maintenance lower than those who had driven less than 15,000 miles in the last year.
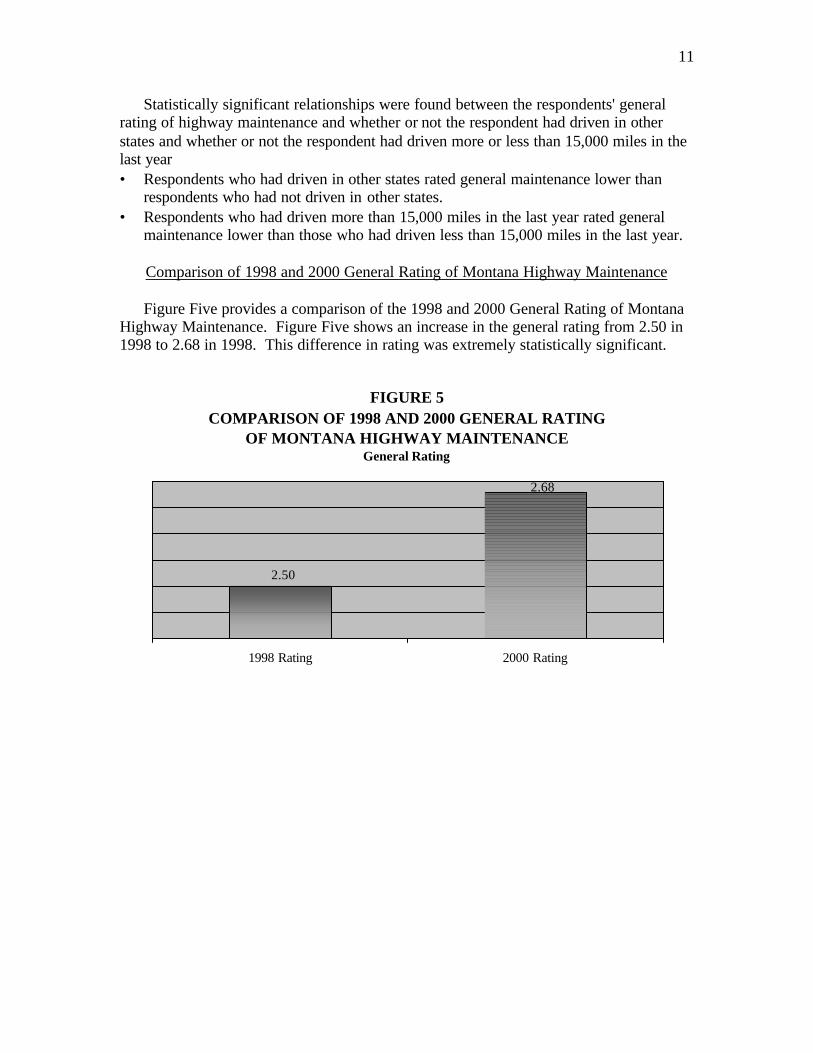
Comparison of 1998 and 2000 General Rating of Montana Highway Maintenance Figure Five provides a comparison of the 1998 and 2000 General Rating of Montana Highway Maintenance. Figure Five shows an increase in the general rating from 2.50 in 1998 to 2.68 in 1998. This difference in rating was extremely statistically significant.
FIGURE 5 COMPARISON OF 1998 AND 2000 GENERAL RATING
OF MONTANA HIGHWAY MAINTENANCEGeneral Rating
2.68
2.50
1998 Rating 2000 Rating

12
General Comparison With Other States
51.5%
18.1%19.2%
49.7%
31.1% 30.4%
Montana Worse Same Montana Better
1998
2000
Winter Maintenance Comparison With Other States
58.0%
19.5%
49.3%
31.2%
17.3%24.7%
Montana Worse Same Montana Better
19982000

13
Rest Area Maintenance Comparison With Other States
19.3%
28.9%
51.7%
39.4%
47.1%
13.4%
Montana Worse Same Montana Better
19982000
Respondents’ Opinion of the Personal Importance of Highway Maintenance
The respondents were also asked generally how important highway maintenance was to them and asked to answer with not important, somewhat important, important or very important. Figure Four shows that 36.2% of the respondents said very important, and 58.1% said important, 5.7% said somewhat important. Statistically Significant Relationships Between Importance of Highway Maintenance
and Demographic/Travel Variables
• General highway maintenance was most important to respondents who had been in Montana over 20 years and was least important to respondents who had only been in Montana for 11 to 20 years.
14
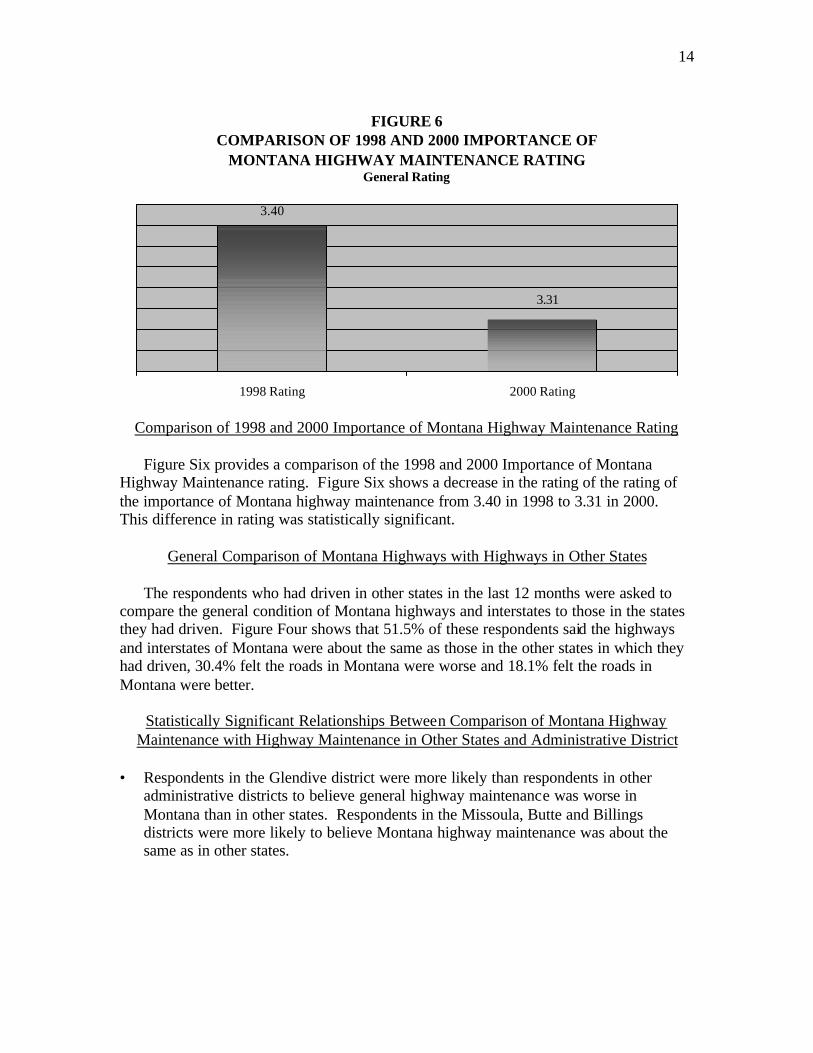
FIGURE 6 COMPARISON OF 1998 AND 2000 IMPORTANCE OF
MONTANA HIGHWAY MAINTENANCE RATINGGeneral Rating
3.40
3.31
1998 Rating 2000 Rating
Comparison of 1998 and 2000 Importance of Montana Highway Maintenance Rating
Figure Six provides a comparison of the 1998 and 2000 Importance of Montana Highway Maintenance rating. Figure Six shows a decrease in the rating of the rating of the importance of Montana highway maintenance from 3.40 in 1998 to 3.31 in 2000. This difference in rating was statistically significant.
General Comparison of Montana Highways with Highways in Other States
The respondents who had driven in other states in the last 12 months were asked to compare the general condition of Montana highways and interstates to those in the states they had driven. Figure Four shows that 51.5% of these respondents said the highways and interstates of Montana were about the same as those in the other states in which they had driven, 30.4% felt the roads in Montana were worse and 18.1% felt the roads in Montana were better.
Statistically Significant Relationships Between Comparison of Montana Highway Maintenance with Highway Maintenance in Other States and Administrative District
• Respondents in the Glendive district were more likely than respondents in other
administrative districts to believe general highway maintenance was worse in Montana than in other states. Respondents in the Missoula, Butte and Billings districts were more likely to believe Montana highway maintenance was about the same as in other states.

15
Statistically Significant Relationships Between Comparison of Montana Highway Maintenance with Highway Maintenance in Other States and Demographic/Travel
Variables • Respondents who indicated their most frequent trips were agriculturally related were
more likely than respondents whose most frequent trips were not agriculturally related to say that Montana maintenance was better while respondents whose most frequent trip was commuting were more likely to say that Montana maintenance was about the same as in other states.
Comparison of 1998 and 2000 Assessment of Montana Highway Maintenance Versus
Highway Maintenance in Other States
• There was no statistically significant difference between the 1998 and 2000 comparisons of Montana highway maintenance and highway maintenance in other states.
Comparison of Montana Winter Maintenance with Winter Maintenance in Other States
The respondents who had driven in other states in the last 12 months were also asked to compare winter maintenance in Montana to winter maintenance in other states Figure Four shows 58.0% of these respondents, who had an opinion, believed winter maintenance was about the same in Montana as in other states while 24.7% believed winter maintenance was better in Montana and 17.3% believed winter maintenance was worse in Montana. Statistically Significant Relationships Between Comparison of Montana Highway Winter
Maintenance with Highway Winter Maintenance in Other States and Administrative District
• Residents of the Glendive district were more likely than residents of other districts to
believe that winter maintenance was worse in Montana than in other states.
Statistically Significant Relationships Between Comparison of Winter Maintenance and Demographic/Travel Variables
• No statistically significant relationships were found between comparison of winter
maintenance in Montana versus other states and any of the demographic/travel variables.
Comparison of 1998 and 2000 Assessment of Montana Highway Winter Maintenance
Versus Winter Maintenance in Other States
• The percentage of respondents saying Montana winter maintenance was better than winter maintenance in other states decreased significantly from 1998 to 2000 while the percentage of respondents thinking winter maintenance in Montana and other states was about the same increased significantly.

16
Comparison of Montana Rest Area Maintenance and Rest Area Maintenance in Other States
The respondents who had driven in other states within the last 12 months were also asked to compare rest area maintenance in Montana with rest area maintenance in the other states in which they had driven. Figure Four shows that 47.1% of respondents who had an opinion felt rest area maintenance was about the same in Montana as in other states, while 39.4% said rest stop area maintenance was worse in Montana and 13.4% said it was better in Montana.
Statistically Significant Relationships Between Rest Area Maintenance Comparison and Demographic/Travel Variables
• Generally, the longer a respondent had lived in Montana the more likely they were to
say that rest area maintenance was worse in Montana than in other states.
Comparison of 1998 and 2000 Assessment of Montana Rest Area Maintenance Versus Rest Area Maintenance in Other States
• The percentage of respondents believing rest area maintenance was worse in Montana
than in other states increased significantly from 1998 to 2000.
Respondents Rating of Eight Maintenance Activities
For the purposes of this survey, highway maintenance activities were divided into 8 categories: winter maintenance, maintaining a smooth highway surface, maintenance of roadsides, maintenance of signs, debris removal, rest stop maintenance, striping maintenance, and winter road condition reports. The respondents were asked to rate each of these activities with the responses poor, fair, good, very good and excellent. Table Three summarizes the results of that rating. The ordering of the activities in Table Three is provided by the mean score for each item on a 1 to 4 scale where 1 = poor, 2 = fair, 3 = good, and 4 = excellent. Also reported in Table Three are the standard deviation (SD) of the distribution of rating for each activity and the standard error of the mean (SE) for the ratings of each activity. While it is not possible to indicate what constitutes a statistically significant difference between means because each mean represents a separate variable, the standard deviation and standard error of the ratings should assist in making any additional interpretations. The largest standard of error is 0.029 resulting in a 95% confidence interval of + .057. This means that if the difference between two means is greater than 0.11, each mean is outside of the 95% confidence interval of the other. Therefore a difference between means greater than 0.11 should be considered a real difference. Table Three shows that the maintenance of highway signs is rated highest (3.02) followed by winter road information (2.91), winter maintenance (2.77), roadside maintenance (2.71), striping (2.70), debris removal (2.65), rest stop maintenance (2.58), and highway surface maintenance (2.44). These ratings show that the maintenance of signs is rated highest followed by winter road information. Next, winter maintenance, roadside maintenance and striping are rated fairly close together. Debris removal and rest

17
stop maintenance are next and smoothness of roadway surfaces is rated lowest of the eight maintenance activities.
TABLE THREE
RATING OF MAINTENANCE ACTIVITIES
Activity Poor Fair Good Excellent N Mean SD SE Signage 1.8% 10.6% 70.7% 16.9% 999 3.02 0.589 0.019 Information 5.2% 16.4% 61.0% 17.4% 844 2.91 0.734 0.025 Winter Maint. 5.6% 25.0% 56.4% 13.0% 952 2.77 0.742 0.024 Roadsides 7.3% 22.7% 61.3% 8.8% 991 2.71 0.725 0.023 Striping 5.9% 26.4% 59.1% 8.6% 1000 2.70 0.706 0.022 Debris Removal 10.3% 25.6% 54.2% 9.9% 999 2.65 0.798 0.025 Rest Stop Maint. 12.1% 28.4% 49.1% 10.4% 800 2.58 0.834 0.029 Surfaces 11.4% 38.3% 45.5% 4.8% 1002 2.44 0.755 0.024
Statistically Significant Relationships Between Rating of Maintenance Activities and Administrative Dis trict
• Respondents in the Butte District rated winter maintenance higher than did other
respondents while the respondent in the Billings District rated winter maintenance lower than did other respondents.
• Respondents in the Glendive District rated striping higher than did respondents from other districts while respondents from the Missoula District rated striping lower than did respondents from other districts.
• Respondents in the Butte and Great Falls Districts rated debris removal higher than did respondents from other districts while respondents in the Glendive and Billings Districts rated debris removal lower than did respondents from other districts.
Statistically Significant Relationships Between Rating of Signage
and Demographic/Travel Variables
• Respondents who had driven more than 15,000 miles in the last 12 months rated signage lower than respondents who had driven less than 15,000 miles.
Statistically Significant Relationships Between Rating of Winter Roadway Information
and Demographic/Travel Variables • Respondents who had driven in other states rated winter roadway information lower
than did respondents who had not driven in other states • Respondents who had driven more than 15,000 miles in the last 12 months rated
winter roadway information lower than respondents who had driven less than 15,000 miles
• Respondents who had been in Montana for more than 10 years rated winter roadway information higher than respondents who had been in Montana for 10 or less years.
• Respondents indicating they were professional driver rated winter roadway information lower than did respondents who were not professional drivers.

18
Statistically Significant Relationships Between Rating of Winter Maintenance and Demographic/Travel Variables
• Respondents who were between 65 and 75 rated winter maintenance higher than did
other respondents while respondents between 18 and 25 rated winter maintenance lower than did other respondents. Generally, the older the respondent the higher their rating of winter maintenance.
• Respondents who had been in Montana l5 years or less and more than 30 years rated winter maintenance higher than did respondents who had been in Montana for between 6 and 30 years.
Statistically Significant Relationships Between Rating of Roadside Maintenance
and Demographic/Travel Variables • No statistically significant relationships were found between rating of roadside
maintenance and any demographic or travel variable.
Statistically Significant Relationships Between Rating of Highway Striping and Demographic/Travel Variables
• Respondents between 46 and 55 and respondents between 66 and 75 rated highway
striping higher than did respondents from 18 to 45, from 56 to 65 and over 75. • Respondents with less than a high school diploma and respondents with a post
graduate education rated highway striping higher than did respondents with a high school diploma, some college or a college degree.
• Respondents who had been in Montana for 10 years or less rated highway striping lower than did respondents who had been in Montana for longer and respondents who had been in Montana for over 20 years rated highway striping higher than did respondents who had been in Montana for less time.
Statistically Significant Relationships Between Rating of Debris Removal
and Demographic/Travel Variables • Respondents who had driven in other states in the last 12 months rated debris removal
higher than respondents who had not. • Professional drivers and respondents saying their most frequent trips were
agriculturally related rated debris remova l lower than respondents who said their most frequent trips were community, work related or personal.
Statistically Significant Relationships Between Rating of Rest Stop Maintenance
and Demographic/Travel Variables • Females rated rest stop maintenance higher than did males. • Respondents who had been in Montana less than 10 years rated rest stop maintenance
higher than did any other respondents.

19
Statistically Significant Relationships Between Rating of Surface Smoothness and Demographic/Travel Variables
• Respondents who had driven more than 15,000 miles within the last 12 months rated
surface smoothness lower than did respondents who had driven less than 15,000. • Respondents over 65 rated surface smoothness higher than did younger respondents. • Respondents who had been in Montana over 20 years rated surface smoothness lower
than did respondents who had been in Montana for 20 years or less. • Professional drivers rated surface smoothness lower than did other respondents.
FIGURE 7 COMPARISON OF 1998 AND 2000 RATINGS
OF MAINTENANCE ACTIVITIES
2.10
2.30
2.50
2.70
2.90
3.10
Signage Information Win Maint Roadsides Striping Debris Rem Rest StpMaint
Surfaces
19982000
Comparison of 1998 and 2000 Ratings of the Eight Maintenance Activities
Figure Seven provides a comparison of 1998 and 2000 ratings of the eight maintenance activities. The ratings of four of the eight maintenance activities showed a statistically significant change from 1998 to 2000. The rating for debris removal decreased significantly from 2.72 in 1998 to 2.64 in 2000. The rating for highway striping decreased significantly from 2.78 in 1998 to 2.70 in 2000. The rating for rest stop maintenance decreased significantly from 2.81 in 1198 to 2.58 in 2000. And, the rating for highway surfaces increased significantly from 2.31 in 1998 to 2.44 in 2000.
Importance of Highway Maintenance Activities to the Respondents
The respondents were asked how important each of the eight maintenance activities was to them. They were asked to respond with not important, somewhat important, important and very important. Table Four summarizes the respondents’ perception of the importance of these different activities. The ordering of activities in Table Four is provided by the mean score of each activity on a 1 to 4 scale where 1 = not important, 2 = somewhat important, 3 = important and 4 = very important.

20
TABLE FOUR IMPORTANCE OF MAINTENANCE ACTIVITIES
Not Smwhat Very Activity Important Import. Import. Import. N Mean SD SE Winter Maint. 0.4% 2.0% 36.9% 60.7% 973 3.58 0.555 0.018 Striping 1.0% 3.9% 42.7% 52.4% 1002 3.46 0.622 0.020 Debris Removal 0.5% 4.4% 52.3% 42.8% 1001 3.37 0.594 0.019 Surfaces 0.7% 4.3% 60.0% 35.0% 1002 3.29 0.579 0.018 Signage 1.4% 5.2% 57.9% 35.6% 1004 3.28 0.622 0.020 Information 2.0% 10.6% 51.0% 36.4% 909 3.22 0.708 0.023 Rest Stop Maint. 2.3% 14.3% 57.2% 26.3% 876 3.07 0.701 0.024 Roadsides 3.5% 11.8% 64.9% 19.8% 992 3.01 0.676 0.021 Table Four shows that winter maintenance is the most important maintenance activity to respondents with a mean of 3.58 followed by striping (3.46), debris removal (3.37), surfaces (3.29), signage (3.28), winter roadway information (3.22), rest stop maintenance (3.07) and roadside maintenance (3.01). The standard deviation and standard error of the mean are presented for the importance ratings of each activity. The largest standard error is 0.024 with a resulting 95% confidence interval of + 0.04 meaning that any difference between means greater than .09 can be considered a real difference. With this figure in mind, winter maintenance is clearly the most important to respondents followed by striping, and debris removal. Surfaces, signage and winter roadway information cannot be differentiated from each other but they are less important than debris removal and more important than rest stop maintenance. Rest stop maintenance cannot be differentiated from roadside maintenance.
Statistically Significant Relationships Between Importance of Maintenance Activities and Administrative District
• Respondents in the Missoula and Glendive Districts rated winter maintenance more
important than did respondents from other districts while respondents in the Billings District believed winter maintenance was less important to them than did respondents in other districts.
Statistically Significant Relationships Between Importance of Winter Maintenance
and Demographic/Travel Variables
• Winter maintenance was less important to respondents who had driven in other states in the last year than it was to respondents who had not driven in other states.
• Winter maintenance was more important to respondents who had been in Montana for more than 20 years than it was to respondents who had been in Montana for 20 or less years.

21
Statistically Significant Relationships Between Importance of Highway Striping and Demographic/Travel Variables
• Striping was more important to respondents who had an eighth grade or less
education, who had some college or who had post graduate education than it was to respondents who had attended some high school, high school graduates or college graduates
• Striping was less important to respondents who indicated their most frequent trip was commuting or agriculturally related than it was to those who were professional drivers, or said their most frequent trip was work related or personal.
Statistically Significant Relationships Between Importance of Debris Removal
and Demographic/Travel Variables • Debris removal was more important to females than it was to males • Debris removal was more important to respondents who had been in Montana for
over 20 years than it was to respondents who had been in Montana for 20 or less years.
Statistically Significant Relationships Between Importance of Surface Smoothness
and Demographic/Travel Variables • Smooth highway surfaces were more important to respondents who said their most
frequent trip was work related, or personal, or to respondents who were professional drivers than it was to respondents who said their most frequent trip was commuting or agriculturally related.
Statistically Significant Relationships Between Importance of Highway Signage
and Demographic/Travel Variables
• Highway signage was more important to female respondents than it was to male respondents.
• Highway signage was more important to respondents who had been in Montana for over 20 years than it was to respondents who had been in Montana for 20 or less years.
Statistically Significant Relationships Between Importance of Winter Roadway
Information and Demographic/Travel Variables
• Winter roadway information was more important to respondents who had driven in other states than it was to respondents who had not driven in other states.
• Winter roadway information was more important to respondents with post graduate education and respondents with some college than it was to respondents with a high school diploma or less or respondents with a college degree. Respondents with some high school rated winter roadway information less important than did respondents with no high school or respondents with a high school diploma or higher level of educational attainment.

22
Statistically Significant Relationships Between Importance of Rest Stop Maintenance and Demographic/Travel Variables
• Rest stop maintenance was more important to professional drivers, respondents who
said their most frequent trip was work related or respondents who said their most frequent trip was personal that it was to respondents who said their most frequent trip as commuting or agricultural in nature.
Statistically Significant Relationships Between Importance of Roadside Maintenance
and Demographic/Travel Variables • Roadside maintenance was more important to female respondents than to male
respondents • Roadside maintenance was more important to respondents with an eighth grade or
less education, with some college or with postgraduate education than it was to respondents with some high school, a high school diploma or a college degree.
• Roadside maintenance was more important to respondents who had been in Montana for 1 to 5 years or for more than 20 years than it was to respondents who had been in Montana from 6 to 20 years.
FIGURE 8 COMPARISON OF 1998 AND 2000 PERCEPTIONS OF
IMPORTANCE OF MAINTENANCE ACTIVITIES
2.70
2.80
2.90
3.00
3.10
3.20
3.30
3.40
3.50
3.60
3.70
Win Maint Striping Debris Rem Surfaces Signage Info Rst StpMaint
Roadsides
1998
2000
Comparison of 1998 and 2000 Importance Rating for Eight Maintenance Activities
Figure Eight provides a comparison of the 1998 and 2000 importance ratings for the eight maintenance activities. The 1998 to 2000 changes in importance ratings of debris removal, winter roadway information and rest stop maintenance were statistically significant. The mean perceived importance of debris removal increased from 3.31 in 1998 to 3.37 in 2000. The mean importance of winter roadway information decreased from 3.36 in 1998 to 3.22 in 2000. And the mean importance for rest stop maintenance decreased from 3.20 in 1998 to 3.07 in 2000.

23
Respondents’ Perception of the Resource Priority Which Should Be Attached to Each Maintenance Activity
The respondents were asked to think about the allocation of Department of Transportation resources and assign a resource priority of low, medium, moderately high, or very high to each of the maintenance activities. Table Five summarizes the results of the respondents’ assignment of resource priorities. The ordering of activities in Table Five is provided by the mean resource priority score for each item on a scale where 1 = low, 2 = medium, 3 = moderately high and 4 = high. As Table Five shows, respondents awarded the highest resource priority to winter maintenance (3.54). Highway striping (3.27) and information about winter road conditions (3.22) were next in terms of resource priorities. Smoothness of roadway surface (3.12) and debris removal (3.10) were in the third highest group in terms of priorities for resource allocation fo llowed by rest stop maintenance (3.00) and signage (2.92). Clearly in last place in terms of the allocation of resources was roadside maintenance (2.59). The standard deviation and standard error of the mean are presented for each activity’s resource priority mean. The largest standard error is 0.028 producing a 95% confidence interval of + 0.055. Therefore a difference between means greater than 0.11 is a real difference. With this figure in mind, the highest priority goes to winter maintenance followed by a tie between striping and winter roadway information, then a tie between surfaces and debris removal, a tie between rest stop maintenance and signage and finally roadsides.
TABLE FIVE RESOURCE PRIORITIES
Moderately Very Activity Low Medium High High N Mean SD SE Winter Maint. 0.5% 07.4% 29.7% 62.4% 988 3.54 0.653 0.021 Striping 2.4% 15.9% 34.1% 47.6% 996 3.27 0.812 0.026 Information 3.1% 15.3% 38.0% 43.6% 968 3.22 0.815 0.026 Surface 2.2% 17.5% 46.4% 33.9% 989 3.12 0.767 0.024 Debris Removal 3.1% 20.1% 41.0% 35.8% 997 3.10 0.821 0.026 Rest Stop Maint. 3.8% 23.2% 42.5% 30.5% 930 3.00 0.830 0.027 Signage 6.0% 24.7% 40.4% 28.9% 996 2.92 0.878 0.028 Roadsides 11.2% 33.6% 40.2% 15.0% 992 2.59 0.876 0.028
Statistically Significant Relationships Between Resource Priorities Assigned to Maintenance Activities and Administrative District
• Respondents in the Glendive Districts gave roadside maintenance a higher priority
than did respondents in other districts while respondents in the Missoula district gave roadside maintenance the lowest priority.
• Respondents in the Great Falls and Glendive Districts also gave rest stop maintenance a higher priority than did respondents in other areas while respondents in the Missoula District gave rest stop maintenance a lower priority than did respondents in other districts.

24
Statistically Significant Relationships Between Resource Priority Assigned to Winter Maintenance and Demographic/Travel Variables
• Respondents who had driven in other states assigned a higher priority to winter
maintenance than did respondents who had not driven in other states. • Winter maintenance was given a higher priority by respondents who said their most
frequent trip was work related than it was by respondents indicating a different most frequent trip. Respondents who indicated their most frequent trip to be agriculturally related gave winter maintenance a lower priority than did respondents whose most frequent trip was for a different purpose.
Statistically Significant Relationships Between Resource Priority Assigned to Roadway
Striping and Demographic/Travel Variables • Females respondents assigned a higher priority to striping than did male respondents. • Generally, the older a respondent, the higher the priority assigned to striping. • Striping was given a higher priority by respondents who had been in Montana from
11 to 20 years and over 30 years than it was by respondents who had been in Montana for 10or less years or 21 to 30 years. Respondents who had been in Montana for 5 or less years gave striping a lower resource allocation priority than did respondents who had been in Montana longer.
• Respondents who said their most frequent trips were work related or personal assigned striping a higher priority than did respondents who were professional drivers, who said their most frequent trip was commuting or who said their most frequent trip was agriculturally related. The respondents who said their most frequent trip was agriculturally related gave striping a lower priority than did respondents who indicated a different purpose for their most frequent trip.
Statistically Significant Relationships Between Resource Priority Assigned to Winter
Roadway Information and Demographic/Travel Variables • Females assigned a higher resource priority to winter roadway information than did
males. • Winter roadway information was given a higher priority by respondents indicating
that their most frequent trips were work related or personal than it was by respondents saying they were professional drivers, that their most frequent trip was commuting or agriculturally related.
Statistically Significant Relationships Between Resource Priority Assigned to Surface
Smoothness and Demographic/Travel Variables • Respondents who said their most frequent trip was work related gave surface
smoothness a higher priority than did respondents who indicated a different purpose for their most frequent trip.

25
Statistically Significant Relationships Between Resource Priority Assigned to Debris Removal and Demographic/Travel Variables
• Debris removal was given a higher priority by female respondents than by male
respondents. • Debris removal was given a higher priority by respondents from 66 through 75 than it
was by younger or older respondents. Respondents from 26 to 35 gave debris removal a lower priority than did younger or older respondents.
Statistically Significant Relationships Between Resource Priority Assigned to Rest Stop
Maintenance and Demographic/Travel Variables • Females assigned a higher priority to rest stop maintenance than did males. • Respondents 35 and younger assigned rest stop maintenance a lower priority than did
older respondents as did respondents between 36 and 45 and between 46 and 55, while respondents over 55 assigned rest stop maintenance a higher priority than did younger respondents.
• Respondents with some college assigned rest stop maintenance a higher priority than did respondents with a higher or lower educational level while respondents with an eighth grade or less educational level assigned rest stop maintenance a lower priority than did respondents with a higher level of education.
• Rest stop maintenance was assigned a higher priority by respondents who said their most frequent trip was work related, personal or by respondents who were professional drivers than it was by respondents who said their most frequent trip was commuting or agriculturally related.
Statistically Significant Relationships Between Resource Priority Assigned to Signage
and Demographic/Travel Variables • Signage was assigned a higher priority by female respondents than by male
respondents. • Respondents who had driven in other states in the last 12 months gave signage a
lower priority than did respondents who had not driven in other states. • Respondents 66 and older provided a higher priority to signage than did younger
respondents • Respondents with a college degree, post graduate education or some high awarded
signage a lower priority than did respondents with other levels of educational attainment.
• Respondents who were professional drivers or who said their most frequent trip was agriculturally related gave signage a lower priority than did respondents who said their most frequent trips were commuting, work related or personal.
Statistically Significant Relationships Between Resource Priority Assigned Roadside
Maintenance and Demographic/Travel Variables • Roadside maintenance was given a higher priority by female respondents than by
male respondents.

26
FIGURE 9 COMPARISON OF 1998 AND
2000 RESOURCE PRIORITIES
2.50
2.70
2.90
3.10
3.30
3.50
3.70
WinterMaint
Striping Info Surface DebrisRem
Rest StpMaint
Signage Roadsides
19982000
Comparison of 1998 and 2000 Priorities Assigned to the Eight Maintenance Activities
Figure Nine provides a comparison of the 1998 and 2000 assignment of priorities to the eight maintenance activities. The decreases from 1998 to 2000 in the priorities assigned to signage (3.03 to 2.92) and in the priorities assigned winter roadway information (3.32 to 3.22) were statistically significant. The changes in mean priority score from 1998 to 2000 for winter maintenance, striping, surface smoothness, debris removal, rest stop maintenance and roadside maintenance were not statistically significant.
Composite Variables for Each Maintenance Activity
To better understand the perceptions of the respondents toward each maintenance activity, a composite variable was constructed for each maintenance activity by combining the answers to the rating, importance, and resource priority questions. The first step in constructing these variables, was to reverse the values assigned to the responses to the rating of each maintenance activity. After reversal, an excellent rating = 1, a good rating = 2, a fair rating = 3, and a poor rating = 4. Then, the composite variable for each maintenance activity was created by adding this reversed value for rating, the score on the importance question (1 = not important, 2 = somewhat important, 3 = important and 4 = very important) and the score on the resource priority question (1 = low, 2 = medium, 3 = moderately high, and 4 = high). If a respondent had answered all three of the questions about a maintenance activity, the scores on the composite variable for that activity would range from 3 to 12. If the value of the composite variable were a 3, it would indicate an excellent rating of the activity, an answer of not important on the importance question and of low priority on the resource priority question. A score of 12 would indicate a poor rating, very important and a high resource priority. A score of less than 3 is possible if the respondent did not answer each question about a particular maintenance activity.

27
The higher the score on this composite variable, the lower the rating, the more important the activity is considered, and the higher the resource priority assigned to the activity. Thus, the higher the score on the composite variable, the more attention respondents believe should be paid to the maintenance activity. Table Six summarizes the values of the composite variable created for each maintenance activity. Each of the eight composite variables of Winter Maintenance, Surface Smoothness, Striping, Debris Removal, Winter Road Information, Signage, Rest Stop Maintenance and Roadside Maintenance occupies a column in Table Six. The ordering of columns in Table Six is based upon the mean score for each composite variable and ranges from Winter Maintenance with a mean score of 9.10 to Rest Stop Maintenance with a mean score of 7.66. The standard deviation and standard error of the mean are presented for each composite variable. The largest standard error is 0.073 producing a 95% confidence interval of + 0.1431. Therefore, a difference between means of greater than .286 represents a real difference. Winter Maintenance, Striping and Surface Smoothness have the highest scores with Debris Removal next, followed by Signage, and Winter Road Information. The composite variables for Roadside Maintenance and Rest Stop Maintenance are nearly the same and are the lowest of the composite variables.
TABLE SIX VALUES OF COMPOSITE VARIABLES
Winter Surface Debris Wtr Rd Rd Side Reststop Value Maint Striping Smthnes Removal Signage Informat Maint Maint 1 0.0% 0.0% 0.0% 0.0% 0.0% 0.2% 0.1% 0.4% 2 0.0% 0.1% 0.0% 0.0% 0.0% 0.9% 0.5% 2.1% 3 0.5% 0.1% 0.0% 0.1% 0.5% 2.8% 0.4% 4.0% 4 2.3% 0.2% 0.2% 0.1% 0.5% 5.8% 1.3% 5.9% 5 0.5% 0.7% 1.0% 0.6% 2.0% 3.0% 3.6% 4.4% 6 1.8% 2.7% 2.3% 3.0% 5.6% 4.2% 12.3% 5.2% 7 5.1% 10.6% 10.0% 12.9% 19.4% 12.5% 22.3% 13.6% 8 16.7% 21.3% 23.5% 26.5% 33.6% 24.8% 29.7% 22.5% 9 30.4% 25.9% 31.4% 27.1% 25.1% 27.4% 18.3% 22.1% 10 27.9% 24.8% 18.68% 18.7% 10.9% 13.5% 7.3% 11.8% 11 13.0% 11.4% 10.8% 7.9% 2.0% 4.4% 2.8% 5.9% 12 1.8% 2.3% 2.3% 3.1% 0.5% 0.6% 1.5% 2.2% N 1000 1004 1004 1004 1004 981 1004 956 Mean 9.10 8.99 8.92 8.79 8.14 7.96 7.79 7.76 SD 1.523 1.426 1.366 1.395 1.314 1.978 1.579 2.269 SE 0.048 0.045 0.043 0.044 0.041 0.063 0.050 0.073 In order to better explain the meaning of these composite variables as well as the respondents’ perceptions of the eight maintenance activities, Table Seven shows the mean score of the composite variable for each activity as well as the relative position of each activity in the respondents’ rating of how well each activity is currently being
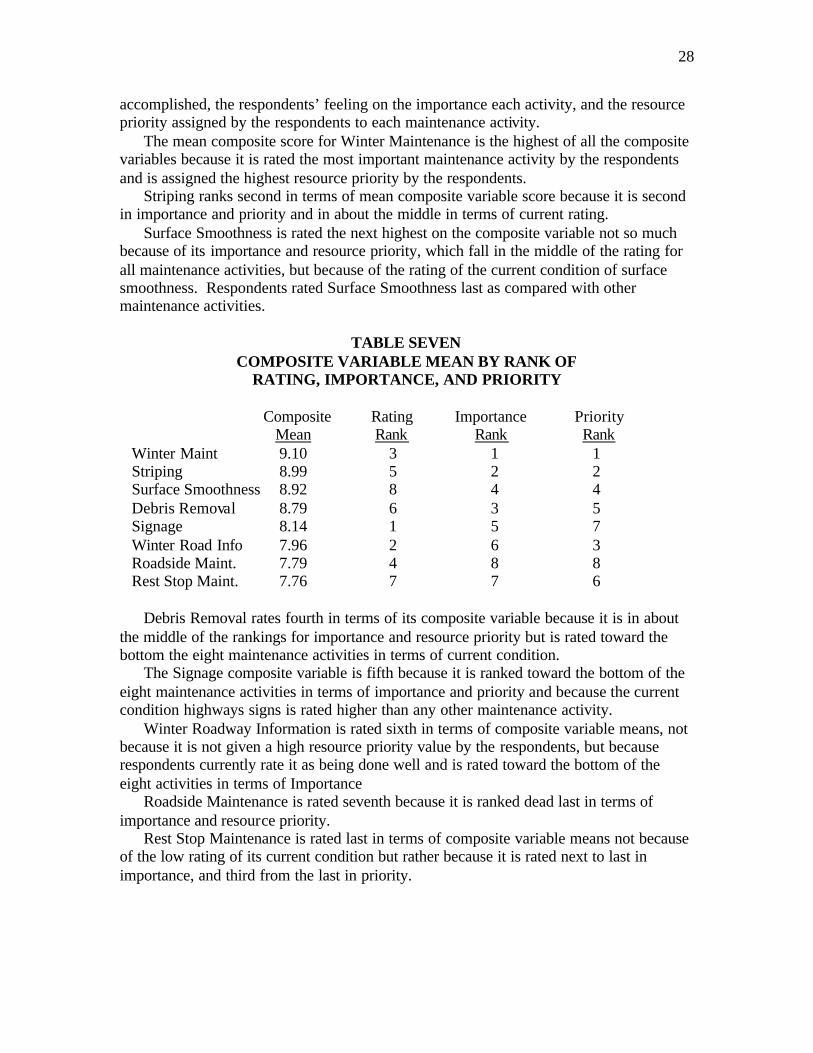
28
accomplished, the respondents’ feeling on the importance each activity, and the resource priority assigned by the respondents to each maintenance activity. The mean composite score for Winter Maintenance is the highest of all the composite variables because it is rated the most important maintenance activity by the respondents and is assigned the highest resource priority by the respondents. Striping ranks second in terms of mean composite variable score because it is second in importance and priority and in about the middle in terms of current rating. Surface Smoothness is rated the next highest on the composite variable not so much because of its importance and resource priority, which fall in the middle of the rating for all maintenance activities, but because of the rating of the current condition of surface smoothness. Respondents rated Surface Smoothness last as compared with other maintenance activities.
TABLE SEVEN COMPOSITE VARIABLE MEAN BY RANK OF
RATING, IMPORTANCE, AND PRIORITY
Composite Rating Importance Priority Mean Rank Rank Rank Winter Maint 9.10 3 1 1 Striping 8.99 5 2 2 Surface Smoothness 8.92 8 4 4 Debris Removal 8.79 6 3 5 Signage 8.14 1 5 7 Winter Road Info 7.96 2 6 3 Roadside Maint. 7.79 4 8 8 Rest Stop Maint. 7.76 7 7 6 Debris Removal rates fourth in terms of its composite variable because it is in about the middle of the rankings for importance and resource priority but is rated toward the bottom the eight maintenance activities in terms of current condition. The Signage composite variable is fifth because it is ranked toward the bottom of the eight maintenance activities in terms of importance and priority and because the current condition highways signs is rated higher than any other maintenance activity. Winter Roadway Information is rated sixth in terms of composite variable means, not because it is not given a high resource priority value by the respondents, but because respondents currently rate it as being done well and is rated toward the bottom of the eight activities in terms of Importance Roadside Maintenance is rated seventh because it is ranked dead last in terms of importance and resource priority. Rest Stop Maintenance is rated last in terms of composite variable means not because of the low rating of its current condition but rather because it is rated next to last in importance, and third from the last in priority.
29
Statistically Significant Relationships Between Composite Variables and Administrative District
• The scores on the composite variable Roadside Maintenance were higher for
respondents living in the Glendive Districts than they were for respondents living in other districts, while the scores on Roadside Maintenance were lower for respondents living in the Missoula District than for respondents in other districts.
Statistically Significant Relationships Between Scores on Winter Maintenance Composite
Variable and Demographic/Travel Variables
• Respondents who reported driving more than 15,000 miles in the last 12 months scored higher on the Winter Maintenance composite variable than did respondents who drove less than 15,000 miles.
• Respondents over 65 scored lower on the Winter Maintenance composite variable than did younger respondents.
• Respondents who had been in Montana for five or less years scored lower on the Winter Maintenance composite variable than did respondents who had been in Montana longer.
Statistically Significant Relationships Between Scores on Striping Composite Variable
and Demographic/Travel Variables • Females scored higher than males on the Striping composite variable. Statistically Significant Relationships Between Scores on Surface Smoothness Composite
Variable and Demographic/Travel Variables • Respondents who had driven in other states in the last 12 months scored higher on the
surface smoothness composite variable than did those who had not driven in other states.
• Respondents who had driven more than 15,000 miles in the last 12 months scored higher on the surface smoothness composite variable than did respondents who had driven less than 15,000 miles.
• Respondents from 36 to 65 scored higher on the Surface Smoothness composite variable than did respondents who were younger or older while respondents over 75 scored lower on this composite variable than younger respondents did.
• Respondents who were professional drivers and respondents who said their most frequent trip was work related scored higher on the Surface Smoothness composite variable than did respondents who indicated any other type of typical trip.
Statistically Significant Relationships Between Scores on Debris Removal Composite
Variable and Demographic/Travel Variables • Female respondents scored higher than male respondents on the Debris Removal
composite variable.

30
• Respondents who reported driving more than 15,000 miles in the last year scored higher on the Debris Removal composite variable than did respondents who had driven less than 15,000 miles.
Statistically Significant Relationships Between Scores on Signage Composite Variable
and Demographic/Travel Variables • Female respondents scored higher on the Signage composite variable than did males. • Respondents over 75 scored higher on the Signage composite variable than younger
respondents while respondents from 26 to 35 scored the lower than younger or older respondents.
• Respondents with a high school diploma, some college or post graduate education scored higher on the Signage composite variable than did respondents with other levels of education attainment.
• Respondents whose most frequent trip was personal scored the highest on the Signage composite variable while those whose most frequent trip was agriculturally related scored the lowest.
Statistically Significant Relationships Between Scores on Winter Roadway Information
Composite Variable and Demographic/Travel Variables • Respondents who had been in Montana for over 10 years scored higher on the Winter
Roadway Information composite variable than did respondents who had been in Montana for less time.
• Professional drivers and respondents whose most frequent trip was work related scored higher on the Winter Roadway information composite variable than did respondents whose most frequent trips were commuting, personal or agriculturally related.
Statistically Significant Relationships Between Scores on Roadside Maintenance
Composite Variable and Demographic/Travel Variables • Female respondents scored higher on the Roadside Maintenance composite variable
than did male respondents.
Statistically Significant Relationships Between Scores on Rest Stop Maintenance Composite Variable and Demographic/Travel Variables
• No statistically significant relationships were found between score on the Rest Stop
Maintenance composite variable and any of the demographic/travel variables.

31
FIGURE 10 COMPARISON OF 1998 AND
2000 COMPOSITE VARIABLE MEANS
6.50
7.00
7.50
8.00
8.50
9.00
9.50
WintMaint
Striping Surface DebrisRem
Signage Wint Info Roadsides Reststops
1998
2000
Comparison of the 1998 and 2000 Composite Variable Means for the Eight Maintenance
Activities Figure Ten provides a comparison of the 1998 and 2000 composite variable means for the eight maintenance activities. The 1998 to 2000 change in two of the eight composite variables was statistically significant. The decrease in the mean value of the Surface Smoothness composite variable from 9.07 in 1998 to 8.92 in 2000 was statistically significant as was the increase in mean value of the Debris Removal composite variable from 8.56 in 1998 to 8.79 in 2000. The 1998 to 2000 changes in the mean values of the composite variables for Winter Maintenance, Striping, Signage, Winter Roadway Information, Roadside Maintenance and Rest Stop Maintenance were not statistically significant.
Respondents Perception of How The Montana Department of Transportation Could Do Better in the Area of Highway Maintenance
The respondents were asked in the form of an open-ended question, what the Department of Transportation could do better in terms of maintenance. The responses were categorized and Table Eight presents a general summary of the categorized answers.

32
TABLE EIGHT WHAT COULD THE TRANSPORTATION DEPARTMENT DO BETTER IN
TERMS OF MAINTENANCE
Rest Area Maintenance 134 16.5% Winter Maintenance 128 15.8% Make Surfaces Smoother 111 13.7% More lanes/Wider Roads 67 8.3% Construction 66 8.1% Striping 60 7.4% Debris Removal/Roadsides 50 6.2% Roadsides 49 6.0% Signage 34 4.2% Better Maintenance 24 3.0% Improve Maintenance 24 3.0% Personnel Management 24 3.0% Funding 18 2.2% Speed Limits/Enforcement 13 1.6% Make Repairs Faster 9 1.1% TOTAL 811 100.0% Table Eight shows the three areas most often singled out as needing improvement were rest area maintenance, winter maintenance, and highway surfaces.
In What Maintenance Activities Does the Department of
Transportation Currently Do a Good Job
The respondents were also asked in an open-ended question what maintenance activities done by the MDT met or exceeded the respondents expectations. These answers were also categorized and Table Nine summarizes the answers to this question.

33
TABLE NINE MAINTENANCE ACTIVITIES THAT MEET OR EXCEED
RESPONDENTS’ EXPECTATIONS
Doing a good job 139 31.0% Winter Maintenance 106 23.7% General Maintenance 47 10.5% Best they can with resources 28 6.2% Debris Removal 22 4.9% Surface Smoothness 17 3.8% Improving Roads 13 2.9% Roadside Maintenance 11 2.5% Signage 11 2.5% Are Improving 11 2.5% Striping 8 1.8% Rest Areas 8 1.8% Construction 8 1.8% Prompt Repair 6 1.3% Roadway Information 6 1.3% Employees 4 0.9% Website 3 0.7% TOTAL 448 100% Table Nine shows 31% of the respondents believe that MDT is doing a good job and another 6.2% think MDT is doing as well as it can with the resources it has. Table Nine also shows that winter maintenance is the area most pointed to by respondents as meeting or exceeding their expectations for highway maintenance.
Willingness to Participate in a Follow Up Study
Finally, the respondents were asked if they would be willing to participate in a follow up study. Figure Eleven shows that 48.0% of the respondents indicated they would be willing to participate in a follow up study while 38.7% said they would not be and 13.3% said they did not know whether or not they would be interested in participating in a follow up study.
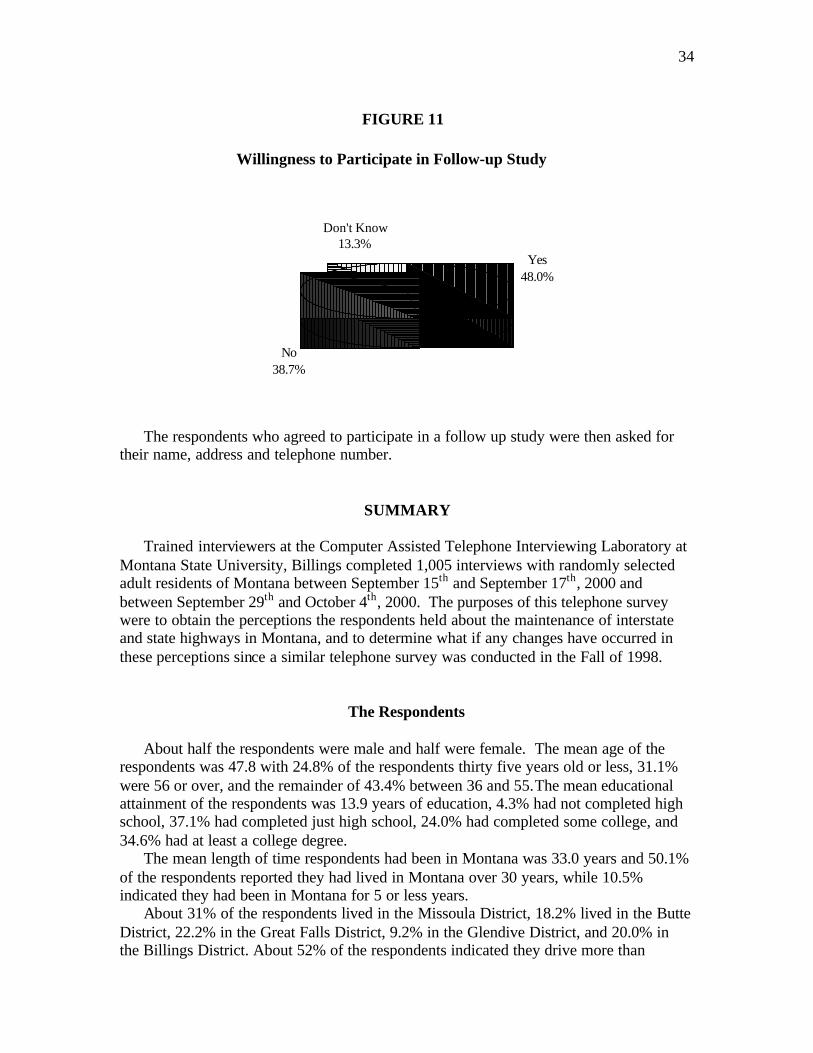
34
FIGURE 11
Willingness to Participate in Follow-up Study
No38.7%
Yes48.0%
Don't Know13.3%
The respondents who agreed to participate in a follow up study were then asked for their name, address and telephone number.
SUMMARY
Trained interviewers at the Computer Assisted Telephone Interviewing Laboratory at Montana State University, Billings completed 1,005 interviews with randomly selected adult residents of Montana between September 15th and September 17th, 2000 and between September 29th and October 4th, 2000. The purposes of this telephone survey were to obtain the perceptions the respondents held about the maintenance of interstate and state highways in Montana, and to determine what if any changes have occurred in these perceptions since a similar telephone survey was conducted in the Fall of 1998.
The Respondents About half the respondents were male and half were female. The mean age of the respondents was 47.8 with 24.8% of the respondents thirty five years old or less, 31.1% were 56 or over, and the remainder of 43.4% between 36 and 55.The mean educational attainment of the respondents was 13.9 years of education, 4.3% had not completed high school, 37.1% had completed just high school, 24.0% had completed some college, and 34.6% had at least a college degree. The mean length of time respondents had been in Montana was 33.0 years and 50.1% of the respondents reported they had lived in Montana over 30 years, while 10.5% indicated they had been in Montana for 5 or less years. About 31% of the respondents lived in the Missoula District, 18.2% lived in the Butte District, 22.2% in the Great Falls District, 9.2% in the Glendive District, and 20.0% in the Billings District. About 52% of the respondents indicated they drive more than

35
15,000 miles per year, while 47.8% drove less than 15,000 miles. The most common trip made by respondents were personal or family errands (52.2%), followed by commuting (22.4%) and then work related trips (16.5%). Seventy-two percent of the respondents indicated they had driven in other states within the last 12 months.
General Perception of Highway Maintenance
When asked to rate overall highway maintenance, 5.2% of the respondents rated overall maintenance as poor while 28.9% said fair, 58.8% said good and 7.1% said excellent. Respondents driving less than 15,000 miles per year rated general maintenance higher than did respondents driving over 15,000 miles per year, and respondents who had driven in other states in the last 12 months rated general maintenance lower than did respondents who had not driven in other states. There was a statistically significant increase in the mean rating, on a 1 to 4 scale labeled as poor, fair, good and excellent, of overall highway maintenance from 2.50 in 1998 to 2.68 in 2000. When asked to rate the importance of highway maintenance to them, 36.2% of the respondents said very important, 58.1% said important, 5.7% said somewhat important, and no one said not important. General highway maintenance was more important to respondents who had been in Montana for over 20 years than it was to respondents who had been here for less time and it was least important to respondents who had been in Montana for 11 to 20 years. On a 1 to 4 scale labeled as not important, somewhat important, important and very important, the mean importance rating for general highway maintenance decreased significantly from 3.40 in 1998 to 3.31 in 2000.
Comparison of Highway Maintenance in Montana with Other States
About fifty-two percent of the respondents who had driven in other states within the last 12 months said the highways and interstates of Montana were about the same as the highways and interstates in the other states in which they had driven, while 30.4% felt the roads in Montana were worse and 18.1% felt the roads in Montana were better. Respondents in the Glendive district were more likely than respondents in other districts to believe general highway maintenance was worse in Montana than in other states while respondents in the Missoula, Butte and Billings districts were more likely to think Montana highway maintenance was about the same as in other states. Fifty-eight percent of the respondents who had driven in other states and who had an opinion believed winter maintenance was about the same in Montana as in other states, while 24.7% believed winter maintenance was better in Montana and 17.3% believed winter maintenance was worse in Montana. Residents of the Glendive district were more likely than respondents living in other districts to believe that winter maintenance was worse in Montana than in other states. The percentage of respondents saying Montana winter maintenance was better than winter maintenance in other states decreased significantly from 1998 to 2000 while the percentage of respondents thinking winter maintenance was about the same in Montana and other states increased significantly from 1998 to 2000.

36
About 47% of the respondents who had driven in other states in the last 12 months and who had an opinion, felt rest area maintenance was about the same in Montana as in other states, while 39.4% said rest stop area maintenance was worse in Montana and 13.4% said it was better in Montana. Generally, the longer a respondent had lived in Montana, the more likely they were to say that rest area maintenance was worse in Montana than in other states. The percentage of respondents who had driven in other states believing rest area maintenance was worse in Montana than in other states increased significantly from 28.9% in 1998 to 39.4% in 2000.
Respondent Perception of the Eight Maintenance Activities
For the purposes of this survey, highway maintenance activities were divided into 8 categories: winter maintenance, maintaining a smooth highway surface, maintenance of roadsides, maintenance of signs, debris removal, rest stop maintenance, striping maintenance, and winter road condition reports. The respondents were asked three different questions about each of these eight maintenance activities. First they were asked how good a job the Montana Department of Transportation (MDT) was doing with each of the eight maintenance activities and to respond with poor, fair, good, or excellent. Then they were asked how important each of the maintenance activities were to them and to respond with not important, somewhat important, important, or very important. Finally, the respondents were asked to think of the allocation of resources to each of the maintenance activities by the MDT and assign a resource priority of low, medium, moderately high, or very high to each of the eight maintenance activities. A composite variable was then constructed for each of the maintenance activities by combining the answers to the three different questions asked about that activity. To construct these variables, the first step was to reverse the values assigned to the responses to the rating of each maintenance activity. After reversal, an excellent rating = 1, a good rating = 2, a fair rating = 3, and a poor rating = 4. Then the composite variable for each maintenance activity was created by adding this reversed value for rating, the score on the importance question (1 = not important, 2 = somewhat important, 3 = important and 4 = very important), and the score on the resource priority question (1 = low, 2 = medium, 3 = moderately high, and 4 = high). If a respondent had answered all three of the questions about a maintenance activity, the range of scores on the composite variable for that activity would be from 3 to 12. If the value of the composite variable were a 3, it would indicate an excellent rating of the activity, an answer of not important on the importance question and of low priority on the resource priority question. A score of 12 would indicate a poor rating, very important and a high resource priority. A score of less than 3 is possible if the respondent did not answer each question about a particular maintenance activity. The higher the score on this composite variable, the lower the rating, the more important the activity is considered, and the higher the resource priority assigned to the activity. Thus, the higher the score on the composite variable, the more attention respondents believe should be paid to the maintenance activity. The overall mean scores for each of the composite variables are: Winter Maintenance, 9.10; Highway Striping, 8.99; Smoothness of Surface, 8.92; Debris Removal, 8.79; Highway Signage, 8.14; Winter Roadway Information, 7.96; Roadside Maintenance,
37
7.79; and Rest Stop Maintenance, 7.76. In 1998 the mean scores on the composite variables were: Winter Maintenance 9.10; Highway Striping, 8.88, Smoothness of Surface, 9.07; Debris Removal, 8.56; Highway Signage, 8.24; Winter Roadway Information, 7.98; Rest Stop Maintenance, 7.69; and Roadside Maintenance, 7.82. Only two of the composite variable changes from 1998 to 2000 were statistically significant. The decrease in the mean value of the Surface Smoothness composite variable from 9.07 in 1998 to 8.92 in 2000 was statistically significant as was the increase in the mean value of the composite variable for Debris Removal from 8.56 in 1998 to 8.79 in 2000. Further comparison of the 1998 and the 2000 means of composite variables shows only one change in order from 1998 to 2000. The composite variable for striping climbed from third from the highest in 1998 to second from the highest in 2000 while the composite variable for surface smoothness fell from second place in 1998 to third place in 2000.
Winter Maintenance The mean composite score for winter maintenance is the highest of all the composite variables because it is rated the most important maintenance activity by the respondents and is assigned the highest resource priority by the respondents. This rating is consistent with the statistically significant decrease from 1998 to 2000 in the percentage of respondents who thought winter maintenance was better in Montana than in other states. Respondents who reported driving more than 15,000 miles in the last 12 months scored higher on the Winter Maintenance composite variable than did respondents who drove less than 15,000 miles. Respondents over 65 scored lower on the Winter Maintenance composite variable than did younger respondents. Respondents who had been in Montana for 5 or less years scored lower on the Winter Maintenance composite variable than did respondents who had been in Montana longer.
Highway Striping
Striping ranks second in terms of the composite variable score because it was second in importance and priority but 5th in terms of rating. Females scored higher than males on the Striping composite variable. The rating for current condition of highway striping decreased significantly from 1998 to 2000
Highway Surface Smoothness Smoothness of highway surface is rated the third on the composite variable, not so much because of its importance and resource priority which fall near the middle of the ratings for all maintenance activities, but because of the rating of the current condition of highway surfaces. Respondents rated the current condition of highway surface smoothness last as compared with other maintenance activities, even though the rating of surface smoothness did increase significantly from 1998 to 2000.The composite variable

38
mean for surface smoothness decreased significantly from 9.07 in 1998 to 8.92 in 2000. Respondents who had driven in other states and respondents who had driven more than 15,000 in the last 12 months scored higher on the surface smoothness composite than did those who had not driven in other states or who had driven less than 15,000 miles. Respondents from 36 to 55 scored higher on the Surface Smoothness composite variable than did respondents who were younger or older while respondents over 75 scored lower on this composite variable than younger respondents did. Respondents who were professional drivers and respondents who said their most frequent trip was work related scored higher on the Surface Smoothness composite variable than did respondents who indicated any other type of typical trip.
Debris Removal Debris removal ranks fourth in terms of the composite variable ratings because it is in about the middle of the rankings for rating of importance and resource priority, but is ranked somewhat lower in terms of current condition. The mean value of the composite variable for Debris Removal increased significantly from 8.56 in 1998 to 8.79 in 2000. Females respondents scored higher than male respondents on the Debris removal composite variable. Respondents who drove more than 15,000 miles per year scored higher than did respondents who drove less than 15,000 miles per year. The rating of the current condition of debris removal decreased significantly from 1998 to 2000 while the perceived importance of debris removal to respondents increased significantly from 1998 to 2000
Highway Signage The Signage composite variable is fifth because it is ranked toward the bottom of the eight maintenance activities in terms of importance and priority and because the current condition highways signs is rated higher than any other maintenance activity. Female respondents score higher on the Signage composite variable than did males. Respondents over 75 scored higher on the Signage composite variable than did younger respondents and 26 to 35 year old respondents scored lower than younger or older respondents. Respondents with a high school diploma, some college or post graduate education scored higher on the Signage composite variable than did respondents with other levels of education attainment. Respondents whose most frequent trip was personal scored the highest on the Signage composite variable while those whose most frequent trip was agriculturally related scored the lowest. The resource priority allocated to highway signage decrease significantly from 1998 to 2000.
Winter Roadway Information Winter roadway information is rated sixth in terms of composite variable means, not because it is given a low resource priority, but because respondents rate it second highest

39
in terms of current condition and toward the bottom in terms of importance. Respondents who had been in Montana for over 10 years scored higher on the Winter Roadway Information composite variable than did respondents who had been in Montana for less time. Professional drivers and respondents who said their most frequent trip was work related scored higher on the Winter Roadway Information composite variable than did respondents who most frequent trips were commuting, personal or agriculturally related. The perceived importance of winter roadway information decreased significantly from 1998 to 2000 as did the resource priority allocated to winter roadway information.
Roadside Maintenance Roadside maintenance is seventh in terms of composite variable means because it is ranked dead last in terms of importance and resource priority. Female respondents scored higher on the Roadside Maintenance composite variable than did male respondents.
Rest Stop Maintenance
Rest stop maintenance is last place in terms of composite variable means even though it is rated next to last in current condition because it is ranked next to the last in importance and third from the last in terms of resource priority. This last place rating in composite variable is also in spite of the fact that a higher percentage of respondents who had driven in other states thought Rest Stop Maintenance was worse in Montana than in other states in 2000 than did in 1998. The last place rating is also in spite of the fact that improvement of Rest Stop Maintenance was the most frequently mentioned thing that MDT could do better. The current condition of the rating for Rest Stop Maintenance decreased significantly from 1998 to 2000, but so to did the importance rating. No statistically significant relationships were found between score on the Rest Stop Maintenance composite variable and any travel or demographic variable.
1998 to 2000 Differences
The following statistically significant differences were observed when comparing 1998 and 2000 data: • The general rating of Montana highway maintenance increased from 2.50 in 1998 to
2.68 in 2000. • The rating of importance of Montana highway maintenance decreased from 3.40 in
1998 to 3.30 in 2000. • The percentage of respondents who had driven in other states who thought winter
maintenance in Montana was better than in other states decreased from 31.2% in 1998 to 24.7% in 2000.
• The percentage of respondents who had driven in others states who thought rest stop maintenance was worse in Montana than in other states increased from 28.9% in 1998 to 39.4% in 2000.

40
• The rating for Surface Smoothness increased from 2.31 in 1998 to 2.44 in 2000. • The rating for Debris Removal decreased from 2.73 in 1998 to 2.64 in 2000. • The rating for Rest Stop Maintenance decreased from 2.81 in 1998 to 2.58 in 2000. • The rating for Highway Striping decreased from 2.78 in 1998 to 2.70 in 2000. • The importance of Winter Roadway Information decreased from 3.36 in 1998 to 3.22
in 2000. • The importance of Debris Removal increased from 3.31 in 1998 to 3.37 in 2000. • The importance of Rest Stop Maintenance decreased from 3.20 in 1998 to 3.07 in
2000. • The resource priority for Signage decreased from 3.03 in 1998 to 2.92 in 2000. • The resource priority for Winter Roadway Information decreased from 3.32 in 1998
to 3.22 in 2000. • The composite variable for Surface Smoothness decreased from 9.06 in 1998 to 8.92
in 2000 • The composite variable for Debris Removal increased from 8.55 in 1998 to 8.79 in
2000.
CONCLUSIONS AND IMPLEMENTATION
According to the respondents to this survey, the Montana Department of Transportation should now pay attention and provide resources to maintenance activities on interstate and state highways in Montana in the following order:
• Winter Maintenance • Highway Striping • Surface Smoothness • Debris Removal • Highway Signage • Winter Roadway Information • Roadside Maintenance • Rest Stop Maintenance

41
REFERENCES Floyd, J.W. (1996), Perceptions of Highway Maintenance in Montana: The Results of a Telephone Survey. Final Report. FHWA/MT-96/8136A, Montana Department of Transportation, Helena, MT. Floyd, J.W. (1998), Perceptions of Highway Maintenance in Montana in 1998: The Results of a Telephone Survey, Final Report. FHWA/MT-98/8136B, Montana Department of Transportation, Helena, MT.

42
APPENDIX ONE:
MAP SHOWING MDT ADMINISTRATIVE DISTRICTS AND MONTANA COUNTIES

43

44
APPENDIX TWO:
TRANSPORTATION SURVEY QUESTIONS

45
Question Hello Hello, my name is _____ and I am calling from Montana State University, Billings. We are conducting a survey on attitudes and opinions of highway maintenance for the Montana Department of Transportation. The Department of Transportation wants the opinions of citizens of Montana about the condition of our roadways. Your participation in this survey will assist the department in establishing future priorities and enable the maintenance program to better use available resources. In order to interview the right person, I need to speak to the member of your household who is at home, over 18, and has had the most recent birthday. Would that be you? CTRl-END OR 3 DIGITS Question Intruct Before I ask the first question, let me explain that this survey deals only with maintenance of highways. Maintenance includes such things as maintaining the established roadway surface, snow and ice removal, removal of debris and litter, maintaining roadsides, repairing signs, re-painting roadway stripes and rest area maintenance. This survey does not deal with the construction of new highways nor construction of new rest stops. This survey only deals with interstates and state highways in Montana. We are not asking you about city streets or county roads, just interstates and state highways. Also, we are only interested in opinions based on your experiences with interstates and state highways in Montana in the last two years. Finally, your household was randomly selected by a computer and all your answers will remain anonymous. PRESS ANY KEY TO CONTINUE Question RateAll How would you rate overall interstate and state highway maintenance in Montana? 1. Poor 2. Fair 3. Good 4. Excellent 5. DK or NR

46
Question ImpAll How important would you say interstate and state highway maintenance in Montana is to you? 1. Not Important 2. Somewhat Important 3. Important 4. Very Important 5. DK or NR Question RateWint How would you rate winter maintenance of interstates and state highways in Montana? By winter maintenance, I mean snow and ice control including plowing, sanding, de-icing, and preventing drifting. 1. Poor 2. Fair 3. Good 4. Excellent 5. DK or NR Question ImpWint How important would you say interstate and state highway winter maintenance is to you? 1. Not Important 2. Somewhat Important 3. Important 4. Very Important 5. DK or NR

47
Question RateSurf How would you rate the surface of Montana's interstates and state highways. In making this rating, consider ride quality which is affected by potholes, ruts, bumps, cracks, etc. 1. Poor 2. Fair 3. Good 4. Excellent 5. DK or NR Question ImpSurf How important is the smoothness of Montana's interstates and state highways to you? 1. Not Important 2. Somewhat Important 3. Important 4. Very Important 5. DK or NR Question RateSide How would you rate the management of interstate and state highway roadsides in Montana? Roadside management includes mowing shoulders and eliminating unwanted vegetation. 1. Poor 2. Fair 3. Good 4. Excellent 5. DK or NR
48
Question ImpSide How important is interstate and state highway roadside management in Montana to you? 1. Not Important 2. Somewhat Important 3. Important 4. Very Important 5. DK or NR Question RateSign How would you rate the condition of interstate and state highway signs in Montana? 1. Poor 2. Fair 3. Good 4. Excellent 5. DK or NR Question ImpSign How important is the condition of interstate and state highway signs to you? 1. Not Important 2. Somewhat Important 3. Important 4. Very Important 5. DK or NR

49
Question RateRemv How would you rate the removal of debris such as litter, roadkill, and fallen rocks, on Montana's interstates and state highways? 1. Poor 2. Fair 3. Good 4. Excellent 5. DK or NR Question ImpRemv How important is the removal of debris on interstates and state highways in Montana to you? 1. Not Important 2. Somewhat Important 3. Important 4. Very Important 5. DK or NR Question RateRest How would you rate the maintenance of rest areas on Montana interstates and state highways. Rest area maintenance includes cleaning rest areas and keeping rest areas in working order. 1. Poor 2. Fair 3. Good 4. Excellent 5. DK or NR
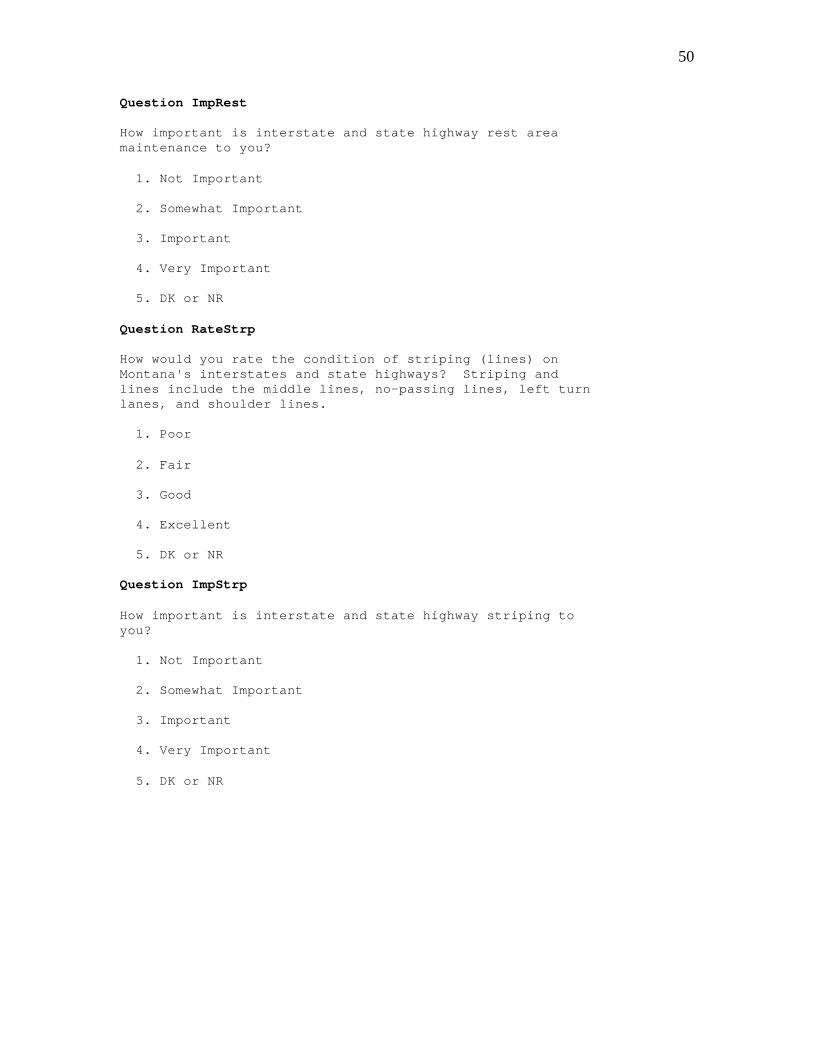
50
Question ImpRest How important is interstate and state highway rest area maintenance to you? 1. Not Important 2. Somewhat Important 3. Important 4. Very Important 5. DK or NR Question RateStrp How would you rate the condition of striping (lines) on Montana's interstates and state highways? Striping and lines include the middle lines, no-passing lines, left turn lanes, and shoulder lines. 1. Poor 2. Fair 3. Good 4. Excellent 5. DK or NR Question ImpStrp How important is interstate and state highway striping to you? 1. Not Important 2. Somewhat Important 3. Important 4. Very Important 5. DK or NR

51
Question RateInfo How would you rate winter roadway information and the way it is provided by the Montana Department of Transportation? Roadway information is provided by a statewide 800 telephone number, highway advisory radio, and changeable message signs. 1. Poor 2. Fair 3. Good 4. Excellent 5. DK or NR Question ImpInfo How important is up to date winter interstate and state highway information to you? 1. Not Important 2. Somewhat Important 3. Important 4. Very Important 5. DK or NR Question PriWint Now I am going to go back through the list of maintenance activities. This time, I want you to think about allocation of resources to each of the activities. For each activity, please tell me if you think it warrants a low, medium, moderately high, or very high resource priority when deciding how state highway maintenance resources should be utilized. Remember, we are only dealing with interstates and state maintained roadways. What resource priority should be placed on interstate and state highway winter maintenance in Montana? 1. Low 2. Medium 3. Moderately High 4. Very High 5. DK or NR

52
Question PriSurf What resource priority should be placed on smooth pavement on interstates and state highways in Montana? 1. Low 2. Medium 3. Moderately High 4. Very High 5. DK or NR Question PriSide What resource priority should be placed on interstate and state highway roadside management in Montana? 1. Low 2. Medium 3. Moderately High 4. Very High 5. DK or NR Question PriSign What resource priority should be placed on repairing and replacing signs on interstates and state highways in Montana? 1. Low 2. Medium 3. Moderately High 4. Very High 5. DK or NR

53
Question PriRemv What resource priority should be placed on debris removal on interstates and state highways in Montana? 1. Low 2. Medium 3. Moderately High 4. Very High 5. DK or NR Question PriRest What resource priority should be placed rest area cleanliness and maintenance on interstates and state highways in Montana? 1. Low 2. Medium 3. Moderately High 4. Very High 5. DK or NR Question PriStrp What resource priority should be placed on roadway striping on interstates and state highways in Montana? 1. Low 2. Medium 3. Moderately High 4. Very High 5. DK or NR

54
Question PriInfo What resource priority should be placed providing accurate and up to date information about the current condition of state maintained highways in Montana? 1. Low 2. Medium 3. Moderately High 4. Very High 5. DK or NR Question OthState Just a couple of more questions about interstate and state highway maintenance. Have you driven on roadways in states other than Montana in the last 12 months? 1. Yes 2. No 3. DK or NR Question GenComp How would you compare general roadway conditions of Montana's state maintained roadways with the general roadway conditions of state maintained roadways in other states? IF THEY SAY THEY HAVE BEEN IN MORE THAN ONE STATE, ASK FOR A GENERAL COMPARISON. IF THEY CANNOT DO THAT, HAVE THEM COMPARE WITH THE STATE THEY DROVE IN MOST RECENTLY. 1. Montana roadways worse 2. About the same 3. Montana better 4. DK or NR

55
Question WintComp How would you compare winter maintenance of Montana's state maintained roadways with winter maintenance of state maintained highways in other states? 1. Montana winter maintenance worse 2. About the same 3. Montana better 4. DK or NR Question RestComp How would you compare rest area cleanliness and maintenance in Montana with rest area cleanliness and maintenance in other states? 1. Montana rest areas worse 2. About the same 3. Montana better 4. DK or NR Question Better The Department of Transportation is striving to improve maintenance operations. In your opinion what could the department do better? TYPE IN ANSWER AND THEN CLICK THE NEXT BUTTON. YOU HAVE 3 LINES. Question GoodNow What is the department doing that meets or exceeds your expectations? TYPE IN RESPONSE AND THEN CLICK THE NEXT BUTTON. YOU HAVE 3 LINES.

56
Question Trips As you probably know different types of people have different types of opinions. The following questions are for statistical purposes only. Which of the following types of trips would you say is most typical of your driving? 1. Commuting to and from work 2. Work related trips, that is trips that are made as a part of work activities. 3. Personal and family errands or trips 4. Agriculture related trips 5. Professional driving 6. Other 7. DK or NR Question HowFar Would you say you drive more or less than 15,000 miles per year? 1. More 2. Less 3. DK or NR Question Age How old are you? TYPE IN THEIR AGE AND PRESS ENTER USE 100 FOR 100 OR OLDER AND 101 FOR DK OR NR. Question Educ What is the highest level of education you have completed? TYPE IN ANSWER AND PRESS ENTER. 12 IS HIGH SCHOOL GRADUATE, 16 IS COLLEGE GRADUATE, 18 IS MASTERS DEGREE AND 20 IS DOCTORATE. USE 21 FOR DK OR NR

57
Question InMT How long have you lived in Montana? TYPE IN THEIR ANSWER AND PRESS ENTER USE 100 FOR 100 OR MORE AND 101 FOR DK OR NR. Question Sex RESPONDENTS SEX (DO NOT ASK) 1. MALE 2. FEMALE 3. CANNOT TELL Question Followup The Montana Department of Transportation may make changes in the way it allocates resources based on the results of this study. Would you be willing to participate in a follow up study so that we can see if your opinions of highway maintenance change in the next two years? 1. Yes 2. No 3. DK or NR Question Address In order to include you in the follow up study, I will need your name, address and telephone number. ENTER NAME ON ONE LINE; STREET ADDRESS ON THE NEXT LINE; CITY, STATE, AND ZIP CODE ON THE THIRD LINE; AND TELEPHONE NUMBER ON THE FOURTH LINE. PLEASE USE APPROPRIATE CAPITALIZATION AND SPELLING. YOU HAVE AN EXTRA LINE FOR ANY STRANGE THINGS IN THE ADDRESS. Question Bye That was the last question. Thank you very much for taking the time to answer these questions. Good bye and have a nice day (or evening).

58

59
Montana Department of Transportation MDT is on the web at: www.mdt.state.mt.us The survey and the preceding two surveys are also available on the MDT web site at: http://www.mdt.state.mt.us/departments/maintenance/ The Montana Department of Transportation (MDT) attempts to provide reasonable accommodations for any disability that may interfere with a person participating in any service, program, or activity of the department. Alternative accessible formats of this document will be provided upon request. For further information call (406) 444-6331(V) or toll free at (800) 335-7592(T). 100 copies of this publication were produced at an estimated cost of $1.16 per copy for a total of $116.00, which includes the cost of printing and binding and $0.00 for distribution.

60