Perceptions of Country Brands in Trade and Tourism ... · Perceptions of Country Brands in Trade...
25
Perceptions of Country Brands in Trade and Tourism: Antecedents and Consequences from Latin America and the Middle East ABSTRACT Although country branding has been a burgeoning theme in the international business literature, comparative studies of this construct across cultures have been limited. The development of a deeper understanding of how diverse nations perceive country brands from their own paradigms is important in the complex world of international business. This study develops and tests a survey instrument in Peru and the Kingdom of Saudi Arabia to assess perceptions of country brands as well as the underlying antecedents to brand preferences. Results from a sample of 154 working adults (Peru 62, Saudi Arabia 92) include the findings that trade preferences are related to top tourism destinations and that consumers from Peru and Saudi Arabia differ in antecedents to country trade choices. Managerial implications and future research directions are also discussed. 1 1
Transcript of Perceptions of Country Brands in Trade and Tourism ... · Perceptions of Country Brands in Trade...

Perceptions of Country Brands in Trade and Tourism: Antecedents and Consequencesfrom Latin America and the Middle East
ABSTRACT
Although country branding has been a burgeoning theme in the international business literature, comparative studies of this construct across cultures have been limited. The development of a deeper understanding of how diverse nations perceive country brands from their own paradigms is important in the complex world of international business. This study develops and tests a survey instrument in Peru and the Kingdom of Saudi Arabia to assess perceptions of country brands as well as the underlying antecedents to brand preferences. Resultsfrom a sample of 154 working adults (Peru 62, Saudi Arabia 92) include the findings that trade preferences are related to top tourism destinations and that consumers from Peru and Saudi Arabia differ in antecedents to country trade choices. Managerial implications and future research directions are also discussed.
1 1

Introduction
As more and more nations attempt to leverage their national identities in the global
marketplace obtaining a deeper understanding of country brand perceptions by consumers from
various cultures of the world will become increasingly important. This is of particular interest to
business and governmental leaders in emerging economies as they face increasing competition with
other nations worldwide in attempts to differentiate and define the added value of products and
services from their home countries. The purpose of this study is to empirically examine perceptions
of country images, or country brands, by working adults from Peru and Saudi Arabia, through the
unique lens of both trade and tourism. We operationalize country branding conceptually through the
country of origin (CoO) literature (Roth & Diamantopoulos, 2009).
Scholars have long studied the national origin of a product and its potential to add to the
overall perceived image of quality in a given country (Han, 1989). Indeed, it was fifty years ago
that Dichter (1962) argued that marketing managers of the future will have to pay more attention to
the similarities and differences among consumers from different parts of the world. More recently,
Papadopoulos and Heslop (2002) found that country-based marketing is either underused or
misdirected due to misconceptions surrounding the meaning of 'country branding.' Other scholars
have studied country branding from a number of perspectives and the foundation of this field of
research has expanded gradually over time (Laroche et al., 2005).
On the practitioner side, many governments have begun to see the intrinsic value of country
branding and have instituted formal offices, programs and policies. In Colombia and Peru, for
example, “Marca Pais” or country branding offices have been created with high level reporting to
either Ministers of Trade or Tourism. Consulting firms, such as Bloom Consulting in Madrid, have
begun to focus on country branding as a way for nations to augment and clarify their competitive
2 2

advantages in the global economy. It has become commonplace now for firms to place their
national flag or logo (yes, many nations now have logos to support the country brand) on products
destined for consumers in foreign nations.
Despite governmental progress, and the increase in academic literature in recent years of
studies and conceptual frameworks related to CoO, very little work has been done in the Middle
East or Latin America (Roth & Diamantopoulos, 2009). Further, a true gap in the literature exists
with respect to contrasting perceptions of country brands between different developing nations of
the world. One of the major critiques of the CoO literature is that there has been an extraordinarily
heavy reliance on U.S. samples in research studies (Roth & Diamantopoulos, 2009). Moreover, few
studies have ventured beyond Europe and North America and cross-national comparisons of two
culturally different developing countries have been virtually nonexistent. The measurement of both
trade and tourism constructs simultaneously has also yet to materialize in the literature. We bridge
these gaps while also building in two unique contributions: first we measure perceptions of a large
swath of national brands not just a small subset (over 100 nations) and second, we assess
antecedents to CoO perceptions, or what we refer to as country brand drivers.
This paper is arranged as follows. In the next section we review the country branding
literature as well as cultural differences between Peru and Saudi Arabia. This is followed by the
development of formal hypotheses related to country of origin and country branding. A description
of our methodology is then presented. The paper concludes with a discussion of results, future
research directions and managerial implications.
Country Branding across Cultures: Literature Review and Hypotheses
The importance of a national image to consumers of products and services is a factor that
may sway an individual from one country to another depending upon the underlying factors that
3 3

support a perception of a country image or brand (Laroche et al., 2005). Researchers have found
that from a tourism perspective many factors are considered when rating potential destinations
Nikolova & Hassan, 2011). For example, Frauman and Norman (2004) identified that potential
tourists seek a multiplicity of experiences when searching for locations. The ability of a country
to brand itself, while unifying the nation’s many attributes, is an important factor as well (Gnoth,
2002). One study concluded that countries with more formalized branding strategies tend to do
better at attracting tourism that those without (Kotler & Gertner, 2002). Gilmore (2002)
proposed a conceptual framework and argued that ‘thoughtful brand positioning’ can give a
country a competitive advantage over other nations. Gilmore’s framework contends that a
country's brand must capture the spirit of its people and must incorporate data from four key
factors: macrotrends, target groups, competitors and core competencies. The extent to which
scholars and practitioners genuinely know what drives perceptions is relatively unknown yet
factors such as strength of an economy, traditionally powerful industries, advertising and external
ratings by various consumer groups tend to play an important role in the evaluative process.
The country of origin literature has yet to reach a consensus on either a comprehensive
measure of the construct or the primary antecedents to cognitions about country perceptions
(Laroche et al, 2005). For the purpose of this paper we utilize the ‘country image’ definition set
forth by Alfred et al., 1999 (p.36), “The perception or impression that organizations and
consumers have about a country. This impression or perception of a country is based on the
country’s economic condition, political structure, culture, conflict with other countries, labor
conditions, and stand on environmental issues.” Although some of these antecedent factors that
drive perceptions of countries are measurable other are not. Also, the weight that consumers
4 4

may place on one factor versus another may vary considerably due to a wide range of influential
factors.
Although there is an increasing awareness about country branding around the world, the
concept in the Middle East appears to have just started to take root. Examples of firms in some
GCC (Gulf Cooperation Council) countries1 actively thinking about CoO, what it means, and
how to incorporate it in principle and practice are becoming more evident. Saudi Arabia, a
member of the GCC, is a host to many important industries such as petrochemicals and refining,
banking, and healthcare. In the recent years, Saudi firms have started putting more emphasis on
country branding best practices and have begun to show greater commitment in terms of
instituting a positive and familiar image of the nation in various industries and institutions
(Mellahi et al., 2010).
In Peru country branding has been more visible and the national campaign has gained
many accolades. Peru’s country brand logo (inspired by the Incan archaeological sites) can be
found on numerous products and websites that originate in the country. In fact, Peru hired the
British firm FutureBrand to develop the concept and in March of 2011 launched the new logo at
the entrance to the New York Stock Exchange on Wall Street (Hirasuna, 2011). Moreover, one of
Peru’s country brand videos launched in 2012 has received over 1.4 million views on Youtube.
Many researchers of country branding concur that cultural differences play a significant
role in the formation of a brand perception (Knight et al., 2003; Roth & Diamantopoulos, 2009).
Culture has been referred to as a construct that is not static but rather an ongoing evolutionary
process that involves changes in the priorities of values at both individual and societal levels
(Triandis, 1995; Wines & Napier, 1992). As a culture changes and evolves, the worldview of
the members of that culture will likely face a transformation as well. The cultural dimension of
1 The GCC includes Bahrain, Kuwait, Oman, Qatar, Saudi Arabia and the United Arab Emirates
5 5
individualism vs. collectivism has been one of the most researched and debated constructs in the
cross-cultural management literature (Ralston et al. 1997; Schwartz, 1999; Triandis, 1995).
Individualism emphasizes the values of independence and self-sufficiency in meeting one’s
personal needs, interests, and goals, while collectivism emphasizes social harmony, social norms,
and duties that serve to meet the needs, interests, and goals of the wider collective rather than
those of the individual (Triandis, 1995).
Although Latin America and Saudi Arabia both have been traditionally classified as
collectivistic cultures (Hofstede 1997, Trompenaars 1994), the degree to which Peruvian
collectivism compares to Saudi collectivism is not clear. The literature suggests that Saudi
Arabia tends to have collectivistic traits while the Peru is even more collectivistic with a score on
Hofstede’s individualism scale of less than half of the Saudi ‘Arab World’ score (Ali, 1993;
Hofstede, 1997; Trompenaars, 1994). Another differentiator was revealed in a recent study of
managers from twelve Latin American nations in which the Peruvian group ranked highest,
relative to its peers, along a dimension titled self-direction (Lenartowicz & Johnson 2002).
Hofstede (1980) also found that Peru scored much higher on uncertainty avoidance that the Saudi
cohort, suggesting that Peruvians are less comfortable with risk-taking, stress and ambiguity.
Thus it appears that Peruvians are more in-group, risk avoidance, collectivists when compared to
the Saudi Arabian group.
From a cross-national paradigm it appears that differences in cultural traditions, such as
individualism versus collectivism, combined with variation in the relative importance placed on
different stakeholder groups, has created institutional environments in Saudi Arabia and Peru that
facilitate potential variation in perceptions of foreign nations as potential markets for trade or
tourism. Further, it appears logical that the underlying antecedents to perceptions of country
6 6

brands, or country brand drivers, are likely to vary across diverse cultural groups. With the
exception of geographic proximity, which has been linked to ease of trade, other core factors,
such as macrotrands and level of competition, tend to have room for cultural interpretation and
valuation (Gilmore, 2002; Roth & Diamantopoulous, 2009). Based on the above analysis of the
literature the following hypotheses have been developed:
Hypotheses
Hypothesis 1. Working adults from Saudi Arabia and Peru will differ in preferences of country brand drivers when selecting preferred trade nations.
Hypothesis 2. Working adults from Saudi Arabia and Peru will differ in their preferences of top tourism destinations.
Hypothesis 3. Regardless of culture, higher preferences to trade with foreign countries ispositively related to higher perceptions of top tourism countries.
Research Method
To test our hypotheses primary data were collected from respondents in Saudi Arabia and
Peru. The survey was developed and translated in late 2012 based on country branding
principles and a number of key demographic questions. The survey instrument was translated
(and back-translated) from English to Arabic, and English to Spanish, to ensure that proper
idiomatic language comes across clearly to the Saudi Arabian and Peruvian respondents (Alreck
& Settle, 1995). Respondents were informed that their participation was voluntary and that their
responses were kept completely anonymous (Alreck & Settle, 1995). Participants in the study
were volunteers who were enrolled in evening programs (MBA, certificate or undergraduate) in
Saudi Arabia and Peru. Only citizens from Saudi Arabia and Peru were allowed to participate.
Although every attempt was made to obtain a sample from each country that was
demographically equivalent, due to cultural constraints and accessibility to subjects some
differences were inevitable. The final number of usable surveys for each country was Saudi
7 7

Arabia n=92 and Peru n=62 for a total sample size of N=154. We did not query participants
about whether or not they were working full-time yet since we obtained surveys though part-time
evening and executive programs it was our understanding that the majority of our sample was
either fully employed or seeking a full-time position. Although it is plausible that many
respondents managed others we did not obtain specific data related to managerial
responsibilities. Also, response bias is a potential limitation yet there was no evidence that it
varied across the subgroups.
The survey consisted of three sections. In the first section 107 nations were rated on two
dimensions: trade and tourism. In our instructions we requested that the respondents rate their
perceptions of doing business and tourism in each country. The ratings ranged from 1 (negative)
to 5 (positive). The 107 countries were obtained from the Bloom Country Brand rankings for
2012. In section two of the survey each subject was asked to rate six factors that were important
in the formulation of his/her decision regarding trade or tourism ratings of each country. These
factors, or country brand drivers, were based on constructs suggested by prior scholars and were
scored for both trade and tourism (Gilmore, 2002; Roth & Diamantopoulos, 2009). The six
country trade drivers were listed as follows: geographic location, level of development, people,
similarity of culture, many opportunities, experience with country. These items were scored
from 1 (not important) to 5 (very important). The third section contained 19 demographic
questions. We went beyond the standard questions and probed deeper into the international
nature and experience of our sampled individuals by asking questions such as “have you spent
time outside your home country?” and “have you been employed outside your home country?”
and “does your firm currently have international operations?”
Insert Table 1 about here
8 8

In Table 1, a summary of the demographic makeup of the sample is presented. For the
Saudi sample, 71.7% had spent time outside of Saudi Arabia while only 53.2% of the Peruvians had
left their home countries. Interestingly, only 7.6% of the Saudi’s had worked abroad yet 26.2% of
the Peruvians has spent time as expatriates. Approximately 73.9% of the Saudi sample and 26,2%
of the Peruvian sample was female and close to 60% of both sub-groups indicated that they were
not married (57.4% Peru and 58.7% Saudi Arabia). With respect to religion 98.9% of the Saudis
indicated they were Muslim and 90.2% of the Peruvians were Christians. Over 90% of each sub-
group held at least an undergraduate degree. With regard to employment information more
Peruvians worked for private firms compared to the Saudis (89.7% versus 25.3% respectively).
Both groups had more than 60% employed in service jobs and the majority of each national cohort
worked for firms with 500 or more employees. Interestingly, the Peruvian group held a slight
advantage in international operations (57% compared to 50%).
Dependent variables
The first two dependent variables were created to measure global perceptions of trade and
tourism at the country level. Thus 107 nations were selected as a representative cross-section of
the world’s over 200 economies. To compute the trade variable we calculated the mean score for
all trade ratings for each country. The tourism variable calculation was the same using the 107
tourism scores. A third dependent variable, top tourism, was then created by taking the mean
scores for the world's top ten countries based on total number of tourist visitors each year
(UNWTO World Tourism Barometer). Note: These nations are listed in Table 6 where we
compare for differences across groups.
9 9

Independent and control variables
In order to ascertain which factors serve as antecedents to trade and tourism country
ratings we next utilized the data collected in section two of the survey related to country brand
drivers. Each respondent was asked to rate six constructs with respect to the extent to which
they mattered in evaluations of the 107 countries. The six factors (geographic location, level of
development, people, similarity of culture, many opportunities, and experience with country)
served as six independent variables and were also combined into two categorical variables:
institutional (geographic location, level of development, many opportunities) and cultural
(people, similarity of culture, experience with country). We also created 'expatriate' as an
independent variable. This was constructed by taking the means of three items from the
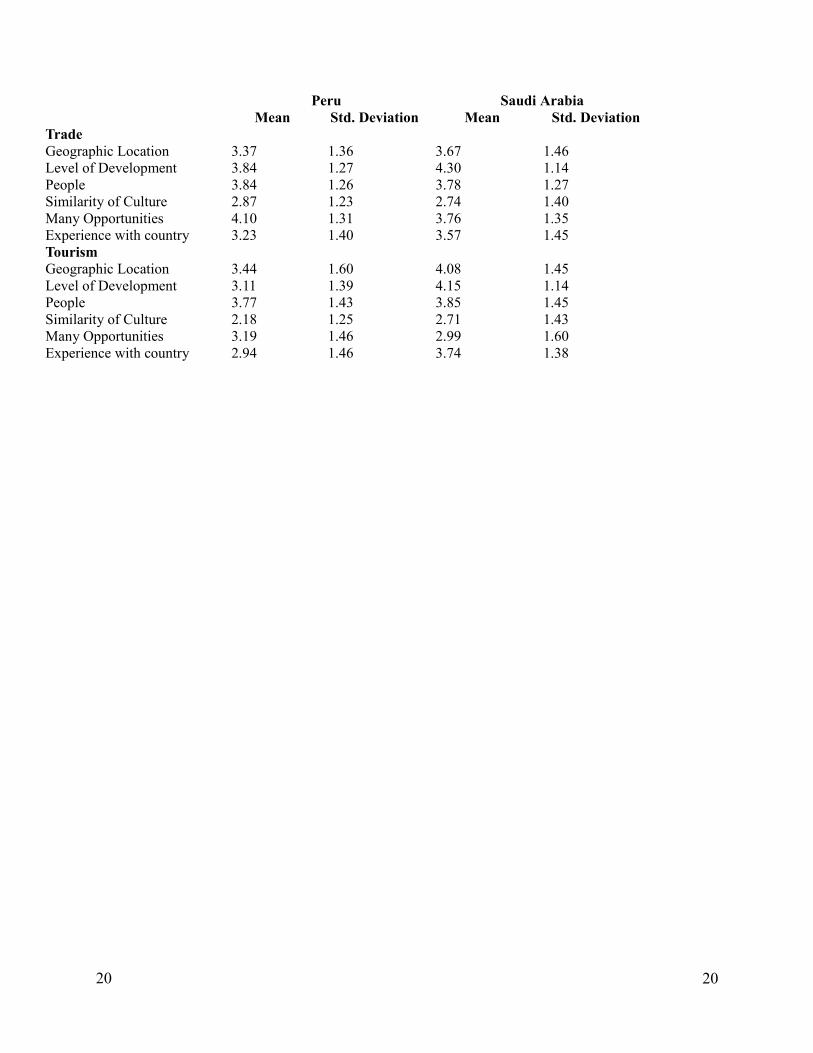
demographic section: lived abroad, worded abroad and spent time abroad. In Table 2 the means
and standard deviations for the six country brand driver variables are presented. The top trade
mean was many opportunities for Peru and level of development for Saudi Arabia. For tourism,
people was the highest score for Peru and, again, level of development for Saudi Arabia. One
interesting observation is that similarity of culture was the lowest scoring country brand driver
for trade and tourism and for both countries. Control variables included education, management
level, gender, marital status, age, firm size and expatriate experience.
Insert Tables 2, 3 and 4 about here
The results from two-stage hierarchical regression analysis are presented in Table 3. Two
two-stage models were run independently for Saudi Arabia and Peru with trade serving as the
dependent variable. The final model, Model 2, for Peru was significant (F=1.64) at the p<0.05
level with an R2 of 0.31. The country brand driver variable opportunities was significant for Peru
(B=.32) at the p<.05 level. Model 2 for Saudi Arabia (F=1.37) was significant at the p<.10 level
10 10

and the predictor variable geography (B=-.24) was significant (negative) at the p<.05 level. In
Hypothesis 1 we posited that working adults from Saudi Arabia and Peru will differ in preferences
of country brand drivers when selecting preferred trade nations. As a follow up analytical
procedure we performed an independent samples t-test and found significant differences between
Peru and Saudi Arabia on the culture and opportunities country brand driver variables (see Table 4).
Although our results are not overwhelmingly strong we did find that differences do indeed exist
between the two national subgroups thus Hypothesis 1 is supported.
Insert Table 5 and 6 about here
In Table 5 our results related to the testing of Hypothesis 2, that Saudi Arabia and Peru differ
in their preferences of top tourism destinations are presented. An independent samples t-test was
performed to explore significant differences between Peruvian and Saudi perceptions of the top ten
tourism destinations in the world. On 8 of the top 10 tourism countries the Saudi and Peruvian
group differed significantly. Peru scored higher than Saudi Arabia in preferences for China and
Russia whereas Saudi Arabia was higher on six nations: the U.S.A., Italy, Turkey, Germany, U.K.
and Malaysia. Thus Hypothesis 2 is supported. It appears that Saudi Arabia has a stronger
preference for either developed nations or nations that embrace Islam as the dominant religion
(Turkey and Malaysia). Peru has strong ties to China, culturally and economically, so that
preference makes sense. Based on the results it is plausible that there is an anti-Russia perception
by Saudi Arabia that yields the higher preference for Peru.
Hypothesis 3 focuses on relationships between variables utilizing the full sample, therefore
regardless of cultural differences. In H3 we theorize that higher preferences to trade with foreign
countries is positively related to higher perceptions of top tourism countries. In Table 6 Top
Tourism was utilized as the dependent variable while institutional, cultural and trade served as the
11 11

independent variables. Demographic variables were entered in stage 1 and the independent
variables in Stage 2. The overall model was significant (F=2.93; p<.01) and the R2 was .17.
Independent variables of institutional (B=.17; p<.05) and trade (B=.31; p<.001) were significantly
related to Top Tourism. This suggests that regardless of culture working adults prefer top tourism
destinations in which that also have a positive impression of trade as well as a high regard for the
institutional environment.
Support of our hypotheses suggests two key findings. First, the cognitive driving forces, or
antecedents, behind perceptions of country brands tend to vary across cultural groups. Our findings
suggest that business opportunities carry significant weight in the mind of Peruvian consumers
while geography is not an important factor in Saudi Arabia. Second, preferred tourism destinations
tend to vary across national groups. Although unsurprising, our finding in Hypothesis 3 builds on
the identification of a positive relationship between preferred trade and tourism destinations. Thus,
people rate tourism destinations higher if they have a positive image of doing business with the
country being considered.
Discussion
The purpose of this study was to extend the body of research published on country
branding through the development of a survey instrument and subsequent collection and analysis
of data in Saudi Arabia and Peru. Although only two nations were examined in this study, the
translation of the survey to Spanish and Arabic will hopefully set the stage for other future
research endeavors. By exploring Saudi Arabian and Peruvian perceptions of country brands, and
identifying potential differences across national groups, we believe that the literature in this area
is now stronger as we have identified potential constructs that may help determine how cultural
differences may impact institutional environments across borders. The focus in this study on how
12 12

certain perceptions of country brands on trade and tourism may have different ‘drivers’ or
antecedents led to some interesting findings.
From a practitioner perspective, individuals working for MNCs may indeed find the
initial results interesting for a variety of reasons. First, very little information is available about
how people from Middle East and Latin American nations perceive the rest of the world.
Second, any firm that intends to engage in business in the Saudi Arabia or Peru may find it
prudent to consider altering brand identification strategies and policies based on the local
traditions, best practices, and perceptions of external governance techniques. And third, firms
may elect to seek additional information related to impressions that managers and consumers
may have of brands that originate from different world regions, and the variation in perceptions
of those brands that may exist. On a global scale the pattern of convergence versus divergence
of values has significant implications for multinational firms that view the world as one market.
To further build on our hypothesis testing we performed two post-hoc analyses. First, we
split the entire sample into two groups based on the variable ‘expatriate.’ This facilitated a
comparison between people who lived, worked or spent time abroad and those who have not
(regardless if they were from Saudi Arabia or Peru). We suspected that the individuals who have
lived abroad would differ in their preferences of country brand drivers. Roughly two-thirds of
the sample fell into the expatriate category with one-third in the ‘local’ group. A t-test revealed a
number of significant differences. When assessing perceptions of countries for trade the ‘local’
group rated geography higher. With respect to tourism, the ‘expatriate’ group was significantly
higher on level of development, culture and experience with country. This suggest that,
especially with tourism perceptions, individuals who have substantial experience abroad tend to
have different factors that their weigh when evaluation foreign nations.
13 13

Insert Table 7 about here
Although we assessed differences between Peru and Saudi Arabia on top tourism
destinations we did not determine the rankings of nations from our overall list of 107 countries.
As a follow up we decided to rank, by means, the top ten nations based on scores from our
respondents from both countries (see Table 7). A few observations are noteworthy. Both groups
rated China and the United States (the world’s largest economies) as their highest trade
preferences. Yet in the top ten, nations from the same world region tended to rate quite high
with four Latin American nations in Peru’s top ten and three for Saudi Arabia. The tourism
rankings revealed that both Saudis and Peruvians have a very high perception of Europe as a
tourism destination with five European nations in the top ten for each group.
Any study that includes data collection in emerging economies can have some limitations.
Normally obtaining a sample with an even distribution of men and women in Saudi Arabia is a
challenge due to a much higher percentage of the working population stemming from the male
group due to religious and cultural reasons. As a result we made an extra effort o target female
groups which ended up skewing our sample a bit in the opposite direction. Although this challenge
was somewhat overcome the samples were slightly uneven with respect to certain demographic
variables, such as education, yet the research questions have been more than adequately addressed
and cultural differences have been captured in the current analyses. Convenience samples also have
some drawbacks yet the size, consistency in data collection, and sample uniqueness trump any
major drawbacks. Recent research has also revealed that factors such as economic distance and
economic freedom distance could be a contributing factor to the survival of firms in the Middle East
and this could play into the transference of corporate citizenship values between home and host
subsidiaries (Demirbag, Apaydin and Tatoglu, 2011). Response bias is often a problem with survey
14 14

administration and it is hoped that by using the same protocol in each nation we have been able to
control this issue.
A deeper analysis of cultural differences between Saudi Arabia and Peru, especially with
respect to collectivism, may be worthy of future research. The Peruvian variety of collectivism
seems to be a bit more influenced by dual pressures, foreign influences on society and the
traditional values of the Inca empire. A recent study of Peruvian cultural values found that the
Hispanic subculture embraces European values more so than the indigenous subculture and
therefore tends to be more self-oriented than the deeply communal indigenous population that
stems from the socialistic Inca civilization (Robertson & Suarez, 2009). Nonetheless, future
researchers of country brands must consider the various subcultures that exist in a society and
how their perceptions may vary based on historical and ethnic beliefs. It is our hope that this
study has established a new foothold for scholars that are attempting to unravel both the driving
forces behind country brand perceptions as well as interrelationships and variations between
trade and tourism as a new paradigm for this research stream.
15 15

References
Ali, A. 1993. Decision-Making Style, Individualism, and Attitudes toward Risk of Arab Executives. International Studies of Management and Organization 23(3): 53-73.
Alreck P. & R. Settle 1995. The Survey Research Handbook, 2nd Edition (Irwin, Homewood, IL).
Demirbag, M., M. Apaydin, & E. Tatoglu. 2011. Survival of Japanese Subsidiaries in the Middle East and North Africa. Journal of World Business 46(4): 411-425.
Dichter, E. 1962. The world customer. The International Executive, 4(4), 25-27.
Ethical Investment Research Service, 2006.
Gnoth, J. 2002. Leveraging export brands through a tourism destination brand. The Journal of Brand Management, 9(4), 262-280.
Han, C.M. 1989. Country image: halo or summary construct? Journal of Marketing Research, 26(2), 222-229.
Hirasuna, D. 2011. Peru Brands Itself, @Issue, March 11, 2011, V.01. Hofstede, G. 1997.Cultures and Organizations: Software of the Mind. New York: McGraw-Hill.
Katsioloudes, M. & T. Brodtkorb. 2007. Corporate Social Responsibility: An Exploratory Study in the United Arab Emirates. SAM Advanced Management Journal 72(4): 9-20.
Kotler, P., & Gertner, D. 2002. Country as brand, product, and beyond: A place marketing and brand management perspective. The Journal of Brand Management, 9(4), 249-261.
Laroche, M., Papadopoulos, N., Heslop, L. A., & Mourali, M. 2005. The influence of country image structure on consumer evaluations of foreign products. International Marketing Review, 22(1), 96-115.
Lenartowicz, T., & Johnson, J.P. 2002. Comparing managerial values in twelve Latin American countries: An exploratory study. MIR: Management International Review, 279-307.
Mellahi, K., M. Demirbag & L. Riddle. 2011. Multinationals in the Middle East. Journal of World Business, 46(4): 406-410.
Noer, D., C. Leupold & M. Valle. 2007. An Analysis of Saudi Arabian and U.S. Managerial Coaching Behaviors. Journal of Managerial Issues 19(2): 271-287.
16 16

Ralston, D.A., D.H. Holt, R.H. Terpstra & Y. Kai-Cheng. 1997. The Impact of National Culture and Economic Ideology on Managerial Work Values: A study of the United States, Russia, Japan, and China. Journal of International Business Studies 28(1): 177-207.
Rawwas, M, Vitell, S. & J. Al-Khatib. 1994. Consumer Ethics: the Possible Effects of Terrorismand Civil Unrest on the Ethical Value of Consumers.Journal of Business Ethics 13(3): 223-231.
Robertson, C., S. Al-Alsheikh & A. Al-Kahtani. 2012. An Analysis of Perceptions of Western Corporate Governance Principles in Saudi Arabia. International Journal of Public Administration 35(6): 402-409.
Schwartz, S.H. 1999. A Theory of Cultural Values and Some Implications for Work.Applied Psychology: An International Review 48(1): 23-47.
Triandis, H.C. 1995. Individualism and Collectivism. Boulder, CO: Westview.
Trompenaars, F. 1994. Riding the Waves of Culture. New York, NY: Irwin.
Wines, W. & N. Napier. 1992. Toward an Understanding of Cross-Cultural Ethics: A Tentative Model.Journal of Business Ethics. 11(11): 831-841.
Gilmore, F. 2002. A country — can it be repositioned? Spain — the success story of country branding, The Journal of Brand Management, Volume 9, Numbers 4-5, April 2002 , pp. 281-293(13)
Papadopoulos, N & L. Heslop. 2002. Country equity and country branding: Problems and prospects. The Journal of Brand Management, Volume 9, Number 4, 1 April 2002 , pp. 294-314(21)
Ralston DA, Holt DH, Terpstra, RH & Y. Kai-Cheng 1997. The impact of national culture and economic ideology on managerial work values: A study of the United States, Russia, Japan, and China. Journal of International Business Studies 28(1): 177-207.
Robertson, C., Crittenden, W., Brady, M. & J. Hoffman.2002. Situational Ethics Across Borders: A Multicultural Examination, Journal of Business Ethics, 38(4): 327-338.
Robertson, C. J., & C. S. Guerrero. 2009. An empirical test of Peruvian subcultural values. CrossCultural Management: An International Journal, 16(2), 215-229.
Roth, K. & A. Diamantopoulos. 2002. Advancing the country of origin construct. Journal of Business Research, 62: 726-740.
17 17

18 18

Table 2. Means and Standard Deviations of Trade Driver Variables across Samples
19
Table 1: Demographic Profile of SamplePeru Saudi Arabia
Spent anytime outside countryYes 53.2% 71.7%No 45.2% 23.9%Highest level of educationHigh school or less 6.6% 3.3%Bachelor 24.6% 42.4%Masters 65.6% 45.7%PHD 3.3%Other 2.2%Employed outside of countryYes 26.2% 7.6%No 73.8% 92.4%Managerial levelExecutive 26.2% 5.4%Middle Management 32.8% 27.2%Junior Management 23.05 17.4%Staff 18.0% 37.0%ReligionMuslim 1.6% 98.9%Christian 90.2%Other 8.2%GenderMale 73.8% 26.1%Female 26.2% 73.9%Marital StatusSingle 57.4% 58.7%Married 42.6% 39.1%Type of OrganizationPrivate 78.7% 25.3%Publicly Traded 4.9% 6.9%Government 9.8% 60.9%Family 6.6% 5.7%Industry of firmManufacturing 29.5% 9.3%Service 70.5% 84.9%Size of firmLess than 50 16.4% 23.5%50 to less than 100 8.2% 2.4%100 to less than 500 23.0% 14.1%500 to less than 1000 16.4% 7.1%1,000 or more 36.1% 50.6%International operationsYes 57.4% 50%No 42.6% 50%
19
20
Peru Saudi ArabiaMean Std. Deviation Mean Std. Deviation
TradeGeographic Location 3.37 1.36 3.67 1.46Level of Development 3.84 1.27 4.30 1.14People 3.84 1.26 3.78 1.27Similarity of Culture 2.87 1.23 2.74 1.40Many Opportunities 4.10 1.31 3.76 1.35Experience with country 3.23 1.40 3.57 1.45Tourism Geographic Location 3.44 1.60 4.08 1.45Level of Development 3.11 1.39 4.15 1.14People 3.77 1.43 3.85 1.45Similarity of Culture 2.18 1.25 2.71 1.43Many Opportunities 3.19 1.46 2.99 1.60Experience with country 2.94 1.46 3.74 1.38
20

Table 3Regression Analysis: Dependent Variable: Trade Preferences
Peru Saudi Arabia
Model 1 Model 2 Model 1 Model 2
Beta Beta Beta Beta
Demographic Variables
Expatriate -0.23* -0.24* -0.15 -0.14Education 0.37** 0.41** -0.02 -0.04Mgt Level 0.22* 0.26* -0.04 -0.08Gender -0.12 -0.09 -0.12 -0.10Marital status -0.09 -0.04 0.33** 0.36**Age 0.01 -0.04 -0.02 0.02Firm size -0.03 -0.05 -0.07 -0.07
Country Brand Drivers
Geography 0.02 -0.24*Development 0.12 0.06People -0.19 -0.01Culture 0.06 0.09Opportunities 0.32* 0.15Experience -0.10 0.05
F (full model) 1.64* 1.37†R2
0.31 0.20Adjusted R2
0.12 0.05N 62 92
†p<.10, *p<0.05, **p<0.01, ***p<0.001
21 21

Table 4Independent-Samples test of mean differences of perceptions of Trade Driver Variables
between Saudi Arabia and Peru
22
3.67 3.56 3.762.733.37
3.223.58
4.10 2.87 4.30
3.783.83
3.83
MeanResponses
Mean for Saudi Arabia Sub-Sample, n = 92
Mean for Peru Sub-Sample, n = 62
Experiencen.s.
OpportunitiesP<.05
CultureP<.05
Peoplen.s.
Developmentn.s.
Geographyn.s.
22
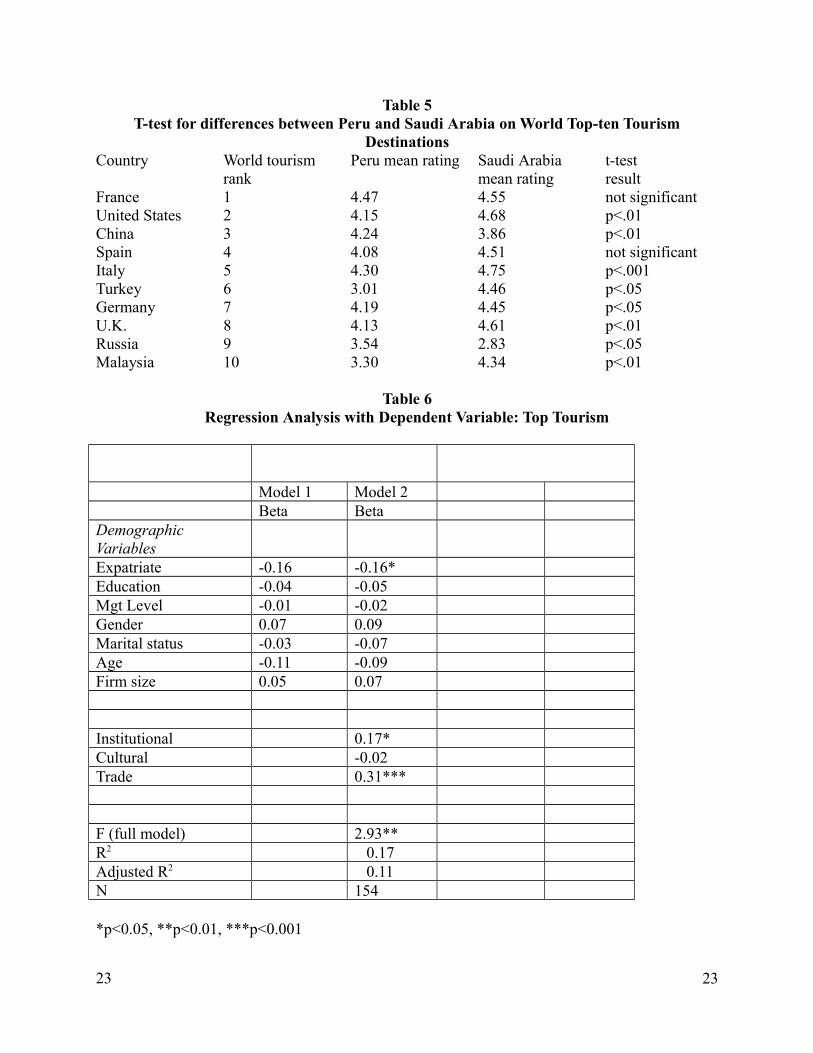
Table 5T-test for differences between Peru and Saudi Arabia on World Top-ten Tourism
DestinationsCountry World tourism
rankPeru mean rating Saudi Arabia
mean ratingt-test result
France 1 4.47 4.55 not significantUnited States 2 4.15 4.68 p<.01China 3 4.24 3.86 p<.01Spain 4 4.08 4.51 not significantItaly 5 4.30 4.75 p<.001Turkey 6 3.01 4.46 p<.05Germany 7 4.19 4.45 p<.05U.K. 8 4.13 4.61 p<.01Russia 9 3.54 2.83 p<.05Malaysia 10 3.30 4.34 p<.01
Table 6Regression Analysis with Dependent Variable: Top Tourism
Model 1 Model 2Beta Beta
Demographic VariablesExpatriate -0.16 -0.16*Education -0.04 -0.05Mgt Level -0.01 -0.02Gender 0.07 0.09Marital status -0.03 -0.07Age -0.11 -0.09Firm size 0.05 0.07
Institutional 0.17*Cultural -0.02Trade 0.31***
F (full model) 2.93**R2 0.17Adjusted R2 0.11N 154
*p<0.05, **p<0.01, ***p<0.001
23 23

Table 7 Peru and Saudi Arabia: Top-Ten nations for Trade and Tourism
PERUTrade Mean Tourism Mean
1. China 4.4603 1. France 4.47622. United States 4.4194 2. Hong Kong 4.46033. Australia 4.3333 3. Belgium 4.34924. Peru 4.2857 4. Brazil 4.34925. Brazil 4.2698 5. Italy 4.30166. Canada 4.2698 6. Peru 4.28577. Japan 4.2222 7. China 4.23818. Hong Kong 4.1746 8. Germany 4.19059. Colombia 4.0317 9. Netherlands 4.174610. Chile 4.0000 10. United States 4.1452
SAUDI ARABIATrade Mean Tourism Mean
1. China 4.6196 1. Italy 4.75002. United States 4.4891 2. United States 4.68483. Japan 4.3261 3. United Kingdom 4.60874. United Kingdom 4.1087 4. France 4.55435. Turkey 4.0870 5. Spain 4.51096. Hong Kong 4.0870 6. Germany 4.44577. Canada 4.0435 7. Turkey 4.44578. Germany 4.0326 8. Switzerland 4.43489. Malaysia 3.9891 9. Canada 4.413010. United Arab Emirates
3.9565 10. United Arab Emirates
4.3804
24 24

AppendixPeru Saudi Arabia
GNI per capita $10,240 (2012) $30,480 (2011)Top 5 Export Destinations
1. China (19.7%) 1. US (14.3%)2. US (15.5%) 2. China (13.7%)3. Canada (9.4%) 3. Japan (13.7%)4. Japan (6.5%) 4. South Korea (9.9%)5. Spain (5.2%) 5. India (8.2%)
Top 5 Export Products
1. Copper 1. Petroleum 2. Gold 2. Petroleum Products3. Lead 3.4. Zinc 4.5. Tin 5.
GDPreal growth rate (3yrs)
8.8% (‘10), 6.9% (‘11), 6.3% (’12)
7.4% (’10), 8.5% (’11), 6.8% (’12)
25 25