Perception Isn’t Everything: The Reality of Class Size
17
4 Fall 2019 Volume Mark Umbricht and Kevin Stange About the Authors The authors are with the University of Michigan. Kevin Stange is also with the National Bureau of Economic Research. Acknowledgments We would like to thank Paul Courant, Ben Koester, Steve Lonn, Tim McCay, and numerous participants in seminars at the University of Michigan for helpful comments. This research was conducted as part of the University of Michigan Institutional Learning Analytics Committee. The authors are solely responsible for the conclusions and findings. Abstract Every term, institutions of higher education must make decisions about the class size for each class they offer, which can have implications for student outcomes, satisfaction, and cost. These decisions must be made within the current higher education landscape of tightening budgets and calls for increased productivity. Beyond institution decision making, prospective students and their families may use class size as one factor in deciding whether an institution might be a good fit for them. The current measure of class size found in university fact books, and subsequently sent to numerous ranking groups such as U.S. News & World Report (hereafter U.S. News), is an inadequate gauge of the student experience in the classroom, as measured by the percent of time students spend in classes of varying sizes. The current measure does not weight for enrollment, credits, or multiple components of a class, which results in a misleading representation of the student experience of class size. This paper will discuss these issues in depth, explain how class size varies across institutions, and offer recommendations on how to reweight class size in the Common Data Set to accurately describe it from the student’s perspective. Institutions could use this new metric to better understand class size, and subsequently to understand the student experience and cost of a class, while prospective students and their families could use the metric to gain a clearer picture of the class sizes they are likely to experience on campus. Keywords: class size, productivity, student outcomes Perception Isn’t Everything: The Reality of Class Size The AIR Professional File, Fall 2019 Article 146 https://doi.org/10.34315/apf1462019 © Copyright 2019, Association for Institutional Research
Transcript of Perception Isn’t Everything: The Reality of Class Size

4Fall 2019 Volume
Mark Umbricht and Kevin Stange
About the Authors
The authors are with the University of Michigan.
Kevin Stange is also with the National Bureau of
Economic Research.
Acknowledgments
We would like to thank Paul Courant, Ben Koester,
Steve Lonn, Tim McCay, and numerous participants
in seminars at the University of Michigan for helpful
comments. This research was conducted as part
of the University of Michigan Institutional Learning
Analytics Committee. The authors are solely
responsible for the conclusions and findings.
Abstract
Every term, institutions of higher education must make decisions about the class size for each class they offer,
which can have implications for student outcomes, satisfaction, and cost. These decisions must be made
within the current higher education landscape of tightening budgets and calls for increased productivity.
Beyond institution decision making, prospective students and their families may use class size as one factor
in deciding whether an institution might be a good fit for them. The current measure of class size found in
university fact books, and subsequently sent to numerous ranking groups such as U.S. News & World Report
(hereafter U.S. News), is an inadequate gauge of the student experience in the classroom, as measured
by the percent of time students spend in classes of varying sizes. The current measure does not weight
for enrollment, credits, or multiple components of a class, which results in a misleading representation of
the student experience of class size. This paper will discuss these issues in depth, explain how class size
varies across institutions, and offer recommendations on how to reweight class size in the Common Data
Set to accurately describe it from the student’s perspective. Institutions could use this new metric to better
understand class size, and subsequently to understand the student experience and cost of a class, while
prospective students and their families could use the metric to gain a clearer picture of the class sizes they
are likely to experience on campus.
Keywords: class size, productivity, student outcomes
Perception Isn’t Everything: The Reality of Class Size
The AIR Professional File, Fall 2019
Article 146
https://doi.org/10.34315/apf1462019
© Copyright 2019, Association for Institutional Research

5Fall 2019 Volume
INTRODUCTIONOrganizing class delivery is a key operational
decision for institutions of higher education. Each
term these institutions must decide how many
students will be taught within each section given
the classes they offer, the faculty and instructors
they have available to teach, and the confines of
physical spaces they have on campus. Within these
constraints, institutions must decide how to deliver
classes. Consider a popular class taken by nearly
every first-year student: Should this class be taught
as one large lecture by a famous professor, many
small sections taught by graduate students, or a
combination of the two? Should small classes target
freshmen who are acclimating to college or seniors
as they specialize in their field?
Institutions, particularly public institutions, make
these decisions within the current context of
increased accountability and decreased resources.
Traditional wisdom argues that smaller classes
increase engagement, facilitate student-faculty
interactions, and improve student success. The
opportunity to learn from prominent scholars in the
field is also considered a strength of undergraduate
education at research universities. However, smaller
classes and senior faculty are costlier and their use
comes at the expense of other ways of enriching
and supporting the undergraduate student
experience. As Courant and Turner (forthcoming)
argue, institutions have an interest in providing
curriculum efficiently, meaning they must strike a
balance between quality, costs, and tuition revenue.
If an institution or department has an influx of
students, it must decide whether it will increase
the size of its faculty or the class size of its courses.
Therefore, decisions about class size have first-order
influence on student success and institutional costs.
From the student perspective, class size could be
influential in the college choice process, with some
students seeking intimate class settings with small
class sizes, and others preferring to blend in to a
large classroom. Students and their families rely
on institutional websites and rankings, such as
Princeton Review or U.S. News, and other publicly
available data for information about class size. These
data are typically drawn from the Common Data Set
(CDS), which is a collaborative effort among data
providers and publishers to improve the quality and
accuracy of information provided to prospective
students, and to reduce the reporting burden on
data providers (CDS Initiative, 2018). While it is
helpful to have a measure that can be reported
across multiple campuses, the class size metric
used by the CDS is measured at the classroom level
rather than at the student level. This difference in
measurement leads to a disconnect between the
metric and the phenomena it is trying to describe, as
described in the following example.
Imagine a high school student researching her
nearby public, research university as a prospective
student. She sees that, according to U.S. News
in 2018, only 17% of classes have more than 50
students, and 57% of classes have fewer than 20
students. The student thinks, What luck! She thinks
she can attend a high-quality research institution
while spending most of her time in small classes.
After graduation from that college, the same
student looks back and sees that she spent more
than 41% of her time in classes with more than
50 students, and only 20% of her time in classes
with fewer than 20 students. These differences in
the perception versus reality are not exaggerated,
but rather are many students’ average experience.
This paper will show that the measure of class size
calculated for the CDS, and subsequently used by
many other sources, does not provide an accurate
approximation of the true class size experienced

6Fall 2019 Volume
by students at the University of Michigan (U-M), a
large, research university in the Midwest. By the
term “student experience,” we mean the percent
of time or credits spent in classes of varying sizes.
The results of this case study could be replicated at
any institution, with varying degrees of departure
from the true student experience depending on the
institution type and size. Specifically, this paper will
argue for a new class size metric to be used in the
CDS and will address the following questions:
Framing Questions
1| How does the standard definition of class size
vary from the student experience?
2| How does a student-centric version of class size
vary across an institution?
3| How can institutional researchers practically
recalculate class size to better approximate
the student experience without significantly
increasing the burden of data providers?
Importance of the Topic and Literature Review
This topic is important for students, institutions,
and the field of institutional research. From the
student perspective, students and those assisting
in their decisions need accurate and meaningful
information to make the best decision about which
college to attend. A small number of studies have
shown that class size is an important factor for
students as they select an institution (Drewes &
Michael, 2006; Espinoza, Bradshaw, & Hausman,
2002). This makes sense since lower class size is
perceived to be linked to gains in student outcomes.
Literature in the secondary setting is clear that lower
class size is associated with gains across multiple
areas, including test scores, noncognitive skills,
college enrollment, and other outcomes (Angrist &
Lavy, 1999; Chetty et al., 2010; Dee & West, 2011;
Dynarski, Hyman, & Schanzenbach, 2013; Hoxby,
2000; Krueger, 1999). However, in higher education
the relationship between class size and outcomes
is not well established, with studies finding either
negligible association (Bettinger, Doss, Loeb, Rogers,
& Taylor, 2017; Lande, Wright, & Bartholomew,
2016; Stange & Umbricht, 2018; Wright, Bergom,
& Lande, 2015) or a negative relationship between
class size and outcomes (Bettinger & Long, 2018; De
Giorgi, Pellizzari, & Woolston, 2012; Kokkelenberg,
Dillon, & Christy, 2008). Institutions that gain a more
accurate and more nuanced version of class size
from the student experience perspective could
aid prospective students in their decision-making
process.
Class size is also important to institutions
for planning purposes. Courant and Turner
(forthcoming) argue that institutions must strike a
balance between quality, costs, and tuition revenue.
In recent years, institutions have been asked to
cut back and do more with fewer resources, which
would imply that increasing class size would be an
appropriate strategy. In fact, class size is one of
the most important drivers of instructional costs
(Hemelt, Stange, Furquim, Simon, & Sawyer, 2018).
However, lower class size is perceived to lead to
better student outcomes and is subsequently tied to
rankings such as those at U.S. News. This common
perception pulls institutions to keep class size lower,
putting institutions in a situation where a logical
solution is to hire cheaper instructors, such as
noncontingent faculty. The ultimate decision on how
to strike this balance is not traditionally made at the
institution level, but rather at the department level.
Cross and Goldenberg (2009) found that the number
of noncontingent faculty at elite research institutions
rose significantly in the 1990s, which was due to

7Fall 2019 Volume
micro- (department-)level decisions. Departments
(or colleges) that are particularly concerned with
the quality (or perceived quality) of small class sizes
would find it difficult to adequately assess how
much time their students spend in classes of a given
size with the current metric, which is at the class
level. A new student experience version of class
size would allow departments to compare the class
size experience across multiple majors or between
departments, which could assist in balancing
the class size constraints for long-term planning.
Having an accurate understanding of imbalances by
class size across colleges, departments, or majors
could help institutions pinpoint areas that need
improvement. In addition, institutions could examine
whether access to smaller classes is inequitable
across certain student groups, such as among
minority, first-generation, or first-year students.
We will argue that the current definition of class size
used in the CDS Initiative (2018) is insufficient for
both internal planning and external consumption.
As institutional researchers, it is our job to provide
meaningful and accurate information to both
internal and external parties. While the traditional
measure of class size may be accurate, this paper
describes ways in which we could provide data that
are more meaningful. Institutional researchers and
higher education professionals have an obligation
to update this metric to reflect the actual student
experience.
DEFINING CLASS SIZEBased on the conventions of the CDS,
undergraduate class size is calculated based on
the number of classes with a given class size range.
Classes are divided into sections and subsections.
A class section is an organized class that is offered
by credit, is identified by discipline and number,
meets at one or more stated times in a classroom or
setting, and is not a subsection such as a laboratory
or discussion section. A class subsection is a part of
a class that is supplementary and meets separate
from the lecture, such as laboratory, recitation, and
discussions sections. In calculations of class size,
we count only the sections of a class and discard
the subsections. The CDS conventions consider
any section or subsection with at least one degree-
seeking undergraduate student enrolled for credit
to be an undergraduate class section, but exclude
distance learning, noncredit, and specialized one-
on-one classes such as dissertation or thesis, music
instruction, one-to-one readings, independent study,
internships, and so on. If multiple classes are cross-
listed, then the set of classes are listed only once to
avoid duplication (CDS Initiative, 2018). This means
that we count stand-alone classes, defined as having
only one component, once per section in the class
section portion.
For classes with multiple components, such as a
lecture section combined with a lab or discussion
section, we count each lecture section once in the
class section portion while we count each associated
lab or discussion section once in the class
subsection table. In traditional class size metrics,
the CDS counts only the class section portion of the
class while the CDS discards the subsection from the
calculation. This metric is relatively easy to compute
and is comparable across campuses, but it may not
be representative of the student experience.
We define “student experience class size” as the
percent of time spent by a student in classes of
various sizes, using credits as a proxy for time.1
Calculations for this metric will be discussed later in
1. We assume that each credit associated with a class is approximately 50 minutes of class time. While this pattern is not universal across U-M, the calculation is easy to make and should be readily accessible in any institution’s data warehouse. A more complicated, but 100% accurate approach, would be to use the day and time location to derive the true number of minutes spent in each section. These data might not be accessible and would require substantial coding to calculate. We tested both approaches and our simplified approach did not meaningfully differ.

8Fall 2019 Volume
this paper. Figure 1 shows the difference between
the CDS method and our new student experience
method of computing class size. Sources that are
often used as references for prospective students
and institutions, such as U.S. News and institutional
websites, draw data from the CDS. The CDS metric
describes the share of classes in a given range
rather than the share of time spent in classes of
varying sizes. According to the U.S. News and the
U-M websites, 84% of classes at U-M have fewer
than 50 students, and 57% have fewer than 20
students. However, using our student experience
class size metric, only 19% of a student’s classroom
time is spent in classes with fewer than 20 students
and nearly 30% of their time is spent in classes with
at least 100 other students. Why do these metrics
differ so drastically?
There are three primary reasons driving these
differences. First, the traditional measure for class
size is not weighted by the number of students
enrolled. A 500-student section and a 5-student
section both count as one class, even though
many more students experience the larger section.
Second, classes are not weighted by the number of
credits associated with the class. A class worth five
credits counts for the same as a class worth one
credit, even though students likely spend five times
as much time in the first class. Finally, the traditional
measure does not incorporate subsections. It is
typical for large lecture classes to have multiple
components, such as a large lecture of 200 that
meets for 2 hours per week and 10 associated small
discussion groups of 20 students each that meet
for 1 hour per week. Students spend 67% of their
classroom time in a large lecture and 33% of their
time in a small discussion, but the traditional metric
Figure 1. Class Size by Various Sources

9Fall 2019 Volume
counts only the lecture portion. This means the
200-person lecture counts as one class, ignoring the
subsections. Our new student experience class size
metric accounts for these three factors, as will be
explained in detail in the methods section. This new
metric provides a more accurate representation of
the student experience within the classroom.
Given the immense difference between the
traditional class size measure and our student
experience version, it is only natural to question why
institutions have not moved to a different calculation
of class size. To be clear, it is not the authors’ belief
that institutions are purposely trying to push an
inaccurate measure of class size. The traditional
class size measure does hold value in describing the
number of classes available to students of various
class sizes. U-M students can choose from many
small classes and could theoretically construct a set
of classes to minimize the amount of time spent in
large classes. In reality, though, several forces could
make it difficult for institutions to switch to a student
experience version of class size.
First, there are serious consequences in rankings
and optics for many institutions, particularly larger
ones. U.S. News currently provides points to
institutions based on the share of small sections (19
and fewer students), partial points for the share of
medium sections (20–49 students), and no points for
large sections (50 or more students).2 Universities
that use larger class sizes to teach a large number
of students will see their rankings negatively
impacted if classes were weighted by the number
of students taking the class. The shift in class size
would also create poor optics for prospective
students and may impact whether they choose one
institution over another. The same would be true
for a student experience measurement of instructor
type, where larger research institutions are much
more likely to use graduate students as instructors.
In addition, having non-tenure track instructors
primarily responsible for teaching large classes, and
therefore many students, could have bad optics
for institutions. Therefore, there is a disincentive
for a single college, or a small group of colleges, to
recalculate their class size based on the student
experience. The exception would be institutions
that uniformly have very small classes, such as
small liberal arts colleges, that would see little or no
change in their calculation of class size.
A second difficulty is measuring class size from the
student perspective. Leaders of the CDS Initiative
already consider the measurement of class size to
be the second-most difficult part of the CDS, with
only calculations of financial aid deemed more
difficult (Bernstein, Sauermelch, Morse, & Lebo,
2015). At U-M, measures required to recalculate
class size to the student perspective are readily
available and clean, and require little manipulation
to combine. Institutions vary significantly in their
data capacity and availability of staff to adjust the
CDS measures. Given these challenges, the authors
of this study still believe that shifting to a student
experience version of class size would provide many
benefits, including an accurate representation of
the amount of time students spend in classes of
varying sizes and with various instructor types. This
shift would be beneficial for institutions for planning
purposes as well as for prospective students as
they weigh various institutions during the selection
process.
2. This recently changed from a system that provided points for small courses and penalties for large courses in an effort to minimize gaming of the system (Supiano, 2018). However, there is no evidence provided to back up this claim. Regardless of whether the new or old system is used, having a larger number of small classes is rewarded, and the metric is at the course level, which does not appropriately describe the student experience.
10Fall 2019 Volume
METHODSThe purpose of this study is to create a student
experience version of class size. We drew data
from the U-M data warehouse, specifically from the
Learning Analytics Data Architecture (LARC) and
College Resource Analysis System (CRAS).3 LARC is a
flattened, research-friendly version of the raw data
warehouse that houses data about students, their
background, their progress, and their coursework.
CRAS is a data warehouse system that houses data
about classes and the instructors that teach them.
The sample included first-time freshman students in
cohorts between 2001 and 2012, examining classes
taken within 4 years of entry. Freshman cohorts are
between approximately 5,500 and 6,500 students
during this period. Individual study classes and one-
on-one classes were removed from the sample, as
were classes with no CRAS information, including
subjects such as medicine, dentistry, armed forces,
study abroad, and classes through the Committee
on Institutional Cooperation program. The final
sample included 70,426 first-time students and
3,398,320 class sections taken in these students’ first
4 years of study, between 2001 and 2016.
Calculating Class Size
As previously noted, we made three adjustments to
the traditional measure of class size: (1) weighting
for number of students, (2) weighting for credits
associated with the section, and (3) incorporating
subsections. Table 1 provides an example of how
3. LARC is unique to U-M, although some institutions have developed a similar research-friendly database. CRAS is also unique to U-M because there are some calculations made with institution-specific formulas. However, these databases comprise data that are regularly available (although not always clean) at all institutions, such as student and class information, classes taken, and the number of students in a given class.
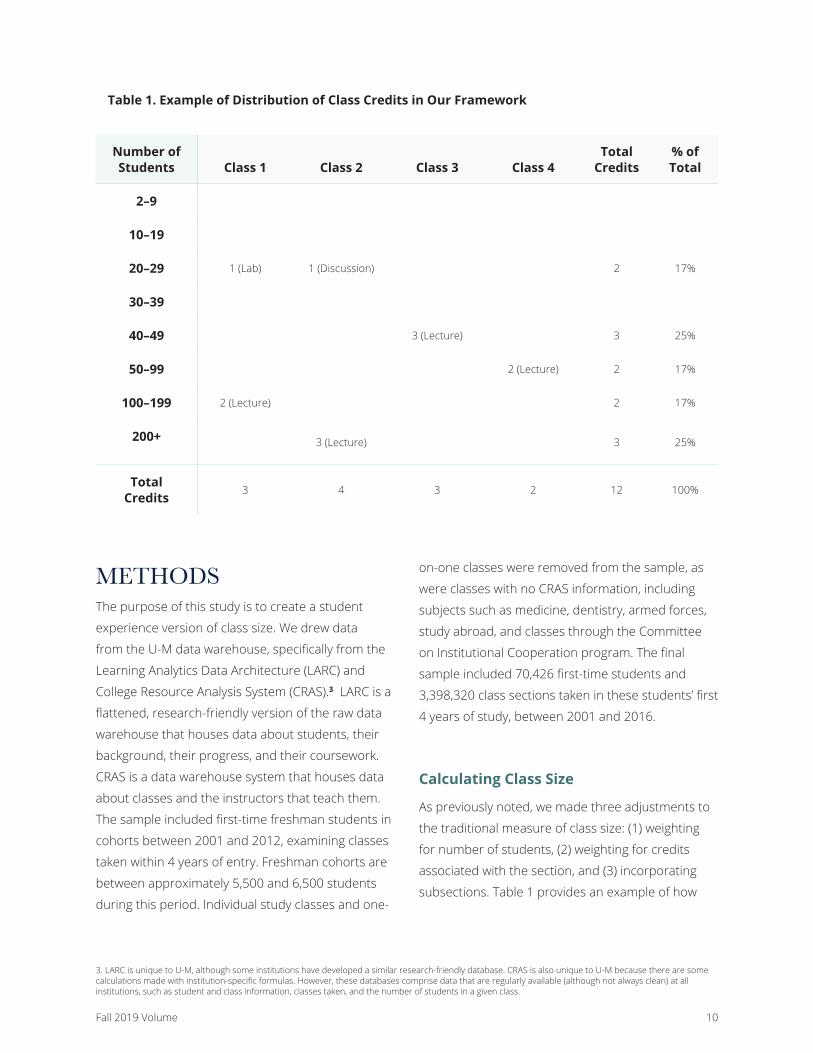
Table 1. Example of Distribution of Class Credits in Our Framework
Number of Students Class 1 Class 2 Class 3 Class 4
Total Credits
% of Total
2–9
10–19
20–29 1 (Lab) 1 (Discussion) 2 17%
30–39
40–49 3 (Lecture) 3 25%
50–99 2 (Lecture) 2 17%
100–199 2 (Lecture) 2 17%
200+ 3 (Lecture) 3 25%
Total Credits
3 4 3 2 12 100%

11Fall 2019 Volume
we accounted for credits and subsections in our
student experience framework.
This example shows a hypothetical student’s
coursework for one term. This student took four
classes in this term for a total of 12 credits. Classes
1 and 2 had multiple components, with a lecture
and either a discussion or a lab. We divided credits
for these classes among the section and subsection
based on the amount of time or credits associated
with each component. Then we put each component
into the appropriate class size bin, shown in the left
column. Classes 3 and 4 were stand-alone classes
that contained only a lecture component, so there
was no need to divide their credits. Once we had
distributed all the credits for each class to the
appropriate class size bin, we totaled credits across
each class size row. In doing so, we accounted for
credits and the multicomponent nature of classes,
fixing two of the issues with the standard definition
of class size. The third piece relates to weighting
class size by the number of students in the class. In
this framework, we theoretically create a table like
this for each student and each term the student
attends. We then summed across every student
and term. Since the level of observation is a class
enrollment, we naturally weight by the number
of students in the class because there will be 50
observations if there are 50 students in a class, or
5 observations for a class with 5 students. A basic
assumption made by this framework is that one
credit is equal to approximately 1 hour of class
time. While there are a small number of classes that
violate this assumption, we do not believe it would
impact our overall results in a meaningful way. It is
also important to note that enrollments for cross-
listed classes were combined into the home class.
At U-M, if there are multiple cross-listed sections,
one is considered the home class and the rest are
considered away classes. This means that if there
are three cross-listed sections with 12, 15, and 18
students, our data would show one class with 45
students.
Once we calculated the percent of time (using
credits as a proxy) that a student earned in various
class sizes across his first four years, we calculated
percentiles for each enrollment group across the
entire university by college, by major, and by year
in school.4 College and major are determined by
the last college or major associated with a student.
If a student graduated with a bachelor’s degree, we
used his graduating college or major. If a student
departed prior to completing his degree, we used
the last known college and major associated with
him.5 Rather than showing just the median or mean,
we chose to use five percentiles (10th, 25th, 50th,
75th, and 90th) to show the distribution of student
experiences. Finally, we mapped these percentiles
into figures that show the range of student
experiences for a given class size.
CASE STUDYThis section will examine how class size varies
across U-M. The figures in this section represent
the distribution of time that students spend in
classrooms of varying sizes. Class size was grouped
into eight bins of varying sizes to create a smooth
figure and to mimic the traditional measure of
class size. Figure 2 shows the distribution of class
size across the entire university. The black line
represents the median student, the dark gray
shaded area represents the 25th to 75th percentile,
and the light gray shaded area represents the 10th
4. Results show the 10th, 25th, 50th, 75th, and 90th percentile for each enrollment group. The term “college” refers to an academic college, such as engineering, liberal arts and science, or education.
5. We considered removing these students but decided that doing so could introduce some selection bias. For example, students that drop out may select larger courses; if we remove them, we may distort the student experience.

12Fall 2019 Volume
to 90th percentiles.
To interpret this figure, consider the enrollment
group of 200+ students. The black line indicates that
the median U-M student spent about 15% of her
time in classes with 200 or more students. Moving
above the black line to the edge of the dark gray
area, we see that about a quarter of students spent
about 23%–24% of their time in classes with 200 or
more students. The outer edge of the light gray area
indicates that 10% of students at U-M spent more
than 30% of their time in these very large classes. If
we move to the 20–29 enrollment group, we see that
the median student spent about 20% of her time
in classes with 20–29 students. There is a very wide
range of experiences (25%) between the 10th and
90th percentiles, indicating that students may spend
vastly different amounts of time in classes with
20–29 students. The spread is only about 10% wide
for enrollment groups between 30 and 49 students,
indicating there is less variability in the percent of
time spent in medium-size classes. Overall, it is clear
that students’ time is more heavily weighted in both
large (50+ students) and small (10–29 students)
classes. This means that students spend their time
in classes of varying sizes, but classes at U-M tend to
favor high or low enrollments on average. This also
implies that very large classes likely have a smaller
enrollment component tied to them, such as a
discussion or lab section.
At a university the size of U-M, with an
undergraduate population of almost 30,000, it
is natural to assume that student experiences
may vary greatly across the institution, such as by
college, major, or year in school. Figure 3 shows
the distribution of class size in the College of
Engineering, which we chose because it is the
Figure 2. Percent of Time Spent by Size Across the University of Michigan

13Fall 2019 Volume
second-largest college on campus and differs
significantly from the trends for the median student.
Once again, the black line and gray shaded areas
represent the percentiles for students in a given
college. We added the gray dotted line here to show
the median U-M student from Figure 2, allowing
us to examine how the college differs from the
overall pattern at the university. In the College of
Engineering students tend to take coursework with
very different class sizes compared to the median
U-M student. In particular, engineering students
take fewer small classes (10–29 students) and
very large classes (200+ students), and instead
take more classes in the middle range (30–199
students). Part of the difference could be attributed
to deliberate planning by the College of Engineering
and part could be related to the size of classrooms
in the engineering buildings. Classroom caps,
and subsequently enrollment caps, for classes
in engineering tend to lie in the middle of the
enrollment group distribution.
While not shown, we created figures for every
college on campus. The trends of these figures show
that class size differs significantly across colleges.
The College of Literature, Science, and the Arts
(LSA) has very similar trends to the median U-M
student, in part because it is the largest college on
campus. Given that more than 60% of students
are in LSA, this college drives much of the median
class size. As one would expect, smaller and more
narrowly focused colleges such as the College of
Architecture and Urban Planning, the College of
Art and Design, and the College of Music, Theatre,
and Dance had significantly higher levels of small
classes (2–29 students) and fewer very large classes
(200+ students). The College of Public Policy tends
to mimic the trends of LSA, in part because students
Figure 3. Percent of Time Spent by Enrollment Group in the College of Engineering

14Fall 2019 Volume
spend their first two years in LSA before declaring
their major. The College of Business had very high
levels of medium-size classes (40–99 students)
because many of its core classes have enrollments
of 40 to 80 students.
Class size also varies in systematic ways by
major, even within a college. Comparing the
major of Arts and Ideas in the Humanities, a
small, multidisciplinary major, to the major of
Biopsychology, Cognition, and Neuroscience (BCN),
a large, premed major, yielded large differences in
class size. The median Arts and Ideas major spent
about 50% of her time in classes with 20 or fewer
students, which is twice the 25% of the median LSA
student. Students in the BCN major, on the other
hand, took a much larger share of large lectures,
rising out of the 90th percentile for LSA students.
They spent nearly 33% of their time in classes with
more than 200 students, compared to only 20% of
the median LSA student’s time. While we observed
systematic differences between majors, we also
found that there were some majors that had very
similar class size structures.
A final way to observe how class size varies across
an institution is by comparing class size by academic
level. Rather than aggregating across a college
or major, we aggregated by a student’s year in
school (e.g., freshman, sophomore, junior, senior).
Students in their first year typically fulfill their
general education requirements, which tend to be
classes taught to many students at once. By their
junior or senior year, students tend to take many
classes within their major of increasing depth and
specialization, characterized by smaller class sizes.
Splitting the data in this manner did yield interesting
differences over time. As shown by the dotted line in
Figure 4. Class Size Within the College of Engineering by Academic Year

15Fall 2019 Volume
Figure 4, students in the College of Engineering took
similar coursework to LSA students in their first year
compared to the median U-M student from Figure
2, taking mainly classes consisting of large lecture
and small discussion groups. This is likely because
students are fulfilling their general education
requirements. By their third year, the solid black line
indicates the median engineering student deviates
from the pattern at the college level and takes a
much higher proportion of classes with 50–100
other students; these classes comprise classes in
the students’ major.
Overall, we created figures for every major, college,
academic level, and student across campus to
examine how class size varied across U-M. The
median student within some majors had class size
distributions that were very similar to the median
student in their college and the university, but many
majors differed significantly from the general trends.
Similarly, there were some students within majors
that varied significantly from the median student in
their major. These figures show that class size can
vary significantly across an institution. A department,
college, or institution can use this information to gain
a more nuanced understanding of the experiences
of their students. For example, if students that
tend to take only large lectures or small discussion
classes perform worse, then an institution could
adjust its advising to promote students to take
classes of varying sizes. Similarly, an institution could
identify whether certain student groups, such as
first-generation students, may benefit from a more
intimate classroom environment where they receive
more attention from instructors.
HOW SHOULD WE MEASURE CLASS SIZE?This paper has shown that the traditional measure
of class size is not sufficient if it is meant to provide
information about a student’s actual experience
in the classroom. Previous research has shown
that increasing class size has a mixed but generally
negative impact on student learning and satisfaction.
Accurately measuring class size is also important
to institutions because it impacts productivity. For
example, increasing or decreasing the class size of
introductory calculus, a class that most students on
campus take, can have vast implications for the cost
of the class. If an institution wanted to recalculate
class size with the student experience at the core,
what would it look like?
We will first consider two simple adjustments:
weighting for credits and weighting for students.
Table 2 shows the distribution of class size given
four different calculations and Figure 5 provides
a visual representation of the table. The first
calculation is the traditional measure of class size,
with no adjustments. This means there is one
observation per lecture. The second column weights
the traditional measure by number of credits. A
class of four credits is now worth twice as much as
a class of two credits. This slightly shifts the class
size distribution down because large class sections
have corresponding subsections. Consider a class
worth three credits, two earned in a lecture and one
earned in a lab. Since the lab, or subsection, is not
counted in the traditional measure, one of the three
credits is discarded, deflating the value of a large
class. The third column accounts for subsections
and credits, appropriately distributing all the credits
associated with each class. A class worth three
credits including a lecture and a lab, as described
above, is now fully included in the metric for class

16Fall 2019 Volume
size (Column 3). This lowers class size considerably
because we are not removing the subsection but
instead including it in our calculation. Subsections
tend to be smaller, which drives the distribution
down.
The fourth column shows class size distribution if
we weighted only for the number of students in a
class. Using this calculation, a large lecture of 500
students is counted 500 times, while a small class
of 5 students is counted only 5 times. As expected,
this dramatically shifts the distribution of class size
upward, nearly flipping the distribution of class size
from the traditional measure. Column 5 accounts
for weighting by credits and students, and includes
subsections simultaneously. This gets closer to
the perfect measure of the student experience
described earlier in this paper and vastly improves
the understanding of class size for institutions
and potential students. Figure 5 shows a visual
representation of each strategy for calculating
class size. We can see that the traditional measure
(nonstudent experience), weighting for credits, and
weighting for subsections are very similar, with
slight increasing low enrollments (fewer than 30)
and decreasing other enrollments (30–200+) after
accounting for subsections. Once we weight for
students there is an immediate shift, nearly flipping
the distribution. However, this shift goes too far;
accounting for credits and subsections provides a
balance between the three strategies.
It is important to note that our calculation of class
size used student-level micro data to account for
these changes, in part due to other related research.
However, this calculation may be burdensome for
institutions. A simpler way to achieve the same
results would be to take the class-level data used for
Table 2. Class Size by Three Different Calculations
Class Size
Traditional Measures
(1)
Weight for Credits
(2)
Account for Subsections
(3)
Weight for Students
(4)
Weight for All Changes
(5)
2–9 13.9% 14.1% 11.4% 2.0% 2.5%
10–19 32.1% 32.5% 31.1% 13.0% 15.4%
20–29 23.0% 23.6% 34.0% 14.2% 21.9%
30–39 8.2% 8.5% 9.4% 6.8% 9.3%
40–49 4.4% 4.3% 3.2% 4.6% 4.4%
50–99 10.5% 10.2% 6.4% 18.2% 15.8%
100–199 4.9% 4.5% 2.9% 17.2% 13.8%
200+ 2.9% 2.4% 1.7% 24.0% 16.8%

17Fall 2019 Volume
the CDS and simply weight each class section and
subsection by the number of students and credits.
This simplifies the process and limits the resources
required to pull and process the data.
LIMITATIONS OF NEW CLASS SIZE MEASUREMENTWhile this new class size metric may provide a
clearer picture of the student experience at an
institution, it does not come without limitations
and challenges. The first challenge is the
technical barriers of calculating the new class size
measurement. For example, institutions may house
the required variables in different data systems, but
replacing or adding a new metric could be difficult to
implement and could increase the reporting burden
on institutions. Most of what is required to adjust
to this new metric is already required for the CDS
version of class size. Institutions must calculate the
number of sections and subsections of a given class
size. This means they must know the exact class size
for every section and subsection. The only missing
piece is to allocate time between the section and
the subsection. At U-M, a field for distributed hours
is contained in the data warehouse, but that may
not be the case for all institutions, some of which
may not even use the Carnegie credit system. For
these institutions, a calculation could be made to
allocate credits based on the amount of classroom
time for each section and subsection. For example, a
three-credit class that meets for 2 hours in a lecture
section and 1 hour in a discussion section could split
the class into two credits for the lecture and one
Figure 5. Class Meeting Size Distribution by Five Different Methods

18Fall 2019 Volume
credit for the discussion. This would require some
up-front work to create these calculations based on
day/time information, but is not unmanageable.
The second set of challenges relate to the nuance
that is inherent in the new metric. Presenting
students with a single metric for an entire university
is simple and easy to explain but leaves out a lot of
nuance. If an institution were to recreate the figures
in this paper, it would introduce some challenges
for interpretation. As shown in Figure 3, there are
stark differences in class size between engineering
and LSA students; the same differences can be
shown between majors or year in school. The large
number combinations and comparisons by college,
major, and year in school present challenges when
trying to show or explain the data to prospective
or current students. While a single, institution-wide
metric leaves out nuance, it is a vast improvement
over the current metric used by institutions and
rankings. If an institution wanted to provide more
nuance, it could create an interactive dashboard
for prospective and current students to view the
nuanced version of class size presented in the
figures of this paper. Students could select a college
or major from a list to see what the distribution
of class size looks like for students in that major.
Institutions could pare down these figures to
show only the median for simplicity or to provide
a detailed explanation of how the percentiles
work when students first use the new dashboard.
However, with a nuanced view an institution could
also show students that class size may be lower for a
given major, or how class size may lower as students
progress toward their degrees.
DISCUSSION AND FUTURE WORKAs institutional researchers it is imperative for us to
provide data that are both accurate and meaningful.
This paper argues that the traditional measure of
class size is not a meaningful representation of
what students experience in the classroom. The
traditional measure of class size illustrates only the
proportion of classes that are small, not the amount
of time that students spend in small classes. This
is problematic for prospective students, who could
use meaningful class size data to determine where
they want to attend college. It is also problematic
for institutions, which may not understand the
extent of large or small classroom experiences on
their campuses. While limited, previous research in
higher education suggests that class size matters for
student outcomes and satisfaction in classes.
This paper suggests that the measurement of class
size could be altered by weighting for the number
of students and credits associated with the section,
and accounting for subsections. We suggest that
institutional researchers consider revamping their
class size metric to reflect the student experience
in the classroom more accurately. Nearly all the
required components (number of students in
each class and section/subsection, and number of
classes) for this calculation are used by the current
CDS metric. We believe that distributed credits, the
potential missing component, is likely captured and
readily available at many institutions, which would
make this adjustment relatively easy. While this could
require an investment of time on behalf of some
institutions, we believe the potential benefits will
outweigh the investment. At a minimum, we suggest
that institutional research professionals consider
reweighting their current metric of class size by the
number of students in each lecture section. This new

19Fall 2019 Volume
metric provides a more accurate description of class
size from the student experience.
Future work on this topic could yield more
improvements in the description of the student
experience at institutions of higher education. First,
the range of class size also varies significantly across
colleges and departments, indicating that a simple
institution-wide metric masks important differences
for students who plan to major in different fields.
Institutions could take this idea one step further
to create an interactive dashboard that allows
prospective and current students the opportunity
to see the range of class size experiences for majors
in which they have interest. A second improvement
institutions could make would be to pair data
about class size and instructor type (e.g., IPEDS
instructor type). By combining the percent of time
spent in varying class sizes and varying instructor
types, students will gain a clearer picture of what
their classroom experience would be at a particular
institution.
REFERENCESAngrist, J., & Lavy, V. (1999). Using Maimonides
Rule to estimate the effect of class size on
scholastic achievement. Quarterly Journal of
Economics, 114(2), 553–575. https://www.jstor.org/
stable/2587016?seq=1#page_scan_tab_contents
Bernstein, S., Sauermelch, S., Morse, R., & Lebo,
C. (2015). Fundamentals and best practices for
reporting Common Data Set (CDS) data. Presented
at the Association for Institutional Research Annual
Conference, Denver, CO, May 27.
Bettinger, E., Doss, C., Loeb, S., Rogers, A., &
Taylor, E. (2017). The effects of class size in online
college courses: Experimental evidence. Economics
of Education Review, 58, 68–85. https://doi.
org/10.1016/j.econedurev.2017.03.006
Bettinger, E. P., & Long, B. T. (2018). Mass instruction
or higher learning? The impact of college class size
on student retention and graduation. Education
Finance and Policy, 13(1), 97–118. https://doi.
org/10.1162/edfp_a_00221
Chetty, R., Friedman, J. N., Hilger, N., Saez, E.,
Schanzenbach, D. W., & Yagan, D. (2011). How
does your kindergarten classroom affect your
earnings? Evidence from Project STAR. Quarterly
Journal of Economics, 126(4), 1593–1660. https://doi.
org/10.1093/qje/qjr041
Common Data Set (CDS) Initiative (2018). 2018–
2019 Common Data Set Initiative. http://www.
commondataset.org/
Courant, P. N., & Turner, S. (forthcoming). Faculty
deployment in research universities. In Hoxby, C. M.
& Stange, K. (Eds.) Productivity in higher education.
Chicago: University of Chicago Press.
Cross, J. G., & Goldberg, E. N. (2009). Off-track profs:
Nontenured teachers in higher education. Cambridge,
MA: MIT Press.
De Giorgi, G., Pellizzari, M., & Woolston, W. G. (2012).
Class size and class heterogeneity. Journal of the
European Economic Association, 10(4), 795–830.
https://onlinelibrary.wiley.com/doi/abs/10.1111/
j.1542-4774.2012.01073.x

20Fall 2019 Volume
Dee, T. S., & West, M. R. (2011). The non-cognitive
returns to class size. Educational Evaluation
and Policy Analysis, 33(1), 23–46. https://doi.
org/10.3102/0162373710392370
Drewes, T., & Michael, C. (2006). How do students
choose a university?: An analysis of applications to
universities in Ontario, Canada. Research in Higher
Education, 47(7), 781–800. https://doi.org/10.1007/
s11162-006-9015-6
Dynarski, S., Hyman, J., & Schanzenbach, D. (2013).
Experimental evidence on the effect of childhood
investments on postsecondary attainment and
degree completion. Journal of Policy Analysis
and Management, 32(4), 692–717. https://doi.
org/10.1002/pam.21715
Espinoza, S., Bradshaw, G., & Hausman, C. (2002).
The importance of college choice factors from the
perspective of high school counselors. College and
University, 77(4), 19–23.
Hemelt, S. W., Stange, K. M., Furquim, F., Simon, A.,
& Sawyer, J. E. (2018). Why is math cheaper than
English? Understanding cost differences in higher
education. Working Paper 25314, National Bureau
of Economic Research, Cambridge, MA. https://doi.
org/10.3386/w25314
Hoxby, C. M. (2000). The effects of class size
on student achievement: New evidence from
population variation. Quarterly Journal of
Economics, 115(4), 1239–1285. https://doi.
org/10.1162/003355300555060
Kokkelenberg, E. C., Dillon, M., & Christy, S. M.
(2008). The effects of class size on student grades
at a public university. Economics of Education
Review, 27(2), 221–233. https://doi.org/10.1016/j.
econedurev.2006.09.011
Krueger, A. B. (1999). Experimental estimates
of education production functions. Quarterly
Journal of Economics, 114(2), 497–532. https://doi.
org/10.1162/003355399556052
Lande, E., Wright, M., & Bartholomew, T. (2016,
October). Impact of smaller class sizes in U-M
mathematics courses. Unpublished internal report,
Center for Research on Learning and Teaching,
University of Michigan, Ann Arbor.
Stange, K., & M. Umbricht, 2018. Undergraduate
class size reduction: Effects and costs. Unpublished
working paper, University of Michigan, Ann Arbor.
Supiano, B. (2018, March 21). Are small classes
best? It’s complicated. Chronicle of Higher Education.
https://www.chronicle.com/article/Are-Small-Classes-
Best-It-s/242878
Wright, M., Bergom, I., & Lande, E. (2015,
September). Impact of smaller class sizes in U-M
Spanish and German courses. Internal report,
Center for Research on Learning and Teaching,
University of Michigan, Ann Arbor. Executive
summary at http://crlt.umich.edu/sites/default/files/
SmallClassExecSum.pdf