
Transparency International Corruption Perception Index 2008 Transparency International-Estonia.

Perception-Based Transparency Optimizationfor Direct Volume Rendering
Ming-Yuen Chan, Student Member, IEEE, Yingcai Wu,Wai-Ho Mak, Wei Chen, Member, IEEE, and Huamin Qu, Member, IEEE
Abstract—The semi-transparent nature of direct volume rendered images is useful to depict layered structures in a volume. However,obtaining a semi-transparent result with the layers clearly revealed is difficult and may involve tedious adjustment on opacity and otherrendering parameters. Furthermore, the visual quality of layers also depends on various perceptual factors. In this paper, we proposean auto-correction method for enhancing the perceived quality of the semi-transparent layers in direct volume rendered images. Weintroduce a suite of new measures based on psychological principles to evaluate the perceptual quality of transparent structures inthe rendered images. By optimizing rendering parameters within an adaptive and intuitive user interaction process, the quality ofthe images is enhanced such that specific user requirements can be met. Experimental results on various datasets demonstrate theeffectiveness and robustness of our method.
Index Terms—Direct volume rendering, image enhancement, layer perception.
1 INTRODUCTION
Volume visualization is a useful means to discover meaningful struc-tures in volumes. It relies on proper transfer function specification todeliver the expected results according to user requirements. In typi-cal scientific volumes, structures to be visualized may be layered orpartially occluded by others in the rendered images. Instead of com-pletely removing the occluding structures or exterior layers and assign-ing an opaque property to the target structures, the structures are oftenrendered in a semi-transparent manner to preserve their appearancesand spatial information in the image, which is an advantageous char-acteristic of volume rendering. Despite its attractiveness, producingsatisfying direct volume rendered images (DVRIs) is still a challeng-ing research issue, as witnessed by the large amount of literature ontransfer function design and volume rendering.
There are several problems in obtaining satisfactory rendered im-ages of volumes with semi-transparent structures. Firstly, all the con-stituent structures should obtain a balanced and sufficiently high opac-ity in order to be visible in the image. As the opacity of structures af-fects the visibility of other layered structures, such mutual effects aredifficult to resolve when the structural complexity of the image is high.A well-balanced opacity specification or adaptive adjustment becomesa non-trivial problem. Actually, visibility is a necessary criteria but notsufficient for expressive visualization. The structure and transparencyperceptions play a more important role in viewers’ understanding ofthe volume. Meanwhile, other visual properties like color and lightingare some of the crucial factors influencing our visual perception of thestructures. These factors lead to a high dimensional parameter space,which is complicated and tedious to explore or manipulate. Therefore,an automatic or interactive adjustment method is necessary to maintainthe quality of the rendered image.
Enhancing the perception of semi-transparent structures has beenstudied for decades. Non-photorealistic lighting [10] and visual cues[1] are often integrated in typical approaches. Psychological studies
• Ming-Yuen Chan, Yingcai Wu, Wai-Ho Mak, and Huamin Qu are with theDepartment of Computer Science and Engineering, The Hong KongUniversity of Science and Technology,E-mail: {pazuchan|wuyc|nullmak|huamin}@cse.ust.hk.
• Wei Chen is with State Key Lab of CAD&CG, Zhejiang University,E-mail: [email protected].
Manuscript received 31 March 2009; accepted 27 July 2009; posted online11 October 2009; mailed on 5 October 2009.For information on obtaining reprints of this article, please sendemail to: [email protected] .
[25] have identified that luminance and contrast are two major factorsin transparency perception, while the contextual information is use-ful to provide visual hints. Other factors including lighting, shadow,reflection, and contours are also evaluated in the psychological stud-ies. It is thus reasonable to exploit these psychological principles tofacilitate the enhancement of the visualization process.
The goal of this paper is to develop a unified framework for au-tomatic specification of rendering parameters and interactive enhance-ment for DVRIs to reveal layered structures in a semi-transparent man-ner. Based on the perception principles, transfer functions for illustrat-ing layered volumetric structures can be obtained by means of novelimage quality measures on visibility, shape, and transparency in con-junction with a parameter optimization procedure. The result is animage quality improvement that preserves the meaningful structureswhile revealing the context and spatial relation of these structures.
The contributions of this paper are as follows:• A suite of image quality measures for assessing the effectiveness
of the rendered image in revealing the layered semi-transparentstructures in the volume
• An adoption of psychological principles to derive rules to esti-mate the perceived transparency of structures in an image
• A novel optimization framework for enhancing the renderingparameters and consequently the perceived quality of semi-transparent structures in the image
• An adaptive and interactive refinement solution to obtain specificrefinements on transparent structures
2 PREVIOUS WORK
In this section, we will first review some recent methods for transferfunction design. The typical techniques for layer and surface visual-ization will then be briefly surveyed. Related work on transparencyperception in psychology and perception fields will also be discussed.
Transfer Function Design Transfer functions [20] can be cate-gorized as data-centric or image-centric. The former determines thevisual properties based on the volume data values and their derivedattributes. Multi-dimensional transfer functions [14] can be definedon the local properties of the volume to reveal the target structures.Properties like curvature [13] and size [3] have also been used. Al-ternatively, the image-centric transfer function is designed based onthe rendered images. For example, transfer function can be searchedbased on the specific features [29] or visibility [4] of structures in therendered image. Image processing operations have also been incor-porated into the transfer function design [6]. To facilitate the trans-fer function specification, many intelligent approaches have been pro-posed, including semi-automatic generation [5] and semantics layers
1283
1077-2626/09/$25.00 © 2009 IEEE Published by the IEEE Computer Society
IEEE TRANSACTIONS ON VISUALIZATION AND COMPUTER GRAPHICS, VOL. 15, NO. 6, NOVEMBER/DECEMBER 2009
Authorized licensed use limited to: Hong Kong University of Science and Technology. Downloaded on July 06,2010 at 02:30:16 UTC from IEEE Xplore. Restrictions apply.

[21, 24]. Our approach is both data- and image-centric, and focuseson the optimization of the perception of transparent structures.
Surface/Layer Visualization Effective surface visualization notonly concerns making a surface visible in an image but also maintain-ing the properties such as curvature, orientation, and texture of theshape. Shape-from-shadow [11] is a common approach. To enhancethe shape perception, Gooch et al. [10] proposed a non-photorealisticlighting model for technical illustration. Light Collages [15] use multi-ple lights and local illumination to adaptively enhance the shape of dif-ferent parts of the structures. Lighting methods can emphasize shapeperception through the features such as shadows, highlights, and sil-houettes in an image. Specular reflection [8] has also been proven to bean effective channel for shape perception. Another common class oftechniques is shape-from-motion [27]. Through the spatial and tempo-ral changes in a sequence of images, shape details can be reconstructedby viewers. Kinetic visualization was proposed by Lum et al. [16] toadd motion cues to static objects using a particle system. For lay-ered surfaces, texturing has also been extensively explored. Differenttextures were tested and a guideline on texture synthesis [1] was devel-oped for effective layered surface visualization. Interrante et al. [12]also used textures to enhance the relative depth and features of lay-ered surfaces. Other visual cues like boundary or silhouette contours,stereo, and occlusion can also be used to encode the shape informa-tion of surfaces. Volume illustration approaches [23] have also beenproven to be an effective way to convey the structural details in vol-umes. In this paper, we do not work on non-photorealistic rendering orvisual cues for shape but focus on enhancement of direct volume ren-dered images. We believe a well-balanced rendered image is necessarybefore any visual effects or techniques can be applied.
Transparency Perception The perceived transparency of struc-tures depends on subjective human perception. This topic has beenstudied in psychology for decades. Various factors [7] like shadow,lighting, contrast, color have been considered as the critical visualcues to reveal transparency. Metelli et al. [18] used a simple physi-cal model to rationalize visual perception on transparency. Luminance[9] is considered as an important channel in conveying transparencyinformation. Based on this theory, Singh and Anderson [25] formu-lated an extension using contrast and proposed the transmittance an-choring principle (TAP) to evaluate the transparency of layers in im-ages. This principle was tested in various conditions [26] and has beenwidely used in the perception field. Commonly used visual cues fortransparency actually emphasize the luminance profile of the image toenhance the transparency. For example, lighting and color [28] can beused to give distinct luminance and contrast to transparent structures.The effects on the image can be explained and evaluated by these per-ception rules. Our work is closely inspired by these principles, whichlead to a new transparency measure and guide the optimization of ap-propriate transparency configurations.
3 ENHANCEMENT FRAMEWORK
The proposed enhancement framework consists of several image qual-ity measures and an optimization process. Given a volumetric dataset,we assume that the structures in the volume are defined and assignedwith color and importance values (or opacity). Our objective is to au-tomatically adjust the rendering parameters to reveal the structures in asemi-transparent manner. This semi-transparent appearance of struc-tures can help preserve the context and spatial relation informationamong layered or hierarchical structures in the volume.
Structures in Volume To evaluate the perception of semi-transparent layers in a rendered image, the structures in the volumehave to be implicitly or explicitly defined in the volume or other fea-ture space. In this paper, we implicitly segment the data based onintensity and the segmented regions are treated as structures in thefollowing discussion. We focus on the conceivable quality enhance-ment and regard the volume segmentation as an input. The discussionof volume segmentation or volume classification via transfer functiondesigns is beyond our scope. Likewise, we define the boundaries of
Fig. 1. Flow chart showing the optimization pipeline.
structures as the structural layers that can be computed with previousmethods like opacity peeling [22] and volume catcher [19].
Structural Layers in DVRI Each structure in a volume can betreated as a structural layer projected on the rendered image with cer-tain transparency. A layer can reveal the shape and appearance of thecorresponding structure in the volume. However, the layers may notbe perceived effectively due to various factors like poor lighting andrendering parameter settings. Image quality may also deteriorate withoverlapping or adjacent layers. Our objective is to enhance the visualperception of layers in conveying the underlying structural informa-tion. Users can specify the expected visual properties (i.e., color andopacity) of each class of structures using a transfer function interface.The opacity is considered as the importance value and the transparencyof the layers is optimized with respect to it in the final image.
An overview of the framework is shown in Fig. 1. Given the volumeand structural information, some invariant volume and image metricsare first pre-computed. In the optimization process, the quality of therendered images is assessed based on three aspects of layered visualperception, namely, visibility, shape, and transparency. Quantitativemeasures are proposed to evaluate these perceptions. The fundamen-tal idea is to ensure that the layer and shape information of the struc-tures can be faithfully conveyed in the rendered image. The deviationbetween the volume content and perceived image is minimized. Weformulate the perceptual deviation as a set of energy terms for a leastsquare optimization, yielding an optimal rendering setting. An en-hanced DVRI is produced using the optimized rendering parameters.
4 PERCEPTUAL QUALITY MEASURES
Visibility is the first necessary condition for a structure to be clearlyshown in an image. To reveal the layered structures in an image, eachlayer should acquire a significantly high opacity and meanwhile thevisibility of the structures should be balanced. Provided a good visi-bility, the shape and transparency should also be faithfully presented inthe image for depicting the details of structures and ensuring the distin-guishable appearance and correct layer perception. Several perceptionrules were derived from these factors in previous psychological stud-ies [7, 25] and were supported with extensive experimental evidences.Based on these investigations, we formulate three measures to assessthe quality of rendered images with layered structures.
4.1 Visibility
While a structure may be assigned a significantly high opacity, its vis-ibility in the rendered image may still be low. In the ray casting pro-cess, each ray may pass through various structures and has differentray compositions. Consider that a layer at the back may be severelyoccluded if the accumulated opacity is high. The ideal situation is tohave all the constituent structures contribute to the ray composite valuein proportion to their structural composition. Our solution is to equal-ize the opacity of structures with respect to the portion of constituentstructures (layers) in the image and the originally assigned opacity(importance). The optimal opacity setting should ensure the visibilityof structures to be proportional to their constituent portion in every ray.
1284 IEEE TRANSACTIONS ON VISUALIZATION AND COMPUTER GRAPHICS, VOL. 15, NO. 6, NOVEMBER/DECEMBER 2009
Authorized licensed use limited to: Hong Kong University of Science and Technology. Downloaded on July 06,2010 at 02:30:16 UTC from IEEE Xplore. Restrictions apply.
� �
Structural Visibility Histogram
� �
Structural Opacity (Importance) Histogram
Ray ProfileOpacity
Visibility
� �
Structural Visibility Deviation Histogram
A B � �
Visibility Equalization
A B
Ray
3D View
2D View
Ray
Ray
Structural Visibility Deviation Histogram
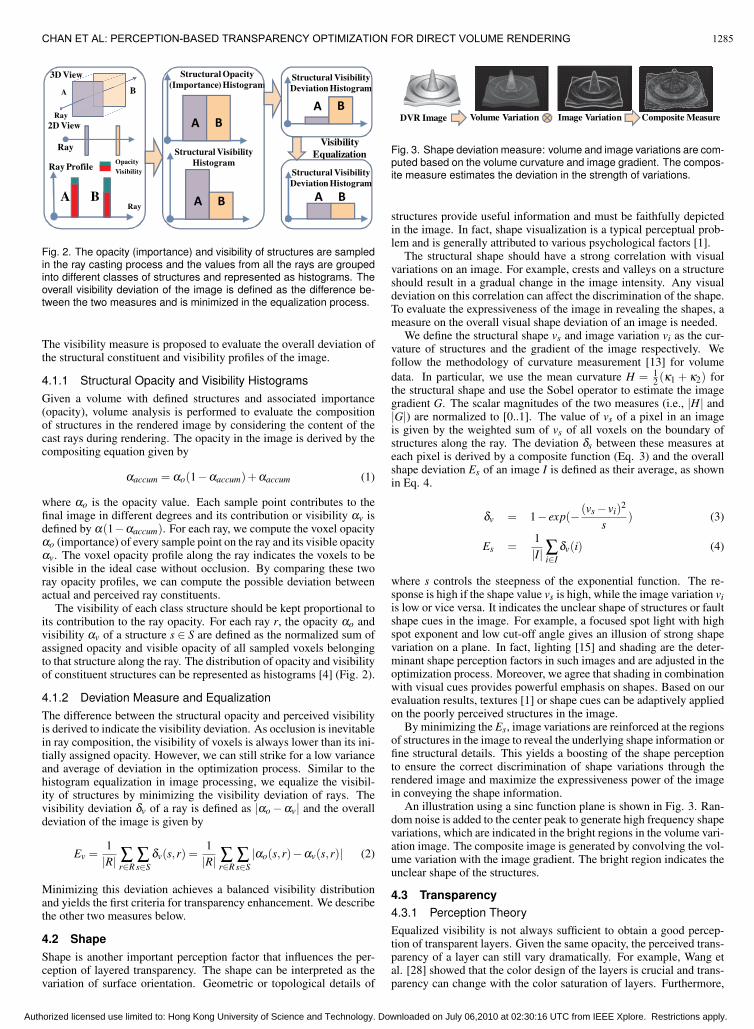
Fig. 2. The opacity (importance) and visibility of structures are sampledin the ray casting process and the values from all the rays are groupedinto different classes of structures and represented as histograms. Theoverall visibility deviation of the image is defined as the difference be-tween the two measures and is minimized in the equalization process.
The visibility measure is proposed to evaluate the overall deviation ofthe structural constituent and visibility profiles of the image.
4.1.1 Structural Opacity and Visibility Histograms
Given a volume with defined structures and associated importance(opacity), volume analysis is performed to evaluate the compositionof structures in the rendered image by considering the content of thecast rays during rendering. The opacity in the image is derived by thecompositing equation given by
αaccum = αo(1−αaccum)+αaccum (1)
where αo is the opacity value. Each sample point contributes to thefinal image in different degrees and its contribution or visibility αv isdefined by α(1−αaccum). For each ray, we compute the voxel opacityαo (importance) of every sample point on the ray and its visible opacityαv. The voxel opacity profile along the ray indicates the voxels to bevisible in the ideal case without occlusion. By comparing these tworay opacity profiles, we can compute the possible deviation betweenactual and perceived ray constituents.
The visibility of each class structure should be kept proportional toits contribution to the ray opacity. For each ray r, the opacity αo andvisibility αv of a structure s ∈ S are defined as the normalized sum ofassigned opacity and visible opacity of all sampled voxels belongingto that structure along the ray. The distribution of opacity and visibilityof constituent structures can be represented as histograms [4] (Fig. 2).
4.1.2 Deviation Measure and Equalization
The difference between the structural opacity and perceived visibilityis derived to indicate the visibility deviation. As occlusion is inevitablein ray composition, the visibility of voxels is always lower than its ini-tially assigned opacity. However, we can still strike for a low varianceand average of deviation in the optimization process. Similar to thehistogram equalization in image processing, we equalize the visibil-ity of structures by minimizing the visibility deviation of rays. Thevisibility deviation δv of a ray is defined as |αo −αv| and the overalldeviation of the image is given by
Ev =1|R| ∑
r∈R∑s∈S
δv(s,r) =1|R| ∑
r∈R∑s∈S
|αo(s,r)−αv(s,r)| (2)
Minimizing this deviation achieves a balanced visibility distributionand yields the first criteria for transparency enhancement. We describethe other two measures below.
4.2 ShapeShape is another important perception factor that influences the per-ception of layered transparency. The shape can be interpreted as thevariation of surface orientation. Geometric or topological details of
Volume VariationDVR Image Image Variation Composite Measure
Fig. 3. Shape deviation measure: volume and image variations are com-puted based on the volume curvature and image gradient. The compos-ite measure estimates the deviation in the strength of variations.
structures provide useful information and must be faithfully depictedin the image. In fact, shape visualization is a typical perceptual prob-lem and is generally attributed to various psychological factors [1].
The structural shape should have a strong correlation with visualvariations on an image. For example, crests and valleys on a structureshould result in a gradual change in the image intensity. Any visualdeviation on this correlation can affect the discrimination of the shape.To evaluate the expressiveness of the image in revealing the shapes, ameasure on the overall visual shape deviation of an image is needed.
We define the structural shape vs and image variation vi as the cur-vature of structures and the gradient of the image respectively. Wefollow the methodology of curvature measurement [13] for volumedata. In particular, we use the mean curvature H = 1
2 (κ1 + κ2) forthe structural shape and use the Sobel operator to estimate the imagegradient G. The scalar magnitudes of the two measures (i.e., |H| and|G|) are normalized to [0..1]. The value of vs of a pixel in an imageis given by the weighted sum of vs of all voxels on the boundary ofstructures along the ray. The deviation δs between these measures ateach pixel is derived by a composite function (Eq. 3) and the overallshape deviation Es of an image I is defined as their average, as shownin Eq. 4.
δv = 1− exp(−(vs − vi)
2
s) (3)
Es =1|I| ∑i∈I
δv(i) (4)
where s controls the steepness of the exponential function. The re-sponse is high if the shape value vs is high, while the image variation viis low or vice versa. It indicates the unclear shape of structures or faultshape cues in the image. For example, a focused spot light with highspot exponent and low cut-off angle gives an illusion of strong shapevariation on a plane. In fact, lighting [15] and shading are the deter-minant shape perception factors in such images and are adjusted in theoptimization process. Moreover, we agree that shading in combinationwith visual cues provides powerful emphasis on shapes. Based on ourevaluation results, textures [1] or shape cues can be adaptively appliedon the poorly perceived structures in the image.
By minimizing the Es, image variations are reinforced at the regionsof structures in the image to reveal the underlying shape information orfine structural details. This yields a boosting of the shape perceptionto ensure the correct discrimination of shape variations through therendered image and maximize the expressiveness power of the imagein conveying the shape information.
An illustration using a sinc function plane is shown in Fig. 3. Ran-dom noise is added to the center peak to generate high frequency shapevariations, which are indicated in the bright regions in the volume vari-ation image. The composite image is generated by convolving the vol-ume variation with the image gradient. The bright region indicates theunclear shape of the structures.
4.3 Transparency4.3.1 Perception Theory
Equalized visibility is not always sufficient to obtain a good percep-tion of transparent layers. Given the same opacity, the perceived trans-parency of a layer can still vary dramatically. For example, Wang etal. [28] showed that the color design of the layers is crucial and trans-parency can change with the color saturation of layers. Furthermore,
1285CHAN ET AL: PERCEPTION-BASED TRANSPARENCY OPTIMIZATION FOR DIRECT VOLUME RENDERING
Authorized licensed use limited to: Hong Kong University of Science and Technology. Downloaded on July 06,2010 at 02:30:16 UTC from IEEE Xplore. Restrictions apply.

(a)
A
P
(b)
����������
� ���
� ���
� ��
���
B
A P Q
(c)
Fig. 4. Example of Metelli’s theory: transparent layer on (a) bipartite and(b) inhomogeneous regions; (c) illustration using overlapping spheres.
lighting on the layer and context can provide hints to the recognitionof the layers. Other image cues [7] like highlight, contrast, and bluralso play an important role in human visual perception.
Metelli’s episcotister model [18] is a widely adopted transparencyperception theory. Given a transparent layer on a bipartite backgroundof region A and B (Fig. 4(a)), the transmittance αmet of the layer, whichindicates the fraction of light passing through the layer, is derived fromthe physical equations (Talbot’s Law) as follows:
p = αta+(1−αt)t
q = αtb+(1−αt)t
αmet = (p−q)/(a−b) (5)
where p,q,a, and b are the reflectances of regions P,Q,A, and B re-spectively. The reflectance can be replaced by luminance, which hasbeen proven to be an intuitive channel to human visual system and ismore effective in rationalizing the contrast perception [9]. Fig. 4(c)shows an example of two spheres overlapping in an image. Bothspheres have identical opacity but different colors. The perceivedtransmittance of yellow and purple layers in the overlapping regionP is derived using the Metelli’s equation and the values are 0.49 and0.36 respectively. It indicates that less light is allowed to pass throughthe purple layer, thus resulting in a higher opacity. This complies withour visual perception that P is more purple than yellow.
This model can explain the transparency perception of layers withuniform luminance. For textured or complex layers, Singh et al. [25]extended the original theory as a generative model to tackle the inho-mogeneity in transmittance and reflectance. Inferring the transparencyfrom luminance distribution involves scaling and anchoring problems.They determine how the luminance ratio is mapped to the ratio of per-ceived transparency and how to anchor this relative scale to the ab-solute one. Based on the psychological observation, scaling can beimplied in contour contrast, which changes linearly with the trans-parency. Moreover, according to the transmittance anchoring princi-ple (TAP), the highest contrast segment along a contour can serve asan anchor for determining the absolute scale of lower contrast regions.This model was validated in the experiments on various inhomoge-neous surfaces and media. The transmittance is defined in terms ofthe contrast (range of luminance I) of background A and transparentregions P (Fig. 4(b)) and is given by
αtap =Imax(P)− Imin(P)
Imax(A)− Imin(A)=
Irange(P)
Irange(A)(6)
This implies that the contrast of the underlying contour is reduced bythe overlay transparent layer. Singh et al. [26] further improved themodel by replacing the luminance range with the Michelson contrastdefined as follows:
C = Irange =Imax − Imin
Imax + Imin(7)
To avoid the luminance ranges being affected by noise, the Imin andImax are defined as max(0, Iμ−2σ ) and min(IMAX , Iμ+2σ ), given I is in[0..IMAX ] and μ , σ are the mean and variance of luminance.
4.3.2 Transparency Measure
In our paper, we adopt a hybrid approach of TAP and Metelli’s model.In homogenous regions with low contrast, Metelli’s model can per-
L0
L4
Image Sub-regions
L1
L3
L2
R0
R1
R2R5
R6
R4
R3
(a)
Image Sub-regions L0
L1
L3
L2
R0R1
R2 R5
R6R4
R3R7
R8
(b)
Fig. 5. Structural layers and sub-regions in image: (a) shows differentkinds of relations between the structural layers. The image is dividedinto sub-regions based on the layer composition. Another example ofoverlapping and enclosed layers is shown in (b).
fectly estimate the transparency, while the TAP (Eq. 6) becomes un-stable with small ranges of luminance. Therefore, a modulation isperformed on the transparency, given by
αt = αmeth+αtap(1−h) (8)
where h = (IMAX − Irange)/IMAX . αt tends to αmet if the regions be-come homogeneous. The perceived opacity is interpreted as 1−αt .
With this transparency perception model, we can compute the trans-parency of layers as well as the perception deviation in different re-gions of the image. In the preprocessing procedures, the structurallayer composition at different parts in the image is computed and theimage is decomposed into sub-regions based on their composition.The regions are then classified into different types (empty, plain view,or overlay) and the perceived transparency of each constituent layer iscomputed, as shown in Fig. 5(a). An empty region does not consistof any layer, while a plain view region only contains one layer. Anoverlay region consists of more than one layer and is either an over-lapping or enclosed regions of structural layers. A structural layer maybe decomposed into several sub-regions and the relations between thestructural layers are defined as separate, touch, overlap, or enclose us-ing the region connection calculus [2]. Based on this information, wecan determine the relation property of the constituent layers in eachregion. This information can be used to determine the perceived trans-parency as well as the transparency perception deviation δt of the re-gion. An illustration of perceived transparency computation is shownin Fig. 5(a) and the rules are summarized as follows:
Case 1: For an empty region (Ro) or a plain view region (R3) witha separate or touch layer, the deviation is zero because no layeredstructure is present.
Case 2: For a plain view region (R1,R4,R6) with an enclosing oroverlap layer, the transparency of the layer can be derived by Eq. 6 forthe enclosing layer (L1) or Eq. 8 for the overlapping layer (L3,L4).
Case 3: For an overlay region (R2,R5), the transparency of eachlayer is determined by its relation property. If a layer belongs to anenclosing layer (L1 in R2), the transparency is the same as that in theenclosing region (L1 in R1). If the layer belongs to an overlappinglayer (L3 and L4 in R5), the transparency can be derived by Eq. 8.
Fig. 5(b) shows a more complicated example of regions with threeor more layers. Region Ro,R1,R2,R3,R8 can be evaluated by the aboverules. Region R4,R7,R6 consist of three layers. The enclosing layerL3 is the same as that in R1, which is derived by case 2 where R1 is thebackground and all regions enclosed by L3 are treated as a transparentlayer. For the overlapping layers in R4,R7,R6, they can be degeneratedto the simple case by ignoring the enclosing layer L3. Region R5 con-tains three overlapping layers L = {L0,L1,L2}. The transparency of alayer Li can be resolved by treating other overlapping layers L−Li asa single layer. The Metelli’s equation can be generalized to
αLi =I{L} − I{Li}
I{L−Li} − I{ /0}(9)
where I{ /0} is the empty view excluding any enclosing layer. For exam-ple, the transparency of L2 in R5 is computed as (IR5 −IR3)/(IR6 −IR1).
1286 IEEE TRANSACTIONS ON VISUALIZATION AND COMPUTER GRAPHICS, VOL. 15, NO. 6, NOVEMBER/DECEMBER 2009
Authorized licensed use limited to: Hong Kong University of Science and Technology. Downloaded on July 06,2010 at 02:30:16 UTC from IEEE Xplore. Restrictions apply.

Given the perceived transparency αt of the non-empty regions, thetransparency deviation δt of a region is derived by the sum of squaredifferences between the perceived opacity 1 − αt and the structuralopacity αo of all the constituent layers. The overall transparency devi-ation Et measure is given by
δt = ∑i∈L
(1−αt(i)−αo(i))2 (10)
Et =1|R| ∑
r∈Rωrδt(r) (11)
where R is the set of all non-empty regions in the image and ωr is theweight of region r, which is given by its portion of area in the image.By minimizing the transparency deviation, the perceived transparencyof the structures will be closer to the expected transparency or compo-sition of the structures in the image.
5 OPTIMIZATION
Recall that the perception of a semi-transparent structure in a DVRI isdriven by the visibility, shape, and transparency, which are governedby the rendering parameters including opacity, lighting, and color. Tofaithfully depict the structures in the image, we have to solve for anoptimal parameter setting for rendering. The three measures are usedto drive the optimization of the rendering parameters for an optimalrendered result. More specifically, the rendering parameters (transferfunctions) of the structures are formulated as an objective function fand is optimized as a least square problem [17]. Our objective is tominimize the perception deviation (or measures) of the overall imageby fitting an optimal parameter configuration for the volume at a spe-cific viewpoint. For each ray r, we derive the energy as
E = ωvEv +ωsEs +ωtEt (12)
where ωv,ωs,ωt are the weights of the measures. We setup an over-determined system of all the ray quality equations and compute thesum of residue
S = ∑r∈R
E( f ,r)2 (13)
The optimal solution with the minimum residue is derived by findingan f for the given DVRI, such that
argmin f {E( f )} (14)
To solve the non-linear least square problem, the parameters arerefined by an iterative solver [17]. We adopt the conjugate gradientmethod, which is a widely used direct search method with good con-vergence performance. Because it is difficult to explicitly compute theanalytical expressions for the partial derivatives of the measure equa-tions, we perform an empirical approximation by sampling the imagewith different f . Based on the steepest descent direction −∇ f E( f ) andthe derived conjugate direction Λ f , the transfer function is updated as
fn+1 = fn +αnΛ fn (15)
where αn is given by argminE( fn +αnΛ fn).Optimizing all the rendering parameters simultaneously is ineffi-
cient; thus, a hierarchical approach is adopted. The visibility of struc-tures is first optimized by adjusting the opacity. Given that every struc-ture becomes basically visible in the image, the shape of the structuresis then preserved by proper lighting. The transparency perception ofthe structures is finally enhanced with proper color. Optimization canbe done sequentially and each step only involves a subset of the pa-rameters. The importance and color of structures provided by users aswell as the default light parameters are the initial guess for the opti-mization. To avoid local optima, the simulated annealing technique isapplied on the parameter optimization. For example, a high transitionprobability is assigned to opacity if the current visibility deviation ishigh or does not show a significant improvement from its initial value.
(a)
Transparent Layers
R+C+
R+C-
R-C-R-C+
(L0,R0)
Mean Luminance (L)
Lum
inan
ce R
ange
(R)
(b)Mean Luminance (L)
Lum
inan
ce R
ange
(R
) (L0,R0)
CalibratedOriginal
(c)
Fig. 6. (a) Our user interface for selective enhancement of DVRIs; (b)Luminance chart showing the relation between luminance and trans-parency; (c) Calibrated chart based on user perception.
6 ADAPTIVE REFINEMENT
A globally optimized solution may not be applicable to all parts of theimage. The optimized configuration may be biased towards the domi-nating structures in the image and leaves the less significant structuresunenhanced. Our system allows users to selectively enhance a specificpart of the image or structures. To guide the interactive enhancementprocess, an image quality map interface is provided to show the devi-ation measure values at different parts of the image. Users can use alens-like tool to specify the regions with poor quality with referenceto the quality map. The regions are then enhanced individually. Userscan also specify an expected visibility or transparency to the structuresof interest within the region to ensure that they are clearly shown andenhanced in the refined image. An example is shown in Fig. 6(a).
Besides, as the perceived transparency may slightly vary betweenviewers and may not always change linearly with the luminance meanand contrast, a calibration tool is provided to estimate the transparencyand contrast relation (Fig. 6(b)). According to the perception theory,the expected luminance values of different transparencies are repre-sented by the straight line between the background luminance (L0,R0)and the origin. From the psychological experiment [25], we can ob-serve that the user perception falls within the region shown in the chart.The exact perception can slightly deviate from the straight red line inFig. 6(c). To calibrate the curve, a test on sample images is performedto record the user perception on layers with different transparencies.After the test, a calibrated curve representing the user perception iscomputed. The perceived transparency can be located on the calibratedcurve. The transmittance value derived from the contrast ratio (Eq. 6)will be adjusted according to this curve in the optimization process.
7 EXPERIMENTS
We conducted experiments on several datasets to demonstrate the qual-ity measures and the optimization of rendered images. Our system wasrun on a Dell machine (Pentium Core2Duo 6400, 2G RAM) equippedwith an NVIDIA GeForce 7600GTS graphics card. The volumes werepre-segmented. Results on different measures will be first discussedand two comprehensive results will be provided afterwards.
We first used a carp datatset (256×256×512) as shown in Fig. 7 toshow the result of visibility equalization (opacity optimization). Theskin and bones of the carp were assigned with importance values of 0.2and 0.8 and our objective was to balance the overall visibility of eachstructure based on this weighting. The equalization on the opacity wasperformed by minimizing the visibility deviation from the importanceweighting (i.e., visibility measure). The measure image indicating thedeviation of the original DVRI showed that the bones were occluded.The opacity of the structures was optimized and the result showed thatthe overall deviation of the image was lowered and the bone structureswere revealed according to the importance ratio. Some optimized re-sults with different ratios were also shown in the figures. By observingthe resulting quality image and the refined DVRI, we can see that thecarp was rendered in a semi-transparent manner with balanced visibil-ity after the optimization based on our measure.
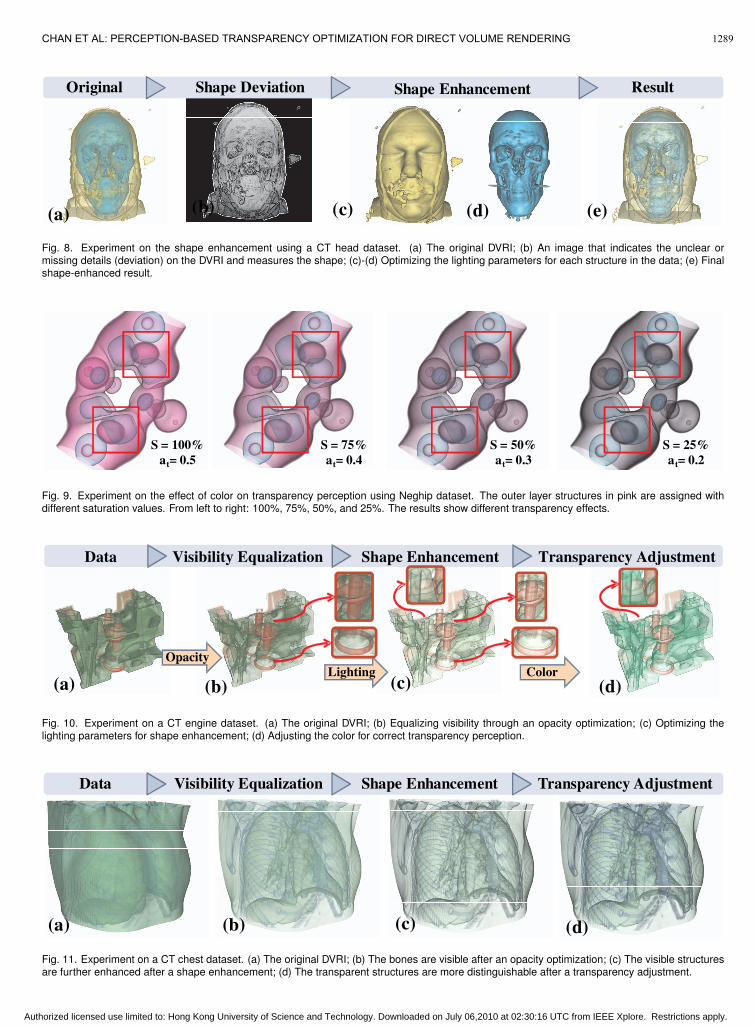
To demonstrate the shape enhancement result, we conducted an ex-periment on a CT head dataset (128×128×231) as shown in Fig. 8.
1287CHAN ET AL: PERCEPTION-BASED TRANSPARENCY OPTIMIZATION FOR DIRECT VOLUME RENDERING
Authorized licensed use limited to: Hong Kong University of Science and Technology. Downloaded on July 06,2010 at 02:30:16 UTC from IEEE Xplore. Restrictions apply.

Fig. 7. Experiment on the visibility equalization using a carp dataset.The skin and bone structures are given the importance values of 0.2and 0.8. Results of other importance ratios are shown at the bottom.
The shape measure image indicates the shape variations and percep-tion deviation in the DVRI. To obtain a better shape perception of theface and skull, the lighting parameters for the structures have to be op-timized for emphasizing the shape variations on both layers. In the op-timization process, the parameters obtained by the structures could bedifferent. For example, a large specular highlight (small specular re-flection exponent) is exerted on a large and smooth surface (e.g., skin).By optimizing the lighting parameters of the structures, the shapes aswell as features on different layers of the head were enhanced. Thiscan be reflected in the reduced overall value of the resulting shapemeasure image. From the experiment, we can see that illumination isimportant to shape enhancement and our measure effectively drives theoptimization on illumination to achieve better shape-revealing results.
To demonstrate the transparency measure, an experiment was con-ducted on a protein (Neghip) molecule dataset (64×64×64) obtainedby simulation. To show the effect of color on transparency perception,DVRIs of the molecule were generated with different color saturationvalues (Fig. 9). In the DVRIs, the layers of structures overlapped andthe color saturation change resulted in different transparencies of theouter layer. The perceived transparency of the outer layer decreasedwith the saturation; thus, the overlapped inner structures became lessvisible. Based on the TAP, we can derive the perceived transparency ofthe structures in the DVRIs. These results show that the transparencyperception does not only depend on visibility but also the color or ap-pearance of the layer. To faithfully present the structures in the image,we should optimize the transparency of structures in the image in addi-tion to the opacity of each constituent structure. From the experiment,we can see that the TAP can effectively estimate the perceived trans-parency of layers in the volume and the result follows the previouspsychological findings. Various transparency effects can be achievedby optimizing on the color using our measure.
Comprehensive experiments were conducted to illustrate the com-plete pipeline of the optimization process. We first demonstrated howto generate the semi-transparent style DVRI of a CT engine dataset(256× 256× 128) with layered structures, as shown in Fig. 10. Theopacity equalization was first performed to balance the visibility of theinterior and exterior structures. Semi-transparent layers of structureswere generated as a result. Afterwards, the lighting parameters wereoptimized to enhance the overall shape perception of the transparentlayers of structures. The results show that the features of the structureswere better preserved in the image. To ensure that the perceived trans-parency complies with the composition (structural opacity) of the lay-ers, the color of the structures were optimized with respect to the TAP-based transparency measure and the expected transparency. Anotherexperiments was conducted on a CT chest dataset (384× 384× 240)as shown in Fig. 11. The result shows that the structures becamemore distinguishable and the details were better preserved after theoptimization on visibility, shape, and transparency. From these exper-iments, we can see that our optimization method allows high qualitysemi-transparent style DVRIs to be generated with optimal visibility,
shape, and transparency perception.The performance of the system benefits from the hierarchical opti-
mization, which only involves a subset of the parameters in each step.The results usually converge within 10 iterations in each step. In ourexperiment, we found that the expected opacity (importance values),color of structures, and default lighting parameters could already pro-vide a good initial guess for the optimization and enhancement couldbe done very efficiently based on these settings. As the partial deriva-tives are empirically estimated on the rendered image, the process canbe speeded up by sampling on the image. The performance dependson the computation in ray and structural analysis, which increases withthe size and complexity of the volume as well as the image resolution.For the CT chest, each iteration takes about 0.2s and the whole processcompletes in 10s with an image resolution of 512×512.
8 EVALUATION AND DISCUSSIONS
To validate our method, we invited 20 graduate students to participatein our user study. Before the test, they were given sample images illus-trating different degrees of transparency as reference for quantitativejudgment of perceived transparency. While the effect of opacity andlighting on visibility and shape perception has been studied [4, 15], wespecifically studied the correlations between transparency and colorby conducting controlled experiments. The subjects were first askedto rank a set of DVRIs, which were generated by adjusting the colorof different structures, based on the perceived transparency. The re-sults were compared with the measured transparency (Section 4.3).The results showed that 85% of the subjects got the expected rankingscoincident with those of the measured values.
To more quantitatively study the transparency perception, the sub-jects were then asked to evaluate the degrees of perceived transparencyof the structures in 10 DVRIs of the 5 datasets used in our experi-ments (Section 7). The reported values were compared with the mea-sured transparency of the structures. The results showed that mostsubjects could perceive the correct degree of transparency of the struc-tures. While visual perception varied among viewers, the means of theperceived transparency of images were close to the measured trans-parency and the relative differences were between 3.7% and 8.2%. Therelative standard deviations of the results were between 9% and 16%.A single-sample t-test was also conducted for the results of each imagewith the measured transparency value as the hypothetical mean. The p-values were between 0.02 and 0.21, while 2 results generated from theCT head dataset fell below the significance level of 0.05. The minorerrors could be attributed to the users’ varied experience with trans-parent structures and deviation due to the existing image cues [7]. Ingeneral, there was no significant difference between the perceived andmeasured values. The user study demonstrated that the transparencymeasure can correctly estimate the perceived transparency.
Finally, the subjects were asked to rate the improvement and qualityof the images throughout the optimization process. The feedback fromthe subjects indicated that the layered transparent structures (e.g., ribsin the chest image) might not be distinguishable even after the visi-bility equalization but an improvement was observed after the shapeand transparency adjustment. It indicated that a good perception oftransparent structures relies not only on visibility (opacity) but alsothe color and lighting. All the subjects agreed that color and opac-ity are important visual factors and 70% also thought that lighting canimprove the visual quality of transparent layers. 90% subjects ratedthe improvement in visual quality as good or significant. This studydemonstrated that all the three measures introduced in the paper havetheir values and can improve the perception of transparent layers.
Our method is an improvement over the conventional methods.Compared with the manual specification of transfer function, our ap-proach does not require any user involvement. Manual manipulationhighly depends on user expertise. For many end-users such as doc-tors and scientists, they do not have the expertise to directly manip-ulate transfer functions and lighting parameters. Thus, it is unlikelythat they can obtain results with similar quality by manual manipula-tion. By using the proposed measures, optimal and objective resultsbased on human perception can be automatically obtained. More-
1288 IEEE TRANSACTIONS ON VISUALIZATION AND COMPUTER GRAPHICS, VOL. 15, NO. 6, NOVEMBER/DECEMBER 2009
Authorized licensed use limited to: Hong Kong University of Science and Technology. Downloaded on July 06,2010 at 02:30:16 UTC from IEEE Xplore. Restrictions apply.
Shape Deviation Shape EnhancementOriginal Result
(a) (b) (c) (d) (e)
Fig. 8. Experiment on the shape enhancement using a CT head dataset. (a) The original DVRI; (b) An image that indicates the unclear ormissing details (deviation) on the DVRI and measures the shape; (c)-(d) Optimizing the lighting parameters for each structure in the data; (e) Finalshape-enhanced result.
S = 100%at= 0.5
S = 75%at= 0.4
S = 50%at= 0.3
S = 25%at= 0.2
Fig. 9. Experiment on the effect of color on transparency perception using Neghip dataset. The outer layer structures in pink are assigned withdifferent saturation values. From left to right: 100%, 75%, 50%, and 25%. The results show different transparency effects.
Visibility Equalization Shape EnhancementData Transparency Adjustment
OpacityLighting Color
(a) (b) (c) (d)
Fig. 10. Experiment on a CT engine dataset. (a) The original DVRI; (b) Equalizing visibility through an opacity optimization; (c) Optimizing thelighting parameters for shape enhancement; (d) Adjusting the color for correct transparency perception.
Visibility Equalization Shape EnhancementData Transparency Adjustment
(a) (b) (c) (d)
Fig. 11. Experiment on a CT chest dataset. (a) The original DVRI; (b) The bones are visible after an opacity optimization; (c) The visible structuresare further enhanced after a shape enhancement; (d) The transparent structures are more distinguishable after a transparency adjustment.
1289CHAN ET AL: PERCEPTION-BASED TRANSPARENCY OPTIMIZATION FOR DIRECT VOLUME RENDERING
Authorized licensed use limited to: Hong Kong University of Science and Technology. Downloaded on July 06,2010 at 02:30:16 UTC from IEEE Xplore. Restrictions apply.

over, the specific and adaptive refinements on each layer cannot beachieved manually using typical intensity or class-based transfer func-tion interfaces. Compared with the semi-automatic approach [5] whichgenerates the opacity transfer function based on the histogram vol-ume structure (i.e., boundaries), our solution is a data- and image-centric approach and can provide comprehensive optimization on morerendering parameters including color and lighting. While the semi-automatic approach provides a high-level interface for opacity specifi-cation, our method can automatically generate semi-transparent layerswith proper opacity, color, and lighting as well. Recall that visibil-ity (opacity) is only one of the factors to our transparency perceptionwhile color also play an important role [28]. Our method can com-prehensively optimize different rendering parameters, such that theperception of each layered structure in the image is better reinforced.Different from typical transfer function design approaches [3, 13] inwhich specific data features are incorporated into the multidimensionaltransfer function [14], we focus on the effectiveness of the resultingimages in conveying the layered features in a semi-transparent mannerand ensure that the specific features are not only enhanced and ren-dered properly but also faithfully perceived in the images. Our solu-tion provides an additional perception-based quality enhancement onthe image, which has not been addressed in the previous approaches.
There are several limitations in applying the measures on renderedimages. Recall that layers of structures have to be implicitly or explic-itly defined for the perception measurement. An intuitive segmentationor feature specification tool is necessary for the purpose. Furthermore,it is basically an ill-posed problem to determine the transparency of asingle layer in plain background. In fact, our perception measures usethe available visual hints in the image to estimate the quality of the im-age based on the user perception. Such hints should be available andthey are actually required by humans to make correct visual judgment.Moreover, the improvement may be limited if there are many layeredstructures coupling in the image. Usually, human vision can only han-dle a limited number of layered structures and the perceived quality ofeach layer deteriorates in complex data. Thus, visual cues should beadded on the poorly perceived regions indicated by our measures inaddition to optimizing the rendering parameters.
9 CONCLUSION
In this paper, we proposed a DVRI enhancement solution based on theperception principles. Three measures were designed to evaluate theperception of the semi-transparent layer from the visibility, shape, andtransparency aspects. Rendering parameters were optimized based onthese measures to deliver results complying with viewers’ perception.High quality semi-transparent style DVRIs with structures faithfullyrevealed can be automatically generated using our method. Althoughour work focuses on the optimization for direct volume rendering, themeasures can provide good indications of structural perception so thatadditional visual cues like textures and shape cues can be adaptivelyapplied to enhance the expressiveness of the image.
While opacity is usually considered as the determinant factor forthe transparency of structures, in the experiment we showed that colorand contrast also affect our visual perception of transparency. Our op-timization method puts these factors into account to deliver results thatcan faithfully reveal the layered structures in a semi-transparent man-ner and ensure a correct perception. Our method also eases the fine-tuning of the parameters for transparent results. In the future, we willextend the current static viewpoint solution to an efficient image re-finement of dynamic views for the purpose of interactive exploration.
ACKNOWLEDGMENTS
The research is partially supported by grant HK RGC CERG 618706and 973 program of China (2010CB732504) and NSF China (No.60873123). We thank the reviewers for their valuable comments.
REFERENCES
[1] A. Bair, D. H. House, and C. Ware. Texturing of layered surfaces for opti-mal viewing. IEEE Transactions on Visualization and Computer Graph-ics, 12(5):1125–1132, 2006.
[2] M.-Y. Chan, H. Qu, K.-K. Chung, W.-H. Mak, and Y. Wu. Relation-aware volume exploration pipeline. IEEE Transactions on Visualizationand Computer Graphics, 14(6):1683–1690, 2008.
[3] C. Correa and K.-L. Ma. Size-based transfer functions: A new volumeexploration technique. IEEE Transactions on Visualization and ComputerGraphics, 14(6):1380–1387, 2008.
[4] C. Correa and K.-L. Ma. Visibility-driven transfer functions. In IEEEPacific Visualization Symposium, pages 177–184, 2009.
[5] J. W. Durkin and G. Kindlmann. Semi-automatic generation of transferfunctions for direct volume rendering. In IEEE Symposium on VolumeVisualization and Graphics, pages 79–86, 1998.
[6] S. Fang, T. Biddlecome, and M. Tuceryan. Image-based transfer functiondesign for data exploration in volume visualization. In IEEE Visualiza-tion, pages 319–326, 1998.
[7] R. W. Fleming and H. H. Bulthoff. Low-level image cues in the percep-tion of translucent materials. ACM Transactions on Applied Perception,2(3):346–382, 2005.
[8] R. W. Fleming, A. Torralba, and E. H. Adelson. Specular reflections andthe perception of shape. Journal of Vision, 4(9):798–820, 2004.
[9] W. Gerbino, C. Stultiens, J. Troost, and C. de Weert. Transparent layerconstancy. Journal of Experimental Psychology: Human Perception andPerformance, 16:3–20, 1990.
[10] A. Gooch, B. Gooch, P. S. Shirley, and E. Cohen. A non-photorealisticlighting model for automatic technical illustration. In SIGGRAPH, pages447–452, 1998.
[11] M. Hatzitheodorou. The derivation of 3-d surface shape from shadows.In Proc. Image Understanding Workshop, pages 1012–1020, 1989.
[12] V. Interrante, H. Fuchs, and S. M. Pizer. Conveying the 3d shape ofsmoothly curving transparent surfaces via texture. IEEE Transactions onVisualization and Computer Graphics, 3(2):98–117, 1997.
[13] G. L. Kindlmann, R. T. Whitaker, T. Tasdizen, and T. Moller. Curvature-based transfer functions for direct volume rendering: Methods and appli-cations. In IEEE Visualization, pages 513–520, 2003.
[14] J. Kniss, G. Kindlmann, and C. Hansen. Multidimensional transfer func-tions for interactive volume rendering. IEEE Transactions on Visualiza-tion and Computer Graphics, 8(3):270–285, 2002.
[15] C. H. Lee, X. Hao, and A. Varshney. Light collages: Lighting design foreffective visualization. In IEEE Visualization, pages 281–288, 2004.
[16] E. Lum, A. Stompel, and K.-L. Ma. Kinetic visualization. IEEE Trans-actions on Visualization and Graphics, 9(2):115–126, June 2003.
[17] K. Madsen, H. B. Nielsen, and O. Tingleff. Methods for non-linear leastsquares problems, 2004.
[18] F. Metelli, O. D. Pos, and A. Cavedon. Balanced and unbalanced, com-plete and partial transparency. Perception and Psychophysics, 38(4):354–366, 1985.
[19] S. Owada, F. Nielsen, and T. Igarashi. Volume catcher. In Symposium onInteractive 3D Graphics, pages 111–116, 2005.
[20] H. Pfister, B. Lorensen, C. Bajaj, G. Kindlmann, W. Schroeder, L. S.Avila, K. Martin, R. Machiraju, and J. Lee. The transfer function bake-off. IEEE Computer Graphics and Applications, 21(3):16–22, 2001.
[21] P. Rautek, S. Bruckner, and E. Groller. Semantic layers for illustrativevolume rendering. IEEE Transactions on Visualization and ComputerGraphics, 13(6):1336–1343, 2007.
[22] C. Rezk-Salama and A. Kolb. Opacity peeling for direct volume render-ing. Comput. Graph. Forum, 25(3):597–606, 2006.
[23] P. Rheingans and D. Ebert. Volume illustration: nonphotorealistic render-ing of volume models. IEEE Transactions on Visualization and ComputerGraphics, 7(3):253–264, 2001.
[24] C. R. Salama, M. Keller, and P. Kohlmann. High-level user interfaces fortransfer function design with semantics. IEEE Transactions on Visualiza-tion and Computer Graphics, 12(5):1021–1028, 2006.
[25] M. Singh and B. L. Anderson. Towards a perceptual theory of trans-parency. Psychological Review, 109(3):492–519, July 2002.
[26] M. Singh, J. D. Kadt, and B. L. Anderson. Predicting perceived trans-parency in textured displays. Journal of Vision, 1(3):277–277, 2003.
[27] S. Treue, M. Husain, and R. Andersen. Human perception of structurefrom motion. Vision Research, 31:59–75, 1991.
[28] L. Wang, J. Giesen, K. T. McDonnell, P. Zolliker, and K. Mueller. Colordesign for illustrative visualization. IEEE Transactions on Visualizationand Computer Graphics, 14(6):1739–1754, 2008.
[29] Y. Wu and H. Qu. Interactive transfer function design based on editingdirect volume rendered images. IEEE Transactions on Visualization andComputer Graphics, 13(5):1027–1040, 2007.
1290 IEEE TRANSACTIONS ON VISUALIZATION AND COMPUTER GRAPHICS, VOL. 15, NO. 6, NOVEMBER/DECEMBER 2009
Authorized licensed use limited to: Hong Kong University of Science and Technology. Downloaded on July 06,2010 at 02:30:16 UTC from IEEE Xplore. Restrictions apply.