PERCEIVED TECHNOLOGY READINESS, ACCEPTANCE AND...
176
PERCEIVED TECHNOLOGY READINESS, ACCEPTANCE AND SATISFACTION ON SMK (SISTEM MAKLUMAT KASTAM / CUSTOMS INFORMATION SYSTEM) BY THE ROYAL MALAYSIAN CUSTOMS BY FUNG JUN IAN KHOR ZI HUI LAU HUEY YING LEE CHEE CHUNG LEW MEI JING A research project submitted in partial fulfilment of the requirement for the degree of BACHELOR OF BUSINESS ADMINISTRATION (HONS) UNIVERSITI TUNKU ABDUL RAHMAN FACULTY OF BUSINESS AND FINANCE DEPARTMENT OF BUSINESS AUGUST 2017
Transcript of PERCEIVED TECHNOLOGY READINESS, ACCEPTANCE AND...

PERCEIVED TECHNOLOGY READINESS, ACCEPTANCE AND SATISFACTION ON SMK (SISTEM MAKLUMAT
KASTAM / CUSTOMS INFORMATION SYSTEM) BY THE ROYAL MALAYSIAN CUSTOMS
BY
FUNG JUN IAN
KHOR ZI HUI
LAU HUEY YING
LEE CHEE CHUNG
LEW MEI JING
A research project submitted in partial fulfilment of the requirement for the degree of
BACHELOR OF BUSINESS ADMINISTRATION (HONS)
UNIVERSITI TUNKU ABDUL RAHMAN
FACULTY OF BUSINESS AND FINANCE
DEPARTMENT OF BUSINESS
AUGUST 2017

ii
Copyright @ 2017
ALL RIGHTS RESERVED. No part of this paper may be reproduced, stored in a
retrieval system, or transmitted in any form or by any means, graphic, electronic,
mechanical, photocopying, recording, scanning, or otherwise, without the prior
consent of the authors.

iii
DECLARATION
We hereby declare that:
1) This undergraduate research project is the end result of our own work and that due acknowledgement has been given in the references to ALL sources of information be they printed, electronic, or personal.
2) No portion of this research project has been submitted in support of any application for any other degree or qualification of this or any other university, or other institutes of learning.
3) Equal contribution has been made by each group member in completing the research project.
4) The word count of this research report is 30522 words.
Name of Student: Student ID: Signature:
1. FUNG JUN IAN 14ABB07421 _________
2. KHOR ZI HUI 14ABB07310 _________
3. LAU HUEY YING 14ABB07308 _________
4. LEE CHEE CHUNG 13ABB02795 _________
5. LEW MEI JING 14ABB07307 _________
Date: 18th August 2017

iv
ACKNOWLEGDEMENT
In this research project, we could not successfully if without the help and support
of several people. Each of them is playing an important roles in helping,
encouraging and guiding us when doing our research project. Firstly, we would
like to express our since appreciation to our research project supervisor, Dr.
Ramesh Kumar. He provide us guidance, advice, care, assistance and
encouragement throughout the process of completing this research project. We are
very grateful to Dr. Ramesh Kumar for willing to share with us his knowledgeable
information to guidance us finish our research project.
Last but not least, we would like to give a special thanks to our friends and group
members for sharing their knowledge and provide the opinion in our research
project. Furthermore, we are really thankful for their endless support and
cooperation of each group member and our friends when we are needed them in
times of difficulties.
Lastly, we would like to thanks to our parents and family members for their
support and motivation when we are facing problem. We really appreciate them
consistent support and encouragement to help us complete the research project.

v
TABLE OF CONTENTS
Page
Copyright Page ii
Declaration iii
Acknowledgement iv
Table of Contents v
List of Tables xi
List of Figures xii
List of Abbreviations xiii
List of Appendices xiv
Abstrak xv
Abstract xvi
CHAPTER 1 INTRODUCTION
1.0 Introduction 1
1.1 Research Background 1
1.2 Problem Statement 6
1.3 Research Objectives 8
1.3.1 General Objective 8
1.3.2 Specific Objectives 8
1.4 Research Question 9
1.5 Significance of the Study 10
1.6 Chapter Layout 11
1.7 Conclusion 13

vi
CHAPTER 2 LITERATURE REVIEW
2.0 Introduction 14
2.1 Literature Review 14
2.1.1 User Satisfaction 14
2.1.2 Technology Acceptance Model (TAM) 16
2.1.2.1 Perceived Ease of Use 17
2.1.2.2 Perceived Usefulness 19
2.1.3 Technology Readiness Index (TRI) 20
2.1.3.1 Optimism 22
2.1.3.2 Innovativeness 25
2.1.3.3 Discomfort 27
2.1.3.4 Insecurity 28
2.2 Review of Theoretical Framework 29
2.2.1 Model 1 29
2.2.2 Model 2 31
2.2.3 Model 3 33
2.2.4 Model 4 35
2.3 Proposed Theoretical/ Conceptual Framework 37
2.4 Hypotheses Development 38
2.4.1 Optimism and Perceived ease of use 39
2.4.2 Innovativeness and Perceived ease of use 40
2.4.3 Discomfort and Perceived ease of use 40
2.4.4 Insecurity and Perceived ease of use 41
2.4.5 Perceived Ease of Use and User satisfaction 42

vii
2.5 Conclusion 43
CHAPTER 3 RESEARCH METHODOLOGY
3.0 Introduction 44
3.1 Research Design 44
3.2 Data Collection Methods 45
3.2.1 Primary Data 45
3.2.2 Secondary Data 46
3.3 Sampling Design 46
3.3.1 Target Population 47
3.3.2 Sampling Frame and Sampling Location 47
3.3.3 Sampling Elements 47
3.3.4 Sampling Technique 48
3.3.5 Sample Size 48
3.4 Research Instrument 50
3.4.1 Questionnaire Design 50
3.4.2 Pilot Study 58
3.5 Constructs Measurement 59
3.5.1 Origin of Construct 60
3.5.2 Scale of Measurement 60
3.5.2.1 Nominal Scale 60
3.5.2.2 Ordinal Scale 61
3.5.2.3 Interval Scale 62
3.6 Data Processing 64
3.6.1 Data Checking 64

viii
3.6.2 Data Editing 64
3.6.3 Data Coding 65
3.6.4 Data Transcribing 67
3.7 Data Analysis 67
3.7.1 Descriptive Analysis 67
3.7.2 Scale Measurement 68
3.7.2.1 Reliability Test 68
3.8 Conclusion 68
CHAPTER 4 RESEARCH RESULT
4.0 Introduction 69
4.1 Preliminary Analysis 69
4.1.1 Data Processing 70
4.1.2 Outlier Detection 71
4.1.3 Normality Analysis 72
4.1.4 Multicollinearity Analysis 73
4.1.5 Common Method Bias 73
4.1.6 Non Responsive Bias 75
4.1.7 Analysis Demographic Profile Respondents 75
4.1.8 Analysis Descriptive Statistics of Study Variables 79
4.2 Rating Outer Model (Measurement Model) 80
4.3 Measurement Model 82
4.3.1 Testing Outer Model (Measurement Model) 82
4.3.2 Testing Inner Model 87
4.4 Structural Model 88

ix
4.4.1 T-Statistic 89
4.5 Conclusion 90
CHAPTER 5 DISCUSSION AND CONCLUSION
5.0 Introduction 91
5.1 Summary of Statistical Analysis 92
5.1.1 Descriptive Analysis 92
5.1.1.1 Summary of Study Variables 92
5.1.1.2 Summary of Demographic Profiles 93
5.2 Discussion of Major Finding 94
5.2.1 Relationship between Optimism and PEOU 94
5.2.2 Relationship between Innovativeness and PEOU 95
5.2.3 Relationship between Discomfort and PEOU 96
5.2.4 Relationship between Insecurity and PEOU 97
5.2.5 Relationship between PEOU and User Satisfaction 97
5.3 Implication of the Study 98
5.3.1 Theoretical Implication 98
5.3.2 Managerial Implications 99
5.4 Limitation of the Study 100
5.4.1 Involvement of the Respondents’ 100
5.4.2 Access to the People 100
5.4.3 Policy and Privacy 101
5.5 Recommendations for Future Research 101
5.6 Conclusion 103

x
References 104
Appendices 118
xi
LIST OF TABLES
Page
Table 3.1: Difference between Original question and Modified question 51
Table 3.2: Sources of Questionnaire’s Questions 60
Table 3.3: Example of Interval Scale (Section B) 62
Table 3.4: Example of Interval Scale (Section C) 63
Table 3.5: Example of Interval Scale (Section D) 63
Table 3.6: Data Coding for Demographic Profile 65
Table 3.7: Example of data coding for Section B, C and D questions 66
Table 4.1: Respondent’s demographic profile for Jabatan Kastam
Malaysia. 76
Table 4.2: Summary of descriptive statistics of the study variables 79
Table 4.3: Reliability of Constructs 83
Table 4.4: Cross Loading 85
Table 4.5: Construct Correlations (Diagonal Elements are Square Roots
of the AVE) 86
Table 4.6: Inner Model Results by size of R-Square 87
Table 4.7: Path Coefficients for Hypothesis Testing between Optimism,
Innovativeness, Insecurity, Discomfort, Perceived ease of use,
and User satisfaction.
89
Table 5.1: Descriptive Statistics 92
Table 5.2: Summary of Hypothesis Results 94

xii
LIST OF FIGURES
Page
Figure 2.1: Conceptual framework of Lin & Hsieh (2007) 29
Figure 2.2: Conceptual framework of Chen & Chen (2009) 31
Figure 2.3: Conceptual framework of Shih & Lee (2014) 33
Figure 2.4: Conceptual framework of Tu, Fang & Lin (2012) 35
Figure 2.5: Proposed Theoretical Framework 37
Figure 3.1: G power result 49
Figure 3.2 Example of Nominal Scale 61
Figure 3.3: Example of Ordinal Scale 61
Figure 4.1: Path coefficients among the Independent variables, and
dependent variable. 81
Figure 4.2: T-value among the dependent variables and independent
variables. 88
xiii
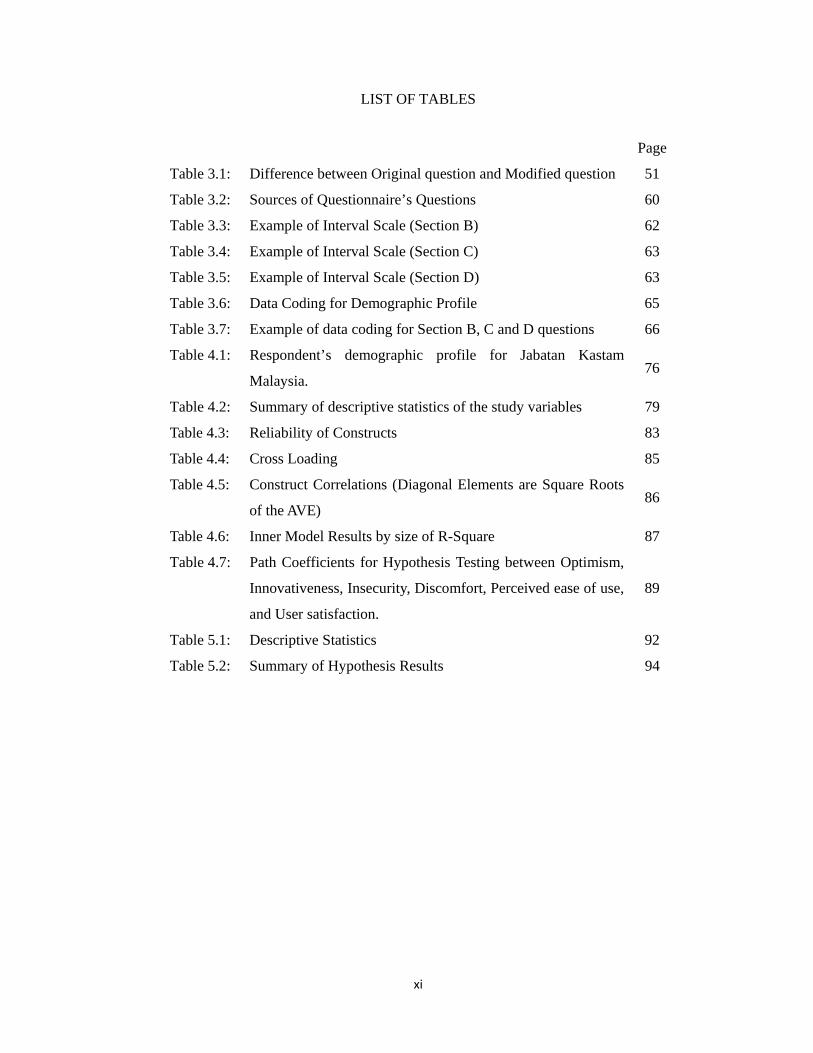
LIST OF ABBREVIATIONS
SMK Sistem Maklumat Kastam
DNT Dagang Net Technologies Sdn Bhd
OGA Other Government Agencies
SST Self-Service Technologies
TR Technology Readiness
TRI Technology Readiness Index
TAM Technology Acceptance Model
MSC Multimedia Super Corridor
MAMPU Malaysian Administrative Modernisation And Management
Planning Unit
PMS II Project Monitoring System
HRMIS Human Resource Management Information System
GOE Generic Office Environment
EP Electronic Procurement
ELX Electronic Labour Exchange
SPSS Statistical Package For Social Sciences
TRA Theory Of Reason Action
TES Technology Enable Services
SSB Self-Service Banking
SEM Structure Equation Model
VIF Variance Inflation Factor

xiv
LIST OF APPENDICES
Appendix A: Result of G power 118
Appendix B: Original and modified questions of Technology readiness
index 118
Appendix C: Original and modified questions of user satisfaction 123
Appendix D: Original and modified questions of perceived ease of use 124
Appendix E: Sources of questionnaire questions 125
Appendix F: Example of Interval Scale question from Section B 126
Appendix G: Example of Interval Scale in Section C 126
Appendix H: Example of Interval Scale in Section D 127
Appendix I: Table of Demographic Profile and Coding 127
Appendix J: Table of Data Coding for Section B, C and D 128
Appendix K: Result of Normality test 129
Appendix L: Total Variance Explained common method bias 134
Appendix M: Frequency table for respondent’s demographic profile for
Royal Malaysian Customs 137
Appendix N: Chart diagram for respondent’s demographic profile from
Royal Malaysian Customs 139
Appendix O: Descriptive Statistics of the study variables 142
Appendix P: Path coefficients among the Independent variables, and
dependent variable. 142
Appendix Q: Reliability of Constructs 143
Appendix R: Cross Loading 144
Appendix S: Construct Correlations 145
Appendix T: Inner Model Results by size of R-Square 145
Appendix U: F-Square 145
Appendix V: T-value among the dependent variables and independent
variables 146
Appendix W: Path Coefficients for Hypothesis Testing 147
Appendix X: Final Year Project Questionnaire 148
Appendix Y: Letter of Permission to Conduct Survey 160

xv
ABSTRAK
Sistem Maklumat Kastam (SMK) juga dikenali sebagai sistem e-permit, dimana
sistem ini pada awalnya dibesarkan dan digunakan di Malaysia secara luas oleh
Jabatan Kastam Malaysia pada tahun 2006. SMK boleh memudahkan kerja
pengimport, pengeksport atau ejen penghantaran. SMK membolehkan mereka
memohon melalui Agensi Kerajaan Lain (OGA) dan mendapat kelulusan melalui
internet sebelum dihantar ke Sistem Maklumat Kastam (SMK) secara elektronik.
Ini adalah untuk pengesahan dan meningkatkan process dengan keberkesanan dan
kecekapan. Tujuan kajian ini adalah menentukan kesediaan teknologi dan
penerimaan Sistem Maklumat Kastam (SMK) di kalangan pegawai kastam di
Jabatan Kastam Malaysia. Analisis data kuantitatif telah dilaksanakan dengan
sasaran populasi tumpuan kepada pegawai adat di Jabatan Kastam Malaysia.
Walau bagaimanapun, jumlah penduduk sasaran Jabatan Kastam Malaysia tidak
tepat dan tidak diketahui dan kemudahan sampling telah digunakan dalam kajian
kita. Terdapat 106 sampel dikumpulkan dari populasi sasaran dan ia cukup baik
untuk menguji model penyelidikan kerana G power mengira 92 sampel saiz.
Smart PLS versi 3.2.6 telah digunakan untuk menguji lima hipotesis. Melalui
kajian ini, para penyelidik telah mendapati bahawa inovatif, ketidakselesaan dan
ketidakamanan menpengaruhi kemudahan SMK dan kepuasan terhadap sistem
SMK tetapi kecuali optimisme. Implikasi manger, kajian penyelidikan masa depan
dan batasan kajian telah dibincangkan dalam setiap bab dengan terperinci.

xvi
ABSTRACT
System Maklumat Kastam (SMK) also known as system e-permit, which this
system was initially brought up and used Malaysia wide by Royal Malaysian
Customs in year 2006. SMK greatly ease the works of importers, exporters or
appointed forwarding agents to apply for the permit as SMK enable them to
apply through Other Government Agencies (OGA) and obtained the approval
online via the internet before transmitted to Sistem Maklumat Kastam (SMK)
electronically for authentication and cross reference purposes to increase the
effectiveness and efficiency of the process. The purposes of this research is
determine the effect of technology readiness and acceptance of Sistem
Maklumat Kastam (SMK) among the customs officers in Royal Malaysian
Customs. A quantitative data analysis was executed with where the target
population were focus on the custom officers in Royal Malaysian Customs.
However, the exact amount of the target population for Royal Malaysian
Customs is unknown, convenience sampling was used. There were 106
samples was collected from the target population and it is good enough to test
the research model because the G power software calculated 92 samples size.
Smart PLS version 3.2.6 was used to test five hypothesis. Through this study,
the researchers found that innovativeness, discomfort and insecurity affected
the custom officers’ perceived ease of use and satisfaction towards the SMK
systems except optimism. Manger implication, future research study and the
limitation of the study was discuss in detail.

A STUDY ON TECHNOLOGY READINESS AND ACCEPTANCE OF SISTEM MAKLUMAT KASTAM (SMK) IN JABATAN KASTAM MALAYSIA
1
CHAPTER 1: INTRODUCTION
1.0 Introduction
This chapter begins with the explanation of the term at the same time identifies the
issues that the researchers need to be considered in every part. This research aims
to study or identify the effect of technology readiness and number of acceptance of
Sistem Maklumat Kastam (SMK) as a tool to support the agency among custom
officers only. First and foremost, in this chapter also, the researchers will start off
by having a detail explanation of SMK background research which follows by the
theory of Technology Readiness Index (TRI) and Technology Acceptance Model
(TAM). Next, the problem statement will focus on the effect of technology
readiness and acceptance of SMK in Jabatan Kastam Malaysia. Furthermore, the
research objective will be determined along with the research questions which will
be stated according to the objective. In addition, relevant hypotheses of the study
also will be constructed in this chapter. The significance in this study is discuss
about the importance and contribution of the study to the custom department
according to the chapter arrangement and provide a brief outline for each chapter
of the research. Next, the last part is a summary or conclusion of the whole chapter
1 will be provided as the last part of the chapter.
1.1 Research Background
The latest updates for the Sistem Maklumat Kastam (SMK) is on 19 June 2017. The
new updates are about cancelling the goods and services tax (GST) on over 60 food

A STUDY ON TECHNOLOGY READINESS AND ACCEPTANCE OF SISTEM MAKLUMAT KASTAM (SMK) IN JABATAN KASTAM MALAYSIA
2
items that will be enforced on 1 July 2017. SMK is a custom operating system.
Since 1993, it used to deals with custom that related to the transactions. SMK was
not fully automated therefore, the system still require some forms of manual
processes by the user. SMK also known as system e-permit, which this system was
initially brought up and used Malaysia wide by Jabatan Kastam Malaysia in year
2006. It also was a web-based value-added service that provided by Dagang Net
Technologies Sdn Bhd (DNT). SMK greatly ease the works of importers, exporters
or appointed forwarding agents to apply for the permit as SMK enable them to apply
through Other Government Agencies (OGA) and obtained the approval online via
the internet before transmitted to Sistem Maklumat Kastam (SMK) electronically
for authentication and cross reference purposes to increase the effectiveness and
efficiency of the process.
Based on previous studies, Parasuraman (2000) and Kuang, Chung, and Chen (2013)
had determine or identified the factors that affects the choice of customers to switch
to SST (Self-Service Technologies) and other technology based services which
depended on the marketing perceptions. Several factors that complied with the
acceptance of new technologies or services which eventually affected through
technology interaction had been identified. TRI also mentions to people’s who are
tendency to accept and use the new technologies to accomplished goals in
workplace or in home. (Parasuraman, 2000; Kuang et al., 2013). TRI construct can
be viewed as the overview of the mind which resulted from a gestalt of mental
enablers and inhibitors that collectively determine a person's predisposition to use
new technology (Lin, Shih & Sher, 2007). According to Lin and Hsieh’s study
(2007), it is important for the firms in considering the use of SST to handle TR
customers as it was showed in their study when TRI of consumers is higher means
the satisfaction and behavioural intentions of that particular customer when using
the self-service technology is higher.
Besides, TRI composed of four dimensions which are optimism, innovativeness,
discomfort and insecurity. According Tsikriktsis study’s (2004), the four
dimensions of TRI were explained as below:

A STUDY ON TECHNOLOGY READINESS AND ACCEPTANCE OF SISTEM MAKLUMAT KASTAM (SMK) IN JABATAN KASTAM MALAYSIA
3
Optimism: defined people have a positive view on technology. People
believe the technologies can increased flexibility, control, and efficiency in
their lives.
Innovativeness: defined as the propensity to be a technology pioneer and a
thought leader. It also measures the range of an individual believes who be
the first to try the new technology-based products or services may
considered as opinion leader on technology-related issues by others.
Discomfort: defined as perceived lack of control over the technology and
speechless feeling from it. This represented the extent to which an individual
having a general paranoia about a particular technology based products and
services where they deeply believed that it tend to be exclusionary rather
than inclusive to everyone.
Insecurity: defined as feeling of disbelief towards technology and
uncertainty about its ability to work properly. It also related to discomfort.
This dimension more focuses on the specific characteristics of technology
based transactions, rather than discomfort with technology.
The first two dimensions which are optimism and innovativeness are more concern
on positive view of using technology. Optimism refers to a belief that technology
offers people to improve the flexibility, control and efficiency in their lives whereas,
innovativeness defined as propensity to be a technology pioneer and a thought
leader. (Parasuraman, 2000; Kuang et al., 2013). Both of this dimensions were
considered as the lead of TR.

A STUDY ON TECHNOLOGY READINESS AND ACCEPTANCE OF SISTEM MAKLUMAT KASTAM (SMK) IN JABATAN KASTAM MALAYSIA
4
On the other hand, the last two dimensions which are discomfort and insecurity
refer to as inhibitors of TR. Discomfort defined as the observed lack of control over
the technology. This make people feel of being speechless. Insecurity defined as
feeling of distrust towards technology and scepticism about its ability to work
properly. (Parasuraman, 2000; Kuang et al., 2013). Based on their scores on the
customers TR-scale, they may be classified to as one of the five segments. Users
with higher score in confidence and innovation dimensions may be the initial users
which belong to the segment of either Explorers or Pioneers. (Parasuraman & Colby,
2001; Erdogmus & Esen, 2011). Explorers refer to those who are highly motivated
and confident in their ability in technology related works. This segment mostly
consists of younger male which have much more opinion and educated than the
other two segments. Pioneer was the second segment which exhibit low resistance
level towards the technology. Users in these segments tends to be both male or
female which possessed similar education level and tend to be more relatively to
the remaining segments (Parasuraman & Colby, 2001; Erdogmus & Esen, 2011).
For consumers who fall under the others two TR dimensions which are discomfort
and insecurity mostly categorized as Paranoids and out-segment. Paranoids refer to
those who trusted and have confidence in the technology however, do not have the
tendency to innovate. This segment have more tendency towards individual who
are slightly older, female, individual who are less affordable and lower educational
level. For example, baby boomers were the individuals who are less likely to use or
accept technological changes. So, they were the opposite of Explorers by having
higher discomfort and insecurity level.
Even the updates is important, in Parasuraman and Colby (2015) mentioned that
original TRI used 36 items scale to indicate the people propensity. It also uses the
cutting-edge technologies. the past researchers also does two part of research to
update and reorganise the TRI. From the articles, the researchers can see that the
past researchers described the multiple research stages and use 16 item scale to do
analyses for produced TRI 2.0. In addition, the past researchers compared the TRI
2.0 with the original TRI in terms of structure, content and psychometric properties.

A STUDY ON TECHNOLOGY READINESS AND ACCEPTANCE OF SISTEM MAKLUMAT KASTAM (SMK) IN JABATAN KASTAM MALAYSIA
5
The last part of this articles is saying about validity, usefulness and reliability of
TRI 2.0 to use as a customer segmentation tool.
Next, according to Priyanka (2012), Technology Acceptance Model (TAM) has
been developed by Davis. TAM is one of the most popular research methods for
forecast use. TAM also is an acceptance of information systems and technology for
individual users. TAM help user understand and explain behaviour in an
information system. The two factors of TAM is perceived usefulness and perceived
of use. This two factors is most important to determine the actual system use and it
influenced by external variables. The main external factors are social, cultural and
political. For example, social factors are related skill and language. For political
factors are related to technology in politics and crisis. Culture factors are related to
the country culture and religion.
The objective of this study is to discover the perception and function of SMK by
custom officers in Jabatan Kastam Malaysia. The results of this study indicated that
user willingness of custom officers to accept the new technology as a tool to support
or catch up on their works or tasks.

A STUDY ON TECHNOLOGY READINESS AND ACCEPTANCE OF SISTEM MAKLUMAT KASTAM (SMK) IN JABATAN KASTAM MALAYSIA
6
1.2 Problem Statement
According to Mazni (2002), computers were first introduced in Malaysia in the
sixties. On 1965, National Electricity Board became the first public sector that used
computer systems along with Inland Revenue Department which process the
statistical information in the same year. The same system had been introduced and
used by Examination Syndicate, Ministry of Education and the Statistic Department.
Due to the increases awareness of computer as a tool for data processing, more and
more organizations and institutions started to use computer as a way to do record
keeping.
At the same time, although Malaysia got 11th place in the e-Government Conference
2009 however, it still lags behind as compared with other developed countries as
according to a survey done by Brookings Institution in United States (Malaysia
ranks 11th in e-govt., 2009). In 1996, implementation of e-Government was
introduced by Multimedia Super Corridor (MSC) and in the following year,
Malaysia government successfully launched the e-Government which refers to as
Electronic Government with the purpose to help country regenerate itself and lead
the country into the Information Age. E-Government enhances the organizations’
convenience, accessibility and quality of interactions with the public greatly. E-
Government can improves the information processes and improved the speed and
quality of the government services. This allowed government to react to the needs
and wants of its citizens in Malaysia more effectively and efficiently.
In the Malaysian context, Electronic Government refers to ‘a linked between
government agency multimedia network in Putrajaya (the new administrative center
of Malaysia) with the centres of government across the country in order to facilitate
the environment of government and provide efficient services to businesses and
citizens’ (Pemodenan Tadbiran dan Unit Perancangan Pengurusan (MAMPU),

A STUDY ON TECHNOLOGY READINESS AND ACCEPTANCE OF SISTEM MAKLUMAT KASTAM (SMK) IN JABATAN KASTAM MALAYSIA
7
1998). There were 7 Electronic Government Flagship Application projects listed as
below and most of the projects were monitored by the Malaysian Administrative
Modernisation and Management Planning Unit (MAMPU).
Project Monitoring System (PMS II)
Human Resource Management Information System (HRMIS)
Generic Office Environment (GOE)
Electronic Procurement (EP) (www.eperolehan.com.my)
Electronic Services Directory (E-Services) (www.eservices.com.my)
Electronic Labour Exchange (ELX) (www.elx.gov.my)
E-Syariah (www.esyariah.gov.my)
Recently on 2016, Port Klang Authority General Manager, Dato’ Capt. David
Padman was deeply concerned with the issue of SMK malfunction in Westport, Port
Klang. This causes a slight impact on the custom’ import process speed as the
movements or flows of the works were highly congested. The issue was caused by
internal system failure. Containers were checked and released manually by the
officers as a solution to reduce the congestion. The issue was beyond the control
and expectation of the Port Klang Authority and Westports’s terminal operators.
Thus, Dato' Capt. David views this issues as a critical condition where it can affect
the efficiency, growth and image of the Port Klang’s as not only the National Port
but also as a renowned world-class container port if the issue did not solved as early
as possible. Jabatan Kastam Malaysia had been working out to resolve the situation
by implemented a temporary alternative solution in the place of manual cargo
clearance (Port Klang Authority Concerned Over Custom Information System
Breakdowns - Maritime News Update @ BERNAMA.com, 2016). Because of this
issues, the customs keep on updates the SMK and the latest updates for the Sistem
Maklumat Kastam (SMK) which is about the cancelling the goods and services tax
(GST) on over 60 food items that will be enforced on 1 July 2017.

A STUDY ON TECHNOLOGY READINESS AND ACCEPTANCE OF SISTEM MAKLUMAT KASTAM (SMK) IN JABATAN KASTAM MALAYSIA
8
The objective of this study is to explore the perception and function of SMK by
custom officers in Jabatan Kastam Malaysia. The results of this study shown the
custom officers user willingness to accept the new technology as a tool to support
the custom officer, delivery agent and others government agencies.
1.3 Research Objectives
The purposes of this research project are stated in term of general objective and
specific objective which are listed as below:
1.3.1General Objective
To determine the effect of technology readiness and acceptance of Sistem
Maklumat Kastam (SMK) among the custom officers in Jabatan Kastam
Malaysia.
1.3.2 Specific Objectives
1. To determine whether there is a positive relationship between optimism and
perceived ease of use of SMK among the custom officers of Jabatan Kastam
Malaysia.
2. To determine whether there is a positive relationship between
innovativeness and perceived ease of use of SMK among the custom
officers of Jabatan Kastam Malaysia.

A STUDY ON TECHNOLOGY READINESS AND ACCEPTANCE OF SISTEM MAKLUMAT KASTAM (SMK) IN JABATAN KASTAM MALAYSIA
9
3. To determine whether there is a negative relationship between discomfort
and perceived ease of use of SMK among the custom officers of Jabatan
Kastam Malaysia.
4. To determine whether there is a negative relationship between insecurity
and perceived ease of use of SMK among the custom officers of Jabatan
Kastam Malaysia.
5. To determine whether there is a positive relationship between perceived
ease of use of SMK and user’s satisfaction of using SMK among the custom
officers of Jabatan Kastam Malaysia.
1.4 Research Question
The purpose of this research project is to investigate on the following research
questions which are:
1. Does optimism has a positive relationship with perceived ease of use of
SMK among the custom officers in Jabatan Kastam Malaysia?
2. Does innovativeness has a positive relationship with perceived ease of use
of SMK among the custom officers in Jabatan Kastam Malaysia?
3. Does discomfort has a negative relationship with perceived ease of use of
SMK among the custom officers in Jabatan Kastam Malaysia?

A STUDY ON TECHNOLOGY READINESS AND ACCEPTANCE OF SISTEM MAKLUMAT KASTAM (SMK) IN JABATAN KASTAM MALAYSIA
10
4. Does insecurity has a negative relationship with perceived ease of use of
SMK among the custom officers in Jabatan Kastam Malaysia?
5. Does perceived ease of use has a positive relationship with user’s
satisfaction of using SMK among the custom officers in Jabatan Kastam
Malaysia?
1.5 Significant of the Study
The significance of this study is based on the past literature or research that the
researchers had gone through and come out with an important assumption.
According to Yalcin, Kahraman and Yilmaz’s study (2011), they pointed out that
the custom officer’s optimism view towards the SMK technology was one of the
important variables that affect the acceptance and readiness of the government
officer to use the SMK technology in the working environment. Attitude and the
optimism towards the SMK technology are very important because this may
directly affect the result of acceptance and readiness of the custom officer in using
the SKM technology in the work place.
The perceive effectiveness by the custom officers themselves had been the key role
in various aspects which related to the work environment. The effectiveness of
custom officer with respect to the use and integration of technology in the
workplace will improve the effectiveness and confidence of custom officers when
dealing with customer issues, especially in the global environment where the
customers themselves already involved in the use of new technology. Through the
technology integration in the government sector, the self-efficiency and optimism
towards the integration of the new technology will be one of the important factors
that assist the government sector to improve their services quality and effectively
improved their work productivity. Not only that but by having a positive attitude in
accepting new technology also may effectively help the custom officer in using a

A STUDY ON TECHNOLOGY READINESS AND ACCEPTANCE OF SISTEM MAKLUMAT KASTAM (SMK) IN JABATAN KASTAM MALAYSIA
11
particular new technology. At the same time of being an effective individual, it also
allowed the officers to be more proficient in using the SMK in their workplace. Last
but not least, custom officers can learn or catch up to the new updates (cancelling
the new GST standard 6% for more than 60 food items) to implement the new
updates and skills on their works.
1.6 Chapter Layout
This research consist of total 5 chapters, which are the Introduction, Literature
Review, Research Methodology, Research Results, Discussion and Conclusion on
the study of the effect of technology readiness and acceptance of Sistem Maklumat
Kastam (SMK) in Jabatan Kastam Malaysia, as shown below:
Chapter 1 Introduction
In Chapter 1, the background introduction of this research project will be contained
inside which give reader an overview of the purpose of this study and clearly
identify the research problem by providing detail explanation on the research
problem and importance of this research for particular industry. In this chapter also,
clear objective will be stated along with the research question that will be solve
during the research project and clearly listed down all the hypotheses that will be
tested in this research.
Chapter 2 Literature Review
In chapter 2, will be the literature review for the research project. In this chapter,
journal and other secondary sources of data that the researchers had study during

A STUDY ON TECHNOLOGY READINESS AND ACCEPTANCE OF SISTEM MAKLUMAT KASTAM (SMK) IN JABATAN KASTAM MALAYSIA
12
the whole process of this research project will be provided as this also provide us
the information and documentation of significant finding which the researchers had
found from the past completed studies or research. At the same time, this chapter
also helps us to identify all the important dependent and independent variables
which related to our research problem. Besides, relevant theoretical models also
will be studied in order to develop the proposed theoretical/conceptual framework
which indicate the finding of this research and hypothesize the relationship between
the independent variables and dependent variable.
Chapter 3 Research Methodology
In chapter 3, will be the research methodology that the researchers had carried out
in the research project. In this chapter, the researchers will clearly mention on how
we will construct our research and determine whether it will be qualitative or
quantitative. Other than that, the researchers also will mention on what type of
method that they will be use in this research project in order to collect the primary
and secondary data for the constructed hypotheses. Besides, the sampling design,
research instrument, constructs measurement, data processing and data analysis of
this research project will be pointed out in order to provide a clear understand on
how the researchers will carried out the data collection process.
Chapter 4 Research Result
In chapter 4, research result will have a clear explanation on the result that the
researchers got after completed the previous chapters. At the same time, the
researchers also will use the Smart PLS 3.2.6 and SPSS 22 to run data. The
researchers also will provide any necessary tables, chart and also analysis on the
respondent demographic profile in the descriptive analysis in this chapter. Besides,
result of scale measurement and inferential analysis of this research also will be
provided in this chapter in order for us to justify the reliability of the analysis and

A STUDY ON TECHNOLOGY READINESS AND ACCEPTANCE OF SISTEM MAKLUMAT KASTAM (SMK) IN JABATAN KASTAM MALAYSIA
13
examine the relationship of the variables that had been identified in the research
project.
Chapter 5 Discussion and Conclusion
In chapter 5, summary of the previous chapter and discussion on the related finding
that we had found will be provided. In addition, limitation of the study that we had
found during the progress of the research along with the recommendation for the
research project also will be provided in order to make it easier for future
researchers who may research on this topic.
1.7 Conclusion
In conclusion for this chapter, the researchers had provide few hypotheses regarding
the relationship of optimism, innovativeness, discomfort and insecurity towards
user’s satisfaction among the custom officer Jabatan Kastam Malaysia. In this
chapter, we also had examined on the research background of the Jabatan Kastam
Malaysia, the Technology Readiness Index (TRI) and Technology Acceptance
Model (TAM), problem statement of the research as well as the formation of the
research objective and the research hypotheses. So, in the next chapter the
researchers will continue on the literature review which will discuss more on the
factors that affect the technology readiness and acceptance of SMK in Jabatan
Kastam Malaysia.

A STUDY ON TECHNOLOGY READINESS AND ACCEPTANCE OF SISTEM MAKLUMAT KASTAM (SMK) IN JABATAN KASTAM MALAYSIA
14
CHAPTER 2: LITERATURE REVIEW
2.0 Introduction
There will be 3 main sections that will be outlined in this chapter. In the first part
or sections of the literature review, the definition terms and dimensions of user
satisfaction, technology readiness index (TRI) and technology acceptance model
(TAM) will be illustrated. For the following part, relationship between the
technology readiness index (TRI) dimensions such as optimism, innovativeness,
insecurity and discomfort, perceived ease of use which is one of the technology
acceptance model (TAM) dimension and user satisfaction will be evaluated. In
order to further investigate the research objectives, this chapter also will provide the
independent variables and dependent variables in the form of conceptual framework.
Lastly, after the relationship between the independent variables and dependent
variable had been established, hypothesis of the study will be formulated.
2.1 Literature Review
2.1.1 User Satisfaction
In the past, user satisfaction had been widely used and cited as a dependent
variable to measure or evaluate the success or failure of a particular system.
According to Galletta and Lederer’s study (1989), researchers in the past
had already investigated the relationship between fulfillment of user’s
requirement, information, website design and support provided to end users
as contributor to user satisfaction. In a given situation, user satisfaction refer
to a sum of one’s feelings or attitudes towards different factors that affect
the situation (Bailey & Pearson, 1983).

A STUDY ON TECHNOLOGY READINESS AND ACCEPTANCE OF SISTEM MAKLUMAT KASTAM (SMK) IN JABATAN KASTAM MALAYSIA
15
User satisfaction also known as an emotional reaction of the user after the
user or consumer had experienced a technology product or services (Chen,
2011). The research generally agreed in Igerhseim (1976); Lucas (1978);
DeLone and McLean (1992); Zeithaml (2002); and Sharma, Shakya and
Kharel (2014) studies, where user satisfaction was not only a way used by
user to assess the view towards a system but it also represents the user’s
affective attitude towards the system on whether it had fulfilled or met with
their expectation and need. This was further supported in Pinar, Mehtap and
Erzengin’s study (2012), where user satisfaction was generally refer to as
individual or user’s pleasure get from the usage of information technologies.
Therefore, user satisfaction also defined as the user reinforce satisfaction
when the user believe that the information system fulfilled their requirement
or need (Ives, Olson & Baroudi, 1983). Hence, in combination with the
actual use, user satisfaction will be the main principal in evaluating the
success of an information system.
Since 1980s until now, user satisfaction had been used as an evaluation
system to measure the success or failure of an information system. However,
measuring the success or failure of the system is a difficult task as it required
to fulfill two needs which are summative evaluation for the researcher and
formative evaluation for the practitioner (Gallette & Lederer, 1989).
Summative evaluation refer to the investigation done by researcher in
identifying the relationship between user satisfaction with other variables in
order to provide a better understanding of the environment while formative
evaluation refer to the feedback mechanism used to uncover the user
perception of strength and weakness in order to make more improvements
(Gallette & Lederer, 1989). In addition to Gallette and Lederer’s study (1989)
where measuring user’s satisfaction towards an information system not only
assist in detecting the strength and weakness of a system, but it also
measures the user’s point of view such as the perceived ease of use towards
the information system rather than the technical quality of the system
(DeLone & McLean, 1992). This was agreed in Sharma, Shakya and

A STUDY ON TECHNOLOGY READINESS AND ACCEPTANCE OF SISTEM MAKLUMAT KASTAM (SMK) IN JABATAN KASTAM MALAYSIA
16
Kharel’s study (2014) where they had indicated that satisfied users are more
likely to had higher usage of services which possessed strong interaction
and regularly recommend it to their family and friends.
In order to measure the user satisfaction towards a particular information
system, numbers of different measuring instruments had been developed by
the past researchers and most of the instruments were developed through
existing literature, questionnaire, interviews or combination of the methods
(Shirani, Aiken & Reithel, 1994). For example, Gallagher (1974) used both
questionnaire and interview to identify the instrument, Jenkins and Ricketts
(1979) developed 20 items of user satisfaction instrument through the
existing literature review and interviews, Larcker and Lessig (1980)
developed two three-item scales that perceived usefulness of an information
provided by the system through interviews, Bailey and Pearson (1983)
recognized 39 factors that affect user satisfaction through existing articles,
questionnaires and interview and Ives et al. (1983) instrument which
developed through questionnaire and existing literature (Ives et al., 1983;
Doll & Torkzadeh, 1988; Galletta & Lederer, 1989; Shirani et al., 1994;
Dastgir & Mortezaie, 2012).
2.1.2 Technology Acceptance Model
Technology acceptance model (TAM) which developed by Davis (1989)
was one of the widely used research models in predicting the acceptance
level and use of technology and information systems by an individual users
(Yousafzai, Foxall & Pallister, 2007; Park, 2009; Suki & Ramayah, 2010;
Surendran, 2012; Fathema, Shannon & Ross, 2015). The model was adapted
from Ajzen and Fishbein’s Theory of Reason Action (TRA) in order to
explain the relationship between user’s internal belief such as perceived
usefulness and ease of use, attitude and technology usage behavior (Davis,
1989; Yousafzai et al., 2007). Although technology acceptance model tend
to be less general than theory of reason action, it can be apply to any type of

A STUDY ON TECHNOLOGY READINESS AND ACCEPTANCE OF SISTEM MAKLUMAT KASTAM (SMK) IN JABATAN KASTAM MALAYSIA
17
technology to measure the user’s acceptance level (Suki & Ramayah, 2010).
This is because, TRA is a potential theoretical base for research or study on
the determinants of user’s behavior as suggested by information system
investigators. Hence, the adaptation of technology acceptance model from
TRA had become a powerful model which use to explain individual usage
behavior towards technology (Yousafzai et al., 2007).
According to Davis’s (1989) and Fathema et al.’s (2015) studies, technology
acceptance model consisted of two fundamental factors of user’s technology
acceptance which are perceived ease of use and perceived usefulness along
with other three constructs namely attitude toward using, actual use and
behavioral intention to use. It was further explained in Surendran’s (2012)
study, where he stated that both perceived ease of use and perceived
usefulness were influenced by external variables such as cultural factors,
social factors and political factors. Various studies had been conducted in
the past by past researchers on technology acceptance model where it led to
the changes from the original proposed model (Surendran, 2012). This was
already mentioned in Park’s (2009) and Fathema et al.’s (2015) study where
as a model which explain how an individual adopt and use technology,
variables of technology acceptance model had been modify and examined
frequently by many researchers.
2.1.2.1 Perceived Ease of Use
According to Davis’s (1989); and Koivisto, Makkonen, Frank and
Riekkinen’s (2016) studies, perceived ease of use was defined to as the
degree to which an individual believed that he or she by using a particular
technology based product or services would be free of effort. This definition
had been adopted in many previous researches or studies because perceived
ease of use had a strong influences on individual’s intention to technology
acceptance and satisfaction (Davis, 1989; Maslin Masrom, 2007; Suki &
Ramayah, 2010; Tu, Fang & Lin, 2012; Sibona & Choi, 2012; Juniwati,

A STUDY ON TECHNOLOGY READINESS AND ACCEPTANCE OF SISTEM MAKLUMAT KASTAM (SMK) IN JABATAN KASTAM MALAYSIA
18
2014; Shih & Lee, 2014; Blut, Wang & Schoefer, 2016). To put it in a simple
explanation, perceived ease of use refer to the perception of an individual
which they believed that it was easy for them to interact with the system or
technology (Chan & Hu, 2001).
As another major determinant of attitude which was used in the TAM model,
perceived ease of use was a belief that believed to ties to the individual’s
assessment of mental effort which involved when using a system (Davis,
1989). This was agreed in Venkatesh, Morris, Davis and Davis’s study
(2003) and Bavarsad and Mennatyan’s study (2013), where they stated that
perceived ease of use refer to an internal feeling of a person which believed
that the use of new technology or system is not complicated and only
required little mental effort in order to use it. Individual perceived ease of
use of a particular technology consist of few category such as service quality,
visual factors, simplicity, innovativeness and speed which will directly
affect an individual’s overall satisfaction (Sharma et al., 2014).
In the terms of technical language, perceived ease of use also known as user
friendliness of a particular system (Pinar et al., 2012). This means that an
individual does not required any additional effort in both the data entry and
finding the data in the system. This was explained in past research where
the perceived ease of use of the technology make it easier for an individual
employee to accept any new technology and lead to having positive effect
on user’s satisfaction (Mahmood, Burn, Gemoets & Jacquez, 2000). This
was further supported in Bavarsad and Mennatyan’s study (2013), where
perceived ease of use was an effective factor in user satisfaction in e-service.
For instead, individual or user will always perceived a particular technology
system or services to be difficult when the system is hard to learn and use.
On the other hand, if the system is easy to learn and use, it will directly
increase an individual’s satisfaction (Sharma et al., 2014).
Based from the literature on information technology, perceived ease of use
refer to how an individual adapt their behavior according to the new

A STUDY ON TECHNOLOGY READINESS AND ACCEPTANCE OF SISTEM MAKLUMAT KASTAM (SMK) IN JABATAN KASTAM MALAYSIA
19
technology when they perceived the technology to be easy to use and learn
(Muslim Amin, Rezaei & Abolghasemi, 2014). Besides that, although both
perceived ease of use and perceived usefulness were considered to as
distinct factors that affect or influenced an individual’s attitude towards new
technology, perceived ease of use was found to had a more positive
influences on individual’s intention and satisfaction as compared to
perceived usefulness (Suki & Ramayah, 2010). This is because, numerous
studies or researches had been done in the past where perceived ease of use
had been hypothesized to influence an individual or user’s perceived
usefulness towards a technology (Maslin Masrom, 2007).
2.1.2.2 Perceived Usefulness
Perceived usefulness is known as the degree to which a particular user’s
perceived that by using a specific system or technology, he or she able to
increases their job performance (Davis, 1989; Yousafzai et al., 2007;
Jahangir & Begum, 2008; Fathema et al., 2015; Blut, Wang & Schoefer,
2016; Koivisto et al., 2016). This was further explained in Davis’s (1989)
and Suki and Ramayah’s (2010) studies, where perceived usefulness was
important in providing analytical insight to the researchers on how an
individual’s attitude and intention towards technology will be influenced,
how perceived usefulness affect directly on the user’s intention to use and
influences via attitude. To put it in a simple way, perceived usefulness refer
to the user’s perceptions on the experience in using a particular technology
(Davis, 1989; Jahangir & Begum, 2008).
Based on the research of acceptance of new technology context, perceived
usefulness is known as an individual or user perceptions on online shopping
performance through internet (Juniwati, 2014). This justify the statement in
Yousafzai et al.’s (2007) study, where perceived usefulness was initially
defined in the context of job performance however, later it will be used in
non-organizational settings such as internet shopping. Furthermore,

A STUDY ON TECHNOLOGY READINESS AND ACCEPTANCE OF SISTEM MAKLUMAT KASTAM (SMK) IN JABATAN KASTAM MALAYSIA
20
perceived usefulness also is an important factor in determining product and
service innovative adaptation (Jahangir & Begum, 2008).
In addition, although both perceived usefulness and perceived ease of
control were an important determinants in predicting individual attitudes
towards a system, perceived usefulness tend to be more influences than
perceived ease of control (Davis 1989; Elkaseh, Wong & Fung, 2016).
However, this was argued by many other researchers where perceived ease
of use was the one who will influenced perceived usefulness. This is because,
whenever an individual or user perceived a technology to be easy to use, he
or she will directly perceived that particular technology to be useful.
Therefore, perceived usefulness was influenced by perceived ease of use as
it had a stronger influences on technology acceptance model (Yousafzai et
al., 2007; Jahangir & Begum, 2008; Juniwati 2014; Fathema et al., 2015).
However in this research, perceived usefulness is not chosen or necessary
because the use of SMK system is compulsory for all custom officers even
if they do not want to use it and the usefulness of the system had already
been determined by the government itself. Therefore, the researchers
decided to not focus on individual’s perceived usefulness in this study.
2.1.3 Technology Readiness Index (TRI)
With the emerging and growth of more new technologies in the society, it
is important for the business to identify or explore the willingness and
satisfaction of people in using these new technologies (Meuter, Ostrom,
Bitner & Roundtree, 2003). According to Chen and Chen’s study (2009),
many works or research had been studied by past researchers on user
reactions towards the acceptance of technology based systems as a part of
their work and home life. Previous literatures shown that users often accept
the use of technology however, users also exhibited the feeling of anxiety
when they implement or used the technology (Lin & Hsieh, 2006). Although
the implementation of technology provide more flexibility and reduces time
A STUDY ON TECHNOLOGY READINESS AND ACCEPTANCE OF SISTEM MAKLUMAT KASTAM (SMK) IN JABATAN KASTAM MALAYSIA
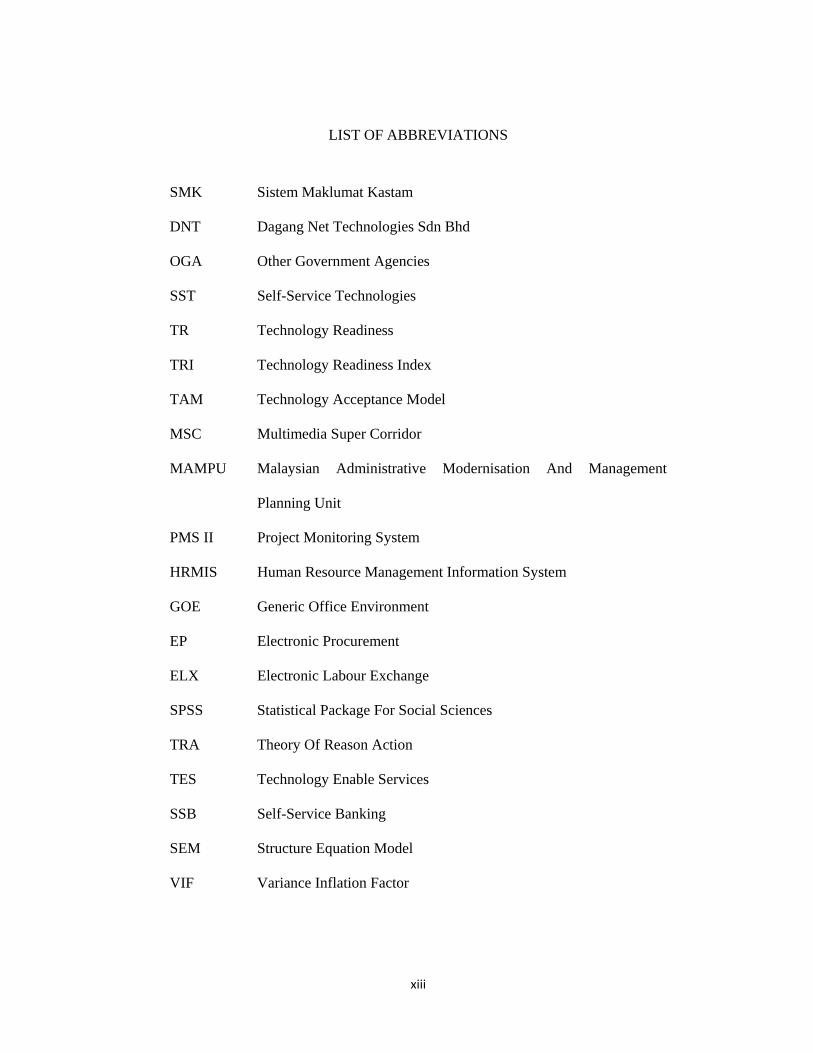
21
consumption for majority of the user, however, it is still unavoidable that
some of the users were feeling uncomfortable when deal with technology
which result in frustration (Lin & Hsieh, 2006). This is because, the
psychographic characteristics such as Technology Readiness Index (TRI) in
every individual is different (Parasuraman, 2000; Parasuraman & Colby,
2015). Therefore, it might be both difficult and easy for different people in
accepting a new technology (Chen, 2011).
Based on the study of past researchers, the term Technology Readiness
Index (TRI) refers to people’s propensity to use and embrace new
technologies for the purpose of accomplishing goals in home and work life
(Parasuraman, 2000; Parasurama & Colby, 2015). In order to understand the
acceptance level of an individual towards a new technology, TRI construct
can be used to measure the acceptance level (Parasuraman, 2000; Shin &
Lee, 2014). The construct can be viewed as an overall state of mind of an
individual which result from a gestalt of mental enablers and inhibitors that
collectively determine a particular person’s tendency towards the use and
acceptance of new technology (Parasuraman, 2000; Lin & Hsieh, 2006; Lai,
2007).
Technology Readiness Index (TRI) also known as the personality trait
which used to measure an individual orientation towards technologies and
as a direct influencer of individual satisfaction (Wang, So & Sparks, 2016).
Hence, technology readiness can be seen as an individual psychological
status which consists of two different kinds of forces in psychology that
affect the willingness of a particular person to use the technology. Such
forces are enablers and inhibitors as according to past literatures done by
past researchers (Chen, 2011). Furthermore, technology readiness is a
combination of both positive and negative technology related beliefs which
believed to be vary between individuals. Mutually, these beliefs will
influence an individual’s perception and tendency to interact with a
particular new technology (Godoe & Johansen, 2012). As a
multidimensional construct, technology readiness able to capture the mental

A STUDY ON TECHNOLOGY READINESS AND ACCEPTANCE OF SISTEM MAKLUMAT KASTAM (SMK) IN JABATAN KASTAM MALAYSIA
22
readiness and acceptance of an individual for new technological innovations
(Wang et al., 2016). This was supported by Nik Abdullah’s (2012); and
Hallikainen and Laukkanen’s (2016) empirical studies where he suggested
that every individual consists of two technology beliefs which are both
positive and negative belief that can be categorized into four dimensions of
technology readiness proposed by Parasuraman (2000).
In Chen and Chen’s (2009); and Stock and Grob’s (2016) studies, they
explained that the four dimensions of technology readiness of the users were
separated according to their dominant or prevailing personalities and traits.
The dimensions were separated into half with two factors being the
motivators or enablers of new technology whereas, the other two being the
inhibitors (Mendez, Parasuraman & Papadopoulos, 2017). The four
dimensions were referred to as optimism, innovativeness, discomfort and
insecurity. The first two dimensions which are optimism and innovativeness
were known as the motivators or enablers of technology readiness whereas,
the other two dimensions which known as discomfort and insecurity will be
the inhibitors (Masood, Mohaidat & Rashedi, 2013; Nugroho, 2015;
Koivisto et al., 2016). Past literatures had found out that optimism and
innovativeness had a positive relationship with the user readiness whereas
discomfort and insecurity had the negative relation (Nik Abdullah, 2012).
Thus, technology readiness cannot be ignored when evaluate an individual’s
acceptance of new technology, as it plays a vital role in causing the
perceptions and behavior of that particular individual.
2.1.3.1 Optimism
According to Tiger’s (1979) studies, optimism was defined as an attitude or
mood which associated with an expectation of the future social or material,
where one was regarded as socially desirable to his or her advantage or for
his or her own pleasure. This was further explained where optimism was
considered to be the general expectancy of positive future which reflects the

A STUDY ON TECHNOLOGY READINESS AND ACCEPTANCE OF SISTEM MAKLUMAT KASTAM (SMK) IN JABATAN KASTAM MALAYSIA
23
overall positive appraisal of the future (Santilli, Marcionetti, Rochat,
Rossier & Nota, 2016). This is because, optimism as the main variable of
positive psychology was effective in increasing individual satisfaction and
life quality which eventually lead to having hopeful views (Luthans,
Lebsack & Lebsack, 2008; Homaei, Bozorgi, Ghahfarokhi & Hosseinpour,
2016).
Optimism also was defined as an individual explanatory style where
optimist tend to invoke external, specific causes and unstable whereas,
pessimists tend to invoke internal, general causes and stable as stated in
Buchanan & Seligman’s (1995); Leung, Moneta & Chang’s (2005); Luthans
et al.’s (2008) studies. This was supported by previous research done by
Yuan and Wang (2016) where optimism was defined as the tendency of
people who attribute specific positive incidents to permanent and internal
factors whereas, attribute negative incidents to temporary and external
factors. Optimism also refer to as the attitude or tendency to view the work
and interpret events and situations positively and also can be considered as
human strength and virtue (Sheldon & King, 2001; Santilli et al., 2016).
Hence, optimism had been defined as longitudinally and cross situationally
stable tendency which believe that one will experience positive and negative
situations or life events (Scheier & Carver, 1985).
In addition, according to Scheier & Carver’s study (1985), general
expectation of positive or favorable outcomes or situations had been defined
to as dispositional optimism where it also described to as an activity related
to self-regulation and goal attainment. In Leung, Moneta and Chang’s study
(2005), it also stated that dispositional optimism had leads to a more positive
evaluations and expectations of both past and future life events and
situations. This is because, optimism not only acts to reduce individual’s
perceptions of stress but also increase individual’s ability to perform
(Scheier & Carver, 1992). Therefore, optimism would eventually increases
the level of an individual’s satisfaction as the higher the level of an
individual’s optimism, the higher the levels of an individual’s satisfaction

A STUDY ON TECHNOLOGY READINESS AND ACCEPTANCE OF SISTEM MAKLUMAT KASTAM (SMK) IN JABATAN KASTAM MALAYSIA
24
(Scheier & Carver, 1982). This was proved in Seligman’s (1998) study,
where optimism may be related to higher productivity and satisfactions
(Luthans et al., 2008). Furthermore, optimism can be further differentiate
into big and little optimism where big optimism was culturally and
biologically bound with the socially acceptable norms whereas, little
optimism refer to as characteristic with specific and adaptive action
(Luthans et al., 2008). It was further argued in Yuan and Wang’s study
(2016), where optimism not only involves around different cognitive
tendencies toward past and future events but involves different emotional
consequences and satisfaction.
Moreover, optimism not only refers to as a positive view of future or past
events but it also refers to a positive view towards technology and belief that
a particular technology will increases the consumer or user’s control,
flexibility and efficiency in everyday lifestyle (Parasuraman, 2000; Koivisto
et al., 2016; Stock & Grob, 2016). This definition was adopted and further
explained in Johnson, Bardhi and Dunn’s (2008) and Wang et al.’s (2016)
studies, where the perception of control plays a significant part in
developing a feeling of satisfaction with self-service technology. This is
because, optimistic people value technology enable services (TES) more
which lead to having higher trust in new technologies and perceived more
positively on the functionality of new technologies (Walczuch, Lemmink &
Streukens, 2007; Lu, Wang & Hayes, 2012; Wang et al., 2016). Therefore
optimism will increases customer and user satisfaction as stated in Thong,
Hong and Tam’s (2006) and Wang et al.’s (2016) studies. User or individual
with high optimism level also not only able to anticipate the stressor, but
also able to respond proactively to the stressor which result in having less
burnout and higher satisfaction (Crosno, Rinaldo, Black & Kelley, 2009).

A STUDY ON TECHNOLOGY READINESS AND ACCEPTANCE OF SISTEM MAKLUMAT KASTAM (SMK) IN JABATAN KASTAM MALAYSIA
25
2.1.3.2 Innovativeness
Based on Garcia and Calantone’s study (2002), innovativeness was defined
to be frequently used as a measure of the degree of new innovation where
highly innovative products were seen as having higher degree or newness
whereas, low innovative product sit at the opposite extreme of the
continuum. This was supported by past researchers where innovativeness
had been defined in terms of product’s newness relative to the firm and
relative to the outside world (Kleinschmidt & Cooper, 1991; Song &
Montoya-Weiss, 1998). Innovativeness also had been categorize into three
categories which were highly innovative products that consist of new to the
world products and innovative new product lines to the company,
moderately innovative products that consist of new lines to the firm but the
product were not innovative to the market and low innovativeness products
which consist of modifications to existing products, redesigned products and
repositioning (Klenischmidt & Cooper, 1991). Innovativeness also had been
defined as the tendency for a firm to develop or innovate a new product or
services and adopt it (Damanpour, 1991; Rogers, 1995).
According to Parasuraman and Colby’s (2001); Koivisto et al., 2016; Stock
and Grob’s (2016) studies, innovativeness refer to the tendency of an
individual or firm to be the thought leader and technology pioneer. This is
because, innovativeness tend to measures the extent to which an individual
believes that he or she was the first in trying out a new technology and
considered as an opinion leader or technology pioneer on technology related
issues by others. Innovativeness can differentiated into two ideologies
perspectives which were operationalized innovativeness for the firm where
it considered as a strategic tool for the firm to identify which services or
product is novel and customer perceived innovativeness where it provide
the overview of innovativeness through customer point of view (Sreejesh,
Amarnath & Debjani, 2015). Based on Hurt et al.’s (1977) and Agarwal &
Prasad’s (1999) studies, they described innovativeness as willingness to

A STUDY ON TECHNOLOGY READINESS AND ACCEPTANCE OF SISTEM MAKLUMAT KASTAM (SMK) IN JABATAN KASTAM MALAYSIA
26
change and developed a self-report that reflected to the definition of
innovativeness. Innovativeness also consists of five categories of normal
adopter which were innovators, early adopter, early majority, late majority
and laggards (Rogers, 1995). It was further explained in Walczuch et al.’s
study (2007), where individual who was early adopters of an innovative
technology will use technology even the potential benefits were inexplicit.
Innovativeness according to Nik Abdullah’s (2012); and Zulkifly, Zahari,
Hanafiah, Hemdi and Ismail’s (2016) studies, refer to consumer or user
predisposition to adopt to the online transaction behavior earlier than his or
her social system. Furthermore, individual with high innovativeness not
only tend to have a stronger intrinsic motivation to use any new technology
but also enjoy the stimulation of trying the new technology (Nik Abdullah,
2012). This is because, innovative customer or users are always curious
about the new technologies and seen themselves as highly competent in
using any new technologies as well as handling any uncertainties
technologies present (Wang et al., 2016). Previous study done by past
researchers such as Agarwal and Prasad (1999) where in their study, it had
confirmed that the higher the innovativeness level of an individual, the more
likely he or she will use the new technology. This was further explained in
Chen and Chen’s study (2009) and Chen, Jong and Lai’s study (2014),
where they had indicated that the innovativeness of an individual user or
consumer will positively affected the user satisfaction where the higher the
continuance intention and perceived ease of use, the higher the user’s
satisfaction.
2.1.3.3 Discomfort
Discomfort defined as the perceived lack of control over technology and the
feeling of being overwhelmed by the technology (Parasuraman, 2000;
Tsikriktsis, 2004; Kaur & Gupta, 2012; Lu et al., 2012; Guhr, Loi, Wiegard
& Breitner, 2013; Wang et al., 2016). Discomfort also known as one of the

A STUDY ON TECHNOLOGY READINESS AND ACCEPTANCE OF SISTEM MAKLUMAT KASTAM (SMK) IN JABATAN KASTAM MALAYSIA
27
two inhibitors of technology use that caused the users unwilling to use
technology. It also represent the extent to which an individual having
general anxiety about technology based products or services (Guhr et al.,
2013). This was supported by past literatures where discomfort had been
stated as representing an individual general paranoia about technology in
which that particular individual believing that the technology based
products and services tend to exclusionary rather than inclusive to all kinds
of people (Tsikriktsis, 2004). Discomfort is created when there is an
inconsistency between the thoughts and actions which result in a reported
feelings of uncomfortable tensions that defined as discomfort (Williams &
Aaker, 2002). It also mentioned in the research done by Giebelhausen,
Robinson, Sirianni and Brady (2014) where discomfort emerges in the form
of feeling conflicted, confused and generally uncomfortable during the
interaction with technology.
According to Lu et al.’s study (2012), individual who having high
discomfort trait tend to perceive technology as complex and find self-service
technology difficult to use as well as satisfied their own needs. This was
further explained in Wang et al.’s study (2016), where individual who
having high discomfort will eventually perceived any new technology to be
complex and overwhelmed by the technologies whenever they feel or sense
a strong lack of control over their ability to handle any uncertainty events.
Thus, result in overestimate the technology’s complexity. Based on Lu et
al.’s (2012) study, in worst scenario, strong sense of discomfort will lead an
individual to become distrustful of the new technology. Not only that but an
individual also will perceived low functionality and usefulness of the
technology and directly decreases the user satisfactions (Wang et al., 2016).
2.1.3.4 Insecurity
Insecurity is defined as the feeling of distrust of the technology and
remained skeptical about the ability of the technology to function properly

A STUDY ON TECHNOLOGY READINESS AND ACCEPTANCE OF SISTEM MAKLUMAT KASTAM (SMK) IN JABATAN KASTAM MALAYSIA
28
or correctly (Parasuraman, 2000; Chen & Chen, 2009; Kaur & Gupta, 2012;
Lu et al., 2012; Nik Abdullah, 2012; Chen, Jong & Lai, 2014; Hemdi,
Rahman, Hanafiah & Adanan, 2016). This is because, a particular individual
with strong sense of insecurity will always perceive technology to be
insecure and skeptical of its performance which eventually lead to avoiding
the use of any new technology due to theirs innate fear (Lu et al., 2012).
Individual with high insecurity level also felt that they may having some
risk if or when used new technology based products or services (Kuo, Liu
& Ma, 2013). This had justified the study done by Hemdi et al., 2016, where
the feeling of insecurity had affected an individual’s perspective towards the
technology such as the used of new technology based product and services
will cause injury, unhealthy or harmful.
According to Tsikriktsis’s study (2004), although insecurity somehow
related to discomfort, it focuses more towards specific aspect of technology
based transactions instead of focusing on lack of comfort in technology.
Besides that, feeling of insecurity will result in people or user becoming
resistance such as postponement, rejection, dismissal, restriction, deferment,
or even opposition towards the use of any new technology based product or
services (Nik Abdullah, 2012; Hemdi et al., 2016). In worst scenario,
insecurity also will affect a company or firm’s business operation resulted
from the slow adoption of consumer or user towards the perceived lack of
security of the self-service technology system (Parasuraman, 2000). It was
generally acknowledged in the study of Hoffman et al. (1999) and Liljander,
Gillberg, Gummerus and Riel (2006) where insecurity was one of the major
contributor to slow adoption of a particular technology based product or
services. In addition, insecurity was the negative emotions that trigger any
negative behavior of an individual or user which might obstruct or block the
user from utilizing the self-service technology (Nik Abdullah, 2012; Hemdi
et al., 2016). Hence, it is expected that insecurity are negatively influence
the customer or user’s perceived ease of use towards the use of self-service
technology based product or services.

A STUDY ON TECHNOLOGY READINESS AND ACCEPTANCE OF SISTEM MAKLUMAT KASTAM (SMK) IN JABATAN KASTAM MALAYSIA
29
2.2 Review of Theoretical Framework
2.2.1 Model 1
Figure 2.1: Conceptual framework of Lin & Hsieh (2007)
Adapted from: Lin, C. J. S. & Hsieh, P. L. (2007). The influence of technology
readiness on satisfaction and behavioral intentions toward self-service technologies
(SST). Computer in Human Behavior 23(3): 1597-1615.
The model provided above, shows the hypothetical relationship between
technology readiness, customer satisfaction with self-service technologies
and behavioral intention towards self-service technologies.
The purpose of this study was to examined the role of customer’s technology
readiness and assess it influence on both customer satisfaction and
behavioral intentions towards the SST. These study consisted of a sample

A STUDY ON TECHNOLOGY READINESS AND ACCEPTANCE OF SISTEM MAKLUMAT KASTAM (SMK) IN JABATAN KASTAM MALAYSIA
30
of 500 adult consumers in Taiwan and a team of 20 research assistants who
requested for personal participation in this study. The 36 item technology
readiness index (TRI) developed by Parasuraman (2000) was adopted in the
measurement of consumers’ technology readiness while the measurement
for customer’s satisfaction with self-service technology was adopted from
the study of Fornell et al. (1996); Wong and Kanji (2001); and Lin & Hsieh
(2007). The measurement of consumers’ behavior intentions towards self-
service technologies was adopted from Cronin et al. (2000) and Zeithaml et
al. (2002); and Lin & Hsieh (2007).
The result of the study shown that technology readiness is an important
driver of customer’s satisfaction with SST as there was a positive
relationship between them. Besides, technology readiness also shown to had
a significant positive influence on customers’ behavioral intention towards
SST and further provide confirmation that the more satisfaction a particular
customer feel or experience when using SST, the more likely that particular
customer will use it again and recommend it to others. Lastly the result
concluded that, the higher the customer’s technology readiness level, the
higher the customer’s satisfaction in using the SST and a more favorable
behavioral intentions towards the SST (Lin & Hsieh, 2007).
2.2.2 Model 2

A STUDY ON TECHNOLOGY READINESS AND ACCEPTANCE OF SISTEM MAKLUMAT KASTAM (SMK) IN JABATAN KASTAM MALAYSIA
31
Figure 2.2: Conceptual framework of Chen & Chen (2009)
Adapted from: Chen, S. C. & Chen, H. H. (2009). The empirical study of customer
satisfaction and continued behavioral intention towards self-service banking:
technology readiness as an antecedent. International Journal of Electronic Finance
3(1), 64-76.
The above model illustrated in Figure 2.2, shown the relation between
technology readiness which consist of four dimensions with satisfaction and
continuance intention. The model was modified from conceptual framework
of Lin and Hsieh (2007) which had been originally demonstrated in research
done by Parasuraman (2000).
The purpose of this study was to examine the consumer satisfaction and the
long term usage intention of self-service banking (SSB). The study also
conducted in order to examine the relationship between technology
readiness, satisfaction and continuance intention (Chen & Chen, 2009).
There are a total sample of 402 users participate in this study where two
university professors who familiar with e-commerce and e-financing were
asked to provide assistance to examine the Chinese version of scale item.
A STUDY ON TECHNOLOGY READINESS AND ACCEPTANCE OF SISTEM MAKLUMAT KASTAM (SMK) IN JABATAN KASTAM MALAYSIA
32
According to the study, the measurement of technology readiness which
consist of optimism, innovativeness, insecurity and discomfort is adopted
from Parasuraman (2000) whereas, the measurement of satisfaction and
continuance intentions were obtained from Oliver (1981); Davis (1989);
Bhattacherjee (2001); and Chen and Chen (2009).
The result of the study found that satisfaction was positively influences the
continuance intention while users’ optimism and innovativeness influence
the satisfaction of using self-service banking. The result also stated that,
optimism and innovativeness were the two main motivators of behavioral
intention towards the users’ continuance intention of using self-service
banking services. On the other hand, the influences of insecurity and
discomfort on satisfaction and continuance intention in adopting the self-
service banking were insignificant (Chen & Chen, 2009). These had further
supported the study done by Meuter et al. (2000); Butcher et al. (2001); and
Chen & Chen (2009) where it had been stated that customer or users’ feeling
of anxiety or worry from interaction with technology services will affect the
users’ satisfaction.
The result of the study also concluded that optimism had more effect on the
users’ satisfaction and continuance intention of using self-service banking
services as compared with innovativeness. This study had proved and
provide additional support for study done by Liljander et al. (2006), where
it had stated that users or customers who are more willing to use new
technology based services or product, along with a positive attitude are more
likely to enjoy and satisfied in using self-service technology.
2.2.3 Model 3

A STUDY ON TECHNOLOGY READINESS AND ACCEPTANCE OF SISTEM MAKLUMAT KASTAM (SMK) IN JABATAN KASTAM MALAYSIA
33
Figure 2.3: Conceptual framework of Shih & Lee (2014)
Adapted from: Shin, S. J. & Lee, W. J. (2014). The Effect of Technology Readiness
and Technology Acceptance on NFC Mobile Payment Services in Korea. The
Journal of Applied Business Research, 30(6), 1615.
The above figure 2.3 shown the relation between technology readiness index
and technology characteristic with technology acceptance as the mediators
towards intention to use NFC Payment.
The purpose of this study is to investigate the factors for the technology
acceptance such as perceived ease of use and perceived usefulness which
was used as an integrated model of technology readiness and technology
characteristic. There are a total sample of 585 individuals from metropolitan
areas of Korea who had experienced smartphone services. The TRI
construct was measured using the 12 item TRI scale which was adopted
from the study of Shin & Lee (2012). Meanwhile, in order to measure the
responsiveness and smartness, measurement from Banwari and Lassar

A STUDY ON TECHNOLOGY READINESS AND ACCEPTANCE OF SISTEM MAKLUMAT KASTAM (SMK) IN JABATAN KASTAM MALAYSIA
34
(1996) and Pechmman and Ratneshwar (1994) was adopted into the study
or research (Shin & Lee, 2012). Furthermore, the measurement for
technology acceptance and behavioral intention by Hsu, Wang and Lin
(2011) and Venkatesh and Goyal (2010) respectively also had been adopted
into the study (Shin & Lee, 2014).
The result of the study found that the four dimensions of the technology
readiness index had a significant impact on the perceived ease of use
whereas the two technological characteristics which are responsiveness and
smartness had an impact on the perceived usefulness. However, between
both the perceived ease of use and perceived usefulness, only perceived
usefulness had a significant impact or effect on the intention to use (Shin &
Lee, 2014).
2.2.4 Model 4

A STUDY ON TECHNOLOGY READINESS AND ACCEPTANCE OF SISTEM MAKLUMAT KASTAM (SMK) IN JABATAN KASTAM MALAYSIA
35
Figure 2.4: Conceptual framework of Tu, Fang & Lin (2012)
Adapted from: Tu, C. C., Fang, K. T. & Lin, C. Y. (2012). Perceived Ease of Use,
Trust and Satisfaction as Determinants of Loyalty in e-Auction Marketplace.
Journal of Computers, 7(3), 645.
The above model in figure 2.4 shown the relation between rational and
emotional. In detail, the rational segment shows the relation between
perceived usefulness, perceived ease of use and trust with satisfaction and
perceived control with loyalty. On the other hand, in the emotional segment
shows the relation between shopping enjoyment and loyalty. However, both
emotional and rational segment also shows the relation between satisfaction
and loyalty.
The purpose of this study is to explore or determine what attracts and make
the customer keep on coming back to the online auctions sites from the
customers’ perspectives and identified the factors that affect customer
satisfaction and loyalty. There are a total sample of 316 users with auction
experience participate in this study instead of the initial 800 users. The
measurement of the technological acceptance which consist of perceived
ease of use and perceived usefulness is adopted from the theory of reasoned
action by Fishbein and Ajzen (1975); and Tu et al. (2012) while trust is

A STUDY ON TECHNOLOGY READINESS AND ACCEPTANCE OF SISTEM MAKLUMAT KASTAM (SMK) IN JABATAN KASTAM MALAYSIA
36
adopted from Flavien et al. and Tu et al., 2012. The measurement of
shopping enjoyment was adopted from Ghani et al. and Tu et al., 2012
through the use of three scale item while for the measurement of perceived
control was the four item scale from Koufaris (2002) and Tu et al., 2012.
From the result of this study or research, customer’s loyalty shown to had
great influence on the user’s satisfaction. The result further shown that
perceived ease of use, trust and user’s satisfaction had a positive effect on
consumers’ loyalty whereas, perceived usefulness, perceived control and
shopping enjoyment shown to had a negative effect on consumers’ loyalty.
According to Tu et al.’s study (2012), the researchers argued that only
perceived ease of use had a positive relation or effect towards user’s
satisfaction instead of both perceived usefulness and perceived ease of use
as suggested by previous researchers. However, this result was supported
and proved by Tu et al. (2012) where perceived ease of use tend to has higher
degree of satisfaction as compared with perceived usefulness. On the other
hand, the result of trust further proved the study done by Zviran et al. (2006);
and Tu et al. (2012) where an individual’s trust in the system will provide a
more accurate information along with perceived ease of use towards user’s
satisfaction.
2.3 Proposed Theoretical / Conceptual Framework
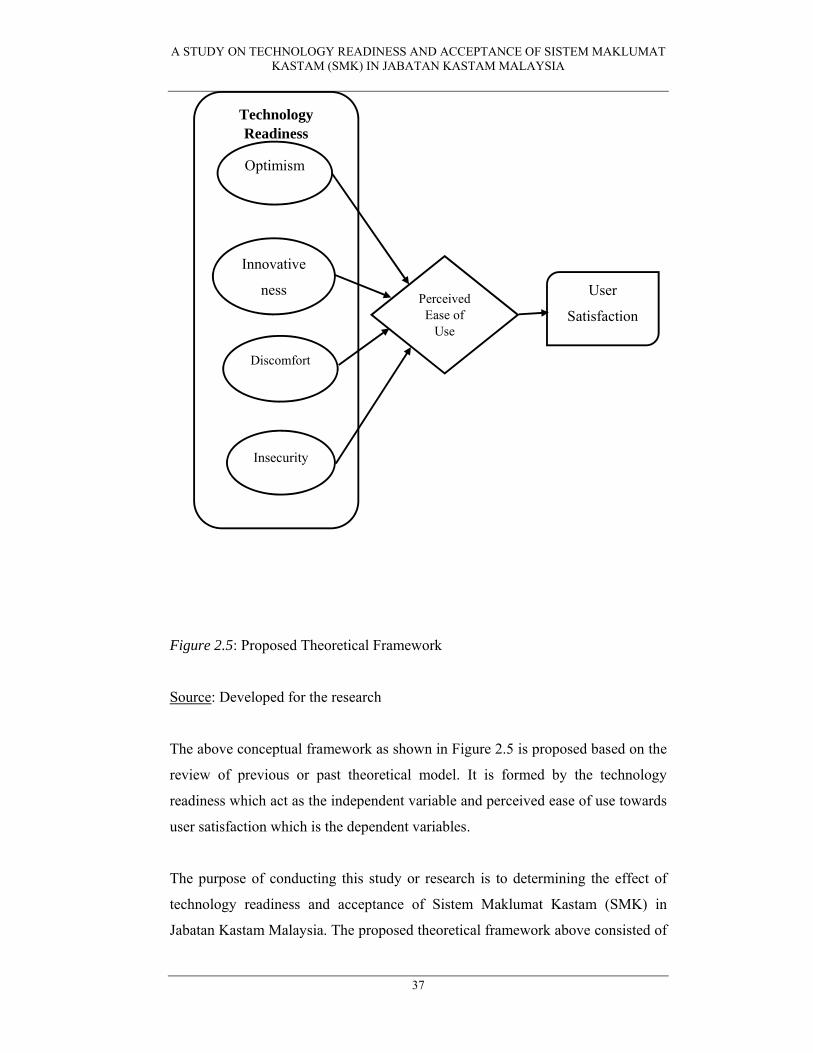
A STUDY ON TECHNOLOGY READINESS AND ACCEPTANCE OF SISTEM MAKLUMAT KASTAM (SMK) IN JABATAN KASTAM MALAYSIA
37
Figure 2.5: Proposed Theoretical Framework
Source: Developed for the research
The above conceptual framework as shown in Figure 2.5 is proposed based on the
review of previous or past theoretical model. It is formed by the technology
readiness which act as the independent variable and perceived ease of use towards
user satisfaction which is the dependent variables.
The purpose of conducting this study or research is to determining the effect of
technology readiness and acceptance of Sistem Maklumat Kastam (SMK) in
Jabatan Kastam Malaysia. The proposed theoretical framework above consisted of
Technology Readiness
Optimism
Innovative
ness
Discomfort
Insecurity
User
Satisfaction Perceived Ease of
Use

A STUDY ON TECHNOLOGY READINESS AND ACCEPTANCE OF SISTEM MAKLUMAT KASTAM (SMK) IN JABATAN KASTAM MALAYSIA
38
four dimensions for the independent variables which are optimism, innovativeness,
discomfort and insecurity. The four dimensions is adopted from the dimensions
developed by Parasuraman (2000). This is because, based on the previous research
or study, the dimension of technology readiness index is more appropriate to use in
determining the satisfaction of the user in using a particular new technology based
product or services. Furthermore, as stated in chapter 1, the SMK system was just
updated on 19th June 2017 where the updates was about the press release
representation (Gazet) GST standard 6% for more than 60 food items. Besides,
previous updates also allowed SMK system to have the QR code functions and
online complaints for the officers and customers.
Although there were numerous study or research of this relationship that had been
done before in the past, but the study of this relationship were still limited in
Malaysia. Therefore, this study will determine how the satisfaction level of custom
officers in Malaysia will be affected by the four dimensions of technology readiness
towards perceived ease of use and user satisfaction. Further study or research and
investigation are needed to prove this relationship.
2.4 Hypothesis Development
In the proposed theoretical or conceptual framework, we had identified all the
important variables which are related to our study. Thus, we obtained the relevant
information from the previous studies or research where the relationship which had
been theorized, tested and proved.
2.4.1 Optimism and Perceived ease of use

A STUDY ON TECHNOLOGY READINESS AND ACCEPTANCE OF SISTEM MAKLUMAT KASTAM (SMK) IN JABATAN KASTAM MALAYSIA
39
Optimism is one of the main variables which used to integrate the feelings
of a particular person towards the use of a new technology based product or
services and generate the feeling of satisfaction towards the technology
(Tsikriktsis, 2004). Optimism towards the use of technology also will
provide a particular person with many benefits such as the increases of
flexibility, control, efficiency or competence in their daily living and work
life. This is because, an optimistic individual tend to achieve their desired
result in a much more optimistic way or strategy (Walczuch et al., 2007).
On the other words, an optimistic individual are less likely to give attention
or focus on negative issues or events as they accept the use or new
technology in a much more flexible ways. Therefore, individual with high
optimism will always look or perceived technology as the most easiest and
effective ways in achieving the desired result and directly lead to having
higher users’ satisfaction level (Walczuch et al., 2007). Based on the above
reviews, the hypothesis is formulated as below:
H0: There is no significant positive relationship between optimism and
perceived ease of use of SMK among the custom officers in Jabatan Kastam
Malaysia.
H1: There is a significant positive relationship between optimism and
perceived ease of use of SMK among the custom officers in Jabatan Kastam
Malaysia.
2.4.2 Innovativeness and Perceived ease of use
Innovativeness refers to the tendency of an individual or firm to be the
technology pioneer and thought leader and considered to be an important
determinant of cognitive absorption (Parasuraman, 2000). This shown that
individual with high innovativeness tend to have a stronger or stable
intrinsic motivation in accepting new technology and enjoy the trill and

A STUDY ON TECHNOLOGY READINESS AND ACCEPTANCE OF SISTEM MAKLUMAT KASTAM (SMK) IN JABATAN KASTAM MALAYSIA
40
sensation of trying new technologies. According to Agarwal and Prasad’s
study (1999), they stressed that innovativeness is important during the study
of the acceptance level of an individual towards new innovated technology.
Furthermore, any individual who scored or have higher innovativeness level,
generally will produce positive effect or impact when using the new
technologies and eventually lead to having higher satisfaction level as they
perceived that particular product or services as easy and effective to use
(Parasuraman & Colby, 2001). Based on the above reviews, the hypothesis
is formulated as below:
H0: There is no significant positive relationship between innovativeness and
perceived ease of use of SMK among the custom officers in Jabatan Kastam
Malaysia.
H1: There is a significant positive relationship between innovativeness and
perceived ease of use of SMK among the custom officers in Jabatan Kastam
Malaysia.
2.4.3 Discomfort and Perceived ease of use
Discomfort refer to the perceived lack of control over technology and the
feeling of being overwhelmed by the technology (Parasuraman, 2000). This
is because, an individual who is not comfortable in using the technology
tend to believe that they had been controlled by the technologies and is not
created to use by all people. Furthermore, individual who high in discomfort,
tend to have feelings of anxiety when using the technology which directly
provide a negative effect on the user’s satisfaction (Hackbarth, Grover & Yi,
2003). As according to Lu et al.’s study (2012), discomfort also will make
an individual to be distrustful towards any new technology and perceived it
to be complex. Based on the above reviews, the hypothesis is formulated as
below:

A STUDY ON TECHNOLOGY READINESS AND ACCEPTANCE OF SISTEM MAKLUMAT KASTAM (SMK) IN JABATAN KASTAM MALAYSIA
41
H0: There is no significant negative relationship between discomfort and
perceived ease of use of SMK among the custom officers in Jabatan Kastam
Malaysia.
H1: There is a significant negative relationship between discomfort and
perceived ease of use of SMK among the custom officers in Jabatan Kastam
Malaysia.
2.4.4 Insecurity and Perceived ease of use
In the context of this study, insecurity is defined as the feeling of distrust
towards the technology and remained skeptical about the ability of the
technology to function properly or correctly (Parasuraman, 2000). Next,
individual who score high on insecurity tend to be less confidence on the
safety of new technologies and thus, often required or demand assurance
when using it (Parasuraman & Colby, 2001).
In addition, based on past researches or study, the feeling of insecurity will
emerged in a particular person the moment he or she perceived that the new
technologies consisted of numerous risk. This had been proved in the study
of Lu et al. (2005), where the perception of risk will effect an individual’s
intention to use the technology due to insecurity. It was further stated in
Tsikriktsis’s study (2004), where people only will take risk when they
perceived that using the new technologies will provide them will more
benefit or advantages. Hence, based on the reviews above, the hypothesis is
formulated as below:
H0: There is no significant negative relationship between insecurity and
perceived ease of use of SMK among the custom officers in Jabatan Kastam
Malaysia.

A STUDY ON TECHNOLOGY READINESS AND ACCEPTANCE OF SISTEM MAKLUMAT KASTAM (SMK) IN JABATAN KASTAM MALAYSIA
42
H1: There is a significant negative relationship between insecurity and
perceived ease of use of SMK among the custom officers in Jabatan Kastam
Malaysia.
2.4.5 Perceived ease of use and User satisfaction
Technology acceptance consists of two major determinant which are
perceived ease of use and perceived usefulness. However, in the context of
this study, the researchers emphasize on the relation between dimensions of
technology readiness and user’s satisfaction along with perceived ease of
use. According to Sibona & Choi’s study (2012), perceived ease of use has
a significant positive relationship towards user’s satisfaction. It was
supported in Ohk, Park and Hong’s study (2015) where it had proved that
the greater the perceived ease of use, the greater the user’s satisfaction level.
However, this was argued in Schaik, Saltikov and Warren’s study (2002),
where the past researchers stated that there was no significant positive
relationship between perceived ease of use and user’s satisfaction. This is
because, the four dimensions of technology have a significant impact on
individual’s perceived ease of use which may direct or indirectly affect the
user’s satisfaction. Hence, further study are required in order to determine
the relation and the hypothesis is formulated as below:
H0: There is no significant positive relationship between perceived ease of
use and user’s satisfaction of using SMK among the custom officers in
Jabatan Kastam Malaysia.
H1: There is a significant positive relationship between perceived ease of
use and user’s satisfaction of using SMK among the custom officers in
Jabatan Kastam Malaysia.

A STUDY ON TECHNOLOGY READINESS AND ACCEPTANCE OF SISTEM MAKLUMAT KASTAM (SMK) IN JABATAN KASTAM MALAYSIA
43
2.5 Conclusion
This chapter has shown the significant relationship between the four independent
variables with the user’s satisfaction. Each of the independent variables had been
discuss in detail and a theoretical framework had been proposed according to the
previous study. Four hypothesis also had been developed in order to be tested in the
following chapter. This study or research will be continue in examining the research
methodology in Chapter 3.
CHAPTER 3: RESEARCH METHODOLOGY

A STUDY ON TECHNOLOGY READINESS AND ACCEPTANCE OF SISTEM MAKLUMAT KASTAM (SMK) IN JABATAN KASTAM MALAYSIA
44
3.0 Introduction
Overall, chapter 3 will be more about the method or research methodology used to
determine the relationship between the independent variables and dependent
variables. Research methodology is consider as a crucial part of this research or
study where it is the process of collecting data and information for the study.
Therefore, this chapter will describes and highlight on the research design, data
collection methods, sampling design, research instrument, construct measurement,
data processing and data analysis.
3.1 Research Design
According to Zikmund, Babin, Carr and Griffin’s study (2013), research design
refer to the process that include collecting, analyzing and interpreting the data and
provide the required information in a more logic and systematic ways. This is
because, research design shows the overall plan on how the researchers plan to carry
out their project or research. Furthermore, due to having larger population of
respondent in this study, quantitative research method will be used in this research
instead of qualitative research method. This is due to the reason that quantitative
research method was a research method which allowed the researchers to collect
and analyze the numerical data from a group people (Sekaran, 2003). Therefore,
quantitative research method will be the one used in this research to study the
relationship between the dimensions of technology readiness index and perceived
ease of use towards the user satisfaction according to the questionnaire the
researchers constructed.
Besides, as compared with qualitative research method, quantitative method tend to
be more valid, generalized and reliable in the prediction of cause and effect. This is
because, in this research, the researchers tend to determine the cause and effect

A STUDY ON TECHNOLOGY READINESS AND ACCEPTANCE OF SISTEM MAKLUMAT KASTAM (SMK) IN JABATAN KASTAM MALAYSIA
45
relationship where a changes in the user satisfaction will causes what changes to
the technology readiness index’s dimensions and perceived ease of use. Therefore
by doing so, the researchers able to determine which variables will be the cause and
effect in this study.
3.2 Data Collection Methods
Data collection methods was one of the important process in any research as it was
used to obtain and gather the information from our respondents. Generally, these
methods included observation method, interview method, and questionnaire which
is distributed through electronically. These type of data collection method could be
used to collect information to do further investigation (Zikmund et al., 2013). Data
collection not only determines where the data come from, it also provide a more
accurate data. In this research, the researchers will be using two types of data which
are primary data and secondary. For instance, primary data refer to the data that the
researchers get from the questionnaire distributed to the respondents whereas,
secondary data refer to the data or information obtained through online.
3.2.1 Primary Data
Primary data often known as original data as it is the first hand information
obtained by the researchers with the objective to conduct a research from
the respondents. Therefore, the data tend to be more reliable and objective
and higher validity than secondary data (Hox & Boeije, 2005). However,
although primary data is more likely to be better than secondary data, it also
consist of several difficulties such as more time consuming and ethical
consideration. For this research, the researchers will be using primary data
as our main data by distributing the questionnaire through google docs using
email to the custom officers in Jabatan Kastam Malaysia. This is because,
this method tend to be more effective and faster in getting responses from
the custom officers.

A STUDY ON TECHNOLOGY READINESS AND ACCEPTANCE OF SISTEM MAKLUMAT KASTAM (SMK) IN JABATAN KASTAM MALAYSIA
46
3.2.2 Secondary Data
Secondary data refers to the data which had been published or collected by
researchers through journal, magazine, books, articles, newspaper, and
scholarly materials for the purpose of a particular researches (Sekaran &
Bougie, 2012). Most of the information or data were obtained from the
online database such as website and online library.
In the progress of doing this research, the researchers had used several
magazines or articles in order to increases the knowledge and understanding
towards the custom department and Sistem Maklumat Kastam (SMK). Most
of the magazines and articles were obtained by using Google search engine.
One of the benefits of using secondary data is that the data tend to be easier
to access and less costly.
3.3 Sampling Design
A sampling unit is a member of the population that may be selected as
representative for sampling. Sampling is a procedure by using entire population
with small number of people or objects for conclusions making purpose. A well-
planned sampling design is designed to ensure that the resulting data adequately
represents the target population and is defended for its intended use. Effective use
of time, money and human resources is a key consideration throughout the sampling
design process. Good design should meet the needs of research with minimal
resources. It also ensures to have best understanding towards whole data
explanation.
3.3.1 Target Population

A STUDY ON TECHNOLOGY READINESS AND ACCEPTANCE OF SISTEM MAKLUMAT KASTAM (SMK) IN JABATAN KASTAM MALAYSIA
47
In these research, the target population were focus on the custom officers in
Jabatan Kastam Malaysia. However, the exact amount of the target
population for Jabatan Kastam Malaysia is unknown. In addition, our
sample size will be 106 respondents from the target population. This is
because, through the calculation from G power, the amount of sample size
needed for our research to be valid and reliable is 92. Therefore, although
the target population amount is unknown, our research still valid by having
106 quality respondents which represent our sample size.
3.3.2 Sampling Frame and Sampling Location
Sampling frame refer to the representative which sample is drawn from a
complete list of items or population (Elangovan, Elavarsu, Ezhil, Prabu, &
Yuvaraj, 2016). Whole Malaysia custom department has been chosen by the
researchers as the sampling location for this study whereas the researchers
will be having 106 respondents as the sampling frame in this study.
3.3.3 Sampling Elements
The sampling elements in this research or study will be the respondents
which had been taking part in this research which are the custom officers of
Jabatan Kastam Malaysia. The researchers only had one criteria to be
included in the sampling element which is respondents are currently
working as custom officers in any custom department across Malaysia.
These populations are targeted by us because they have more experience
and understanding with the Sistem Maklumat Kastam (SMK) as they were
required to use it in their workplace. Thus, they may provide us with more
accurate information through the survey instrument.

A STUDY ON TECHNOLOGY READINESS AND ACCEPTANCE OF SISTEM MAKLUMAT KASTAM (SMK) IN JABATAN KASTAM MALAYSIA
48
3.3.4 Sampling Technique
Sampling technique that has been used in this research which are the non-
probability sampling and convenience sampling. Non-probability sampling
refers to the chance of being choose from the target population’s is unknown.
Convenience sampling means that the target populations were free to answer
all the questionnaire for us. It is a technique where the sample being chosen
from the target population on the basis of their accessibility or convenience
to the researcher (Ross, 2005). According to Sekaran and Bougie (2012),
Convenience sampling provided the best method to collect information
because the preliminary information can be obtained quickly and
inexpensive way. In our research, this sampling allows us to investigate
based on cost and time constraints. Thus, it is much convenient and easy for
us to obtain data from quality respondents.
3.3.5 Sample Size
Based on the past researchers, the amount of samples size was deemed to be
more than 100 as it provide a more valid result. For example, according to
Anderson and Gerbing’s (1983) study, they stated that although the sample
size of 100 was sufficient for convergence of 3 or more indicators per factor,
it still not sufficient for a convergent as the suitable amount of sample size
should be 150 or above for SEM. This was supported by past researcher
such as Hoelter (1983) where the researcher proposed a critical sample size
of 200 and above. Furthermore, Schumacker and Lomax (2004) suggested
that the suitable amount of sample size should be around 250 to 500.
Therefore, in this study, the researchers asked one of the custom officers
who will acted as a representative for the researchers and distributed to 300
respondents evenly across 16 custom departments in Malaysia. However,
the researchers only managed to get a total of 107 feedbacks from the
custom officers.

A STUDY ON TECHNOLOGY READINESS AND ACCEPTANCE OF SISTEM MAKLUMAT KASTAM (SMK) IN JABATAN KASTAM MALAYSIA
49
Hence, the researchers decided to use G power as the sample size calculation
method where it can be used to determine the qualified sample size needed
for the study but it’s not telling about generalized. Since, the researchers do
not have any literature for effect size that can be taken as medium, the
researchers needed to know about the power. According to the G power
developer, the power needed will be 0.80 and the G power result stated that
the minimum amount of sample needed for the study will be 92 whereas,
the researchers managed to get 106 samples with one missing data which is
sufficient and more than enough to justify the reliability and validity of the
study.
Figure 3.1: G power result
3.4 Research Instrument
Research instrument is a tool that the researchers use to elaborate the process of
how the study has been done by us. Questionnaire is used as our research instrument
in the research. The questionnaires are set according to the theoretical frameworks

A STUDY ON TECHNOLOGY READINESS AND ACCEPTANCE OF SISTEM MAKLUMAT KASTAM (SMK) IN JABATAN KASTAM MALAYSIA
50
which investigate the relationship between one of the TAM determinant which is
perceived ease of use and TRI which are optimism, innovativeness, discomfort and
insecurity towards user satisfaction.
3.4.1 Questionnaire Design
The questionnaire that the researchers distributed to the respondent was a
combination of previous research paper questionnaire with slight
modification on it. The questionnaires were fixed alternative questions as
every single question will consist of different choices for the respondents.
In order to reduce inconveniences and time usage, the researchers
constructed the questionnaire with two different languages which are Malay
and English. From the given alternative, the respondents are required to
select the most similar or accurate answer to their viewpoint.
This questionnaire consists of four (4) sections which are Section A, B, C
and D where Section A refer to the respondents’ demographic information
such as gender, age, marital status, educational level, position grade, length
or period of service and salary. Section B is the combinations of four TRI
dimensions which are optimism, innovativeness, discomfort and insecurity.
There are total 23 questions which cover the four dimensions of technology
readiness index. Section C will be the user satisfaction which consist of 3
questions whereas in Section D, the perceived ease of use will consisted of
7 questions. In section B, C and D, the researchers applied 5 points Likert
Scale to measure the respondent answers which ranging from “strongly
agree, agree, neutral, disagree and strongly disagree”. The questionnaire is
composed of closed questions, and the respondent can choose among the
alternatives set by the researcher. Closed questionnaires provide a clear
meaning that the question you want to express, and that the interviewee can
easily and quickly understand and answer. It also makes more meaningful
comparison of results and achieves research goals.

A STUDY ON TECHNOLOGY READINESS AND ACCEPTANCE OF SISTEM MAKLUMAT KASTAM (SMK) IN JABATAN KASTAM MALAYSIA
51
Table 3.1
Difference between Original question and Modified question
Independent variables: Technology readiness index (TRI)
Original questions Modified questions
Optimism Optimism
OPT1
Technology gives people more
control over their daily lives.
OPT1
Sistem maklumat kastam memberikan
pengguna lebih banyak kawalan ke atas
tugasan seharian mereka.
SMK gives people more control over their
everyday tasks.
Continued
Original questions Modified questions
OPT2
Products and services that use
the newest technologies are
much more convenient to use.
OPT2
Proses pengikraran menggunakan SMK lebih
mudah digunakan berbanding dengan
pengikraran menggunakan borang.
The declaration process becoming easier
through the use of SMK than using document.
OPT3
I prefer to use the most
advanced technology available.
OPT3
Saya lebih suka menggunakan sistem SMK
berbanding dengan cara pengikraran
menggunakan borang kastam.
I prefer to use SMK system than custom
document as a method for declaration.
OPT4
I like technologies that allow
me to tailor things to fit my own
needs.
OPT4
Saya suka sistem SMK kerana ianya
memudahkan saya dengan hanya mengisi
maklumat di ruangan yang telah sedia ada di
dalam paparan sistem.

A STUDY ON TECHNOLOGY READINESS AND ACCEPTANCE OF SISTEM MAKLUMAT KASTAM (SMK) IN JABATAN KASTAM MALAYSIA
52
I like SMK system because it make me easier
by only needed to fill in the information at the
space provided in the display system.
OPT5
Technology makes me more
efficient in my occupation.
OPT5
Sistem maklumat kastam meningkatkan tahap
kecekapan saya semasa bekerja.
SMK makes me more efficient in my
occupation.
OPT6
I find new technologies to be
mentally stimulating
OPT6
Saya mendapati sistem SMK lebih
merangsangkan dari segi mental.
I find SMK to be mentally stimulating.
Continued
Original questions Modified questions
OPT7
Technology give me more
freedom of mobilty
OPT7
Dengan adanya SMK, ianya memberikan saya
lebih banyak kebebasan untuk bergerak.
By having SMK, it gives me more freedom of
mobility
OPT8
Learning about technology can
be as rewarding as the
technology itself.
OPT8
Sistem SMK boleh meningkatkan pungutan
hasil bagi JKDM.
SMK system can increases the revenue
collections for JKDM.
OPT9
I feel confident that technology-
based systems will follow
through with what I instruct
them to do.
OPT9
Dengan menggunakan sistem SMK, saya
berasa lebih yakin kerana ianya berfungsi
seperti yang saya arahkan.
By using SMK, I feel more confident because
the systems functions according as I instructed.
Innovativeness Innovativeness
INN1 INN1

A STUDY ON TECHNOLOGY READINESS AND ACCEPTANCE OF SISTEM MAKLUMAT KASTAM (SMK) IN JABATAN KASTAM MALAYSIA
53
Other people come to me for
advice on new technologies.
Orang lain datang kepada saya untuk
mendapatkan nasihat mengenai sistem SMK.
Other people come to me for advice on SMK
system.
INN2
It seems my friends are learning
more about the newest
technologies than I am
INN2
Rakan sekerja saya lebih arif menggunakan
SMK berbanding dengan saya.
My colleagues were more skilled in using
SMK than me [reverse scored]
Continued
Original questions Modified questions
INN3
In general, I am among the first in
my circle of friends to acquire new
technology when it appears.
INN3
Secara umum, saya adalah antara yang
pertama dijadikan rujukan mengenai sistem
SMK di tempat kerja saya.
In general, I was among the first in my
workplace that being made as reference to
SMK system.
INN4
I can usually figure out new high-
tech products and services without
help from others.
INN4
Biasanya saya boleh menggunakan sistem
SMK tanpa bantuan daripada orang lain.
Usually I can figure out how to use SMK
system without help from anyone.
INN5
I keep up with the latest
technological developments in my
areas of interest.
INN5
Saya sentiasa mengikuti pindaan terkini ke
atas sistem SMK dari masa ke semasa.
I always keep up with the latest version of
SMK system from time to time.
INN6 INN6

A STUDY ON TECHNOLOGY READINESS AND ACCEPTANCE OF SISTEM MAKLUMAT KASTAM (SMK) IN JABATAN KASTAM MALAYSIA
54
I enjoy the challenge of figuring out
high-tech gadgets.
aya menikmati keseronokan dan cabaran
dalam proses menggunakan sistem SMK.
I enjoy the challenging process of using
SMK system
INN7
I find I have fewer problems than
other people in making technology
work for me.
INN7
Saya tidak mempunyai masalah dalam
menggunakan SMK berbanding dengan
rakan sekerja saya yang lain.
I find myself to have fewer problems than
others in using SMK.
Continued
Original questions Modified questions
Discomfort Discomfort
DIS1
Technical support lines are not
helpful because they don’t explain
things in terms I understand.
DIS1
Sistem SMK sangat mudah dan jelas.
SMK system was easy and clear.
DIS2
Many new technologies have health
or safety risks that are not
discovered until after people have
used them.
DIS2
Sistem SMK ini memudahkan jabatan
untuk mengintip agen penghantaran dari
melakukan kesilapan pengikraran
barangan.
SMK system makes it easy for the
departments to spy on the delivery agent
mistakes during the declaration of goods.
Insecurity Insecurity
INS1
I do not consider it safe to provide
personal information over the
Internet.
INS1
Saya berasa tidak selamat untuk
melakukan pengikraran barangan melalui
elektronik.

A STUDY ON TECHNOLOGY READINESS AND ACCEPTANCE OF SISTEM MAKLUMAT KASTAM (SMK) IN JABATAN KASTAM MALAYSIA
55
I do not consider it safe to do any goods
declaration online
INS2
I worry that information I make
available over the Internet mayb be
misused by others.
INS2
Saya bimbang bahawa maklumat
pengikraran borang yang dimasukkan di
dalam sistem akan sampai ke pihak yang
lain bagi kegunaan yang salah.
I worry that the document's declaration
information that I entered into the system
will be send to other party with bad
intention.
Continued
Original questions Modified questions
INS3
I do not feel confident doing
business with a place that can only
be reached online.
INS3
Saya berasa tidak yakin menjalankan proses
pengikraran kastam yang hanya bergantung
dengan sistem elektronik sahaja.
I am not convince in the custom's
declaration process that only depends on
electronic system
INS4
Any business transaction you do
electronically should be confirmed
later with a separate
communication.
INS4
Apa-apa transaksi melalui sistem elektronik
perlu disahkan kemudian secara bertulis.
Any transaction through electronic system
need to be confirmed later in black and
white or written.
INS5
When I call a business, I prefer
talking to a person rather than
interacting with an automated
system.
INS5
Saya lebih suka berkomunikasi secara
bersemuka dengan orang dan bukannya
melalui mesin semasa urusan pengikraran
barangan.

A STUDY ON TECHNOLOGY READINESS AND ACCEPTANCE OF SISTEM MAKLUMAT KASTAM (SMK) IN JABATAN KASTAM MALAYSIA
56
I prefer to talk in person rather than through
a machine during the declaration of goods.
Source: Parasuraman & Colby (2015)
Dependent variables: User satisfaction
Original questions Modified questions
User satisfaction User satisfaction
USER1
Saya berniat untuk menggunakan
Sistem maklumat Kastam
ditempat kerja saya.
USER1
Saya setuju penggunaan sistem SMK di
tempat kerja saya diteruskan.
I agree to the continuance use of SMK system
in my workplace.
USER2
Saya akan kembali ke SMK ini
kerap jika ada urusan kerja
USER2
Saya akan kembali ke SMK secara kerap jika
ada proses pengikraran perlu dilakukan.
I will frequently come back to SMK if there
was a declaration process that needed to be
done.
USER3
Saya berniat untuk menerima
maklumat atau tugas kerja
dengan mengunkan SMK
USER3
Saya berniat untuk menerima maklumat atau
tugas kerja dengan menggunakan SMK.

A STUDY ON TECHNOLOGY READINESS AND ACCEPTANCE OF SISTEM MAKLUMAT KASTAM (SMK) IN JABATAN KASTAM MALAYSIA
57
I intend to receive information or workload
through the use of SMK.
Perceived ease of use
Original questions Modified questions
PEOU1
Learning to use E-government system
would be easy for me
PEOU1
Belajar cara penggunaan sistem SMK
adalah mudah bagi saya.
Learning to use SMK system would be
easy for me.
PEOU2
I would find it easy to get better service
using E-government system
PEOU2
Saya mendapati bahawa pengikraran
menjadi lebih mudah melalui sistem
SMK.
I found that declaration becoming
easier through SMK system
PEOU3
It would be easy for me to become skill
full at using E-government system
PEOU3
Ia adalah mudah bagi saya untuk
menjadi mahir dalam pengunaan sistem
SMK.

A STUDY ON TECHNOLOGY READINESS AND ACCEPTANCE OF SISTEM MAKLUMAT KASTAM (SMK) IN JABATAN KASTAM MALAYSIA
58
It would be easy for me to become
skillful at using SMK system
PEOU4
I would find E-government system
easy to use
PEOU4
Saya mendapati bahawa SMK adalah
senang digunakan.
I would find SMK easy to use.
PEOU5
My interaction with E-learning was
clear and understandable.
PEOU5
Interaksi antara saya dengan SMK
adalah jelas dah mudah difahami.
My interaction with SMK would be
clear and understable
Continued
Original questions Modified questions
PEOU6
I think it is easy to use an NFC mobile
payment system.
PEOU6
Prosedur bagi sistem SMK adalah
mudah difahami.
Procedure for SMK system is easy to
understand.
PEOU7
It would be easy for me to find
information at E-learning.
PEOU7
Saya berasa mudah untuk mengetahui
perjalanan proses pengikraran
barangan melalui sistem SMK.
I would find it easy to know the course
of goods declaration process through
SMK system.
Source: Davis (1989), Maslin Masrom (2007), Suki & Ramayah (2010) & Shin &
Lee (2014).
Note: Discomfort (DIS), Innovativeness (INN), Insecurity (INS), Optimism (OPT), Perceived ease of
use (PEOU), User satisfaction (USER)

A STUDY ON TECHNOLOGY READINESS AND ACCEPTANCE OF SISTEM MAKLUMAT KASTAM (SMK) IN JABATAN KASTAM MALAYSIA
59
3.4.2 Pilot study
In fact, a pilot study is an essential initial step in a research and this applies
to all types of research studies and the cornerstone of good research
(Sekaran & Bougie, 2011; Hazzi & Maldaon, 2015). The purpose of the
pilot study was to examine the feasibility of an approach that is intended to
be used in a larger scale study. A pilot study was conducted by the
researchers with a custom officer representative who had distributed the
questionnaire to 30 custom officers before carry out the actual survey in
Jabatan Kastam Malaysia. After the custom officers checked for the
suitability of the questionnaire, the researchers then pass the questions to the
custom officer who will act as a representative and help the researchers in
distributing the questionnaires to other officers. This meant that, the
researchers already had a feedback session with the 30 custom officers and
having a reliability level of more than 80%. Pilot study was consider as a
vital part because the researchers had been using it to identify the problem.
Not only that, pilot study also was suitable for accuracy, reliability, and
validity of the data. Following the analysis of pilot study data, unclear words
or vague questions were deleted or rephrased. Questions in the questionnaire
also had been modified according to the suggestion of custom officer so that
it can be understood by others officers. In this research, the researchers also
had used back to back translation when designing the questions so that
custom officers had a better understanding on the questions. Back to back
translation was one of the most widely used techniques in cross-cultural
research as it able to maximizes translation, equality questionnaire from
English into Malay and reduces the chance of a false positive translation.
3.5 Constructs Measurement

A STUDY ON TECHNOLOGY READINESS AND ACCEPTANCE OF SISTEM MAKLUMAT KASTAM (SMK) IN JABATAN KASTAM MALAYSIA
60
Researchers often do the inappropriate measurement in theirs study with lack of
availability or only taken the previously published measures in accordance with
existing research methods rather than on the effectiveness (Nielsen, 2014). In this
research study, construct measurement as the vital part of element. It ensures the
validity of the findings. All scale measurement consist four basic scale levels which
is nominal, ordinal, interval and ratio scale. Each of them explains for how to
provide more insight of using the scale to develop their current study. The
researchers had separated the questions into 4 parts, which are section A, B, C and
D. In part A, the researchers collected the respondent’s demographic information.
In part B, the question that related to the independent variables; and the last part C
and D is the question that related to the dependent variable which is user satisfaction
and perceived ease of use. The researchers used nominal, ordinal and interval scale
in designing our questionnaire.
3.5.1 Origin of Construct
Table 3.2
Sources of Questionnaire’s Questions
Variables Sources (Adopted from) Number of
Item
(Original)
Number of
Items
(Modified)
Optimism Parasuraman, A. & Colby,
C. L. (2015)
12 10
Innovativeness Parasuraman, A. & Colby,
C. L. (2015)
9 7
Discomfort Parasuraman, A. & Colby,
C. L. (2015)
13 9
Insecurity Parasuraman, A. & Colby,
C. L. (2015)
11 9
User satisfaction Suki, N. M. & Ramayah, T.
(2010)
3 3

A STUDY ON TECHNOLOGY READINESS AND ACCEPTANCE OF SISTEM MAKLUMAT KASTAM (SMK) IN JABATAN KASTAM MALAYSIA
61
Perceived ease of
use
Masrom, M. (2007)
Davis, F. D. (1989)
Suki, N. M. & Ramayah, T.
(2010)
8 7
Source: Develop from the research
3.5.2 Scale of Measurement
3.5.2.1 Nominal Scale
According to Zikmund (2010), nominal scale is the most basic scale
measurement out of four types of scale design. It use to classify and also
identified the object’s value, and it can classify as a non-metric and
qualitative measurement. It was not include any quantitative measure, only
a very simple way to assign the categories into the specific group. There are
total three questions in part A that used nominal scale, is question 1
(gender),question 2(age) and question 3(status).
Figure 3.2: Example of Nominal Scale
Source: Develop from the research
3.5.2.2 Ordinal Scale
1. Gender:
Male
Female

A STUDY ON TECHNOLOGY READINESS AND ACCEPTANCE OF SISTEM MAKLUMAT KASTAM (SMK) IN JABATAN KASTAM MALAYSIA
62
Ordinal scale is one of a scale measurement with ranking, but the value of
the ranking could not be classified. It assigned objects, people or places
according to their magnitude in a particular order (Khalid, Hilman, & Kumar,
2012). Question 4, 5, 6, and 7 in part A are using ordinal scale. They are
the education level, position grade length or period of services and salary in
the business. One of the examples is shown below:
Figure 3.3: Example of Ordinal Scale
Source: Develop from the research
3.5.2.3 Interval Scale
According to Zikmund et al. (2009), interval scale is similar to the ordinal
scale. But it also includes the information regarding the differences in the
quantities of a concept. The zero in the interval scale known as the non-true
zero point that means zero still get meaning. The interval scale is a scale that
arranges not only the objects, the size of the object or the place in a particular
order, but also the arrangement of the interval. All questions in section B, C
and D are using interval scale to design the questions.
Table 3.3
4. Taraf pendidikan tertinggi / Educational Level
SPM
STPM / Diploma
Ijazah Sarjana Muda / Degree
Lain-lain / Others

A STUDY ON TECHNOLOGY READINESS AND ACCEPTANCE OF SISTEM MAKLUMAT KASTAM (SMK) IN JABATAN KASTAM MALAYSIA
63
Example of Interval Scale (Section B)
No. Optimism Strongly
Disagree
Disagree Neutral Agree Strongly
Agree
1. Sistem maklumat
kastam memberikan
pengguna lebih banyak
kawalan ke atas
tugasan seharian
mereka. (SMK gives
people more control
over their everyday
tasks).
1 2 3 4 5
Source: Develop from the research
Table 3.4
Example of Interval Scale (Section C)
No. User Satisfaction Strongly
Disagree
Disagree Neutral Agree Strongly
Agree
1. Saya setuju
penggunaan sistem
SMK di tempat kerja
saya diteruskan. (I
agree to the
continuance use of
SMK system in my
workplace.)
1 2 3 4 5
Source: Develop from the research
Table 3.5

A STUDY ON TECHNOLOGY READINESS AND ACCEPTANCE OF SISTEM MAKLUMAT KASTAM (SMK) IN JABATAN KASTAM MALAYSIA
64
Example of Interval Scale (Section D)
No. Perceived Ease of
Use
Strongly
Disagree
Disagree Neutral Agree Strongly
Agree
1. Belajar cara
penggunaan sistem
SMK adalah mudah
bagi saya. (Learning
to use SMK system
would be easy for
me.)
1 2 3 4 5
Source: Develop from the research
3.6 Data Processing
Data processing is a computer technique that convert data into information way.
Data processing is a process of gathering and manipulating data then using the
computer database. Data processing includes checking, editing, coding and
transcribing as well as specifying any special or unusual treatments of data. In this
study, the researchers will be using SPSS and SMART PLS for data processing.
3.6.1 Data Checking
Data checking is the process to determine the accuracy and completeness of
the information of data that collected from the sample of population
(Zikmund, 2010). This is the first step in data processing because it uses to
ensure all the questionnaires given to the respondents are returned. Besides
that, in this step also help to check the questionnaire completion level and

A STUDY ON TECHNOLOGY READINESS AND ACCEPTANCE OF SISTEM MAKLUMAT KASTAM (SMK) IN JABATAN KASTAM MALAYSIA
65
make sure there is no omission data. Data checking is reliable, if the data no
check it will influence the consistent on the reliability test result.
3.6.2 Data Editing
In order to prevent any bias element and inconsistent in the data editing
process, the researchers will to carry out extensive process for checking and
correcting purpose. This can happened because, sometimes, the respondents
might not understanding what the question ask, which eventually lead to
respondents not be able to express their ideas into proper sentence.
Therefore, it is important to implement the data and edit it. This was agreed
in Waal, Pannekoek and Scholtus’s (2011) study, where data editing process
was use to improve the quality of the data by detecting and correcting errors
encompasses a variety of procedures. Through this step, the data will be
more accurate and complete.
3.6.3 Data Coding
According to Sekaran and Bougie (2010), data coding is a process to classify
and allocate numbers as well as other symbol to the data edited previously.
Every data have coded before key in into the computer becoming data result.
After coded, the data processing become more easy and smoothly to conduct.
Commonly the researchers had to use the specific numerical symbol or
number to represent each of the data.in section A, the following question
will be coded as below:
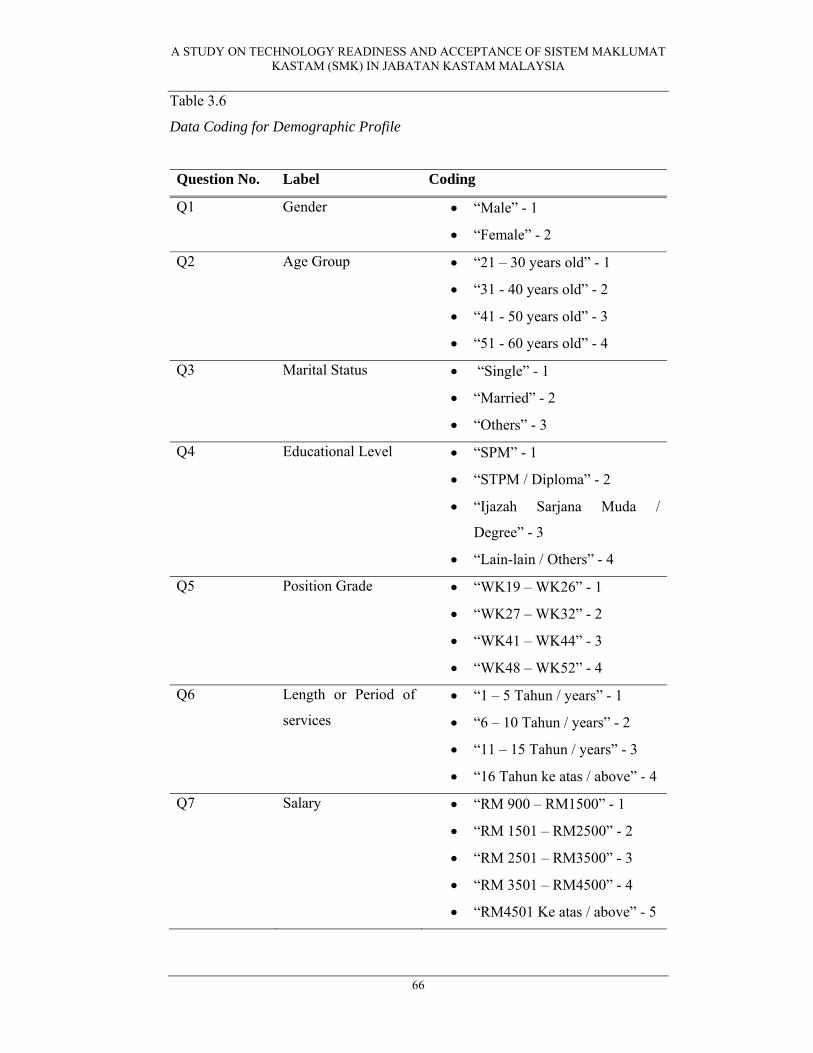
A STUDY ON TECHNOLOGY READINESS AND ACCEPTANCE OF SISTEM MAKLUMAT KASTAM (SMK) IN JABATAN KASTAM MALAYSIA
66
Table 3.6
Data Coding for Demographic Profile
Question No. Label Coding
Q1 Gender “Male” - 1
“Female” - 2
Q2 Age Group “21 – 30 years old” - 1
“31 - 40 years old” - 2
“41 - 50 years old” - 3
“51 - 60 years old” - 4
Q3 Marital Status “Single” - 1
“Married” - 2
“Others” - 3
Q4 Educational Level “SPM” - 1
“STPM / Diploma” - 2
“Ijazah Sarjana Muda /
Degree” - 3
“Lain-lain / Others” - 4
Q5 Position Grade “WK19 – WK26” - 1
“WK27 – WK32” - 2
“WK41 – WK44” - 3
“WK48 – WK52” - 4
Q6 Length or Period of
services
“1 – 5 Tahun / years” - 1
“6 – 10 Tahun / years” - 2
“11 – 15 Tahun / years” - 3
“16 Tahun ke atas / above” - 4
Q7 Salary “RM 900 – RM1500” - 1
“RM 1501 – RM2500” - 2
“RM 2501 – RM3500” - 3
“RM 3501 – RM4500” - 4
“RM4501 Ke atas / above” - 5

A STUDY ON TECHNOLOGY READINESS AND ACCEPTANCE OF SISTEM MAKLUMAT KASTAM (SMK) IN JABATAN KASTAM MALAYSIA
67
For section B to section D, each question is asked in coded as below method:
Table 3.7
Example of data coding for Section B, C and D questions
Question Coding
3. Secara umum, saya adalah antara yang
pertama dijadikan rujukan mengenai
sistem SMK di tempat kerja saya. (In
general, I was among the first in my
workplace that being made as reference
to SMK system.)
“Strongly Disagree” is coded as 1
“Disagree” is coded as 2
“Neutral” is coded as 3
“Agree” is coded as 4
“Strongly Agree” is coded as 5
3.6.4 Data Transcribing
Data transcribing is the last steps in data processing. The researchers will be
using the SMART PLS to convert information into data mode. The quality
of transcription can impact to the analysis quality (Stuckey, 2014). Even it
was time consuming but this step cannot be cut down, because the
researchers had to use this result for data analysis purposes.
3.7 Data Analysis
Data analysis is the method use to interpret the data result. It also as the process of
bringing order, structure and meaning to the mass of collected data.

A STUDY ON TECHNOLOGY READINESS AND ACCEPTANCE OF SISTEM MAKLUMAT KASTAM (SMK) IN JABATAN KASTAM MALAYSIA
68
3.7.1 Descriptive Analysis
Descriptive analysis is the method used to describe the basic information
features of the data in the study. It always provides a very simple summary
about the sample data and measurement (Trochim, 2006). With descriptive
analysis you are simply describe what the data show off. In this study, the
researchers will be using the descriptive analysis to explain the questions in
section A such as respondent’s demographic information. There are three
methods that can be use to describe the collected data, the researchers
organizing and summarizing the data in an informative way which are
frequency, percentage, and average. In order to make data easy to
understand, the data collected will be presented in the form of pie chart
which provided under Appendix N.
3.7.2 Scale Measurement
3.7.2.1 Reliability Test
According to Sekaran and Bougie (2012), reliability indicates how stable
and consistent the instruments measure the concept of the research.
Reliability test is conducted based on the data collected from the study. The
degree of the consistency over time and accuracy representation of the total
population for a study and is considered as reliable if a similar results of the
study can be reproduced by using a similar methodology (Golafshani, 2003).
In this research, in order to text the result reliability, the researchers decided
to use G power to determine the accuracy of the result. The result of the G
power stated that amount of samples needed to conduct the survey is 92 and
the researchers managed to get 106 samples which is already more than
enough to justify the result reliability.

A STUDY ON TECHNOLOGY READINESS AND ACCEPTANCE OF SISTEM MAKLUMAT KASTAM (SMK) IN JABATAN KASTAM MALAYSIA
69
3.8 Conclusion
In conclusion, this chapter described on how the research methodology had been
conducted by using questionnaire, data collection methods, sampling designs,
research instrument, construct measurement. In this chapter, the researchers will be
using the SMART PLS 3.2.6 and SPSS for data running, data analysis according to
the step constructed in the PLS. The researchers also using the G-power to get valid
and corresponding number of sample size that the researchers needs in the research.
Furthermore, a series of data interpreting will be carry out in detail in chapter 4.

A STUDY ON TECHNOLOGY READINESS AND ACCEPTANCE OF SISTEM MAKLUMAT KASTAM (SMK) IN JABATAN KASTAM MALAYSIA
70
Chapter 4.0 Research Result
4.0 Introduction
For the chapter before, the researchers had successfully identified those method that
need to be used to carry out this research study, ways to identify the sample size
and successfully prepared the questionnaires for the research study. At the same
time, the researchers also had carried out the data processing and the data collection
investigation steps. Meanwhile, in Chapter 4, the researchers will carry out an
examination of the data that had been collected and generated in the previous
chapter by assigning some difference patterns and analysis toward the result. Which
the output of the analysis will always interrelated to the research hypothesis and
research question which stated in first and second chapter. Hence, in this chapter,
the researchers will indicated the descriptive analysis of the data, Rating Outer
Model and etc. Followed by the discussion on the PLS regressions that had been
used to assists the researchers in testing the research model and hypothesis that had
made in the first chapter will be explained in deep.
4.1 Preliminary Analysis
In the previous chapter, the researchers had done processes the data, and it is been
checked for missing data, normality assumption multicollinearity and outliers. The
coming section will talk about the results for the common method and also the non-
responsive bias for this study.
4.1.1 Data Processing

A STUDY ON TECHNOLOGY READINESS AND ACCEPTANCE OF SISTEM MAKLUMAT KASTAM (SMK) IN JABATAN KASTAM MALAYSIA
71
Data processing is one of a step that used to delineate the data that had
prepare. In data processing process it contain some necessary steps such as,
data checking, data editing, data coding, and data transcribing. The special
data will also been specifying in the data processing step before the
researchers analyze on it.
The first step in the data processing is the have a data checking, the data
checking step plays an important role in this study, which help researcher to
make sure that all their questionnaire are fully answered by the respondents
and also double check on the data obtained from the questionnaires are
complete and without missing answer or data.
According to Zikmund, Babin, Carr, and Griffin (2013), the second step in
the data processing is data editing, which throughout this process, in order
to make the information from the questionnaire more consistency and
legibility, the researchers were required to do some scanning and editing the
information contained in the questionnaire. In order to let the questionnaire
become more perfect, consistent and free from mistake, the researcher have
the right to carry out some modification on the data when they discover
some answers or information are lacking.
Based on Field (2013), Due to certain reason such as lengthy questionnaire
or uninteresting questionnaire, respondents may accidentally missed some
of the question when they answering the questions. Some of the participants
are not willing to answer the question that they deem may affect them.
Besides, the author also recommended three ways of dealing with missing
data:
1. Listwise deletion: when there is a data missing, researcher may withdraw
the whole record from the study.

A STUDY ON TECHNOLOGY READINESS AND ACCEPTANCE OF SISTEM MAKLUMAT KASTAM (SMK) IN JABATAN KASTAM MALAYSIA
72
2. Pairwise removal: instead of removing the data, pairwise removal can
remain all the available data by ignoring the missing value.
3. Replace the missing score using an average score: calculate the average
score for the variable and the missing data will be replaced by the average
score.
In this research study, the researchers had use the listwise approach to deal
with the missing data. The initial sample size obtained from the Google Doc
are total 107 sets. After processed the data, the researchers found that 1 set
of the questionnaire contain missing data so it remain only 106 sets.
The third step of the data processing is data coding which help to
determining and categorize every information into both character symbol or
numeric score (Zikmund, Babin, Carr & Griffin, 2013).
4.1.2 Outlier detection
Anomaly detection also known as outlier detection, where it is a value for
the supplementary data set which are unlike usual and did not define the
characteristics of the data (Field, 2013). In statistics, an outlier can be
explained as a point of observation which is not closely related to any other
observations. Due to the errors in experiment or inconsistency of the
measurement that had been used, an outlier may occured. A weight
distribution tails of a population or either one of the measurement errors will
be shown when outliners occur. Thus, bias can occurred due to the outliers.
(Hair, 2014; Tabachnick & Fidell 2014). Hence, before the SEM analysis,
the researcher should remove or recoded the outliers first.

A STUDY ON TECHNOLOGY READINESS AND ACCEPTANCE OF SISTEM MAKLUMAT KASTAM (SMK) IN JABATAN KASTAM MALAYSIA
73
In order to determine the Outliers, the researchers had used multivariate
(Mahalanobis D2 distance) and also univariate detections such as
histograms, box-plots and standardised Z score. For univariate detection, in
addition to examining the box-plots and histograms each of the variables,
the researchers also done to examined the standardised (z) score. According
to Hair (2014). A large sample size, it only required a z > 4 in order for the
evidence of an extreme observation.
Next, the researchers will apply the multivariate detection to assist in
continue examined of the data. The researchers also will use the SPSS
Regressions that a case number will be given to serve as the dependent
variable, for those remaining non-demographic measure are categories as
independent variable in order for us to obtain the Mahalanobis D2 distances.
A potential multivariate outliners will come with a higher D2 values (>3.5)
(Hair, 2014). Based on the data we received, there is no outliner was
detected, as refer to table 4.2 below. All 106 set of data was included for our
analysis.
4.1.3 Normality analysis
Based on Field (2013), In order to explore the assumption for the data
normality, the researchers will adopt the Shapiro-Wilk and Kolmogorov-
Smirnov test. When the outcome of this test is not significant (p> 0.05) then
it indicated that the distribution is normal and if the outcome is significant
(p <0.05) means that the distribution of the question is not normal. On the
other hand, with a sample size that is large it can guide us to important
judgements in the second test signal as an alternative for the normal
distribution. Therefore, in order for us to determining on the normal

A STUDY ON TECHNOLOGY READINESS AND ACCEPTANCE OF SISTEM MAKLUMAT KASTAM (SMK) IN JABATAN KASTAM MALAYSIA
74
distribution, the skewness and kurtosis statistics has been used. If the
outcome of the Kolmogorov-Smirnov test are significant (p <0.05) so it
pointed out that the question may not be normal. At the same time, the
researchers also carried out the statistical skewness and kurtosis where the
researchers had included the statistical results of skewness and kurtosis in
the Appendix K. As refer to the table in the appendix, in pointed out that
most of the question is normal, but there is still some of them is abnormal.
But if the distribution is not normal, it did not affect our analysis if we used
PLS base SEM (Weston, Paual, & Gore, 2006). Since, the unusual
distribution can be study by using the SEM-PLS, so changes on the data
fulfill the assumption of normality were not required.
4.1.4 Multicollinearity analysis
As to perform the multicollinearity analysis, the researchers had use the
IBM SPSS Statistics software to calculate the correlation matric for all the
variable, in order for us to obtain the Variance Inflation Factor (VIF) values.
The reason to use this software is because the Smart PLS has not providing
us the VIF value. The researchers are necessary to have a VIF value that is
5 or lower so that the collinearity problem can be avoided because this is the
rule of thumb of the Variance Inflation Factor (VIF) values (Hair, Ringle,
& Sarstedt, 2011). So, the outcome indicated that there was insufficient
evidence of multicollinearity (refer to the table 4.3).

A STUDY ON TECHNOLOGY READINESS AND ACCEPTANCE OF SISTEM MAKLUMAT KASTAM (SMK) IN JABATAN KASTAM MALAYSIA
75
4.1.5 Common Method Bias
As refer to Podsakoff, MacKenzie, Lee, and Podsakoff (2003), during the
time researcher conduct their studies, the participants provided the
information related to the criterion variables and the two predictors, it may
happen the methods similar bias. In order to reduce the bias, it is necessary
for us to keep the respondent’s responses unidentified and convince them
by letting them know that there is no standard answers. This is to let them
answer the question more freely, and the answer they provided would be as
honest as they can. (Dinev and Hart, 2006; Podsakoff et al 2003.)
The researchers must let all the respondents aware that the answers they
provided will be a private and confidential. This will motivate the
respondents to participate and provide their unbiased and meaningful
answer to us. The private and confidential information will be written in the
cover of the questionnaire before distributing the questionnaire to the
respondents. Furthermore, Harman single factor test will be carried out after
the researchers had collected the data, mainly because this test will assists
us in determining some of the potential effects-of the-usual-methods of
weight (Harman 1967). It’s also help us to determine the same variance in
the design research methods. (Malhotra et al. 2006). This test also help us
indicated whether a single factor will be seem from the analysis of the
factors. When one common factor is occurs, this means there are majority
of the covariance of dependent as well as independent variables (Aulakh &
Kotabe, 1997; Pavlou & Gefen, 2005; Podsakoff & Organ 1986).
To have a strong evidence for the common method bias, the analysis that
the researchers perform must use a single factor that obtain from the large
amount of factors to clarify the variance in the data. Which the common

A STUDY ON TECHNOLOGY READINESS AND ACCEPTANCE OF SISTEM MAKLUMAT KASTAM (SMK) IN JABATAN KASTAM MALAYSIA
76
method bias has been supported with a strong evidence. As a hypothesis, the
researchers inserted all the variables for a model to run an exploratory factor
analysis. Meanwhile, the unrotated factors helps the researchers to define
the amount of factors that must be included to the differences in variables.
Based on the outcomes, it indicated that the unrotated factor analysis was
80.25% of the total variance. (See Appendix L). In short, the researchers can
defined that the results was not influenced by the responses of the
respondents.
4.1.6 Non Responsive Bias
Non-response bias can be considered as one of the problems that the
researchers commonly face during the time the researchers performed the
survey methodology (Armstrong & Overton, 1977). The validity of the
survey could be threaten if our survey contained non-response bias (Cook,
Dickinson, & Eccles, 2009). During this research, the researchers had used
the method of assimilating between those early respondents and those late
respondents on those important demographic variables and reaction on the
key constructs to check on the non-response bias which this method is
created by the Armstrong and Overton (1977).
For the analysis, all the respondents were obtained from the Google Doc,
and the respondents were required to answer the questionnaire via internet.
Thus, 2 weeks were used by the researchers in order to obtain the data of all
the respondents from the Google Doc and there was no non-responsive bias
in our study.

A STUDY ON TECHNOLOGY READINESS AND ACCEPTANCE OF SISTEM MAKLUMAT KASTAM (SMK) IN JABATAN KASTAM MALAYSIA
77
4.1.7 Analysis Demographic profile respondents.
Table 4.1 will indicated the detailed information of all the custom officer’s
demographics profile who participated in the data collection process.
Table 4.1
Respondent’s demographic profile for Jabatan Kastam Malaysia.
Frequency Percent
Male 44 41.5
Female 62 58.5
Total 106 100.0
21-30 32 30.2
31-40 46 43.4
41-50 22 20.8
51-60 6 5.7
Total 106 100.0
Single 30 28.3
Married 72 67.9
Others 4 3.8
Total 106 100.0
SPM 78 73.6
STPM / Diploma 10 9.4
Degree 16 15.1

A STUDY ON TECHNOLOGY READINESS AND ACCEPTANCE OF SISTEM MAKLUMAT KASTAM (SMK) IN JABATAN KASTAM MALAYSIA
78
Frequency Percent
Male 44 41.5
Female 62 58.5
Total 106 100.0
Others 2 1.9
Total 106 100.0
Continued
Frequency Percent
WK19-WK26 82 77.4
WK27-WK32 8 7.5
WK41-WK44 14 13.2
WK48-WK52 2 1.9
Total 106 100.0
1 year- 5 years 14 13.2
6 years- 10 years 26 24.5
11 years- 15 years 14 13.2
16 years and above 52 49.1
Total 106 100.0
RM900-RM1500 2 1.9
RM1501-RM2500 30 28.3
RM2501-RM2500 14 13.2
RM3501-RM4500 48 45.3
RM4501 and above 12 11.3
Total 106 100.0
Source: Generate from SPSS version.

A STUDY ON TECHNOLOGY READINESS AND ACCEPTANCE OF SISTEM MAKLUMAT KASTAM (SMK) IN JABATAN KASTAM MALAYSIA
79
Based on the table 4.1 it clearly shown the gender of the participants in the
survey from the Jabatan Kastam Malaysia. In total, there are total 106
respondents who participate in this survey, which including of 44 male
participants (41.5%) and 62 female participants (58.5%). Next, is about the
respondent’s marital status for the Jabatan Kastam Malaysia. Majority of the
respondents are married which were up to 72 (67.9%) out of 106
respondents, and the remaining (31.8%) were those 30 respondents who
were single and 4 respondents who are maybe they are already engaged or
etc.
In the Educational level aspect, Over half of the respondents which was 78
(73.6%) of the respondents were only have the qualifications of SPM maybe
because they have a longer working experience which they had joined
Jabatan Kastam since they are young. There were 16 respondents (15.1%)
who have a bachelor’s degrees and others 10 respondents (9.4%) having the
qualifications of STPM/ Diploma. The remaining 2 respondents (1.9%) who
chosen others qualification such as UPSR, or PMR. About the position
grade, Most of the respondents were fall into the categories of the lowest
position grade which was WK19-WK26 which consists of 82 respondents
(77.4%) and followed by the next position which is WK27-WK32 and its
consists of 8 respondents (7.5%) and the second highest position WK41-
WK44 which consists of 14 respondents (13.2%) and lastly the highest
position consists of 2 respondents (1.9%).
Related to the length of period of services, majority of the respondents had
worked more than 16 years which was 52 respondents (49.1%), followed by
26 respondents (24.5%) which were in the range of 6-10 years, and the
remaining 1-6 years and 11-15years it both give an equal amount of
respondents which is 14 (13.2%). Lastly, about the salary range, because it
is a government sector, most of the respondents are fail in the salary range
of RM3501-RM4500 which have total 48 respondents (45.3%) and followed
by 30 respondents (28.3%) who fall in the salary range of RM1501-RM2500,

A STUDY ON TECHNOLOGY READINESS AND ACCEPTANCE OF SISTEM MAKLUMAT KASTAM (SMK) IN JABATAN KASTAM MALAYSIA
80
salary between RM2501-RM3500 and RM4500 above are 14 (13.2%) and
12 (11.3%) respondents and at last, there are only 2 respondents (1.9%) who
are in the salary range between RM900-RM1500.
All the above, demographic profile, the researchers already prepare the pie
chart and histogram in order to assist to have a clear view of the
demographic profile for the respondents. (See Appendix N)
4.1.8 Analysis descriptive statistics of study variables
Table 4.2
Summary of descriptive statistics of the study variables
Descriptive Statistics
N Minimum Maximum Mean Std. Deviation
Optimism 106 2.10 5.00 3.7811 .79272
Innovativeness 106 2.00 5.00 3.8208 .83789
Discomfort 106 2.56 5.00 3.5482 .48281
Insecurity 106 2.11 5.00 3.1583 .58993
User satisfaction 106 1.33 5.00 3.6981 .88554
Perceived ease of use 106 2.00 5.00 3.9682 .78434
Valid N (listwise) 106
Table 4.2 indicated the standard deviation and the mean for each of the
variable in our study. For the dependent variable, as referring to the mean
for the Optimism among the custom officers, there are 75.6% of the custom
officers are optimism toward the SMK, while their standard deviation is
0.79. While for the Innovativeness among the custom officers toward the
SMK there is 76.4% of the custom officers are innovativeness, and the
standard deviation is the 0.84.

A STUDY ON TECHNOLOGY READINESS AND ACCEPTANCE OF SISTEM MAKLUMAT KASTAM (SMK) IN JABATAN KASTAM MALAYSIA
81
In additional, the level of discomfort of the custom officers toward the SMK
is 71% which is the second lowest among the others variable, meanwhile,
the standard deviation for the discomfort is 0.48. For the last dependent
variable, indicate the insecurity level of the custom officers is the lowest of
63.16% and the standard deviation is 0.59.
While for the moderator of our study, perceived ease of use among the
custom officers toward is SMK is 79.36% and the standard deviation is 0.78
and lastly for the user satisfaction, there is only 73.96% of the custom
officers feel satisfaction toward the SMK system, and the standard deviation
it gave is 0.89.
4.2 Rating Outer Model (Measurement Model)
In this study, the researchers had used the Smart PLS version 3.2.6 to do the testing
on our hypothesis. The PLS is another method that to be used to analysis on the
SEM based variance. By using this it will benefited with assumptions can be
eliminated and the relatively small sample size can be estimated as well. The
software that had been used in this research is Smart PLS Program Version 3.2.6,
which this program are useful to estimate the structural equations with the basis of
the variance. This software can be easily obtained through the internet. There are 3
important criteria that the researchers must know before considering the outer
model which are convergent validity, composite-discriminant-validity as well as
reliability (Ghozali, 2008; Hair, Hult, Ringle, & Sarstedt 2016). Full depictions of
the SEM to evaluate outer Smart PLS model as shown as below.

A STUDY ON TECHNOLOGY READINESS AND ACCEPTANCE OF SISTEM MAKLUMAT KASTAM (SMK) IN JABATAN KASTAM MALAYSIA
82
Figure 4.1 Path coefficients among the Independent variables, and dependent
variable.
Note: Discomfort (D), Innovativeness (IN), Insecurity (INS), Optimism (OP),
Perceived ease of use (PEU), User satisfaction (USER)
The Figure 4.1 indicated the factors that will affect the user satisfaction of the SMK
among the employee in the Jabatan Kastam Malaysia which are optimism,
innovativeness, discomfort and insecurity which are measured by few indicators on
each. OP1, OP2, OP4, OP5, OP6, OP7, OP8, OP9, OP10 are the indicators for
optimism. IN1, IN2, IN3, IN4, IN5, IN6, IN7 are the indicators for innovativeness.
D1, D8 are the indicators for discomfort. Lastly, INS2, INS3, INS4, INS5, INS8,
are the indicators for insecurity. Hence, perceived ease of use is measured by seven
indicators which are PEU1, PEU2, PEU3, PEU4, PEU5, PEU6, and PEU7. User
satisfaction is measured by 3 indicators, namely USER1, USER2, and USER3. The

A STUDY ON TECHNOLOGY READINESS AND ACCEPTANCE OF SISTEM MAKLUMAT KASTAM (SMK) IN JABATAN KASTAM MALAYSIA
83
relationships of those hypothesis are pointed by arrows between the variable, which
the perceived ease of use act as the moderator for this study. Throughout this
analysis, the researchers had deleted 12 indicators in order to make our model fit
which are OP3, D2, D3, D4, D5, D6, D7, D9, INS1, INS6, INS7, and INS9. Based
on Hair et al. (2016), In order to get a fit model, 25% of the indicators can be remove.
4.3 Measurement Model
Before the researchers run the hypothesis test, it is necessary to have a checking on
the measurement model. This can help to ensure that our model is fit by having this
assessing on the measurement model accurateness. The validity of the measurement
is the reason why we need the measurement model analysis, which this will directly
affect the underlying theoretical constructs.
4.3.1 Testing Outer Model (Measurement Model)
The Outer Assessment Model (Measurement Models) consists three criteria
which is Convergent Validity, Discriminant Validity and Composite
Reliability. (Ghozali, 2008; Hair et al., 2016). From the figure 4.1, it shows
the full structural equation model to assess outer Smart PLS models by using
version 3.2.6.

A STUDY ON TECHNOLOGY READINESS AND ACCEPTANCE OF SISTEM MAKLUMAT KASTAM (SMK) IN JABATAN KASTAM MALAYSIA
84
Table 4.3
Reliability of Constructs
Constructs Items Loadings CR AVE VIF
Discomfort D1 0.893 0.852 0.742 2.661
D8 0.828
Innovativeness IN1 0.833 0.935 0.674 2.363
IN2 0.665
IN3 0.867
IN4 0.857
IN5 0.838
IN6 0.85
IN7 0.818
Insecurity INS2 0.677 0.884 0.609 1.498
INS3 0.903
INS4 0.866
INS5 0.813
INS8 0.601
Optimism OP1 0.828 0.971 0.79 2.275
OP2 0.891
OP4 0.873
OP5 0.896
OP6 0.929
OP7 0.892
OP8 0.923
OP9 0.844
OP10 0.92
Perceived PEU1 0.93 0.985 0.901 1
ease of use PEU2 0.922
PEU3 0.962
PEU4 0.973

A STUDY ON TECHNOLOGY READINESS AND ACCEPTANCE OF SISTEM MAKLUMAT KASTAM (SMK) IN JABATAN KASTAM MALAYSIA
85
PEU5 0.977
PEU6 0.96
Continued
Constructs Items Loadings CR AVE VIF
PEU7 0.919
User USER1 0.955 0.97 0.916
satisfaction USER2 0.956
USER3 0.961
Source: Data Processing Smart PLS (2017)
Note: Discomfort (D), Innovativeness (IN), Insecurity (INS), Optimism (OP),
Perceived ease of use (PEU), User satisfaction (USER)
The outer models variables is discomfort, innovativeness, insecurity,
optimism, perceived ease of use can be seen as in the Table 4.3. In the entire
construct indicators, the value convergent validity must with loading factor
more than 0.5. In figure 4.1, we can concluded that the all data is valid and
fit. In Table 4.3, the loading results for all the variables were more than 0.6
which mean that the all variables in this research were fully reliable.
In order to demonstrate the correlation between the variable, we had used
the divergent validity test, if the cross correlation values loading latent
variables greater than the correlation on the other latent variables, the cross
correlation value loading all indicators used in forming latent variables
declared unacceptable. Table 4.3 shows that the loading cross correlation
values respectively the variables.

A STUDY ON TECHNOLOGY READINESS AND ACCEPTANCE OF SISTEM MAKLUMAT KASTAM (SMK) IN JABATAN KASTAM MALAYSIA
86
Table 4.4
Cross Loading
Item IN INS OP PEU USER D
D1 0.786 -0.508 0.685 0.76 0.604 0.893
D8 0.409 -0.436 0.504 0.609 0.584 0.828
IN1 0.833 -0.387 0.688 0.611 0.603 0.606
IN2 0.665 -0.22 0.528 0.364 0.348 0.412
IN3 0.867 -0.385 0.618 0.524 0.561 0.484
IN4 0.857 -0.414 0.523 0.646 0.516 0.623
IN5 0.838 -0.377 0.408 0.601 0.473 0.593
IN6 0.85 -0.522 0.678 0.666 0.656 0.738
IN7 0.818 -0.422 0.447 0.549 0.473 0.584
INS2 -0.361 0.677 -0.422 -0.296 -0.368 -0.32
INS3 -0.4 0.903 -0.442 -0.525 -0.565 -0.497
INS4 -0.367 0.866 -0.4 -0.467 -0.454 -0.509
INS5 -0.4 0.813 -0.371 -0.455 -0.455 -0.407
INS8 -0.376 0.601 -0.297 -0.385 -0.352 -0.379
OP1 0.527 -0.319 0.828 0.588 0.555 0.614
OP10 0.633 -0.44 0.92 0.601 0.652 0.579
OP2 0.57 -0.378 0.891 0.626 0.642 0.569
OP4 0.581 -0.534 0.873 0.591 0.635 0.685
OP5 0.535 -0.384 0.896 0.619 0.579 0.662
OP6 0.635 -0.412 0.929 0.625 0.674 0.629
OP7 0.667 -0.433 0.892 0.616 0.7 0.601
OP8 0.59 -0.534 0.923 0.644 0.684 0.642
OP9 0.667 -0.498 0.844 0.64 0.73 0.614
PEU1 0.681 -0.613 0.682 0.93 0.867 0.744
PEU2 0.6 -0.58 0.692 0.922 0.795 0.762
PEU3 0.663 -0.491 0.612 0.962 0.812 0.768

A STUDY ON TECHNOLOGY READINESS AND ACCEPTANCE OF SISTEM MAKLUMAT KASTAM (SMK) IN JABATAN KASTAM MALAYSIA
87
PEU4 0.662 -0.51 0.65 0.973 0.793 0.748
PEU5 0.669 -0.514 0.628 0.977 0.796 0.769
Continued
Item IN INS OP PEU USER D
PEU6 0.695 -0.521 0.657 0.96 0.809 0.779
PEU7 0.698 -0.469 0.692 0.919 0.771 0.754
USER1 0.644 -0.548 0.731 0.857 0.955 0.741
USER2 0.588 -0.503 0.706 0.794 0.956 0.606
USER3 0.609 -0.589 0.664 0.786 0.961 0.624
Source: Data Processing Smart PLS (2017)
Note: Discomfort (D), Innovativeness (IN), Insecurity (INS), Optimism (OP),
Perceived ease of use (PEU), User satisfaction (USER)
Table 4.5
Construct Correlations (Diagonal Elements are Square Roots of the AVE)
IN INS OP PEU USER D
IN 0.821
INS -0.485 0.78
OP 0.676 -0.492 0.889
PEU 0.703 -0.558 0.695 0.949
USER 0.642 -0.571 0.733 0.85 0.957
D 0.715 -0.55 0.699 0.801 0.689 0.861
Source: Data Processing Smart PLS (2017)
Note: Discomfort (D), Innovativeness (IN), Insecurity (INS), Optimism (OP),
Perceived ease of use (PEU), User satisfaction (USER)
As refer to the table 4.5 clearly indicated the square root AVE value for
individual construct is more than 0.5 so the divergent validity was all been
achieved. Besides, the table also pointed out that all variable also have a

A STUDY ON TECHNOLOGY READINESS AND ACCEPTANCE OF SISTEM MAKLUMAT KASTAM (SMK) IN JABATAN KASTAM MALAYSIA
88
greater value as compare to other constructs of their square root AVE value.
As conclusion, the criteria for the Partial Test Least Square Models with
Outer size (Measurement Model) had all been met in this study.
4.3.2 Testing Inner Model
Table 4.6
Inner Model Results by size of R-Square
Variable R-Squared
Included
R-squared
Excluded f-squared
Effect
size
User
satisfaction 0.723 0.703 0.0722 Small
Source: Data Processing Smart PLS (2017)
R Square used to identify the coefficient for determination in the dependent
constructs. Based on Chin (1998), for a strong R square we need 0.67, while
for moderate we need 0.33 and for a weak R square we need 0.19. But,
according to Hair et al. (2016), the R square of 0.75 is very strong, while 0.5
is strong, and 0.25 is weak. Based on these study, the R square for our study
is strong enough (0.723).
Yet, the researchers still have to know on the F Square in order to know
about the power of this model. The purpose to have this Effect Size (f
square) is to help use to determine a good model. After the researchers
calculated the excluded and included R square, the researchers will know
how big is the effect size (see Appendix U for the included and excluded R
square).
By referring to the table 4.6, the User satisfaction has a small effect size, In
short, the researchers knew that the model had meet the requirement of the
Inner Model by referred to the measurement requirement for the Inner
Model.

A STUDY ON TECHNOLOGY READINESS AND ACCEPTANCE OF SISTEM MAKLUMAT KASTAM (SMK) IN JABATAN KASTAM MALAYSIA
89
4.4 Structural Model
The output for the hypothesis testing with the bootstrapping was obtained by using
the Smart PLS version 3.2.6 software. Figure 4.2 as shown as below is the test result
the researchers obtained.
Figure 4.2 T-value among the dependent variables and independent variables.
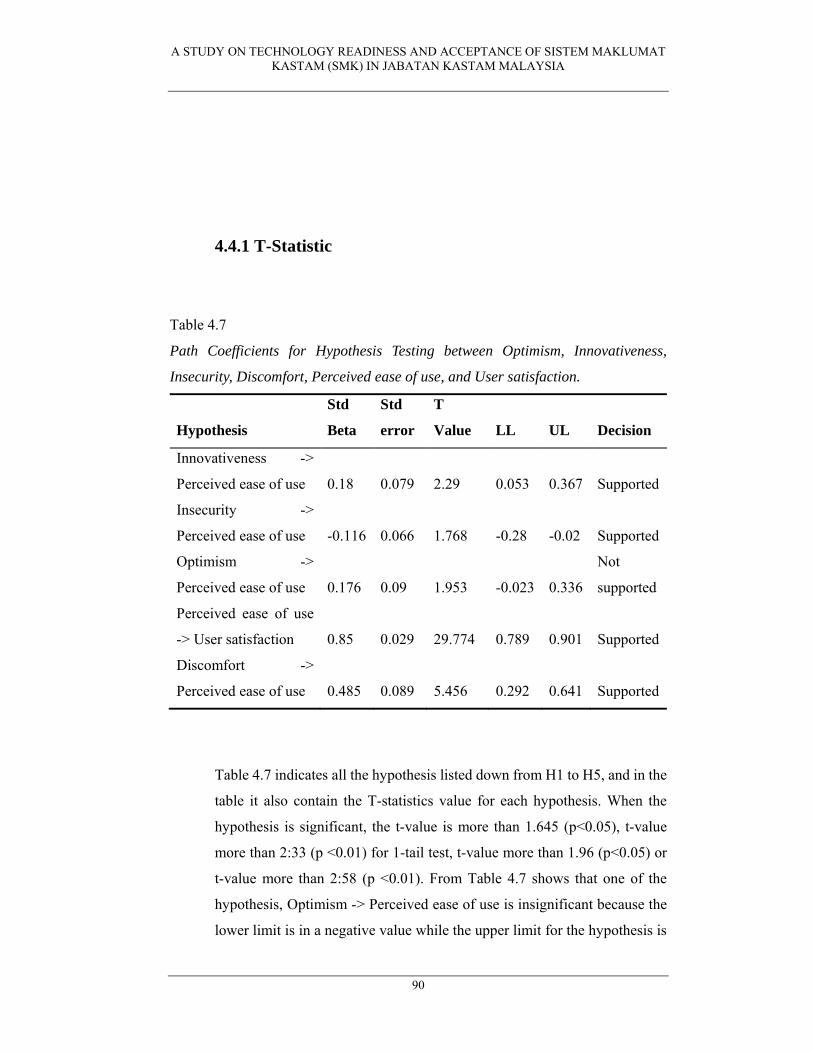
A STUDY ON TECHNOLOGY READINESS AND ACCEPTANCE OF SISTEM MAKLUMAT KASTAM (SMK) IN JABATAN KASTAM MALAYSIA
90
4.4.1 T-Statistic
Table 4.7
Path Coefficients for Hypothesis Testing between Optimism, Innovativeness,
Insecurity, Discomfort, Perceived ease of use, and User satisfaction.
Hypothesis
Std
Beta
Std
error
T
Value LL UL Decision
Innovativeness ->
Perceived ease of use 0.18 0.079 2.29 0.053 0.367 Supported
Insecurity ->
Perceived ease of use -0.116 0.066 1.768 -0.28 -0.02 Supported
Optimism ->
Perceived ease of use 0.176 0.09 1.953 -0.023 0.336
Not
supported
Perceived ease of use
-> User satisfaction 0.85 0.029 29.774 0.789 0.901 Supported
Discomfort ->
Perceived ease of use 0.485 0.089 5.456 0.292 0.641 Supported
Table 4.7 indicates all the hypothesis listed down from H1 to H5, and in the
table it also contain the T-statistics value for each hypothesis. When the
hypothesis is significant, the t-value is more than 1.645 (p<0.05), t-value
more than 2:33 (p <0.01) for 1-tail test, t-value more than 1.96 (p<0.05) or
t-value more than 2:58 (p <0.01). From Table 4.7 shows that one of the
hypothesis, Optimism -> Perceived ease of use is insignificant because the
lower limit is in a negative value while the upper limit for the hypothesis is

A STUDY ON TECHNOLOGY READINESS AND ACCEPTANCE OF SISTEM MAKLUMAT KASTAM (SMK) IN JABATAN KASTAM MALAYSIA
91
in a positive value, so the hypothesis had become insignificant. Meanwhile,
for all the remaining hypothesis were supported.
4.5 Conclusion
In this chapter, different types of test and analysis have carried out in order for the
researchers to have an observation on the collected data for the questionnaire such
as Normality analysis and Multicollinearity analysis. As the outcome for this
chapter, the researchers had identified that there was only 1 hypothesis or variable
which was not supported in this study which was optimism. However, for the
remaining variables, the result shown that they were all having a significant positive
and negative relationship. Therefore, the outcome of this chapter which is the
analysis result and interpretations of the result will be use in the chapter to have a
further discussion in the next chapter along with the recommendation for the future
study and determining the impact of this study nad develop a conclusion in total for
these research study.

A STUDY ON TECHNOLOGY READINESS AND ACCEPTANCE OF SISTEM MAKLUMAT KASTAM (SMK) IN JABATAN KASTAM MALAYSIA
92
CHAPTER 5: DISCUSSION AND CONCLUSION
5.0 Introduction
In this chapter, the researchers will draw a conclusion and discussion for the
research project that had been conducted. At first, the researchers made a
summarization on the demographic profile statistic, scale measurement, central
tendencies and inferential analysis in this chapter. There are several limitations the
researchers had found while doing this research. The researchers also had provided
the recommendations for the future study with similar methodology and topic.

A STUDY ON TECHNOLOGY READINESS AND ACCEPTANCE OF SISTEM MAKLUMAT KASTAM (SMK) IN JABATAN KASTAM MALAYSIA
93
5.1 Summary of Statistical Analysis
5.1.1 Descriptive Analysis
5.1.1.1 Summary of Study Variables
Table 5.1
Descriptive Statistics
N Minimum Maximum Mean Std. Deviation
Optimism 106 2.10 5.00 3.7811 .79272
Innovativeness 106 2.00 5.00 3.8208 .83789
Discomfort 106 2.56 5.00 3.5482 .48281
Insecurity 106 2.11 5.00 3.1583 .58993
User satisfaction 106 1.33 5.00 3.6981 .88554
Perceived ease of
use 106 2.00 5.00 3.9682 .78434
Valid N (listwise) 106
Based from the table 5.1, for both optimism and innovativeness level of the
custom officers towards the SMK system was 76%. Therefore, Jabatan
Kastam Malaysia still have 24% to improve in their officers’ optimism and
innovativeness level. For user’s discomfort level, the system achieved 71%
which clearly shown that Jabatan Kastam Malaysia must improve their
system in order to decreases the officers discomfort level when using the
systems. This may be due to the reasons that the officers perceived they were
being pushed to works even at home and caused the feeling of discomfort to
emerge. Furthermore, as seen in the table, the security level for SMK is good
where the custom officers have 63% of insecurity towards the system. In
addition, although the system able to provide the custom officers with 74%

A STUDY ON TECHNOLOGY READINESS AND ACCEPTANCE OF SISTEM MAKLUMAT KASTAM (SMK) IN JABATAN KASTAM MALAYSIA
94
satisfaction, it still has 26% to improve in order to achieve full satisfaction.
Lastly, referring to the table, the officers perceived that the SMK systems
was easy to use where it was having 79%. However, the researchers cannot
deny that the system still got 21% to improve in order to be perceived as
easy to use by all the custom officers.
5.1.1.2 Summary of Demographic Profiles
The demographic profile from this research shows the 106 respondents,
majority of them are female respondents, which are 58.5% and male
respondents with 44%. For the marital status, majority of the respondents
had married, which are 67.9%, while 28.3% respondents are single and 3.8%
for others. Next, from the result of our research, most of the respondents are
SPM holders which are 73.6%, followed by Degree holders 15.1%. The
other respondents are STPM/Diploma holder with 9.4% and lastly the other
respondents are 1.9%.
Besides, in the position grade, most of the respondents are in the lowest
position grade which is WK19-WK26, 77.4%., then followed with the
second highest position which is WK41-WK44, 13.2%. The result shows
there is 7.5% respondents are in the position WK27-WK32, and lastly 1.9%
respondents are in position WK48-WK52.
In addition, based on our research, majority of the respondents are work for
more than 16 years, which is consist of 49.1%, followed by the respondents
who work between 6-10 years, which is 24.5%, and both the respondents
who work between 1-5 years and 11-15 years have a same percentage which
is 13.2%. Finally, for the salary range, most of the respondents receive the
salary between RM3501-RM4500 which is 45.3%, followed by 28.3% of
respondents receive salary between RM1501-RM2500, 13.2% respondents
receive salary RM4500 and above and the least salary range is between
RM900-RM1500 which is 1.9% respondents.
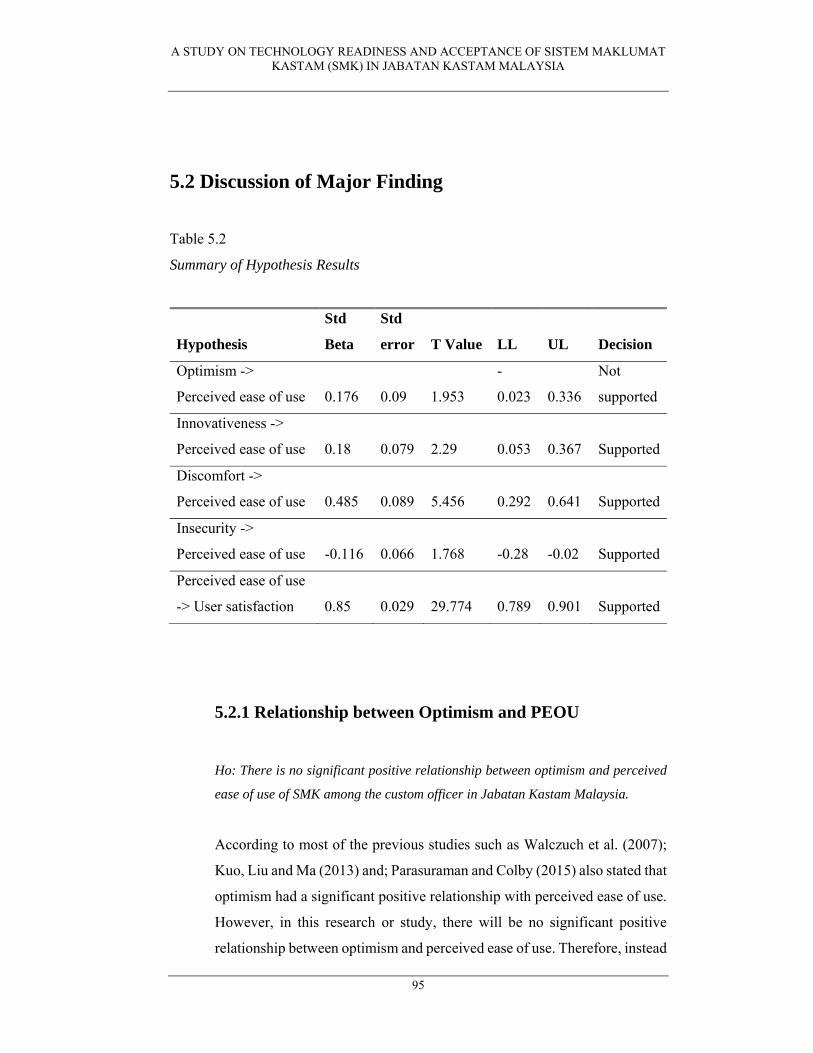
A STUDY ON TECHNOLOGY READINESS AND ACCEPTANCE OF SISTEM MAKLUMAT KASTAM (SMK) IN JABATAN KASTAM MALAYSIA
95
5.2 Discussion of Major Finding
Table 5.2
Summary of Hypothesis Results
Hypothesis
Std
Beta
Std
error T Value LL UL Decision
Optimism ->
Perceived ease of use 0.176 0.09 1.953
-
0.023 0.336
Not
supported
Innovativeness ->
Perceived ease of use 0.18 0.079 2.29 0.053 0.367 Supported
Discomfort ->
Perceived ease of use 0.485 0.089 5.456 0.292 0.641 Supported
Insecurity ->
Perceived ease of use -0.116 0.066 1.768 -0.28 -0.02 Supported
Perceived ease of use
-> User satisfaction 0.85 0.029 29.774 0.789 0.901 Supported
5.2.1 Relationship between Optimism and PEOU
Ho: There is no significant positive relationship between optimism and perceived
ease of use of SMK among the custom officer in Jabatan Kastam Malaysia.
According to most of the previous studies such as Walczuch et al. (2007);
Kuo, Liu and Ma (2013) and; Parasuraman and Colby (2015) also stated that
optimism had a significant positive relationship with perceived ease of use.
However, in this research or study, there will be no significant positive
relationship between optimism and perceived ease of use. Therefore, instead

A STUDY ON TECHNOLOGY READINESS AND ACCEPTANCE OF SISTEM MAKLUMAT KASTAM (SMK) IN JABATAN KASTAM MALAYSIA
96
of in agreement with previous studies done by past researchers, the
researchers had to disagree with the statement that the more optimistic an
individual, the more likely an individual will perceived a particular
technology to be easy to use.
This is because, optimism was known as an attitude or mood of a particular
person which associated with the expectation of future material or social
(Luthans et al., 2008). However, in this study, the custom officers were
required to use the SMK systems even if they do not have the mood or
attitude to use it. Therefore, the researchers assume that this may be the
reason why there is no significant relationship between optimism and
perceived ease of use in this study.
5.2.2 Relationship between Innovativeness and PEOU
H1: There is a significant relationship positive relationship between
innovativeness and perceived ease of use of SMK among the custom officers in
Jabatan Kastam Malaysia.
The result of the research or study shown that, innovativeness has a
significant positive relationship with perceived ease of use. In order words,
the more innovative a particular custom officer is, the more perceived ease
of use he or she perceived towards the SMK systems. Moreover, the results
of the relationship between innovativeness and perceived ease of use are
consistent or in agreement with previous studies or research such as
Agarwal and Prasad (1998); and Kwon, Choi and Kim (2007). Besides that,
individual who are early adopters of innovative technology will more likely
to use the technology even if the benefits or advantages of the technology
were ambiguous (Walczuch et al., 2007; Nik Abdullah, 2012; Wang et al.,
2016).
This was supported by Chen and Chen’s (2009); and Chen et al.’s (2014)
studies where individual with higher personal innovativeness tend to be

A STUDY ON TECHNOLOGY READINESS AND ACCEPTANCE OF SISTEM MAKLUMAT KASTAM (SMK) IN JABATAN KASTAM MALAYSIA
97
have more effect on perceived ease of use. This is because, this category of
people tends to be eager and willingly to try new technologies and motivated
to understand any new features provided by new technologies (Kuo et al.,
2013). Furthermore, as nowadays, more and more people including custom
officers were at ease with technologies such as smart phones. Therefore, as
proved in this study, innovativeness clearly had a significant positive
relationship with the perceived ease of use.
5.2.3 Relationship between Discomfort and PEOU
H1: There is a significant negative relationship between discomfort and perceived
ease of use of SMK among the custom officers in Jabatan Kastam Malaysia.
According to the above table 5.2, the results of the research or study shown
that discomfort has a significant negative relationship with perceived ease
of use. The result also are in agreement and consistent with past researches
such as Venkatesh et al. (2003) and Lu et al. (2012). The study implied that
if a custom officer perceived SMK system to be discomfort, that particular
custom officer also may perceived the SMK system to be difficult to use.
Discomfort custom officers also may had been adapted to current
technologies, therefore, this will directly affect the custom officers’
intention to use new technologies (Kuo et al., 2013). For example, in the
past, Jabatan Kastam Malaysia had been using the traditional method for
goods declarations before implementing the SMK system. The
implementation of SMK systems by Jabatan Kastam Malaysia started 20
years ago and the system undergo constant update with the latest update fall
on 19th June 2017. Therefore, custom officers who high in discomfort may
find he or she having difficulty in adapting to this changes and perceived
the use of SMK systems requiring a lot of efforts.

A STUDY ON TECHNOLOGY READINESS AND ACCEPTANCE OF SISTEM MAKLUMAT KASTAM (SMK) IN JABATAN KASTAM MALAYSIA
98
5.2.4 Relationship between Insecurity and PEOU
Hl: There is a significant negative relationship between insecurity and perceived
ease of use of SMK among the custom officers in Jabatan Kastam Malaysia.
Based from the above table 5.2, the result of the study or research shown
that, insecurity had a significant negative relationship with perceived ease
of use. The result of this variables was within the expectation of the
researchers. This is because, the more insecurity a custom officer possess,
the more likely that particular custom officer will perceived the SMK
system to be complicated to use. Furthermore, custom officers who had a
sense of technological insecurity may always worry about the negative
consequences provided by the system as they do not have enough trust
towards the system. For instance, custom officers who scored high in
insecurity will always concern about whether the system will leaked any
private information to other parties and this may cause the officers to be
incapable to perform well and use the SMK system effectively. This
relationship had been supported by past researchers such as Nik Abdullah
(2012) and Hemdi et al. (2016) where insecurity will have a significant
negative relationship with user’s perceived ease of use.
5.2.5 Relationship between PEOU and User satisfaction
H1: There is a significant positive relationship between perceived ease of use and
user’s satisfaction of using SMK among the custom officers in Jabatan Kastam
Malaysia.
According to the result of the study or research, perceived ease of use has a
significant positive relationship with user satisfaction. This further
confirmed the study done by past researchers such Suki and Ramayah

A STUDY ON TECHNOLOGY READINESS AND ACCEPTANCE OF SISTEM MAKLUMAT KASTAM (SMK) IN JABATAN KASTAM MALAYSIA
99
(2010); Tu, Fang and Lin (2012); Sibona and Choi (2012); Kuo, Liu and Ma
(2013); and Shih and Lee (2014) where the researchers argued that
perceived ease of use had a positive effect on user’s satisfaction.
In practical, the custom officers were required to use the SMK system to
undergo their everyday job task such as declaration of goods instead of using
the classic documentation method. Next, the moment Jabatan Kastam
Malaysia implemented these changes, the officers were resistance towards
the changes as they perceived the use of technology is difficult and may
need to spend more time in doing the jobs. Therefore, it is critical that the
SMK system is design to be easy to use by the officers. This is because,
when the SMK system was perceived as easy to use by the officers, it will
directly increases their satisfaction in using the system. This statement was
supported in Muslim Amin et al.’s (2014) study, where the researcher stated
that whenever a particular individual perceived the system to be easy to use,
and the satisfaction level of the user will increases.
5.3 Implication of the Study
5.3.1 Theoretical Implication
Based from the theoretical point of view, the researchers figure out that this
study or research had contributed to the knowledge of applying Technology
Readiness Index (TRI) and Technology Acceptance Model (TAM) in
predicting the custom officers’ satisfaction and acceptance of the newly
updated SMK systems. Furthermore, as expected by the researchers, the
perceived ease of use shown to has a significant relationship with the user’s
satisfaction whereas, the perceived usefulness will not be included in this
study. This is because, as stated in previous chapters, the custom officers
were required or compulsory by the Jabatan Kastam Malaysia to use the

A STUDY ON TECHNOLOGY READINESS AND ACCEPTANCE OF SISTEM MAKLUMAT KASTAM (SMK) IN JABATAN KASTAM MALAYSIA
100
SMK systems for declaration of goods. Therefore, the researchers decided
to not focus on the perceived usefulness.
In addition, this study or research provide a deeper insight into the
satisfaction of custom officers towards the SMK system based on the
personal traits of Technology Readiness Index which are optimism,
innovativeness, discomfort and insecurity.
5.3.2 Managerial Implications
Besides theoretical implications, the researchers also figure out the
managerial implications for this study where the custom officers are
demonstrating higher technological readiness for innovativeness, insecurity
and discomfort which encourage the Jabatan Kastam Malaysia to provide
the custom officers with appropriate technology assistance. In the case of
optimism, the result shown that optimism was insignificant with the custom
officer’s perceived ease of use since, the officers were required to use the
system even if they were not optimistic about the systems. Another reason
may be due to the reasons that the Jabatan Kastam Malaysia had been
emphasizing too much on the user’s optimism. Next, among the custom
officers, there were some of the officers who were lacking in computer
literacy and thus may perceived more negative emotions and expectations
towards the systems. Therefore, continuous training program and education
should be provided to the custom officers in order to help them realize the
important or benefits of using technology along with minimizing the feeling
of discomfort and insecurity among the custom officers.
Through this study or research, the researchers also found that all of the
variables such as innovativeness, discomfort and insecurity will affected the
custom officers’ perceived ease of use towards the SMK systems with
exception of only one variable which is optimism. Therefore, it is suggested
that the custom officers’ requirements must be fully understood during the

A STUDY ON TECHNOLOGY READINESS AND ACCEPTANCE OF SISTEM MAKLUMAT KASTAM (SMK) IN JABATAN KASTAM MALAYSIA
101
development of SMK so that the system able to meet of fulfilled the officers’
demand and lead to user’s satisfaction.
5.4 Limitation of the study
During this research study, we have faced some unavoidable limitations. At the
same time, due to this limitation, we need to spent additional time and efforts, to
double confirm and check on our study in order meet the aim for our study. These
factors are consider as the limitation that researchers faced during the process of
this study.
5.4.1 Involvement of the Respondents’
This is the most common limitation that generally faced by the others
researchers when conducting a survey, so was the researchers. During the
time the researchers conducting the survey, most of the officers were not
willing to participate in this survey because, they perceived that the study
may leak their answer to other officers which will eventually affect their job.
This is because, this study was mainly focus on the custom officers’
satisfaction level in using the SMK system to perform their job task. Yet,
there were still some of the respondents who were willing to provide the
researchers with responses. Still, the researchers were able to receive 107
sets of questionnaires via Google Docs.
5.4.2 Access to the People
In this research, the access to the custom officers and custom department
across Malaysia is limited. This is because, the researchers were required to
gain permission from the Director of Jabatan Kastam Malaysia in order to

A STUDY ON TECHNOLOGY READINESS AND ACCEPTANCE OF SISTEM MAKLUMAT KASTAM (SMK) IN JABATAN KASTAM MALAYSIA
102
further access into the custom departments’ top management and all of the
employees. However, the researchers were unable to gain the necessary
permission from the Director to gain access to the Jabatan Kastam
Malaysia’s top management officers and most of the employees. Therefore,
the researchers were unable to provide a more accurate result for this study
as most of the top management of Jabatan Kastam Malaysia were not
participate in this study.
5.4.3 Policy and Privacy
Initially, when the researchers request for the permission to distribute the
questionnaire in Jabatan Kastam Malaysia, the researchers were rejected due
to the policy and privacy of the Jabatan Kastam Malaysia. This is due to the
reasons that the questionnaire the researchers design contained some of the
sensitive and irrelevant questions. However, after amending the
questionnaire several times according to the custom officers’ suggestion, the
researchers were successfully persuaded the officers in allowing the
researchers to distribute and collect the data from them and completed the
research study.
5.5 Recommendations for Future Research
Our research is guiding a right way for the future research. The hypothesis of this
study was to study the effect of technology readiness and acceptance of SMK in
Jabatan Kastam Malaysia. However, there are some recommendations for the future
research.
For the first recommendations that the researchers going to provide to the future
researcher is to have a study on testing the relationship between the variables of
technology readiness index and technology acceptance model with the user
satisfaction in order to more accurately determine the level of user satisfaction

A STUDY ON TECHNOLOGY READINESS AND ACCEPTANCE OF SISTEM MAKLUMAT KASTAM (SMK) IN JABATAN KASTAM MALAYSIA
103
among the officer toward the SMK. In addition, researcher can add more
moderators and mediators such as perceived usefulness, complexity, trust,
flexibility, reliability and so on into the study of the effect of technology readiness
and acceptance. With this, the test result can be more helpful for the Jabatan Kastam
Malaysia in order to make improvement on their implemented system and increased
their productivities and comfortable level when using the SMK system.
Furthermore, the questionnaires of this study were consisted of dual languages. This
is because, some of the respondents were having difficulty in understanding the
question in the questionnaires. Therefore, future researchers can add more
languages or versions into the study such as English, Malay and Chinese into the
questionnaire as it able to help the respondents to understand the question better and
allowed the respondent to provide a more accurate responses.
Lastly, researcher can conduct the effect of technology readiness and acceptance of
SMK in other industries as well. For example, manufacturing or logistic industries
they are also using the SMK. Manufacturing and logistic industries need to use
SMK to help the company get the licences to export and import their products.
Conduct in other industries also can help researcher to get more respondents and
collect more opinion and data.
5.6 Conclusion
This study or research provides some issues in Jabatan Kastam Malaysia. First, this
study determines the effect of technology readiness and acceptance of Sistem
Maklumat Kastam (SMK) among the custom officers in Jabatan Kastam Malaysia.
According to the shown result, all of the dimensions of technology readiness index
were having a significant effect on the custom officers’ perceived ease of use except
optimism which does not has a significant effect on the PEOU. Further, the
perceived ease of use also shown to has a significant effect on the custom officers’
satisfaction level. Significant indicators towards user satisfaction are provided by
the researchers to help the Jabatan Kastam Malaysia in understanding how the

A STUDY ON TECHNOLOGY READINESS AND ACCEPTANCE OF SISTEM MAKLUMAT KASTAM (SMK) IN JABATAN KASTAM MALAYSIA
104
custom officers’ accept the SMK system. Several limitations and recommendation
also had been suggested by the researchers for the future researchers to take note.

A STUDY ON TECHNOLOGY READINESS AND ACCEPTANCE OF SISTEM MAKLUMAT KASTAM (SMK) IN JABATAN KASTAM MALAYSIA
105
REFERENCES
Agarwal, R., & Prasad, J. (1998). A Conceptual and Operational Definition of
Personal Innovativeness in the Domain of Information Technology.
Information Systems Research, 9(2), 204-215.
Armstrong, J. S., & Overton, T. S. (1977). Estimating Nonresponse Bias in Mail
Surveys. Journal Of Marketing Research (JMR), 14(3), 396-402.
Aulakh, P.S., & Kotabe, M. (1997)."Antecedents and performance implications of
channel integration in foreign markets. Journal of International Business
Studies (28:1), pp 145–175.
Badri, M. A., Mohaidat, J., & Rashedi, A. A. (2013). Technology Readiness of
School Teachers - An Empirical Study of Measurement and Segmentation.
Industrial Engineering & Management, 2(4), 1-10.
Bailey, J. E., & Pearson, S. W. (1983). Development of a Tool for Measuring and
Analyzing Computer User Satisfaction. Journal of Management Sciences,
29(5), 530-545.
Bavarsad, B., & Mennatyan M. A. (2013). A Study of the Effects of Technology
Acceptance Factors on Users’ Satisfaction of E-Government Services.
World Applied Programming, 3(5), 190-199.
Blut, M., Wang, C., & Schoefer, K. (2016). Factors Influencing the Acceptance of
Self-Service Technologies: A Meta-Analysis. Journal of Service Research,
19(4), 396-416.
Chau, P. Y. K. 2001). Information Technology Acceptance by Individual
Professionals: A Model Comparison Approach. Journal of The Decision
Sciences Institute, 32(4), 699–719.

A STUDY ON TECHNOLOGY READINESS AND ACCEPTANCE OF SISTEM MAKLUMAT KASTAM (SMK) IN JABATAN KASTAM MALAYSIA
106
Chen, S. C., & Chen, H. H. (2009). The empirical study of customer satisfaction
and continued behavioural intention towards self-service banking:
technology readiness as an antecedent. International Journal of Electronic
Finance, 3(1), 64-76.
Chen, S. C. (2011). Understanding the effects of technology readiness, satisfaction
and electronic word-of-mouth on loyalty in 3c products. Australian Journal
of Business and Management Research, 1(3), 1-9.
Chen, S. C., Jong, D., & Lai, M. T. (2014). Assessing the Relationship between
Technology Readiness and Continuance Intention in an E-Appointment
System: Relationship Quality as a Mediator. Journal of Medical System,
38(76), 1-12.
Chin, W. W. (1998). The partial least squares approach to structural equation
modeling. Modern methods for business research, 295(2), 295-336.
Cook, J. V., Dickinson, H. O., & Eccles, M. P. (2009). Response rates in postal
surveys of healthcare professionals between 1996 and 2005: an
observational study. BMC health services research, 9(1), 1.
Crosno, J. L., Rinaldo, S. B., Black, H. G., & Kelley, S. W. (2009). Half Full or
Half Empty: The Role of Optimism in Boundary-Spanning Positions.
Journal of Service Research, 11(3), 295-309.
Damanpour, F. (1991). Organizational Innovation: A Meta-Analysis Of Effects Of
Determinants and Moderators. Academy of Management Journal, 34(3),
555-590.
Dastgir, M., & Mortezaie, A. S. (2012). FACTORS AFFECTING THE END-
USER COMPUTING SATISFACTION. Business Intelligence Journal,
5(2), 292-298.

A STUDY ON TECHNOLOGY READINESS AND ACCEPTANCE OF SISTEM MAKLUMAT KASTAM (SMK) IN JABATAN KASTAM MALAYSIA
107
Davis, F. D. (1999). Perceived Usefulness, Perceived Ease of Use, and User
Acceptance of lnformation Technology. MIS Quaterly, 318-340.
DeLone, W. H., & McLean, E. R. (1992). Information Systems Success: The Quest
for the Dependent Variable . The Institute of Management Sciences, 60-95.
Doll, W. J., & Torkzadeh, G. (1988). The measurement of end-user computing
satisfaction. MIS Quaterly, 12(2), 259-274 .
Dinev, T., & Hart, P. (2006)"An extended privacy calculus model for e-commerce
transactions," Information Systems Research 17(1), 61–80.
Elkaseh, A. M., Wong, K. W., & Fung, C. C. (2016). Perceived Ease of Use and
Perceived Usefulness of Social Media for e-Learning in Libyan Higher
Education: A Structural Equation Modeling Analysis. International Journal
of Information and Education Technology, 6(3), 192-199.
Erdoğmuş, N., & Esen, M. (2011). An Investigation of the Effects of Technology
Readiness on Technology Acceptance in e-HRM. Procedia - Social
And Behavioral Sciences, 24(The Proceedings of 7th International
Strategic Management Conference), 487-495.
doi:10.1016/j.sbspro.2011.09.131
Fathema, N., Shannon, D., & Ross, M. (2015). Expanding The Technology
Acceptance Model (TAM) to Examine Faculty Use of Learning
Management Systems (LMSs) In Higher Education Institutions. Journal of
Online Learning and Teaching, 11(2), 210-232.
Field, A. P. (2013). Discovering statistics using IBM SPSS statistics : and sex and
drugs and rock 'n' roll. Los Angeles : Sage, 2013.

A STUDY ON TECHNOLOGY READINESS AND ACCEPTANCE OF SISTEM MAKLUMAT KASTAM (SMK) IN JABATAN KASTAM MALAYSIA
108
Galletta, D. F., & Lederer, A. L. (1989). Some Cautions on the Measurement of
User Information Satisfaction. Journal of The Decision Sciences Institute,
20(3), 419–434.
Garcia, R., & Calantone, R. (2002). A critical look at technological innovation
typology and innovativeness terminology: a literature review. Journal of
Product Innovation Management, 19(2), 110–132.
Ghozali, Imam. 2008. Aplikasi Analisis Multivariate Dengan Program SPSS.
Semarang: Universitas Diponegoro.
Guhr, N., Loi, T., Wiegard, R., & Breitner, M. H. (2013). Technology Readiness in
Customers’ Perception and Acceptance of M(obile)-Payment: An Empirical
Study in Finland, Germany, the USA and Japan. 11th International
Conference on Wirtschaftsinformatik, (pp. 119-133).
Hackbarth, G., Grover, V., & Yi, M. Y. (2003). Computer playfulness and anxiety:
positive and negative mediators of the system experience effect on
perceived ease of use. Information Management, 40(3), 221-232.
Hallikainen, H., & Laukkanen, T. (2016). HOW TECHNOLOGY READINESS
EXPLAINS ACCEPTANCE AND SATISFACTION OF DIGITAL
SERVICES IN B2B HEALTHCARE SECTOR? Pacific Asia Conference
on Information Systems (PACIS) 2016 Preceedings. AIS Electronic Library
(AISeL).
Hair, J. F. (2014). Multivariate data analysis. Harlow : Pearson Education Limited,
2014.
Hair J. F., Hult, G. T. M., Ringle, C. M., & Sarstedt, M. (2016). A primer on partial
least squares structural equation modeling (PLS-SEM). Sage Publications,
Thousand Oaks.

A STUDY ON TECHNOLOGY READINESS AND ACCEPTANCE OF SISTEM MAKLUMAT KASTAM (SMK) IN JABATAN KASTAM MALAYSIA
109
Hair, J. F., Ringle, C. M., & Sarstedt, M. (2011). PLS-SEM: Indeed a silver bullet.
Journal of Marketing Theory and Practice, 19(2), 139–151.
Hemdi, M. A., Rahman, S. A. S., Hanafiah, M. H., & Adanan, A. (2016). Airport
self-service check-in: The influence of technology readiness on customer
satisfaction. Proceedings of the 3rd International Hospitality and Tourism
Conference, IHTC 2016 (pp. 537-541). London: Taylor & Francis Group.
Homaei, R., Bozorgi, Z. D., Ghahfarokhi, M. S. M., & Hosseinpour, S. (2016).
Relationship between Optimism, Religiosity and Self-Esteem with Marital
Satisfaction and Life Satisfaction . International Education Studies, 9(6),
53-61.
Hox, J. J., & Boeije, H. R. (2005). Data Collection, Primary vs. Secondary.
Encyclopedia of Social Measurment, 1, 593-599.
Ives, B., Olson, M. H., & Baroudi, J. J. (1983). The Measurement of User
Information Satisfaction. Communication of the ACM, 26(10), 785-793.
Jahangir, N., & Begum, N. (2008). The role of perceived usefulness, perceived ease
of use, security and privacy, and customer attitude to engender customer
adaptation in the context of electronic banking. African Journal of Business
Management, 2(1), 32-40.
Juniwati. (2014). Influence of Perceived Usefulness, Ease of Use, Risk on Attitude
and Intention to Shop Online. European Journal of Business and
Management, 6(27), 218-228.Kaur, G., & Gupta, S. (2012). Consumers’
Behavioral Intentions Toward Self-Service Technology in the Emerging
Markets. Journal of Global Marketing, 25(5), 241-261.
Kleinschmidt, E. J., & Cooper, R. G. (1991). The Impact of Product Innovativeness
on Performance . Journal of Product Innovation Management, 8, 240-251.

A STUDY ON TECHNOLOGY READINESS AND ACCEPTANCE OF SISTEM MAKLUMAT KASTAM (SMK) IN JABATAN KASTAM MALAYSIA
110
Koivisto, K., Makkonen, M., Frank, L., & Riekkinen, J. (2016). Extending the
Technology Acceptance Model with Personal Innovativeness and
Technology Readiness : A Comparison of Three Models. Journal of
Versendaal.
Kuang-Ming, K., Chung-Feng, L., & Chen-Chung, M. (2013). An investigation of
the effect of nurses' technology readiness on the acceptance of mobile
electronic medical record systems. BMC Medical Informatics &
Decision Making, 13(1), 1-14. doi:10.1186/1472-6947-13-88
Kuo, K. M., Liu, C. F., & Ma, C. C. (2013). An investigation of the effect of nurses’
technology readiness on the acceptance of mobile electronic medical record
systems. BMC Medical Informatics and Decision Making, 13(88).
Kwon, O., Choi, K., & Kim, M. (2007). User acceptance of context-aware services:
self-efficacy, user innovativeness and perceived sensitivity on contextual
pressure. Behaviour & Information Technology, 26(6), 483-498.
Lai, C. S. (2007). The Effects of Technology Readiness Index and IT-based
Services on the Service Quality in the Hotel Industry. Portland
International Conference on Management of Engineering & Technology (pp.
2743-2747). Portland: IEEE.
Leung, B. W. C., Moneta, G. B., & Chang, C. M. (2005). Think Positively and Feel
Positively: Optimism and Life Satisfaction in Late Life. The International
Journal of Aging and Human Development, 61(4), 335-365.
Lin, C. J. S., & Hsieh, P. L. (2006). The role of technology readiness in customers'
perception and adoption of self�service technologies. International Journal
of Service Industry Management, 17(5), 497-517.
Lin, C. J. S., & Hsieh, P. L. (2007). The influence of technology readiness on
satisfaction and behavioral intentions toward self-service technologies.
Computer in Human Behavior, 23, 1597–1615.

A STUDY ON TECHNOLOGY READINESS AND ACCEPTANCE OF SISTEM MAKLUMAT KASTAM (SMK) IN JABATAN KASTAM MALAYSIA
111
Lin, C.-H., Shih, H.-Y. & Sher, P. J. (2007). Integrating technology readiness into
technology acceptance: The TRAM model. Psychol. Mark., 24: 641–
657. doi:10.1002/mar.20177
Liljander, V., Gillberg, F., Gummerus, J., & Riel, A. ( 2006). Technology readiness
and the evaluation and adoption of self-service technologies. Journal of
Retailing and Consumer Services, 13(3), 177-191.
Lu, J., Wang, L. J., & Hayes, L. A. (2012). How do technology readiness, platform
functionality and trust influence C2C user satisfaction? Journal of
Electronic Commerce Research, 13(1), 50-69.
Luthans, K. W., Lebsack, S. A., & Lebsack, R. R. (2008). Positivity in healthcare:
relation of optimism to performance. Journal of Health Organization and
Management, 22(2), 178-188.
Mahmood, M. A., Burn, J. M., Gemoets, L. A., & Jacquez, C. (2000). Variables
affecting information technology end-user satisfaction: A meta-analysis of
the empirical literature. International Journal of Human Computer Studies,
52, 751-771.
Malaysia ranks 11th in e-govt. (2009). News.asiaone.com. Retrieved 2 April 2017,
from
http://news.asiaone.com/News/AsiaOne%2BNews/Malaysia/Story/A1Stor
y20091 014 -173569.html
Malhotra, N.K., Kim, S.S., & Patil, A. (2006). "Common method variance in IS
research: A comparison of alternative approaches and a reanalysis of past
research," Management Science 52(12), 1865–1883.
MAMPU. (2017). En.wikipedia.org. Retrieved 2 April 2017, from
https://en.wikipedia.org/wiki/MAMPU

A STUDY ON TECHNOLOGY READINESS AND ACCEPTANCE OF SISTEM MAKLUMAT KASTAM (SMK) IN JABATAN KASTAM MALAYSIA
112
Masrom, M. (2007). Technology Acceptance Model and E-learning. 12th
International Conference on Education, Sultan Hassanal Bolkiah Institute
of Education.
Mazni B. (2002). Digitalization: making some sense of convergence in Malaysia.
Department of Communication Universiti Kebangsaan Malaysia.
Meuter, M. L., Ostrom, A. L., & Bitner, M. J., & Roundtree, R. (2003). The
influence of technology anxiety on consumer use and experiences with self-
service technologies. Journal of Business Research, 56(11), 899-906.
Mohsin.A & Raha.O. (2007). Implementation of Electronic Government In
Malaysia: The status and Potential for Better Service to the Public. Public
Sector ICT Management Review.
Muslim Amin., Rezaei, S., & Abolghasemi, M. (2014). User satisfaction with
mobile websites: the impact of perceived usefulness (PU), perceived ease of
use (PEOU) and trust. Nankai Business Review International, 5(3), 258-274.
Nik Abdullah, N. A. (2012). Technology Readiness and Users Satisfaction towards
Self-Service Technology at Malaysian Airport. Information Management
and Business Review, 4(8), 453-460.
Nugroho, M. A. (2015). Impact of Government Support and Competitor Pressure
on the Readiness of SMEs in Indonesia in Adopting the Information
Technology. Procedia Computer Science, 72, 102-111.
Ohk, K. Y., Park, S. B., & Hong, J. W. (2015). The Influence of Perceived
Usefulness, Perceived Ease of Use, Interactivity, and Ease of Navigation on
Satisfaction in Mobile Application . Advanced Science and Technology
Letters, 84, 88-92.

A STUDY ON TECHNOLOGY READINESS AND ACCEPTANCE OF SISTEM MAKLUMAT KASTAM (SMK) IN JABATAN KASTAM MALAYSIA
113
Parasuraman A. (2000) Technology readiness index (tri): a multiple-item scale to
measure readiness to embrace new technologies. J Serv
Res.2(4):307–320. doi: 10.1177/109467050024001.
Parasuraman A, Colby CL.(2001)Techno-ready marketing: How and why your
customers adopt technology. 1. New York: The Free Press.
Parasuraman, A., & Colby, C. (2015). An Updated and Streamlined Technology
Readiness Index: TRI 2.0. Journal Of Service Research, 18(1), 59-74.
doi:10.1177/1094670514539730
Park, S. Y. (2009). An Analysis of the Technology Acceptance Model in
Understanding University Students’ Behavioral Intention to Use e-Learning .
Educational Technology & Society, 12(3), 150–162.
Pavlou, P.A., & Gefen, D. (2005)."Psychological contract violation in online
marketplaces: antecedents, consequences, and moderating role,"
Information Systems Research, 16(4), 372-399.
Pinar, I., Mehtap, A., & Erzengin, E. (2012). The effect of end user perceptions of
information technologies on the information sharing. Journal of Global
Strategic Management, 6(1), 32-41.
Priyanka S. (2012). Technology Acceptance Model: A Survey of Literature.
International Journal of Business and Social Research, vol. 2, issue 4,
pages 175-178.
Podsakoff, P.M., & Organ, D.W. (1986). "Self-reports in organizational research:
Problems and prospects " Journal of Management, 12(4), 531–544.
Podsakoff, P.M., MacKenzie, S.B., Lee, J.-Y., & Podsakoff, N.P. (2003) “Common
methods biases in behavioral research: a critical review of the literature and
recommended remedies," Journal of Applied Psychology 88(5), 879–903.

A STUDY ON TECHNOLOGY READINESS AND ACCEPTANCE OF SISTEM MAKLUMAT KASTAM (SMK) IN JABATAN KASTAM MALAYSIA
114
Port Klang Authority Concerned Over Customs Information System Breakdowns –
Maritime News Update @ BERNAMA.com. (2016).
Maritime.bernama.com. Retrieved 2 April 2017, from
http://maritime.bernama.com/news.php?id=1253542&lang=en
Rogers, E. M. (1995). DIFFUSION OF INNOVATIONS, (4th ed). United States of
America: THE FREE PRESS.
Rojas-Mendez, J. I., Prasuraman, A., & Papadopoulos, N. (2017). Demographics,
attitudes, and technology readiness: A cross-cultural analysis and model
validation. Marketing Intelligence & Planning, 33(1), 18-39.
Santilli, S., Marcionetti, J., Rochat, S., Rossier, J., & Nota, L. scheier(2016). Career
Adaptability, Hope, Optimism, and Life Satisfaction in Italian and Swiss
Adolescents. Journal of Career Development, 44(1), 62-76.
Sekaran, U., & Bougie, R. (2012). Research methods for business: A skill building
approach (6th ed.). Chichester, West Sussex: John Wiley & Sons, Inc.
Scheier, M., & Carver, C. S. (1985). Optimism, coping, and health: Assessment and
implications of generalized outcome expectancies. Journal of Health
Psychology, 4(3), 219-247.
Scheier, M. F., & Carver, C. S. (1992). Effects of optimism on psychological and
physical well-being: Theoretical overview and empirical update. Cognitive
Therapy and Research, 16(2), 201-228.
Sharma, G., Shakya, S., & Kharel, P. (2014). Technology Acceptance Perspectives
on User Satisfaction and Trust of E-Government Adoption. Journal of
Applied Sciences, 14, 860-872.
Shin, S. J., & Lee, W. J. (2014). The Effects Of Technology Readiness And
Technology Acceptance On NFC Mobile Payment Services In Korea.
Journal of Applied Business Research, 30(6), 1615-1626.

A STUDY ON TECHNOLOGY READINESS AND ACCEPTANCE OF SISTEM MAKLUMAT KASTAM (SMK) IN JABATAN KASTAM MALAYSIA
115
Shirani, A., Aiken, M., & Reithel, B. (1994). A model of user information
satisfaction. DATABASE for Advances in Information Systems, 25(4), 17-
23 .
Sibona, C., & Choi, J. H. (2012). Factors Affecting End-User Satisfaction on
Facebook. Proceedings of the Sixth International AAAI Conference on
Weblogs and Social Media (pp. 575-578). Denver: Association for the
Advancement of Artificial Intelligence .
Song, X. M., & Montoya-Weiss, M. M. (1998). Critical Development Activities for
Really New versus Incremental Products. Journal of Product Innovation
Management, 124–135.
Sreejesh, S., Mitra, A., & Sahoo, D. (2015). The impact of customer’s perceived
service innovativeness on image congruence, satisfaction and behavioral
outcomes. Journal of Hospitality and Tourism Technology, 6(3), 288-310.
Stock, R., & Grob, M. (2016). How Does Knowledge Workers' Social Technology
Readiness Affect Their Innovative Work Behavior? 49th Hawaii
International Conference on System Sciences (HICSS). Koloa, HI, USA:
IEEE.
Suki, N. M., & Ramayah, T. (2010). User Acceptance of the E-Government
Services in Malaysia: Structural Equation Modelling Approach.
Interdisciplinary Journal of Information, Knowledge, and Management, 5,
396-413.
Surendran, P. (2012). Technology Acceptance Model: A Survey of Literature.
International Journal of Business and Social Research (IJBSR), 2(4), 175-
178.

A STUDY ON TECHNOLOGY READINESS AND ACCEPTANCE OF SISTEM MAKLUMAT KASTAM (SMK) IN JABATAN KASTAM MALAYSIA
116
Shaidin S. (2016). e-Government Initiatives in Malaysia and the Role of the
National Archives of Malaysia in Digital Records Management.
National Archives of Malaysia.
Tabachnick, B. G., & Fidell, L. S. (2014). Using multivariate statistics. Harlow :
Pearson, 2014.
Tsikriktsis, N. (2004). A technology readiness -- based taxonomy of customers: A
replication and extension. Journal of Service Research 7(1): 42-52
Tu, C. C., Fang, K. T., & Lin, C. Y. (2012). Perceived Ease of Use, Trust, and
Satisfaction as Determinants of Loyalty in e-Auction Marketplace . Journal
of Computers, 7(3), 645-652.
Walczuch, R., Lemmink, J., & Streukens, S. (2007). The effect of service
employees’ technology readiness on technology acceptance. Journal of
Information and Management, 44, 206-215.
Wang, Y., So, K. K. K., & Sparks, B. A. (2016). Technology Readiness and
Customer Satisfaction with Travel Technologies: A Cross-Country
Investigation. Journal of Travel Research, 56(5), 563-577.
Weston, R., Paual, A. & Gore, J. (2006). A brief guide to structural equation
modeling. The Counseling Psychologist, 34(5), 719-751
Westports: Imports affected by Customs system failure. (2016). Thesundaily.my.
Retrieved 2 April 2017, from
http://www.thesundaily.my/news/1832733
WIlliams, P., & Aaker, J. L. (2002). Can Mixed Emotions Peacefully Coexist?
Journal of Consumer Research, 28, 636-649.
Yousafzai, S. Y., Foxall, G. R., & Pallister, J. G. (2007). Technology acceptance: a
meta�analysis of the TAM: Part 1. Journal of Modelling in Management,
2(3), 251-280.

A STUDY ON TECHNOLOGY READINESS AND ACCEPTANCE OF SISTEM MAKLUMAT KASTAM (SMK) IN JABATAN KASTAM MALAYSIA
117
Yuan, W. J., & Wang, L. (2016). Optimism and attributional style impact on the
relationship between general insecurity and mental health. Personality and
Individual Differences, 101, 312-317.
Zikmund, W. G., Babin, B. J., & Carr, J. C. dan Griffin, M. (2010). Business
research methods (8th ed.). Mason, HO: Cengage Learning.
Zikmund, W. G., Babin, B. J., Carr, J. C., & Griffin, M. (2013). Business research
methods. Cengage Learning.
Zulkifly, M. I., Zahari, M. S. M., Hanafiah, M. H., & Ismail, M. N. I. (2016).
Customers' technology readiness and customer information satisfaction on
tablet-based menu ordering experience. Conference: 3rd International
Hospitality and Tourism Conference ( IHTC 2016). London: Taylor &
Francis Group.

A STUDY ON TECHNOLOGY READINESS AND ACCEPTANCE OF SISTEM MAKLUMAT KASTAM (SMK) IN JABATAN KASTAM MALAYSIA
118
Appendices
Appendix A: Result of G power
Appendix B: Original and modified questions of Technology readiness index
Technology readiness index (TRI)
Original questions Modified questions
Optimism Optimism
OPT1
Technology gives people more
control over their daily lives.
OPT1
Sistem maklumat kastam memberikan
pengguna lebih banyak kawalan ke atas
tugasan seharian mereka.
SMK gives people more control over their
everyday tasks.
OPT2
Products and services that use the
newest technologies are much more
convenient to use.
OPT2
Proses pengikraran menggunakan SMK
lebih mudah digunakan berbanding
dengan pengikraran menggunakan borang.

A STUDY ON TECHNOLOGY READINESS AND ACCEPTANCE OF SISTEM MAKLUMAT KASTAM (SMK) IN JABATAN KASTAM MALAYSIA
119
The declaration process becoming easier
through the use of SMK than using
document.
OPT3
I prefer to use the most advanced
technology available.
OPT3
Saya lebih suka menggunakan sistem
SMK berbanding dengan cara pengikraran
menggunakan borang kastam.
I prefer to use SMK system than custom
document as a method for declaration.
OPT4
I like technologies that allow me to
tailor things to fit my own needs.
OPT4
Saya suka sistem SMK kerana ianya
memudahkan saya dengan hanya mengisi
maklumat di ruangan yang telah sedia ada
di dalam paparan sistem.
I like SMK system because it make me
easier by only needed to fill in the
information at the space provided in the
display system.
OPT5
Technology makes me more
efficient in my occupation.
OPT5
Sistem maklumat kastam meningkatkan
tahap kecekapan saya semasa bekerja.
SMK makes me more efficient in my
occupation.
OPT6
I find new technologies to be
mentally stimulating
OPT6
Saya mendapati sistem SMK lebih
merangsangkan dari segi mental.
I find SMK to be mentally stimulating.
OPT7
Technology give me more freedom
of mobilty
OPT7
Dengan adanya SMK, ianya memberikan
saya lebih banyak kebebasan untuk
bergerak.
By having SMK, it gives me more freedom
of mobility

A STUDY ON TECHNOLOGY READINESS AND ACCEPTANCE OF SISTEM MAKLUMAT KASTAM (SMK) IN JABATAN KASTAM MALAYSIA
120
OPT8
Learning about technology can be
as rewarding as the technology
itself.
OPT8
Sistem SMK boleh meningkatkan
pungutan hasil bagi JKDM.
SMK system can increases the revenue
collections for JKDM.
OPT9
I feel confident that technology-
based systems will follow through
with what I instruct them to do.
OPT9
Dengan menggunakan sistem SMK, saya
berasa lebih yakin kerana ianya berfungsi
seperti yang saya arahkan.
By using SMK, I feel more confident
because the systems functions according as
I instructed.
Innovativeness Innovativeness
INN1
Other people come to me for advice
on new technologies.
INN1
Orang lain datang kepada saya untuk
mendapatkan nasihat mengenai sistem
SMK.
Other people come to me for advice on
SMK system.
INN2
It seems my friends are learning
more about the newest technologies
than I am
INN2
Rakan sekerja saya lebih arif
menggunakan SMK berbanding dengan
saya.
My colleagues were more skilled in using
SMK than me [reverse scored]
INN3
In general, I am among the first in
my circle of friends to acquire new
technology when it appears.
INN3
Secara umum, saya adalah antara yang
pertama dijadikan rujukan mengenai
sistem SMK di tempat kerja saya.
In general, I was among the first in my
workplace that being made as reference to
SMK system.
INN4 INN4

A STUDY ON TECHNOLOGY READINESS AND ACCEPTANCE OF SISTEM MAKLUMAT KASTAM (SMK) IN JABATAN KASTAM MALAYSIA
121
I can usually figure out new high-
tech products and services without
help from others.
Biasanya saya boleh menggunakan sistem
SMK tanpa bantuan daripada orang lain.
Usually I can figure out how to use SMK
system without help from anyone.
INN5
I keep up with the latest
technological developments in my
areas of interest.
INN5
Saya sentiasa mengikuti pindaan terkini ke
atas sistem SMK dari masa ke semasa.
I always keep up with the latest version of
SMK system from time to time.
INN6
I enjoy the challenge of figuring out
high-tech gadgets.
INN6
aya menikmati keseronokan dan cabaran
dalam proses menggunakan sistem SMK.
I enjoy the challenging process of using
SMK system
INN7
I find I have fewer problems than
other people in making technology
work for me.
INN7
Saya tidak mempunyai masalah dalam
menggunakan SMK berbanding dengan
rakan sekerja saya yang lain.
I find myself to have fewer problems than
others in using SMK.
Discomfort Discomfort
DIS1
Technical support lines are not
helpful because they don’t explain
things in terms I understand.
DIS1
Sistem SMK sangat mudah dan jelas.
SMK system was easy and clear.
DIS2
Many new technologies have health
or safety risks that are not
discovered until after people have
used them.
DIS2
Sistem SMK ini memudahkan jabatan
untuk mengintip agen penghantaran dari
melakukan kesilapan pengikraran
barangan.
SMK system makes it easy for the
departments to spy on the delivery agent
mistakes during the declaration of goods.

A STUDY ON TECHNOLOGY READINESS AND ACCEPTANCE OF SISTEM MAKLUMAT KASTAM (SMK) IN JABATAN KASTAM MALAYSIA
122
Insecurity Insecurity
INS1
I do not consider it safe to provide
personal information over the
Internet.
INS1
Saya berasa tidak selamat untuk
melakukan pengikraran barangan melalui
elektronik.
I do not consider it safe to do any goods
declaration online
INS2
I worry that information I make
available over the Internet mayb be
misused by others.
INS2
Saya bimbang bahawa maklumat
pengikraran borang yang dimasukkan di
dalam sistem akan sampai ke pihak yang
lain bagi kegunaan yang salah.
I worry that the document's declaration
information that I entered into the system
will be send to other party with bad
intention.
INS3
I do not feel confident doing
business with a place that can only
be reached online.
INS3
Saya berasa tidak yakin menjalankan
proses pengikraran kastam yang hanya
bergantung dengan sistem elektronik
sahaja.
I am not convince in the custom's
declaration process that only depends on
electronic system
INS4
Any business transaction you do
electronically should be confirmed
later with a separate
communication.
INS4
Apa-apa transaksi melalui sistem
elektronik perlu disahkan kemudian secara
bertulis.
Any transaction through electronic system
need to be confirmed later in black and
white or written.
INS5 INS5

A STUDY ON TECHNOLOGY READINESS AND ACCEPTANCE OF SISTEM MAKLUMAT KASTAM (SMK) IN JABATAN KASTAM MALAYSIA
123
When I call a business, I prefer
talking to a person rather than
interacting with an automated
system.
Saya lebih suka berkomunikasi secara
bersemuka dengan orang dan bukannya
melalui mesin semasa urusan pengikraran
barangan.
I prefer to talk in person rather than
through a machine during the declaration
of goods.
Source: Parasuraman & Colby (2014)
Appendix C: Original and modified questions of user satisfaction
Dependent variables
User satisfaction
Original questions Modified questions
USER1
Saya berniat untuk menggunakan
Sistem maklumat Kastam ditempat
kerja saya.
USER1
Saya setuju penggunaan sistem SMK di
tempat kerja saya diteruskan.
I agree to the continuance use of SMK
system in my workplace.
USER2
Saya akan kembali ke SMK ini kerap
jika ada urusan kerja
USER2
Saya akan kembali ke SMK secara
kerap jika ada proses pengikraran perlu
dilakukan.
I will frequently come back to SMK if
there was a declaration process that
needed to be done.
USER3
Saya berniat untuk menerima
maklumat atau tugas kerja dengan
mengunkan SMK
USER3
Saya berniat untuk menerima
maklumat atau tugas kerja dengan
menggunakan SMK.
I intend to receive information or
workload through the use of SMK.

A STUDY ON TECHNOLOGY READINESS AND ACCEPTANCE OF SISTEM MAKLUMAT KASTAM (SMK) IN JABATAN KASTAM MALAYSIA
124
Appendix D: Original and modified questions of perceived ease of use
Perceived ease of use
Original questions Modified questions
PEOU1
Learning to use E-government system
would be easy for me
PEOU1
Belajar cara penggunaan sistem SMK
adalah mudah bagi saya.
Learning to use SMK system would be
easy for me.
PEOU2
I would find it easy to get better service
using E-government system
PEOU2
Saya mendapati bahawa pengikraran
menjadi lebih mudah melalui sistem
SMK.
I found that declaration becoming
easier through SMK system
PEOU3
It would be easy for me to become skill
full at using E-government system
PEOU3
Ia adalah mudah bagi saya untuk
menjadi mahir dalam pengunaan sistem
SMK.
It would be easy for me to become
skillful at using SMK system
PEOU4
I would find E-government system
easy to use
PEOU4
Saya mendapati bahawa SMK adalah
senang digunakan.
I would find SMK easy to use.
PEOU5
My interaction with E-learning was
clear and understandable.
PEOU5
Interaksi antara saya dengan SMK
adalah jelas dah mudah difahami.
My interaction with SMK would be
clear and understable
PEOU6
I think it is easy to use an NFC mobile
payment system.
PEOU6
Prosedur bagi sistem SMK adalah
mudah difahami.

A STUDY ON TECHNOLOGY READINESS AND ACCEPTANCE OF SISTEM MAKLUMAT KASTAM (SMK) IN JABATAN KASTAM MALAYSIA
125
Procedure for SMK system is easy to
understand.
PEOU7
It would be easy for me to find
information at E-learning.
PEOU7
Saya berasa mudah untuk mengetahui
perjalanan proses pengikraran
barangan melalui sistem SMK.
I would find it easy to know the course
of goods declaration process through
SMK system.
Source: Fred (1989), Maslin Masrom (2007), Suki & Ramayah (2010) & Shin &
Lee (2014).
Appendix E: Sources of questionnaire questions
Variables Sources (Adopted from) Number of
Items
(Original)
Number of
Items
(Modified)
Optimism Parasuraman, A. & Colby, C.
L. (2014)
12 10
Innovativeness Parasuraman, A. & Colby, C.
L. (2014)
9 7
Discomfort Parasuraman, A. & Colby, C.
L. (2014)
13 9
Insecurity Parasuraman, A. & Colby, C.
L. (2014)
11 9
User satisfaction Suki, N. M. & Ramayah, T.
(2010)
3 3
Perceived ease of
use
Masrom, M. (2007)
Davis, F. D. (1989)
Suki, N. M. & Ramayah, T.
(2010)
8 7
Appendix F: Example of Interval Scale question from Section B
No. Optimism Strongly
Disagree
Disagree Neutral Agree Strongly
Agree

A STUDY ON TECHNOLOGY READINESS AND ACCEPTANCE OF SISTEM MAKLUMAT KASTAM (SMK) IN JABATAN KASTAM MALAYSIA
126
1. Sistem maklumat
kastam memberikan
pengguna lebih
banyak kawalan ke
atas tugasan seharian
mereka. (SMK gives
people more control
over their everyday
tasks).
1 2 3 4 5
Source: Develop from the research
Appendix G: Example of Interval Scale in Section C
No. User Satisfaction Strongly
Disagree
Disagree Neutral Agree Strongly
Agree
1. Saya setuju
penggunaan sistem
SMK di tempat kerja
saya diteruskan. (I
agree to the
continuance use of
SMK system in my
workplace.)
1 2 3 4 5
Source: Develop from the research
Appendix H: Example of Interval Scale in Section D
No. Perceived Ease of
Use
Strongly
Disagree
Disagree Neutral Agree Strongly
Agree
1. Belajar cara
penggunaan sistem
SMK adalah mudah
bagi saya. (Learning
1 2 3 4 5

A STUDY ON TECHNOLOGY READINESS AND ACCEPTANCE OF SISTEM MAKLUMAT KASTAM (SMK) IN JABATAN KASTAM MALAYSIA
127
to use SMK system
would be easy for
me.)
Appendix I: Table of Demographic Profile and Coding
Question
No.
Label Coding
Q1 Gender “Male” - 1
“Female” - 2
Q2 Age Group “21 – 30 years old” - 1
“31 - 40 years old” - 2
“41 - 50 years old” - 3
“51 - 60 years old” - 4
Q3 Marital Status “Single” - 1
“Married” - 2
“Others” - 3
Q4 Educational Level “SPM” - 1
“STPM / Diploma” - 2
“Ijazah Sarjana Muda /
Degree” - 3
“Lain-lain / Others” - 4
Q5 Position Grade “WK19 – WK26” - 1
“WK27 – WK32” - 2
“WK41 – WK44” - 3
“WK48 – WK52” - 4
Q6 Length or Period of
services
“1 – 5 Tahun / years” - 1
“6 – 10 Tahun / years” - 2
“11 – 15 Tahun / years” - 3
“16 Tahun ke atas / above” - 4
Q7 Salary “RM 900 – RM1500” - 1
“RM 1501 – RM2500” - 2
“RM 2501 – RM3500” - 3
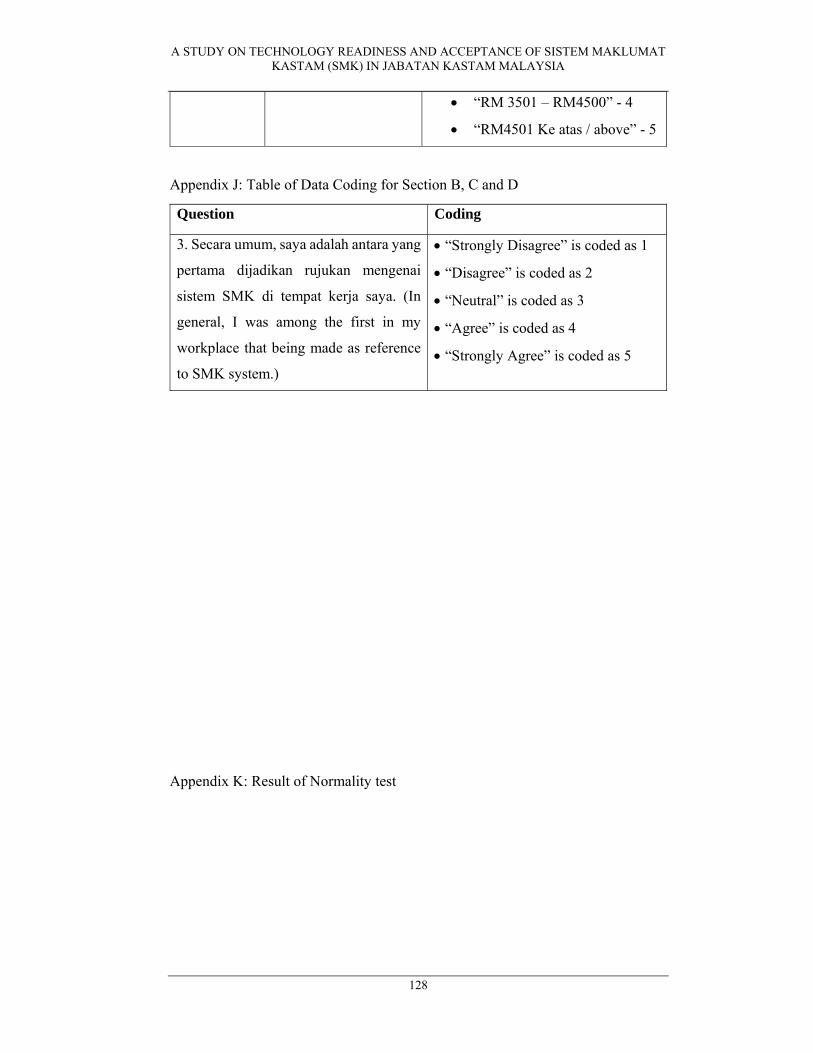
A STUDY ON TECHNOLOGY READINESS AND ACCEPTANCE OF SISTEM MAKLUMAT KASTAM (SMK) IN JABATAN KASTAM MALAYSIA
128
“RM 3501 – RM4500” - 4
“RM4501 Ke atas / above” - 5
Appendix J: Table of Data Coding for Section B, C and D
Question Coding
3. Secara umum, saya adalah antara yang
pertama dijadikan rujukan mengenai
sistem SMK di tempat kerja saya. (In
general, I was among the first in my
workplace that being made as reference
to SMK system.)
“Strongly Disagree” is coded as 1
“Disagree” is coded as 2
“Neutral” is coded as 3
“Agree” is coded as 4
“Strongly Agree” is coded as 5
Appendix K: Result of Normality test

A STUDY ON TECHNOLOGY READINESS AND ACCEPTANCE OF SISTEM MAKLUMAT KASTAM (SMK) IN JABATAN KASTAM MALAYSIA
129
Tests of Normalityb,c,d,e,f,g,h,i,j
Kolmogorov-Smirnova Shapiro-Wilk
Statistic df Sig. Statistic df Sig.
2.2 .307 4 . .729 4 .024
2.4 .307 4 . .729 4 .024
2.7 .407 6 .002 .640 6 .001
3.4 .307 4 . .729 4 .024
3.6 .407 6 .002 .640 6 .001
3.7 .284 12 .008 .859 12 .048
3.8 .381 10 .000 .640 10 .000
4.3 .291 8 .045 .799 8 .028
4.4 .307 4 . .729 4 .024
4.6 .415 15 .000 .631 15 .000
4.8 .258 5 .200* .782 5 .057
5 .407 6 .002 .640 6 .001
a. Lilliefors Significance Correction *. This is a lower bound of the true significance. b. User satisfaction is constant when Optimism = 2.10. It has been omitted. c. User satisfaction is constant when Optimism = 2.80. It has been omitted. d. User satisfaction is constant when Optimism = 3.00. It has been omitted. e. User satisfaction is constant when Optimism = 3.20. It has been omitted. f. User satisfaction is constant when Optimism = 3.30. It has been omitted. g. User satisfaction is constant when Optimism = 3.50. It has been omitted. h. User satisfaction is constant when Optimism = 3.90. It has been omitted. i. User satisfaction is constant when Optimism = 4.10. It has been omitted. j. User satisfaction is constant when Optimism = 4.20. It has been omitted.

A STUDY ON TECHNOLOGY READINESS AND ACCEPTANCE OF SISTEM MAKLUMAT KASTAM (SMK) IN JABATAN KASTAM MALAYSIA
130
Tests of Normalityb,c,d,e,f,g,h,i
Kolmogorov-Smirnova Shapiro-Wilk
Statistic df Sig. Statistic df Sig.
2.2857142857142856 .330 6 .039 .762 6 .026
2.857142857142857 .307 4 . .729 4 .024
3 .263 6 .200* .823 6 .093
3.4285714285714284 .316 8 .018 .772 8 .014
3.5714285714285716 .224 14 .054 .876 14 .052
4 .270 10 .038 .788 10 .010
4.142857142857143 .148 16 .200* .945 16 .411
4.857142857142857 .385 3 . .750 3 .000
5 .392 19 .000 .693 19 .000
a. Lilliefors Significance Correction
*. This is a lower bound of the true significance.
b. User satisfaction is constant when Innovativeness = 2.00. It has been omitted.
c. User satisfaction is constant when Innovativeness = 2.57. It has been omitted.
d. User satisfaction is constant when Innovativeness = 3.14. It has been omitted.
e. User satisfaction is constant when Innovativeness = 3.29. It has been omitted.
f. User satisfaction is constant when Innovativeness = 3.86. It has been omitted.
g. User satisfaction is constant when Innovativeness = 4.29. It has been omitted.
h. User satisfaction is constant when Innovativeness = 4.57. It has been omitted.
i. User satisfaction is constant when Innovativeness = 4.71. It has been omitted.

A STUDY ON TECHNOLOGY READINESS AND ACCEPTANCE OF SISTEM MAKLUMAT KASTAM (SMK) IN JABATAN KASTAM MALAYSIA
131
Tests of Normalityb,c,d,e,f,g
Kolmogorov-Smirnova Shapiro-Wilk
Statistic df Sig. Statistic df Sig.
3 .300 10 .011 .773 10 .007
3.111111111111111 .381 10 .000 .640 10 .000
3.2222222222222223 .245 10 .091 .820 10 .025
3.3333333333333335 .307 4 . .729 4 .024
3.4444444444444446 .289 9 .029 .765 9 .008
3.5555555555555554 .189 17 .110 .888 17 .043
3.6666666666666665 .307 4 . .729 4 .024
3.7777777777777777 .361 8 .003 .670 8 .001
3.888888888888889 .229 8 .200* .871 8 .155
4 .407 6 .002 .640 6 .001
4.111111111111111 .307 4 . .729 4 .024
4.222222222222222 .307 4 . .729 4 .024
a. Lilliefors Significance Correction
*. This is a lower bound of the true significance.
b. User satisfaction is constant when Discomfort = 2.56. It has been omitted.
c. User satisfaction is constant when Discomfort = 2.78. It has been omitted.
d. User satisfaction is constant when Discomfort = 2.89. It has been omitted.
e. User satisfaction is constant when Discomfort = 4.33. It has been omitted.
f. User satisfaction is constant when Discomfort = 4.78. It has been omitted.
g. User satisfaction is constant when Discomfort = 5.00. It has been omitted.

A STUDY ON TECHNOLOGY READINESS AND ACCEPTANCE OF SISTEM MAKLUMAT KASTAM (SMK) IN JABATAN KASTAM MALAYSIA
132
Tests of Normalityb,c,d,e,f,g
Kolmogorov-Smirnova Shapiro-Wilk
Statistic df Sig. Statistic df Sig.
2.4444444444444446 .307 4 . .729 4 .024
2.5555555555555554 .407 6 .002 .640 6 .001
2.6666666666666665 .307 4 . .729 4 .024
2.7777777777777777 .259 10 .056 .801 10 .015
2.888888888888889 .153 8 .200* .900 8 .291
3 .210 25 .006 .885 25 .009
3.111111111111111 .385 3 . .750 3 .000
3.2222222222222223 .250 8 .150 .849 8 .093
3.3333333333333335 .307 4 . .729 4 .024
3.5555555555555554 .263 6 .200* .823 6 .093
3.6666666666666665 .307 4 . .729 4 .024
3.7777777777777777 .307 4 . .729 4 .024
4.111111111111111 .226 6 .200* .842 6 .135
a. Lilliefors Significance Correction
*. This is a lower bound of the true significance.
b. User satisfaction is constant when Insecurity = 2.11. It has been omitted.
c. User satisfaction is constant when Insecurity = 2.22. It has been omitted.
d. User satisfaction is constant when Insecurity = 2.33. It has been omitted.
e. User satisfaction is constant when Insecurity = 4.00. It has been omitted.
f. User satisfaction is constant when Insecurity = 4.33. It has been omitted.
g. User satisfaction is constant when Insecurity = 4.44. It has been omitted.
h. User satisfaction is constant when Insecurity = 5.00. It has been omitted.

A STUDY ON TECHNOLOGY READINESS AND ACCEPTANCE OF SISTEM MAKLUMAT KASTAM (SMK) IN JABATAN KASTAM MALAYSIA
133
Tests of Normalityb,c,d,e,f,g
Kolmogorov-Smirnova Shapiro-Wilk
Statistic df Sig. Statistic df Sig.
3 .518 16 .000 .398 16 .000
3.125 .202 6 .200* .853 6 .167
3.75 .202 6 .200* .853 6 .167
3.875 .307 4 . .729 4 .024
4 .359 26 .000 .691 26 .000
4.25 .307 4 . .729 4 .024
4.5 .307 4 . .729 4 .024
4.75 .385 3 . .750 3 .000
4.875 .376 5 .020 .739 5 .023
5 .527 20 .000 .351 20 .000
a. Lilliefors Significance Correction
*. This is a lower bound of the true significance.
b. User satisfaction is constant when Perceived ease of use = 2.00. It has been omitted.
c. User satisfaction is constant when Perceived ease of use = 2.38. It has been omitted.
d. User satisfaction is constant when Perceived ease of use = 2.88. It has been omitted.
e. User satisfaction is constant when Perceived ease of use = 3.38. It has been omitted.
f. User satisfaction is constant when Perceived ease of use = 4.13. It has been omitted.
g. User satisfaction is constant when Perceived ease of use = 4.38. It has been omitted.

A STUDY ON TECHNOLOGY READINESS AND ACCEPTANCE OF SISTEM MAKLUMAT KASTAM (SMK) IN JABATAN KASTAM MALAYSIA
134
Appendix L: Total Variance Explained commona method bias
Total Variance Explained
Initial Eigenvalues Extraction Sums of Squared Loadings Rotation Sums of Squared Loadings
Total % of Variance Cumulative % Total % of Variance Cumulative % Total % of Variance Cumulative %
1 19.548 42.496 42.496 19.548 42.496 42.496 9.717 21.125 21.125
2 4.050 8.803 51.300 4.050 8.803 51.300 8.905 19.358 40.483
3 3.034 6.595 57.895 3.034 6.595 57.895 3.977 8.645 49.128
4 2.576 5.599 63.494 2.576 5.599 63.494 3.379 7.346 56.474
5 1.925 4.185 67.679 1.925 4.185 67.679 2.998 6.517 62.991
6 1.719 3.736 71.415 1.719 3.736 71.415 2.042 4.439 67.430
7 1.508 3.278 74.693 1.508 3.278 74.693 2.030 4.412 71.842
8 1.448 3.147 77.840 1.448 3.147 77.840 2.009 4.367 76.210
9 1.112 2.418 80.258 1.112 2.418 80.258 1.862 4.048 80.258
10 .995 2.163 82.421
11 .899 1.955 84.376
12 .821 1.786 86.162
13 .710 1.543 87.705
14 .678 1.474 89.178
15 .587 1.275 90.453
16 .537 1.166 91.620

A STUDY ON TECHNOLOGY READINESS AND ACCEPTANCE OF SISTEM MAKLUMAT KASTAM (SMK) IN JABATAN KASTAM MALAYSIA
135
17 .494 1.074 92.693
18 .421 .915 93.608
19 .392 .853 94.461
20 .316 .687 95.147
21 .283 .616 95.763
22 .248 .538 96.302
23 .226 .491 96.793
24 .197 .428 97.221
25 .151 .328 97.549
26 .151 .328 97.877
27 .131 .286 98.163
28 .124 .269 98.431
29 .120 .261 98.692
30 .094 .204 98.896
31 .084 .183 99.079
32 .074 .161 99.241
33 .061 .133 99.374
34 .058 .127 99.501
35 .044 .097 99.597

A STUDY ON TECHNOLOGY READINESS AND ACCEPTANCE OF SISTEM MAKLUMAT KASTAM (SMK) IN JABATAN KASTAM MALAYSIA
136
36 .040 .087 99.684
37 .034 .075 99.759
38 .028 .062 99.820
39 .028 .060 99.881
40 .016 .034 99.915
41 .015 .032 99.947
42 .009 .020 99.967
43 .006 .013 99.981
44 .004 .009 99.990
45 .003 .007 99.997
46 .001 .003 100.000
Extraction Method: Principal Component Analysis.

A STUDY ON TECHNOLOGY READINESS AND ACCEPTANCE OF SISTEM MAKLUMAT KASTAM (SMK) IN JABATAN KASTAM MALAYSIA
137
Appendix M: Frequency table for respondent’s demographic profile for Jabatan Kastam Malaysia
Gender
Frequency Percent Valid Percent
Cumulative
Percent
male 44 41.5 41.5 41.5
female 62 58.5 58.5 100.0
Total 106 100.0 100.0
Age
Frequency Percent Valid Percent
Cumulative
Percent
21-30 32 30.2 30.2 30.2
31-40 46 43.4 43.4 73.6
41-50 22 20.8 20.8 94.3
51-60 6 5.7 5.7 100.0
Total 106 100.0 100.0
Maritalstatus
Frequency Percent Valid Percent
Cumulative
Percent
single 30 28.3 28.3 28.3
Married 72 67.9 67.9 96.2
Others 4 3.8 3.8 100.0
Total 106 100.0 100.0
Educationlevel
Frequency Percent Valid Percent
Cumulative
Percent
SPM 78 73.6 73.6 73.6
STPM / Diploma 10 9.4 9.4 83.0
Degree 16 15.1 15.1 98.1
Others 2 1.9 1.9 100.0
Total 106 100.0 100.0

A STUDY ON TECHNOLOGY READINESS AND ACCEPTANCE OF SISTEM MAKLUMAT KASTAM (SMK) IN JABATAN KASTAM MALAYSIA
138
Position
Frequency Percent Valid Percent
Cumulative
Percent
WK19-WK26 82 77.4 77.4 77.4
WK27-WK32 8 7.5 7.5 84.9
WK41-WK44 14 13.2 13.2 98.1
WK48-WK52 2 1.9 1.9 100.0
Total 106 100.0 100.0
service
Frequency Percent Valid Percent
Cumulative
Percent
1-5 14 13.2 13.2 13.2
6-10 26 24.5 24.5 37.7
11-15 14 13.2 13.2 50.9
16 above 52 49.1 49.1 100.0
Total 106 100.0 100.0
Salary
Frequency Percent Valid Percent
Cumulative
Percent
RM900-RM1500 2 1.9 1.9 1.9
RM1501- RM2500 30 28.3 28.3 30.2
RM2501- RM3500 14 13.2 13.2 43.4
RM3501 - RM4500 48 45.3 45.3 88.7
RM4501 and above 12 11.3 11.3 100.0
Total 106 100.0 100.0

A STUDY ON TECHNOLOGY READINESS AND ACCEPTANCE OF SISTEM MAKLUMAT KASTAM (SMK) IN JABATAN KASTAM MALAYSIA
139
Appendix N: Chart diagram for respondent’s demographic profile from Jabatan Kastam Malaysia

A STUDY ON TECHNOLOGY READINESS AND ACCEPTANCE OF SISTEM MAKLUMAT KASTAM (SMK) IN JABATAN KASTAM MALAYSIA
140

A STUDY ON TECHNOLOGY READINESS AND ACCEPTANCE OF SISTEM MAKLUMAT KASTAM (SMK) IN JABATAN KASTAM MALAYSIA
141

A STUDY ON TECHNOLOGY READINESS AND ACCEPTANCE OF SISTEM MAKLUMAT KASTAM (SMK) IN JABATAN KASTAM MALAYSIA
142
Appendix O: Descriptive Statistics of the study variables
Descriptive Statistics
N Minimum Maximum MeanStd.
Deviation
Optimism 106 2.10 5.00 3.7811 .79272
Innovativeness 106 2.00 5.00 3.8208 .83789
Discomfort 106 2.56 5.00 3.5482 .48281
Insecurity 106 2.11 5.00 3.1583 .58993
User satisfaction 106 1.33 5.00 3.6981 .88554
Perceived ease of use
106 2.00 5.00 3.9682 .78434
Valid N (listwise) 106
Appendix P: Path coefficients among the Independent variables, and dependent variable.

A STUDY ON TECHNOLOGY READINESS AND ACCEPTANCE OF SISTEM MAKLUMAT KASTAM (SMK) IN JABATAN KASTAM MALAYSIA
143
Appendix Q: Reliability of Constructs
Constructs Items Loadings CR AVE VIF
Discomfort D1 0.893 0.852 0.742 2.661
D8 0.828 Innovativeness IN1 0.833 0.935 0.674 2.363
IN2 0.665
IN3 0.867
IN4 0.857
IN5 0.838
IN6 0.85
IN7 0.818 Insecurity INS2 0.677 0.884 0.609 1.498
INS3 0.903
INS4 0.866
INS5 0.813
INS8 0.601 Optimism OP1 0.828 0.971 0.79 2.275
OP10 0.92
OP2 0.891
OP4 0.873
OP5 0.896
OP6 0.929
OP7 0.892
OP8 0.923
OP9 0.844 Perceived PEU1 0.93 0.985 0.901 1
Esae of use PEU2 0.922
PEU3 0.962
PEU4 0.973
PEU5 0.977
PEU6 0.96
PEU7 0.919 User USER1 0.955 0.97 0.916
satisfaction USER2 0.956
USER3 0.961

A STUDY ON TECHNOLOGY READINESS AND ACCEPTANCE OF SISTEM MAKLUMAT KASTAM (SMK) IN JABATAN KASTAM MALAYSIA
144
Appendix R: Cross Loading
Innovativeness
Insecurity
Optimism
Perceived ease of use
User satisfaction
discomfort
D1 0.786 -0.508 0.685 0.760 0.604 0.893
D8 0.409 -0.436 0.504 0.609 0.584 0.828
IN1 0.833 -0.387 0.688 0.611 0.603 0.606
IN2 0.665 -0.220 0.528 0.364 0.348 0.412
IN3 0.867 -0.385 0.618 0.524 0.561 0.484
IN4 0.857 -0.414 0.523 0.646 0.516 0.623
IN5 0.838 -0.377 0.408 0.601 0.473 0.593
IN6 0.850 -0.522 0.678 0.666 0.656 0.738
IN7 0.818 -0.422 0.447 0.549 0.473 0.584
INS2 -0.361 0.677 -0.422 -0.296 -0.368 -0.320
INS3 -0.400 0.903 -0.442 -0.525 -0.565 -0.497
INS4 -0.367 0.866 -0.400 -0.467 -0.454 -0.509
INS5 -0.400 0.813 -0.371 -0.455 -0.455 -0.407
INS8 -0.376 0.601 -0.297 -0.385 -0.352 -0.379
OP1 0.527 -0.319 0.828 0.588 0.555 0.614OP10 0.633 -0.440 0.920 0.601 0.652 0.579
OP2 0.570 -0.378 0.891 0.626 0.642 0.569
OP4 0.581 -0.534 0.873 0.591 0.635 0.685
OP5 0.535 -0.384 0.896 0.619 0.579 0.662
OP6 0.635 -0.412 0.929 0.625 0.674 0.629
OP7 0.667 -0.433 0.892 0.616 0.700 0.601
OP8 0.590 -0.534 0.923 0.644 0.684 0.642
OP9 0.667 -0.498 0.844 0.640 0.730 0.614PEU1 0.681 -0.613 0.682 0.930 0.867 0.744
PEU2 0.600 -0.580 0.692 0.922 0.795 0.762
PEU3 0.663 -0.491 0.612 0.962 0.812 0.768
PEU4 0.662 -0.510 0.650 0.973 0.793 0.748
PEU5 0.669 -0.514 0.628 0.977 0.796 0.769
PEU6 0.695 -0.521 0.657 0.960 0.809 0.779
PEU7 0.698 -0.469 0.692 0.919 0.771 0.754
USER1 0.644 -0.548 0.731 0.857 0.955 0.741
USER2 0.588 -0.503 0.706 0.794 0.956 0.606
USER3 0.609 -0.589 0.664 0.786 0.961 0.624

A STUDY ON TECHNOLOGY READINESS AND ACCEPTANCE OF SISTEM MAKLUMAT KASTAM (SMK) IN JABATAN KASTAM MALAYSIA
145
Appendix S: Construct Correlations
Innovativeness
Insecurity
Optimism
Perceived ease of use
User satisfaction
discomfort
Innovativeness 0.821
Insecurity -0.485 0.780
Optimism 0.676 -0.492 0.889 Perceived ease of use 0.703 -0.558 0.695 0.949
User satisfaction 0.642 -0.571 0.733 0.850 0.957
discomfort 0.715 -0.550 0.699 0.801 0.689 0.861
Appendix T: Inner Model Results by size of R-Square
Included Excluded f‐squared Effect size
R‐squared 0.723 0.703 0.0722 Small
Appendix U: F-Square

A STUDY ON TECHNOLOGY READINESS AND ACCEPTANCE OF SISTEM MAKLUMAT KASTAM (SMK) IN JABATAN KASTAM MALAYSIA
146
Appendix V: T-value among the dependent variables and independent variables.
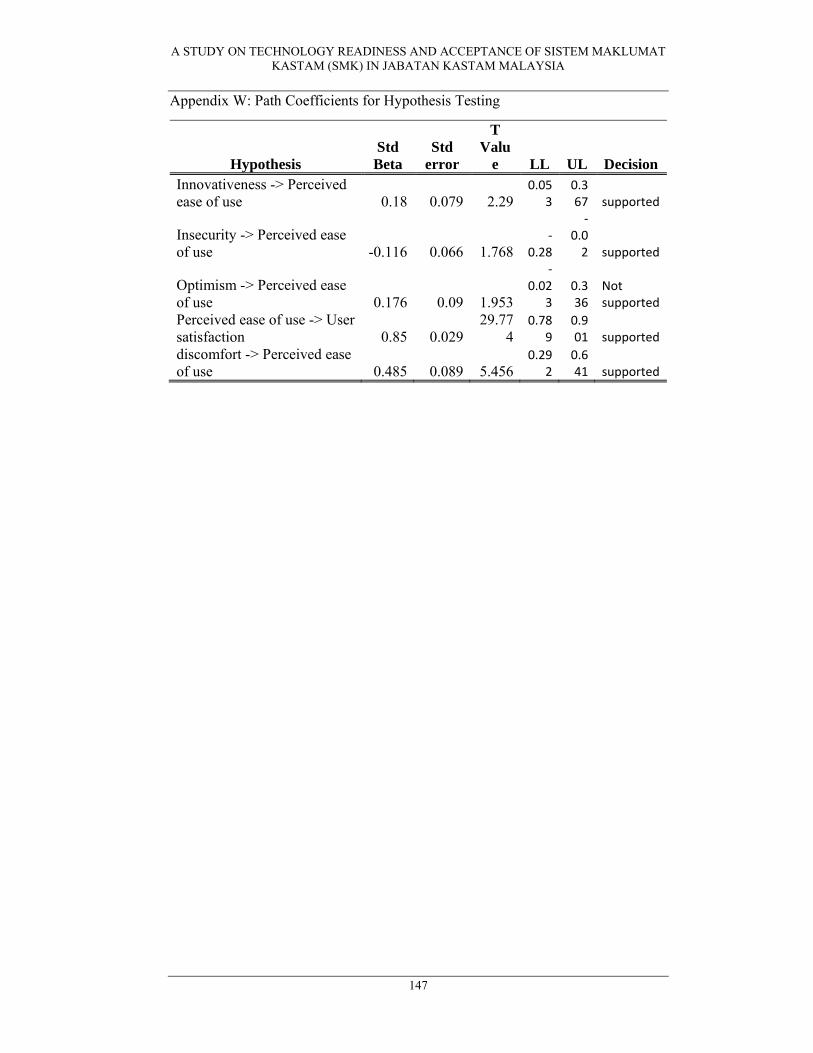
A STUDY ON TECHNOLOGY READINESS AND ACCEPTANCE OF SISTEM MAKLUMAT KASTAM (SMK) IN JABATAN KASTAM MALAYSIA
147
Appendix W: Path Coefficients for Hypothesis Testing
Hypothesis Std Beta
Std error
T Valu
e LL UL Decision Innovativeness -> Perceived ease of use 0.18 0.079 2.29
0.053
0.367 supported
Insecurity -> Perceived ease of use -0.116 0.066 1.768
‐0.28
‐0.02 supported
Optimism -> Perceived ease of use 0.176 0.09 1.953
‐0.02
3 0.336
Not supported
Perceived ease of use -> User satisfaction 0.85 0.029
29.774
0.789
0.901 supported
discomfort -> Perceived ease of use 0.485 0.089 5.456
0.292
0.641 supported

A STUDY ON TECHNOLOGY READINESS AND ACCEPTANCE OF SISTEM MAKLUMAT KASTAM (SMK) IN JABATAN KASTAM MALAYSIA
148
Appendix X: Final Year Project Questionnaire

A STUDY ON TECHNOLOGY READINESS AND ACCEPTANCE OF SISTEM MAKLUMAT KASTAM (SMK) IN JABATAN KASTAM MALAYSIA
149

A STUDY ON TECHNOLOGY READINESS AND ACCEPTANCE OF SISTEM MAKLUMAT KASTAM (SMK) IN JABATAN KASTAM MALAYSIA
150

A STUDY ON TECHNOLOGY READINESS AND ACCEPTANCE OF SISTEM MAKLUMAT KASTAM (SMK) IN JABATAN KASTAM MALAYSIA
151

A STUDY ON TECHNOLOGY READINESS AND ACCEPTANCE OF SISTEM MAKLUMAT KASTAM (SMK) IN JABATAN KASTAM MALAYSIA
152

A STUDY ON TECHNOLOGY READINESS AND ACCEPTANCE OF SISTEM MAKLUMAT KASTAM (SMK) IN JABATAN KASTAM MALAYSIA
153

A STUDY ON TECHNOLOGY READINESS AND ACCEPTANCE OF SISTEM MAKLUMAT KASTAM (SMK) IN JABATAN KASTAM MALAYSIA
154

A STUDY ON TECHNOLOGY READINESS AND ACCEPTANCE OF SISTEM MAKLUMAT KASTAM (SMK) IN JABATAN KASTAM MALAYSIA
155
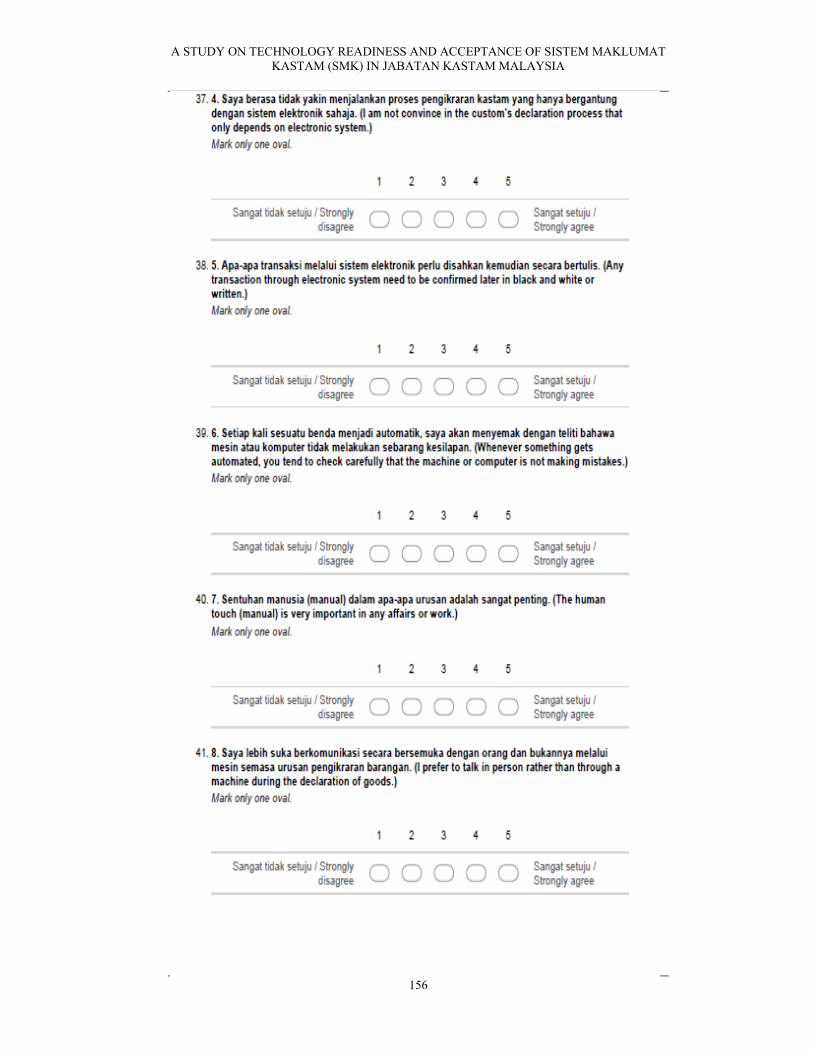
A STUDY ON TECHNOLOGY READINESS AND ACCEPTANCE OF SISTEM MAKLUMAT KASTAM (SMK) IN JABATAN KASTAM MALAYSIA
156

A STUDY ON TECHNOLOGY READINESS AND ACCEPTANCE OF SISTEM MAKLUMAT KASTAM (SMK) IN JABATAN KASTAM MALAYSIA
157

A STUDY ON TECHNOLOGY READINESS AND ACCEPTANCE OF SISTEM MAKLUMAT KASTAM (SMK) IN JABATAN KASTAM MALAYSIA
158

A STUDY ON TECHNOLOGY READINESS AND ACCEPTANCE OF SISTEM MAKLUMAT KASTAM (SMK) IN JABATAN KASTAM MALAYSIA
159

A STUDY ON TECHNOLOGY READINESS AND ACCEPTANCE OF SISTEM MAKLUMAT KASTAM (SMK) IN JABATAN KASTAM MALAYSIA
160
Appendix Y: Letter of Permission to Conduct Survey