Perceived Factors Influencing the Acceptance and...
142
Perceived Factors Influencing the Acceptance and Adoption of Self-service Technology Chang Mexen A research project submitted in partial fulfilment of the requirement for the degree of Master of Business Administration Universiti Tunku Abdul Rahman Faculty of Accountancy and Management March 2015
Transcript of Perceived Factors Influencing the Acceptance and...

Perceived Factors Influencing the Acceptance and
Adoption of Self-service Technology
Chang Mexen
A research project submitted in partial fulfilment of the
requirement for the degree of
Master of Business Administration
Universiti Tunku Abdul Rahman
Faculty of Accountancy and Management
March 2015
Perceived Factors Influencing the Acceptance and
Adoption of Self-service Technology
By
Chang Mexen
This research project is supervised by:
Sia Bik Kai
Senior Lecturer
Department of Economics
Faculty of Accountancy and Management

________________________________________________________________________
________________________________________________________________________
iii
Copyright @ 2015
ALL RIGHTS RESERVED. No part of this paper may be reproduced, stored in a
retrieval system, or transmitted in any form or by any means, graphic, electronic,
mechanical, photocopying, recording, scanning, or otherwise, without the prior
consent of the authors.

________________________________________________________________________
________________________________________________________________________
iv
DECLARATION
I hereby declare that:
(1) This Research Project is the end result of my own work and that due
acknowledgement has been given in the references to all sources of information be
they printed, electronic, or personal.
(2) No portion of this research project has been submitted in support of any
application for any other degree or qualification of this or any other university, or
other institutes of learning.
(3) The word count of this research report is 18,128.
Name of Student : Chang Mexen
Student ID : 10 UKM 07187
Signature :
Date : 27 March 2015

________________________________________________________________________
________________________________________________________________________
v
ACKNOWLEDGEMENT
I would like to acknowledge gratitude to Mr Sia, my supervisor for his invaluable
advice and guidance along the way of my research project. I could not imagine
how messy my work will be without his guidance. Without his tremendous
support I won‟t be able to complete the research project smoothly, not even dare
to imagine that I‟m writing on the acknowledgment page.
I appreciate for my family members and friends who help me on my data
collection; in way of showing supporting they took further steps to share the
questionnaire link to their extended friends and family. Thank you for your
helping hands and share my stress during my data collection period. I won‟t know
how difficult it is until I realized it in action.
My family members always are the biggest supporters in my life. I feel sorry that I
am not around and could not help up much during the critical time and I really feel
touch as they given me all the supports and loves during my difficult period.

________________________________________________________________________
________________________________________________________________________
vi
DEDICATION
To my love Eugene Goh,
No words can describe how emotional I can be when I drafting this. This honor
did not belong to me alone, but for both of us. Your life didn‟t stop where you
were, I am so glad that I can help you to achieve one of your goal - completion of
MBA. I have been struggle all this while; I believe the determination and strength
came from you.
I wish you be happy always.
Thanks for being my special one.
Love, Mexen
________________________________________________________________________
________________________________________________________________________
vii
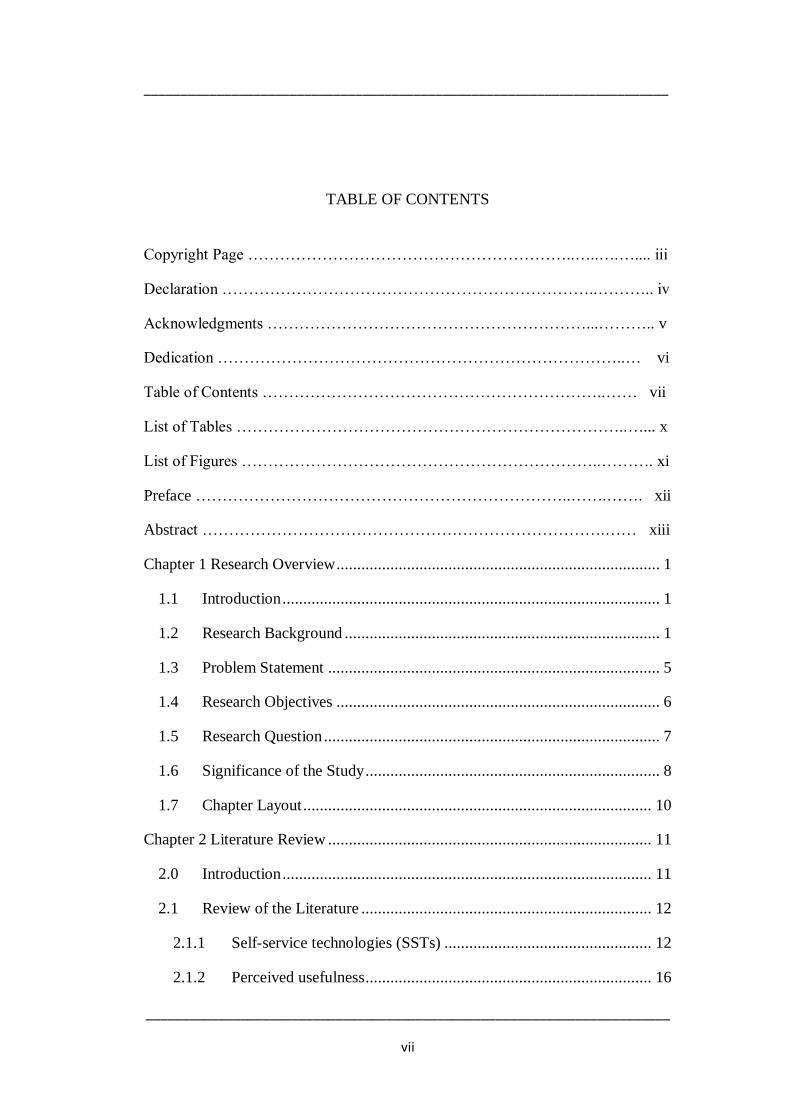
TABLE OF CONTENTS
Copyright Page ……………………………………………………..…..….….... iii
Declaration ……………………………………………………………..……….. iv
Acknowledgments ……………………………………………………...……….. v
Dedication …………………………………………………………………..… vi
Table of Contents ………………………………………………………..…… vii
List of Tables ………………………………………………………………..…... x
List of Figures …………………………………………………………..………. xi
Preface ……………………………………………………………..…….……. xii
Abstract ………………………………………………………………….…… xiii
Chapter 1 Research Overview .............................................................................. 1
1.1 Introduction ........................................................................................... 1
1.2 Research Background ............................................................................ 1
1.3 Problem Statement ................................................................................ 5
1.4 Research Objectives .............................................................................. 6
1.5 Research Question ................................................................................. 7
1.6 Significance of the Study ....................................................................... 8
1.7 Chapter Layout .................................................................................... 10
Chapter 2 Literature Review .............................................................................. 11
2.0 Introduction ......................................................................................... 11
2.1 Review of the Literature ...................................................................... 12
2.1.1 Self-service technologies (SSTs) .................................................. 12
2.1.2 Perceived usefulness ..................................................................... 16
________________________________________________________________________
________________________________________________________________________
viii
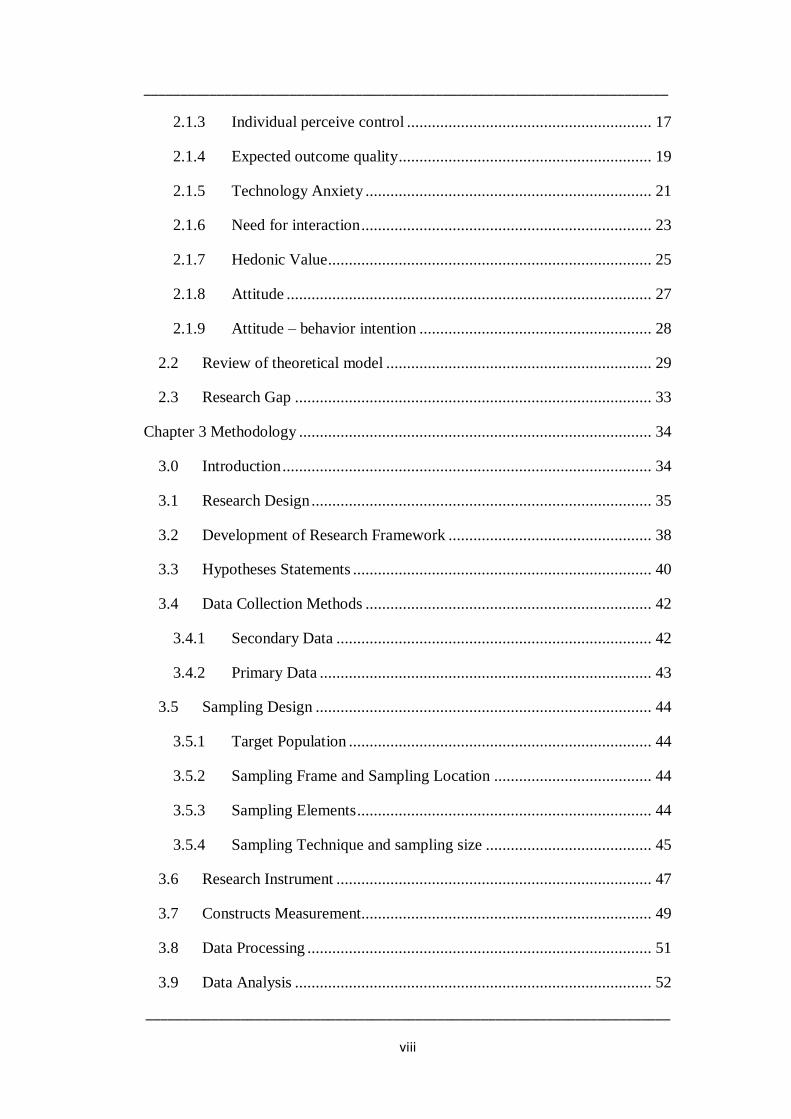
2.1.3 Individual perceive control ........................................................... 17
2.1.4 Expected outcome quality ............................................................. 19
2.1.5 Technology Anxiety ..................................................................... 21
2.1.6 Need for interaction ...................................................................... 23
2.1.7 Hedonic Value .............................................................................. 25
2.1.8 Attitude ........................................................................................ 27
2.1.9 Attitude – behavior intention ........................................................ 28
2.2 Review of theoretical model ................................................................ 29
2.3 Research Gap ...................................................................................... 33
Chapter 3 Methodology ..................................................................................... 34
3.0 Introduction ......................................................................................... 34
3.1 Research Design .................................................................................. 35
3.2 Development of Research Framework ................................................. 38
3.3 Hypotheses Statements ........................................................................ 40
3.4 Data Collection Methods ..................................................................... 42
3.4.1 Secondary Data ............................................................................ 42
3.4.2 Primary Data ................................................................................ 43
3.5 Sampling Design ................................................................................. 44
3.5.1 Target Population ......................................................................... 44
3.5.2 Sampling Frame and Sampling Location ...................................... 44
3.5.3 Sampling Elements ....................................................................... 44
3.5.4 Sampling Technique and sampling size ........................................ 45
3.6 Research Instrument ............................................................................ 47
3.7 Constructs Measurement...................................................................... 49
3.8 Data Processing ................................................................................... 51
3.9 Data Analysis ...................................................................................... 52
________________________________________________________________________
________________________________________________________________________
ix
Chapter 4 Data Analysis .................................................................................... 53
4.0 Introduction ......................................................................................... 53
4.1 Descriptive Analyses ........................................................................... 56
4.1.1 Demographics‟ Profile .................................................................. 56
4.1.2 Consumer behavior over SST ....................................................... 60
4.1.3 Independent and Dependent variables ........................................... 62
4.2 Inferential Analyses ............................................................................. 64
4.2.1 Factor Analysis............................................................................. 64
4.2.2 Reliability Analysis ...................................................................... 67
4.2.3 Multiple linear regression ............................................................. 68
4.2.4 Simple linear regression ............................................................... 73
4.2.5 Logistic regression ....................................................................... 76
4.3 Discussion of Results and Hypotheses testing conclusion .................... 78
Chapter 5 Discussion, Conclusion and Implications .......................................... 83
5.0 Introduction ......................................................................................... 83
5.1 Discussions of Major Findings............................................................. 83
5.2 Implications of the study...................................................................... 88
5.3 Managerial implications ...................................................................... 89
5.4 Limitations of the Study ...................................................................... 93
5.5 Conclusion and recommendations for future research .......................... 95
References …………………………………………………………………..…...97
Appendices …………………………………………………………………… 107

________________________________________________________________________
________________________________________________________________________
x
LIST OF TABLES
Table 2.1 Classification of SSTs on base of interface and purpose ……………. 13
Table 3.1: Summary of past studies on independent variables and dependent
variables ……………………………………………………………. 35
Table 4.1: Summary of confirmation factor analysis results for SST questionnaire
(N=210) …………………………………………………………….. 65
Table 4.2: Summary table of Cronbach‟s Alpha for each construct …………… 66
Table 4.3: Summary of multiple linear regressions……………………..……… 70
Table 4.4: Summary of multiple linear regressions …………………….……… 74
Table 4.5: Summary of logistic regression……………………………………… 77
Table 4.6: Summary of hypothesis testing results ……………………………….78

________________________________________________________________________
________________________________________________________________________
xi
LIST OF FIGURE
Figure 2.1: The Theory of Reasoned Action Model……………………………. 29
Figure 2.2: The Technology Acceptance Model ……………………………. … 31
Figure 3.1: Research framework on perceived factors influencing acceptance and
adoption of self-service technology ………………………..……... 37
Figure 4.1: Flow of influence analysis ……………………………………......... 53
Figure 4.2: Theoretical model and statistical analysis methods used …………...54
Figure 4.3: Respondent demographic – Gender ………………………………...56
Figure 4.4: Respondent demographic – Age …………………………………… 56
Figure 4.5: Respondent demographic - Education level ……………………...…57
Figure 4.6: Respondent demographic – Monthly household expenses (RM) ….. 57
Figure 4.7: Respondent demographic – Monthly household income (RM) …… 58
Figure 4.8: Frequency of each type of SST used …………………………….….60
Figure 4.9: Mean, mode and standard deviation for all variables ………….……62
Figure 4.10: SPSS output – Scatterplot for homoscedasticity test …………..…..68
Figure 4.11: SPSS output – Histogram for normality test ……………………… 68
Figure 4.12: SPSS output – Normal P-P plot of regression standardized
Residual ………………………………………………………….. 69
Figure 4.13: SPSS output – Histogram for normality test………………………. 73
Figure 4.14: Normal P-P plot of regression standardized residual ………………73

________________________________________________________________________
________________________________________________________________________
xii
PREFACE
This research project is original, unpublished, independent work by the author,
Chang, M.

________________________________________________________________________
________________________________________________________________________
xiii
ABSTRACTION
The purpose of the research project is to determine influential perceived factors on
using self-service technology (SST), through perceived factors to find out
Malaysian‟s attitude and behavior intention towards SST. The results of this
research would also be able to show if consumer perceived SST as supportive role
or already become a vital role for daily life. In this study include six independent
variables, namely perceived usefulness, individual perceived control, expected
outcome quality, technology anxiety, need for interaction and hedonic value to
measure the relationship towards attitude on SST. Further examine the
relationship on attitude and behavioural intention towards the actual used of SST.
Secondary data was used for literature review; the proposed research framework
was the results after analysing information from literature review contributed from
many researchers. TAM model was adopt for the study with some modification,
added more perceived factors that has been prove to be significant to SST in
research done by other researchers. Primary data was collected 210 questionnaire
surveys using non-probability sampling technique, through online self-
administered questionnaire.
This research found that only perceived usefulness, expected outcome quality and
hedonic value are positive related to attitude on SST. Attitude on SST is positively
related to behaviour intention on SST and behaviour intention on SST is positively
related to actual used of SST. The findings of this study contribute to business
management as well as government over Malaysia behaviour over using self-
service technologies.
________________________________________________________________________
________________________________________________________________________
1
CHAPTER 1
RESEARCH OVERVIEW
1.1 Introduction
This chapter given an overview of the research project that help to understanding
the perceived factors influencing the acceptance and adoption of self-service
technology (SST) in the context of Malaysia. Specifically, the study aims to
examine the causal effect on perceived factors over attitude, intention behaviour
and actual used of SST. There are six main areas which will be discussed in this
chapter, including the research background, the problem statement, the research
objectives, the research questions, the significance of the study and lastly the
chapter layout on the research project.
1.2 Research Background
Self-service technologies (SST) are technologies that enable individual to perform
a task or transaction without any interaction with service personnel and require
consumer actively participate in the operation process. We explore to SSTs in our
daily life widely. Self-service technology (SST) play a role in Malaysians‟ daily
life, it started back in 1981 when Maybank introduced Malaysia‟s first self-service
automated teller machine (ATM) (Moreira, 2013). There after Malaysia banking
industry successively introduced self-service kiosk such as cash deposit machine
and cheque deposit machine to assist in the heavy daily transactions in banking
industry. Air Asia even make it mandatory for local flight‟s customers to do self-
check in either through online web check in or using self-service kiosk provided
in airport, otherwise a penalty will be impose if check in via counter (Air Asia,
n.d). In December 2013, Malaysia first fully self-service kiosk cinema started its
operation in Premium-X Cinemas by MCT Consortium Berhad (Cinema Online,
________________________________________________________________________
________________________________________________________________________
2
2014). While one of the Sakae Sushi selling point is their Ipad menu, besides
picking up the sushi on the conveyor belt, customers can place their order by
browsing and clicking on the Ipad menu, the order will straight away goes to the
kitchen and it will be serve by the waiter once the dishes are ready.
Furthermore, SST also implemented in launderette segment. Self-service laundry
is on a growing trend as well. It was introduced to Malaysia 30 years ago but it
was not widely accepted by the public until recently. From year 2009, the biggest
market player of self-service laundry is Clean Pro. Clean Pro already had 100
branches in Malaysia in year 2014, not to forget the other 2 major players which
are Laundrybar and Adan Laundry, who also providing self-service laundry
services using token or coin for washing machine and dryer services (Lee & Tan,
2014).
Along with Malaysia government introduced on e-Government, seven government
agencies has initiated online self-service system aim to improve the overall
efficiency and effectiveness in serving the public, these agency include Services
Portal (myGovernment), e-Tanah, e-Consent, e-Filing, e-Local Government (e-PBT), e-
Kehakiman, Custom Information System (SMK), Pensions Online Workflow
Environment (POWER), and Training Information System (e-SILA) (Suki & Ramayah,
2010). All these are self-service platform for public to do filling, application, checking
status and other service through SST. Such implementation benefits both government and
the users, in various perspectives. For example ever year on April is the peak season for
personal income tax submission. With the implementation of e-filling SST, individual are
able to submit instantly online in the template prepared. In addition it also able to assist
user to calculate automatically on the final outcome on how much tax payment needed. It
make the whole process effective and efficient as both party can save time and enhance
the data accuracy and calculation accurately as no manual calculation and data input are
required, tax payer can make the payment instantly thereafter.

________________________________________________________________________
________________________________________________________________________
3
Previous researches on self-service technology
There are lots of studies conducted on the innovation and in the field of
information technology, such as Sandnes & Hagen (2010) conducted a study on
universally designed kiosk prototype established on a multimodal intelligent user
interface which adjust according to user‟s physical features. Many researches has
been conducted on this area, however, these engineering researcher did not help
marketers and business owner to understand why SST was not able to fully
adopted by end user given the large gain in efficiency, convenience and other
benefits mention above.
Thus, another group of researchers started to conduct research to fill up the gap.
Various studies have been conducted focusing on the acceptance and factor that
attracting consumer to conduct activities through SST in various areas. Bashir &
Albarbarawi (2011) conducted SST study focus on the use of smart phones and
tablet computers; Liu, Huang & Chiou (2012) conducted SST study on online
stock trading system brokers; where by Cho (2011) conducted SST study on
apparel retail settings; Huang & Martin-Taylor (2013) conducted SST study in the
context on human resource management.
In Bashir & Albarbarawi (2011) study, they have pointed out several reasons on
why peoples are not willing to adopt SST. Based on their initial research, the most
significant reasons was due to personal behaviour and the need to use SST.
Further breakdown on the personal behaviour, Bashir & Albarbarawi found that
cultures and values play an important role, while some of the user chooses to be
an innovator and some of them choose to adopt the technology on a much later
period which we used to categories them as laggards. This is very similar with
product adoption model, which supported by Roger (1995), where people behave
differently and this has been segmented into five different groups of consumer that
has been normally distributed into innovators, early adopters, early majority, late
majority and the laggards.

________________________________________________________________________
________________________________________________________________________
4
While the second reason user not using SST discussed by Bashir & Albarbarawi
(2011) was because of users are scared of making mistake. They feel risky and
worried when using SST that the services or products purchased were not up to
their expectation which might causing waste of time and money. Besides,
complex interface and language become one of the reasons that restrain user from
using SST.
The purpose of this research study is to determine influential perceived factors on
using SST, through perceived factors to find out consumers attitude towards SST
and behaviour intention towards SST in a Malaysia context.
________________________________________________________________________
________________________________________________________________________
5
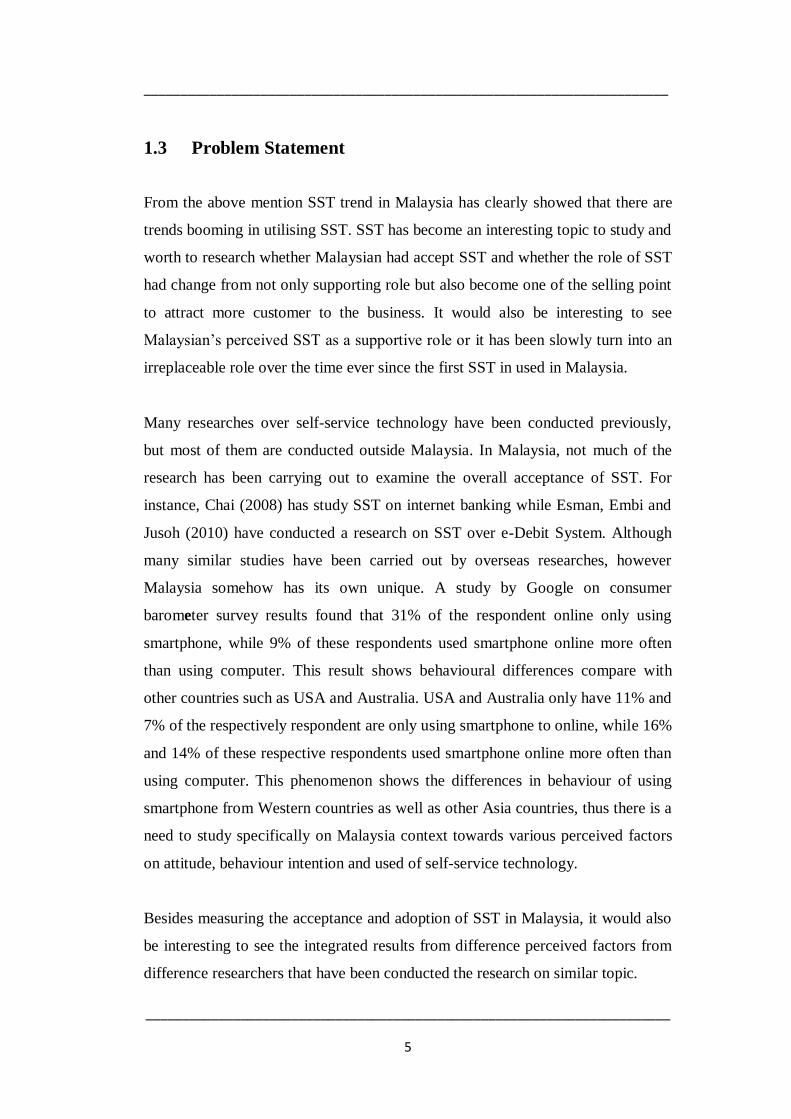
1.3 Problem Statement
From the above mention SST trend in Malaysia has clearly showed that there are
trends booming in utilising SST. SST has become an interesting topic to study and
worth to research whether Malaysian had accept SST and whether the role of SST
had change from not only supporting role but also become one of the selling point
to attract more customer to the business. It would also be interesting to see
Malaysian‟s perceived SST as a supportive role or it has been slowly turn into an
irreplaceable role over the time ever since the first SST in used in Malaysia.
Many researches over self-service technology have been conducted previously,
but most of them are conducted outside Malaysia. In Malaysia, not much of the
research has been carrying out to examine the overall acceptance of SST. For
instance, Chai (2008) has study SST on internet banking while Esman, Embi and
Jusoh (2010) have conducted a research on SST over e-Debit System. Although
many similar studies have been carried out by overseas researches, however
Malaysia somehow has its own unique. A study by Google on consumer
barometer survey results found that 31% of the respondent online only using
smartphone, while 9% of these respondents used smartphone online more often
than using computer. This result shows behavioural differences compare with
other countries such as USA and Australia. USA and Australia only have 11% and
7% of the respectively respondent are only using smartphone to online, while 16%
and 14% of these respective respondents used smartphone online more often than
using computer. This phenomenon shows the differences in behaviour of using
smartphone from Western countries as well as other Asia countries, thus there is a
need to study specifically on Malaysia context towards various perceived factors
on attitude, behaviour intention and used of self-service technology.
Besides measuring the acceptance and adoption of SST in Malaysia, it would also
be interesting to see the integrated results from difference perceived factors from
difference researchers that have been conducted the research on similar topic.

________________________________________________________________________
________________________________________________________________________
6
1.4 Research Objectives
With the above problem statement in mind, the objectives of this research are set
as below:
1. To identify significant relationship between perceived usefulness towards
attitude on self-service technology.
2. To identify significant relationship between individual perceived control
towards attitude on self-service technology.
3. To identify significant relationship between expected outcome quality
towards attitude on self-service technology.
4. To identify significant relationship between technology anxiety towards
attitude on self-service technology.
5. To identify significant relationship between need for interaction towards
attitude on self-service technology.
6. To identify significant relationship between hedonic value towards attitude
on self-service technology.
7. To identify significant relationship between attitude and behaviour intention
over self-service technology.
8. To identify significant relationship between behaviour intention over actual
used of self-service technology.

________________________________________________________________________
________________________________________________________________________
7
1.5 Research Question
The research problem above can be framed in the following eight research
questions:
1. How does perceived usefulness factor inference in relationship with attitude
towards self-service technology?
2. How does individual perceived control factor inference in relationship with
attitude towards self-service technology?
3. How does expected outcome quality factor inference in relationship with
attitude towards self-service technology?
4. How does expected technology anxiety factor inference in relationship with
attitude towards self-service technology?
5. How does need for interaction factor inference in relationship with attitude
towards self-service technology?
6. How does hedonic value factor inference in relationship with attitude
towards self-service technology?
7. How does attitude over self-service technology inference in relationship with
behaviour intention over self-service technology?
8. How does behaviour intention over self-service technology inference in
relationship with actual used of self-service technology?

________________________________________________________________________
________________________________________________________________________
8
1.6 Significance of the Study
The results of the study will provide valuable insight for business management
and government to identify the Malaysian acceptance and adoption of SST. From
literature review six factors has been identify to examined in this study which
include perceived usefulness, individual perceive control, expected outcome
quality, technology anxiety, need for interaction and hedonic value. These factors
help to find out if there any significant relationship that impact on attitude towards
SST that will have influence over behaviour intention and actual used of SST.
As this research will be conducting using causal model, hypothesizing if the actual
used of SST is affected by consumers‟ behavioural intention that affected by
attitude towards SST used. The results of this research will reflect the most
influential perceived factors over attitude and behaviour intention towards SST.
The positive results on attitude, behaviour intention towards SST reveals the
acceptance and adoption of self-service technology in Malaysia.
The results will somehow affect organisation decision over the implementation of
SST in future including but not limit to self-service kiosk, online trading platform,
vending machine as well as mobile application that able to install in smartphone.
Although organisation will evaluate using cost and benefits evaluation method,
however, it will not turn into desire outcome as planned as market acceptance and
adaptation will always remain as an unknown factor in any type of innovative
process. Although smartphone usage in Malaysia is high, it does not come to any
conclusion that people performing self-service via smartphone. From consumer
barometer survey (2014) found that the top 3 activities using smartphone are
visiting social network, using search engines and checking email. Thus, this
research is still important for organisation that looking into implementing mobile
applications
________________________________________________________________________
________________________________________________________________________
9
In additional, one of the hypotheses on hedonic value is significant to marketing
manager. If hedonic value over SST resulting a significant impact, marketing
manager should include SST as one of the selling point when advertising to the
public. The results would need to be taking into consideration when designing the
marketing plan for better resources allocation.
On the other hand, this study also provides valuable information to government.
The results of the study give an in sign on the nation‟s ability to accept the used of
SST, government department can then modify the current practice to adopt SST
due to the various benefits. This can not only reduce the public waiting time, but
also enable them to focus more on society group that needed their attention.

________________________________________________________________________
________________________________________________________________________
10
1.7 Chapter Layout
Chapter 1: Research Overview
Chapter one give an overview idea on the research study on perceived factors
influencing the acceptance and adoption of self-service technology. It also give a
brief research background, stating the problem statement, research objectives,
research questions, hypotheses of the study and also elaborate the importance of
the research topic contributed to organisations as well as to government.
Chapter 2: Literature Review
Chapter two will start with a briefly explain on self-service technology and
discusses about literature review on previous researcher findings and results on
the similar topic. The review of literate includes the relevant theoretical models,
proposed research framework, showcase the all the independent and dependent
variables in the hypotheses development.
Chapter 3: Methodology
Chapter three illustrate on the research design, theoretical framework, hypotheses
statements, data collection method, sampling design, research instrument,
constructs measurement, data processing and method of data analysis.
Chapter 4: Data Analysis
Chapter four presents the analysed results of data collection using SPSS.
Chapter 5: Discussions Conclusion and Implication
Chapter five illustrate the summary of the research project in term of statistical
analyses, major findings and implication as well as limitation of the study.
Nevertheless, also include suggestion and recommendation for future research.
________________________________________________________________________
________________________________________________________________________
11
CHAPTER 2
LITERATURE REVIEW
2.0 Introduction
This chapter illustrate review of secondary data over self-service technology as
well as the relevant factors that influencing perceived value over SST by
consumer as well as relevant theory applied. This chapter kick start with a brief
introduction on SST including classification as well as the pros and cons of
implementing SST in the business environment. The second part discusses about
the perceived factors variables that influencing the adaptation and acceptation of
using SST which contributed to the proposed research framework. Relevant
theory will also have a brief discussion in this chapter follow by the proposed
research framework.

________________________________________________________________________
________________________________________________________________________
12
2.1 Review of the Literature
2.1.1 Self-service technologies (SSTs)
Meuter, Ostrom, Roundtree, Bitner (2000) define self-service technologies (SSTs)
as technological interfaces that enable consumer to produce a service
independently from the interaction of direct service-employee involvement. One
of the most well-known self-service technologies is automated teller machine
(ATM), which was invented back in 1967 and it was 1st installed in London by
Barclays Bank (Milligan, 2007). Only by year 1981, ATM was introduced to
Malaysian by Maybank (Moreira, 2013). Besides that, SSTs also include online
banking, self-service laundry service, check-in kiosk in airport or hotel, m-
commerce and etc.
Classification of self-service technologies (SSTs)
As SST cover widely, Meuter et al. (2010) had contributed a table of classification
on SST base on interface (interactive, telephone, Internet, kiosks, video/CD) and
purpose (customer service, transactional, self-help) to distinguishing SSTs. This
consumer-based perceptual map of SSTs has been broadly discuss by several
researchers such as Chai (2008), Kaur & Gupta (2012), Cunningham,Young &
Gerlach (2008) and others.

________________________________________________________________________
________________________________________________________________________
13
Table 2.1: Classification of SSTs on base of interface and purpose
Note. From Matthew L. Meuter, Amy L. Ostrom, Robert I. Roundtree, Mary Jo Bitner (2000) Self-Service
Technologies: Understanding Customer Satisfaction with Technology-Based Service Encounters. Journal of
Marketing: July 2000, Vol. 64, No. 3, pp. 50-64.
In this research study will only focus on two types of interfaces, which are using
online or internet and interactive kiosk throughout all purposes. The reasons
simply because the users need to provide full and interaction on the web page,
applications or the kiosk in order to complete the task. Meaning that these types of
SSTs have more self-control and almost nil interaction with service employees to
complete the task, which is closer to the definition of self-service define above.
However, distinction from other types of SSTs‟ interfaces, video or CD interface
did not cover all of the purposes, while interactive voice responds or telephone
interface, user have the options to talk to the service personnel while the service
employees will do the rest of the task, as so interactive voice respond nor video or
CD interfaces will not be the focus on this study.

________________________________________________________________________
________________________________________________________________________
14
Pros and cons on self-service technologies (SSTs)
It is not easy for business management to make decide on change their operation
model using SSTs interface either entirely or partially. As Implementing SSTs not
only require high expenditure and overall collaboration, but it require a team of
people that are experience in technical on both hardware and software as well as
commercial expertise to support the SST operation. (Kiosk Solution, NA)
Regardless the troublesome mentions above, many big corporations still going for
SSTs, mainly are attracted from the long run benefits on implementing SST. Cost
are the biggest enemy for a business that all business wish to keep it at minimum;
upon implementing SST, the business are expect to reduce cost per transaction
(Honebin and Cammarano, 2006). The reason simple because SST replace service
personnel, the yearly increasing wages and leaves are part of the operations cost.
This becomes part of the burden to the management especially to meet workers‟
salary demand and bonus expectations. However, SST interface provide 24/7
services without hesitate. Corporation could spend the spare money on their core
business or improve in productivity in order to stay competitive in the market.
The second concern of the business usually will be efficiency and effectiveness.
Implementing SSTs system will reduce manual work from service employee and
this will directly reduce human mistakes. Besides, the data require by
management can generate as and when required as all data is on a real time basis.
Using SSTs reduce human interaction. This can solve the problems arise from
human interaction between employees and consumer, such as complaint and
arguments (Weijter, Rangarajan, Falk, & Schillewaert, 2007) Although there is a
known mantra in business that “customer always right”, which employees should
put their customer as priority in order to achieve high customer satisfaction and
attract repeat purchase. However some unreasonable customer or occasionally bad
emotion will turn the overall outcome differently which lead to argument,
complaint or even fighting if the environment are uncontrollable.

________________________________________________________________________
________________________________________________________________________
15
Besides, the convenient of SST help the business growth effective and efficient
over the long run as results of increasing customer self-sufficient in the decision
making process (Srikanth & Padmanabhan, 2002; Dabholkar, Bobbitt, & Lee,
2003). Especially internet and online interface allow user to perform the task
anywhere at any time. While self-service laundry services that open 24/7, suitable
for different habitual of customers that like to do their laundry at any time, day or
night regardless is a sunny or raining day.
________________________________________________________________________
________________________________________________________________________
16
2.1.2 Perceived usefulness
Perceived usefulness is one of the most influential factors in technology
acceptance model (TAM) that impacting on consumer attitude which also have a
causal effect to consumer behaviour intention and actual used of a certain
technology, this was supported by the studies conducted by Norazah, Ramayah
and Norbayah (2008) and Fu, Farn, and Chao (2006). Perceived usefulness has
been defined as the degree to a person believes in using a particular technology
system that would improve productivity, performance and effectiveness (Davis,
1989). Perceived usefulness has been an important factor influencing behaviour,
and has been widely used as part of TAM in measuring the acceptance and
adoption level on self-service technology. For instant, Cho (2011) was using
perceived usefulness on the study in self-service technology, investigation of the
potential for adoption in apparel retail settings; the results shows perceived
usefulness has significant relationship toward consumer attitude.
Besides in appear industry, such as banking, airport, and trading industry also
have the similar outcome, identified perceived usefulness as one of the major
driver for attitude toward an SST (Cho, 2011; Liu, Huang and Chiou, 2012;
Esman et al., 2010)
Dabholkar and Bagozzi (2002) mention it is difficult to measure perceived
usefulness in SST as consumer of SST do not own the technology, despite the fact
that they participate in using the technology. Unless this construct is measure on a
consistently and accurately manner on a performing task.

________________________________________________________________________
________________________________________________________________________
17
2.1.3 Individual perceive control
Bateson (1985) found that one of the reasons customers prefer to use self-service
processes is because of perceived control, although there are no additional
advantages such as less waiting time or lower price. Consumers prefer to have
some degree of control over a process or outcome (Anselmsson, 2001).
Meanwhile consumer must have some extent of understanding or instruction given
on how to operate the SST in order to have controllability over it (Lee & Allaway,
2002).
Collier (2006) study found that consumer who has a greater control in using SST
will generate positive attitude on SST as a results from inner tension and overall
anxiety from using SST. Similar results were concluded by Hui and Bateson
(1991). Dabholkar (1996) pointed that perceived control is being associated with
service quality, which consumer expect themselves to have some control to reduce
the chance of service failure while performing a task using SST and thus stimulate
SST adoption (Lee and Allaway, 2002). In contrast, the lesser perceive control,
consumer will tend to have negative attitude towards SST.
Yet, increasing in individual perceived control implied the transferring power of
control from employee to consumer. It became debateable topic on responsibilities
as this may give rise to the chances of making mistake as employees are trained
on the matter but not all individual could handle the same matter correctly.
Misinterpretation may happen even instruction is given. The mistake may
frustrated consumer as they would have to bear with the mistake and even absorb
the cost of error. Therefore, options are important for consumer to correct their
mistake or even cancel the whole transaction. (Collier, 2006)
Although consumer prefer to have options to control, but too much of options
may results a negative out come as it might become too complicated to use if
consumer cannot understand all the options available, thus finding a balance is
________________________________________________________________________
________________________________________________________________________
18
essential when designing on a SST (Collier, 2006). Wind and Rangaswamy (2001)
also state that when an individual is faced with too many options or a lack of
control when using a technology, they will psychologically shut down. When
consumers take on the role o f a partial employee, they must feel capable and in
control of the process. If a consumer is to perform a transaction without the
assistance of an employee, then he or she should have the ability to request
different options and also the ability to correct mistakes if they occur.

________________________________________________________________________
________________________________________________________________________
19
2.1.4 Expected outcome quality
In this dynamic and challenging business environment, expected outcome quality
becomes an imperative for business continues to be sustainable in the market
(Kaur & Gupta, 2012). A successful SST system must be able to provide the
ultimate core value to the service where consumer‟s expectation on SST to do
things perfectly with no error and generate the anticipated outcomes accordingly
to its designated purpose (Dabholkar & Bagozzi, 2002; Lee & Allaway, 2002).
Some researcher has found that expected outcome quality is positively associated
with perceived usefulness and positive relationship with customer satisfaction
level (Pai and Huang, 2011; Lee and Yang, 2013). Similarly in banking industry,
Bowen and Hedges (1993) pointed out that expected outcome quality play an
important major role as it could enhance the market share in banking industry.
Expected outcome quality is the consumer‟s expectation over a SST used to
delivery experience that is about to occur and this expectation is normally form
when information received by service promises made by the business (Bitner
1995), prior consumer experiences (Cadotte, Woodruff, and Jenkins, 1987),
advertising (Mittal, 1999), or word of mouth (Bansal and Voyer, 2000). It can be
further breakdown into desired service expectation and adequate service
expectation. Desired service expectation is what consumer hope to receive; while
adequate service expectation is the accepted level within the tolerance level given
that the outcome might not always as per their wish (Zeithaml, Bitner and Gremler,
2009).
The study conducted by Zeithaml and Bitner (1996) found that consumers
expectation outcome quality is build based on the belief of the service delivery are
function as standards or reference points. Consumers also have a tendency to to
assign different expectation on self-service options differently, such as higher and
straighter expectation outcome quality on banking sector and using this as a
reference points to judge it‟s service quality and performance. According to

________________________________________________________________________
________________________________________________________________________
20
Zeithaml et al. (2009), consumer will tend to have higher expectation on more
important sectors, thus lesser tolerance given.
Failing to meet the expected quality, consumers feel disappointed and
consequently would affecting the attitude towards the particular SST use that
produce disappointment.
________________________________________________________________________
________________________________________________________________________
21
2.1.5 Technology Anxiety
In the recent decade, technology has playing an important role in daily life and yet
it keeps changing, from the previous study conducted there is evidence showing
that people is facing difficulty to keep themselves update with current
technologies. To measure consumers accordance over technology, many
researchers have included technology anxiety or computer anxiety is frequently
used interchangeability in studies or research over acceptance towards certain
technology in order to verify the impact and degree of technology anxiety on the
public, which include Phongkusolchit (2008), Meuter (1999), Caramba-Coker
(2009), Chai (2008) and a lot more researchers. The degree of technology anxiety
in customers is a crucial indicator to reflect whether customers are willing to
purchase or to use innovations technology-related product (Sinkovics, Stottinger,
Schlegelmilch, & Ram, 2002).
Technology anxiety refers to a negative feeling towards technology, which have
similar meaning for technophobia and computer aversion mentions in other
research paper. Meuter et al. (2003) define technology anxiety as users mind set
on ability and willingness to use and control over technology-related products
(Meuter, Ostrom, Bitner, & Roundtree, 2003).
Technology anxiety did not mean that individual do not know how to use a
computer, but is about confidence in their ability to handle with technology and
the willingness to use technology product (Meuter et al, 2003). Kjerulff, Pillar,
Mills & Lanigan (1992) study found that nurses with high technology anxiety
view their work place as source of stress and frustration which supported by
Doronina (1995) who illustrious that one‟s who anxiety to technology will be
nervousness in using computers, give negative comments and feedback, attempts
to minimise timing spent on using computers and avoiding using technology
related product as much as possible. This is due to consumers lack confidence
over the ability to effectively control and hand technology as results of rapid

________________________________________________________________________
________________________________________________________________________
22
change technology (Oyedele and Simpson, 2007).
Technology anxiety serves as one of the factors that impacting the technology
readiness index (TRI), which the model introduced by Parasuraman (2000). TRI
measure the propensity to embrace and use new technologies for accomplishing
certain goals. These model has been incorporated several factors such as cultural,
attitude, technology anxiety and one‟s capacity and willingness to use. Once
technology readiness in individual is set, he or she will be more likely to have a
try on new technology (Parasuraman , 2000).

________________________________________________________________________
________________________________________________________________________
23
2.1.6 Need for interaction
Need for interaction with employees become one of the barriers for SST get
implementation on everything or processes as SST is not suitable for complex
service and process. It may require human analysis and assistance to evaluate the
situation on a case by case basis. For instance, banking industry implements SST
with ATM, CDM online and phone banking services. However to get a bank loan
is not suitable for SST, as this is a complex procedure. Besides collecting the
relevant documentations, banker needs to evaluate the applicant‟s ability to
payback, financial background and other factors that might differ the decision
making from one individual to another. In the shoes of applicant, he or she may
have extensive questions on the loan rate, tenure, clauses and other non-general
questions that needed extensive consultations. In such case SST is not suitable.
SST are suitable to serve short, straight forward and routine process (Collier,
2006), such as self-service Laundromat service only required as simple as 5 steps
to get the clothes washed. With the aid of picture and simples wordings of
instructions, consumers have no issue to run the SST at their own convenient time.
Beside that most of the online selling platform or website provide frequent asked
question (FAQ) for user to refer and clear their doubts when encounter any issues
during the transactions.
Esman et al. (2010)study found that consumer did not perceived need for
interaction with bank employees as important factors to use SST, as longer
waiting time are needed, similar results on the study conducted by Curran and
Meuter (2005) found that consumer prefer to use ATM and online banking
compare to heading over the counter.
Besides complexity of the process, Hornik (1992) study also found that making
eye contact with customer are important as it will enhance the customer
experience and satisfaction, feeling the personal touch thus would have a positive
________________________________________________________________________
________________________________________________________________________
24
attitude toward the particular restaurant.
A part from service processes, personal behaviour that vary from individual will
reflect the different need for interaction with employees. Introversion people are
quiet, reserved and shy. They are more confortable to do things without the face to
face interaction with human (Koch and Pratarelli, 2004). These people prefer to
read instruction and follow the steps given rather than approaching the employee;
while outspoken people prefer to talk to people and prefer to have some
interaction with employees (Collier, 2006; Phongkusolchit, 2008).
________________________________________________________________________
________________________________________________________________________
25
2.1.7 Hedonic Value
Hedonic value is very subjective to each individual and it arises from individual‟s
capacity to build hedonic responses such as perceive enjoyment (Babin, Darden
and Griffin, 1994). Building a positive hedonic value is important, as consumers
with positive hedonic value tend to have significant positive behaviour including
willingness to share verbal recommendations with others. Besides that researcher
also found that adaptability had a significant relationship with hedonic value
judgment over SST (Collier, 2006) .
The study from Matzler, Bidmon, & Grabner-Kräuter (2006) mention that
consumer with hedonic value will increased loyalty and forming brand trust. This
is supported by Kazakeviciute & Banyte (2012), researcher further investigated
that hedonic value could be built through the consumers‟ social, emotion and
epistemic experiences. Based on Holbrook & Hirschman (1982), utilitarian and
hedonic products classify perceived enjoyment and playfulness as hedonic. As so
in this research, hedonic value will investigate thru the perceive enjoyment and
fun on SST.
Perceived enjoyment is a positive sensory stimulation such as joy and pleasure
that emerge from using SST (Hirschman & Holbrook,1982; Teo, 2001) Many
researchers found that perceived enjoyment or having fun in using SST has
significant impact towards creating a positive attitude (Dabholkar and Bagozzi,
2002). Dabholkar (1994) found that the intrinsic motivation for consumer to used
SST is perceive enjoyment and fun attract them in using technologies and this is
supported by Igbaria, Parasuraman & Baroudi (1996). Consumer choose to use
SST as they enjoy using SST, having fun and feel entertain compare to the
traditional way of doing things (Koufaris, 2002).
In Cho (2011) study, perceived enjoyment has been used as part of the intrinsic
motivation factors on measuring the consumer attitude towards using SST. The
results showed significant positive outcome. Van der Heijden (2004) further

________________________________________________________________________
________________________________________________________________________
26
suggested that program developer should put in more effort to create hedonic
content as in computer system, such as increase he visual layout, graphical and
sound to make user feel the fun while using system as consumers use
technological innovations for entertainment.
________________________________________________________________________
________________________________________________________________________
27
2.1.8 Attitude
Eagly and Chaiken (1993) define attitude as a psychological tendency that is
expressing self-evaluation with a degree of favourable or unfavourable towards an
object behavioural and this psychological tendency is difficult to change. While
Hogg, & Vaughan (2005) define attitude as a reasonably persistent way of
organizing one‟s beliefs, feelings, and behavioural tendencies towards generally
significant objects, groups, events or symbols. Whereas Dabholkar & Bagozzi
(2002) simply describe attitude as consumers‟ feelings towards using SST in his
study. This attitude can be positive or negative based on consumers‟ own
assessment.
Fishbein and Ajzen‟s (1975) had further split attitude into 2 constructs, which is
attitude toward an object and attitude toward the specific behaviour. The second
part on attitude toward a specific behaviour has been incorporated in TAM that
has been discussed earlier showing a strong relationship over attitude and
behaviour. One‟s positive attitude towards the used of SST will lead continuously
used of SST in future or increase the frequency of using it.
Researcher has further breakdown attitude into 3 elements, which are: affective is
referring to personal feelings and emotion towards an object; behavioural is refer
to the ways the person act or behave and cognitive is refer to one‟s believe or
knowledge towards an object, this is also known as ABC model of attitude
(McLeod, 2009).
This has led to a board study over attitude –behaviour relationship, using attitude
as an effective predictor of behaviour. The stronger the attitude the more likely it
should affected in one‟s behaviour. In this research, to determine the SST attitude-
behaviour relationship is straightforward and one‟s evaluation should linked to the
perceived factors discussed earlier over the choice of using SST or employee
service.
________________________________________________________________________
________________________________________________________________________
28
2.1.9 Attitude – behavior intention
Various previous studies have been conducted on attitude – behaviour intention
relationship. The results indicated the behaviour intentions over SST are
determined by the attitudes towards SST that determined by SST‟s various
characteristic and advantages as well as individual perceived values (Curran et al.,
2003; Dabholkar, 1996; Dabholkar and Bagozzi, 2002). Besides being a part of
TAM, the attitude – behaviour intention relationship also had been studied in the
theory of reasoned action (TRA) by Fishbein and Ajzen (1975), focus in
behavioural intention rather than the actual behaviour, arguing that intentions does
not always lead to actual action by consumer. In addition, attitude – behaviour
intention relationship also being a part of theory of planned behaviour (TPB)
model by Ajzen and Madden (1986) state that actual behaviour is not determined
solely by behavioural intentions. The connection of intention-behaviour is
expected to be different from one and other due to across situations.
However, this attitude-behaviour relationship did not apply to all situations where
a study conducted by Lapiere (1934) found that there is exceptional case, in some
cases cognitive and affective value did not seem to be in line with behavioural,
can causes some conflict in attitude-behavioural relationship. This is supported
with Theory of Self-Regulation (TSR) by Bagozzi (1992), focusing on examined
conative, motivational and emotional processes in performing of intentions and
behaviour. The researcher found that attitudes do not necessarily lead to
behavioural intentions due to lack of motivational to perform a certain task. The
study shows desire must be exists for proximal cause of intentions, whereas
attitudes were reflected as a distal cause, although it stimulates desires.
________________________________________________________________________
________________________________________________________________________
29
2.2 Review of theoretical model
In order to have a better understand on how consumer come across to accept and
adopt SST, relevant literature review on models and studies that applied
theoretical and empirical bases on consumer acceptance and adaptation are
summarise as following:
The innovation adoption process:
Meuter (1999) used innovation adoption process to study on consumer readiness
to use SST. In innovation adoption process there are 6 stages: awareness,
investigation, evaluation, trial, repeat purchase and commitment.
However, the numbers of stages and sequence may be different depends on
whether the product is high or low involvement. For high involvement products
consumer may fully follow the sequence and steps: awareness, investigation,
investigation, attitude formation, trial and adoption; whereby for low involvement
product, consumer may found it waste of time or simply just “trying” rather than
to go through the full innovation adoption process: awareness, trial, attitude
formation and adoption (Gatignon and Robertson, 1985).
In Meuter (1999) study, researcher believes that consumer readiness on using
SST‟s key determinant is trial in the process. Once consumer trial on SST, it is
higher chance that the consumer will repeat using SST.

________________________________________________________________________
________________________________________________________________________
30
The Theory of Reasoned Action
This model was first developed in the late 1960s by Martin Fishbein and revised
and expanded by Fishbein and Icek Azjen. The Theory of Reasoned Action is an
intention model that used to predict and explain human‟s behavior based on
beliefs and attitudes (Peter & Olson, 2005).
An intention is a plan or likelihood that someone will behave in a particular way
in a specific situation regardless the actual outcome. For instant, a smoker who is
thinking about to quit smoking intends or plans to quit, but in actual he or she may
or may not actually follow through on that intention. TRA study at humans‟
attitudes and norms in conjunction with subjective norms towards a particular
behaviour as these was found to be the main influences on intention that motivate
behaviour (Hale, Householder & Greene, 2002).
Figure 2.1: The Theory of Reasoned Action Model
Note. From: Davis, F., Bagozzi,R. & Washaw, P.(1989). User acceptance of computer technology: a comparison of two theoretical models. Management Science, 35(8), 982-1003.

________________________________________________________________________
________________________________________________________________________
31
Technology Acceptance Model (TAM)
Technology Acceptance Model (TAM) is used to study individual‟s perceptions
that affect his or her intentions to use a certain type of technology as well as the
actual usage. The model was established on the basis of extension in theory of
Reasoned Action (TRA) (Chuttur, 2009). Various researchers used TAM to
measure the acceptance level in new technology from two core perspective, which
are (i) perceived usefulness and (ii) perceived ease of used. From these two core
construct to check on the attitude towards the system, which will reveal user‟s
behavioural intention and behavioural usage of the technology.
Davis (1989) define perceived usefulness as the degree of one‟s believe using a
particular technology could enhance job performance, which found to be a
strongly influential factor from how user come to accept and adopt a certain
technology via intention and behaviour; while perceived ease of use is the degree
of one‟s believe using a particular technology is effortless.
TAM is known to be the most widely recognised empirical study through
validations, applications and replications (Legris, Ingham and Collerette 2003).
However, Chuttur (2009) who did the overview study on TAM has found that this
model could be better established if the gap on lacks of rigidness and relevance
was fulfilled (Chuttur, 2009).
Many researcher has then modify TAM from the original construct to include
more factors that believe would somehow to be more relevance in order to
measure the impact on attitude towards technology reflecting significant influence
on intention & behaviour over the technology. For instance, Bobbitt and
Dabholkar (2001) modify TAM by incorporate previous experience of self-service
over individual‟s attitude towards using the technology. In this study, a slight
modify TAM model will be carry out to fill up relevance gap in order to figure out
perceived factors influencing the acceptance and adoption of SST.

________________________________________________________________________
________________________________________________________________________
32
Besides that, the study would also be interesting to see integrated results on
perceived factors from literate review discussed. The proposed research
framework will be discussed detail on the next section.
Figure 2.2: The Technology Acceptance Model
Note. From Davis, F.(1989) "Perceived Usefulness, Perceived Ease of Use and User Acceptance of
Information Technology," M IS Quarterly, pp 319-340

________________________________________________________________________
________________________________________________________________________
33
2.3 Research Gap
There are several studies on SST has been conducted in Malaysia, for instant Chai
(2008) used model of consumer trial SST to identify the real key mediators and
the likelihood of trial in Internet-based banking SST service among Malaysians.
While Esman,Embi and Jusoh (2010) research focusing on postgraduate students
intention to use SST offered by the Bursary and to figure out the affecting factors.
In their studies, there used perceived usefulness, perceived ease of use, perceived
enjoyment need for interaction, security and privacy against behavioural intention
to use SST. In addition, Suki & Ramayah (2010) used Structural Equation
Modeling (SEM) techniques to measure and identify determinants of user
acceptance and its causal relationships using a theoretical model based on the
Technology Acceptance Model focusing on e-Government services in Malaysia.
In this study, it is interesting to see the integrated perceived factors adopt from
several previous studies and using Technology Acceptance Model and multiple
linear regression analysis to identify Malaysian‟s attitude and behaviour intention
towards SST. In this study there will be six independent variables, namely
perceived usefulness, individual perceived control, expected outcome quality,
technology Anxiety, need for interaction and hedonic value to measure the
relationship towards attitude on SST. The study will also further examine the
relationship on attitude and behavioural intention towards the actual used of SST.

________________________________________________________________________
________________________________________________________________________
34
CHAPTER 3
METHODOLOGY
3.0 Introduction
This chapter discussing on the processes and methodology used to conduct this
research study. In this chapter also talk about research design that shows the
overall strategy used in a coherent and logical way to effectively address the
research objective. Follow by explaining the research framework which makes up
the hypotheses statements that used to address research objectives.
Primary and secondary data collection methods will also be discuss together with
sampling design, research instruments, construction measurement, data processing
and data analysing. The process of the research study starts with the development
of the research framework and hypothesis which states the expected outcome of
the study which to be validate through data analysis.
________________________________________________________________________
________________________________________________________________________
35
3.1 Research Design
This study utilizes inferential statistic research design, which used samples to
generalize the populations‟ attitude, behavioral towards SST by performing
hypothesis testing to validate the relationship among variables (Hair, Money,
Samouel and Page, 2007). A cross-sectional structured survey is conducted via
self-administration questionnaires. The collection of data is to make inferences of
population of attitude and behavioral over SST at a point in time, thus this survey
captured the attitude and behavior of respondent inferences population‟s attitude
and behavior at this particular point of time (Lavrakas, 2008).
In this research, quantitative research will be conduct for the purpose of
measuring the independent variables that would affect the consumers‟ attitude,
behavior and actual used towards the used of SST in Malaysia context via
questionnaire survey. The purpose of quantitative research is to validate the
relationship between independent variables and dependent variables that have
been tested on prior empirical study within or out outside Malaysia in the past as
well as to check if the same results are apply to Malaysia consumers.
A summary of table independent variables and dependent variables as well as the
sources are presented in the table below to showcase the relevant variables that
have been study in previous study.

________________________________________________________________________
________________________________________________________________________
36
Table 3.1: Summary of past studies on independent variables and dependent
variables
Variables Sources
IV1 Perceived usefulness Godoe & Johansen (2012)
Suki & Ramayah (2010)
Curran & Meuter (2005)
Lin & Chang (2011)
Huang & Martin-Taylor (2013)
Oghazi, Mostaghel, Hultman & Parida (2012)
Kaur & Gupta (2012)
Esman, Embi & Jusoh (2010)
Weijters, Rangarajan, Falk & Schillewaert (2007)
Faqih & Jaradat (2014)
Kokkinou (2010)
Cho (2011)
Liu,Huang & Chiou (2012)
IV2 Individual perceived
control
Caramba-Coker (2009)
Kokkinou (2010)
Faqih & Jaradat (2014)
IV3 Expected outcome
quality
Kokkinou (2010)
Faqih & Jaradat (2014)
Kallweit, Spreer & Toporowski (2014)
Phongkusolchit (2008)
IV4 Technology anxiety Phongkusolchit (2008)
Meuter, Bitner, Ostrom & Brown (2005)
Meuter (1999)
Cho (2011)
Kokkinou (2010)
Chai (2008)
Jia, Wang, Ge, Shi, & Yao (2012)

________________________________________________________________________
________________________________________________________________________
37
Table 3.1: Summary of past studies on independent variables and dependent
variables (Continue)
Variables Sources
IV6 Hedonic value Kokkinou (2010)
Oghazi, Mostaghel, Hultman & Parida (2012)
Esman, Embi & Jusoh (2010)
Chea (2006)
Weijters, Rangarajan, Falk & Schillewaert (2007)
Collier (2006)
Curran & Meuter (2007)
DV1 Attitude towards
using SST
Cho (2011)
Suki & Ramayah (2010)
Curran & Meuter (2005)
Curran & Meuter (2007)
Kaur & Gupta (2012)
Weijters, Rangarajan, Falk & Schillewaert (2007)
Kallweit, Spreer & Toporowski (2014)
Collier (2006)
Oghazi, Mostaghel, Hultman& Parida (2012)
DV2 Behaviour intention
to use SST
Cho (2011)
Kaur & Gupta (2012)
Esman, Embi & Jusoh (2010)
Phongkusolchit (2008)
Collier (2006)
Chea (2006)
DV3 Actual used of SST Phongkusolchit (2008)
Caramba-Coker (2009)
Faqih & Jaradat (2014)
Chea (2006)

________________________________________________________________________
________________________________________________________________________
38
3.2 Development of Research Framework
Research framework consists of concepts that are used in a logical and sequential
design to clearly outline preferred approach for purpose of explaining the
predicted outcome.
The research framework is based on the literature review in chapter 2. Several
factors are driven from different past studies and adapted to the study of perceived
factors influencing the acceptance and adoption of self-service technology. By
incorporated those selected independent variables that believe to be able to
illustrate a better model that capable to reflect the true value of consumers‟
attitude and behaviour towards SST.
These independent variables are then integrated into modified Technology
Acceptance Model (TAM) to see if this research framework can better explain the
research objectives. The research framework is shown as below:
Figure 3.1: Research framework on perceived factors influencing acceptance and
adoption of self-service technology
________________________________________________________________________
________________________________________________________________________
39
As mention, the above research framework are modify from Technology
acceptance model. The modification are reflected in the independent variables
where more perceived factors have been discussed in literature review are adopted
and integrate into this research model, while the original factor on ease to use was
removed. This is because in the study of Islam, Azad, Mantymaki & Islam (2014)
pointed out that ease of use has not linked to attitude and behavioural intention
consistently. Ease of use become significant in TAM depends on the task
measured. The researchers also mention that 24% of the previous studies was
shown to be insufficient evidence to conclude that perceive ease to use factor have
significant relationship with attitude and behaviour intention (Islam, Azad,
Mantymaki & Islam, 2014).

________________________________________________________________________
________________________________________________________________________
40
3.3 Hypotheses Statements
The eight hypotheses from the research framework discussed earlier are illustrated
as below:
First Hypothesis:
H10: There is no relationship between perceived usefulness and attitude on self-
service technology.
H1a: There is a positive relationship between perceived usefulness towards
attitude on self-service technology.
Second Hypothesis:
H20: There is no relationship between individual perceived controls and attitude
on self-service technology.
H2a: There is a positive relationship between individual perceived controls
towards attitude on self-service technology.
Third Hypothesis:
H30: There is no relationship between expected outcome qualities and attitude on
self-service technology.
H3a: There is a positive relationship between expected outcome qualities towards
attitude on self-service technology.
Fourth Hypothesis:
H40: There is no relationship between technology anxieties and attitude on self-
service technology.
H4a: There is a negative relationship between technology anxieties towards
attitude on self-service technology.
________________________________________________________________________
________________________________________________________________________
41
Fifth Hypothesis:
H50: There is no relationship between need for interaction and attitude on self-
service technology.
H5a: There is a negative relationship between need for interaction towards attitude
on self-service technology.
Sixth Hypothesis:
H60: There is no relationship between hedonic values and attitude on self-service
technology.
H6a: There is a positive relationship between hedonic values towards attitude on
self-service technology.
Seventh Hypothesis:
H70: There no relationship between attitude and behaviour intention over self-
service technology.
H7a: There is a positive relationship between attitude and behaviour intention over
self-service technology.
Eighth Hypothesis:
H80: There is a positive relationship between behaviour intention and actual used
of self-service technology.
H8a: There is a positive relationship between behaviour intention over actual used
of self-service technology.

________________________________________________________________________
________________________________________________________________________
42
3.4 Data Collection Methods
3.4.1 Secondary Data
Secondary data are information that has been collected by previous researcher for
some other purpose than the research project on hand (Burns and Bush, 2000),
such as government statistic, historical share price, company annual accounting
report and other. Secondary data normally serve with low cost or even free of
charge, unless the particular important question cannot be adequately addressed or
resolved with secondary data, then collecting of primary data is necessarily (Hair
et al., 2007).
In this study, secondary data was collected for the purpose of better
understanding and define the problem in order to develop the research model for
this research, for instant, to identifying the key perceived factors that have the
most influential in SST. The past empirical studies provide a better scope,
direction and ideas to identify those independent and dependent variables that
used to fulfill the research objective. However, these secondary data can be out
dated, not exactly fit into the research model and might due to cultural difference
in different country, thus primary data are needed to further validate the results
conducted by previous researchers on the similar topic over SST.
The sources of secondary data for this study are mainly obtained from literature
review of the journals, book, article and etc. In this research, most of the
secondary data are collected through journal and book. Where the journals have
obtained through Emerald, Sciences direct, Goggle scholar and other database in
UTAR online database. A part of that, some information also collected through
government publications on statistics, analyses offered by the media and
corporations and websites.

________________________________________________________________________
________________________________________________________________________
43
3.4.2 Primary Data
Primary data can help to fill up the gap in of secondary data problems such as
outdate, different target respondent, different measurement design, unable to
exactly fit into the research objectives. Primary data are information that is the
firsthand data collected by the researcher specifically for the research objectives
(Burns and Bush, 2000) that targeted to solve the research problem. There are
three main methods to collect primary data such as survey method, interview
method and observation method (Currie & CIPD, 2005)
In this study survey questionnaire is used to collect primary data. The
questionnaire designed and distribute to the target respondent via self-
administration structured questionnaire survey. This method are used to provide a
standardize question and with a same set of options given to the respondents,
which enable to have easier data analysis on a later stage.
________________________________________________________________________
________________________________________________________________________
44
3.5 Sampling Design
3.5.1 Target Population
The target population is the ideal population on research study that would want to
make inference from sampling. Since the objective of this study is to determine
influential perceived factors on using SST, through perceived factors to find out
Malaysian‟s attitude and behaviour intention towards SST. Hence, the target
population for this study is targeted on all Malaysian from age 21 above, used at
least 1 time on any type of SST in the past 1 month.
3.5.2 Sampling Frame and Sampling Location
Sampling frame is a complete list of all the members of the population that wish
to study. As mention above, sampling frame covered all Malaysian from age 21
above are estimated to be 18,404,892 representing 61.2% of total Malaysia
population of according to the CIA world fact book on Malaysian estimation
population for year 2014 (CIA, 2014)
However, to include the additional screening criteria that the respondent must be
used at least 1 time on any type of SST in the past 1 month, the sampling frame
will definitely lesser than 18,404,892 Malaysian.
3.5.3 Sampling Elements
Sampling element of this research is individual consumer of SST. The survey
questionnaire is distributed via e-mail and social media platform such as
Facebook.
________________________________________________________________________
________________________________________________________________________
45
3.5.4 Sampling Technique and sampling size
According to Barreiro & Albandoz (2001) there are three types of sampling
techniques, which are:
1. Probability sampling or random sampling, each sample has the same
probability of being selected.
2. Purposive sampling, selection of the sample according to researcher‟s
purpose of study.
3. No – rule sampling or nonprobability sampling, each sample do not have the
same probability of being selected.
4. Under nonprobability sampling, there are three methods, which are
convenience, quota and snowball method.
In this study, nonprobability sampling technique convenience method is used for
sample selection. The questionnaire is design using Google form, which allow
building the survey questionnaire easily and the finished questionnaire is
dedicated by a link or URL can easily share to reach out to the target respondent
via e-mail, personal blog, social media or even share it out using smart phone‟s
communication application such as Whatapps, line and etc.
As convenience method is adopted, this research questionnaire link is distributed
on social media, blogs and e-mail. Besides distributed via e-mail are more private
and specify to a single person, distribution via social media and blogs are pretty
open to public. A brief note was put up to invite qualify respondent to answer the
survey at their own time own preference. Some of the respondent even shares the
link to their extended friends and family members which made the research data
collection more efficient.

________________________________________________________________________
________________________________________________________________________
46
According to Roscoe (1975), sample sizes larger than 30 and less than 500 is good
enough to achieve acceptable confidence level for most research. In this study is
targeting to receive 300 respondents to complete online self-administered
questionnaire, where respondent are required to read the instructions and answer
all the questions to complete the survey on their own without the presence of
interviewer.
________________________________________________________________________
________________________________________________________________________
47
3.6 Research Instrument
Questionnaire survey is chosen to collect primary data. The questionnaire is
design using Google form, for the use of building survey questionnaire easily and
is free. Google form provides different measure option for different needs and the
responses are updated in excel spread sheet automatically. By doing so, it save
lots of time on data collection in terms of transferring respondent input into excel;
save time and money as to get the questionnaire distribute in form of link or URL
rather than printed copies. The link or URL was distributed via e-mail, blogs and
social media or even share it out using smart phone‟s communication application
such as Whatapps, line and etc. Respondent can easily access to the questionnaire
via computer as well as smartphone.
Since the URL are posted on the public blogs and social media, people who see
and read on the post are clearly aware of this undisguised survey is from UTAR
student who performing the study for academic purpose, condition of qualify
respondent, research objective as well as their response and identity will remain
anonymity and confidentiality. Similarly information is written on the e-mail,
Whatapps and Line message send together with the questionnaire URL.
Some of the questions in questionnaire was self-created and some was adopted
and modified from several researches which include Godoe, P., & Johansen, T.S.
(2012), Kokkinou, A. (2010), Caramba-Coker, F. O. (2009), Faqih, K. M., &
Jaradat, M. I. R. M. (2014), Chai, K. F. (2008), Phongkusolchit, K. (2008) and
Cho, S. (2011). These researchers had done the study on the same area on self-
service technology, but using different theoretical model or perceive value for
measuring, thus relevant questionnaire are adopt and modify in this study.
The questionnaire is closed ended designed. Respondent are required to choose
the options given in the questionnaire and answer all questions. The questionnaire
can be segregated into 3 parts, part A, B and C. Part A is the questions measuring
how often SST are used, while part B is the questions designed to gather data
________________________________________________________________________
________________________________________________________________________
48
regarding to the research question to identify which are the key perceived factors
for consumers to adopt and accept SST. The questionnaire used 7 point Likert
scale to measure the level of agreement of each questions. Part C is demographic
questions on respondent personal information. The whole set of questionnaire are
expected be complete within 10 to 15 minutes.
Prior to distribution of the actual survey questionnaire, a total of 10 pilot test
samples have been carried out. This is to analyse initial data to identify limitations
of the preliminary questionnaire (Hair et al., 2007). The questionnaire was being
refined for better sentence structure and easy to understand after the feedback
from pilot testing.

________________________________________________________________________
________________________________________________________________________
49
3.7 Constructs Measurement
In the questionnaire, few type of measurement scales can be carry out to measure
the attitudes of respondents towards SST, which including interval, ordinal and
nominal scales. The discussion will be breakdown according to the questionnaire
part A,B and C accordingly.
Part A measure the how often are Malaysians used SST and what are the services
they used SST the most. The data collection from this section is mainly for the use
of dependent variables on the actual used of SST. Ordinal scales was used mainly
in this session to measure how frequent consumer using each type of these SST
given in the options of seven examples in the questionnaire including ATM &
CDM, self-service laundry service, online transactions via mobile commerce, self-
service kiosks in airport, online trading platform, online purchase and online or
phone banking . Ordinal scales provide option that used to rank an object that
reflects the amount or level (Schuh & Upcraft, 2001). While Nominal scales was
used to measure what type of SST are most popular among the respondent within
the seven SST examples mention above.
In part B, the questions were designed to measure the respondent perceived
factors towards SST and all questions are measure via 7 point likert interval scales,
which respondent choose the options base on the vary degrees of agreement of the
statement (Schuh & Upcraft, 2001). The options are equal intervals where 1
represent strongly disagree and 7 represent strongly agree. These perceived factors
including perceived usefulness, individual perceived control, expected outcome
quality, technology anxiety, need for interaction, hedonic value. Similarly, 7 point
Likert scales also used to measure respondents‟ attitude and behavioural intention
towards SST.
Lastly, part C measures the demographic respondents profile regards to personal
information. Nominal scales apply mostly in this section which helps to categorise
the respondent. Unlike ordinal scales, nominal scales do not imply ranking or

________________________________________________________________________
________________________________________________________________________
50
order in the dimension given therefore no measure information available for such
as “more than”, as it only define labels and the characteristic of description
(Schuh and Upcraft, 2001; Burns & Bush, 2000 ). Gender, ethnic group, religion,
employment status and information sources are using nominal scales to measure,
while age, education background, household income and expenses are using
ordinal scales to measure with multiple choice option given.

________________________________________________________________________
________________________________________________________________________
51
3.8 Data Processing
Data processing involves few steps of action with purpose of improving result‟s
quality and minimise errors. These steps including data checking, editing, coding,
transcribing, data cleaning, statistical adjustment and analysis strategy selection
(Pink, 2010).
With the aid of Google form, respondents perform self-administration survey
questionnaire online, and the system can help to ensure empty questions are filled,
before proceed to next session. This has avoid the common questionnaire mistake
and reduce researcher burden on sorting out errors such as incompleteness
questionnaire, did not follow instructions, missing pages or even mistake incur by
researcher on inputting data into system.
Some of the questions need to do reverse coding, while some question using
nominal and ordinal scales‟ data need to assign numeric codes so that when
running the data analysis, the results are accurate. The data need to be
consistencies and avoid using extreme values data that might influence the final
outcome.
________________________________________________________________________
________________________________________________________________________
52
3.9 Data Analysis
As Google form is used in the questionnaire survey, the responses from
respondent will be save in Google excel instantly upon completion of each and
every survey. The data will then transfer to SPSS (The Statistical Packages for
Social Science) to run analyse on the responses according to the research
objectives in this study.
By taking into consideration of the sample size and type of variables, multiple
liner regression analysis is the most suitable way to perform analysis in this study
to test the relationship between two or more independent variable and one
dependent variable at a same time.
Besides that, descriptive analyses will be carry out to present data related to
attitude towards SSTs and demographic information. Never the less, reliability test
on Cronbach‟s will be carry out.

________________________________________________________________________
________________________________________________________________________
53
CHAPTER 4
DATA ANALYSIS
4.0 Introduction
This chapter will be presenting the test and analysis base on the data collected
using questionnaire discussed in previous chapter. A total of 210 samples of self-
administered questionnaire were collected at the end of closing date. Respondents
conducted the survey from any part of the Malaysia through internet via computer,
smartphone or tablet at their own convenient time. No missing value or outlier
was found in the data collected. This online questionnaire was posted and
distributed on social media, e-mail, and smartphone communication application
such as Whatapps and Line for a period of 2 months.
All test and analysis on primary data collected will be conduct using Statistical
Package for the Social Sciences (SPSS) version 21. Descriptive analyses will
review the respondents profile as well as studying type of SSTs that are welled
adopted in Malaysia and follow by inferential analysis. In order to satisfy the
purpose of this study, several test and analysis will be carry out to according to the
hypotheses statements mention in chapter 3 earlier. Tables, charts and graphs
generated from SPSS will present in this chapter as well. The flow of influence
analysis shows as in figure 4.1below.

________________________________________________________________________
________________________________________________________________________
54
Figure 4.1: Flow of influence analysis
Never the less, prior to run analysis listed above, some tests needed to carryout to
examinie on the data if suitable to proceed with the mention analysis. These tests
will also present in this chapter to strengthen the support of the analysis outcome .
Based on the structure model proposed in chapter 3, to examinine the relationship
3 different analysis will be carry out in this study which including multiple linear
regression, simple linear regression and logistic regression as shown in figure 4.2.

________________________________________________________________________
________________________________________________________________________
55
Figure 4.2: Theoretical model and statistical analysis methods used
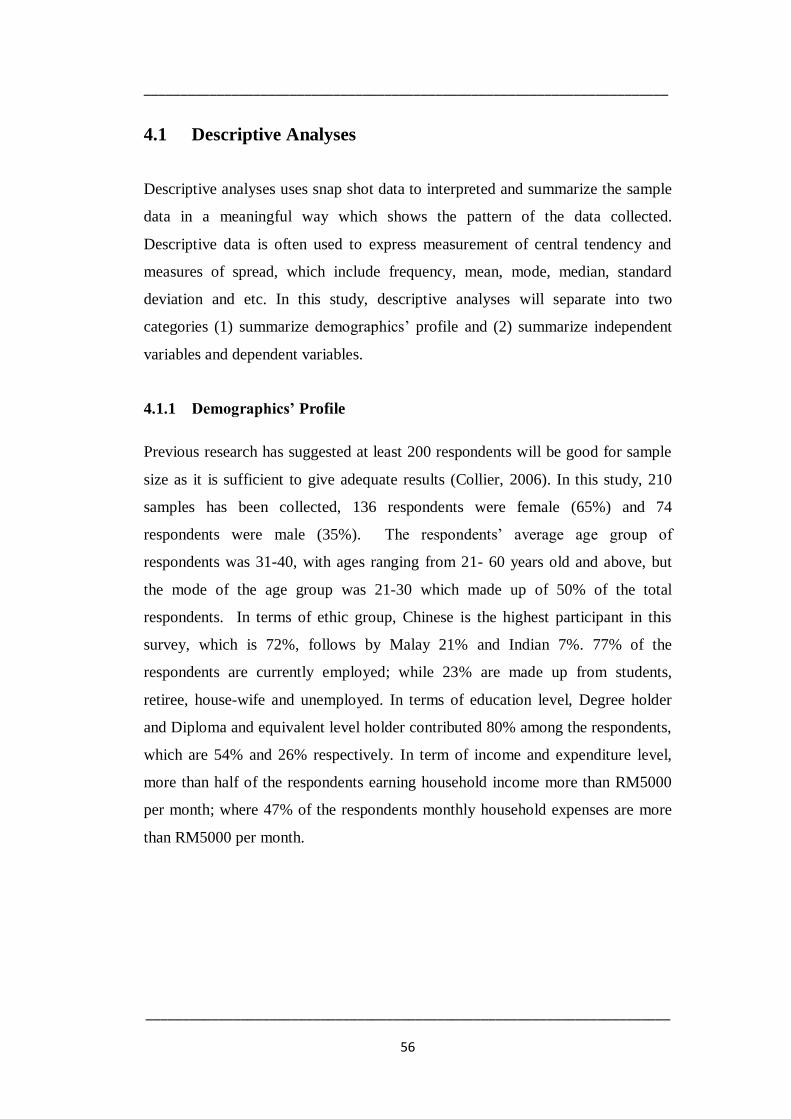
________________________________________________________________________
________________________________________________________________________
56
4.1 Descriptive Analyses
Descriptive analyses uses snap shot data to interpreted and summarize the sample
data in a meaningful way which shows the pattern of the data collected.
Descriptive data is often used to express measurement of central tendency and
measures of spread, which include frequency, mean, mode, median, standard
deviation and etc. In this study, descriptive analyses will separate into two
categories (1) summarize demographics‟ profile and (2) summarize independent
variables and dependent variables.
4.1.1 Demographics’ Profile
Previous research has suggested at least 200 respondents will be good for sample
size as it is sufficient to give adequate results (Collier, 2006). In this study, 210
samples has been collected, 136 respondents were female (65%) and 74
respondents were male (35%). The respondents‟ average age group of
respondents was 31-40, with ages ranging from 21- 60 years old and above, but
the mode of the age group was 21-30 which made up of 50% of the total
respondents. In terms of ethic group, Chinese is the highest participant in this
survey, which is 72%, follows by Malay 21% and Indian 7%. 77% of the
respondents are currently employed; while 23% are made up from students,
retiree, house-wife and unemployed. In terms of education level, Degree holder
and Diploma and equivalent level holder contributed 80% among the respondents,
which are 54% and 26% respectively. In term of income and expenditure level,
more than half of the respondents earning household income more than RM5000
per month; where 47% of the respondents monthly household expenses are more
than RM5000 per month.
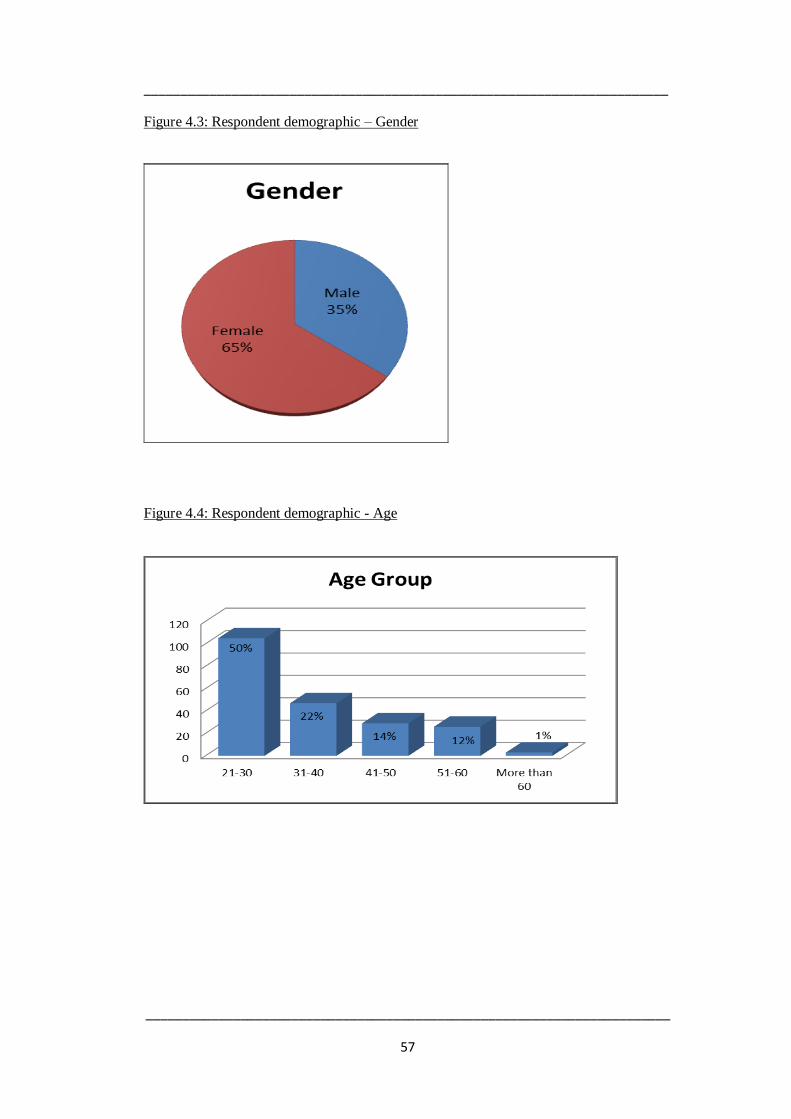
________________________________________________________________________
________________________________________________________________________
57
Figure 4.3: Respondent demographic – Gender
Figure 4.4: Respondent demographic - Age
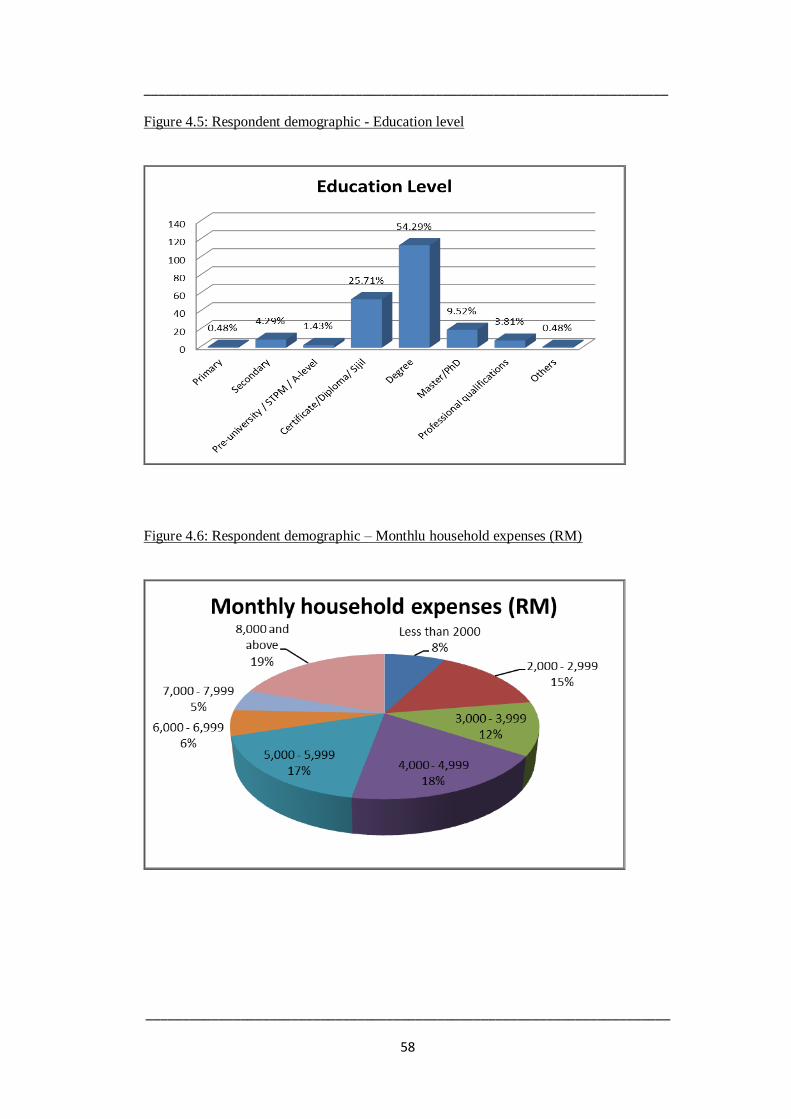
________________________________________________________________________
________________________________________________________________________
58
Figure 4.5: Respondent demographic - Education level
Figure 4.6: Respondent demographic – Monthlu household expenses (RM)

________________________________________________________________________
________________________________________________________________________
59
Figure 4.7: Respondent demographic – Monthlu household income (RM)
________________________________________________________________________
________________________________________________________________________
60
4.1.2 Consumer behavior over SST
Seven types of SST examples were ask in questionnaire over the respective usage
frequency and if the respondent tried on those SST before, which including ATM
and CDM, Laundry Service, Mobile commerce, Airport check-in kiosk, online
trading, online purchase and online banking. The result shows that ATM and
CDM as well as online banking service are the most widely accepted SST. Among
all of the respondents, 99% and 90% of them tried the respective services before.
Furthermore, 86% and 70% of them utilized respective services frequently.
Online purchase appear to be slightly lesser than above mention SST, 87%
respondents tried online purchase at least 1 time, but only 42% of time perform
this service occasionally. Mobile commerce and airport check-in kiosk have the
same exposure rate to the respondents, which are 77% of total respondents. Lastly,
the least accepted and adopted SST services under the seven examples given are
self-service laundry and online trading platform service for financial instruments,
which shows 38% and 37% of the respondents‟ exposure to these SST. Although
the percentage of exposure to respondents are low; but if further look into detail,
80% of users are actually frequent users. While for online trading platform service
for financial instruments show only 51% of users are frequent users.
Further to above mention, bar chart below analyses how often consumer used
these SST in their daily life. Corresponding to above results, online banking and
ATM & CDM services have the highest frequency used by consumer, similarly
SST type that are not being tried or used by consumer are online trading and self-
service laundry services, which in line with above analysis shows only 37% of the
respondents exposure to these two type of SST.
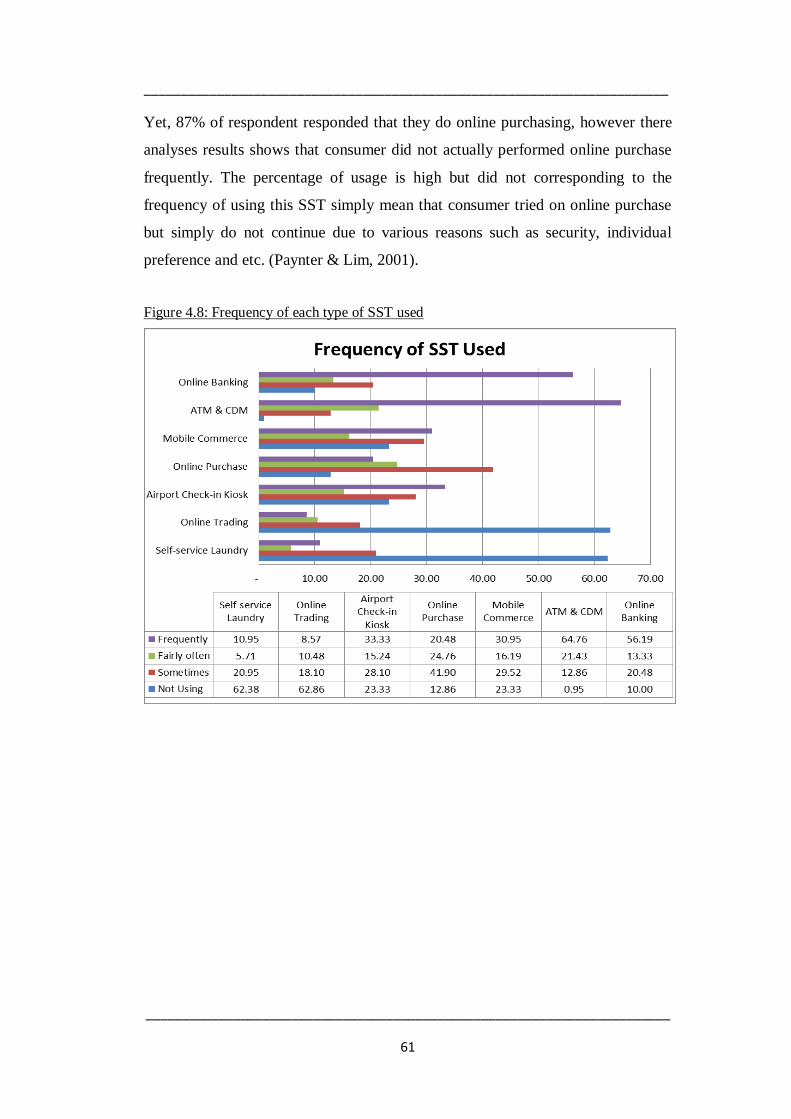
________________________________________________________________________
________________________________________________________________________
61
Yet, 87% of respondent responded that they do online purchasing, however there
analyses results shows that consumer did not actually performed online purchase
frequently. The percentage of usage is high but did not corresponding to the
frequency of using this SST simply mean that consumer tried on online purchase
but simply do not continue due to various reasons such as security, individual
preference and etc. (Paynter & Lim, 2001).
Figure 4.8: Frequency of each type of SST used

________________________________________________________________________
________________________________________________________________________
62
4.1.3 Independent and Dependent variables
This section turned the focus in to six independent variables including Perceived
usefulness (X1), Individual perceived control (X2), Expected outcome quality
(X3), Technology anxiety (X4), Need for interaction (X5), Hedonic value (X6)
and 3 dependent variables which are Attitude towards SST (Y1), Behavioral
intention on SST (Y2), Actual used of SST (Y3). Unlike demographic profile the
nature of the data are ordinary and nominal, frequency was used. Whereas seven
point likert scale was used to quantify independent and dependent variables into
two types of measurement: (1) Central position by using mean, mode and median
as well as (2) Measurement of spread by using standard deviation, variance and
range.
A summary table in appendix A shows the summary of these two measurements.
As 7 point likert scale was used in the questionnaire, within the latent variable the
respective questions are further compute into 6 dependents variables and 3
independents variables, as so the data range are limit within 1 to 7. Due to this
reason no possible of outlier, the standard deviation for these variables become
quite similar, from the summary table below, the highest standard deviation of
1.47 is attitude (Y1), while the lowest standard deviation variable is technology
anxiety (X4) which give value of 1.04.
To visualise the measurement of centralise and spread, a graphical chart below
give an indication on mean, mode as well as the standard deviation illustrate the
spread for each variables. Mean is an average of the responses while mode tells
the values that appear most often in the data collected. Vertical line that cross over
mean values are the standard deviation, which give idea on variation among
respondents. The details of the descretive analysis for independent and dependent
variable can refer to appendix A.

________________________________________________________________________
________________________________________________________________________
63
Figure 4.9: Mean, mode and standard deviation for all variables
X1: Perceived usefulness.
X2: Individual perceived control
X3: Expected outcome quality
X4: Technology anxiety
X5: Need for interaction
X6: Hedonic value Y1: Attitude towards SST
Y2: Behavioural intention on SST
Y3: Actual used of SST
________________________________________________________________________
________________________________________________________________________
64
4.2 Inferential Analyses
Inferential analysis uses statistical tests to see if the pattern is due to chances or
due to the sequencer or mediation effects. Inferential analysis is widely used by
researcher to locate the relationship between a variables as well as the strength of
that relationship. In this study, four separate analyses were conducted: (1) Factor
analysis, (2) Multiple linear regression analysis, (3) Simple linear regression
analysis and (4) Logistic regression analysis.
4.2.1 Factor Analysis
Factor Analysis (FA) is commonly used to confirm the latent factor structure. It
takes into consideration between variables, latent factors and error. As mention is
last chapter, the questionnaire is built base on adopting questions from different
prior research papers and some of them are self-create. As so, confirmatory factor
analyses on independent variables will carry out to distinguish factors from one
and another base on communality. Never the less, the ultimate purpose to run this
analysis is to make the loading pattern clearer.
Before perform FA, suitability of data for factor analysis has to be performed and
the results are following:
1. The Kaiser-Meyer-Oklin measure sampling adequacy, value of 0.9,
exceeding the recommended value of 0.6 by Hair et al (1998), shows the
meritorious degree of inter-correlations among variables.
2. Bartlett‟s Test of Sphericity examines the strength of the entire correlation
matrix. Results show sig=0, hence, statistical significance (p<0.05) indicate
sufficient correlations exist among the variables to proceed.
The determinant is less than 0.00001, but both tests mention above support
factorability of the correlation matrix. Thus, factor analysis should continue. The
details for SPSS output is located at appendix B.
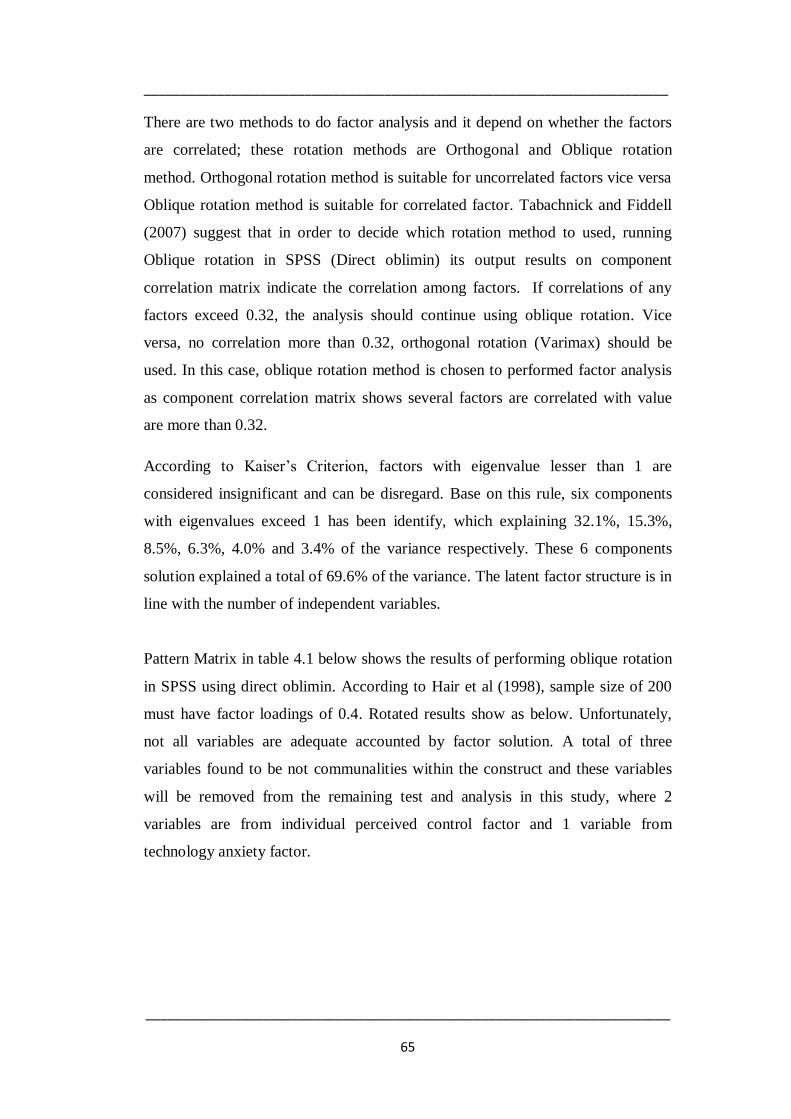
________________________________________________________________________
________________________________________________________________________
65
There are two methods to do factor analysis and it depend on whether the factors
are correlated; these rotation methods are Orthogonal and Oblique rotation
method. Orthogonal rotation method is suitable for uncorrelated factors vice versa
Oblique rotation method is suitable for correlated factor. Tabachnick and Fiddell
(2007) suggest that in order to decide which rotation method to used, running
Oblique rotation in SPSS (Direct oblimin) its output results on component
correlation matrix indicate the correlation among factors. If correlations of any
factors exceed 0.32, the analysis should continue using oblique rotation. Vice
versa, no correlation more than 0.32, orthogonal rotation (Varimax) should be
used. In this case, oblique rotation method is chosen to performed factor analysis
as component correlation matrix shows several factors are correlated with value
are more than 0.32.
According to Kaiser‟s Criterion, factors with eigenvalue lesser than 1 are
considered insignificant and can be disregard. Base on this rule, six components
with eigenvalues exceed 1 has been identify, which explaining 32.1%, 15.3%,
8.5%, 6.3%, 4.0% and 3.4% of the variance respectively. These 6 components
solution explained a total of 69.6% of the variance. The latent factor structure is in
line with the number of independent variables.
Pattern Matrix in table 4.1 below shows the results of performing oblique rotation
in SPSS using direct oblimin. According to Hair et al (1998), sample size of 200
must have factor loadings of 0.4. Rotated results show as below. Unfortunately,
not all variables are adequate accounted by factor solution. A total of three
variables found to be not communalities within the construct and these variables
will be removed from the remaining test and analysis in this study, where 2
variables are from individual perceived control factor and 1 variable from
technology anxiety factor.

________________________________________________________________________
________________________________________________________________________
66
Table 4.1: Summary of confirmation factor analysis results for SST questionnaire
(N=210)
Pattern Matrix
Component
Perceived usefulness
Need for interaction
Hedonic Value
Tech. Anxiety
Expected outcome
quality
Individual perceived
control
Exp. outcome quality - Q1 -.796
Exp. outcome quality - Q2 -.690
Exp. outcome quality - Q3 -.749
Exp. outcome quality - Q4 -.627
Hedonic Value - Q1 .700
Hedonic Value - Q2 .875
Hedonic Value - Q3 .898
Hedonic Value - Q4 .909
Ind. perceived control - Q1 -.637
Ind. perceived control - Q2 .413 -.568
Ind. perceived control - Q3 -.721
Need for interaction - Q1 .885
Need for interaction - Q2 .889
Need for interaction - Q3 .769
Need for interaction - Q4 .587
Need for interaction - Q5 .888
Need for interaction - Q6 .461
Perceived usefulness - Q1 .765
Perceived usefulness - Q2 .824
Perceived usefulness - Q3 .830
Perceived usefulness - Q4 .856
Perceived usefulness - Q5 .907
Perceived usefulness - Q6 .827
Perceived usefulness - Q7 .842
Technology Anxiety - Q1 .701
Technology Anxiety - Q2 .650
Technology Anxiety - Q3 .720
Technology Anxiety - Q5 .818
Technology Anxiety - Q6 .416 .486
Technology Anxiety - Q7 .422
Eigenvalues 10.59 5.05 2.07 2.07 1.33 1.12
% of Variance 32.08 15.30 8.55 6.27 4.04 3.41
Note: Cumulative % of 6 components are 69.63%

________________________________________________________________________
________________________________________________________________________
67
4.2.2 Reliability Analysis
Cronbach‟s Alpha is use to perform reliability test for each variable. In
questionnaire, several questions were asked in order to capture the responses
under same construct for each variable respectively. Therefore reliability test is
carryout to measure the consistency of this measurement. In this research, there
are eight constructs built, 6 independent variables and 2 dependent variables. The
summary of Cronbach‟s Alpha for each construct is exhibited in table 4.2 .
Table 4.2: Summary table of Cronbach‟s Alpha for each construct
Variables Cronbach's
Alpha
No. of
questions
IV1 Perceived Usefulness 0.950 7
IV2 Individual perceive control 0.838 3
IV3 Expected outcome quality 0.869 4
IV4 Technology Anxiety 0.798 6
IV5 Need for interaction 0.869 6
IV6 Hedonic Value 0.934 4
DV1 Attitude towards SST 0.955 4
DV2 Behavioural Intention towards SST 0.958 4
The value for Cronbach‟s Alpha is range from 0 to 1. For a construct to be
sufficient to describe the variable internal consistency, Cronbach‟s Alpha for each
construct should more than 0.60 (Malhotra, 2009). The Cronbach‟s Alpha value
can be improved by remove questions that have low correlation. Refer to the
breakdown of reliability test for each construct in appendix C, the last column
showing the Cronbach‟s alpha value if the particular question were removed from
the construct. However, no question was removed from construct as the
Cronbach‟s Alpha for each constructs are more than 0.7, which reflecting good
correlation among constructs.

________________________________________________________________________
________________________________________________________________________
68
4.2.3 Multiple linear regression
Multiple linear regression analysis is an extention to simple linear regression
which give prediction of one outcome from several predictors. This analysis also
able to discover the predictive power of each independent variable. The prediction
outcome can be summarise in an equation, which describe the relationship using a
variation of equation of a straight line (Daher, Hair, Black, Babin, & Studenmund,
2012).
There are several assumptions for multiple linear regression have to be tested
before the results can be generalise to the population, which including:
1. No Multicollinearity
The rule for collinearity diagnostics are tolerenca should be more than 0.2
and VIF should be lesser than 10. This two criteria has met and is shown in
coefficient table below, thus no multicollinearity was found in between the
variables.
2. Homoscedasticity
The predictors‟ variance of error term should be constant. This can be check
via scatterplot, no trend was found in figure 4.10.
3. Independent Errors
The error terms should be uncorrelated. Durbin-Watson statistic results show
1.878 has reflected superior results as independent of residual and is free
from autocorrelation.
4. Normally-distributed Errors
This assumption is fulfilled as histogram is show in figure 4.11 showing a
normal distribution and normal probability plot reflect linear in figure 4.12.
The details on SPSS output for multiple linear regression can be found in
appendix D.

________________________________________________________________________
________________________________________________________________________
69
Figure 4.10: SPSS output – Scatterplot for homoscedasticity test
Figure 4.11: SPSS output – Histogram for normality test

________________________________________________________________________
________________________________________________________________________
70
Figure 4.12: SPSS output – Normal P-P plot of regression standardized residual
Coefficient of determination (R2), shows the proportion of variance in the
dependent variable that can be explained by the independent variables. R2=0.726,
means all independent variables (Perceived Usefulness, Individual perceive
control, Expected outcome quality, Technology Anxiety, Need for interaction,
Hedonic Value) explain 72.6% of the variability on dependent variable (Attitude
towards SST).
Adjusted R square, explain by only combining significant variables in the mode,
adjusted R2=0.717 shows significant independent variables explained 71.7% of
the variability of dependent variable in the model.
Where, ANOVA shows the overall regression model is a good fit for the data as
F=89.319, Sig=0, which less than 0.05. In order to understand which are the
significant influential variables would need to refer to coefficients matrix show
below.

________________________________________________________________________
________________________________________________________________________
71
Table 4.3: Summary of multiple linear regressions
B SE B
(Constant) -0.123 0.337
Perceived Usefulness 0.213 0.064 0.176*
Individual Perceived Value -0.094 0.058 -0.086
Expected Outcome Quality 0.163 0.07 0.122*
Technology Anxiety -0.023 0.04 -0.022
Need for Interaction -0.014 0.05 -0.011
Hedonic Value 0.849 0.052 0.73*
Note: R2=0.726. *p < 0.05
Multiple regression model predict values of an outcome from several predictors,
in this case, to predict the attitude towards SST, 3 independent variables are
significant to the model shows sig. value less than 0.05 including Perceived
Usefulness (p=0.001; t=3.349), Expected Outcome Quality (p=0.022; t=2.313)
and Hedonic Value (p=0.000; t=16.291); whereas another 3 variables did not
show significant to the model as sig. value more than 0.05, which including
Individual Perceived Control (p=0.105; t=-1.627), Technology Anxiety (p=0.563;
t=-0.579) and Need for Interaction (p=0.779; t=-0.281).
Unstandardized coefficients indicate relationship between predictor and the
outcome. The sign tells the direction of the effects is having on dependent variable,
while the value gives the size of the effect range from 0 to 1.
The equation for attitude towards SST shows below:
Y1 = -0.123 + 0.213(X1) - 0.094 (X2) + 0.163 (X3) - 0.023 (X4) – 0.014(X5)
+ 0.849(X6)
This equation simply means that, ceteris paribus, 1 unit increase in perceived
usefulness (X1), attitude towards SST (Y1) will increase by 0.213. Similarly, 1 unit
increase in expectation outcome quality (X3), Y1 will increase by 0.163. While
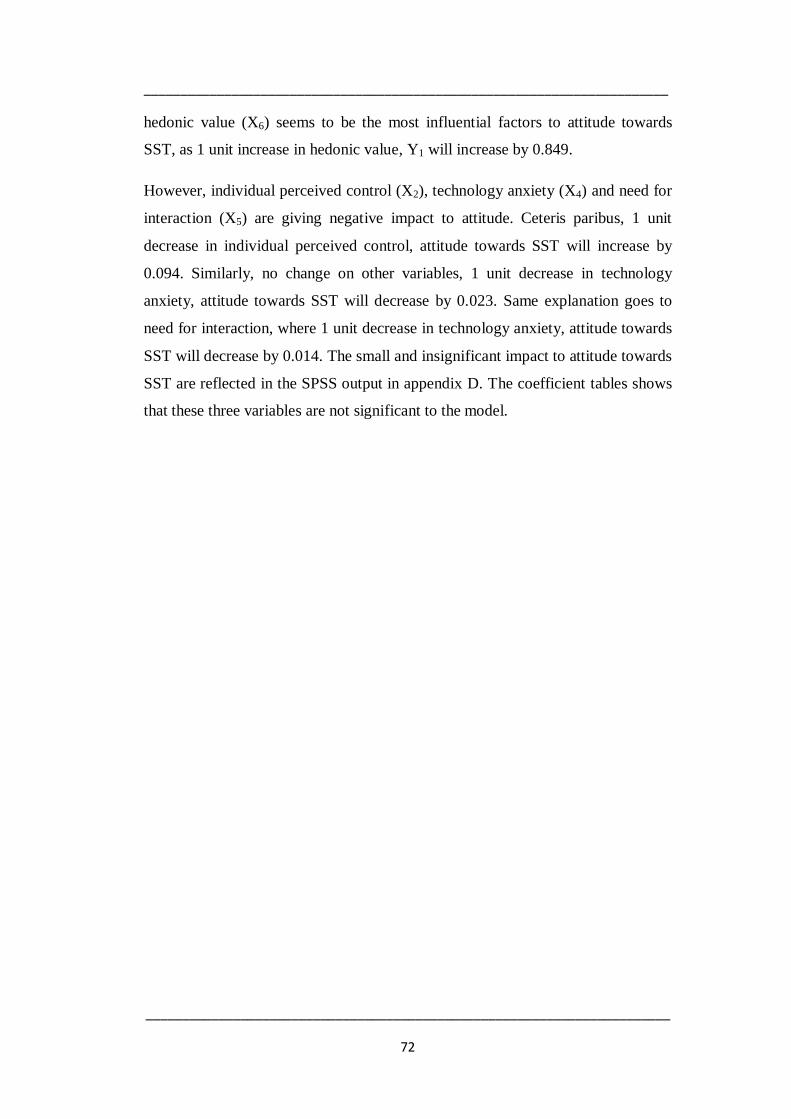
________________________________________________________________________
________________________________________________________________________
72
hedonic value (X6) seems to be the most influential factors to attitude towards
SST, as 1 unit increase in hedonic value, Y1 will increase by 0.849.
However, individual perceived control (X2), technology anxiety (X4) and need for
interaction (X5) are giving negative impact to attitude. Ceteris paribus, 1 unit
decrease in individual perceived control, attitude towards SST will increase by
0.094. Similarly, no change on other variables, 1 unit decrease in technology
anxiety, attitude towards SST will decrease by 0.023. Same explanation goes to
need for interaction, where 1 unit decrease in technology anxiety, attitude towards
SST will decrease by 0.014. The small and insignificant impact to attitude towards
SST are reflected in the SPSS output in appendix D. The coefficient tables shows
that these three variables are not significant to the model.
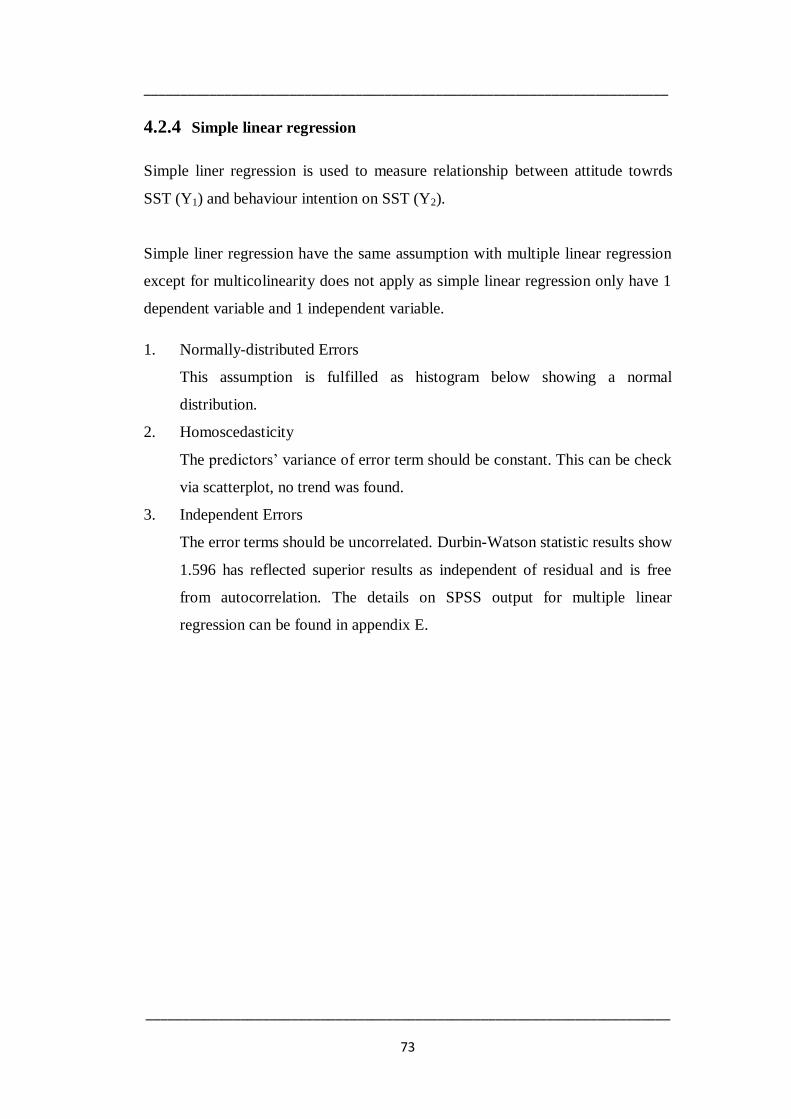
________________________________________________________________________
________________________________________________________________________
73
4.2.4 Simple linear regression
Simple liner regression is used to measure relationship between attitude towrds
SST (Y1) and behaviour intention on SST (Y2).
Simple liner regression have the same assumption with multiple linear regression
except for multicolinearity does not apply as simple linear regression only have 1
dependent variable and 1 independent variable.
1. Normally-distributed Errors
This assumption is fulfilled as histogram below showing a normal
distribution.
2. Homoscedasticity
The predictors‟ variance of error term should be constant. This can be check
via scatterplot, no trend was found.
3. Independent Errors
The error terms should be uncorrelated. Durbin-Watson statistic results show
1.596 has reflected superior results as independent of residual and is free
from autocorrelation. The details on SPSS output for multiple linear
regression can be found in appendix E.

________________________________________________________________________
________________________________________________________________________
74
Figure 4.13: SPSS output – Histogram for normality test
Figure 4.14: Normal P-P plot of regression standardized residual

________________________________________________________________________
________________________________________________________________________
75
Coefficient of determination shows R2=0.653, where attitude towards SST explain
65.3% of behavioural intention on SST. This regression model is good fit as from
ANOVA table shows F=390.841, Sig=0, which in line with results in coefficients
matrix showing attitude towards SST (Y1) give significantly effect to behaviour
intention on SST (Y2), with p=0.000; t=19.770. The unstandardized coefficient of
0.748 shows a positive relation between independent variable and dependent
variable. The equation explains that change of 1 unit in attitude towards SST (Y1),
behaviour intention on SST (Y2) will change by 0.748 in the same direction.
The equation for behavioural intention on SST shows below:
Y2 = 1.511 + 0.748 (Y1)
Table 4.4: Summary of simple linear regressions
B SE B
(Constant) 1.511 0.195 Attitude towards SST 0.748 0.038 0.808*
Note: R2=0.653. *p < 0.05
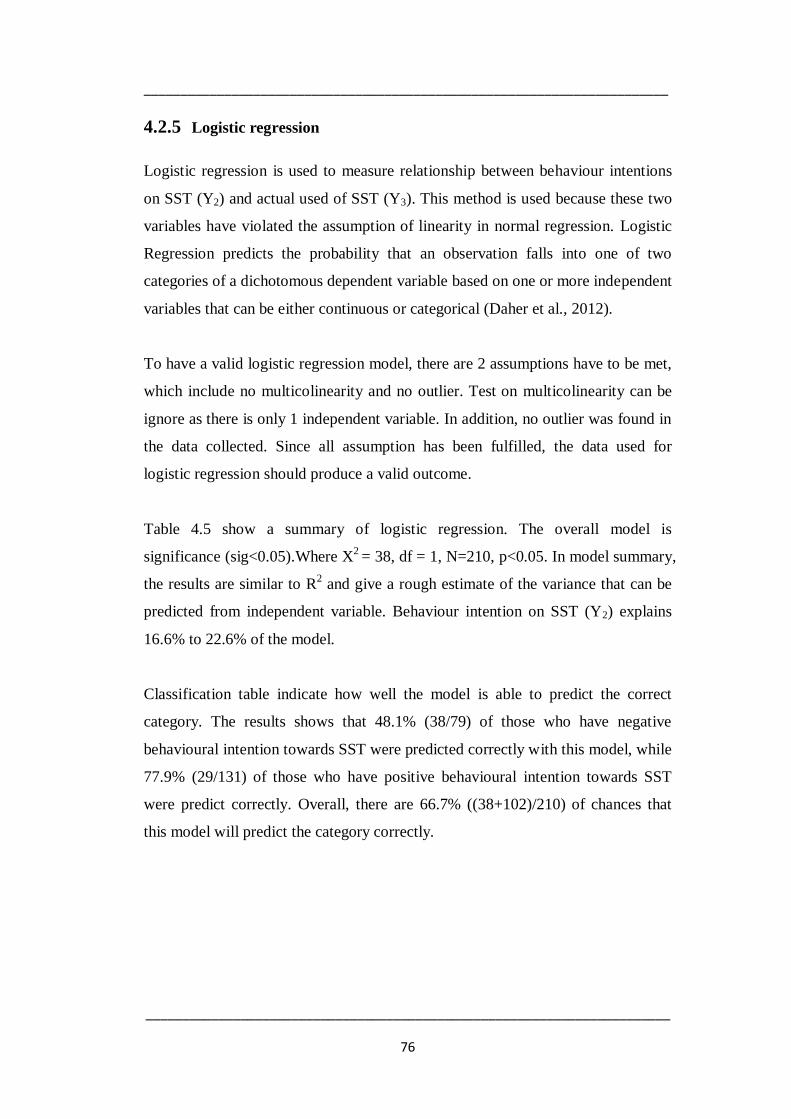
________________________________________________________________________
________________________________________________________________________
76
4.2.5 Logistic regression
Logistic regression is used to measure relationship between behaviour intentions
on SST (Y2) and actual used of SST (Y3). This method is used because these two
variables have violated the assumption of linearity in normal regression. Logistic
Regression predicts the probability that an observation falls into one of two
categories of a dichotomous dependent variable based on one or more independent
variables that can be either continuous or categorical (Daher et al., 2012).
To have a valid logistic regression model, there are 2 assumptions have to be met,
which include no multicolinearity and no outlier. Test on multicolinearity can be
ignore as there is only 1 independent variable. In addition, no outlier was found in
the data collected. Since all assumption has been fulfilled, the data used for
logistic regression should produce a valid outcome.
Table 4.5 show a summary of logistic regression. The overall model is
significance (sig<0.05).Where X2
= 38, df = 1, N=210, p<0.05. In model summary,
the results are similar to R2 and give a rough estimate of the variance that can be
predicted from independent variable. Behaviour intention on SST (Y2) explains
16.6% to 22.6% of the model.
Classification table indicate how well the model is able to predict the correct
category. The results shows that 48.1% (38/79) of those who have negative
behavioural intention towards SST were predicted correctly with this model, while
77.9% (29/131) of those who have positive behavioural intention towards SST
were predict correctly. Overall, there are 66.7% ((38+102)/210) of chances that
this model will predict the category correctly.

________________________________________________________________________
________________________________________________________________________
77
Variables in the Equation table exhibits behavioural intention towards SST is
significant (sig<0.05), where Exp(B) = 2.018 showing positively related to the
actual used of SST. Exp(B) is the odd ratio, simply mean that every one-unit
increase on behavioural intention towards SST will increase the odds of actual used
of SST by 2.018.
Table 4.5: Summary of logistic regression
95% CI for exp b
B (SE) Lower exp b Upper
Included
(Constant) -3.073* 1.578 2.018 2.580 (0.650)
Behaviour Intention 0.702**
(0.126)
Note: R
2=0.166 (Cox & Snell), 0.226 (Nagelkerke). Model
2(1) = 38, p < 0.05.
*p < 0.05. **p < 0.05.
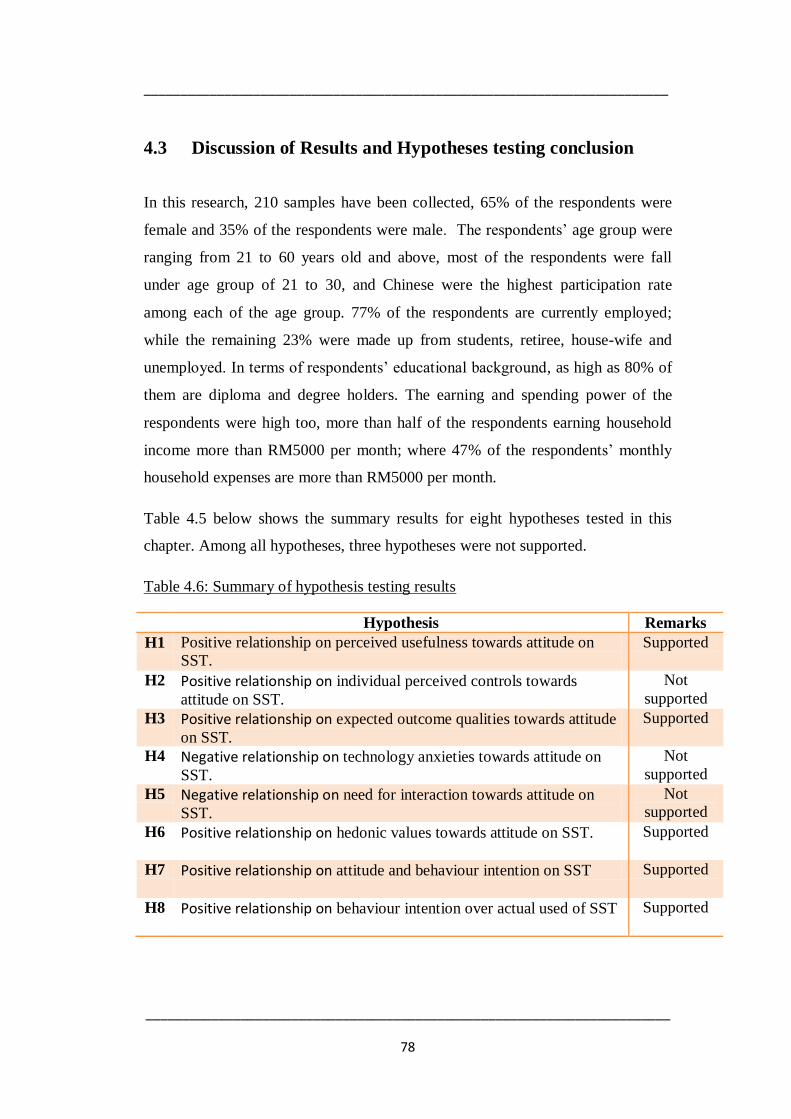
________________________________________________________________________
________________________________________________________________________
78
4.3 Discussion of Results and Hypotheses testing conclusion
In this research, 210 samples have been collected, 65% of the respondents were
female and 35% of the respondents were male. The respondents‟ age group were
ranging from 21 to 60 years old and above, most of the respondents were fall
under age group of 21 to 30, and Chinese were the highest participation rate
among each of the age group. 77% of the respondents are currently employed;
while the remaining 23% were made up from students, retiree, house-wife and
unemployed. In terms of respondents‟ educational background, as high as 80% of
them are diploma and degree holders. The earning and spending power of the
respondents were high too, more than half of the respondents earning household
income more than RM5000 per month; where 47% of the respondents‟ monthly
household expenses are more than RM5000 per month.
Table 4.5 below shows the summary results for eight hypotheses tested in this
chapter. Among all hypotheses, three hypotheses were not supported.
Table 4.6: Summary of hypothesis testing results
Hypothesis Remarks
H1 Positive relationship on perceived usefulness towards attitude on
SST.
Supported
H2 Positive relationship on individual perceived controls towards
attitude on SST.
Not
supported
H3 Positive relationship on expected outcome qualities towards attitude
on SST.
Supported
H4 Negative relationship on technology anxieties towards attitude on
SST.
Not
supported
H5 Negative relationship on need for interaction towards attitude on
SST.
Not
supported
H6 Positive relationship on hedonic values towards attitude on SST. Supported
H7 Positive relationship on attitude and behaviour intention on SST Supported
H8 Positive relationship on behaviour intention over actual used of SST Supported

________________________________________________________________________
________________________________________________________________________
79
Hypothesis 1 proposed a positive significant relationship between perceived
usefulness and attitude on SST and this is supported with statistical analysis. The
coefficient was 0.21 and significant at p=0, t=3.35. The respondents indicated that
they are able to complete the task via SST more quickly and easily, which can
save them lots of time compare to employee service. This finding indicates there
is a direct positive relationship between perceived usefulness and attitude on SST.
The simple and straight forward design as well as the speed of SST kiosk is
important to generate positive attitude towards SST. The study on situational
influences by Wang, Harris & Patterson (2009) indicated that consumer choose
SST because it is faster, as in personal service normally took longer time.
Academy of Marketing Science & Robinson (2014) study also concluded that
perceived usefulness was an important motivation factors that impacting attitude
towards SST.
Hypothesis 2 was not supported by statistical analysis. A negative relationship
was identified on coefficient of -0.94. This variable was not significant to attitude
as p=0.11, t=-1.63. Only half on the respondents agree that they have some degree
of control when using SST. Collier & Sherrell (2010) explained perceived control
over the options to choose whether or not to use SST, thus mediator was
suggested to determine ones‟ respond with situational factor such as speed of
transaction, exploration and trust. No mediator was used between individual
perceived control and attitude towards SST in this study, thus the results maybe
vary as different individual will interpret the meaning of control differently. Lee
and Allaway (2002) mention that individual perceived control can be explain from
three dimension which including of predictability, controllability and outcome
desirability. Further to this, a study conducted by Kuan, Ho & Chang (2011)
found that perceived control was negatively related to perceived risk. While Xu‟s
study found that individual perceived control provides higher degree of
explanation for personal privacy concern (Xu, 2007).

________________________________________________________________________
________________________________________________________________________
80
Hypothesis 3 was supported; positive relationship between expected outcome
qualities towards attitude on SST is supported with coefficient of 0.16 but the
strength of the relationship is relatively low. In terms of significant of this
variable, p=0.02, t=2.31 showing this is a significant variables that explaining
attitude towards SST. The low correlation coefficient can be explained by the
expectation on the SST was form prior to the usage, thus as long as the
expectation are met, there should not be any influence on the attitude towards
SST, this has been supported by Zeithaml et al (2009) that consumer placed
adequate service expectation on SST, as long as the expected outcome quality fall
within the tolerance level, consumer will still perceive positively over the SST.
The forming of this expectation can be from word of mouth, internet which
including sharing information in social media, leaving comments on the blog and
etc. From the data analysed, 88% of the respondent source their information from
internet including social media, blogs and online news.
Hypothesis 4 was not supported by statistical analysis. This variable gives no
relationship to attitude towards SST as coefficient of -0.02 was almost zero.
Besides, statistical analysis also showing that this variable did not show
significant in the model, p=0.56, t=-0.58. This may be explaining by the
respondents‟ demographic background. As most of them are young and well
educated, up to 94.7% of the respondents have received at least tertiary education,
thus they will definitely find no problem to perform SST using computer or kiosk.
The similar results were concluded in Phongkusolchit‟s study. Although many
studies were supported on the negative relationship between technology anxieties
towards attitude over SST, yet this has trigger out researchable question if
technology anxiety still exists in the general population after the generalise usage
of computers, smartphones and technological devices in Malaysia. Besides that
Phongkusolchit also mention that measuring technology anxiety will be
meaningful in technical field rather than daily routine task such as withdrawing
money from ATM (Phongkusolchit, 2008)
________________________________________________________________________
________________________________________________________________________
81
Hypothesis 5 was not supported by statistical analysis. Need for interaction give
no relationship to attitude towards SST as coefficient of -0.02 was almost zero. In
additional, this variable show do not show significant to attitude on SST, as
p=0.80 and t=-0.28. The study conducted by Esman, Embi and Jusoh (2010)
found that need for interaction did not show a significant results as the
respondents who was bank employees did not perceived need for interaction as an
important factors as this would cause long time spent for bank counter employees
to attend to their needs. This finding also consistent with the result of Curran and
Meuter (2005), where they found that need for interaction has no significant effect
on ATMs and online banking.
Hypothesis 6 was supported by statistical analysis. A strong positive relationship
between hedonic values and attitude on SST was form and show in coefficient of
0.85. This variable is significant in the model, showing p=0 and t =16.29, being
the most influential variables towards attitude on SST. This results has been
supported with the study conducted from Cho (2011) review that consumer used
SST in retail environment because of the fun. Similar result was found is study by
Academy of Marketing Science & Robinson (2014), among the other variables,
hedonic value was the most important variables that influencing consumers‟
attitude towards SST.
Hypothesis 7 was supported in statistical analysis. A strong positive relationship
between attitude and behavioural intention on SST was form and show in
coefficient of 0.75. This variable is significant in the model, showing p=0 and t
=19.77. This variable solely explained 65.3% of the behavioural intention towards
SST. The result is in line with the literature review discussed on the attitude –
behaviour relationship. As being part of the TAM, the positive attitude towards
SST has reflect positive behaviour intention on SST, which verified partial of the
model.
________________________________________________________________________
________________________________________________________________________
82
Hypothesis 8 was supported in statistical analysis. Behaviour intention on SST is
positively related to actual used of SST, as Exp(B)=2.018 and also tested
significant to the model on actual SST used, as p=0. 16.6% to 22.6% of actual
SST used is measure based on behaviour intentions towards SST. The results was
in line with the theory of reasoned action, where consumer reflecting positive
intention to use SST in near future, and most likely the consumer will put it into
actual behavior, act according to he or her intention.

________________________________________________________________________
________________________________________________________________________
83
CHAPTER 5
DISCUSSION, CONCLUSION AND IMPLICATIONS
5.0 Introduction
This chapter give summary on the overall study, discuss on the findings base on
the statistical analysis‟s results. Implications of the study as well as managerial
implication will also discuss in this chapter.
Never the less, this study will be wrapped up with limitations of the study as well
as recommendation and improvement to the future study on SST.
5.1 Discussions of Major Findings
The overall purpose of this study was to explore and determine the importance
influential perceived factors and their relationship with consumers‟ acceptance
and adoption of SST in Malaysia context, through these perceived factors to find
out consumers attitude and behaviour intention towards SST. The purpose serves
as a ground for hypotheses and objectives to build and examination throughout the
study.
Questionnaire survey was conducted to collect primary data for statistical analysis
for testing the hypotheses statements. 210 respondents responded to this online
survey. Measures were based on literature review and 7 point likert scale was used
in the questionnaire. The demographic information collected showing 65% of the

________________________________________________________________________
________________________________________________________________________
84
respondents were female and 35% of the respondents were male. The respondents‟
age group were ranging from 21 to 60 years old and above, most of the
respondents were fall under age group of 21 to 30, while the average age 40group
was 31 to 40.
Chinese were the highest participation rate, contributed 72%, follows by 21% was
Malay and Indian 7%. 77% of the respondents are currently employed; while the
remaining 23% were made up from students, retiree, house-wife and unemployed.
95% of the respondents receive tertiary education including STPM, diploma,
degree, postgraduate and respective equivalent standards. The earning and
spending power of the respondents were high, more than half of the respondents
earning household income more than RM5000 per month; where 47% of the
respondents‟ monthly household expenses are more than RM5000 per month.
The objectives of the study can categorised into 4 sections as a guide on this
discussion:
1. To identify significant relationship between perceived usefulness, individual
perceived control, expected outcome quality, technology anxiety, need for
interaction, hedonic value and attitude on SST.
2. To examine the effect of these factors on attitude towards SST.
3. To investigate the relationship between attitude and behaviour intention over
SST.
4. To investigate the relationship between behaviour intention over actual used
of SST.

________________________________________________________________________
________________________________________________________________________
85
Form objective 1 and 2; it gives rise to six hypotheses statements.
Hypothesis 1: There is a positive relationship between perceived usefulness
towards attitude on self-service technology.
Hypothesis 1 is supported with statistical analysis. Most of the respondents
appreciate perceived usefulness on SST specifically on the time saving as well as
allowing consumer to do things effectively. Online banking saves consumers from
wasting time on a queue as well as avoiding the traffic jam travel from one
destination to another. While self-service laundry service allow consumer to do
their laundry on a 24/7 basis without the hesitation on the weather.
Hypothesis 2: There is a positive relationship between individual perceived
controls towards attitude on self-service technology.
This study found insufficient evidence to reject H20, as it was not supported by
statistical analysis. Previous study found that individual perceived control is
related to perceived risk and personal privacy. This result was not support with the
previous study. This can be explained by cultural differentiation that causing a
different results from the past study. Malaysian are so used to the previous way of
doing things and reluctant to change without given punishment or benefit to do so,
as controllability over a certain task did not seems be significant to Malaysian as
there are still risk of possible making mistake that hardly to be rectify or it would
be costly or time consuming to get it rectify.
Hypothesis 3: There is a positive relationship between expected outcome qualities
towards attitude on self-service technology.
Hypothesis 3 was supported by statistical analysis. The finding shows positive
relationship between expected outcome qualities towards attitude over SST. The
forming of this expectation is based on one‟s believe and it can also from word of
mouth, internet which including sharing information in social media, leaving
comments on the blog and etc. From the data analysed, 88% of the respondent
source their information from internet including social media, blogs and online
news, follow by newspaper.
________________________________________________________________________
________________________________________________________________________
86
Hypothesis 4: There is a negative relationship between technology anxieties
towards attitude on self-service technology.
This study found insufficient evidence to reject H40, as it was not supported by
statistical analysis. The young and educated respondents were benefited with the
generalised education system that given chances to train on technology knowledge
together with the good telecommunications infrastructure throughout the country,
which allow the citizens to performed various task online.
Hypothesis 5: There is a negative relationship between need for interaction
towards attitude on self-service technology.
This study found insufficient evidence to reject H50, as it was not supported by
statistical analysis. Malaysians are able to perform simple and straight forward
task using SST without the need for interaction with service employees. Perhaps,
one of the reasons might be consumers avoiding long queue and preference on
remain privacy of own personal information, these reason has been discussed in
previous study, which caused this hypothesis not able to be supported statistically.
Hypothesis 6: There is a positive relationship between hedonic values towards
attitude on self-service technology.
Hypothesis 6 was supported by statistical analysis. The finding shows a strong
positive relationship between hedonic values including perceived enjoyment and
playfulness with attitude on SST. This has given a big encouragement for business
sector to come out with innovative way that allow consumer to perform self-
service using technology as well as explaining the reason why Sakae Sushi can
expend the business tremendously in such a short period of time despite of the
quality and taste of the food. It has successfully using SST as the selling point in
the business.
________________________________________________________________________
________________________________________________________________________
87
Objective 3 give rise to hypothesis below.
Hypothesis 7: There is a positive relationship between attitude and behaviour
intention over self-service technology.
Hypothesis 7 was supported in statistical analysis. A strong positive relationship
between attitude and behavioural intention on SST was form. Hypothesis 7 and 8
are part of the TAM model. The data explain the attitude – behaviour relationship.
This can be explain by affective attitude have the power to predict future
behavioural intentions; this is supported by the research conducted by Baumann,
Burton, Elliott & Kehr, (2007) specifically looking into retain banking industry.
Objective 4 give rise to hypothesis below.
Hypothesis 8: There is a positive relationship between behaviour intention over
actual used of self-service technology.
Hypothesis 8 was supported in statistical analysis. Behaviour intention on SST is
positively related to actual used of SST. The result shows that ATM and CDM as
well as online banking service are the most widely accepted SST. This is probably
related to the long history of ATM exist in Malaysia as well as the wide spread of
ATM and CDM thought out the whole Malaysia to serve the public. Follow by
online banking service through internet. 77% of total respondents used mobile
commerce and airport check-in kiosk and the least accepted and adopted SST
services are self-service laundry and online trading platform service for financial
instruments, which shows only 38% and 37% of the respondents‟ exposure to
these SST. An interesting finding was found, self-service laundry consumers
although are less, the repeat usage was high; up to 80% of users are frequent
users.
Besides that, this study has reflected a low rate of using mobile commerce, online
trading platform, and online purchase. Although the usage of smartphone in
Malaysia is high but from consumer barometer survey (2014) has found that the
top 3 activities using smartphone were visiting social network, using search
engines and checking email.

________________________________________________________________________
________________________________________________________________________
88
5.2 Implications of the study
This study has integrated several perceived factors from literature review done by
various previous researchers. Not all variables were significant in this study, but
perceived usefulness, expected outcome quality and hedonic value are the
significant variables.
This study has successfully shows the integrated model of TAM by combining
additional factors. The relationship was supported and this has been served as a
theoretical implication that the modification of TAM model was accepted.
Although only three perceived factors was significant to the model instead of six
proposed, this establishment of relationships also contributed to the original model
for TAM.
The not supporting results on the relationship against technology anxiety and
attitude over SST has trigger a researchable question if technology anxiety still
exist in this new era, where people are well educated and exposure to computers
and smartphone since young and also has been generalised on the usage.

________________________________________________________________________
________________________________________________________________________
89
5.3 Managerial implications
The rapid growth in information technology fosters the growth of SST that allows
consumers to undertake new roles in the services facility. To facilitate the
continued growth of SST, this study was carry out to with the purpose of explore
and determine the importance influential perceived factors and their relationship
with consumers‟ acceptance and adoption of SST in Malaysia. The findings in the
study provide valuable insight for business management and government to
identify the Malaysian acceptance and adoption of SST.
This study has found that Malaysian are able to accept and adopt SST, the most
successful example of SST are ATM and CDM, due to the market need and long
existing history in Malaysia. This study has further found that among six
perceived factors (perceived usefulness, need for interaction, expected outcome
quality, technology anxiety, individual perceived control and hedonic value),
hedonic value are the most influential factors on attitude towards SST. Consumers
perceived hedonic value as important factor, given the feeling of fun, pleasure,
enjoyable, relax and interesting were significant attributes on one‟s attitude
towards SST. This has produced a significant implication for marketers, SST
interface designer as well as business owner.
Marketers can make use of this information and come out with ideas that can
maximise consumers‟ hedonic value. A study found that consumer with high
hedonic shopping values tend to avoid online purchasing as they perceived more
joy was stimulate when they can touch and try the product as well as interact with
the staff (Sarkar, 2011). Marketers and SST interface designer can work together
to overcome this issue by creating a more interactive interface with customer,
such as creating an adorable character that assigned to each consumer, act as
shopping partners holding the shopping bag and able to interact with the shoppers.
Eventually this will beat the old methods, which try to squeeze in as much as
possible of product information that try to impress and convince shopper to buy
from their website. Another successful examples using SST as a tool to attract
________________________________________________________________________
________________________________________________________________________
90
consumer as well as improve operation process are Sakae Sushi that practicing
IPad menu and conveyer belt that transferring the food from one place to another.
Understanding that consumer related hedonic value closely to attitude of
consumer, the overall design should be using attention colour to capture consumer
attention, this should not be limited to SST interface its self only but the overall
settings and locations should be line. Marketers should grasp this psychology
behaviour by making consumers feel present, stimulate and arousal the courage to
try out the SST for new user.
In order to enjoy the benefits bought to you by SST, various preparation have to
be in place. Training on existing employees are the first steps to transmit adequate
knowledge on the particular SST, create awareness on their new SST service to
customer as well as encouraging customer to used SST. This not only can achieve
maximum customer satisfaction, also to reduce customer waiting time and more
effective resources planning to the business in terms of employees, working
schedule as well as costing specially in salary and wages which employees expect
to have increments every year regardless on the business profitability.
Further to that, the design of a SST kiosk have to be fun and interesting that can
capture consumers‟ interest and yet enlighten consumer to performed the task as
consumer perceive usefulness and expected outcome quality are also significant
factors influencing attitude as well. Regardless any form of SST, it should be well
maintained and upgrade as and when to ensure its function generate the
anticipated outcomes according to its designated purpose. As per discussed in
literature review, consumers tend to have their expectation depending on the type
of SST used, the significant of expected outcome quality has prompted the
importance for business owner and marketer to figure out the level of desire
service expectation an well as their tolerance level.
This study also gives an idea to organisation that considering adopting SST
service. From the descriptive analysis over consumer behaviour, it tells what kind

________________________________________________________________________
________________________________________________________________________
91
of SST service has the highest and lowest rate of adoption currently, how
consumer behave towards the usage of SST; whether they are only interesting on
first trial or consumer really adopted the SST into their daily life over different
type of SST. Although only seven examples of SST were measure in the study,
covering banking and finance industry (online banking, online trading, ATM &
CDM), travel industry (airport check-in kiosk), retail industry (mobile commerce
and online purchase) as well as laundry industry (self-service laundry), this could
probably serve as an indication or benchmark to other industry over the variance
on consumer behaviour. This can be improved over the time and marketing
activities carried out by the business itself.
The study also found that 88.3% of the respondents received information from
internet via social media and online news, which has exceed traditional source of
information from newspaper. While less than half of the respondents received
information from radio and television. Regardless of business sector or
government sector, this information is useful for spreading information such as
marketing events, announcement to the public. Never the less, target audience
behaviour and reachability should be the priority concern when come to choose
the form of communication.
Undeniable this results of this study shows consumers‟ acceptance and adoption
of SST in Malaysia also give implication on the potential of layoff excessive
workers once SST were readily to serve the public. With the increasing usage of
SST and actively developed smartphone application, the demand on customer
services opportunity may reduce. In view of the liquidity of labour market in
Malaysia, this might threaten the working opportunities for foreigner. The
brighten way of this is to accelerate the reduction on the relying on foreign labour
force, at the same time pushing the nation to become a technology advancement
country.
The power of information technology are unquestionable, it help to accelerate the
country‟s development. Malaysia government has invested heavily on e-services

________________________________________________________________________
________________________________________________________________________
92
under MSC initiative; however Malaysia government should proactively
promoting this e-service to the public. Further on this, more self-service
technology should be exploit in order to fit into different government department
for process improvement. For example of issuing national identification
registration card, the current process is applicant fill up hardcopy form and wait
their turn to be served. In fact, for better resources planning can put in place by
implementing SST, which can assist to shorten the waiting time where applicants
submitting their information and instantly photo taking with the specially design
kiosk. A queue number and bar code for counter employees to trace individual
record is then printed. Counter employees only need to scan the bar code to
extract applicants information, perform verify and do the finger prints. The
suggested process would actually cut down individual waiting time, eliminate
duplicate work on personal data input, eliminate transferring individual to photo
taking session in another counter where applicant need to queue again.
Never the less, intellectual property policy needed to put into practice for the
purpose of protecting and encouraging business to continuous seeking opportunity
to growth and creation of innovation ways in doing business.

________________________________________________________________________
________________________________________________________________________
93
5.4 Limitations of the Study
There are some limitations that point to interesting opportunities for further
research. First, cross-sectional design method was used in this study which
produces static and time bound results that do not able to indication and identify
the sequence of events nor reveal or explain any historical contexts. Besides that,
the results cannot see the changing behavior and attitude of consumer over the
time. Thus, no conclusion was made this study that what will be the SST trend in
few years times based on current statistic.
Second, the research areas are too board. Although the SST types has been
focusing on only two types of interfaces, which are using online or internet and
interactive kiosk throughout the study and yet SST can be used in wide range of
industries and situational factors was not taken into considerations. A scenario
should be given in questionnaire for responses, which limiting the industry, SST
interface as well as situation factors for all respondents. The results would be
more precise unlike general question were ask in this SST questionnaire where
respondents could recall different experience over different type of SST in
different industry that cause the results inaccurate.
Third, the data collection were collected online constrained respondents should be
Malaysian and used at least one time on any type of SST in the past one month.
Due to the nature of the questionnaire were self-administrated, basically all
respondents would automatically qualify for second condition mention above.
However, this option has also eliminated respondents that using other type of SST
but not online. In addition, majority of the respondents were young adults with
tertiary education background. Thus, sample bias may occur in this study which
did not represent the true Malaysia populations.

________________________________________________________________________
________________________________________________________________________
94
Lastly, this research might be influence by cultural that shape into current
consumer behaviour, which results to different outcome on the relationship
between the model. As so, the results from this study might not applicable to other
country.

________________________________________________________________________
________________________________________________________________________
95
5.5 Conclusion and recommendations for future research
Besides the limitations mention above, some suggestion and recommendation for
future research on this similar area over SST are discussed in the following. First
of all, more independent factors should be integrated into the model together with
situational factors such as waiting time. The questionnaire should adopt scenario
for each measurement for more precise results.
Secondly, quota sample selection should be implemented especially in locations
and age group in order to perform multiple group analysis that could help to
explain consumer behavioural based on different demographics. This would
further help the business and government to understand their target market
behaviour and acceptance over SST base on certain criteria of their target market.
Thirdly, since only 71.7% of attitude towards SST can be explain by the three
significant variables including hedonic value, perceived usefulness and expected
outcome quality, there are still room to improve the overall model by included
better predictor such as trust, previous experience and others.
The overall of this study showing that Malaysians are keen to accept and adopt
SST; an obvious successful examples would be ATM and CDM machine. In
another hand, the low rates of usage on other type of SST might due to the lack of
awareness, exposure, encouragement, enforcement and trial over other type of
SST. Never the less, the benefits of SST are undeniable, more time and efforts
should be allocate to those technology laggards, helping them to adopt SST by
guiding them steps by steps.
Government should encourage the public actively using SST available to enjoy
the benefits of convenient, giving adequate support to the design and development
team on SST, review and perform process improvement where SST can better fit
into the role to serve the public. Besides that, government also need to encourage
the private sector to establish a solid ground on providing SSTs services to the
________________________________________________________________________
________________________________________________________________________
96
public, by reducing the chances of SST interface failure, mistake, performing poor
quality service that could cause the public to be disappointment and frustration.
The new way of business operating model would be contributing to Malaysia
economy.
________________________________________________________________________
________________________________________________________________________
97
REFERENCES
Academy of Marketing Science, & Robinson, L. (2014). Marketing dynamism &
sustainability: Things change, things stay the same... : proceedings of the
2012 Academy of Marketing Science (AMS) Annual Conference.
Air Asia. (n.d.). AskAirAsia - What is Self Check-In? Retrieved August 17, 2014,
from http://www.airasia.com/ask/template.do?id=52
Anselmsson, J. (2001). Customer-Perceived Service Quality and Technology-
Based Self-Service Systems (Doctoral dissertation, Doctoral Dissertation.
Lund University).
Babin, B. J., Darden, W. R., & Griffin, M. (1994). Work and/or fun: measuring
hedonic and utilitarian shopping value. Journal of consumer research,
644-656.
Bagozzi, R. P. (1992). The self-regulation of attitudes, intentions, and
behavior.Social psychology quarterly, 178-204.
Bansal, H. S., & Voyer, P. A. (2000). Word-of-mouth processes within a services
purchase decision context. Journal of service research, 3(2), 166-177.
Barreiro, P. L., & Albandoz, J. P. (2001). Population and sample. Sampling
techniques. Management mathematics for European schools.
Bashir, M. S., & Albarbarawi, S. A. (2011). Factors Influencing the Adoption of
Self Service Technologies (SSTs).
Baumann, C., Burton, S., Elliott, G., & Kehr, H. M. (2007). Prediction of attitude
and behavioural intentions in retail banking. International Journal of Bank
Marketing, 25(2), 102-116.
Bitner, M. J. (1995). Building service relationships: it‟s all about
promises.Journal of the Academy of Marketing Science, 23(4), 246-251.
Bobbitt, M.L., & Dabholkar, P.A. (2001). Integrating attitudinal theories to
understand and predict use of technology-based self-service. International
Journal of Service Industry Management, 12(5), 423-450.
Bowen, J. W., & Hedges, R. B. (1993). Increasing service quality in retail
banking. Journal of Retail Banking, 15, 21-21.
________________________________________________________________________
________________________________________________________________________
98
Burns, A. C., & Bush, R. F. (2000). Marketing research. Upper Saddle River, NJ:
Prentice Hall.
Cadotte, E. R., Woodruff, R. B., & Jenkins, R. L. (1987). Expectations and norms
in models of consumer satisfaction. Journal of marketing Research, 305-
314.
Caramba-Coker, F. O. (2009). Consumer attitudes and behavioral intention
towards self-service kiosks in hotels: A cultural perspective. University of
Delaware.
Chai, K. F. (2008). Self-Service Technology and Internet Banking: An
Investigation of Consumers? Trial Decision (Master's thesis, University of
Malaya, Malaysia). Retrieved from http://dspace.fsktm.um.edu.my/
Chea, S. (2006). Understanding the roles of emotion in technology
acceptance (Order No. 3216051). Available from ProQuest Dissertations
& Theses Global. (305319501). Retrieved from
http://search.proquest.com/docview/305319501?accountid=50207
Cho, S. (2011). Self-service technology: an investigation of the potential for
adoption in apparel retail settings. The University of North Carolina at
Greensboro.
Chuttur M.Y. (2009). "Overview of the Technology Acceptance Model: Origins,
developments and future directions.
CIA. (2014). Malaysia Demographics Profile 2014. Retrieved from
http://www.indexmundi.com/malaysia/demographics_profile.html
Cinema Online. (2014). cinema.com.my: Events - We visited Premium-X
Cinemas!Retrieved August 17, 2014, from
http://www.cinema.com.my/news/events.aspx?search=2014.e_wevisitedpr
emium_19795
Collier, J. E. (2006). Examining customers' intentions to use self-service
technology through utilitarian and hedonic value judgments. ProQuest
Dissertations and Theses, , 235-235 p. Retrieved from
http://search.proquest.com/docview/304910318?accountid=50207.
(304910318).
Collier, J. E., & Sherrell, D. L. (2010). Examining the influence of control and
convenience in a self-service setting. Journal of The Academy of
Marketing Science. doi:10.1007/s11747-009-0179-4

________________________________________________________________________
________________________________________________________________________
99
Cunningham, L. F., Young, C. E., & Gerlach, J. H. (2008). Consumer views of
self-service technologies. Service Industries Journal, 28(6), 719-732.
doi:10.1080/0264206080198852
Curran, J. M., & Meuter, M. L. (2005). Self-service technology adoption:
comparing three technologies. Journal of Services Marketing, 19(2), 103-
113.
Curran, J. M., & Meuter, M. L. 2007). ENCOURAGING EXISTING
CUSTOMERS TO SWITCH TO SELF-SERVICE TECHNOLOGIES:
PUT A LITTLE FUN IN THEIR LIVES. Journal Of Marketing Theory &
Practice, 15(4), 283-298. doi:10.2753/MTP1069-6679150401
Curran, J. M., Meuter, M. L., & Surprenant, C. F. (2003). Intentions to use self-
service technologies: A confluence of multiple attitudes. Journal of
Service Research, 5(3), 209-224.
Currie, D., & Chartered Institute of Personnel and Development.
(2005). Developing and applying study skills: Writing assignments,
dissertations and management reports. London: Chartered Institute of
Personnel and Development.
Dabholkar, P. A. (1994). Incorporating choice into an attitudinal framework:
analyzing models of mental comparison processes. Journal of Consumer
Research, 100-118.
Dabholkar, P. A. (1996). Consumer evaluations of new technology-based self-
service options: an investigation of alternative models of service
quality.International Journal of research in Marketing, 13(1), 29-51.
Dabholkar, P.A., & Bagozzi, R.P. (2002). An attitudinal model of technology-
based self service: Moderating effects of consumer traits and situational
factors. Journal of the Academy of Marketing Science, 30(3), 184-201.
Dabholkar, P.A., & Bobbitt, L.M., & Lee, E.J. (2003). Understanding consumer
motivation and behavior related to self-scanning in retailing. International
Journal of Service, 30(3), 184-201.
Daher, H., Hair, J. F., Black, W. C., Babin, B. J., & Studenmund, A. H. (2012).
Data analysis : econometrics and multivariate statistical data analysis.
Harlow, Essex: Pearson Education limited.
Davis, F.(1989) "Perceived Usefulness, Perceived Ease of Use and User
Acceptance of Information Technology," M IS Quarterly, pp 319-340

________________________________________________________________________
________________________________________________________________________
100
Davis, F., Bagozzi,R. & Washaw, P.(1989). User acceptance of computer
technology: a comparison of two theoretical models. Management Science,
35(8), 982-100
Doronina, O. V. (1995). Fear of computers. Russian Education & Society,37(2),
10-28.
Eagly, A. H., & Chaiken, S. (1993). The psychology of attitudes. Harcourt Brace
Jovanovich College Publishers.
Esman, F., Embi. R., and Jusoh, R. (2010) Usage of Self-Service Technologies
(SSTs): A Case Study of e-Debit System at Bursary UiTM Shah Alam.
International Journal of Instructional Technology and Distance Learning.
Faqih, K. M., & Jaradat, M. I. R. M. (2014). Assessing the moderating effect of
gender differences and individualism-collectivism at individual-level on
the adoption of mobile commerce technology: TAM3 perspective. Journal
of Retailing and Consumer Services, 22, 37-52.
Fishbein, M., & Ajzen, I. (1975). Belief, attitude, intention and behavior: An
introduction to theory and research.
Fu, J. R., Farn, C. K., & Chao, W. P. (2006). Acceptance of electronic tax filing:
A study of taxpayer intentions. Information & Management, 43(1), 109-
126.
Gatignon, Hubert and Thomas S. Robertson (1985), “A Prepositional Inventory
for New Diffusion Research,” Journal o f Consumer Research, 11 (March),
849-867.
Godoe, P., & Johansen, T.,S.. (2012). Understanding adoption of new
technologies: Technology readiness and technology acceptance as an
integrated concept. Journal of European Psychology Students, 3, 38-52
Google. (2014). Consumer Barometer Survey. Retrieved from
https://www.consumerbarometer.com/en/graphbuilder/?question=W4&filt
er=country:malaysia
Hair, J.F., Money, A.H., Samouel, P., & Page, M. (2007). Research methods for
business. Chichester: John Wiley & Sons.
Hale, J. L., Householder, B. J., & Greene, K. L. (2002). The theory of reasoned
action. The persuasion handbook: Developments in theory and practice,
259-286.

________________________________________________________________________
________________________________________________________________________
101
Holbrook, M. B., & Hirschman, E. C. (1982). The experiential aspects of
consumption: Consumer fantasies, feelings, and fun. Journal of consumer
research, 132-140.
Huang, J., & Martin-Taylor, M. (2013). Turnaround user acceptance in the context
of HR self-service technology adoption: an action research
approach.International Journal Of Human Resource Management, 24(3),
621-642. doi:10.1080/09585192.2012.677460
Hui, M. K., & Bateson, J. E. (1991). Perceived control and the effects of crowding
and consumer choice on the service experience. Journal of Consumer
Research, 174-184.
Igbaria, M., Parasuraman, S., & Baroudi, J. J. (1996). A motivational model of
microcomputer usage. Journal of management information systems, 127-
143.
Islam, A. N., Azad, N., Mäntymäki, M., & Islam, S. S. (2014). TAM and E-
learning Adoption: A Philosophical Scrutiny of TAM, Its Limitations, and
Prescriptions for E-learning Adoption Research. In Digital Services and
Information Intelligence (pp. 164-175). Springer Berlin Heidelberg.
Jia, H., Wang, Y., Ge, L., Shi, G., & Yao, S. (2012). Asymmetric Effects of
Regulatory Focus on Expected Desirability and Feasibility of Embracing
Self-Service Technologies. Psychology & Marketing, 29(4), 209-225.
doi:10.1002/mar.20516
Kallweit, K., Spreer, P., & Toporowski, W. (2014). Why do customers use self-
service information technologies in retail? The mediating effect of
perceived service quality. Journal of Retailing and Consumer
Services, 21(3), 268-276.
Kaur, G., & Gupta, S. (2012). Consumers‟ Behavioral Intentions Toward Self-
Service Technology in the Emerging Markets. Journal Of Global
Marketing, 25(5), 241-261. doi:10.1080/08911762.2012.757406
Kazakeviciute, A., & Banyte, J. (2012). The Relationship of Consumers
„Perceived Hedonic Value and Behavior. Engineering Economics, 23(5),
532-540.
Kiosk Solution- Information on kiosk solution (n.d.). Retrieved February 15, 2015,
from http://kiosk-solutions.com/en/self-service-solutions/#services

________________________________________________________________________
________________________________________________________________________
102
Kjerulff, K. H., Pillar, B., Mills, M. E., & Lanigan, J. (1992). Technology anxiety
as a potential mediating factor in response to medical technology. Journal
of medical systems, 16(1), 7-13.
Koch, W. H., & Pratarelli, M. E. (2004). Effects of Intro/Extraversion and Sex on
Social Internet Use. North American Journal of Psychology, 6(3).
Kokkinou, A. (2010). Using simulation to estimate the impact of self-service
technology implementation on customer waiting times and system
operating costs (Doctoral dissertation, The Pennsylvania State University).
Koufaris, M. (2002). Applying the technology acceptance model and flow theory
to online consumer behavior. Information systems research, 13(2), 205-
223.
Kuan, F., Ho, Y., & Chang, T. (2011). A study on the influence of consumers'
perceived control and perceived risk to new E-Commerce technology
innovation resistance. doi:10.1109/ICEBEG.2011.5881419
LaPiere, R. T. (1934). Attitudes vs. actions. Social forces, 13(2), 230-237.
Lavrakas, P. J. (2008). Encyclopedia of Survey Research Methods: AM (Vol. 1).
Sage.
Lavrakas, P. J. (2008). Encyclopedia of survey research methods. Thousand Oaks,
CA: SAGE Publications.
Lee, J., & Allaway, A. (2002). Effects of personal control on adoption of self-
service technology innovations. Journal of Services Marketing, 16(6), 553-
572.
Lee, J., & Tan, T. (2014, April 16). Self-service launderettes are seeing a
resurgence in Klang Valley - SME | The Star Online. Retrieved from
http://www.thestar.com.my/Business/SME/2014/04/16/Cleaning-up-
nicely-Selfservice-launderettes-are-seeing-a-resurgence-in-Klang-
Valley/?style=biz
Legris, P., Ingham, J., & Collerette, P. (2003). Why do people use information
technology? A critical review of the technology acceptance model.
Information & Management, 40, 191-204.
Lin, J. S. C., & Chang, H. C. (2011). The role of technology readiness in self-
service technology acceptance. Managing Service Quality: An
International Journal, 21(4), 424-444.

________________________________________________________________________
________________________________________________________________________
103
Liu, S., Huang, L., & Chiou, Y. (2012). An integrated attitude model of self-
service technologies: evidence from online stock trading systems brokers.
Service Industries Journal, 32(11), 1823-1835.
doi:10.1080/02642069.2011.574695
Matzler, K., Bidmon, S., & Grabner-Kräuter, S. (2006). Individual determinants
of brand affect: the role of the personality traits of extraversion and
openness to experience. Journal of Product & Brand Management, 15(7),
427-434.
McLeod, S. (2009). Attitude measurement. Simply Psychology-Articles for
Students.
Meuter M.L, Ostrom A.L., Roundtree R.I. and Bitner M.J. (2000), “Self-service
technologies: understanding consumer satisfaction with technology-based
service encounters”, Journal of Marketing, 64, 3 (July), pp.50
Meuter, M. L. (1999). Consumer adoption of innovative self-service technologies:
A multi-method investigation (Order No. 9935964). Available from
ProQuest Dissertations & Theses Global. (304496909). Retrieved from
http://search.proquest.com/docview/304496909?accountid=50207
Meuter, M. L., Bitner, M. J., Ostrom, A. L., and Brown, S. W. (2005). Choosing
among alternative service delivery modes: An investigation of customer
trial of Self-Service technologies. Journal of Marketing, 69(2):61–83.
Meuter, M. L., Ostrom, A. L., Bitner, M. J., & Roundtree, R. (2003). The
influence of technology anxiety on consumer use and experiences with
self-service technologies. Journal of Business Research, 56(11), 899-906.
Milligan, B. (2007), “The man who invented the cash machine”, BBC News, 25
June. http://newsvote.bbc.co.uk, accessed 29 April 2008.
Mittal, B. (1999). The advertising of services meeting the challenge of
intangibility. Journal of Service Research, 2(1), 98-116.
Moreira, C. (2013). The Humble ATM: Swiss Army Knife of Banks - Rototype
International. Retrieved August 17, 2014, from
http://www.rototypeintl.com/newsroom/the-humble-atm-swiss-army-
knife-of-banks/#.U-_Fs_mSzLk

________________________________________________________________________
________________________________________________________________________
104
Norazah Mohd Suki, T. Ramayah, Norbayah Mohd Suki, (2008)
"Internet shopping acceptance: Examining the influence of intrinsic versus
extrinsic motivations", Direct Marketing: An International Journal, Vol. 2
Iss: 2, pp.97 – 110
Oghazi, P., Mostaghel, R., Hultman, M., & Parida, V. (2012). Antecedents of
Technology-Based Self-Service Acceptance: A Proposed Model. Services
Marketing Quarterly, 33(3), 195-210. doi:10.1080/15332969.2012.689937
Oyedele, A., & Simpson, P. M. (2007). An empirical investigation of consumer
control factors on intention to use selected self-service
technologies.International Journal of Service Industry Management, 18(3),
287-306.
Parasuraman, A. (2000). Technology Readiness Index (TRI) a multiple-item scale
to measure readiness to embrace new technologies. Journal of service
research, 2(4), 307-320.
Paynter, J., & Lim, J. (2001). Drivers and Impediments to E-commerce in
Malaysia. Malaysian Journal of Library & Information Science, 6(2), 1-19.
Peter, J. and Olson, J. 2005. Customer behaviour and marketing strategy, Irwin,
New York
Phongkusolchit, K. (2008). Improving self-service technologies utilization: The
potential impacts of technology anxiety, need for interaction with service
employees, and expected service quality (Order No. 3310993). Available
from ProQuest Dissertations & Theses Global. (304474695). Retrieved
from http://search.proquest.com/docview/304474695?accountid=50207
Pink, R. (2010). 7 Steps to Prepare Data for Analysis | Cvent Survey. Retrieved
from http://survey.cvent.com/blog/conducting-online-surveys/7-steps-to-
prepare-data-for-analysis
Rogers, E. (1995). Diffusion of innovations (4th ed.). New York, NY: Simon &
Shuster.
Roscoe, J.T. (1975). Fundamental Research Statistics for the Behavioural
Sciences, 2nd edition. New York: Holt Rinehart & Winston
Sandnes, F. E & Hagen, S. (2010) Toward accessible self-service kiosks through
intelligent user interfaces. Springer. (n.d.). Retrieved from
http://link.springer.com/article/10.1007%2Fs00779-010-0286-8
________________________________________________________________________
________________________________________________________________________
105
Sarkar, A. (2011). Impact of utilitarian and hedonic shopping values on
individual‟s perceived benefits and risks in online shopping. International
management review, 7(1), 58-65.
Schuh, J. H., & Upcraft, M. L. (2001). Assessment practice in student affairs. San
Francisco, CA: Jossey-Bass
Sinkovics, R. R., Stöttinger, B., Schlegelmilch, B. B., & Ram, S. (2002).
Reluctance to use technology‐related products: Development of a
technophobia scale. Thunderbird International Business Review, 44(4),
477-494.
Srikanth, R. P., & Padmanabhan, C. (2002). Indian banks cash in on delivery
channels. Express Computer. Retrieved from
http://www.expresscomputeronline.com/20021202/banks1.shtml
Suki, N. M., & Ramayah, T. (2010). User acceptance of the e-government
services in Malaysia: structural equation modelling
approach. Interdisciplinary Journal of Information, Knowledge, and
Management, 5(1), 395-413.
Sweeney, J. C., & Soutar, G. N. (2001). Consumer perceived value: the
development of a multiple item scale. Journal of retailing, 77(2), 203-220.
Tabachnick, B. G., & Fidell, L. S. (2007). Multivariate analysis of variance and
covariance. Using multivariate statistics, 3, 402-407.
Teo, T. S. (2001). Demographic and motivation variables associated with Internet
usage activities. Internet Research, 11(2), 125-137.
Van der Heijden, H. (2004). User acceptance of hedonic information systems.MIS
quarterly, 695-704.
Vaughan, G., & Hogg, M. A. (2005). Introduction to social psychology. Pearson
Education Australia.
Wang, C., Harris, J., & Patterson, P. (2009). Situational influences in the choice of
self-service in a multi-channel retail context. Retrieved from Diskbank:
http://www. duplication. net. au/ANZMAC09/papers/ANZMAC2009-261.
pdf.
Weijters, B., Rangarajan, D., Falk, T., & Schillewaert, N. (2007). Determinants
and outcomes of customers' use of self-service technology in a retail
setting.Journal of Service Research, 10(1), 3-21.

________________________________________________________________________
________________________________________________________________________
106
Wind, J., & Rangaswamy, A. (2001). Customerization: the next revolution in
mass customization. Journal of interactive marketing, 15(1), 13-32.
Xu, H. (2007). The effects of self-construal and perceived control on privacy
concerns. ICIS 2007 Proceedings, 125.
Zeithaml, V, A. & Bitner, M, J. (2003) Service Marketing: Integrating Customer
Focus Across the Firm, New York: McGraw-Hill Higher Education.
Zeithaml, V, A. & Bitner, M, J. (2009) Service Marketing: Integrating Customer
Focus Across the Firm, New York: McGraw-Hill Higher Education.
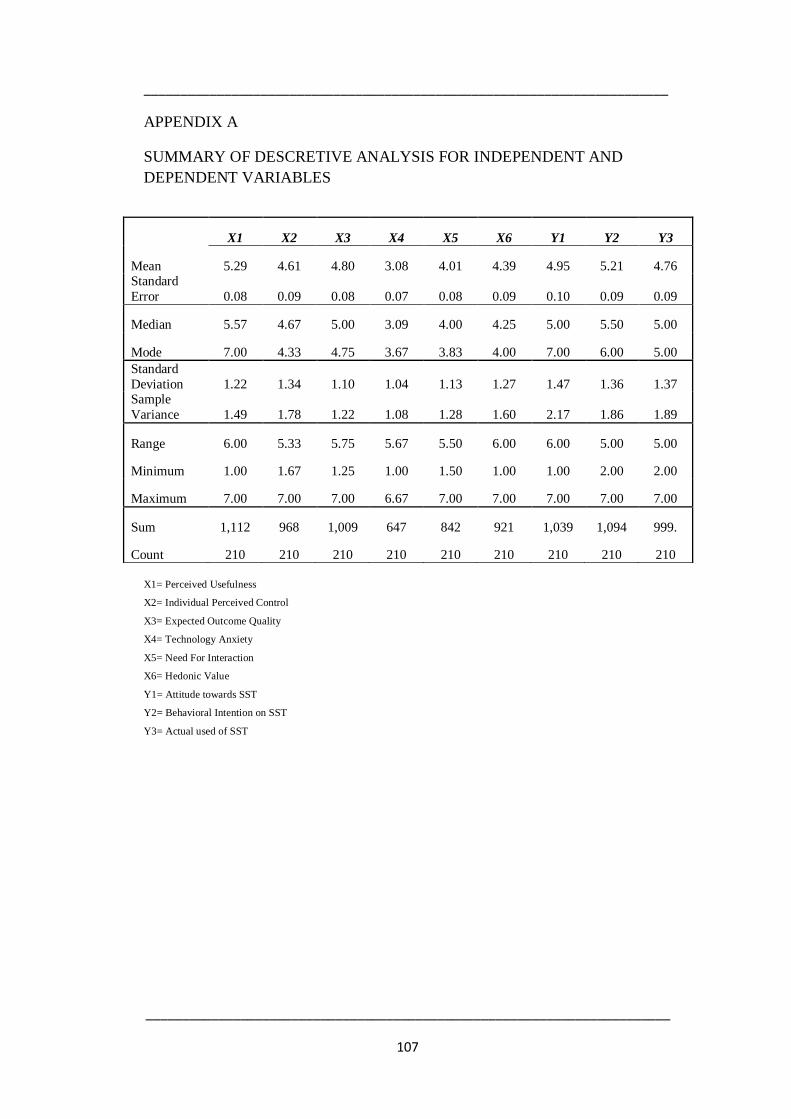
________________________________________________________________________
________________________________________________________________________
107
APPENDIX A
SUMMARY OF DESCRETIVE ANALYSIS FOR INDEPENDENT AND
DEPENDENT VARIABLES
X1= Perceived Usefulness
X2= Individual Perceived Control
X3= Expected Outcome Quality
X4= Technology Anxiety
X5= Need For Interaction
X6= Hedonic Value
Y1= Attitude towards SST
Y2= Behavioral Intention on SST
Y3= Actual used of SST
X1 X2 X3 X4 X5 X6 Y1 Y2 Y3
Mean 5.29 4.61 4.80 3.08 4.01 4.39 4.95 5.21 4.76 Standard
Error 0.08 0.09 0.08 0.07 0.08 0.09 0.10 0.09 0.09
Median 5.57 4.67 5.00 3.09 4.00 4.25 5.00 5.50 5.00
Mode 7.00 4.33 4.75 3.67 3.83 4.00 7.00 6.00 5.00
Standard
Deviation 1.22 1.34 1.10 1.04 1.13 1.27 1.47 1.36 1.37 Sample
Variance 1.49 1.78 1.22 1.08 1.28 1.60 2.17 1.86 1.89
Range 6.00 5.33 5.75 5.67 5.50 6.00 6.00 5.00 5.00
Minimum 1.00 1.67 1.25 1.00 1.50 1.00 1.00 2.00 2.00
Maximum 7.00 7.00 7.00 6.67 7.00 7.00 7.00 7.00 7.00
Sum 1,112 968 1,009 647 842 921 1,039 1,094 999.
Count 210 210 210 210 210 210 210 210 210
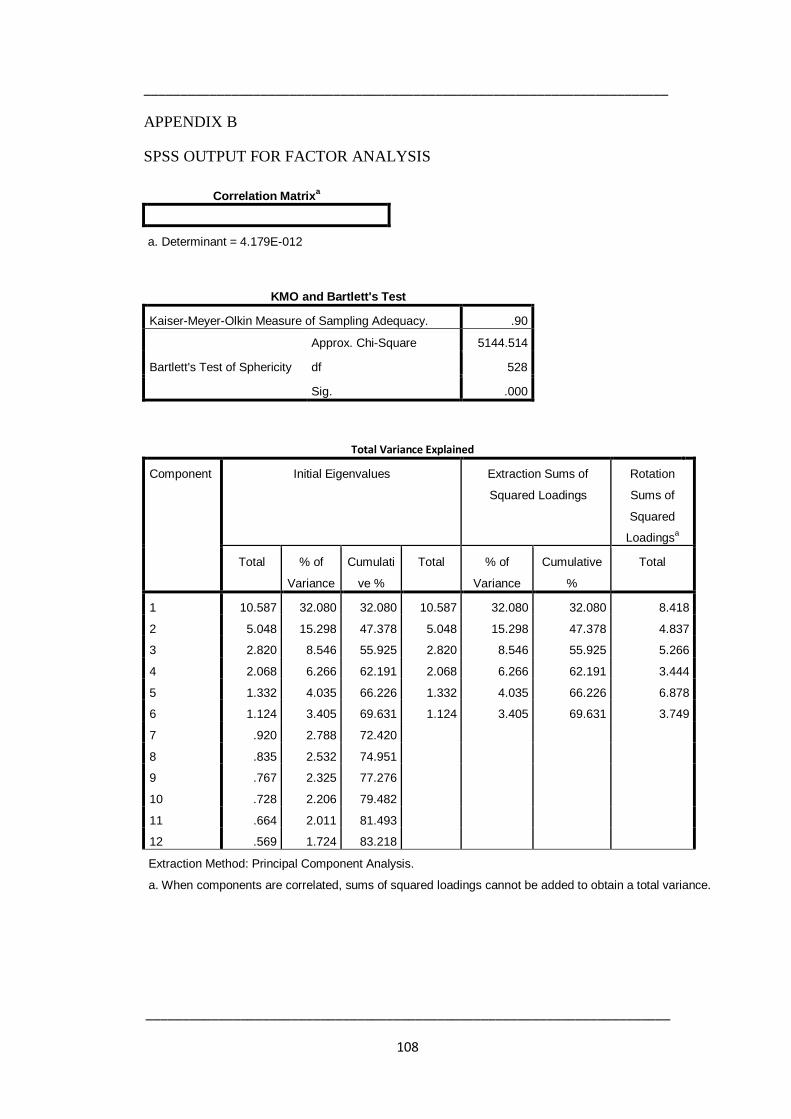
________________________________________________________________________
________________________________________________________________________
108
APPENDIX B
SPSS OUTPUT FOR FACTOR ANALYSIS
Correlation Matrixa
a. Determinant = 4.179E-012
KMO and Bartlett's Test
Kaiser-Meyer-Olkin Measure of Sampling Adequacy. .90
Bartlett's Test of Sphericity
Approx. Chi-Square 5144.514
df 528
Sig. .000
Total Variance Explained
Component Initial Eigenvalues Extraction Sums of
Squared Loadings
Rotation
Sums of
Squared
Loadingsa
Total % of
Variance
Cumulati
ve %
Total % of
Variance
Cumulative
%
Total
1 10.587 32.080 32.080 10.587 32.080 32.080 8.418
2 5.048 15.298 47.378 5.048 15.298 47.378 4.837
3 2.820 8.546 55.925 2.820 8.546 55.925 5.266
4 2.068 6.266 62.191 2.068 6.266 62.191 3.444
5 1.332 4.035 66.226 1.332 4.035 66.226 6.878
6 1.124 3.405 69.631 1.124 3.405 69.631 3.749
7 .920 2.788 72.420
8 .835 2.532 74.951
9 .767 2.325 77.276
10 .728 2.206 79.482
11 .664 2.011 81.493
12 .569 1.724 83.218
Extraction Method: Principal Component Analysis.
a. When components are correlated, sums of squared loadings cannot be added to obtain a total variance.

________________________________________________________________________
________________________________________________________________________
109
APPENDIX B
SPSS OUTPUT FOR FACTOR ANALYSIS (Continue)
Pattern Matrixa
Component
1 2 3 4 5 6
Expected outcome quality - Q1 -.796
Expected outcome quality - Q2 -.690
Expected outcome quality - Q3 -.749
Expected outcome quality - Q4 -.627
Hedonic Value - Q1 .700
Hedonic Value - Q2 .875
Hedonic Value - Q3 .898
Hedonic Value - Q4 .909
Individual perceived control - Q1 -.637
Individual perceived control - Q2 .413 -.568
Individual perceived control - Q3 -.721
Individual perceived control - Q4 -.570
Individual perceived control - Q5 -.639
Need for interaction - Q1 .885
Need for interaction - Q2 .889
Need for interaction - Q3 .769
Need for interaction - Q4 .587
Need for interaction - Q5 .888
Need for interaction - Q6 .461
Perceived usefulness - Q1 .765
Perceived usefulness - Q2 .824
Perceived usefulness - Q3 .830
Perceived usefulness - Q4 .856
Perceived usefulness - Q5 .907
Perceived usefulness - Q6 .827
Perceived usefulness - Q7 .842
Technology Anxiety - Q1 .701
Technology Anxiety - Q2 .650
Technology Anxiety - Q3 .720
Technology Anxiety - Q4 .425
Technology Anxiety - Q5 .818
Technology Anxiety - Q6 .416 .486
Technology Anxiety - Q7 .422
Extraction Method: Principal Component Analysis.
Rotation Method: Oblimin with Kaiser
Normalization.
a. Rotation converged in 10 iterations.

________________________________________________________________________
________________________________________________________________________
110
APPENDIX B
SPSS OUTPUT FOR FACTOR ANALYSIS (Continue)
Component Correlation Matrix
Component 1 2 3 4 5 6
1 1.000 .166 .256 -.031 -.497 -.361
2 .166 1.000 .032 .263 -.125 .033
3 .256 .032 1.000 -.147 -.344 -.218
4 -.031 .263 -.147 1.000 .003 -.001
5 -.497 -.125 -.344 .003 1.000 .267
6 -.361 .033 -.218 -.001 .267 1.000
Extraction Method: Principal Component Analysis.
Rotation Method: Oblimin with Kaiser Normalization.

________________________________________________________________________
________________________________________________________________________
111
APPENDIX C
SPSS OUTPUT FOR CRONBACH ALPHA
Cronbach‟s Alpha for construct 1: Perceived Usefulness
Item-Total Statistics
Scale Mean if
Item Deleted
Scale Variance
if Item Deleted
Corrected Item-
Total
Correlation
Cronbach's
Alpha if Item
Deleted
Perceived usefulness - Q1 31.57 54.957 .818 .943
Perceived usefulness - Q2 31.81 54.518 .797 .944
Perceived usefulness - Q3 31.70 53.142 .844 .940
Perceived usefulness - Q4 31.83 52.957 .862 .939
Perceived usefulness - Q5 31.88 53.859 .847 .940
Perceived usefulness - Q6 32.18 54.069 .809 .943
Perceived usefulness - Q7 31.71 53.811 .826 .942
Cronbach‟s Alpha for construct 2: Individual perceive control
Item-Total Statistics
Scale Mean if
Item Deleted
Scale Variance
if Item Deleted
Corrected Item-
Total
Correlation
Cronbach's
Alpha if Item
Deleted
Individual perceived control - Q1 9.20 7.309 .723 .754
Individual perceived control - Q2 9.28 8.076 .678 .797
Individual perceived control - Q3 9.17 7.760 .704 .773
Cronbach‟s Alpha for construct 3: Expected outcome quality
Item-Total Statistics
Scale Mean if
Item Deleted
Scale Variance
if Item Deleted
Corrected Item-
Total
Correlation
Cronbach's
Alpha if Item
Deleted
Expected outcome quality - Q1 14.59 10.981 .781 .809
Expected outcome quality - Q2 14.38 12.581 .679 .851
Expected outcome quality - Q3 14.40 10.929 .721 .835
Expected outcome quality - Q4 14.28 11.246 .717 .835

________________________________________________________________________
________________________________________________________________________
112
APPENDIX C
SPSS OUTPUT FOR CRONBACH ALPHA (Continue)
Cronbach‟s Alpha for construct 4: Technology Anxiety
Item-Total Statistics
Scale Mean if
Item Deleted
Scale Variance
if Item Deleted
Corrected Item-
Total
Correlation
Cronbach's
Alpha if Item
Deleted
Technology Anxiety - Q1 15.36 30.575 .379 .806
Technology Anxiety - Q2 15.06 26.877 .592 .758
Technology Anxiety - Q3 15.74 26.290 .665 .740
Technology Anxiety - Q5 15.55 27.809 .578 .762
Technology Anxiety - Q6 15.04 27.386 .600 .756
Technology Anxiety - Q7 15.62 29.022 .510 .777
Cronbach‟s Alpha for construct 5: Need for interaction
Item-Total Statistics
Scale Mean if
Item Deleted
Scale Variance
if Item Deleted
Corrected Item-
Total
Correlation
Cronbach's
Alpha if Item
Deleted
Need for interaction - Q1 19.96 31.917 .763 .830
Need for interaction - Q2 19.83 31.537 .740 .833
Need for interaction - Q3 19.94 33.480 .692 .843
Need for interaction - Q4 20.08 34.224 .526 .872
Need for interaction - Q5 19.92 31.032 .802 .822
Need for interaction - Q6 20.53 34.317 .513 .874
Cronbach‟s Alpha for construct 6: Hedonic Value
Item-Total Statistics
Scale Mean if
Item Deleted
Scale Variance
if Item Deleted
Corrected Item-
Total
Correlation
Cronbach's
Alpha if Item
Deleted
Hedonic Value - Q1 12.91 15.843 .786 .931
Hedonic Value - Q2 13.29 14.282 .876 .902
Hedonic Value - Q3 13.13 15.054 .851 .911
Hedonic Value - Q4 13.31 13.824 .868 .906

________________________________________________________________________
________________________________________________________________________
113
APPENDIX C
SPSS OUTPUT FOR CRONBACH ALPHA (Continue)
Cronbach‟s Alpha for construct 7: Attitude towards SST
Item-Total Statistics
Scale Mean if
Item Deleted
Scale Variance
if Item Deleted
Corrected Item-
Total
Correlation
Cronbach's
Alpha if Item
Deleted
Attitudes toward using SSTs - Q1 14.64 20.346 .885 .943
Attitudes toward using SSTs - Q2 14.90 19.985 .865 .948
Attitudes toward using SSTs - Q3 14.84 19.926 .919 .933
Attitudes toward using SSTs - Q4 14.98 18.913 .895 .940
Cronbach‟s Alpha for construct 8: Behavioural Intention towards SST
Item-Total Statistics
Scale Mean if
Item Deleted
Scale Variance
if Item Deleted
Corrected Item-
Total
Correlation
Cronbach's
Alpha if Item
Deleted
Behavioural Intentions to use SSTs - Q1 15.61 16.669 .913 .939
Behavioural Intentions to use SSTs - Q2 15.47 16.767 .922 .936
Behavioural Intentions to use SSTs - Q3 15.76 17.639 .847 .958
Behavioural Intentions to use SSTs - Q4 15.69 16.722 .901 .943
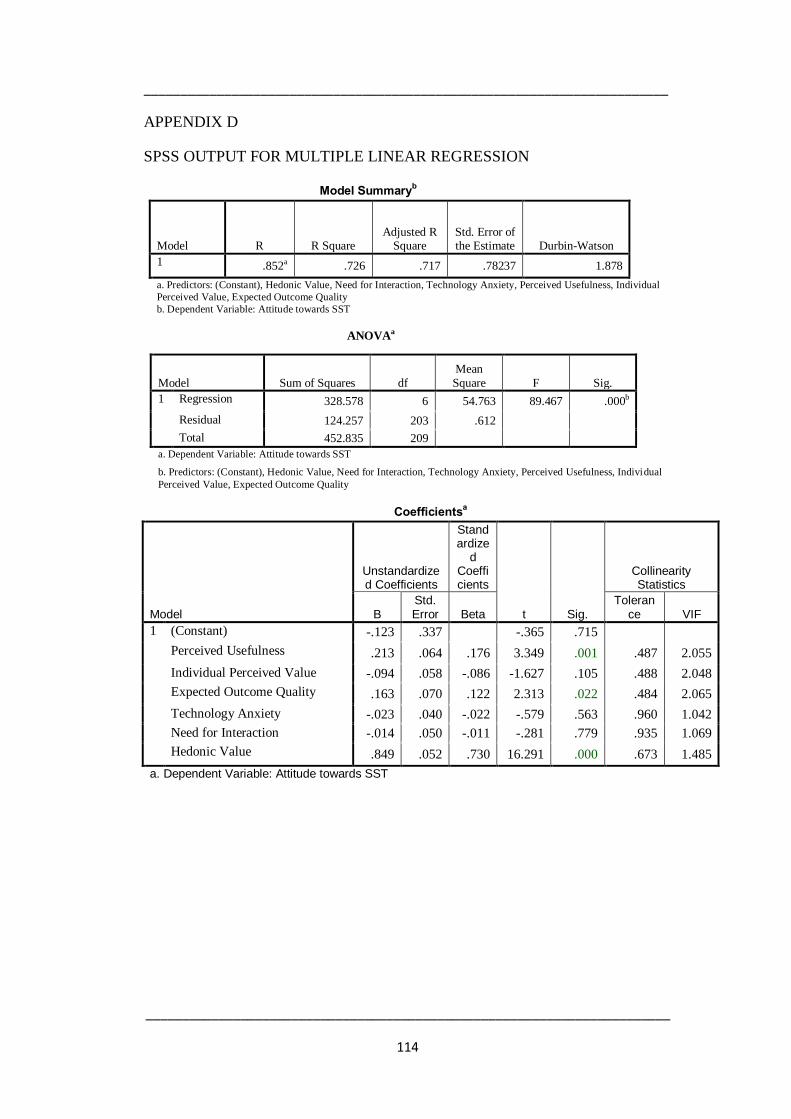
________________________________________________________________________
________________________________________________________________________
114
APPENDIX D
SPSS OUTPUT FOR MULTIPLE LINEAR REGRESSION
Model Summaryb
Model R R Square Adjusted R
Square Std. Error of the Estimate Durbin-Watson
1 .852a .726 .717 .78237 1.878
a. Predictors: (Constant), Hedonic Value, Need for Interaction, Technology Anxiety, Perceived Usefulness, Individual
Perceived Value, Expected Outcome Quality
b. Dependent Variable: Attitude towards SST
ANOVAa
Model Sum of Squares df
Mean
Square F Sig.
1 Regression 328.578 6 54.763 89.467 .000b
Residual 124.257 203 .612
Total 452.835 209
a. Dependent Variable: Attitude towards SST
b. Predictors: (Constant), Hedonic Value, Need for Interaction, Technology Anxiety, Perceived Usefulness, Individual
Perceived Value, Expected Outcome Quality
Coefficientsa
Model
Unstandardized Coefficients
Standardize
d Coefficients
t Sig.
Collinearity Statistics
B Std. Error Beta
Tolerance VIF
1 (Constant) -.123 .337 -.365 .715
Perceived Usefulness .213 .064 .176 3.349 .001 .487 2.055
Individual Perceived Value -.094 .058 -.086 -1.627 .105 .488 2.048
Expected Outcome Quality .163 .070 .122 2.313 .022 .484 2.065
Technology Anxiety -.023 .040 -.022 -.579 .563 .960 1.042
Need for Interaction -.014 .050 -.011 -.281 .779 .935 1.069
Hedonic Value .849 .052 .730 16.291 .000 .673 1.485
a. Dependent Variable: Attitude towards SST

________________________________________________________________________
________________________________________________________________________
115
APPENDIX E
SPSS OUTPUT FOR SIMPLE LINEAR REGRESSION
Model Summaryb
Model R
R Squar
e
Adjusted
R Square
Std. Error of the
Estimate
Durbin-
Wats
on
1 .808a .653 .651 .80505 1.596
a. Predictors: (Constant), Attitude towards SST
b. Dependent Variable: Behaviour Intention on SST
ANOVAa
Model Sum of Squares df
Mean Square F Sig.
1 Regression 253.307 1 253.307 390.841 .000b
Residual 134.806 208 .648
Total 388.113 209
a. Dependent Variable: Behaviour Intention on SST
a. Predictors: (Constant), Attitude towards SST
Coefficientsa
Model
Unstandardized Coefficients
Standardized
Coefficients
t Sig.
Collinearity Statistics
B Std. Error Beta Toleran
ce VIF
1 (Constant) 1.511 .195 7.742 .000
Attitude towards
SST .748 .038 .808 19.770 .000 1.000 1.000
a. Dependent Variable: Behaviour Intention on SST
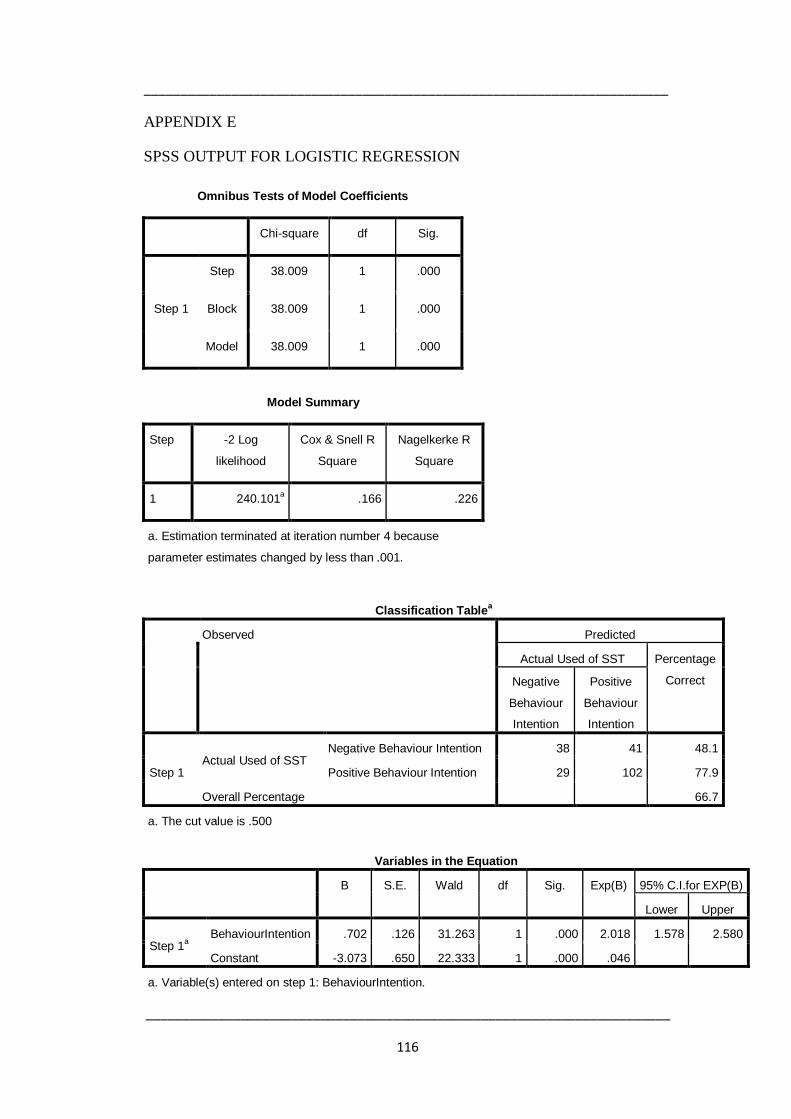
________________________________________________________________________
________________________________________________________________________
116
APPENDIX E
SPSS OUTPUT FOR LOGISTIC REGRESSION
Omnibus Tests of Model Coefficients
Chi-square df Sig.
Step 1
Step 38.009 1 .000
Block 38.009 1 .000
Model 38.009 1 .000
Model Summary
Step -2 Log
likelihood
Cox & Snell R
Square
Nagelkerke R
Square
1 240.101a .166 .226
a. Estimation terminated at iteration number 4 because
parameter estimates changed by less than .001.
Classification Tablea
Observed Predicted
Actual Used of SST Percentage
Correct
Negative
Behaviour
Intention
Positive
Behaviour
Intention
Step 1 Actual Used of SST
Negative Behaviour Intention 38 41 48.1
Positive Behaviour Intention 29 102 77.9
Overall Percentage 66.7
a. The cut value is .500
Variables in the Equation
B S.E. Wald df Sig. Exp(B) 95% C.I.for EXP(B)
Lower Upper
Step 1a
BehaviourIntention .702 .126 31.263 1 .000 2.018 1.578 2.580
Constant -3.073 .650 22.333 1 .000 .046
a. Variable(s) entered on step 1: BehaviourIntention.

________________________________________________________________________
________________________________________________________________________
117
APPENDIX F
E-MAIL INVITATION FOR DATA COLLECTION
From: [email protected]
To:
Subject: Data collection: Perceived factors influencing the acceptance and
adoption of self-service technology
Date: Thu, 15 Jan 2015 01:21:22 +0800
Dear all,
I am UTAR student currently doing my MBA course, to fulfill research project
requirement, I am currently conducting a research study entitled "Perceived
factors influencing the acceptance and adoption of self-service technology (SST)".
The objective of this research study is to determine influential perceived factors
on using SST, through perceived factors to find out Malaysian‟s attitude and
behaviour intention towards SST.
Believe that you have a busy schedule but your input is important. I would like to
ask you to lend me 10 minutes for answering questionnaire as per following link: -
https://docs.google.com/forms/d/1qkx2qDKWbygSLQ8y5tz3aFlgCoRuUhk4xyxr
lEbmwo/viewform
Please be assured that all information gathered from this questionnaire will be
kept private and confidential. Do not hesitate to e-mail me should you have any
comments or enquiries on the questionnaire.
Thank you
Mexen

Perceived factors influencing the acceptance andadoption of selfservice technology (SST)The objective of this survey is to identify the perceived factors and measure the attitude and behavior intention towards selfservice technologies.
* Required
Selfservice technologies (SSTs)
are technologies that enable individual to perform a task or transaction without any interaction with service personnel. For instant, online ticketing, selfservice laundry service, mcommerce, airport checkin kiosk and etc.
Your survey responses will be treated strictly confidential.
Section A Selfservice technologies used
1. How often do you use selfservice technology service? *Mark only one oval.
1 2 3 4 5 6 7
Never Always
2. What type of selfservice technologies you used? *You may select more than 1 optionsCheck all that apply.
ATM & CDM
Laundry service
Mobile commerce
Airport selfcheckin kiosk
Online trading of FX, Equities, Bonds
Online purchasing
Online banking or phone banking
user
Typewritten Text
APPENDIX G
user
Typewritten Text
QUESTIONNAIRE
user
Typewritten Text
user
Typewritten Text
user
Typewritten Text
user
Typewritten Text
user
Typewritten Text
user
Typewritten Text
user
Typewritten Text

3. How often do you use an Automated Teller Machine (ATM) or Cash DepositMachine (CDM)? *Mark only one oval.
I do not use this type of SST
Sometimes
Fairly often
Very often
Always
4. How often do you use selfservice laundry service? *Mark only one oval.
I do not use this type of SST
Sometimes
Fairly often
Very often
Always
5. How often do you engage in online transactions via mobile commerce? *Mark only one oval.
I do not use this type of SST
Sometimes
Fairly often
Very often
Always
6. How often do you use selfservice kiosks when you checkin at an airport? *Mark only one oval.
I do not use this type of SST
Sometimes
Fairly often
Very often
Always
7. How often do you perform online trading of FX, Equities, Bonds? *Mark only one oval.
I do not use this type of SST
Sometimes
Fairly often
Very often
Always

8. How often do you perform online purchase? *Mark only one oval.
I do not use this type of SST
Sometimes
Fairly often
Very often
Always
9. How often do you perform online banking or phone banking? *Mark only one oval.
I do not use this type of SST
Sometimes
Fairly often
Very often
Always
Section B Perceived Factors
Perceived usefulness
Please rate each of the statements below from strongly disagree to strongly agree.
10. Selfservice technology enables me to accomplish tasks more quickly *Mark only one oval.
1 2 3 4 5 6 7
StronglyDisagree
StronglyAgree
11. Using selfservice technology enhances my effectiveness on the job *Mark only one oval.
1 2 3 4 5 6 7
StronglyDisagree
StronglyAgree
12. Using selfservice technology makes it easier to do my job *Mark only one oval.
1 2 3 4 5 6 7
StronglyDisagree
StronglyAgree

13. Using the self‐service technology is more convenient *Mark only one oval.
1 2 3 4 5 6 7
StronglyDisagree
StronglyAgree
14. Using the self‐service technology make me perform task more efficiently *Mark only one oval.
1 2 3 4 5 6 7
StronglyDisagree
StronglyAgree
15. Using the self‐service technology will make me more productive. *Mark only one oval.
1 2 3 4 5 6 7
StronglyDisagree
StronglyAgree
16. Using the self‐service kiosk will save me time. *Mark only one oval.
1 2 3 4 5 6 7
StronglyDisagree
StronglyAgree
Individual perceived controlPlease rate each of the statements below from strongly disagree to strongly agree.
17. Selfservice kiosks are less intrusive as opposed to interpersonal interactions withfront desk staff. *Mark only one oval.
1 2 3 4 5 6 7
StronglyDisagree
StronglyAgree
18. I have control over using mobile commerce *Mark only one oval.
1 2 3 4 5 6 7
StronglyDisagree
StronglyAgree
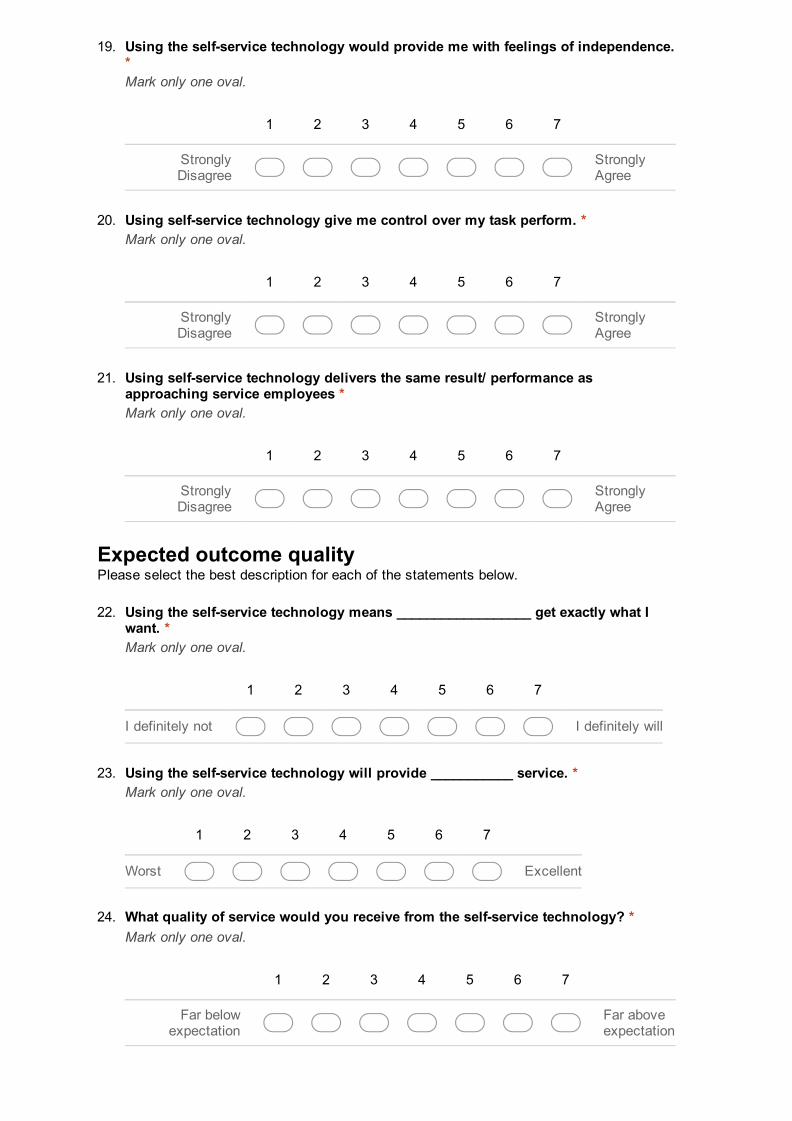
19. Using the selfservice technology would provide me with feelings of independence.*Mark only one oval.
1 2 3 4 5 6 7
StronglyDisagree
StronglyAgree
20. Using selfservice technology give me control over my task perform. *Mark only one oval.
1 2 3 4 5 6 7
StronglyDisagree
StronglyAgree
21. Using selfservice technology delivers the same result/ performance asapproaching service employees *Mark only one oval.
1 2 3 4 5 6 7
StronglyDisagree
StronglyAgree
Expected outcome qualityPlease select the best description for each of the statements below.
22. Using the selfservice technology means __________________ get exactly what Iwant. *Mark only one oval.
1 2 3 4 5 6 7
I definitely not I definitely will
23. Using the selfservice technology will provide ___________ service. *Mark only one oval.
1 2 3 4 5 6 7
Worst Excellent
24. What quality of service would you receive from the selfservice technology? *Mark only one oval.
1 2 3 4 5 6 7
Far belowexpectation
Far aboveexpectation

25. Using the selfservice technology will ________________________. *Mark only one oval.
1 2 3 4 5 6 7
not be reliable be very reliable
Technology AnxietyPlease rate each of the statements below from strongly disagree to strongly agree.
26. I feel nervous about using technology. *Mark only one oval.
1 2 3 4 5 6 7
StronglyDisagree
StronglyAgree
27. Technical terms are confusing to me. *Mark only one oval.
1 2 3 4 5 6 7
StronglyDisagree
StronglyAgree
28. I have avoided technology because it is unfamiliar to me. *Mark only one oval.
1 2 3 4 5 6 7
StronglyDisagree
StronglyAgree
29. I am confident I can learn technology related skills. *Mark only one oval.
1 2 3 4 5 6 7
StronglyDisagree
StronglyAgree
30. I have difficulty understanding most technological matters. *Mark only one oval.
1 2 3 4 5 6 7
StronglyDisagree
StronglyAgree
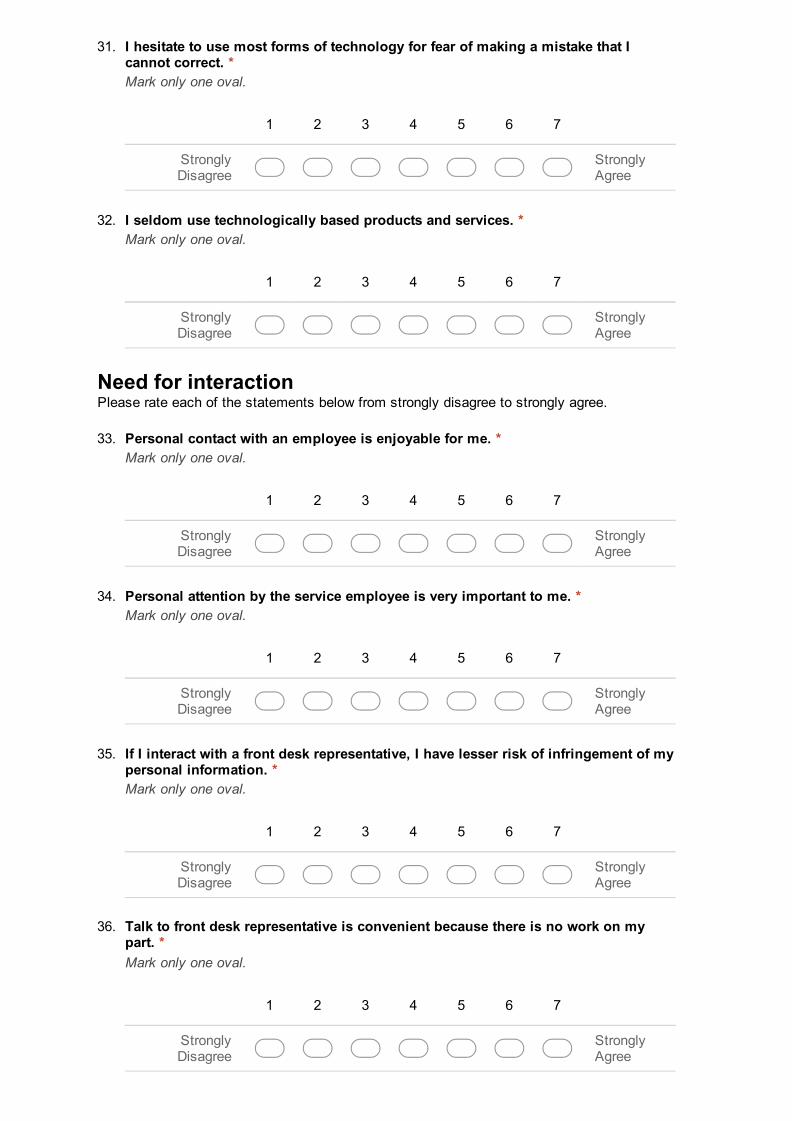
31. I hesitate to use most forms of technology for fear of making a mistake that Icannot correct. *Mark only one oval.
1 2 3 4 5 6 7
StronglyDisagree
StronglyAgree
32. I seldom use technologically based products and services. *Mark only one oval.
1 2 3 4 5 6 7
StronglyDisagree
StronglyAgree
Need for interactionPlease rate each of the statements below from strongly disagree to strongly agree.
33. Personal contact with an employee is enjoyable for me. *Mark only one oval.
1 2 3 4 5 6 7
StronglyDisagree
StronglyAgree
34. Personal attention by the service employee is very important to me. *Mark only one oval.
1 2 3 4 5 6 7
StronglyDisagree
StronglyAgree
35. If I interact with a front desk representative, I have lesser risk of infringement of mypersonal information. *Mark only one oval.
1 2 3 4 5 6 7
StronglyDisagree
StronglyAgree
36. Talk to front desk representative is convenient because there is no work on mypart. *Mark only one oval.
1 2 3 4 5 6 7
StronglyDisagree
StronglyAgree

37. I like interacting with the person who provides the service. *Mark only one oval.
1 2 3 4 5 6 7
StronglyDisagree
StronglyAgree
38. It bothers me to use a machine when I could talk with a person instead. *Mark only one oval.
1 2 3 4 5 6 7
StronglyDisagree
StronglyAgree
Hedonic ValuePlease select the best description for each of the statements below.
39. Using the selfservice technology is ________________________. *Mark only one oval.
1 2 3 4 5 6 7
definitely notenjoyable
deninitelyenjoyable
40. Using the selfservice technology is ________________________. *Mark only one oval.
1 2 3 4 5 6 7
definitely notentertaining
definitelyentertaining
41. Using the selfservice technology is ________________________. *Mark only one oval.
1 2 3 4 5 6 7
Not fun at all very fun
42. Using the selfservice technology is ________________________. *Mark only one oval.
1 2 3 4 5 6 7
extremetelyboring
veryinteresting
Attitudes toward using selfservice technologies (SSTs)Please select the best desciption that fits your attitude towards SSTs

43. SST is ______________. *Mark only one oval.
1 2 3 4 5 6 7
Bad Good
44. I ____________ SST. *Mark only one oval.
1 2 3 4 5 6 7
Hate Love
45. SST is ______________. *Mark only one oval.
1 2 3 4 5 6 7
Harmful Beneficial
46. SST is ______________. *Mark only one oval.
1 2 3 4 5 6 7
Unfavourable Favourable
Behavioral Intentions to use selfservice technologyPlease rate each of the statements below from strongly disagree to strongly agree.
47. I expect to perform the task through selfservice technology in the near future. *Mark only one oval.
1 2 3 4 5 6 7
StronglyDisagree
StronglyAgree
48. There is high probability that I will use the selfservice technology in the future. *Mark only one oval.
1 2 3 4 5 6 7
StronglyDisagree
StronglyAgree

49. There is high likelihood that I would recommend to my friend using selfservicetechnology. *Mark only one oval.
1 2 3 4 5 6 7
StronglyDisagree
StronglyAgree
50. On my next visit it is more likely that I will use a selfservice technology kiosk. *Mark only one oval.
1 2 3 4 5 6 7
StronglyDisagree
StronglyAgree
Section C User's Profile
51. Mark only one oval.
Option 1
52. Gender *Mark only one oval.
Male
Female
53. Age *Mark only one oval.
21 –30
31 – 40
41 50
51 – 60
More than 60
54. Ethnic group *Mark only one oval.
Malay
Chinese
Indian
Other:
55. Religion *Mark only one oval.
Muslim
Christian
Hindu
Buddhist
Taoist
Other:
56. Education level *Mark only one oval.
No formal education
Primary
Secondary
Preuniversity / STPM / Alevel
Certificate/Diploma/ Sijil/Diploma
Degree
Master/PhD
Professional qualifications
Other:
57. What is your current employment status? *Mark only one oval.
Employee Private Sector
Employee Government Sector
Employer
Selfemployed
Housewife
Retired
Student
Unemployed
Other:

Powered by
58. What is your HOUSEHOLD MONTHLY Income (RM) ? *Mark only one oval.
Less than 2000
2,000 2,999
3,000 3,999
4,000 4,999
5,000 5,999
6,000 6,999
7,000 7,999
8,000 and above
59. What is your FAMILY MONTHLY Expenses (RM)? *Include all expenses such as car, house installment, utility, children education....etcMark only one oval.
Less than 2000
2,000 2,999
3,000 3,999
4,000 4,999
5,000 5,999
6,000 6,999
7,000 7,999
8,000 and above
60. What are your main sources of information? *Check all that apply.
Radio
Television
Newspapers
The Internet (eg. blogs, Facebook, online news)
Other: