Per- and Polyfluoroalkyl substances (PFAS) in Agricultural ...
53
Ned Beecher, Special Projects Mgr., NEBRA Linda S Lee, Purdue University February 19, 2021 USDA • NRCS Conservation Webinars (http://conservationwebinars.net/) Per- and Polyfluoroalkyl substances (PFAS) in Agricultural Operations NEBRA’s PFAS page: https://www.nebiosolids. org/pfas-biosolids Includes “PFAS & Biosolids & Septage on NE Farms” and lit. reviews (click at bottom of page) 1
Transcript of Per- and Polyfluoroalkyl substances (PFAS) in Agricultural ...

Ned Beecher, Special Projects Mgr., NEBRALinda S Lee, Purdue University
February 19, 2021USDA • NRCS Conservation Webinars (http://conservationwebinars.net/)
Per- and Polyfluoroalkyl substances (PFAS) in Agricultural Operations
NEBRA’s PFAS page: https://www.nebiosolids.org/pfas-biosolidsIncludes “PFAS & Biosolids & Septage on NE Farms” and lit. reviews (click at bottom of page)
1

Outline• PFAS: Widely used! Much still unknown. • Why concern about PFAS?• Regulations near background levels• Sources of PFAS in soils, on farms• Why biosolids are applied to soils• Data on PFAS in biosolids, manures, and farm soils• PFAS fate in soils, plant uptake• Industrially-impacted farm situations• Ongoing PFAS research examples• PFAS mitigation: most efficient is to phase out non-essential uses
2

PFAS* - especially PFOSan extreme, worst-case contaminant of emerging concern*the only common trace contaminant of drinking water
regulated in low ppts*
FF
F
F
F
F
F
F
F
F
F
F
F
F
F
O
OH
PFOA
PFOS
3

Why the concern about PFAS?Widespread contamination + potential health concerns...
• There are hundreds of U. S. drinking water & groundwater PFAS contamination sites from industry & fire-fighting.
• Scary: “forever chemicals,” research links PFAS to some negative health impacts
• Community groups, researchers calling for action; some states taking action. Voluntary phase-outs continue (e.g. ski wax).
• See varying perspectives: https://pfasproject.com/ https://www.ewg.org/key-issues/toxics/nonstick-chemicals https://www.nebiosolids.org/pfas-biosolids https://dec.vermont.gov/water/drinking-water/water-quality-monitoring/pfas https://www1.health.gov.au/internet/main/publishing.nsf/Content/ohp-pfas-
expert-panel.htm4

In the news...
https://nmpoliticalreport.com/2019/02/19/groundwater-contamination-devastates-a-new-mexico-dairy-and-threatens-public-health/
https://www.newscentermaine.com/article/news/health/high-pfos-levels-detected-on-maine-farm-maine-milk-supply-deemed-safe/ 5

PFAS: Widely used!
“PFAS are used in almost all industry branches and in many consumer products. Some consumer products even have multiple applications of PFAS within the same product. A cell phone for example may contain fluoropolymer-insulated wiring, PFAS in the circuit boards/semiconductors, and a screen coated with a fingerprint-resistant fluoropolymer.”
https://pubs.rsc.org/en/content/articlelanding/2020/em/d0em00291g#!divAbstract
6

* Schaider et al., 2016. Septic systems as sources of organic wastewater compounds in domestic drinking water wells in a shallow sand and gravel aquifer. Sci. Total Environ.
__ 70 ppt__ MA, NH, & VT groundwater limits & MCLs
Regulations at background levels:Even septic systems may violate standards.Cape Cod, MA groundwater and drinking water was impacted, only by septic systems, at low ppt levels; no industrial sources nearby.
1 ppt = 1 ng/L = 1 ng/kg =1 second in 31,700 years.7

Regulations at background levels.Leaching from biosolids and even food waste composts may not be able to meet a few states’ standards.
MA & VT MCLs and groundwater quality standards:• 20 ppt for the sum of: PFNA, PFOA, PFOS, PFHpA, PFHxS (plus
PFDA in MA)
Maine (ME) soil screening levels: • PFOA 2.5 ppb• PFOS 5.2 ppb
1 ppt = 1 second in 31,700 years.
1 ppb = 1 second in 31.7 years.
8

Variability in regulations... (caused by uncertainties)
• MA drinking water standard (2020): 20 ppt (sum of 6 PFAS)
• CA drinking water notification levels: PFOA = 5.1 ppt, PFOS = 6.2 ppt
• Canada (Dec. 2018): PFOA = 200 ppt, PFOS = 600 ppt
9
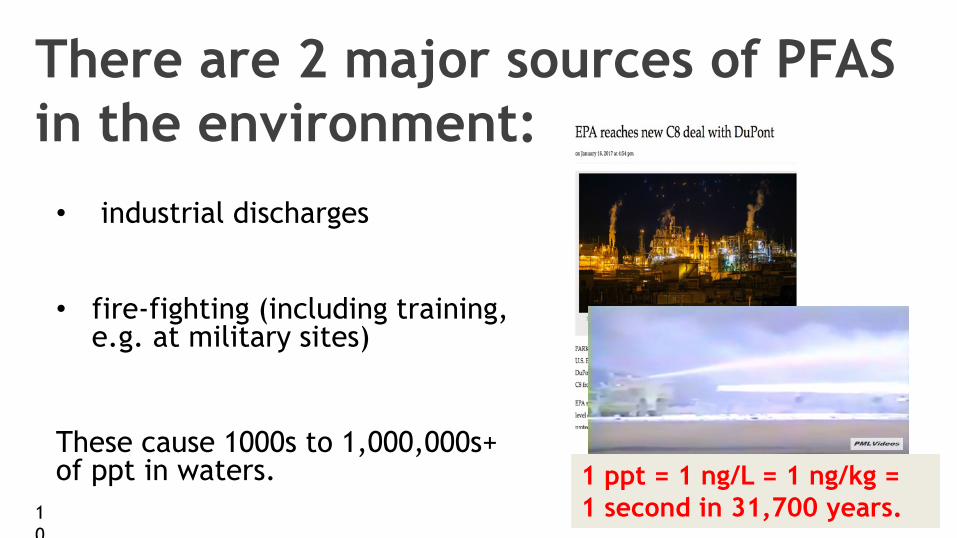
There are 2 major sources of PFAS in the environment:
• industrial discharges
• fire-fighting (including training, e.g. at military sites)
These cause 1000s to 1,000,000s+ of ppt in waters. 1 ppt = 1 ng/L = 1 ng/kg =
1 second in 31,700 years.10

PFAS contamination at industrial site...
https://www.ewg.org/research/update-mapping-expanding-pfas-crisis
Example: Wolverine Worldwide Kent County tannery dump sites, Rockford, MI
-Highest concentration is 76,000 PPT (PFOA+PFOS)
Suspected source: This area consists of a former licensed disposal facility owned and operated by Wolverine… and several unregulated dump sites across three townships in northern Kent County.
FF
F
F
F
F
F
F
F
F
F
F
F
F
F
O
OH
11

...and then there is ambient background PFAS,
including most wastewater and biosolids and other residuals (e.g. food waste compost, paper mill residuals), septic (onsite) systems, solid waste management activities – these are all receivers of PFAS, not original sources.
When any of these are recycled, the background PFAS go with them.
These cause 10s to 100s of ppt in waters.12

Sources of PFAS in soils / on farms• Aerial deposition from industry... Example: Merrimack, NH area, where
PFAS were ventilated from fabric coating industry
• Groundwater contamination farm water impacted... Example: NM dairy
• Fire-fighting foam use
• Lubricants, paints, cleaners, etc. Example: Floor cleaners & waxes used in schools result in school septic systems & water wells being contaminated.
• Biosolids and septage (derived from wastewater treatment)
• Composts derived from food waste, especially with compostable foodware
See NEBRA literature review.... Click to it from the bottom of this page: https://www.nebiosolids.org/pfas-biosolids
13

Study forVT DEC 2018
PFAS measured in randomly-selected sites with no obvious PFAS sources.
PFOS found in every sample
PFAS in Soils
14

Why biosolids are usedNEBRA’s PFAS page: https://www.nebiosolids.org/pfas-biosolidsIncludes “PFAS & Biosolids & Septage on NE Farms” and lit. reviews (click at bottom of page)
15

NEBRA’s PFAS page: https://www.nebiosolids.org/pfas-biosolids
Includes lit. reviews(click from bottom of page)
16

Next...Analyses & dataPFAS family, chemistry, lab & research data, understanding precursors & fate in biosolids & soils, and data from farm sites
FF
F
F
F
F
F
F
F
F
F
F
F
F
F
O
O-H+
PFOA
17

.
Initial finding: PFAS leach to groundwater some...
Sepulvado et al; Environ. Sci.
Technol. 2011, 45, 8106-8112
Concentrations of PFOA and PFOS with depth in the long-term plots at various loading rates. Control = 0 Mg/ha, LR 1 = 553 Mg/ha, LR 2 = 1109 Mg/ha, and LR 3 and LR 3 dup = 2218 Mg/ha (on dry weight basis).
Past research: PFAS fate in soils...
18

.
Initial finding: Short-chain PFAS show plant uptake, less with long-chain PFAS...
Blaine, A., Rich, C., Sedlacko, E., Hundal, L., Kumar, K., Lau, C., Mills, M., Harris, K., and Higgins, P., 2014. Perfluoroalkyl acid distribution in various plant compartments of edible crops grown in biosolids-amended soils. Environmental Science & Technology, (2014) 48, 7858–7865.
Past research: PFAS plant uptake...
19

The PFAS Family – more than just the ones you hear about the most
Figure modified from Wang et al., 2017, ES&T, 51:2508-2518 23
Currently > 4,800 PFAS producedNew estimate: >7000* PFAS (*Johnson et al., 2020)
All have a perfluoroalkyl chain of varying length
Numerous classes/subclasses, each with a unique differentiating characteristic
Each subclass includes PFAS with several different perfluoroalkyl chain lengths
An individual PFAS may have multiple isomers (linear versus different types of branching)
Each class either does not degrade or degrades to another class/subclass

PFOS C8Perfluorooctane sulfonic acid
PFOA C8Perfluorooctanoic acid
8-2 FTOH MeFOSA
PFAAsPersistent
Anionic (-), low pKaMore solubleMore mobile
PFAA Precursors
Perfluoroalkyl carboxylic acid (PFCA) Perfluoroalkyl sulfonic acid (PFSA)24
Multiple steps & pathways
2 are on the EPA ‘24’ List
PFAS ‘Biodegradability’ is not mineralization, but transformation to other PFAS!
PFAS example from the telomerization process PFAS example from the electrochemical process
Terminal microbial metabolites: PFCAs + PFSAs = PFAAs
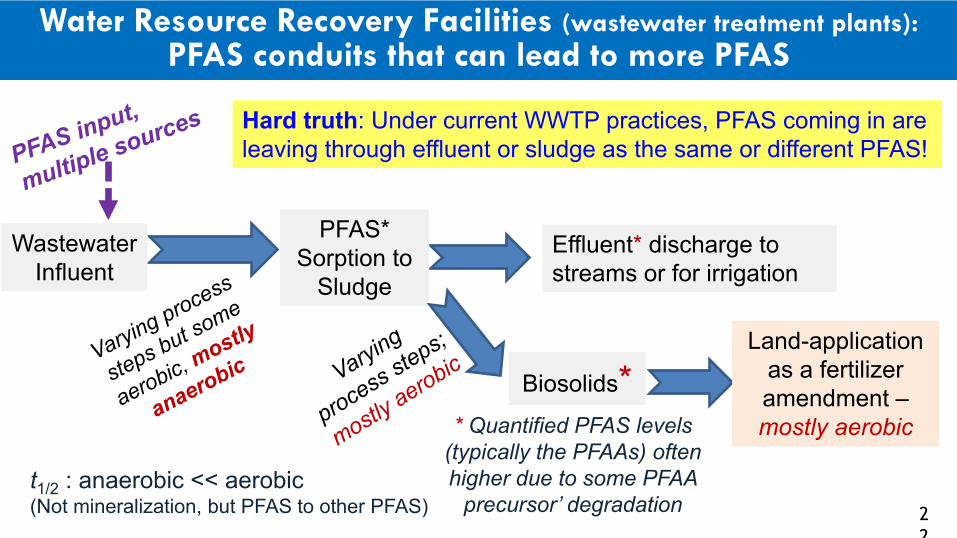
WastewaterInfluent
Effluent* discharge to streams or for irrigation
PFAS* Sorption to
Sludge
Biosolids*Land-application
as a fertilizer amendment –mostly aerobic
t1/2 : anaerobic << aerobic(Not mineralization, but PFAS to other PFAS)
* Quantified PFAS levels (typically the PFAAs) often higher due to some PFAA
precursor’ degradation
Hard truth: Under current WWTP practices, PFAS coming in are leaving through effluent or sludge as the same or different PFAS!
Water Resource Recovery Facilities (wastewater treatment plants):PFAS conduits that can lead to more PFAS
22

2014 Commercially AvailableA Food and yard compostB Compost with untreated wood productsC Manure compostD Manure and peat compostE
Mushroom compostFG Peat/compost based growing mixH
Heat-dried granular biosolids* 2014, 2016 & 2018
IJ*KLM Biosolids blended with maple sawdust and aged
barkN
Composted biosolids with woodchipsOP Composted biosolids with municipal solid waste
Q Composted biosolids with residential yard trimmings
R Composted biosolids with plant materials
2017 OFMSW Obtained through Zero Waste WAResidential and commercial food waste and yard waste. Allows compostable food packaging. Municipal food and yard waste and wood products. Allows compostable food packaging. Residential and commercial food waste and yard waste. Allows compostable food packaging. Residential and commercial food waste and yard waste. Allows compostable food packaging. Residential and commercial food waste and yard waste. Allows compostable food packaging.Residential and commercial food waste and yard waste. Allows compostable food packaging. Primarily commercial food waste (food scraps, coffee grounds, lobster shells), horse manure and wood shavings. Allows compostable food packaging. Leaves and grass from municipalities. Backyard Waste Compost Bin. Includes yard trimmings, food waste and unbleached coffee filters. No compostable serviceware or other paper products.Primarily leaves from municipalities.
PFAS Occurrence in Biosolids-based Products and Composts
23

• Extraction of solids with addition of mass-labeled surrogates• Targeted PFAS quantification in 2019-2020 publications for soil amendments
focused on perfluoroalkyl acids (PFAAs)*o 13 PFCAs (C4 to C18): CF3(CF2)nCOOHo 4 PFSAs (C4, 6, 8,10): CF3(CF2)nSO3
-
• Evaluated the relative presence of PFAA precursorso Total oxidizable precursor (TOP) assay- persulfate oxidation at high pH with heat
o Screened for 30 precursors• Evaluated PFAS release to porewater
*Our current approach includes 44 PFAS for quantitation with analytical standards (and growing), and target and nontarget screening using a Sciex QToF, SWATH analysis and an ever growing PFAS library.
General Analytical Approach Used
24

• Higher PFAA loads in biosolids-based products
• Range for the biosolid-based products: 30 – 185 µg/kg (ppb)
• Longer chains (CFn ≥ 6) dominant in 2014 biosolid-based products versus CFn ≤ 6 in 2017 municipal waste composts
• Higher [PFAA] in municipal waste composts with compostable food packaging (#1-7)
• * #9 included food wastes, coffee grounds, unbleached coffee filters
• Background levels include atmospheric deposition, insecticides, and contaminated water.
PFAS Occurrence in Biosolids-based Products and Composts
*
Choi, Lee et al. ES&T Letters, 6 (6):372–377 https://doi.org/10.1021/acs.estlett.9b00280Kim-Lazcano, Lee et al. ES&T 54(14):8640-8648. https://doi.org/10.1021/acs.est.9b07281 2
5

What did the Total Oxidizable Precursor (TOP) assay reveal about hiddenPFAA sources in 2014 Commercially Available Organic Soil Amendments?
• Largest increase observed in TOP was for PFHxA (note: not necessarily 1:1 precursor to PFAA)• ENVI-Carb clean-up step prior to the TOP assay is necessary; otherwise conversion efficiency
reduced due to dissolved organic matter.
• Increases in Total PFAA
concentration after TOP treatment reveals hidden
precursors
Precursor degradation after land application can
contribute to increases in available PFAAs for transport
26

From 2014 to 2018: ~80% PFOS (C8) reduction ~30% PFHxA (C6)
reduction
Keep in mind:• Only 17 PFAAs were analyzed.• Source and process dependent
Milorgonite commonly used in home gardens, golf courses,
community gardens, etc.
Temporal Trends May Vary (Example 1: PFAS Decreasing)
(*,**&*** statistically different at p<0)
Kim-Lazcano, Lee et al. ES&T 54(14):8640-8648. https://doi.org/10.1021/acs.est.9b07281
2014, 2016, & 2018 Milorganite - heat-treated biosolid-based fertilizer
27

0.001
0.01
0.1
1
10
100
10005:
3 FT
A7:
3 FT
A6:
2 FT
S8:
2 FT
SH
FPO
-DA…
PFBA
PFPe
APF
HxA
PFH
pAPF
OA
PFN
APF
DA
PFU
dAPF
DoA
PFTr
DA
PFTe
DA
PFBS
PFPe
SBr
-PFH
xSL-
PFH
xSPF
HpS
L-PF
OS
PFD
SL-
N-M
eFO
SAA
L-N
-EtF
OSA
ABr
-N-E
tFO
SAA
6:2
diPA
P8:
2 di
PAP
10:2
FTA
6:2
PAP
Cl-P
FHxP
APF
HxP
APF
DPA
6:6
PFPi
6:8
PFPi
Con
cent
ratio
n lo
g(µg
/kg)
2014 ∑17 PFAAs 35 µg/kg
2019 product: ∑PFAS 233 ± 5 µg/kg (ppb)
2019 ∑17 PFAAs 210 µg/kgVS
• ΣPFAAs:2014 << 2019
• TOP Assay & Nontarget screening revealed additional PFAS in 2014 product, but estimated ΣPFAS still << 2019 product
• Method modifications, e.g., increased PFAS targeted, improved extraction procedure (long chains and precursors)
Temporal Trends May Vary (Example 2: PFAS Increasing)
2014 vs 2019 Product - heat-treated biosolid-based fertilizer
28
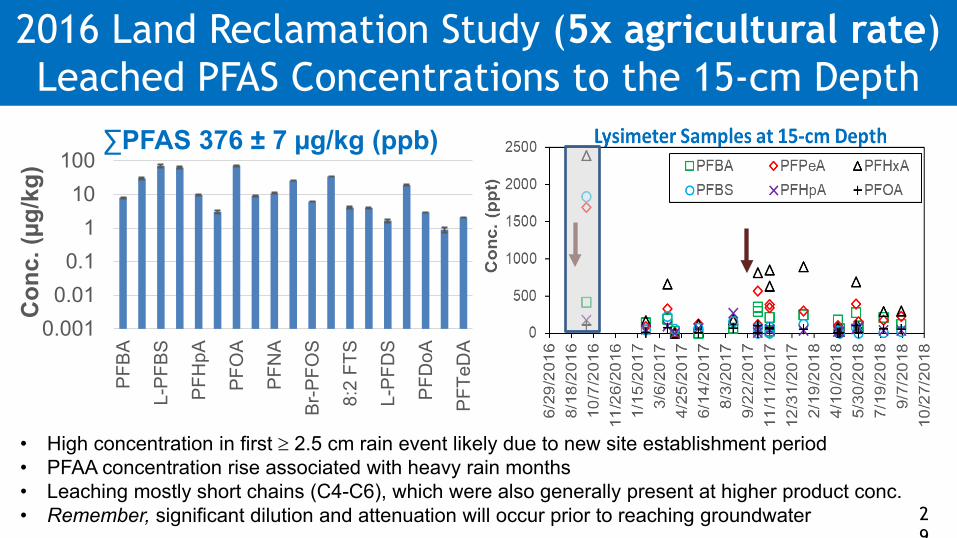
2016 Land Reclamation Study (5x agricultural rate)Leached PFAS Concentrations to the 15-cm Depth
0.0010.01
0.11
10100
PFBA
L-PF
BS
PFH
pA
PFO
A
PFN
A
Br-P
FOS
8:2
FTS
L-PF
DS
PFD
oA
PFTe
DA
Con
c. (µ
g/kg
)
∑PFAS 376 ± 7 µg/kg (ppb)
• High concentration in first ≥ 2.5 cm rain event likely due to new site establishment period• PFAA concentration rise associated with heavy rain months• Leaching mostly short chains (C4-C6), which were also generally present at higher product conc.• Remember, significant dilution and attenuation will occur prior to reaching groundwater 2
9

Biosolids and Biosolid-based Products are not all the Same
• Production practices vary by utility and if Class A or Class B biosolids: Temperatures Cycling times Feed composition Microbial populations …...
30

Biosolids and Biosolid-based Products are not all the Same
• Production practices vary by utility and if Class A or Class B biosolids: Temperatures Cycling times Feed composition Microbial populations, etc.
• Biosolids properties vary and may affect PFAS release:• Al content (e.g., 1,400 to 57,300 mg/kg)• Fe content (e.g., 1,575 to 299,000 mg/kg)• pH (e.g., 6.5 to 8)• % OM (e.g., 17-41%)• Polymer additions in the treatment process• Protein content may also vary and correlate to PFAS release
31

OC-normalized media-water sorption coefficients (Koc)strongly correlated with PFAA chain length (CF2 groups)
• Koc strongly correlated to PFAA chain length and similar for all organic-based amendments• Slope for PFSAs slightly higher even on a CF2 basis versus chain length• Koc values have NOT proven adequate for PFAA soil-water partitioning across soils (OC in
soils < compared to OC in biosolids) especially in trying to predict vadose-zone transport 32

Putting PFAA in Biosolids in Perspective (Example)
PFAAs in soil after an initial application based on N recommendations at the
start of the growing season
• Soil amendments/fertilizers are often applied based on N requirements• Products low in N could lead to higher PFAS loads with a single application• ALSO biosolids that are offered free to the public from their local municipality are often over
applied unlike use in commercial agriculture where regulations are in place• Plant uptake in home gardens may be a greater concern than commercially grown products
33

Impact of Common Biosolid Treatment Processeson PFAA levels (prior to land-application or use in gardens)
Only blending decreased PFAS loads due to dilution
(Kim Lazcano et al., 2019, Water Environ. Res.,doi:10.1002/wer.1174)3
4

Current field data:PFAS in manure?• Yes, where there are
high soil levels from industrial sources
• Minimal data
• PFAS can cycle in manure – soil – (plant?) -cow system
• Example: industrially-impacted Maine farm with manure up to 20 ppb (see right )
35

Current field data:Biosolids-Amended Soil Sampling DataMaine, 201929 fields, 1 sample each, multiple years of biosolids applicationug/kg (ppb)
Biosolids = typical, not-industrially impacted
Mean Maximum Minimum Screening PFOA 3.06 12.90 1.05
2.5PFOS 8.76 20.90 2.13
5.236

Current field data: Industrially-impacted farms...Vermont“Sewage sludge spreading leads to farm groundwater PFAS contamination:” (April 12, 2020)https://vtdigger.org/2020/04/12/sewage-sludge-spreading-leads-to-farm-groundwater-pfas-contamination/
But...• Only a few long-term biosolids
sites showed levels of potential concern. • These levels are far lower than industrial
& firefighting (e.g. max. of 176 ppt in data here )
• No significant impacts on farm products• Biosolids are “worst-case”; food waste composts have PFAS, just less.
Below:long-term septage land application;Vermont groundwater standard = 20 ppt for sum of 5 PFAS
37

Industrially-impacted farm... Wisconsin• April 15, 2020: PFAS found in 7 of 98 drinking water
wells near Marinette, WI where industrially-impacted biosolids were applied...
• But... only 1 result is above EPA health advisory (70 ppt):
• https://www.wbay.com/content/news/More-wells-in-Marinette-County-test-positive-for-elevated-levels-of-PFAS--569683041.htmlMilwaukee Journal Sentinel: https://www.jsonline.com/story/news/local/wisconsin/2020/04/14/forever-chemicals-johnson-controls-ordered-deliver-more-homes/2989330001/Wisconsin Public Radio: https://www.wpr.org/listen/1625136Wisconsin DNR info: https://dnr.wi.gov/topic/Contaminants/Marinette.html
38
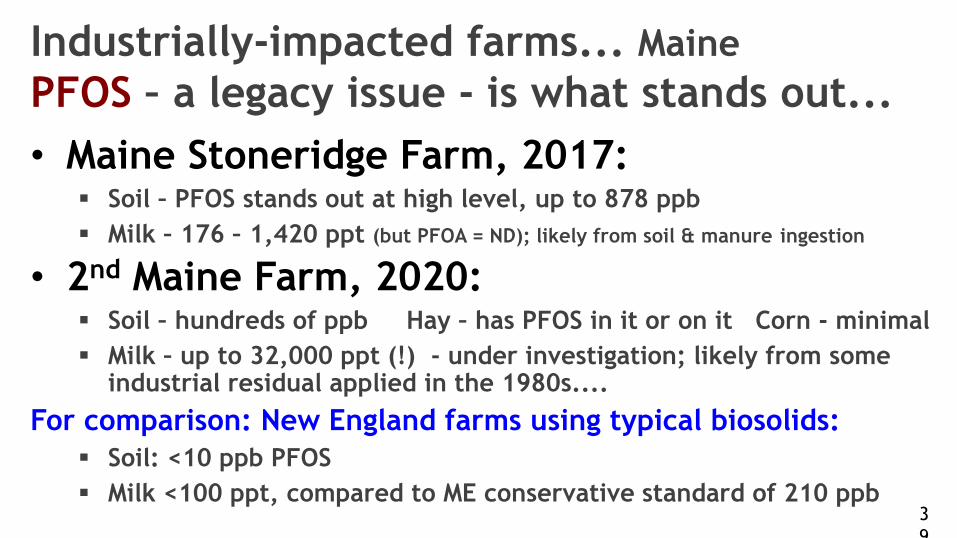
Industrially-impacted farms... MainePFOS – a legacy issue - is what stands out...• Maine Stoneridge Farm, 2017:
Soil – PFOS stands out at high level, up to 878 ppb Milk – 176 – 1,420 ppt (but PFOA = ND); likely from soil & manure ingestion
• 2nd Maine Farm, 2020: Soil – hundreds of ppb Hay – has PFOS in it or on it Corn - minimal Milk – up to 32,000 ppt (!) - under investigation; likely from some
industrial residual applied in the 1980s....For comparison: New England farms using typical biosolids:
Soil: <10 ppb PFOS Milk <100 ppt, compared to ME conservative standard of 210 ppb
39

But... Maine milk is safe.
https://www.maine.gov/dacf/ag/pfas/index.shtml
40

Industrially-impacted biosolids - Michigan MI showed how to efficiently address PFAS in biosolids.• PFAS source control upstream of wastewater plants has reduced
PFAS levels 90+% in biosolids. • Smart focus on source control & pretreatment = biggest risk
reduction for the cost. • Collaborative effort of Michigan EGLE & MPART (ag dept.), et al.
NEBRA coverage: https://www.nebiosolids.org/michigan-shows-effective-approach-to-pfas-in-wastewater-biosolids
Michigan EGLE:https://www.michigan.gov/pfasresponse/0,9038,7-365-88059_91299---,00.html
41
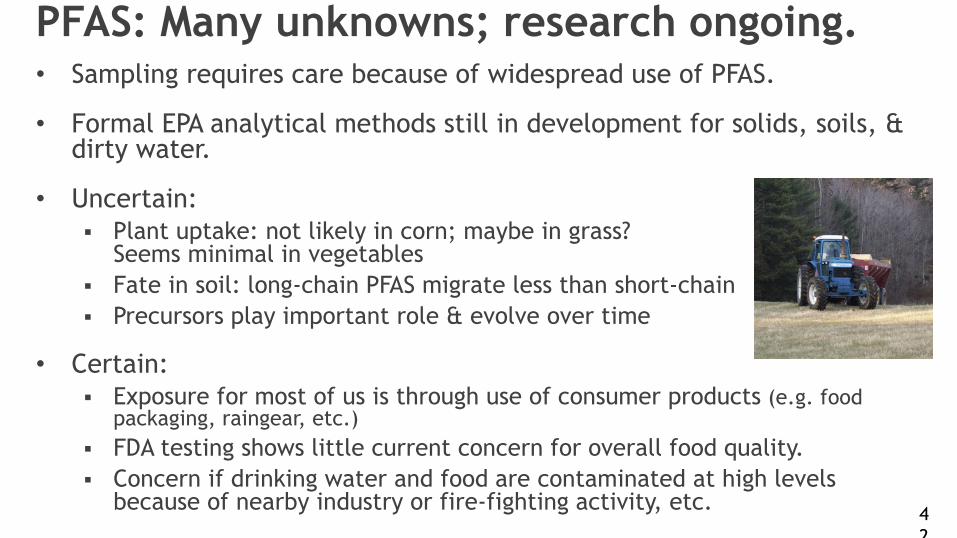
PFAS: Many unknowns; research ongoing.• Sampling requires care because of widespread use of PFAS.
• Formal EPA analytical methods still in development for solids, soils, & dirty water.
• Uncertain: Plant uptake: not likely in corn; maybe in grass?
Seems minimal in vegetables Fate in soil: long-chain PFAS migrate less than short-chain Precursors play important role & evolve over time
• Certain: Exposure for most of us is through use of consumer products (e.g. food
packaging, raingear, etc.) FDA testing shows little current concern for overall food quality. Concern if drinking water and food are contaminated at high levels
because of nearby industry or fire-fighting activity, etc. 42

Water Research Foundation Project #5042 (CDM Smith, Purdue)Assessing PFAS Release from Finished Biosolids
• 6-month study (4/27-10/20)• 7 biosolids• 140 to 450 µg/kg PFAS• 28 pore volumes passed• Leached PFAS concentrations varied• Precursor transformation evident
43

Goal 1 (Objectives 1-3):Reduce PFAS loads in the Water Resource & Recovery Facilities (WRRFs) bytreating PFAS in the landfill leachate entering the WRRF and in the centrate that getsreturned to the basins within the WRRF, which will also reduce PFAS loads in thesubsequent biosolids.
Goal 2 (Objectives 4-6):Simultaneously protect the beneficial use of biosolids and water quality byreducing the mobility of PFAS that may be present in biosolids
o Anaerobic digestion train: 2-2.5 time increase in typically quantified PFAo Anerobic thermophilic digestion train: ~5 times increaseo Pyrolyzed biosolids reduce PFAS leaching
Overarching Goals (6 Objectives)
EPA STAR G18B112718486 (1 of 7 funded)Decreasing polyfluoroalkyl substances (PFAS) in municipal wastewater effluent
and minimizing release from land-applied biosolidsL.S. Lee (PI, Purdue), J. Judy (co-PI, UF) & B. Chaplin (co-PI. UI-Chicago)
44

o Pyrolysis leads to volume & mass reduction
o Grinding material affects extraction efficiency
o Most PFAAs concentrations decreased with pyrolysis
o PFAA loss could be due to volatilization, thus may be in the syngas/oil product
o Apparent increases or negligible change for some PFAAs may be due to PFAA precursor breakdown or mass reduction greater than volatile losses
Low Temperature (350 °C, Low O2) Pyrolysis of Biosolids (Obj. 5)
0
100
200
300
400
500
600
PFAA
Con
c. (µ
g/kg
dw
) Ground biochar
Coarse biochar
Chicago Class AClass A Biosolid
Pyrolysis done by Dr. Wei Zheng
Illinois Sustainable Technology Center
University of Illinois at Urbana-Champaign 4
5

• Only PFCAs observed in porewater• [PFCA] < 7 ppt)• In the untreated Class A biosolid,
PFAA porewater concentrations ranged from 6 to 1200 ppt
• Pyrolysis reduced leaching of PFAAs even if totals on a mass basis increased
• Next steps - evaluate sorptivecapability of biochar for potential mixing with untreated biosolids
PFAA Release to Porewater ReducedAfter Low Temperature (350 °C, Low O2) Pyrolysis (Obj. 5)
Only PFCAs
46

To address key data gaps in our understanding of the occurrence and fate ofPFAS in rural landscapes and agricultural operations and their impacts on ruralwater supplies and agricultural products.
Overarching Goal
EPA NATIONAL PRIORITIES G20B113019085 (1 of 3 funded)Evaluating PFAS Occurrence and Fate in Rural Water Supplies and Agricultural
Operations to Inform Management Strategies (R840082) Lead at Purdue UniversityL.S. Lee (PI, Purdue), H. Preisendanz (co-PI, PSU) & Kurt Pennell (co-PI, Brown University)
We propose a combination of synergistic field, laboratory and modeling activities. We will survey rural water supplies for PFAS in PA, IN, and VA and evaluate data
available from other states where plausible to better understand sources to ruralwaters.
Overall Approach
https://cfpub.epa.gov/ncer_abstracts/index.cfm/fuseaction/recipients.display/rfa_id/658/records_per_page/ALL 4
7

Where are we on regulations being imposed on biosolids?
What is the best mitigation strategy?
48

Given PFAS are ‘Forever’ Chemicals, shouldn't we just ban PFAS-containing materials from land-application or stream discharge?
Banning land application places a heavy burden on public municipalitiesBanning could lead to numerous unintended consequencesControl sources contributing to PFAA levels in biosolids (e.g., pretreatment
of influent from industry or landfills with high PFAA levels) Focus on regulating nonessential uses of PFAS & ban them from use in
food packaging, carpets, etc. This will go a long way to reducing PFAS loads in municipal wastes including biosolids.
+ →49

Phase out use of most-concerning PFAS.EPA facilitated the most significant reduction of risk, phasing out PFOA & PFOS blood serum levels reduced 70%.
https://www.atsdr.cdc.gov/pfas/pfas-blood-testing.html
50
Ned Beecher, Special Projects Mgr.Tamworth, NH [email protected], x2
Thank you.
Biosolids compost for my raspberries…I still use it, knowing it has PFAS in it. I believe the benefits outweigh risks : )
PFAS & Biosolids: https://www.nebiosolids.org/pfas-biosolidsIncludes “PFAS and Biosolids and Septage on NE Farms”Click to lit. review on PFAS in Agriculture at bottom of page.
Summary article in Country Folks: https://countryfolks.com/pfas-and-agriculture-what-it-means/
“We can never get to zero...” https://www.wastedive.com/news/pfas-chemicals-organics-recycling-compost-biosolids/587044/
Linda S. Lee, [email protected](765) 494-8612

Acknowledgements & Sources of NEBRA PFAS slidesInclusion on this list does not imply endorsement. Views expressed are those of Ned Beecher/NEBRA only.• Linda Lee and Rooney Kim Lazcano, Purdue University• Stephen Zemba and Harrison Roakes, Sanborn Head Assocs.• Sarita Croce, Merrimack, NH• Shelagh Connelly and Charley Hanson, Resource Management, Inc.• Jeff McBurnie, Casella Organics• Lawrence Zintek, U. S. EPA Region 5• Andrew Carpenter and Leigh Dorsey, Northern TilthAnd many others (apologies for any omissions):
•Sally Brown, Univ. of WA•NH DES staff– esp. R. Gordon, A. Drouin•VT DEC staff – esp. Eamon Twohig•Mike Person, MI DEQ•Mark Russell, formerly Chemours•ME DEP staff- K. Malinowski, C. Hopkins•Layne Baroldi, Synagro•Sally Rowland, NY DEC•Barbara Reid, NH Municipal Association•Lakhwinder Hundal, formerly Chicago WRRF
•Jennifer Palmiotto,GS Rural Water (NH)•Rufus Chaney, USDA (retired)•Scott Firmin, Portland Water District•Ed Topp, Agriculture & Agrifood Canada•Charles Neslund, Eurofins•Matt Berg & Sherri van der Wege, WEAT•Tiffany Skogstrom, Mass EEEAAND many organizations across North America who funded NEBRA’s PFAS work in 2018 – 2020.
THANK YOU!

Acknowledgements for Dr. Lee’s slides Dr. Rooney Kim Lazcano (Ph.D. student, Purdue Univ.) Caroline Rose Alukkal M.S. (Ph.D. student, Purdue Univ.) M. Christina Schilling-Costello (Ph.D. student, Purdue Univ.) Dr. Michael L. Mashtare (Assist. Prof., Purdue Univ. now at Penn State) Dr. Youn Jeong Choi (Post doc., Purdue; Professional, Purdue) Dr. Mahsa Modiri-Gharehveran (Post Doc, Purdue Univ.) Heather Trim on behalf of Zero Waste Washington USDA National Institute of Food and Agriculture Hatch Funds USDA – Agriculture and Food Research Initiative Competitive Grant SERDP ER-2426 Geosyntec, DuPont Water Research Foundation-CDM Smith VA Hampton Roads Sanitation District (HRSD)