Per- and polyfluoroalkyl substances and fluorine mass ...
12
Environmental Science Processes & Impacts rsc.li/espi ISSN 2050-7887 PAPER Lara Schultes, Robin Vestergren, Jonathan P. Benskin et al. Per- and polyfluoroalkyl substances and fluorine mass balance in cosmetic products from the Swedish market: implications for environmental emissions and human exposure Volume 20 Number 12 December 2018 Pages 1633–1776
Transcript of Per- and polyfluoroalkyl substances and fluorine mass ...

Environmental ScienceProcesses & Impacts rsc.li/espi
ISSN 2050-7887
PAPERLara Schultes, Robin Vestergren, Jonathan P. Benskin et al.Per- and polyfl uoroalkyl substances and fl uorine mass balance in cosmetic products from the Swedish market: implications for environmental emissions and human exposure
Volume 20 Number 12 December 2018 Pages 1633–1776

EnvironmentalScienceProcesses & Impacts
PAPER
Ope
n A
cces
s A
rtic
le. P
ublis
hed
on 0
1 N
ovem
ber
2018
. Dow
nloa
ded
on 3
/22/
2022
7:5
6:26
AM
. T
his
artic
le is
lice
nsed
und
er a
Cre
ativ
e C
omm
ons
Attr
ibut
ion-
Non
Com
mer
cial
3.0
Unp
orte
d L
icen
ce.
View Article OnlineView Journal | View Issue
Per- and polyfluo
aDepartment of Environmental Science and
University, Stockholm, Sweden. E-mail: L
aces.su.sebSwedish Environmental Research Institute
[email protected] Society for Nature Conservation (S
† Electronic supplementary informa10.1039/c8em00368h
Cite this: Environ. Sci.: ProcessesImpacts, 2018, 20, 1680
Received 15th August 2018Accepted 1st November 2018
DOI: 10.1039/c8em00368h
rsc.li/espi
1680 | Environ. Sci.: Processes Impacts
roalkyl substances and fluorinemass balance in cosmetic products from theSwedish market: implications for environmentalemissions and human exposure†
Lara Schultes, *a Robin Vestergren,*b Kristina Volkova,c Emelie Westberg, b
Therese Jacobsonc and Jonathan P. Benskin *a
Per- and polyfluoroalkyl substances (PFASs) are a diverse class of >4700 chemicals used in commercial
products and industrial processes. Concerns surrounding PFASs are principally due to their widespread
occurrence in humans and the environment and links to adverse health effects. One of the lesser known
uses for PFASs is in cosmetic products (CPs) which come into contact with the skin (e.g. hair products,
powders, sunblocks, etc.). In the present work, thirty-one CPs from five product categories (cream,
foundation, pencil, powder and shaving foam) were analyzed for 39 PFASs by liquid chromatography-
tandem mass spectrometry, as well as extractable organic fluorine (EOF) and total fluorine (TF)
by combustion ion chromatography (CIC). This multi-platform approach enabled determination of the
fraction of fluorine accounted for by known PFASs (i.e. fluorine mass balance). Foundations and powders
contained 25 different PFASs with the most frequently detected being perfluorinated carboxylic acids
(perfluoroheptanoic acid and perfluorohexanoic acid) and polyfluoroalkyl phosphate esters (PAPs). S14PAP
concentrations up to 470 mg g�1 were measured in products listing mixtures of PAPs as an ingredient. For
all samples, S39PFAS concentrations only explained a small fraction of the EOF and TF, pointing to the
presence of unknown organic and/or inorganic fluorinated substances, including polymers. While creams,
pencil and shaving foams did not contain measurable concentrations of any of the 39 PFASs targeted here,
CIC revealed high to moderate TF content. Overall, these data highlight the need for further investigations
into the occurrence of PFASs in CPs and their importancewith regards to human and environmental exposure.
Environmental signicance
A number of regulatory restrictions and substitution measures have been implemented over the last decade with the aim of reducing environmental emissionsand human exposure to per- and polyuoroalkyl substances (PFASs). However, the large number and structural diversity of PFASs make it difficult tocomprehensively assess environmental emissions and human exposure to this class of contaminants. Using a multi-platform approach to facilitate uorinemass balance calculations, this study demonstrates that Swedish cosmetic products contain large quantities of both known and as-of-yet unidentied PFASs.The results indicate the need for improved understanding of dermal exposure and environmental emissions arising from PFASs in cosmetic products and theimportance of uorine mass balance determination as part of consumer product testing.
Introduction
Per- and polyuoroalkyl substances (PFASs) comprise a largeand diverse group of synthetic chemicals which have been
Analytical Chemistry (ACES), Stockholm
[email protected]; Jon.Benskin@
(IVL), Stockholm, Sweden. E-mail: Robin.
SNC), Stockholm, Sweden
tion (ESI) available. See DOI:
, 2018, 20, 1680–1690
produced since the 1940s. Due to the strong electronegativityand small atomic size of uorine, the peruoroalkyl moiety(–CnF2n+1) imparts unique properties to molecules includinghigh surface activity, chemical and thermal stability and water-and oil-repellency.1 These properties make PFASs useful as low-molecular weight surfactants or polymeric materials in an arrayof industrial applications and consumer products.2 However;following the detection of peruorooctane sulfonic acid (PFOS)and peruorooctanoic acid (PFOA) in human blood and wildlifesamples from around the globe in 2001 there has been anincreasing focus on the adverse environmental properties ofPFASs.3,4 Since the early 2000s it has been well-established thatlong-chain peruoroalkyl carboxylic acids (PFCAs) and
This journal is © The Royal Society of Chemistry 2018

Paper Environmental Science: Processes & Impacts
Ope
n A
cces
s A
rtic
le. P
ublis
hed
on 0
1 N
ovem
ber
2018
. Dow
nloa
ded
on 3
/22/
2022
7:5
6:26
AM
. T
his
artic
le is
lice
nsed
und
er a
Cre
ativ
e C
omm
ons
Attr
ibut
ion-
Non
Com
mer
cial
3.0
Unp
orte
d L
icen
ce.
View Article Online
peruoroalkyl sulfonic acids (PFSAs) fulll regulatory criteriafor persistent, bioaccumulative and toxic substances.5 Agrowing number of toxicological and epidemiological studiesalso suggest that elevated exposure to PFASs is related toadverse health effects in human populations.6–8
Concerns regarding long-term adverse effects of PFASs haveled to numerous regulatory actions and industry substitutioninitiatives for reducing human and wildlife exposure to PFASs.9
A general strategy among uorochemical producers in theEuropean Union (EU), North America and Japan has involvedreplacement of long-chain PFCAs, PFSAs and their precursorswith shorter-chain homologues or various per- or poly-uoroether compounds10,11 and reduction of point sourceemissions related to PFAS manufacture.12,13 The industrialtransition away from long-chain PFCAs and PFSAs was followedby regulatory restrictions on the quantity of these substancesused in consumer products to ensure compliance by the uo-rochemical industry. For example, with few exceptions, it isprohibited by EU regulation to manufacture or import productscontaining more than 10 mg kg�1 of PFOS and its salts.14 Asimilar restriction of 25 ppb of PFOA and its salts (or 1000 ppbSPFOA-related compounds) will be implemented in the EU in2020.15 These regulations, however, only cover a small numberof the PFASs in circulation on the global market. A recent reportby the Organization for Economic and Co-operation andDevelopment (OECD) identied 4730 PFAS related CASnumbers, of which 20% are mixtures.16 The database excludessubstances with missing CAS numbers or substances undercondential business information, suggesting that the actualnumber of PFASs might be even larger. For many of the non-regulated substances there is little information about theirstructure, use, exposure, toxicity, fate and associated risk(s),rendering the process of regulating these chemicals time-consuming.
One of the lesser known uses for PFASs is in cosmeticsproducts (CPs) which come into contact with the skin (e.g.hair products, powders, sunblocks, etc.). Examples of uori-nated ingredients in CPs include: per/polyuorinated acrylatepolymers, naphthalenes, alkanes/alkenes, alcohols, silox-anes, silanes, sulfonamides, ethers, esters, phosphate esters(PAPs), acrylates and acids.17 According to the EuropeanCommission's database on cosmetic ingredients (CosIng),these substances are used in CPs as emulsiers, antistatics,stabilizers, surfactants, lm formers, viscosity regulators andsolvents.18 Regulation of PFASs included in CPs on the Euro-pean market falls under the Cosmetics Regulation (Regula-tion (EC) no. 1223/2009) which stipulates that CPmanufacturers must ensure that the contents of their prod-ucts are safe for human health.19 However, this regulationdoes not contain requirements on the use of substances thatmay impact the environment (i.e. which display persistentand bioaccumulative properties). Instead, the cosmeticsregulation stipulates that environmental risks should beaddressed by REACH (Registration, Evaluation, Authorizationand restriction of Chemicals). REACH species that polymersand low molecular weight substances imported or manufac-tured in quantities of <1 tonne per year do not require hazard
This journal is © The Royal Society of Chemistry 2018
and risk assessments. Similarly, in the US, the Federal Food,Drug, and Cosmetic Act does not require cosmetic ingredients(with the exception of some color additives) to be approved bythe Food and Drug Administration prior to entering themarket.20 While CPs are expected to be safe for consumersunder their normal conditions of use, assessing the safety oftheir ingredients ultimately falls on the companies and indi-viduals responsible for marketing them. Thus, PFASs used inCPs may y under the radar of both EU and North AmericanCosmetics regulation and REACH, either because there are nodata on their risk(s) to human health or because they are usedin relatively small quantities.17
Few data are available on the occurrence of PFASs in CPs.While a recent survey of ingredients conrmed the presence of59 different PFAS-containing CPs on the Swedish market, theirconcentrations remain unknown.21 In fact, to our knowledgethe only study which has quantied PFASs in CPs was that ofFujii et al. (2013) in which >87% of products sampled fromJapan, Korea, France and the United States contained PFCAs.22
However; that study only focused on a small subset of knownPFASs, and not substances listed on the ingredients lists, as forexample PAPs. Clearly, one of the major challenges associatedwith characterizing CPs (and commercial products in general)involves how to handle the large number and diversity ofPFASs. While liquid chromatography coupled to tandem mass-spectrometry (LC-MS/MS) is the method of choice for ionicPFASs, volatile neutral PFASs and polymeric PFASs typicallyrequire analysis by gas chromatography (GC)-MS and matrix-assisted laser desorption ionization time-of-ight-MS, respec-tively.23,24 Despite the availability of these analytical platforms,many PFASs lack authentic standards, making them unquan-tiable using the aforementioned approaches. In order tocircumvent the problems of multiple MS-based approachesand standard availability, combustion ion chromatography(CIC)25–36 and particle induced gamma ray emission(PIGE)28,37,38 have recently been introduced for indirect quan-tication of total and extractable organic uorine (TF and EOF,respectively) in samples. As these approaches are uorine-specic, a standard of any uorinated substance may be usedfor quantication. When paired with targeted PFAS analysisusing e.g. LC-MS/MS, uorine mass balance calculations canbe used to assess the fraction of TF and EOF explained byknown PFASs, but also the fraction of as-of-yet unidentiedPFASs. Early applications of CIC and PIGE in reghtingfoams, biota and textiles have revealed that only a small frac-tion of the organic uorine content can be accounted for byknown PFASs.31,33,37
The overall aim of this study was to quantify a diverse rangeof PFASs in CPs on the Swedish market and assess the fractionof TF and EOF accounted for by these substances. To achievethis goal we used a combination of targeted LC-MS/MS analysisand uorine-specic CIC measurements, combined with uo-rine mass balance calculations. To our knowledge this is therst uorine mass balance study on CPs. The results are dis-cussed with respect to their implications for environmentalemissions and human exposure.
Environ. Sci.: Processes Impacts, 2018, 20, 1680–1690 | 1681

Environmental Science: Processes & Impacts Paper
Ope
n A
cces
s A
rtic
le. P
ublis
hed
on 0
1 N
ovem
ber
2018
. Dow
nloa
ded
on 3
/22/
2022
7:5
6:26
AM
. T
his
artic
le is
lice
nsed
und
er a
Cre
ativ
e C
omm
ons
Attr
ibut
ion-
Non
Com
mer
cial
3.0
Unp
orte
d L
icen
ce.
View Article Online
Methods and materialsSample selection
Thirty-one CPs from ve product categories were analyzed in thepresent work. Representative samples of PFAS-containing CPswere selected from a database of ingredient lists, compiled bythe Swedish Society for Nature Conservation (SSNC). Based onthe survey by KEMI in 2015, the most frequently reported PFASsreported in CPs were used to identify specic products con-taining these substances on their ingredient list.17 During 2016and 2017, 24 CPs listing 9 different PFASs as active ingredientswere purchased from the Swedish market. In addition, 7 prod-ucts which did not list PFASs among their ingredients werepurchased from the same stores as control samples. The prod-ucts included moisturizing creams (abbreviated CRE), founda-tions (FOUN), powders and eye shadows (POW), eye pencil(PEN) and shaving foams (SHAV). A tabular overview of thesamples, brand names and uorinated ingredients (according
Table 1 List of samples, brand and product names and fluorinated ingre
Sample IDa Brand Product name
CRE01 L'Oreal Skinperfection, Correcting Day MoisCRE02 Biotherm Aquasource, rich cream, dry skinCRE03 Biotherm Homme, Aquapower, Oligo-thermalCRE04 Biotherm Skin-best, Cream SPF 15, Normal/CoCRE05 Garnier The Miracle Cream, SPF 20, all skinCRE06 Lumene Beauty li, illuminating V-shaping sCRE07b Biotherm Aquasource nutrition, rich balm, verFOUN01 The Body Shop Shade adjusting drops darkeningFOUN02 Lumene Nude perfection uid foundation,
2 So Honey, normal to oily skinFOUN03 The Body Shop Fresh Nude Foundation SPF 15, 020FOUN04 IsaDora Hydralight, water-based matte make
FOUN05 Lumene BLUR Foundation longwear,6 Golden light, all skin types, SPF 15
FOUN06 Sensai Fluid nish lasting velvet, SPF 15FOUN07b Lumene Invisible illumination, instant
glow beauty serum, all skin typesFOUN08b IsaDora Wake up make-up, SPF 20FOUN09b The Body Shop Moisture foundation SPF 15PEN01 H&M Color Essence Eye Pencil (celestial)POW01 H&M Eylure Brow Palette, brow trioPOW02 IsaDora Eye color barPOW03 IsaDora Anti-Shine Mattiying Powder
POW04 H&M Face Palette (4 colors)POW05b IsaDora Bronzing powderPOW06 Lumene Luminous mattPOW07b H&M Blusher highlighter palettePOW08 IsaDora Ultra Cover compact powder 6in1
POW09 Lumene Longwear blurPOW10 H&M Highlight Palette (4 colors)POW11 H&M Face Palette (3 colors)POW12 Lumene CC color correcting powder 6 in 1SHAV01 Gillette Satin Care, Pure & DelicateSHAV02b Gillette Satin Care, Olay, Violet Swirl Shave g
a CRE ¼ cream; FOUN ¼ foundation; PEN ¼ pencil; POW ¼ powder; SHA
1682 | Environ. Sci.: Processes Impacts, 2018, 20, 1680–1690
to international nomenclature of cosmetic ingredients (INCI))as listed on the packaging is given in Table 1.
Targets of interest
A total of 39 PFASs were quantied in the present work. Sincenative and/or isotopically labelled standards were unavailable forsome PFASs, we dened three levels of data quality. Level 1 wasapplied to the following 17 targets for which a native standardand exactly matched, isotopically labelled standard were available(supplier information can be found in Table S1†): linear isomersof peruorobutanoate (PFBA), peruoropentanoate (PFPeA), per-uorohexanoate (PFHxA), peruoroheptanoate (PFHpA), PFOA,peruorononanoate (PFNA), peruorodecanoate (PFDA), per-uoroundecanoate (PFUnDA), peruorododecanoate (PFDoDA),peruorohexane sulfonate (PFHxS), PFOS, peruorooctanesulfonamide (FOSA), 1H,1H,2H,2H-peruorooctane sulfonate (6:2FTSA), 1H,1H,2H,2H-peruorooctylphosphate (6:2 monoPAP), 1H,1H,2H,2H-peruorodecylphosphate (8:2 monoPAP), bis(1H,1H,
dient (INCI nomenclature)
Fluorinated ingredient
turiser PTFEPolyperuoromethylisopropyl ether
comfort care Polyperuoromethylisopropyl ethermbination Skin PTFEtypes PTFEerum Triuoroacetyl tripeptide-2y dry skin —
Ammonium C6-16 peruoroalkylethyl phosphateC9-15 uoroalcohol phosphate
Bali Vanilla Ammonium C6-16 peruoroalkylethyl phosphate-up, 57 fair beige Polyperuoroethoxymethoxy
diuoroethyl PEG phosphatePeruorooctyl triethoxysilane
Triuoropropyl demethiconol—
——Peruorononyl dimethiconePTFEPTFEPolyperuoroethoxymethoxydiuoroethyl PEG phosphatePolytefum (PTFE), polytef (PTFE)—Peruorooctyl triethoxysilane—Polyperuoroethoxymethoxydiuoroethyl PEG phosphatePeruorooctyl triethoxysilanePolytefum (PTFE), polytef (PTFE)Polytef (PTFE)Peruorooctyl triethoxysilanePTFE
el —
V ¼ shaving foam. b No uorinated ingredient listed.
This journal is © The Royal Society of Chemistry 2018

Paper Environmental Science: Processes & Impacts
Ope
n A
cces
s A
rtic
le. P
ublis
hed
on 0
1 N
ovem
ber
2018
. Dow
nloa
ded
on 3
/22/
2022
7:5
6:26
AM
. T
his
artic
le is
lice
nsed
und
er a
Cre
ativ
e C
omm
ons
Attr
ibut
ion-
Non
Com
mer
cial
3.0
Unp
orte
d L
icen
ce.
View Article Online
2H,2H-peruorooctyl)phosphate (6:2/6:2 diPAP) and bis(1H,1H,2H,2H-peruorodecyl)phosphate (8:2/8:2 diPAP). Level 2 wasgiven to the following 13 targets for which a native standard wasavailable but not an exactly matched isotopically labelled stan-dard: peruorotridecanoate (PFTrDA), dodecauoro-3H-4,8-diox-anonanoate (ADONA), 9-chlorohexadecauoro-3-oxanonane-1-sulfonate (9Cl-PF3ONS), 11-chloroeicosauoro-3-oxaundecane-1-sulfonate (11Cl-PF3OUdS), peruorobutane sulfonate (PFBS),peruorodecane sulfonate (PFDS), peruorooctane sulfonami-doacetic acid (FOSAA), 1H,1H,2H,2H-peruorohexane sulfonate(4:2 FTSA), 1H,1H,2H,2H-peruorodecane sulfonate (8:2 FTSA),1H,1H,2H,2H-peruorohexylphosphate (4:2 monoPAP), 1H,1H,2H,2H-peruorododecylphosphate (10:2 monoPAP), bis(1H,1H,2H,2H-peruorohexyl)phosphate (4:2/4:2 diPAP) and (1H,1H,2H,2H-peruorooctyl)(1H,1H,2H,2H-peruorodecyl)phosphate(6:2/8:2 diPAP). Finally, a data quality rating of level 3 was givento 9 targets for which native and isotopically labelled standardswere unavailable and concentrations were determined semi-quantitatively using a structurally similar substance. This wasonly applied when there was a high degree of condence in theidentication (i.e. consistent retention times and MS/MS tran-sitions relative to other PFAS homologues). Level 3 was appliedto the following targets: peruoroheptane sulfonate (PFHpS),peruorononane sulfonate (PFNS), peruoroundecane sulfo-nate (PFUnDS), and 6 polyuoroalkyl phosphate diesters (4:2/6:2 diPAP, 6:2/10:2 diPAP, 8:2/10:2 diPAP, 6:2/12:2 diPAP, 8:2/12:2 diPAP, 6:2/14:2 diPAP). See Table S1† for more information.
Targeted PFAS analysis
Sample extraction and targeted analysis was carried out atStockholm University (SU). Samples were extracted usinga method adapted from Powley et al. (2005).39 Briey, 0.5 ml of0.2 M NaOH, 5 ml methanol and 50 ml of internal standardmixture (50 ng ml�1) were added to 0.1 g of sample material.Thereaer, samples were vortexed and extracted in an ultra-sonic bath at room temperature for 30 minutes. Aer centri-fuging at 2000 rpm for 5 minutes, the supernatant wastransferred to a new test tube. The extraction was repeated with5 ml methanol and the extract centrifuged for 20 min at3000 rpm, aer which it was neutralized with 50 ml of 2 M HCl.The combined supernatants from both extractions wereconcentrated under a gentle stream of nitrogen to about 1 ml.500 ml of the concentrated extract was transferred to a 1.5 mlEppendorf tube containing 25 mg graphitized carbon (Supel-clean ENVI-carb) and 50 ml glacial acetic acid, vortexed andcentrifuged at 10 000 rpm for 10 minutes before transferringthe supernatant to a new Eppendorf tube to which 50 ml ofrecovery internal standards (20 ng ml�1) and 500 ml of 4 mMaqueous NH4OAc solution was added. The samples were storedin the freezer until the day of analysis. Before injection, thesamples were vortexed, centrifuged and transferred to a microvial.
Extracts were injected (5 ml) onto an Acquity UPLC (WatersCorp., Milford, MA) equipped with BEH C18 guard (5� 2.1 mm,1.7 mm particle size) and analytical (50 � 2.1 mm, 1.7 mm)column operated at 40 �C. Mobile phase composition and
This journal is © The Royal Society of Chemistry 2018
details about gradient and ow rate can be found in Tables S2and S3.† Detection of PFASs was carried out using a triplequadrupole mass spectrometer (Xevo TQ-S, Waters Corp, Mil-ford, MA) operated in negative electrospray ionization modeaccording to a method reported by Gebbink et al.40 Furtherinformation onMS parameters andMS transitions can be foundin Table S1.† Quantication of individual PFASs (39 targets) wascarried out using linear calibration curves (1/x weighting)ranging from 0.008 to 150 ng ml�1.
In cases where a target exceeded the concentration of thehighest point in the calibration curve (some mono- and diPAPs insamples FOUN01, FOUN02 and FOUN03), the respective extractsand blanks were subjected to three levels of dilution (1 : 5 to1 : 500) depending on the analyte concentration followed byfortication of internal standard (10 ng) and re-analysis on LC-MS/MS. The addition of internal standards to the extracts(versus to the sample) accounts for matrix effects in the quanti-cation; however, losses during the extraction procedure are nottracked by this approach. Generally, the concentration of ananalyte in the nal extract can be adjusted either by reducing theamount of material subjected to extraction or by diluting theextract. However, in the case of samples FOUN01, FOUN02 andFOUN03, the concentrations were too high to nd a balance ofsample amount and nal volume at which a reasonable amountof internal standard added to the sample would still be detectablein the diluted extract. Therefore, the concentrations reported forPAPs in those three samples are not corrected for procedurallosses. Thus, these not-corrected concentrations are directlycomparable to EOF concentrations, which also return concen-trations in the sample extract rather than in the neat sample, andcan be used directly for mass balance calculations.
The procedural blanks that were prepared and processedindependently along with all samples did not show detectablecontamination for any target PFAS. Therefore, the LODs weredetermined using the concentration obtained from the lowestcalibration point with a signal to noise ratio of at least 3 andconverted to w/w units using an average sample weight. LODsare summarized in Tables S8 and S9.† In case of extract dilution,the dilution factor has to be taken into account for the calcu-lation of the LOD for the respective sample.
Analysis of total uorine and extractable organic uorine
TF and EOF measurements were carried out at SU usinga Thermo-Mitsubishi combustion ion chromatograph (CIC).Sample extracts (100 ml) were placed in a ceramic sample boatcontaining glass wool for better dispersion of the uids whileneat CP material was weighed directly into the sample boat. Allboats were baked prior to sample combustion to minimizebackground contamination. The samples were combustedslowly in a combustion furnace (HF-210, Mitsubishi) at 1100 �Cunder a ow of oxygen (400 l min�1) and argonmixed with watervapor (200 l min�1) for approximately 5 minutes. Combustiongases were absorbed in MilliQ water during the entire length ofthe combustion process using a gas absorber unit (GA-210,Mitsubishi). An aliquot of the absorption solution (18 or 200ml, depending on sample concentration) was injected onto an
Environ. Sci.: Processes Impacts, 2018, 20, 1680–1690 | 1683
Environmental Science: Processes & Impacts Paper
Ope
n A
cces
s A
rtic
le. P
ublis
hed
on 0
1 N
ovem
ber
2018
. Dow
nloa
ded
on 3
/22/
2022
7:5
6:26
AM
. T
his
artic
le is
lice
nsed
und
er a
Cre
ativ
e C
omm
ons
Attr
ibut
ion-
Non
Com
mer
cial
3.0
Unp
orte
d L
icen
ce.
View Article Online
ion chromatograph (Dionex Integrion HPIC, Thermo FisherScientic) equipped with an anion exchange column (DionexIonPac AS19 2 � 50 mm guard column and 2 � 250 mmanalytical column, 7.5 mm particle size) operated at 30 �C.Chromatographic separation was achieved by runninga gradient of aqueous hydroxide mobile phase ramping from8 mM to 60 mM at a ow rate of 0.25 ml min�1. Fluoride wasdetected using a conductivity detector.
Sample sizes were approximately 5 mg of neat CP materialfor TF analysis (i.e. direct combustion; Fig. 1) and 0.05–0.8 g ofCP material for EOF (i.e. combustion of extract; Fig. 1)depending on the expected uorine concentration. Samplesintended for EOF analysis were extracted using a similarprocedure as for targeted analysis described above but withoutaddition of internal standards. The nal volume of the extractwas adjusted by evaporation of the solvent to about 2 ml, withthe exception of high concentration samples which were kept ata nal volume of 10 ml. In both cases, extraction blanks of thesame nal solvent volume were analyzed together with thesample extracts. More information about blank monitoring andquality control procedures can be found in the QA/QC section.
Quantication of TF and EOFwas carried out using a linear six-point calibration curve of PFOS ranging from 0.5 to 100 mg ml�1
(r2 > 0.999). EOF extract concentrations were adjusted by dilutionwith methanol or solvent evaporation under nitrogen to t withinthe concentration range of the calibration curve. The LOD for TFmeasurements was calculated from three times the average areaobtained from instrumental blanks (n ¼ 3) and converted usingan average sample amount (3 mg) which resulted in 91.1 mg g�1.TF method blanks were below 1% of sample concentrations, andtherefore TF measurements were not blank-corrected. For EOFmeasurements, LODs were calculated using three times theaverage signal of the procedural blank (n ¼ 3) converted with thecorresponding calibration curve and an average nal extractvolume (2 ml) and sample amount (0.5 g). LODs for EOFmeasurements were determined for every batch of measurementsand varied depending on the inter-day variability of the instru-mental response and blank level and ranged from 1.02 to 6.65 mgg�1. All EOF concentrations were blank corrected.
Fluorine mass balance calculations
Fluorine mass balance calculations were carried out by con-verting the concentration for a given PFAS measured by LC-MS/MS (CPFAS; ng PFAS per g) to its corresponding uorideconcentration (CF_PFAS; ng F per g) using the following equation:
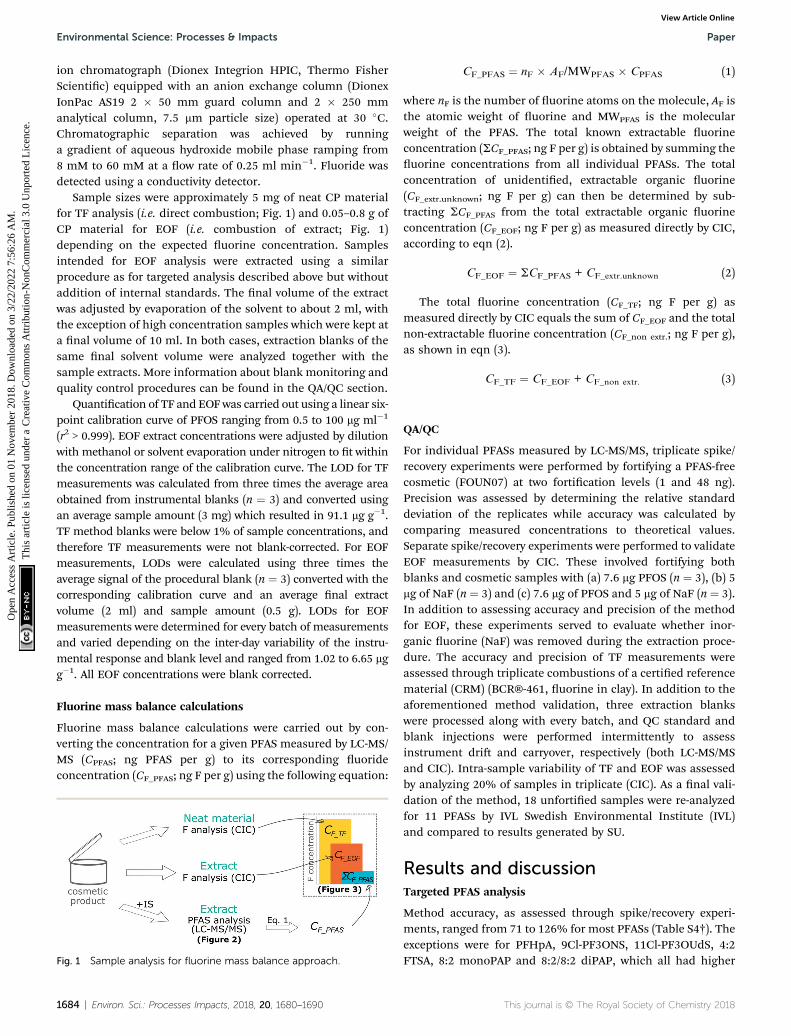
Fig. 1 Sample analysis for fluorine mass balance approach.
1684 | Environ. Sci.: Processes Impacts, 2018, 20, 1680–1690
CF_PFAS ¼ nF � AF/MWPFAS � CPFAS (1)
where nF is the number of uorine atoms on the molecule, AF isthe atomic weight of uorine and MWPFAS is the molecularweight of the PFAS. The total known extractable uorineconcentration (SCF_PFAS; ng F per g) is obtained by summing theuorine concentrations from all individual PFASs. The totalconcentration of unidentied, extractable organic uorine(CF_extr.unknown; ng F per g) can then be determined by sub-tracting SCF_PFAS from the total extractable organic uorineconcentration (CF_EOF; ng F per g) as measured directly by CIC,according to eqn (2).
CF_EOF ¼ SCF_PFAS + CF_extr.unknown (2)
The total uorine concentration (CF_TF; ng F per g) asmeasured directly by CIC equals the sum of CF_EOF and the totalnon-extractable uorine concentration (CF_non extr.; ng F per g),as shown in eqn (3).
CF_TF ¼ CF_EOF + CF_non extr. (3)
QA/QC
For individual PFASs measured by LC-MS/MS, triplicate spike/recovery experiments were performed by fortifying a PFAS-freecosmetic (FOUN07) at two fortication levels (1 and 48 ng).Precision was assessed by determining the relative standarddeviation of the replicates while accuracy was calculated bycomparing measured concentrations to theoretical values.Separate spike/recovery experiments were performed to validateEOF measurements by CIC. These involved fortifying bothblanks and cosmetic samples with (a) 7.6 mg PFOS (n ¼ 3), (b) 5mg of NaF (n ¼ 3) and (c) 7.6 mg of PFOS and 5 mg of NaF (n ¼ 3).In addition to assessing accuracy and precision of the methodfor EOF, these experiments served to evaluate whether inor-ganic uorine (NaF) was removed during the extraction proce-dure. The accuracy and precision of TF measurements wereassessed through triplicate combustions of a certied referencematerial (CRM) (BCR®-461, uorine in clay). In addition to theaforementioned method validation, three extraction blankswere processed along with every batch, and QC standard andblank injections were performed intermittently to assessinstrument dri and carryover, respectively (both LC-MS/MSand CIC). Intra-sample variability of TF and EOF was assessedby analyzing 20% of samples in triplicate (CIC). As a nal vali-dation of the method, 18 unfortied samples were re-analyzedfor 11 PFASs by IVL Swedish Environmental Institute (IVL)and compared to results generated by SU.
Results and discussionTargeted PFAS analysis
Method accuracy, as assessed through spike/recovery experi-ments, ranged from 71 to 126% for most PFASs (Table S4†). Theexceptions were for PFHpA, 9Cl-PF3ONS, 11Cl-PF3OUdS, 4:2FTSA, 8:2 monoPAP and 8:2/8:2 diPAP, which all had higher
This journal is © The Royal Society of Chemistry 2018
Paper Environmental Science: Processes & Impacts
Ope
n A
cces
s A
rtic
le. P
ublis
hed
on 0
1 N
ovem
ber
2018
. Dow
nloa
ded
on 3
/22/
2022
7:5
6:26
AM
. T
his
artic
le is
lice
nsed
und
er a
Cre
ativ
e C
omm
ons
Attr
ibut
ion-
Non
Com
mer
cial
3.0
Unp
orte
d L
icen
ce.
View Article Online
recoveries (up to 280%) and PFTrDA, FOSAA and 6:2/8:2 diPAPwhich displayed lower recoveries (as low as 29%), likely due tomatrix-induced ionization effects (since qualier ions displayedsimilar recoveries) which were not accounted for due to theabsence of exactly-matched isotopically labelled standards.Nevertheless, most substances displayed good precision(average RSD of 24%) at both fortication levels (Table S4†).Results of the inter-laboratory comparison on a subset of 18samples (unfortied) revealed good agreement between labs,with a coefficient of determination of 0.9605 for 11 targetedPFAS measurements (Fig. S1†).
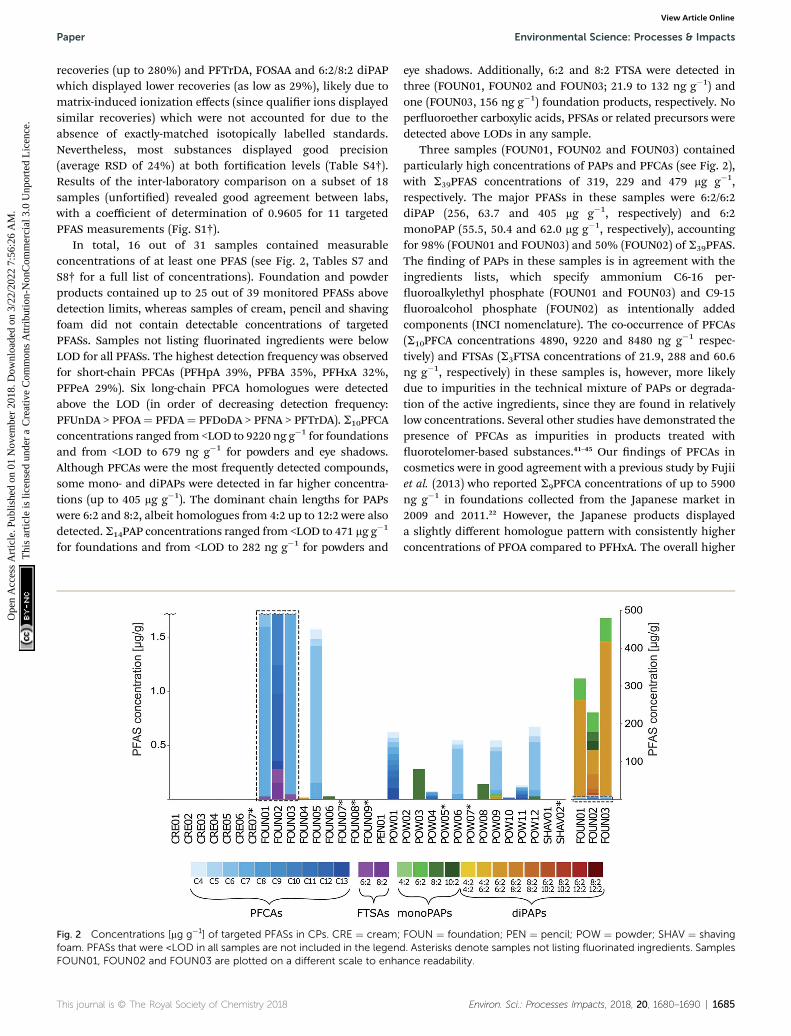
In total, 16 out of 31 samples contained measurableconcentrations of at least one PFAS (see Fig. 2, Tables S7 andS8† for a full list of concentrations). Foundation and powderproducts contained up to 25 out of 39 monitored PFASs abovedetection limits, whereas samples of cream, pencil and shavingfoam did not contain detectable concentrations of targetedPFASs. Samples not listing uorinated ingredients were belowLOD for all PFASs. The highest detection frequency was observedfor short-chain PFCAs (PFHpA 39%, PFBA 35%, PFHxA 32%,PFPeA 29%). Six long-chain PFCA homologues were detectedabove the LOD (in order of decreasing detection frequency:PFUnDA > PFOA¼ PFDA¼ PFDoDA > PFNA > PFTrDA). S10PFCAconcentrations ranged from <LOD to 9220 ng g�1 for foundationsand from <LOD to 679 ng g�1 for powders and eye shadows.Although PFCAs were the most frequently detected compounds,some mono- and diPAPs were detected in far higher concentra-tions (up to 405 mg g�1). The dominant chain lengths for PAPswere 6:2 and 8:2, albeit homologues from 4:2 up to 12:2 were alsodetected. S14PAP concentrations ranged from <LOD to 471 mg g�1
for foundations and from <LOD to 282 ng g�1 for powders and
Fig. 2 Concentrations [mg g�1] of targeted PFASs in CPs. CRE ¼ cream;foam. PFASs that were <LOD in all samples are not included in the legenFOUN01, FOUN02 and FOUN03 are plotted on a different scale to enha
This journal is © The Royal Society of Chemistry 2018
eye shadows. Additionally, 6:2 and 8:2 FTSA were detected inthree (FOUN01, FOUN02 and FOUN03; 21.9 to 132 ng g�1) andone (FOUN03, 156 ng g�1) foundation products, respectively. Noperuoroether carboxylic acids, PFSAs or related precursors weredetected above LODs in any sample.
Three samples (FOUN01, FOUN02 and FOUN03) containedparticularly high concentrations of PAPs and PFCAs (see Fig. 2),with S39PFAS concentrations of 319, 229 and 479 mg g�1,respectively. The major PFASs in these samples were 6:2/6:2diPAP (256, 63.7 and 405 mg g�1, respectively) and 6:2monoPAP (55.5, 50.4 and 62.0 mg g�1, respectively), accountingfor 98% (FOUN01 and FOUN03) and 50% (FOUN02) of S39PFAS.The nding of PAPs in these samples is in agreement with theingredients lists, which specify ammonium C6-16 per-uoroalkylethyl phosphate (FOUN01 and FOUN03) and C9-15uoroalcohol phosphate (FOUN02) as intentionally addedcomponents (INCI nomenclature). The co-occurrence of PFCAs(S10PFCA concentrations 4890, 9220 and 8480 ng g�1 respec-tively) and FTSAs (S3FTSA concentrations of 21.9, 288 and 60.6ng g�1, respectively) in these samples is, however, more likelydue to impurities in the technical mixture of PAPs or degrada-tion of the active ingredients, since they are found in relativelylow concentrations. Several other studies have demonstrated thepresence of PFCAs as impurities in products treated withuorotelomer-based substances.41–45 Our ndings of PFCAs incosmetics were in good agreement with a previous study by Fujiiet al. (2013) who reported S9PFCA concentrations of up to 5900ng g�1 in foundations collected from the Japanese market in2009 and 2011.22 However, the Japanese products displayeda slightly different homologue pattern with consistently higherconcentrations of PFOA compared to PFHxA. The overall higher
FOUN ¼ foundation; PEN ¼ pencil; POW ¼ powder; SHAV ¼ shavingd. Asterisks denote samples not listing fluorinated ingredients. Samplesnce readability.
Environ. Sci.: Processes Impacts, 2018, 20, 1680–1690 | 1685
Environmental Science: Processes & Impacts Paper
Ope
n A
cces
s A
rtic
le. P
ublis
hed
on 0
1 N
ovem
ber
2018
. Dow
nloa
ded
on 3
/22/
2022
7:5
6:26
AM
. T
his
artic
le is
lice
nsed
und
er a
Cre
ativ
e C
omm
ons
Attr
ibut
ion-
Non
Com
mer
cial
3.0
Unp
orte
d L
icen
ce.
View Article Online
concentrations and detection frequency of PFHxA in this studyprobably reect the industrial transition from C8 to C6uorotelomer-based PFASs occurring in the period betweenwhen the two studies were conducted. Thus, the homologuepattern of PFASs in cosmetics appear to follow the same trend astreated textiles and papers where recent studies typically reportthe highest concentrations and detection frequency for C6compounds.37,38,46
Fluorine mass balance and unidentied PFASs
CIC spike/recovery experiments involving samples fortied withdifferent combinations of PFOS and NaF (see method sectionfor details) revealed that inorganic uorine was effectivelyremoved during the extraction procedure (i.e. uorine was notdetected in samples fortied only with NaF). This was remark-able as previous studies had found it necessary to use a solidphase extraction step for efficient removal of inorganic uo-rine.25,31 Furthermore, PFOS fortied into foundation or blanksrevealed reasonable accuracy and precision, given that nointernal standard was used to account for losses during theextraction procedure (recovery of 69 � 14% RSD, n ¼ 3 repli-cates for spiked foundation and blanks, see Table S6†). Vali-dation of TF measurements via direct combustion of the CRM(BCR®-461, uorine in clay) revealed excellent agreementbetween measured (565 � 15 mg kg�1, n ¼ 3) and certiedconcentrations (568 � 60 mg kg�1). Finally, intra-sample vari-ability (assessed via triplicate measurements of 20% of samples)averaged 10% for TF and 3% for EOF measurements. The largerintra-sample variability for TF compared to EOF measurementsmay be attributed in part to the uncertainty of weighing smallamounts of neat product material and potential heterogeneityof the small aliquots.
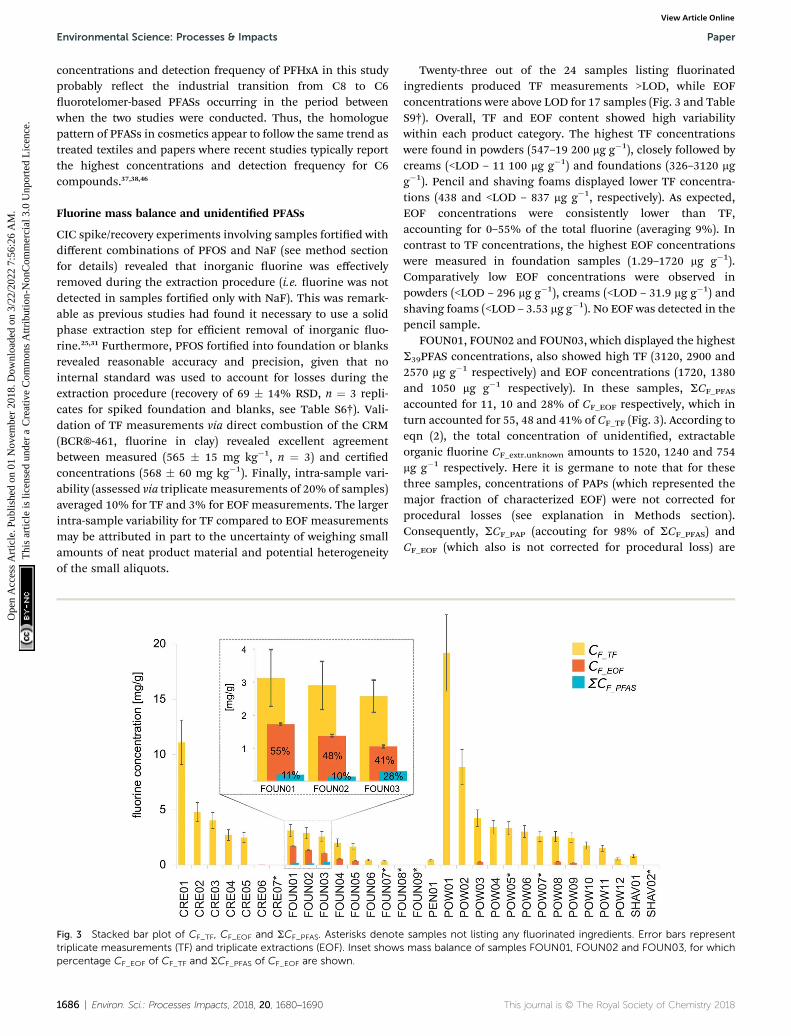
Fig. 3 Stacked bar plot of CF_TF, CF_EOF and SCF_PFAS. Asterisks denotetriplicate measurements (TF) and triplicate extractions (EOF). Inset showpercentage CF_EOF of CF_TF and SCF_PFAS of CF_EOF are shown.
1686 | Environ. Sci.: Processes Impacts, 2018, 20, 1680–1690
Twenty-three out of the 24 samples listing uorinatedingredients produced TF measurements >LOD, while EOFconcentrations were above LOD for 17 samples (Fig. 3 and TableS9†). Overall, TF and EOF content showed high variabilitywithin each product category. The highest TF concentrationswere found in powders (547–19 200 mg g�1), closely followed bycreams (<LOD – 11 100 mg g�1) and foundations (326–3120 mgg�1). Pencil and shaving foams displayed lower TF concentra-tions (438 and <LOD – 837 mg g�1, respectively). As expected,EOF concentrations were consistently lower than TF,accounting for 0–55% of the total uorine (averaging 9%). Incontrast to TF concentrations, the highest EOF concentrationswere measured in foundation samples (1.29–1720 mg g�1).Comparatively low EOF concentrations were observed inpowders (<LOD – 296 mg g�1), creams (<LOD – 31.9 mg g�1) andshaving foams (<LOD – 3.53 mg g�1). No EOF was detected in thepencil sample.
FOUN01, FOUN02 and FOUN03, which displayed the highestS39PFAS concentrations, also showed high TF (3120, 2900 and2570 mg g�1 respectively) and EOF concentrations (1720, 1380and 1050 mg g�1 respectively). In these samples, SCF_PFAS
accounted for 11, 10 and 28% of CF_EOF respectively, which inturn accounted for 55, 48 and 41% of CF_TF (Fig. 3). According toeqn (2), the total concentration of unidentied, extractableorganic uorine CF_extr.unknown amounts to 1520, 1240 and 754mg g�1 respectively. Here it is germane to note that for thesethree samples, concentrations of PAPs (which represented themajor fraction of characterized EOF) were not corrected forprocedural losses (see explanation in Methods section).Consequently, SCF_PAP (accouting for 98% of SCF_PFAS) andCF_EOF (which also is not corrected for procedural loss) are
samples not listing any fluorinated ingredients. Error bars represents mass balance of samples FOUN01, FOUN02 and FOUN03, for which
This journal is © The Royal Society of Chemistry 2018

Paper Environmental Science: Processes & Impacts
Ope
n A
cces
s A
rtic
le. P
ublis
hed
on 0
1 N
ovem
ber
2018
. Dow
nloa
ded
on 3
/22/
2022
7:5
6:26
AM
. T
his
artic
le is
lice
nsed
und
er a
Cre
ativ
e C
omm
ons
Attr
ibut
ion-
Non
Com
mer
cial
3.0
Unp
orte
d L
icen
ce.
View Article Online
directly comparable and indicate the presence of non-targetedPFASs or other uorinated compounds.
For the remaining samples, the fraction of CF_EOF accountedfor by SCF_PFAS was negligible (#1.3%), with remainingCF_extr.unknown of up to 552 mg g�1. As in these cases all PFASconcentrations were adjusted for extraction losses while EOFconcentrations are not, the gap between CF_EOF and SCF_PFAS
(CF_extr.unknown) should be considered conservative (i.e. under-estimated). However, as the listed uorinated ingredients inthese samples (peruorooctyl triethoxysilane, triuoropropyldimethiconol, peruoropropyl dimethicone, and polymerspolytetrauoroethylene (PTFE, also known as Teon, polytefumor polytef), polyperuoromethylisopropyl ether, triuoroacetyltripeptide-2 and polyperuoroethoxymethoxy diuoroethyl PEGphosphate) were not quantied due to lack of analyticalmethods and standards, the signicance of CF_extr.unknown inthese samples remains unclear. Notably, the four sampleslisting peruorooctyl triethoxysilane (FOUN05, POW06, POW09and POW12) all contained C4–C7 PFCAs, dominated by the C6homologue. These PFCAs are presumably impurities or degra-dation products of the 6:2 uorotelomer moiety of the per-uorooctyl triethoxysilane, given that they did not appear oningredients lists. Overall these data indicate that uorine-containing ingredients do not necessarily account for all ofthe measured EOF, and that other PFASs not included iningredient lists may be important.
All samples listing PTFE as ingredient had high TF concen-trations (n ¼ 9, 837–19 200 mg g�1), whereas EOF could only bedetected in 5 of the PTFE-containing samples in low concen-trations (<LOD – 12.3 mg g�1), suggesting that PTFE is notextracted with methanol. Samples containing other polymers,namely polyperuoroethoxymethoxy diuoroethyl PEG phos-phate (FOUN04, POW03 and POW08) and polyper-uoromethylisopropyl ether (CRE02 and CRE03), also showedhigh TF (2000–4240 mg g�1 and 4040–4790 mg g�1 respectively)and low EOF contents (289–552 mg g�1 and <LOD respectively).Whereas PTFE-containing samples contained low levels ofPFCAs (C4–C13), and polyperuoroethoxymethoxy diuoroethylPEG phosphate-containing products contained low levels ofPAPs (8:2 mono and 6:2/6:2 diPAP) as residues, no targetedPFASs were detected in polyperuoromethylisopropyl ethercontaining products. Interestingly, only one of the sevensupposedly uorine-free samples (CRE07) was below LOD forboth TF and EOF. Five of the CPs not listing any uorinatedingredients had detectable TF levels (<LOD – 3330 mg g�1), andthree samples had detectable EOF content (<LOD – 30.2 mg g�1).
One of the study limitations was that some of the listeduorinated ingredients (e.g. uorinated silanes, polymericsubstances) were not quantied due to the lack of MS-basedmethods and/or authentic standards. In those cases, the massbalance gap between S39PFASs and EOF may be explained bythe active ingredient. However, some of these CPs containedPFASs impurities which are not likely to originate from thelisted uorinated ingredient and might therefore indicate thepresence of other PFAS or PFAS precursors in these products.Samples in which the active ingredient was quantied (i.e.PAPs) still showed a large gap between S39PFASs and EOF,
This journal is © The Royal Society of Chemistry 2018
hinting at the presence of other uorinated substances thatwere not included in the targeted analysis. Similarly, TF andEOF concentrations were signicantly different in all sampleswith the EOF content only accounting 9% of TF on average. Thisdifference reects on one hand the extraction efficiency of lowmolecular substances (e.g. PAPs) and on the other hand thepresence of non-extractable substances such as polymers orinorganic uorine (e.g. uoride or uorphlogopite).
Implications for human exposure and environmentalemissions
This study demonstrates that PFCAs of various chain-lengthsare present in CPs as impurities or degradation products ofother PFASs which are added as active ingredients. Dermalexposure to PFCAs has, thus far, been considered negligiblerelative to contributions from dietary intake, drinking water andingestion of house dust according to current human exposureassessments.47,48 However, these exposure assessments have notconsidered the potential contribution of CPs towards dermaluptake due to the lack of measurement data. Furthermore, theassessments for other types of consumer products (e.g. PFAS-treated textiles and impregnation sprays) may have under-estimated the exposure by using the dermal absorption coeffi-cients for the ammonium salt of PFOA49 without considerationof how ionization status, co-solvents etc. may affect dermalpenetration. Thus, the results from this study on PFASs in CPsin combination with more recent dermal permeability studiesof PFOA underscore the need to revisit the potential contribu-tion of dermal exposure.50
Considering that foundations displayed the highest detectionfrequency and absolute concentrations of PFASs the followingcalculation illustrates the potential importance of dermal expo-sure to PFASs. According to the US EPA exposure factors hand-book the amount of foundation per application is 0.265 gram.Assuming a daily application of foundation, a body weight of 60kg and that 30% of the applied PFOA has penetrated the skinaer 10 hours (ref. 50) the estimated daily exposure to PFOA fromCPs analyzed in this study would be in the range <0.006–3.1 ngper kg per day. The higher-end values indicate that frequentapplication of specic CPs can lead to a dermal exposure to PFOAwhich exceeds daily intakes of PFOA via diet (0.04–0.7 ng per kgper day) for the Swedish population.51,52 It should also be notedthat these calculations do not consider indirect exposure to PFOAvia metabolism of PAPs, which were present in 100-fold higherconcentrations compared to PFCAs, or other potential precursorsthat contributed to the EOF fraction. Clearly, more research isneeded to establish dermal absorption coefficients for a widerrange of PFASs and application conditions and the potentialtransformation of PFASs by phase 1 and phase 2 enzymes andphotolytic processes in or on the skin.53–55
In addition to the potential for human exposure, there maybe environmental risks associated with PFASs in CPs whichenter waste streams following use. It is unclear how thesesubstances will behave during wastewater treatment. However,waste water treatment plants (WWTPs) have been identied asa signicant source of PFASs, either to air, receiving water, and
Environ. Sci.: Processes Impacts, 2018, 20, 1680–1690 | 1687

Environmental Science: Processes & Impacts Paper
Ope
n A
cces
s A
rtic
le. P
ublis
hed
on 0
1 N
ovem
ber
2018
. Dow
nloa
ded
on 3
/22/
2022
7:5
6:26
AM
. T
his
artic
le is
lice
nsed
und
er a
Cre
ativ
e C
omm
ons
Attr
ibut
ion-
Non
Com
mer
cial
3.0
Unp
orte
d L
icen
ce.
View Article Online
elds where sludge is applied as fertilizer.56,57 A recent uorinemass balance study of Swedish WWTPs reported that 42–82% ofextractable organic uorine in sludge and 5–21% in effluentwere unaccounted for. Notably, diPAPs, which are among theknown ingredients in some CPs, contributed a major propor-tion (63%) to the SPFAS concentrations in sludge samples.57
Conflicts of interest
The authors have no conicts of interest to declare.
Acknowledgements
We would like to thank Oskar Sandblom for assistance withsample analysis. This project was funded by the SwedishResearch Council Formas (Grant number 2013-00794) and theSwedish Society for Nature Conservation (SSNC).
References
1 E. Kissa, Fluorinated Surfactants and Repellents (2nd EditionRevised and Expanded), Marcel Dekker, 2001.
2 R. C. Buck, J. Franklin, U. Berger, J. M. Conder, I. T. Cousins,P. De Voogt, A. A. Jensen, K. Kannan, S. A. Mabury andS. P. J. van Leeuwen, Peruoroalkyl and PolyuoroalkylSubstances in the Environment: Terminology, Classication,and Origins, Integr. Environ. Assess. Manage., 2011, 7(4), 513–541.
3 J. P. Giesy and K. Kannan, Global Distribution ofPeruorooctane Sulfonate in Wildlife, Environ. Sci.Technol., 2001, 35(7), 1339–1342.
4 K. J. Hansen, L. a. Clemen, M. E. Ellefson and H. O. Johnson,Compound-Specic, Quantitative Characterization ofOrganic Fluorochemicals in Biological Matrices, Environ.Sci. Technol., 2001, 35(4), 766–770.
5 J. M. Conder, R. A. Hoke, W. De Wolf, M. H. Russell andR. C. Buck, Are PFCAs Bioaccumulative? A Critical Reviewand Comparison with Regulatory Criteria and PersistentLipophilic Compounds, Environ. Sci. Technol., 2008, 995–1003.
6 K. Steenland, T. Fletcher and D. A. Savitz, EpidemiologicEvidence on the Health Effects of Peruorooctanoic Acid(PFOA), Environ. Health Perspect., 2010, 118(8), 1100–1108.
7 V. Barry, A. Winquist and K. Steenland, PeruorooctanoicAcid (PFOA) Exposures and Incident Cancers among AdultsLiving near a Chemical Plant, Environ. Health Perspect.,2013, 121(11–12), 1313–1318.
8 A. Winquist and K. Steenland, Modeled PFOA Exposure andCoronary Artery Disease, Hypertension, and HighCholesterol in Community and Worker Cohorts, Environ.Health Perspect., 2014, 122(12), 1299–1305.
9 A. B. Lindstrom, M. J. Strynar and E. L. Libelo,Polyuorinated Compounds: Past, Present, and Future,Environ. Sci. Technol., 2011, 45(19), 7954–7961.
10 Z. Wang, I. T. Cousins, M. Scheringer and K. Hungerbuhler,Fluorinated Alternatives to Long-Chain PeruoroalkylCarboxylic Acids (PFCAs), Peruoroalkane Sulfonic Acids
1688 | Environ. Sci.: Processes Impacts, 2018, 20, 1680–1690
(PFSAs) and Their Potential Precursors, Environ. Int., 2013,60(2013), 242–248.
11 Z. Wang, I. T. Cousins, M. Scheringer and K. Hungerbuhler,Hazard Assessment of Fluorinated Alternatives to Long-Chain Peruoroalkyl Acids (PFAAs) and Their Precursors:Status Quo, Ongoing Challenges and Possible Solutions,Environ. Int., 2015, 75, 172–179.
12 Z. Wang, I. T. Cousins, M. Scheringer, R. C. Buck andK. Hungerbuhler, Global Emission Inventories forC4–C14 Peruoroalkyl Carboxylic Acid (PFCA)Homologues from 1951 to 2030, Part I: Production andEmissions from Quantiable Sources, Environ. Int.,2014, 70, 62–75.
13 Z. Wang, I. T. Cousins, M. Scheringer, R. C. Buck andK. Hungerbuhler, Global Emission Inventories for C4-C14Peruoroalkyl Carboxylic Acid (PFCA) Homologues from1951 to 2030, Part II: The Remaining Pieces of the Puzzle,Environ. Int., 2014, 69, 166–176.
14 Commission Regulation (EU), https://eur-lex.europa.eu/legal-content/EN/TXT/?qid¼1534354204793&uri¼CELEX:32010R0757,No. 757/2010, (accessed Aug 15, 2018).
15 Commission Regulation (EU)2017/1000, https://eur-lex.europa.eu/legal-content/EN/TXT/?qid¼1528983620555&uri¼CELEX:32017R1000, (accessed Jun 14, 2018).
16 OECD, Toward a New Comprehensive Global Database Pf Per-and Polyuoroalkyl Substances (PFASs): Summary Report onUpdating the OECD 2007 List of per-and PolyuoroalkylSubstances (PFASs), 2018.
17 KEMI Swedish Chemical Agency, Occurrence and Use ofHighly Fluorinated Substances and Alternatives, 2015.
18 CosIng - Cosmetics - GROWTH - European Commissionhttp://ec.europa.eu/growth/tools-databases/cosing/index.cfm?fuseaction¼search.simple, (accessed Aug 15, 2018).
19 Regulation (EC), No. 1223/2009 of the European Parliamentand of the Council of 30 November 2009 on cosmeticproducts, https://eur-lex.europa.eu/legal-content/EN/TXT/?uri¼celex:32009R1223, (accessed Jul 4, 2018).
20 FDA, Federal Food, Drug and Cosmetics Act, https://www.fda.gov/cosmetics/productsingredients/ingredients/default.htm, (accessed Sep 30, 2018).
21 C. Henricsson, Forekomst Av PFAS i Kosmetiska Produkter,Master Thesis, Lund University, 2017.
22 Y. Fujii, K. H. Harada and A. Koizumi, Occurrence ofPeruorinated Carboxylic Acids (PFCAs) in Personal CareProducts and Compounding Agents, Chemosphere, 2013,93(3), 538–544.
23 A. Jahnke, L. Ahrens, R. Ebinghaus, U. Berger, J. L. Barberand C. Temme, An Improved Method for the Analysisof Volatile Polyuorinated Alkyl Substances inEnvironmental Air Samples, Anal. Bioanal. Chem., 2007,387(3), 965–975.
24 K. Rankin and S. A. Mabury, Matrix Normalized MALDI-TOFQuantication of a Fluorotelomer-Based Acrylate Polymer,Environ. Sci. Technol., 2015, 49(10), 6093–6101.
25 Y. Miyake, N. Yamashita, M. K. So, P. Rostkowski,S. Taniyasu, P. K. S. Lam and K. Kannan, Trace Analysis ofTotal Fluorine in Human Blood Using Combustion Ion
This journal is © The Royal Society of Chemistry 2018

Paper Environmental Science: Processes & Impacts
Ope
n A
cces
s A
rtic
le. P
ublis
hed
on 0
1 N
ovem
ber
2018
. Dow
nloa
ded
on 3
/22/
2022
7:5
6:26
AM
. T
his
artic
le is
lice
nsed
und
er a
Cre
ativ
e C
omm
ons
Attr
ibut
ion-
Non
Com
mer
cial
3.0
Unp
orte
d L
icen
ce.
View Article Online
Chromatography for Fluorine: A Mass Balance Approach forthe Determination of Known and Unknown OrganouorineCompounds, J. Chromatogr. A, 2007, 1154(1–2), 214–221.
26 Y. Miyake, N. Yamashita, P. Rostkowski, M. K. So, S. Taniyasu,P. K. S. Lam and K. Kannan, Determination of Trace Levels ofTotal Fluorine in Water Using Combustion IonChromatography for Fluorine: A Mass Balance Approach toDetermine Individual Peruorinated Chemicals in Water,J. Chromatogr. A, 2007, 1143(1–2), 98–104.
27 S. Willach, H. J. Brauch and F. T. Lange, Contribution ofSelected Peruoroalkyl and Polyuoroalkyl Substances tothe Adsorbable Organically Bound Fluorine in GermanRivers and in a Highly Contaminated Groundwater,Chemosphere, 2016, 145, 342–350.
28 E. E. Ritter, M. E. Dickinson, J. P. Harron, D. M. Lunderberg,P. A. DeYoung, A. E. Robel, J. A. Field and G. F. Peaslee, PIGEas a Screening Tool for Per- and Polyuorinated Substancesin Papers and Textiles, Nucl. Instrum. Methods Phys. Res.,Sect. B, 2017, 407, 47–54.
29 L. W. Y. Yeung, Y. Miyake, S. Taniyasu, Y. Wang, H. Yu,M. K. So, G. Jiang, Y. Wu, J. Li, J. P. Giesy, et al.,Peruorinated Compounds and Total and ExtractableOrganic Fluorine in Human Blood Samples from China,Environ. Sci. Technol., 2008, 42(21), 8140–8145.
30 L. W. Y. Yeung, Y. Miyake, P. Li, S. Taniyasu, K. Kannan,K. S. Guruge, P. K. S. Lam and N. Yamashita, Comparisonof Total Fluorine, Extractable Organic Fluorine andPeruorinated Compounds in the Blood of Wild andPeuorooctanoate (PFOA)-Exposed Rats: Evidence for thePresence of Other Organouorine Compounds, Anal. Chim.Acta, 2009, 635(1), 108–114.
31 L. W. Y. Yeung, Y. Miyake, Y. Wang, S. Taniyasu,N. Yamashita and P. K. S. Lam, Total Fluorine, ExtractableOrganic Fluorine, Peruorooctane Sulfonate and OtherRelated Fluorochemicals in Liver of Indo-PacicHumpback Dolphins (Sousa Chinensis) and FinlessPorpoises (Neophocaena Phocaenoides) from South China,Environ. Pollut., 2009, 157(1), 17–23.
32 E. I. H. Loi, L. W. Y. Yeung, S. Taniyasu, P. K. S. Lam,K. Kannan and N. Yamashita, Trophic Magnication ofPoly- and Peruorinated Compounds in a Subtropical FoodWeb, Environ. Sci. Technol., 2011, 45(13), 5506–5513.
33 L. W. Y. Yeung and S. A. Mabury, Bioconcentration ofAqueous Film-Forming Foam (AFFF) in Juvenile RainbowTrout (Oncorhyncus Mykiss), Environ. Sci. Technol., 2013,47(21), 12505–12513.
34 A. Wagner, B. Raue, H. J. Brauch, E. Worch and F. T. Lange,Determination of Adsorbable Organic Fluorine fromAqueous Environmental Samples by Adsorption toPolystyrene-Divinylbenzene Based Activated Carbon andCombustion Ion Chromatography, J. Chromatogr. A, 2013,1295, 82–89.
35 L. W. Y. Yeung, S. J. Robinson, J. Koschorreck andS. A. Mabury, Part I. A Temporal Study of PFCAs and TheirPrecursors in Human Plasma from Two German Cities1982-2009, Environ. Sci. Technol., 2013, 47(8), 3865–3874.
This journal is © The Royal Society of Chemistry 2018
36 L. W. Y. Yeung, S. J. Robinson, J. Koschorreck andS. A. Mabury, Part I. A Temporal Study of PFCAs and TheirPrecursors in Human Plasma from Two German Cities1982-2009, Environ. Sci. Technol., 2013, 47(8), 3865–3874.
37 A. E. Robel, K. Marshall, M. Dickinson, D. Lunderberg,C. Butt, G. Peaslee, H. M. Stapleton and J. A. Field, Closingthe Mass Balance on Fluorine on Papers and Textiles,Environ. Sci. Technol., 2017, 51(16), 9022–9032.
38 L. A. Schaider, S. A. Balan, A. Blum, D. Q. Andrews,M. J. Strynar, M. E. Dickinson, D. M. Lunderberg,J. R. Lang and G. F. Peaslee, Fluorinated Compounds inU.S. Fast Food Packaging, Environ. Sci. Technol. Lett., 2017,4(3), 105–111.
39 C. R. Powley, S. W. George, T. W. Ryan and R. C. Buck, MatrixEffect-Free Analytical Methods for Determination ofPeruorinated Carboxylic Acids in Environmental Matrixes,Anal. Chem., 2005, 77(19), 6353–6358.
40 W. A. Gebbink, A. Glynn and U. Berger, Temporal Changes(1997-2012) of Peruoroalkyl Acids and Selected Precursors(Including Isomers) in Swedish Human Serum, Environ.Pollut., 2015, 199, 166–173.
41 S. T. Washburn, T. S. Bingman, S. K. Braithwaite, R. C. Buck,L. W. Buxton, H. J. Clewell, L. A. Haroun, J. E. Kester,R. W. Rickard and A. M. Shipp, Exposure Assessment andRisk Characterization for Peruorooctanoate in SelectedConsumer Articles, Environ. Sci. Technol., 2005, 39(11),3904–3910.
42 M. J. A. Dinglasan-Panlilio and S. A. Mabury, SignicantResidual Fluorinated Alcohols Present in Various FluorinatedMaterials, Environ. Sci. Technol., 2006, 40(5), 1447–1453.
43 B. S. Larsen, P. Stchur, B. Szostek, S. F. Bachmura,R. C. Rowand, K. B. Prickett, S. H. Korzeniowski andR. C. Buck, Method Development for the Determination ofResidual Fluorotelomer Raw Materials andPerurooctanoate in Fluorotelomer-Based Products by GasChromatography and Liquid Chromatography MassSpectrometry, J. Chromatogr. A, 2006, 1110(1–2), 117–124.
44 K. Prevedouros, I. T. Cousins, R. C. Buck andS. H. Korzeniowski, Sources, Fate and Transport ofPeruorocarboxylates, Environ. Sci. Technol., 2006, 40(1),32–44.
45 S. Fiedler, G. Pster and K.-W. Schramm, Poly- andPeruorinated Compounds in Household ConsumerProducts, Toxicol. Environ. Chem., 2010, 92(10), 1801–1811.
46 R. Vestergren, D. Herzke, T. Wang and I. T. Cousins, AreImported Consumer Products an Important Diffuse Sourceof PFASs to the Norwegian Environment?, Environ. Pollut.,2015, 198, 223–230.
47 D. Trudel, L. Horowitz, M. Wormuth, M. Scheringer,I. T. Cousins and K. Hungerbuhler, Estimating ConsumerExposure to PFOS and PFOA, Risk Anal., 2008, 28(2), 251–269.
48 R. Vestergren, I. T. Cousins, D. Trudel, M. Wormuth andM. Scheringer, Estimating the Contribution of PrecursorCompounds in Consumer Exposure to PFOS and PFOA,Chemosphere, 2008, 73(10), 1617–1624.
49 W. J. Fasano, G. L. Kennedy, B. Szostek, D. G. Farrar,R. J. Ward, L. Haroun and P. M. Hinderliter, Penetration of
Environ. Sci.: Processes Impacts, 2018, 20, 1680–1690 | 1689
Environmental Science: Processes & Impacts Paper
Ope
n A
cces
s A
rtic
le. P
ublis
hed
on 0
1 N
ovem
ber
2018
. Dow
nloa
ded
on 3
/22/
2022
7:5
6:26
AM
. T
his
artic
le is
lice
nsed
und
er a
Cre
ativ
e C
omm
ons
Attr
ibut
ion-
Non
Com
mer
cial
3.0
Unp
orte
d L
icen
ce.
View Article Online
Ammonium Peruorooctanoate through Rat and HumanSkin in Vitro, Drug Chem. Toxicol., 2005, 28(1), 79–90.
50 J. Franko, B. J. Meade, H. F. Frasch, M. Barbero andS. E. Anderson, Dermal Penetration Potential ofPeruorooctanoic Acid (PFOA) in Human and MouseSkin, J. Toxicol. Environ. Health, Part A, 2012, 75(1), 50–62.
51 R. Vestergren, U. Berger, A. Glynn and I. T. Cousins, DietaryExposure to Peruoroalkyl Acids for the Swedish Populationin 1999, 2005 and 2010, Environ. Int., 2012, 49, 120–127.
52 W. A. Gebbink, A. Glynn, P. O. Darnerud and U. Berger,Peruoroalkyl Acids and Their Precursors in Swedish Food:The Relative Importance of Direct and Indirect DietaryExposure, Environ. Pollut., 2015, 198, 108–115.
53 A. Pannatier, P. Jenner, B. Testa and J. C. Etter, The Skin asa Drug-Metabolizing Organ, Drug Metab. Rev., 1978, 8(2),319–343.
1690 | Environ. Sci.: Processes Impacts, 2018, 20, 1680–1690
54 F. Oesch, E. Fabian, K. Guth and R. Landsiedel, Xenobiotic-Metabolizing Enzymes in the Skin of Rat, Mouse, Pig,Guinea Pig, Man, and in Human Skin Models, Arch.Toxicol., 2014, 88(12), 2135–2190.
55 R. M. Sayre, J. C. Dowdy, A. J. Gerwig, W. J. Shields andR. V. Lloyd, Unexpected Photolysis of the SunscreenOctinoxate in the Presence of the Sunscreen Avobenzone,Photochem. Photobiol., 2005, 81(2), 452–456.
56 L. Ahrens, M. Shoeib, T. Harner, S. C. Lee, R. Guo andE. J. Reiner, Wastewater Treatment Plant and Landlls asSources of Polyuoroalkyl Compounds to the Atmosphere,Environ. Sci. Technol., 2011, 45(19), 8098–8105.
57 L. W. Y. Yeung, U. Eriksson and A. Karrman PilotstudieAvseende Oidentierade Poly-Och Peruorerade Alkylamnen iSlam Och Avloppsvatten Fran Reningsverk i Sverige,Naturvardsverket, 2016.
This journal is © The Royal Society of Chemistry 2018