PepsiCo: Frito-Lay North America€¦ · PepsiCo: Frito-Lay North America Presentation to Consumer...
15
PepsiCo: Frito-Lay North America Presentation to Consumer Analyst Group of New York February 21, 2018 PepsiCo: Frito-Lay North America Presentation to Consumer Analyst Group of New York February 21, 2018 1
Transcript of PepsiCo: Frito-Lay North America€¦ · PepsiCo: Frito-Lay North America Presentation to Consumer...

PepsiCo: Frito-Lay North AmericaPresentation to Consumer Analyst Group of New YorkFebruary 21, 2018
PepsiCo: Frito-Lay North AmericaPresentation to Consumer Analyst Group of New YorkFebruary 21, 2018
1

Safe Harbor Statement & Non-GAAP Information
2
This presentation should be viewed in conjunction with PepsiCo’s webcast presentation at the Consumer Analyst Group of New York Conferenceon February 21, 2018.
Safe Harbor StatementStatements in this presentation that are “forward-looking statements,” are based on currently available information, operating plans and projections about futureevents and trends. Terminology such as “aim,” “anticipate,” “believe,” “drive,” “estimate,” “expect,” “expressed confidence,” “forecast,” “future,” “goal,” “guidance,”“intend,” “may,” “objective,” “outlook,” “plan,” “position,” “potential,” “project,” “seek,” “should,” “strategy,” “target,” “will” or similar statements or variations of suchterms are intended to identify forward-looking statements, although not all forward looking statements contain such terms. Forward-looking statements inherentlyinvolve risks and uncertainties that could cause actual results to differ materially from those predicted in such forward looking statements. Such risks anduncertainties include, but are not limited to: changes in demand for PepsiCo’s products, as a result of changes in consumer preferences or otherwise; changes, orfailure to comply with, applicable laws and regulations; imposition or proposed imposition of new or increased taxes aimed at PepsiCo’s products; imposition oflabeling or warning requirements on PepsiCo’s products; changes in laws related to packaging and disposal of PepsiCo’s products; PepsiCo’s ability to competeeffectively; political conditions, civil unrest or other developments and risks in the markets where PepsiCo’s products are made, manufactured, distributed or sold;PepsiCo’s ability to grow its business in developing and emerging markets; uncertain or unfavorable economic conditions in the countries in which PepsiCooperates; the ability to protect information systems against, or effectively respond to, a cybersecurity incident or other disruption; increased costs, disruption ofsupply or shortages of raw materials and other supplies; business disruptions; product contamination or tampering or issues or concerns with respect to productquality, safety and integrity; damage to PepsiCo’s reputation or brand image; failure to successfully complete or integrate acquisitions and joint ventures intoPepsiCo’s existing operations or to complete or manage divestitures or refranchisings; changes in estimates and underlying assumptions regarding futureperformance that could result in an impairment charge; increase in income tax rates, changes in income tax laws or disagreements with tax authorities; failure torealize anticipated benefits from PepsiCo’s productivity initiatives or global operating model; PepsiCo’s ability to recruit, hire or retain key employees or a highlyskilled and diverse workforce; loss of any key customer or disruption to the retail landscape, including rapid growth in hard discounters and the e-commercechannel; any downgrade or potential downgrade of PepsiCo’s credit ratings; PepsiCo’s ability to implement shared services or utilize information technologysystems and networks effectively; fluctuations or other changes in exchange rates; climate change or water scarcity, or legal, regulatory or market measures toaddress climate change or water scarcity; failure to successfully negotiate collective bargaining agreements, or strikes or work stoppages; infringement ofintellectual property rights; potential liabilities and costs from litigation, claims, legal or regulatory proceedings, inquiries or investigations; and other factors that mayadversely affect the price of PepsiCo’s publicly traded securities and financial performance.
For additional information on these and other factors that could cause PepsiCo’s actual results to materially differ from those set forth herein, please see PepsiCo’sfilings with the Securities and Exchange Commission, including its most recent annual report on Form 10-K and subsequent reports on Forms 10-Q and 8-K.Investors are cautioned not to place undue reliance on any such forward-looking statements, which speak only as of the date they are made. PepsiCo undertakesno obligation to update any forward-looking statements, whether as a result of new information, future events or otherwise.
Non-GAAP InformationPlease refer to the “Investors” section of PepsiCo’s web site at www.pepsico.com under the heading “Events and Presentations” to find disclosure and areconciliation of any non-GAAP financial measures.

Net Revenues Division Operating Profit
PepsiCo 2017 financial highlights
25%
All Other Sectors
Frito-Lay North America
Source: PepsiCo 2017 Financials
Frito-Lay North America
All Other Sectors
42%
3

FLNA has delivered industry-leading growth
4
3% 6%Average 3-year
net revenue growth
Average 3-year operating profit
growth
#1Contributor to
3- year total F&Bdollar growth
Source: IRI, MULOC L52W ending 2015-2017 for F&B growth

Kantar Rankings (1)
We are retail customers’ most preferred supplier
Source: Kantar Retail, 2017(1) Identifies the retailers and manufacturers currently setting the highest standards of performance, as viewed by their trading partners
Named top manufacturer for secondyear in a row
Earned top marks in every category
#1
- Clearest Company Strategy- Most Important Brands- Best Combination of Growth & Profitability- Best Sales Force / Customer Teams- Most Innovative Marketing Approach- Best Consumer Shopper Insights- Best Supply Chain Management- Best Shopper Marketing Programs- Best Use of Digital Platforms
5

Our momentum is strong
6
Strong performance… …fueled by innovation and portfolio breadth
Source: IRI, MULOC 2015-2017 growth rates and share data.
+48 bps3-year Salty snack share gain

Agenda focused on four levers
7
Brand Building Innovation
Productivity Execution
11 22
44 33

A&M behind global brandsIconic campaignsStrong brands
Priority #1: Brand Building
8
Top 7brands in Salty Snacks
~90% of retail sales from brands with #1 or #2 sub-category
share position
Source: IRI, MULOC 2017

Priority #2: Innovation in the Core
9
2017 2018
Source: Company Data
Priority #2: Innovation in BFY
10
Growth in BFY Categories Portfolio Transformation
#1RTE Popcorn
Increasing Positive NutritionRate of sales growth of Everyday Nutrition will outpace sales growth of remaining portfolio
Reducing SodiumAt least 75% of our global foods portfolio volume will not exceed 1.3 mg per calorie
Reducing Saturated FatAt least 75% of our global foods portfolio volume will not exceed 1.1 g per 100 calories
2025 PepsiCo Goals

Priority #3: Execution – Precision DSD
11
Scale and Reach Differentiated Capabilities
~500,000service calls/week
~300,000retail stores served weekly
Source: Company Data
• Computer Aided Ordering• Merchandising with precision• Advanced technology• Labor efficiency

12Source: Company Data
Brand Building
Investments in Capabilities, Talent, and Culture Brand
Building
Brand BuildingNew Occasions
Brand BuildingPortfoliobreadth
Marketing Supply Chain
Data Analytics Team/ValuesDelivering Growth
Priority #3: Execution – eCommerce
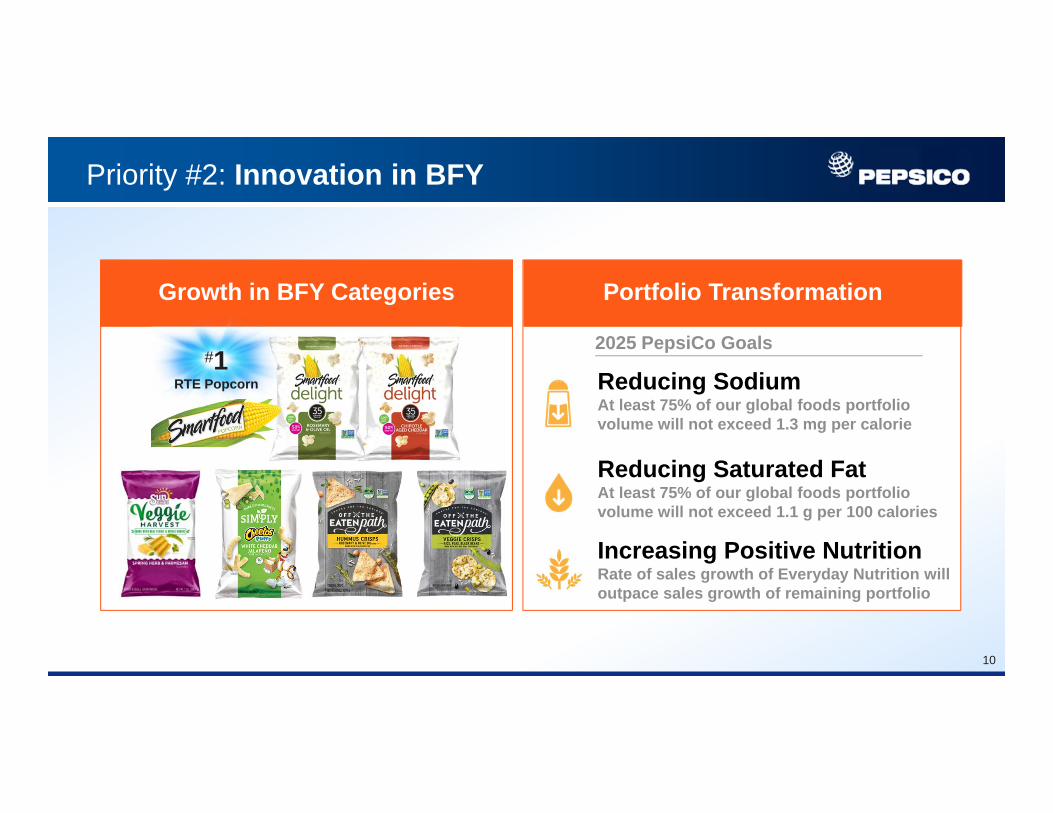
Priority #4: Productivity
13Source: Company Data
Streamlining via office automation, machine learning
Digital Capabilities
Unlocking zero-touch
supply chain
Automation
Enabling greater efficiency and
portfolio breadth
GES
Generating additional
cost savings
Sustainability

Our Business Agenda is Delivering
14
Brand Building Innovation
Productivity Execution
11 22
44 33