People's Perception Study Curves 5 Dec...understand people’s perception on renewable energy and...
62
People’s Perception Study Renewable Energy in India 2014 REPORT IND 2015
Transcript of People's Perception Study Curves 5 Dec...understand people’s perception on renewable energy and...
People’s Perception Study
Renewable Energy in India 2014
REPORTIND
2015
© WWF-India 2015
Published by WWF-India
Reproduction is authorised, provided the source is acknowledged, save where otherwise
stated.
Acknowledgments
WWF-India is extremely grateful to all the respondents who have provided useful inputs
during the course of the survey. WWF-India expresses its gratitude and acknowledges
the effort put in by several team members and individuals in the production of this
report. The efforts put in by the communications team are also appreciated. Special
thanks are due to Mr Rafael Senga from WWF International for his valuable feedback.
The support by WWF- Sweden is thankfully acknowledged.
Project Team
WWF-India: Jincy Joy, Divya Joy, T.S. Panwar
Disclaimer
This report has been prepared by WWF-India with inputs and literature based on
publicly available information and responses received during the survey from different
organizations/ individuals. WWF-India disclaims any and all liability for the use that
may be made of the information contained in this report. Further, the views in the
document do not necessarily refl ect those of WWF-Sweden.


ii

iii
Table of Contents
1. INTRODUCTION
1.1 Introduction 3
1.2 Background to the Perception Study 6
1.3 Themes of the Study 7
2. INDIVIDUAL’S PERCEPTION OF RENEWABLES IN INDIA
2.1 Individual’s Awareness Level 10
2.1.1 Awareness about the potential of renewables to replace fossil fuel use 10
2.1.2. Awareness on the current status of renewable energy technologies in India 11
2.1.3 Perception on whether renewable energy prices will reduce to a considerable level 12
2.1.4 Awareness among people on the linkage between biodiversity and renewable energy technologies 13
2.2. Policies, Incentives and Subsidies 15
2.2.1 Awareness on plans and policies of the government implemented on renewable energy 15
2.2.2 Awareness on subsidies on renewable energy 16
2.3. Willingness to Invest in and Adopt Renewable Energy Technologies 17
2.3.1 Willingness to adopt renewable energy technologies 17
2.3.2 Willingness to take the lead in renewable energy adoption 18
2.3.3 Barriers towards adoption of renewable energy technologies 19
2.3.4 Willingness to invest in renewable energy technologies 20
2.4. Access to Information 21
2.4.1 Access to information on renewable energy initiatives and programmes 21
2.4.2 Access to information on renewable energy outlets and vendors 23

2.5. Public Choice, Acceptability and Reliability 24
2.5.1 Public choice of renewables 24
2.5.2 Public acceptability of renewables 26
2.5.3 Public reliability on renewables 27
2.5.4 Post-Purchase problems 28
3. MANUFACTURER’S PERCEPTION OF RENEWABLES IN INDIA
3.1. Challenges Faced by Manufacturers 32
3.2. Consumer Awareness of Renewable Energy Subsidies 33
3.3. Consumer’s Choice of Renewable Energy Technology 35
3.4 Negative Perceptions among Consumers about Renewable Energy Products and Applications 36
3.5 Determining Post-Sale Services 38
3.6 Access to Means of Communication 39
4. KEY FINDINGS AND CONCLUSIONS
4.1 Key Findings 42
4.2 Conclusions 43
5. KEY ASKS FROM THE STAKEHOLDERS
Individuals 48
Media 48
Civil Society 49
Technology Providers 49
Government 50
1
C h a p t e r 1

2
All the world’s energy needs could be provided
cleanly, sustainably and economically by
the year 2050. Renewable energy is the way
ahead.
Such a transition is not only possible but
also cost-effective, providing energy that is
affordable for all and producing it in ways
that can be sustained by the global economy
and the planet." (The Energy Report: 100%
Renewable Energy by 2050)1

3
1.1 Introduction
Currently, climate change is recognized as a serious global
environmental concern. ‘Climate Change’ as defi ned by the United
Nations Framework Convention on Climate Change (UNFCCC), refers to
a “change of climate which is attributed directly or indirectly to human
activity that alters the composition of the global atmosphere and which
is in addition to natural climate variability observed over comparable
time periods”.2 Human induced (anthropogenic) changes, occur
due to greenhouse gases (GHGs), emitted by various activities like
deforestation, energy usage, changes in land use and vehicular usage.
Globally, there has been a marked increase in emission of carbon
dioxide, methane and nitrous oxide since 1750 mainly due to
anthropogenic activities. Emission of such harmful gases far exceeds
the pre-industrial values, determined mainly from the ice cores
spanning many thousands of years. The atmospheric concentration
of carbon dioxide has increased globally from the pre-industrial value
of about 280 ppm to 395.4 ppm in 2014.3 This global increase
in carbon dioxide is attributed primarily to use of fossil fuel and
changes in land use.
Concerns about climatic change have been growing over the years.
These have led countries around the world to adopt ‘low carbon
pathways’, which reduce carbon emissions and thus contribute to
reduce climate change. In recent years, India’s emerging economic
growth and rising energy consumption have led to increase in GHG
emissions, which also makes India the fourth largest emitter of GHGs
after China, USA and EU. However, India’s emission intensity
has been declining with 66.8 g of CO2e per rupee of GDP in 1994 to
56.2 g of CO2e per rupee of GDP in 2007. Further, in 2009, India
announced reduction of emission intensity of its GDP by 20–25 per
cent over the 2005 levels by 2020. Several other initiatives with
respect to meeting this objective have also been undertaken in order
to tackle climate change and reduce energy consumption without
compromising the country’s development agenda.
Studies have shown that India’s energy sector has had a major share
in the country’s GHG emission profi le. Emissions from the energy
sector were 1,625.79 million tonnes of carbon dioxide equivalent
(MTCDE) in 2010.4 Emissions from the energy sector are attributed
to two broad categories: fossil fuel combustion, and biomass and
fugitive emissions.5 Fossil fuel combustion emissions contribute to
more than 90 per cent of the total emissions from the energy sector
in India.
Renewable energy (RE) has been an important component of India’s
energy planning process for more than four decades. The importance
of renewable energy sources in the transition to a sustainable energy
base was recognized way back in the early 1970s. It started with the
establishment of the Department of Non-Conventional Energy Sources
in 1982, which later became the Ministry of Non-Conventional Energy
Sources (MNES) in 1992, and subsequently renamed as the Ministry
of New and Renewable Energy (MNRE) in 2006.

4
Over the years, there has been implementation of broad spectrum
programmes harnessing renewable power and energy. In the rural
areas, the focus was on use of renewable sources for lighting, cooking
and motive power, while in urban areas, the emphasis was on industrial
and commercial applications and development of alternate fuels and
applications. Along with initiatives like The National Action Plan on
Climate Change (NAPCC) (2008), the Twelfth Five Year Plan, the
National Policy on Biofuels and Renewable Purchase Obligation (RPO),
the government has formulated various schemes and programmes, to
promote use of renewable energy sources in the country.
India is currently ranked fi fth in the world with 15,691.4 MW grid-
connected and 367.9 MW off-grid renewable energy based power
capacity. India is one of the most developed renewable energy
markets in South Asia, with annual revenues of about USD 185
billion. According to the latest Ernst & Young report, India is among
the top seven countries in the world in terms of the renewable energy
attractiveness index.6 Several estimates have shown that India has a
high potential of generating renewable energy from various sources like
solar, biomass, wind, small hydro and bagasse based cogeneration, etc.
As on 31 May 2014, the total grid interactive power capacity sourced
by renewables was 31,833 MW (see Table 1.1). This includes wind with
a capacity of 21,262 MW, solar (2,647 MW), small hydropower (SHP)
(3,803 MW), biomass power & gasifi cation potential (1,365 MW),
bagasse cogeneration (2,648 MW) and waste to power (106 MW).7
An effective and planned utilization of the available RE potential can
thus pave the way for a sustainable growth of renewable energy in the
country. India has the vision, potential and policies to scale up the
use of renewable energy sources. India is fast embracing renewable
energy and has made substantial progress in increasing the share of
RE in the country. Most importantly, there is an increase in public
awareness about clean energy and an eagerness to adopt a green
lifestyle. With vox pop playing a crucial role in almost every facet of
the society, it has become very important to reach out to more and
more people for adopting renewable energy sources, to discuss its
larger benefi ts, and explain to them the difference that renewables
can make in reducing environmental hazards in the world.

5
TABLE 1.1:Renewable Energy Capacity in the Country as on 31 May 20148
SectorTarget Achievements during the Year (up to March 2013) Cumulative Achievements
2013-14 2014-15 2013–14 (% of Target) 2014–15 (% of Target) (as on 31 May 2013) (as on 31 May 2014)
I. Grid-Interactive Power (Capacities in MW)
Wind Power 2,500.00 2,000.00 264.10 (10.56) 130.15 (6.51) 19,317.05 21,262.23
Small Hydropower 300.00 250.00 39.00 (13.0) - (-) 3,671.25 3,803.65
Biomass Power & Gasifi cation 105.00 100.00 - (-) - (-) 1,264.80 1,365.20
Bagasse Cogeneration 300.00 300.00 - (-) - (-) 2,337.43 2,648.35
Waste to Power 20.00 20.00 - (-) - (-) 96.08 106.58
Solar Power 1,100.00 1,100.00 73.00 (-) - (-) 1,759.44 2,647.00
TOTAL 4,325.00 3,770.00 376.10 (8.7) 130.15 (3.45) 28,446.05 31,833.01
II. Off-Grid/ Captive Power (Capacities in MWeq
)
Waste to Energy 10.00 10.00 - (-) - (-) 115.57 132.73
Biomass (non-bagasse)
Cogeneration
80.00 80.00 2.8 (3.5) - (-) 473.95 531.82
Biomass Gasifi ers
- Rural
- Industrial
1.00 0.80 - (-) - (-) 16.79 17.48
9.00 8.00 0.5 (5.6) - (-) 142.08 147.20
Aero-Genrators/Hybrid
systems
1.00 0.05 - (-) - (-) 2.11 2.25
SPV Systems 40.00 60.00 - (-) - (-) 124.67 174.35
Water mills/micro hydel 2.00
(500 nos)
4.00
(500 nos)
- (-) - (-) 10.65
(2,131 nos)
13.21
(2,643 nos)
Bio-gas based energy system 2.00 - - (-) - (-) - 3.77
TOTAL 143.00 158.85.00 3.30 (9.06) - (-) 885.82 1,022.81

6
1.2 Background to the Perception Study
The advent of renewables is very timely as more and more individuals
are becoming curious and engaging in the increasing role of renewables
in the country. What general masses know, think and talk about
renewables is viewed as absolutely essential in determining the level of
acceptability of renewable energy among Indian citizens.
Accordingly, WWF-India conducted a Renewable Energy Survey to
understand people’s perception on renewable energy and determine
the level of acceptability among Indian citizens of the use of renewable
energy sources. The survey deployed an online platform, targeting
the general internet users. The respondents were targeted through
bulk e-mailing and social media platforms. The duration of the survey
was one month. The questionnaire consisted of a total of 28 simple
questions, which were a combination of both open-ended and close-
ended questions.
The total sample size of the survey is 901, with more than 50 per cent
of the respondents falling in the age bracket of 22 to 32. There were
also a substantial number of respondents in the age group of 32 to
42 years, followed by individuals under 21, and in the age group of
43 to 52 years. Most of the responses received were from the metros
and other big cities of the country, with Delhi, Bangalore and Mumbai
leading the bandwagon.
Along with individual’s perception, it was felt essential to tap
into the minds of RE manufacturers and understand the market
dynamics. In order to complete the circle, a similar survey was
designed for renewable energy manufacturers/suppliers/implementers.
The total sample size is 48 in this case. While majority of them
were manufacturers (28), the respondents also comprised project
implementers, retailers/distributers and technology implementing
NGOs. Most of the surveyed respondents promoted solar technologies
(36) followed by biomass-based technologies, biogas technologies and
wind energy technology. Some of the other products that they dealt with
included biomass cookstoves and biogas upgradation.
The questionnaire consisted of a total of 14 simple questions,
which were a combination of both open-ended and close-ended
questions. The survey for manufacturers also deployed an online
platform, targeting some of the key players in the RE market. These
manufacturers were targeted through emails and telephonic interaction.
The most common target customers of RE products were found to be
industries and institutes (educational, offi ce complexes, hospitals),
followed by government organizations and individual household users.
The remaining section of target customers included residential society
users/community and commercial user (shops, malls, market places).
These surveys dealt with various aspects such as policies and incentives
available, awareness levels, knowledge platforms, existing technologies
and products, cost/fi nance options, innovations on business models &
technology, and the likely solutions. The surveys also attempt to assess
some of the crucial components associated with renewable energy such
as its acceptance, reliability, access to relevant information, existing
knowledge gaps and other barriers related to fi nance and technology.

7
1.3 Themes of the Study
The broad themes that the study aims to explore are depicted in the chart below:
Individual’s Survey Manufacturer’s Survey
Level of awareness
Public choice, acceptability & reliability
Willingness to invest & adopt Access to means
of communication
Challenges faced by
manufacturer
Consumer’s awareness on RE subsidies
Consumer’s choice of RE technology
Negative perceptions among
consumers
Post-sale services
Policies, incentives &
subsidies
Access to information

8

9
C h a p t e r 2

10
AgreeAgree 92.34%92.34%
Don’t knowDon’t know 2.66%2.66%
DisagreeDisagree 4.99%4.99%
2.1 Individual’s Awareness Level
Research has shown that interest and support for renewables can be
increased by informed dialogue and information sharing; also some
assessments focusing on this idea have helped rank renewables (so as
to estimate wide penetration/popularity of a specifi c technology).9 Some
studies have also shown that if people ‘agree’ on a specifi c technology,
it means they have ‘knowledge of how the potential for renewable
energy can be utilized’ which is crucial for its application.10 Therefore, it
is very important to determine the level of awareness on RE among the
general public.
The survey questions to assess the awareness among Indian citizens
about the potential of RE to replace use of fossil fuel show very
positive response, with 92.34 per cent (832 respondents) agreeing
to the proposition that RE will replace use of conventional fuel in
the near future. This leads to the conclusion that ‘Indian citizens
have a positive outlook about the role that RE can play in the near
future and its potential to gradually replace dependence on fossil
fuel usage. Very few respondents disagreed (4.99 per cent or 45
respondents) to the proposition. This could be a result of sheer
unawareness related to RE potential as well as scepticism about
renewable energy. The ‘don’t know’ option was used by 2.66 per
cent or 24 respondents. They may be unaware or less aware of
RE technologies usage due to lack of information sharing and
dissemination.
Further analysis of the respondents (92.34 per cent) in the ‘agree’
category was done to estimate the perception about the ‘time-frame’
2.1.1 Awareness about the potential of renewables to replace use of fossil fuel
Do you agree that the energy generated from renewable technologies can replace the use of conventional fuels (like oil/coal/gas etc.)
Almost 92 per cent Indians feel that renewables can
replace use of fossil fuel in the near future. Of this, 63
per cent think that such a transition can occur in the
medium term, i.e., 5–20 years.

11
required for such a transformation. For this, the respondents were
provided with three options: short-term (3–5 years), medium-term
(5–20 years) and long-term (more than 20 years). Medium-term
received the maximum support of 62.95 per cent (537 respondents),
which looks like a very realistic assumption on the part of the
respondents, as policies and programmes on renewables will
surely take some time to get implemented and regulated in order
to have a wider penetration. Of the respondents, 23.68 per cent
(202 respondents) believe that it will take more than 20 years for
RE to replace fossil fuels. It clearly shows that this section of the
respondents understand that a wider adoption of RE is a long-term
process. On the other hand, the ‘short-term’ category received a very
low response (13.36 per cent or 114 respondents). This shows that
there are people who can envision a fast transformation happening.
This could also refl ect the high rising motivation and expectation that
people have from the government on the RE front.
Which renewable energy sources, according to you, has a high potential in India?
If you agree that renewable energy will replace conventional fuel, what is the likely time frame in which this can be achieved?Q
Short term Short term (3-5 years)(3-5 years)
13.36%13.36%
Medium-Medium-term (5-20 term (5-20
years)years) 62.95%62.95%
Long-term Long-term (more than 20 years) (more than 20 years) 23.68%23.68%
2.1.2. Awareness on the current status of renewable energy technologies in India
More than 92 per cent of the respondents are of the view
that solar energy has a high potential in India. About 60
per cent of the total respondents think that waste-to-
energy has a high potential, followed by biomass (~57 per
cent of the total), wind (~49 per cent of the total) and small
hydropower (~29 per cent of the total).
Wind Solar Small Hydro Waste-to-energy
Biogas (gasifi ers, bagasse based co-generation, digesters)
0
20
40
60
80
100
48.83%
92.79%
29.30%
57.05%60.71%

12
An important aspect to check the awareness of people on renewables
is to test their understanding on the current scenario of RE
technologies. With this objective in mind, the respondents were
asked to choose from a set of RE sources which in their view has
a ‘higher potential in India’. This question tries to identify which
specifi c RE source has a noticeable presence in people’s mind and
has been promoted by the government.
Out of the fi ve most widely used sources – wind, solar, small
hydro, biomass (gasifi ers, bagasse based co-generation, digesters)
and waste-to-energy – solar energy got the highest response. This
awareness can be attributed to the coverage of the initiatives taken
by the Indian government for solar energy policy and programme
promotions in the media. Also waste-to-energy and biomass got a
moderate response, followed by wind and small hydro. Therefore,
‘solar energy’ emerges as one of the most popular renewable energy
options in India.
2.1.3 Perception on whether prices of renewables will reduce to a considerable level
Strongly agreeStrongly agree 27.52%27.52%
Don’t knowDon’t know 7.66%7.66%AgreeAgree 49.39%49.39%
Need more information Need more information 15.43%15.43%
Q
About 77 per cent of the respondents agree that prices of
renewables will reduce to a considerable level and will
eventually become cheaper than conventional energy.
To determine people’s awareness of prices of renewables, the following
question was put forward: ‘Do you think renewable energy will match
the price of conventional energy and will eventually become cheaper’?
Do you think renewable energy will match the price of conventional energy and will eventually become cheaper?

13
2.1.4 Awareness on the linkage between biodiversity and renewable energy technologies
Compared to fossil fuel do you think renewable energy based technologies have much lesser impact on biodiversity and the environment?
Almost half of the respondents, i.e., 49.39 per cent (445 respondents)
‘agreed’ with this assumption. This clearly shows that people have a
positive inclination and understanding on RE investment.
Of the respondents, 27.52 per cent (248 respondents) ‘strongly agree’
with the view that renewables will replace conventional fuel sources
in the future. This clearly shows a positive inclination and a clear
understanding on the part of the respondents about the long-term
benefi ts and knowledge of RE investment. They are perhaps the set of
people who have already invested/ready to invest in RE technology in the
country.
While a small number, i.e., 7.66 per cent (69 respondents) ‘don’t agree’
with the question posed. This shows that some sections are still not
convinced about investing in RE technology. Also, their understanding
seems to be infl uenced by the perception that RE technology is
expensive.
The category of ‘need more information’, received 15.43 per cent or 139
responses. They do not have any idea about the cost of RE technology.
Strongly agreeStrongly agree 59.16%59.16%
AgreeAgree 30.41%30.41%
Don’t agreeDon’t agree 2.44%2.44%
Need more information Need more information 7.99%7.99%
Q
Apart from the options provided, a section was given in the questionnaire for any
specifi c comments. The respondents were free to share their views on ‘whether
RE prices will match the price of fossil fuel’. This was an open-ended question
where the respondents came up with suggestions and any other remarks that
they wished to make.
A summary of the responses received are listed below:• Information on RE should be made effective and should reach out to a
larger audience.
• Awareness on this aspect should be a major focus of the government.
• Initial cost must be economical with options like EMIs which are available
for larger investments.
According to 53 per cent Indians, renewable energy
based technologies do not have any harmful impact on
the environment and biodiversity. Further, more than
90 per cent of the respondents believe that renewable
energy has much lesser impact on biodiversity and the
environment, as compared to fossil fuel based energy.

14
Do you think renewable energy application also have harmful impact on biodiversity and the environment?
In order to analyze people’s perception on the linkage of renewable
energy and biodiversity, two questions were put forward before
the respondents. One aimed at analyzing people’s perception on
the plausible harmful effects of these technologies on biodiversity
(conventional technologies v. RE technologies). The second, probed
the popular belief regarding the harmful effects of RE applications
on the environment and biodiversity.
Comparison between people’s perception on non-renewable
technologies/sources and renewable technologies impacting biodiversity
showed that more than half of the respondents, 59.16 per cent (533
respondents), strongly agree that RE technologies have lesser impact
on biodiversity. This set of respondents would have come across media
articles/research fi ndings that focus on the impact of RE technologies
on biodiversity. Of the total, 30.41 per cent (274 respondents) of the
respondents also agreed that RE technologies have lesser impact on
biodiversity, but not as strongly as the previous set of respondents. This
set could probably consist of people who have heard about the same in
peer group and discussions revolving around this issue.
The option ‘don’t agree’ that renewables have lesser impact on
biodiversity’ comprise 2.44 per cent (22 respondents) of the total
respondents. They are either people who have some fi rst-hand
experience on the negative impacts of RE on biodiversity or are
convinced of this perception. This could probably be attributed
to existing information gap on this issue. People who ‘need more
information’ on this issue comprised 7.99 per cent (72 respondents).
This section probably consisted of mainly those people who have
never come across this concept, and would need access to additional
information in order to comment on this issue.
Q
Strongly agreeStrongly agree 3.44%3.44%
Need more informationNeed more information 27.41%27.41%
Don’t agreeDon’t agree 52.61%52.61%
AgreeAgree 16.54%16.54%
A summary of the comments received for this section are listed below: • Before installing a windmill/ solar plant, path taken by birds should be
properly studied.
• There is need for research on the impact of renewables on biodiversity. The
impact on the environment due to wind mills reducing air currents and
huge solar plants reducing the energy transfer to the ground, and their
corresponding effects on the environment has not been properly studies.
• Other non-renewable technologies that have a harmful effect on
biodiversity should also be the focus of research groups, and results of
such studies should also be shared with the public.

15
2.2. Policies, Incentives and Subsidies
Studies have shown that citizens can be made more informed and
educated about government initiatives by making such information
readily accessible. This requires transparent functioning and accountable
systems for the citizens.11 Studies also show that government can foster a
fact-based public debate on RE, if they provide all relevant information.12
For the development of renewables in various countries, formulation of
effective policies are considered to play an important role13
2.2.1 Awareness on plans and policies of the government on renewable energy
In order to analyze people’s perception of government policies and
schemes for RE technologies, it was important to analyze three
important aspects: fi rst, whether or not people are actually aware of
government’s plans and policies on renewables; second, are they aware
of or able to recall and name some of these schemes or policies; and
third, are they aware of subsidies available for RE applications. It is
seen that more than half of the respondents, 52.94 per cent (477
respondents) are of the view that there have been initiatives by the
government, but believe that these initiatives are not enough to make
the switch possible. This clearly highlights that ‘there exists a huge
gap between government-led initiatives and the actual benefi ciaries’.
YesYes 8.10%8.10% NoNo 38.96%38.96%
To an entent, To an entent, but not enough but not enough
52.94%52.94%
NoNo 67.70%67.70%
YesYes 32.30%32.30%
Do you think the government is taking initiatives to help you switch to renewables?
Do you know of any plans/policies of the central/state government in regard of renewable energy? If yes, please name a few.
Q
Q

16
Of the total respondents, 38.96 per cent (351 respondents) have
‘no knowledge of these initiatives at all’. This brings to light a very
important fact that ‘adoption of RE among common citizens is not
taking place as should be the ideal case (considering the rate at which
RE technology and its manufacturers and suppliers are increasing
in the country). Therefore, this calls for action on the part of the
government with regard to effective ‘dissemination of information’ on
subsidies/plans/policies that have individual/household-centric benefi ts.
It’s only a small percentage of 8.10 per cent (73 respondents) who
are aware of RE initiatives and feel that the government has taken
steps to help individuals shift to renewable energy. This highlights that
there is awareness but only to the ones who want to opt for a particular
technology and have ventured into availing subsidies or taking loans for
RE products.
2.2.2 Awareness of subsidies on renewable energy
Are you aware of government subsidies to purchase renewable energy applications?
When asked further if they could name a few plan/policies by the central/state
government, majority (67.70 per cent or 610 respondents) said ‘no’ they cannot
name any such initiatives and 32.30 per cent (291 respondents) said ‘yes’
they could. Analysis of the policies/programmes respondents named shows
that the Jawaharlal Nehru National Solar Mission (JNNSM) is the most popular
choice among the respondents. Various state RE policies also featured in the
list which included states like Gujarat (wind projects and solar park), Tamil
Nadu (green home project), Karnataka (hydrothermal projects, road tax rebate
on REVA cars), and Kerala’s Agency for Non-conventional Energy and Rural
Technology (ANERT). Subsidies on solar and biogas plants came through as a
frequent response. Other responses included Solar Lantern Programme, National
Biogas and Manure Management Programme (NBMMP), Solar Thermal Energy
Demonstration Programme, Non-Conventional Energy Development Agency
(NEDA) schemes, National Solar Mission, Rajiv Gandhi Grameen Vidyutikaran
Yojana (RGGVY), etc.
43 per cent Indians are aware of government subsidies
on renewables, but admit to having insuffi cient
information on availing these subsidies. Another 43 per
cent citizens said that they have no information at all on
existing subsidies on renewables.
Subsidies on solar water heater and solar lantern were
most popular among individuals.
Q
YesYes 14.87%14.87%NoNo 42.62%42.62%
Yes aware, but Yes aware, but have insuffi cient have insuffi cient
information on information on availing these availing these
subsidiessubsidies42.51%42.51%

17
For an analysis of whether people have requisite information of
government subsidies on RE applications, there is a perfect balance
between ‘yes aware but have insuffi cient information on availing these
subsidies’ (42.5 per cent or 383 respondents) and ‘no’ (42.62 per
cent or 384 respondents). This proves that 84.13 per cent of potential
users of RE applications still require correct, usable and consumer-
friendly information on government subsidies. Only 14.8 per cent of the
respondents (134 respondents) were aware of the subsidies available
and understood the nitty-gritty of availing such subsidies. This group
included existing RE users and well-informed individuals. This low
percentage also highlights the fact that there is a lot more that needs to
be done in terms of easy and accessible information transfer.
Additional comments on government subsidies included:
• Government subsidy through NABARD, on solar heating, solar lanterns, solar
PV in Kerala and Delhi
• Lack of easily available information – no public information
• Some respondents are under the impression that there are no government
subsidies for individuals; subsidies are only available for implementing fi rms.
On being asked if they would like to suggest specifi c support policies/measures on
RE that the government should initiate, a general sense of “not enough is being
done” was expressed. This means that either individuals are not informed of the
various government policies and initiatives or there is not enough dissemination
of relevant information on RE technologies. A substantial number of respondents
were aware of the programmes at a very peripheral level (most respondents said
they do not remember the actual names, but have some information about subsidy
policies from hearsay).This clearly suggest that there is a need for providing more
information to the people on government RE initiatives. In addition, there is a need
for information decoding for better acceptability of RE policies.
2.3. Willingness to Invest In and Adopt Renewable Energy Technologies
2.3.1 Willingness to adopt renewable energy technologies
Studies show that decisions taken emotionally are stronger than fact
and knowledge based decisions14
More than 95 per cent of the current non-users of
renewables are willing to adopt RE technology and use it
in the near future.
If you haven’t used any renewable energy application as yet, do you plan to use it in future?Q
NoNo 4.84%4.84%
YesYes 95.16%95.16%
18
In order to analyze this aspect, non-users of RE technologies were
targeted and were asked to respond whether or not they plan to use it
in the near future. A remarkable 95.16 per cent of the respondents
(727 respondents) gave their support to this aspect. This shows that
people have a positive outlook towards RE adoption. However, what is
required at present is to transcend this positive outlook into positive
action for which, information on these technologies and plans/
policies/programmes have to be made readily available to them.
2.3.2 Willingness to take the lead in renewable energy adoption
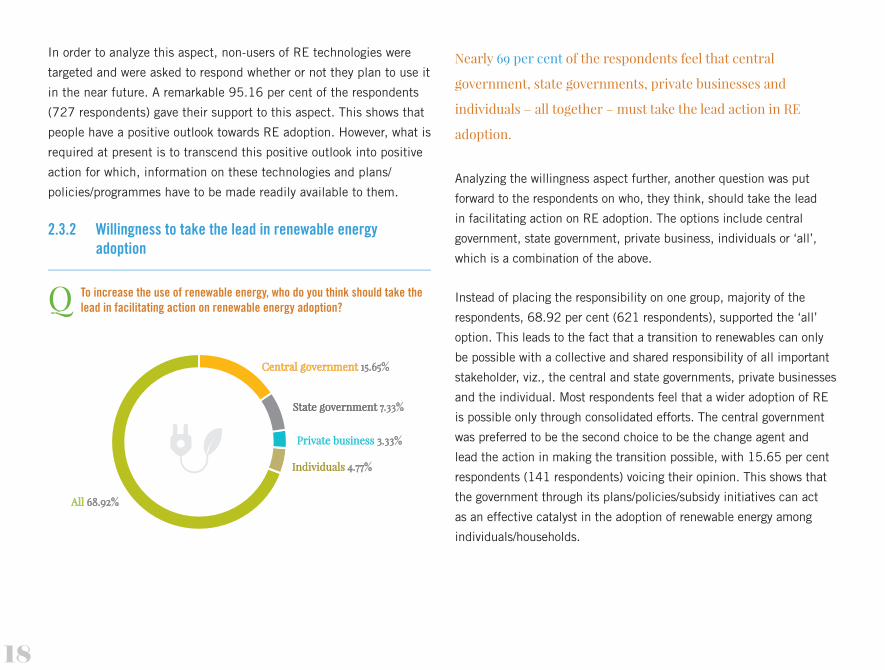
To increase the use of renewable energy, who do you think should take the lead in facilitating action on renewable energy adoption?
Analyzing the willingness aspect further, another question was put
forward to the respondents on who, they think, should take the lead
in facilitating action on RE adoption. The options include central
government, state government, private business, individuals or ‘all’,
which is a combination of the above.
Instead of placing the responsibility on one group, majority of the
respondents, 68.92 per cent (621 respondents), supported the ‘all’
option. This leads to the fact that a transition to renewables can only
be possible with a collective and shared responsibility of all important
stakeholder, viz., the central and state governments, private businesses
and the individual. Most respondents feel that a wider adoption of RE
is possible only through consolidated efforts. The central government
was preferred to be the second choice to be the change agent and
lead the action in making the transition possible, with 15.65 per cent
respondents (141 respondents) voicing their opinion. This shows that
the government through its plans/policies/subsidy initiatives can act
as an effective catalyst in the adoption of renewable energy among
individuals/households.
Nearly 69 per cent of the respondents feel that central
government, state governments, private businesses and
individuals – all together – must take the lead action in RE
adoption.
Q
AllAll 68.92%68.92%
State governmentState government 7.33%7.33%
Private businessPrivate business 3.33%3.33%
Central governmentCentral government 15.65%15.65%
IndividualsIndividuals 4.77%4.77%

19
2.3.3 Barriers towards the adoption of renewable energy technologies
If you don’t plan to install a renewable energy technology in your home, which of the following reason applies?
In order to analyze the barriers towards adoption of RE technologies,
the respondents were asked a simple question on what are the most
common reasons for a non-user to not install an RE product. Based on
the most commonly observed reasons, multiple options were provided
to the respondents. Of the seven reasons listed in the question, a high
share of the respondents, 49.94 per cent or 450 respondents, were of
the opinion that ‘renewables are expensive’. Some other percentages
are as follows:
19.76 per cent (178 respondents) think that ‘RE will not be able
to meet the complete energy need’
14.10 per cent (127 respondents) said that they are not aware
of such technologies.
A fair number of people, 13.87 per cent (125 respondents),
consider space as a constraint for RE adoption at the household
level.
Some respondents also feel that these technologies are not
attractive (1.44 per cent or 13 respondents), and few also
admitted to not knowing how to operate them (0.89 per cent).
Q
While 50 per cent of the respondents think that
renewables are expensive, 20 per cent feel that
renewables will not be able to meet their overall
energy demands.
They are not They are not attractive, do not suit attractive, do not suit the decor of my home the decor of my home
1.44%1.44%
Space constraints Space constraints 13.87%13.87%
Can’t operate them Can’t operate them 0.89%0.89%
Won’t be able to meet Won’t be able to meet complete energy needscomplete energy needs 19.76%19.76%
It it very It it very expensiveexpensive
49.94%49.94% I’m not aware of any such I’m not aware of any such technologytechnology 14.10%14.10%
Other reasons for not planning to install an RE technology at home, as cited by the
respondents are:
• No proper incentives from the government
• Infrastructure constraints
• No easy availability of the technology at the market
• Individuals are not convinced enough to make the switch
• Restricted accessibility to such products
• High maintenance cost
• Rented accommodations. So, it is beyond the individual’s control to install such
applications.

20
2.3.4 Willingness to invest in renewable energy technologies
Do you think investing in renewable energy is fi nancially sustainable in the long run?
To further assess the motivation level among people to invest in RE
technologies, they were asked to share their opinion on whether or
not investment in renewables would be fi nancially sustainable in the
long run.
A majority of the respondents had a positive support for investment
which is seen by the responses received for the choice of ‘strongly
agree’ (39.84 per cent or 359 respondents) and agree (47.50 per
cent or 428 respondents). This helps us infer that these groups of
people understand the long-term benefi ts of switching to RE and
are already paying or would like to pay the stipulated cost of such a
transition. In addition, these respondents are the ones who have a
positive inclination and understanding of investment in renewables.
About 87 per cent of the respondents think that
investing in renewable energy is fi nancially sustainable
in the long run. At the same time, close to 68 per cent
consider the high initial cost of RE technology a barrier
to their willingness to invest in renewables.
Q
Strongly agree Strongly agree 39.84%39.84%
AgreeAgree 47.50%47.50%
Don’t agreeDon’t agree2.55%2.55%
Need more information Need more information 10.10%10.10%
Is higher initial cost a barrier to your willingness to invest in renewable energy technologies?Q
YesYes 67.59%67.59%
Need more information Need more information 17.87%17.87%
NoNo 14.54%14.54%

21
People who ‘need more information’ constitute about 10.10 per
cent (91 respondents), which is the share of people seeking more
information on ‘RE investment’ and is the reason why they couldn’t
choose other options.
Only a small number of people 2.55 per cent (23 respondents) who
opted for ‘don’t think RE investment is sustainable’, which could
perhaps be the result of existing information gap, understanding and
the common perception that renewable energy is expensive.
Higher initial cost of RE technology was also assessed as an
altogether different component in understanding the barriers to
invest in renewables. A signifi cant majority consisting of 67.59 per
cent of the respondents think that the initial investment is a huge
barrier for them, and probably lack an understanding of the long-term
sustainability benefi ts associated with renewables. This perception
therefore hinders their plans, if any, to invest in renewables. This
category of 67.59 per cent is also supported by people who ‘need
more information’, i.e., 17.87 per cent, which shows that they
still have an unclear mindset on higher initial cost and sustainable
benefi ts associated with RE technologies. Additionally, only 14.54
per cent (131 respondents) have a clear understanding of the long-
term benefi ts associated with RE investment and believe that higher
initial cost is not a barrier to adopt RE technologies.
2.4. Access to Information
2.4.1 Access to information on renewable energy initiatives and programmes
Do you know about platforms (like websites, magazines, etc.) where you can read and understand more about renewable energy status in India?Q
YesYes 39.07%39.07%
Need more Need more informationinformation
21.20%21.20%
NoNo 39.73%39.73%
About 40 per cent of the respondents are not aware of
appropriate platforms to access information on RE-
related initiatives and programmes. Further, nearly 77
per cent of the respondents think that their local media
do not cover news related to policies, initiatives and
programmes on renewables.

22
Statistical analysis shows that there is a balance between people
who have access to information on RE technologies (39.07 per cent
or 352 respondents) and those who do not (39.73 per cent or 358
respondents). Thus, 39.07 per cent of the respondents are interested
in learning more on renewables, while the remaining 39.73 per cent
are not aware of platforms where they can get more information
about renewables. The latter ones are those who know very little
on the subject. Further, the category of people who opted for ‘need
more information’, 21.20 per cent (191 respondents), are those who
know about renewables but do not know the right platforms to read
more on it. The analysis hints at the compelling need for effective
dissemination of information by government/NGOs and other related
organizations on renewables through proper communication mediums
like magazines, websites, editorials, etc.
More than half of the respondents, 57.71 per cent (520
respondents), were of the view that their local media did not
cover news on RE policies, programmes, products, innovations,
etc., initiated by the government, NGOs and other agencies. This
shows that there is a huge target audience who are keen on getting
information on RE related activities and initiatives. There is also a
category of people, around 19.20 per cent (173 respondents), who
have ‘no idea’ on the local RE initiatives. Based on this study, one
can infer that if information is made available to people at the local
level, there is a scope for making 76.91 per cent of the respondents
more aware and positively inclined towards renewables. Only 23.09
per cent of the respondents (208 respondents) had information on
renewables which could either be a result of their future plans to
purchase RE products.
Does your local media cover news on renewable energy policies, pro-grammes, products, innovations etc., by governments, NGOs, agencies in your city?
Q
YesYes 23.09%23.09%
No ideaNo idea 19.20%19.20%
NoNo 57.71%57.71%

23
2.4.2 Access to information on renewable energy outlets and vendors
Do you know of outlets where you can purchase renewable energy equipments you need?
Do you want a list or renewable energy vendors to be made readily avail-able (such as in newspapers)?Q
Q
YesYes 93.56%93.56%
NoNo 6.44%6.44%
YesYes 33.63%33.63%
NoNo 66.37%66.37%
Almost 66 per cent Indians did not know of outlets to
purchase their choice of RE application. And, 94 per
cent Indians want the information on RE vendors to be
readily available, in an easy to access medium, such as in
newspapers.
After analyzing access to information on renewable energy and
programmes among Indians, it seemed very important to know
‘whether individuals are aware of channels where RE products could
be purchased’. Of the total individuals surveyed, a high percentage
of people, i.e., 66.37 per cent did not know of outlets from where
they could purchase RE equipment, which shows that a huge number
of people still do not have knowledge of and access to technology
providers. Only 33.63 per cent of the respondents knew of avenues to
purchase RE products.
Also, in continuation to this, individuals were asked if they would like
a list of renewable energy vendors to be made readily available to them
(such as in newspapers, etc.), on which 93.56 per cent responded

24
‘yes’. This clearly shows that a wide adoption of RE applications is
possible if the needed information is provided to them through the most
accessible medium, such as newspaper, magazines, etc.
2.5. Public Choice, Acceptability and Reliability
2.5.1 Public choice of renewables
Do you use any renewable energy application(s)?
45 per cent of the total target audiences use some or the other
renewable energy appliance, while 55 per cent of them do not
use any renewable energy product.
Water heater is the most commonly used RE product, with
46 per cent of the users of RE technologies (and about 22
per cent of the total respondents) using a solar water heater.
This is followed by solar lantern (38 per cent of the users and
about 18 per cent of the total respondents) and solar home
lighting system (21 per cent of users and 10 per cent of the total
respondents).
Q
YesYes 44.51%44.51%NoNo 55.49%55.49%
If yes, in which category will you put yourself as a renewable energy user?Q
Residential society Residential society users/community user users/community user 9.10%9.10%
Individual Individual household userhousehold user
47.38%47.38%
Institutes (educational, offi ce complexes, hospitals) 9.10%9.10%None of the above None of the above
30.56%30.56%
IndustriesIndustries 2.31%2.31%
Community user (shops, Community user (shops, mall, market places ) mall, market places ) 1.54%1.54%

25
In order to determine the acceptability of RE applications among the
respondents, it is important to know how many respondents directly/
indirectly use renewable energy. Analysis showed that 55.49 per cent
(500 respondents) do not use RE applications, while 44.51 per cent
(401 respondents) use RE applications. Further analysis of the users of
RE applications (i.e., referring to 44.51 per cent respondents) showed
that majority of them are individual household users (47.38 per cent).
There is an equal share among residential society/community user and
institutes (educational, offi ce complexes, hospitals, etc.) of 9.10 per
cent each and only a small percentage of users fall under the industries
and commercial user category (shops, malls, market places, etc.), 2.31
per cent and 1.54 per cent respectively.
To understand RE technology with the highest penetration among
users, an assessment of actual usage of the same was done amongst
the respondents. Of them ‘solar water heater’ had the highest
applicability (21.98 per cent or 198 respondents), followed by ‘solar
lantern’ (17.98 per cent or 162 respondents). Also, 9.90 per cent
people use solar home lighting system, 9.32 per cent use other solar
stand-alone systems (garden lighting, periphery lighting, solar street
lighting, etc.), 8.99 per cent use solar cookers and 6.10 per cent use
solar photovoltaic for electricity production. Biogas based technology
was used by 5.33 per cent of the respondents.
Which renewable energy application do you use?Q
Solar lantern Solar lantern 17.98%17.98%
Solar water heater Solar water heater 21.98%21.98%
BiogassBiogass 5.33%5.33%
Solar cookersSolar cookers 8.99%8.99%
Solar home lightning Solar home lightning 9.99%9.99%
None of theseNone of these 52.61%52.61%
Other solar stand alone system (garden, periphery, solar street lightning) 9.32%9.32%
Solar PV for electricity Solar PV for electricity productionproduction 6.10%6.10%
Apart from the ones listed above, other RE applications that are used by
individuals include:
• Solar fencing
• Solar mobile chargers
• Solar battery chargers
• Kitchen waste composting
• Solar pump
• Solar fl ashlights
• Wind turbine
26
2.5.2 Public acceptability of renewables
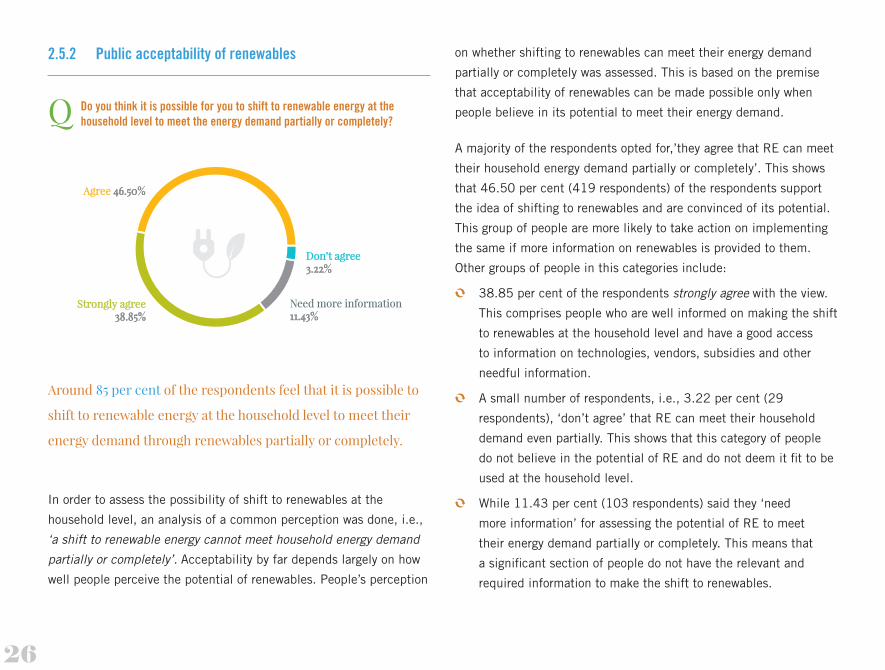
Do you think it is possible for you to shift to renewable energy at the household level to meet the energy demand partially or completely?
In order to assess the possibility of shift to renewables at the
household level, an analysis of a common perception was done, i.e.,
‘a shift to renewable energy cannot meet household energy demand
partially or completely’. Acceptability by far depends largely on how
well people perceive the potential of renewables. People’s perception
on whether shifting to renewables can meet their energy demand
partially or completely was assessed. This is based on the premise
that acceptability of renewables can be made possible only when
people believe in its potential to meet their energy demand.
A majority of the respondents opted for,’they agree that RE can meet
their household energy demand partially or completely’. This shows
that 46.50 per cent (419 respondents) of the respondents support
the idea of shifting to renewables and are convinced of its potential.
This group of people are more likely to take action on implementing
the same if more information on renewables is provided to them.
Other groups of people in this categories include:
38.85 per cent of the respondents strongly agree with the view.
This comprises people who are well informed on making the shift
to renewables at the household level and have a good access
to information on technologies, vendors, subsidies and other
needful information.
A small number of respondents, i.e., 3.22 per cent (29
respondents), ‘don’t agree’ that RE can meet their household
demand even partially. This shows that this category of people
do not believe in the potential of RE and do not deem it fi t to be
used at the household level.
While 11.43 per cent (103 respondents) said they ‘need
more information’ for assessing the potential of RE to meet
their energy demand partially or completely. This means that
a signifi cant section of people do not have the relevant and
required information to make the shift to renewables.
Around 85 per cent of the respondents feel that it is possible to
shift to renewable energy at the household level to meet their
energy demand through renewables partially or completely.
Q
AgreeAgree 46.50%46.50%
Strongly agreeStrongly agree 38.85%38.85%
Don’t agree Don’t agree 3.22%3.22%
Need more information Need more information 11.43%11.43%

27
2.5.3 Public reliability on renewables
Do you think renewable energy technologies are reliable?
The component of reliability was evaluated by analyzing actual
experiences that people had after making a shift to RE technologies.
This included evaluation of components like problems faced by users
after purchasing RE applications, issues related to operation and
maintenance, availability of post-sale servicing, etc.
Reliability of RE technologies, as perceived by the general audience,
was assessed. It was found that a majority of the people 56.71
per cent (511 respondents) responded in affi rmative. This section
of respondents can possibly comprise prospective buyers of RE
technology in India. 20.75 per cent of the users were ‘not completely
satisfi ed’ with RE applications, thus showing that there is a group of
Q
Not completely Not completely satisfi ed satisfi ed 22.09%22.09%
YesYes 56.71%56.71%
Not satisfi ed at all Not satisfi ed at all 0.44%0.44%
Don’t know Don’t know 20.75%20.75%
About 57 per cent of people fi nd renewable energy
reliable. More than 96 per cent of people believe that
renewable energy shift can contribute to a greener
lifestyle.
Do you think that a shift to renewable energy can contribute to a greener lifestyle?Q
YesYes 96.12%96.12%
NoNo 0.67%0.67%
Not sure Not sure 3.22%3.22%

28
people who do not fi nd RE technology reliable due to their previous
experiences. Only 0.44 per cent of the respondents said they are
not satisfi ed at all with RE technology. In addition, 20.75 per cent
of the respondents said that they are not in a position to assess the
reliability of RE technology as they do not know anything about the
technology. This means that either they do not have any fi rst-hand
experience in using RE applications or they have absolutely no
information on the subject.
In order to evaluate how people foresee the role of renewables in
the near future, it is seen that an overwhelmingly large number of
people, i.e., 96.12 per cent (866 of the total 901 respondents),
are of the view that a shift to renewable energy can contribute to a
greener lifestyle. These are people who understand the long-term
benefi ts of shifting to renewables.
2.5.4 Post-purchase problems faced by people using renewable energy products
Did you face any problems after purchasing a renewable energy product? If yes, please elaborate on the problem faced.
About 66 per cent of RE users did not face any problems
after purchasing an RE product. Of the ones who faced such
problems, nearly 33 per cent of the users were not provided
with post-sale services and nearly 32 per cent of them did not
even approach the vendor. Only about 29 per cent of the users
were provided with maintenance services.
Q
N/AN/A 66.26%66.26%
YesYes 11.54%11.54%
NoNo 22.20%22.20%

29
Analysis of problems faced by people after purchasing an RE
application showed that a majority of the respondents, i.e., 22.20
per cent (200 respondents), did not face any problem, while 11.54
per cent people (104 respondents) faced problems of maintenance.
About 66 per cent of the respondents answered in N/A category. This
means that out of the 304 applicable respondents to this question,
34 per cent of the actual users faced post-purchase problems and
66 per cent of them did not face any problem. Performance issues
have thus been identifi ed which need to be rectifi ed as soon as
possible. This would help curb development of any plausible wrong
perception on the reliability of RE technology.
Specifi c problems faced:
• Non-availability of spare parts/batteries
• Installation problem
• Wires and tubes of solar equipment are eaten up by animals
• After the installation, problems with regard to software/maintenance
reminders, but no one has taken onus to provide suffi cient information.
• Very few places where the equipment can get repaired
• Suppliers do not respond to post-sale grievances
• Lack of skilled professional for after sale servicing
Providing maintenance service is very crucial as it plays an important
role in customer satisfaction, thus enhancing reliability of the products.
About 67 per cent of the respondents answered in N/A category. Of
the total people who had adopted RE technology and were applicable
respondents (295 of 901 respondents), only 29.15 per cent of the
people were provided with maintenance services by their vendors while
a majority, i.e., 32.54 per cent (95 respondents) said they were not
provided maintenance services by their vendors. On the other hand,
32.5 per cent of the target respondents did not even approach the
vendor. Possibly, once the default was noted, the customer presumed
that the product was unreliable and therefore thought it would not
be a judicious decision to get back to the vendor. Out of the total
users, only a few said that ‘vendor did not respond’, i.e., 2 per cent
(18 respondents), which shows that the majority of vendors do offer
maintenance service after the purchase of RE products.
Were you provided with maintenance service by your vendor?Q
YesYes 9.54%9.54%
N/AN/A 67.26%67.26%
NoNo 10.54%10.54%
Vendor did not Vendor did not respondrespond 2%2%
Did not approach the vendor 10.65%10.65%

30
31
C h a p t e r 3

32
3.1. Challenges Faced by Manufacturers
Studies have shown that analysis of various challenges faced by
manufacturers/sellers of RE products, contribute in identifying crucial
components in making strategies for effective promotion and adoption
of their products in the market. A survey done in India shows that there
is ‘lack of awareness (among consumers)’ as only 56 per cent of Indian
consumers have heard of ‘renewable energy’ or ‘clean energy’, and
only 27 per cent of consumers have heard of ‘energy effi ciency’.15 In
addition, studies have also shown that renewable energy is assumed to
be costlier and plays an important role in cost driven decision making
and policies.16 Further, some studies highlight that project developers
may face problems to arrange for credit mainly due to lack of collateral,
poor creditworthiness or distorted capital markets.17
Q What are the challenges faced by you as a renewable energy manufacturer/supplier/implementer to get increased demand for your RE products?
0
10
20
30
40
50
60
70
8075%
12.50%
37.50%
62.50%
29.17%
Cost (capital and operational cost)
Access to latest technology
Lack of awareness (of latest technology)
Lack of awareness (among consumers)
Lack of trained manpower
Costs are the biggest challenges faced by 75 per cent
manufacturers/suppliers/implementers. Lack of awareness
about renewables among the consumers is the second biggest
challenge for the manufacturers.
Specifi c challenges include poor designing, engineering,
implementation and installation of projects leading to
improper/unsatisfactory results.

33
In order to analyze the components that hinder manufacturer/
supplier/implementer to increase the demand of their products, they
were provided with 12 most observed and well-researched reasons.
Out of these, a majority of them chose cost (capital and operational
cost) as the main reason, which is closely followed by ineffective or
lack of government incentives/support mechanism. Also, some other
challenges such as lack of awareness (among consumers) and lack of
easy access to fi nance and consumer willingness to pay also received
some responses. Other important challenges faced by manufacturer/
supplier/implementer include aspects related to policy/regulatory
framework, lack of awareness (of latest technology), lack of trained
manpower and lack of a successful business model.
Comments on specifi c challenges included:
• Poor designing, engineering, implementation and installation of or
projects leading to improper/unsatisfactory results. Thus, customer
loses faith in the industry as a whole.
• Some rating system of the installers (in solar thermal too) to be in
place.
• Even a small domestic system has to be installed properly after proper
site survey and is thus a project in itself.
3.2. Consumer Awareness on RE Subsidies
Research has highlighted that many Indians have not heard about
government subsidies on RE applications. Also, a considerably good
percentage of commercial/industrial respondents were also not aware
of government subsidies on RE.18 Further studies on RE application
have emphasize that large public subsidies, both implicit and
explicit, in varying amounts can distort investment cost decisions.19
Are individuals aware of various government subsidies for renewable energy technologies?
YesYes 25.00%25.00%
Yes, but don’t understand Yes, but don’t understand the technicalities and the technicalities and
processesprocesses64.58%64.58%
NoNo 10.42%10.42%
Q

34
About 65 per cent of RE manufacturers say that their consumers
are aware of subsidies but are clueless on how to avail them.
Further 62 per cent of the manufacturers said that they take
eff orts in making their consumers aware of subsidies by
breaking down and simplifying the information for them. While
the remaining percentage of manufacturers admitted to not
having done much in this regard, mainly because the process is
tedious and time consuming.
Manufacturers/suppliers/implementers are the very fi rst point of contact
for a consumer. Therefore, they can be the best resource to extract
consumers’ awareness levels and knowledge on government subsidies/
initiatives on RE technologies. They also serve as a resource pool in
making consumers aware of various subsidies related to RE.
64.58 per cent of the manufacturers/supplier/implementers
responded by saying that a majority of consumers know that
subsidies for particular renewable energy technologies exist, but
they cannot understand the technicalities and processes involved
in it.
While 25 per cent of the manufacturer/supplier/implementers
responded that consumers have complete understanding of
subsidies when they approach them.
While 10.42 per cent of respondents said that they have no
knowledge of it, thus highlighting a very important aspect that
a number of consumers that go to purchase RE technologies
have absolutely no knowledge of RE subsidies and it’s the
manufacturer/supplier/implementer through whom they get to
know about the same.
Further to analyze whether manufacturer/supplier/implementers take
steps in explaining consumers about subsidies, a majority of them,
i.e., 62.07 per cent responded ‘yes’, while 41.38 per cent said ‘no’.
Steps manufacturers/suppliers/implementers take to make people aware on RE subsidies:
• Training women from rural communities
• Increasing awareness and informing the public
• Elaborately explain the policies and processes
• Awareness camps
• Simplifying the information for the customers by breaking it down into
bullet points
Reasons why manufacturers/suppliers/implementers do not take steps to make people aware on RE subsidies:
• Complex process
• Time consuming procedure

35
3.3. Consumer’s Choice of Renewable Energy Technology Technology
Global studies have shown that people favour one form of RE
application in comparison to the other, mainly due to personal
choices and emotional inclination towards a particular technology.20
Which application do people generally choose while opting for renewables? (can choose more than one option)
When asked to list down specifi c support policies/measures on RE from the perspective of manufacturers/suppliers/implementers, the following comments were received:
• Policies are not clear on a long-term basis
• Grant and soft loans for RE vendors
• Government has created a lot of confusion over subsidies. Need to make
it simple.
• Banks must be incentivized to fi nance RE projects
• Implementation of policies is more important rather than mere policies
• Phase out subsidies and encourage low-interest fi nancing for solar
• More awareness
• Working capital support for manufacturers
• Direct subsidies to end-users
• VAT exemption
• Stop subsidies on LPG
Q
0
10
20
30
40
50
60
70
80
90
100
46.81%
68.09%
12.77%17.02%
48.94%
65.94%
44.68%
Solar lantern
Solar water heater
Biogas
Solar cookers
Solar home lighting
Solar PV for electricity production
Other solar stand alone systems (garden lighting, periphery lighting, street lighting etc.)
36
Consumer’s preference of RE technology, as witnessed by
manufacturers/suppliers/ implementers, (on being given an option to
choose from more than one technology) was assessed. The analysis
provided the following results:
According to the manufacturers/suppliers/implementers, solar water
heater and solar PV for electricity production were the most preferred
technologies.
Other technologies that are most common among consumers are
solar home lighting, solar lantern and other solar stand-alone
systems (garden lighting, periphery lighting, street lighting, etc.).
Other preferred technologies include solar cookers and biogas.
Other often opted RE technologies listed down by manufactures
include solar water pump, solar pumping system, bio-chulhas,
biomass cook-stoves and solar mini grid.
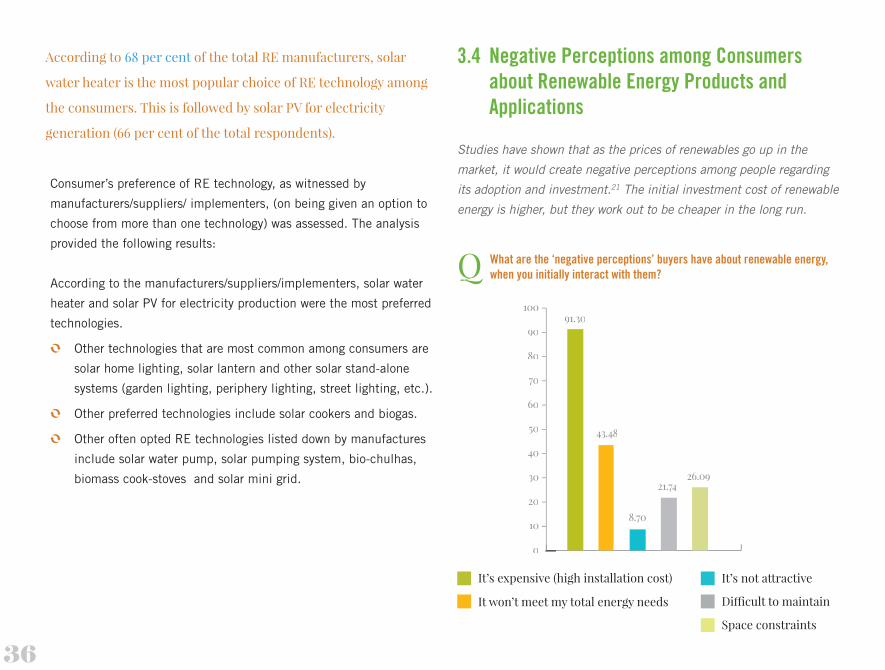
3.4 Negative Perceptions among Consumers about Renewable Energy Products and Applications
Studies have shown that as the prices of renewables go up in the
market, it would create negative perceptions among people regarding
its adoption and investment.21 The initial investment cost of renewable
energy is higher, but they work out to be cheaper in the long run.
What are the ‘negative perceptions’ buyers have about renewable energy, when you initially interact with them?
According to 68 per cent of the total RE manufacturers, solar
water heater is the most popular choice of RE technology among
the consumers. This is followed by solar PV for electricity
generation (66 per cent of the total respondents).
Q
0
10
20
30
40
50
60
70
80
90
10091.30
43.48
8.70
21.7426.09
It’s expensive (high installation cost)
It won’t meet my total energy needs
It’s not attractive
Diffi cult to maintain
Space constraints

37
According to 91 per cent of RE manufacturers, consumers are of
the view that renewables are expensive with a high installation
cost. Renewables are also perceived to be unable to meet their
total energy demand, according to 43 per cent of the total
manufacturers surveyed.
When manufacturers/suppliers/implementers were asked if they would like to suggest some measures to overcome hindrances mentioned above, some of the recommendations included:
• Training/skill building institutes for technical and marketing
personnel
• Easy fi nance options
• Subsidy disbursement must be quick and transparent
• Behavioural change through awareness
• Work on improving the look and design of the equipment
Since a particular manufacturer/supplier/implementer is involved
in selling various types of RE products, therefore while listing down
negative perceptions buyers have about the use of renewables, they
could choose more than one option. Understanding the manufacturers’
impression of their customers would enable listing the most common
perceptions that consumers have according to the perception of the
manufacturers. Consequently, policymakers and implementers can
build interventions around breaking these prejudices.
Results show that the most common perception witnessed
by consumers include that ‘renewables are expensive (and
accompanied with a high installation cost)’ and also that
‘renewables would be ineffective in meeting the total energy
demand’.
A fair amount of people believed that RE technologies are
diffi cult to maintain and have associated space constraints.
There were also a few respondents who did not consider these
technologies attractive.

38
3.5 Determining Post-Sale Services
Studies have shown that in order to assure reliability of renewable
energy, vendors should focus on appropriate design, correct installation
practices and proper after-sales services.22 In certain places, RE
manufacturers are also very few and scattered, who are not able to
provide after-sales services.23 Considering the penetration of renewable
energy in India, manufacturers/suppliers have to take multiple
responsibilities, from educating the marketplace to handling after sales
service and bill collection, which hinders their time-to-time delivery.24
Do you deliver post-sales services?Q
Q
YesYes 87.23%87.23%Yes, only if its an Yes, only if its an
expensive technologyexpensive technology2.13%2.13%
NoNo 10.64%10.64%
What are the factors that contribute to ineffective post-sale services?
0
10
20
30
40
50
60
51.1651.16
34.88
11.63
Finance of travel is higher than product cost
Distance
Lack of manpower
Lack of system components for replacement

39
About 87 per cent of the RE suppliers provide post-sale services.
However, cost of travel and the distance involved turn out to be
the main reasons for ineff ective post-purchase services.
Out of the total RE manufacturers/suppliers/implementers surveyed,
87.23 per cent (41 respondents) confi rmed delivering post-sales
services to their clients. They seem to value customer satisfaction
and believe that it is the good experiences that will be shared with
others, which will help in the propagation of both the technology
and the service provider. 10.64 per cent of the respondents do
not provide after-sales services, which may be due to issues like
distance from the consumer, fi nance and manpower availability
issues, availability of spare parts for repair, etc. One of the responses
also stated that sales service would be provided only when the fault
appears in expensive technologies as this will be more lucrative.
A further analysis was done to assess the main reasons for
manufacturers /suppliers /implementers’ ineffective post-sales
services. The main reason was the cost of travel that turns out to be
much higher. Lack of manpower and lack of system components for
replacement were also recognized to be contributing to ineffective
post-sale services.
3.6 Access to Means of Communication
Research shows that ‘websites, social media, and other promotions’
regardless of whether a company uses on-product messaging, typically
relies on its website as an additional means of communication.25
What are the main issues you face in terms of accessing relevant informa-tion that limit your sales?Q
0
10
20
30
40
50
60
70
18.60%
58.14%
39.53%
27.91%
44.19%
Unaware of how to access raw materials
No readily available information on technology, target market and end consumers
Dependence on experience-based learning
Dependence on conventional knowledge by local small manufacturers/producers
Lack of manpower to manage communication activities on website and other media

40
About 58 per cent of the respondents think that there is no
readily available information on technology, target market and
end consumers, which limits their access to information and
further limits their sales.
There is no readily available information on technology, target market
and end consumers, which turns out to be the biggest challenge
faced by manufacturers/suppliers/implementers in accessing relevant
information, which further limits marketing and sales of RE products.
Other issues include dependence on experience-based learning and
conventional knowledge by local small manufacturers/producers.
Lack of manpower to manage communication activities on website
and other mediums of communication as well as lack of fi nance to
fund for marketing and sales activities are major issues pointed out
by the manufacturers. Some are also completely clueless on how to
access research materials in order to upgrade their technology.
Apart from these, delayed disbursement of subsidies from the
government has also come to light as an important issue because of
which the RE industry is losing the motivation to gr ow.

41
C h a p t e r 4

42
4.1 Key Findings
Amongst the various RE options, solar energy topped the
preference as the most commonly known RE application, both
among individuals as well as among manufacturers. Majority
of the individual respondents are of the view that solar energy
has the highest potential in the country. Also, the targeted
manufacturers are promoting solar-based technologies more as
compared to other RE technologies.
Solar water heater is the most popular choice of RE technology
among individuals. Solar water heater also turned out to be the
most popular choice as observed by the manufacturers. Other
popular applications included solar lantern and solar PV for
electricity.
55 per cent of the people still do not used any renewable energy
application. Nevertheless, more than 95 per cent current non-
users are willing to adopt RE technology in the near future.
This means that there is tremendous scope for expansion of
renewable energy in the country. Individuals are keen and eager
to adopt renewables. Rampant scaling up and rapid awareness
creation is the need of the hour.
The most common perception that exists among individuals is that
renewable energy is expensive and does not meet their complete
energy demands. The same has been observed and voiced by the
manufacturers. A majority of respondents still seem to lack an
understanding of the long-term sustainability benefi ts associated
with renewable energy. 67.59 per cent of the people consider the
initial investment as a huge barrier for adoption of renewables.
43 per cent of the people are aware of government subsidies
on renewables, but admit to having insuffi cient information on
availing it. 65 per cent RE manufacturers say that their consumers
are aware of subsidies but are clueless on how to avail them.
Besides, 43 per cent of the respondents also said that they have
no information at all on existing subsidies on renewables. Thus,
information on subsidies is perceived to be quite complicated and
very diffi cult for consumers to decode and understand.
Access to apt and readily available information comes across
as a big barrier for both individuals to adopt renewables and for
manufacturers to enhance and promote their products.
Operational and capital costs are the biggest challenges faced
by 75 per cent manufacturers/suppliers/implementers. Lack of
awareness of renewables among the consumers is the second
biggest challenge for the manufacturers.
More than 90 per cent of the respondents believe that RE-based
technologies have much lesser impact on biodiversity and the
environment, as compared to fossil fuel based energy.
96 per cent of the respondents believe that a shift to RE can
contribute to a greener lifestyle.
Nearly 69 per cent of the people feel that the central and state
governments, private businesses and individuals – all together –
must take the lead action in RE adoption.

43
4.2 Conclusions
The study clearly presents a favourable case scenario for RE adoption
and expansion. With over 90 per cent of the individuals convinced
that renewable energy contributes to a greener lifestyle and more
than 95 per cent non-users of RE technologies are willing to adopt
renewables in the future, there is tremendous scope for scaling up of
RE applications in the country. Citizens have a positive outlook towards
renewables and are of the view that it has the potential to gradually
replace fossil fuels over the medium-term (say 5–20 years). They also
believe that renewables are less harmful to biodiversity, as compared to
fossil fuels.
While wind energy has a higher potential in India, individuals instead
perceive solar to have a higher potential in the country. Solar promotion
has always been on a higher scale and hence visibility of solar energy
remains highest among individuals. Thus, there is a need for increased
awareness and promotion of various schemes and policies related to
RE. There is also an increased need to harness the potential of RE
sources other than solar and more importantly, make that perceptible
to the general masses.
Despite a positive way forward for renewables, there are various
challenges ahead that need to be addressed and deployed in future
actions. The biggest barrier to uptake and propagation of renewables
are the various myths and misconceptions that inhabit the minds
of prospective RE adopters. The most common of them being that
renewables are expensive and that they are unable to meet the energy
demands. It is crucial to make individuals aware of the long-term
sustainability benefi ts associated with RE technologies. It is also
crucial to make people aware that RE has the potential to meet most
of the energy demands of the user. The biggest challenge faced by the
manufacturers also relates to cost with operational and capital costs
proving to be the biggest challenges for RE technology providers.
Awareness with respect to government subsidies and policies on RE
accounted to be very low among Indian citizens. There is a need to
provide readily available information on RE vendors in a lucid and
easy-to-access method. Also, it is very important to break down the
information for common citizens in an easy-to-understand manner.
Lastly, but of course not the least, there is a need for a shared vision,
which the people have identifi ed in the survey. The step to call and
take up action is perceived to be of all the stakeholders together
– governments, both at the centre and the state, institutions,
government organizations, NGOs and individuals.

44
Nearly 69 per cent of
the people feel that
central government
and state governments,
private businesses
and individuals – all
together- must take
the lead action in RE
adoption.
More than 96 per
cent Indians believe
that a shift to RE
can contribute to
a greener lifestyle.
About 57 per cent of
the people fi nd RE
reliable.
About 68 per cent
consider the high
initial cost of RE
technology a barrier
to their willingness
to invest in RE.
PEOPLE’S PERCEPTION STUDY Renewable Energy in India 2014
More than 92 per cent respondents are
of the view that solar
energy has a higher
potential in India.
About 68 per cent
of the people were
unable to name any
government plans or
policies connected
with RE.
50 per cent of the respond-
ents think that renewables
are expensive. According to
91 per cent of the RE manu-
facturers, consumers are of
the view that renewables are
expensive with a high instal-
lation cost.

45
About 55 per cent of
people still have not
used any renewable
energy application.
Almost 92 per cent of the
people feel that renewa-
bles can replace fossil
fuel use in the near fu-
ture. Of this, 63 per cent
of the respondents think
that such a transition can
occur in the medium-term
(5–20 years).
Jawaharlal Nehru
National Solar
Mission (JNNSM) is
the most popular
government initiative
among individuals.
About 53 per cent
of the respondents
feel that there have
not been enough
initiatives to make
the switch to RE
possible.
Solar water heater is the most
commonly used RE source, with
46 per cent users of RE technology
using a solar water heater. According
to 68 per cent of the total RE
manufacturers, solar water heater
is the most popular choice of RE
technology among the consumers.
20 per cent feel that re-
newables will not be able to
meet their complete energy
demands. Renewables
are also perceived to be
unable to meet their total
energy demand, according
to 43 per cent of the total
manufacturers.

46
About 77 per cent of
the individuals think
that their local media
does not cover news
related to policies,
initiatives and
programmes on RE.
About 58 per cent RE
manufacturers think
that there is no readily
available information
on RE technology,
target market and end
consumer.
About 87 per cent RE
suppliers provide post-
sale services. However,
cost of travel and the
distance involved turn out
to be the main reasons for
ineffective post-purchase
services.
Costs are the
biggest challenges
faced by 75
per cent of the
manufacturers/
suppliers/
implementers.
More than 95 per
cent current non-
users of renewables
are willing to adopt
RE technology in the
near future.
43 per cent Indian citizens are
aware of government subsidies
on renewables, but admit to
having insuffi cient information
on availing it. 65 per cent
RE manufacturers say that
their consumers are aware of
subsidies but are clueless on
how to avail them.
More than 90 per cent of
the respondents believe
that renewable energy
based technology have
much lesser impact
on biodiversity and the
environment, as compared
to fossil fuel based energy.

47
C h a p t e r 5

48
Individuals Spread the word! Ask more and more people to shift to renewables.
Adopt smart and effi cient RE equipment and make the share of RE count.
Seek and share information on RE vendors and policies.
In coordination with other stakeholders, individuals should take the lead in making a shift to
renewables.
Reach out to government agencies, manufacturers, NGOs in the renewable energy area in their state to
retrieve more information on RE technology, cost and specifi cations.
Individuals should be well aware of their personal/household energy consumption level and gain a
thorough understanding of what difference would it make by shifting to renewables.
Media Create a positive outlook for RE uptake.
Increased coverage on RE policies and programmes, both at the central and state levels. International,
national and local level initiatives must also be extensively covered.
Local media must play a proactive role in covering news pertaining to RE initiatives at the local level.
Felicitate and encourage positive dialogue between policy implementers, RE vendors and individual
end users. Build upon positive stories on RE adoption by various stakeholders in order to enhance wider
adoption of these technologies.
Include once a week column on renewables, which can be an interaction with an ‘expert in RE fi eld’.
Relation of RE application with social and environment factors in addition to economic ones must be
explored and highlighted.

49
Civil Society Mobilize, advocate and generate awareness through effective ‘knowledge sharing process’ among
individuals on renewables.
Infl uence policymakers to develop policies that promote renewable energy and enable a just transition
to renewables.
Liaison with RE manufacturers and technology providers, and develop projects at the grassroots to
promote sustainable energy.
Organize fairs and exhibitions on RE to popularize its applications.
By engaging with various stakeholders, civil societies should take the lead in making a shift to
renewables possible.
Technology Providers Increase awareness among consumers on various aspects of renewables such as subsidies, technology,
potentials and benefi ts.
Make increased efforts at enhancing and improving post-sale services.
Stay updated on new research and information pertaining to renewable energy technology.
Constantly innovate and develop new technologies.
Stay updated about various government subsidies, programmes and policies on renewable energy.
Engage with the government wherever possible, to contribute towards effective policymaking.
50
Government Create awareness around RE, its various sources/technology, its potential and scope, and policies,
incentives and subsidies.
Efforts at revamping the already existing government communication mediums like website,
magazines, newsletters, bulletins, etc., to effectively communicate about various policies, incentives,
technology, etc.
Information on subsidies should be simplifi ed and made easily available to the consumers.
Initiatives to promote wider use of renewable energy equipment in institutions, organizations and
commercial places.
Incentivize RE manufacturers and provide them with fi nancial and technological support
Governments, along with other stakeholders, must take the lead action in making a shift to renewables.
To communicate effectively to the consumers about the various benefi ts of shifting to RE rather than
the conventional energy sources.
Bring in policies that enable large-scale adoption of RE at the grassroots.
Ensure effective implementation of existing RE policies. In particular, timely dispersal of incentives
and subsidies that are already in place.

51
REFERENCES1. WWF International. 2011. The Energy Report: 100% Renewable
Energy by 2050. WWF International, Ecofys & OMA. Gland,
Switzerland. http://d2ouvy59p0dg6k.cloudfront.net/downloads/the_
energy_report_lowres_111110.pdf, accessed on 27 August 2014.
2. IPCC. n.d. Glossary. IPCC Fourth Assessment Report: Climate
Change 2007: Working Group II: Impacts, Adaptation and
Vulnerability. Intergovernmental Panel on Climatic Change.
http://www.ipcc.ch/publications_and_data/ar4/wg2/en/
annexessglossary-a-d.html, accessed on 27 August 2014.
3. Blasting, T.J. 2014. Recent Greenhouse Gas Concentrations.
Carbon Dioxide Information Analysis Center. http://cdiac.ornl.
gov/pns/current_ghg.html, accessed on 30 August 2014.
4. TERI. 2013. TERI Energy Data Directory & Yearbook 2012/13.
The Energy and Research Institute, New Delhi.
5. Planning Commission. 2011. Low Carbon Strategies for Inclusive
Growth: An Interim Report. Government of India, New Delhi.
http://planningcommission.nic.in/reports/genrep/Inter_Exp.pdf,
accessed on 15 December 2013.
6. Ernst & Young. 2014. Renewable Energy Country Attractiveness
Index. Issue 41 (June). http://www.ey.com/Publication/vwLUAssets/
Renewable_Energy_Country_Attractiveness_Index_41_-_
June_2014/$FILE/EY-Renewable-Energy-Country-Attractiveness-
Index-41-June-2014.pdf, accessed on 29 August 2014.
7. MNRE. n.d. Physical Progress (Achievements). Ministry of New and
Renewable Energy, Government of India. http://www.mnre.gov.in/
mission-and-vision-2/achievements, accessed on 29 August 2014.
8. Ibid.
9. MacArthur, Julie. 2014. Challenging Public Engagement:
Participation, Deliberation and Power in Energy Policy Design and
Implementation. Waikato Sustainability Symposium: Transforming
Public Engagement on Controversial Science & Technology, 17–18
February. The University of Waikato, Hamilton, New Zealand.
http://www.waikato.ac.nz/fass/conference/sustcitconf/papers/
MacArthur%20Waikato%20Sustainability%20Symposium%20
(2).pdf, accessed 1 September 2014; Geothermal Communities.
2013. Study on Public Perception on Geothermal Energy.
Geothermal Communities. http://www.geothermalcommunities.
eu/sitedir/project_material/d61_study_on_public_perception_of_
geothermal_energy.pdf, accessed on; Department of Energy and
Climate Change. 2012. DECC Public Attitude Tracker – Wave 2:
Summary of Key Findings. Department of Energy and Climate
Change. https://www.gov.uk/government/uploads/system/uploads/
attachment_data/fi le/65520/6410-decc-public-att-track-surv-
wave2-summary.pdf, accessed on 1 September 2014.
10. See Eshchanov, Bahtiyor R., Stultjes, Mona Grinwis Plaat
and Ruzumboy A. Eshchanov Sanaatbek K. Salaev. 2011.

52
People’s Perceptions on Renewable Energy Sources’ Penetration
Prospects in the Khorezm Province, Uzbekistan. Journal
of Knowledge Management, Economics and Information
Technology. Issue 7 (December). http://www.scientifi cpapers.
org/wp-content/fi les/1237_Peoples_Perceptions_on_Renewable_
Energy_SourcesPenetration_ProspectsintheKhorezm_Province_
Uzbekistan.pdf, accessed on 1 September 2014.
11. The main purpose, as Beierle says, is to “create a better-informed
and educated public and to increase trust by making government
and the regulated community more accountable and transparent
to citizens”. See Beierle, Thomas. C. 1998. Public Participation
in Environmental Decisions: An Evaluation Framework Using
Social Goals. Discussion Paper 99-06, Resources for the Future,
Washington, DC, quoted in Zea, Alfredo Santos, Benavides, Ana
Catalina Vargas, Ogungbemi, Benjamen Toluwalope, Namuyondo,
Esther, Enwena, Nneka Maryrose and Olga Petrikova. 2012.
Public Participation in Renewable Energy Infrastructure Projects:
A Comparison between the Copenhagen and Malmø Regions.
Aalborg University, Denmark. http://energioresund.org/pic_m/17_
verdi_182_ProjectWork-EMSS2-42012.pdf, accessed on 1
September 2014.
12. Governments can and should provide information about RE
which can help foster a fact-based public debate, while striking a
careful balance to ensure that their communications do not come
across as ‘propaganda’. See Bridle, Richard, Collings, Jonathan,
Cottrell, Jacqueline and Aaron Leopold. 2013. Communication
Best-Practices for Renewable Energy. IISD, FOS and Collings &
Money. http://iea-retd.org/wp-content/uploads/2013/04/IEA-RETD-
RE-COMMUNICATE-Report_Final_20130403.pdf, accessed on 1
September 2014.
13. Jacobsson, S. and Lauber, V. 2006. The Politics and Policy of
Energy System Transformation: Explaining the German Diffusion
of Renewable Energy Technology. Energy Policy 34(3): 256–276;
Winkler, H. 2005. Renewable Energy Policy in South Africa:
Policy Options for Renewable Electricity. Energy Policy 33(1):
27–38; Tan, K.T., Lee, K.T. and A. R. Mohamed. 2008. Role of
Energy Policy in Renewable Energy Accomplishment: The Case
of Second-Generation Bioethanol. Energy Policy 36(9): 3360–
3365; Peidong, Z., Yanli, Y., Jin, S., Yonghong, Z., Lisheng,
W. andL. Xinrong. 2009. Opportunities and Challenges for
Renewable Energy Policy in China. Renewable and Sustainable
Energy Reviews 13(2): 439–449; Mitchell, C. and Connor, P.
2004. Renewable Energy Policy in the UK 1990–2003. Energy
Policy 32(17): 1935–1947.
14. A study by Bang et al. (2000) revealed that emotionally charged
decisions are more important than facts and knowledge-based
decisions among US citizens. See Bang, H. K., Ellinger, A. E.,
Hadjimarcou, J. and P. A. Traichal. 2000. Consumer Concern,
Knowledge, Belief, and Attitude toward Renewable Energy:
An Application of the Reasoned Action Theory. Psychology &
Marketing 17 (6): 449–468. See also Eshchanov, Bahtiyor
R., Stultjes, Mona Grinwis Plaat and Ruzumboy A. Eshchanov
Sanaatbek K. Salaev. 2011. People’s Perceptions on Renewable
Energy Sources’ Penetration Prospects in the Khorezm Province,
Uzbekistan. Journal of Knowledge Management, Economics
and Information Technology. Issue 7 (December). http://
53
www.scientifi cpapers.org/wp-content/fi les/1237_Peoples_
Perceptions_on_Renewable_Energy_SourcesPenetration_
ProspectsintheKhorezm_Province_Uzbekistan.pdf, accessed on
September 2014.
15. According to a fi rst-of-its-kind survey conducted by Mercom
Capital Group titled ‘India Renewable Energy Awareness Survey,’
only 56 per cent of Indian consumers have heard of ‘renewable
energy’ or ‘clean energy’, and only 27 per cent of consumers
have heard of ‘energy effi ciency’. See Mercom Capital Group,
http://mercomcapital.com/awareness-of-renewable-energy-and-
energy-effi ciency-low-in-india-according-to-survey-by-mercom-
capital-group1, accessed on 1 September 2014.
16. Many argue that renewable energy costs more than other
sources, resulting in cost-driven decisions and policies that avoid
renewable energy. See Beck, Fredric and Martinot, Eric. 2004.
Renewable Energy Policies and Barriers. Encyclopedia of Energy.
Vol. 5.Elsevier Inc. http://www.martinot.info/Beck_Martinot_
AP.pdf, accessed on 1 September 2014.
17. Consumers or project developers may lack access to credit to
purchase or invest in renewable energy beacause of lack of
collateral, poor credit worthiness or distorted capital markets.
See Mercom Capital Group. 2010-2011. India Renewable
Energy Awareness Survey. Mercom Capital Group, LLC. http://
www.mercomcapital.com/MercomIndiaREAwarenessSurvey.pdf,
accessed on 1 September 2014.
18. About 62 per cent of all surveyed respondents had not heard of
government subsidies for renewable energy. An 80 per cent of
rural respondents had not heard of renewable energy subsidies,
while 61 per cent of commercial/industrial respondents were
unaware of government subsidies for renewable energy, 54
per cent of residential respondents were also not aware of
subsides. Vyas, Charul and Hurst, Dave. 2013. Energy and
Environment Consumer Survey. Navigant Research. http://www.
navigantresearch.com/wp-assets/uploads/2013/12/WP-EECS-13-
Navigant-Research.pdf, accessed on 1 September 2014.
19. Large public subsidies, both implicit and explicit, are channeled
in varying amounts to all forms of energy, which can distort
investment cost decisions. See Beck, Fredric and Martinot, Eric.
2004. Renewable Energy Policies and Barriers. Encyclopedia
of Energy. Vol. 5.Elsevier Inc. http://www.martinot.info/Beck_
Martinot_AP.pdf, accessed on 1 September 2014.
20. Close to 80 per cent of the respondents favoured the concept
of solar energy, which led all concepts in favorable responses,
followed by wind energy (72 per cent). Vyas, Charul and Hurst,
Dave. 2013. Energy and Environment Consumer Survey.
Navigant Research. http://www.navigantresearch.com/wp-
assets/uploads/2013/12/WP-EECS-13-Navigant-Research.pdf,
accessed on 1 September 2014.
21. The higher the costs of renewable energy the more negative is
the perception. See Kuhn,Marc, Zajontz, Yvonne and Vanessa
Kollmann. n.d. Consumer Perception of Global Renewable
Energy Projects – exemplifi ed at DESERTEC. http://www.
lcbr-online.com/index_fi les/proceedingsemc12/12emc005.pdf,
accessed on 1 September 2014.

54
22. The only way of ensuring the reliability of renewable energy
systems is to focus on (a) appropriate design, (b) correct
installation practices, and (c) proper after-sales service (India
should accelerate renewable energy. See Kumar, Amit. 2014.
India should Accelerate Renewable Energy. The Energy
and Resource Institute (TERI).http://www.teriin.org/index.
php?option=com_featurearticle&task=details&sid=839, accessed
on 1 September 2014.
23. Manufacturers were also very few and scattered who could
not provide after sale services. SeeIn SolTherm Times. n.d.
Interview: Mr. Deepak Gupta, Secretary, Ministry of New and
Renewable Energy. InSolTherm Times. Ministry of New and
Renewable Energy and Solar Thermal Federation of India.http://
mnre.gov.in/fi le-manager/solar-thermal-newsletter/volume-1-
issue-2/EN/interview.html, accessed on 1 September 2014.
24. Who provides marketing and after sales service? Given the
embryonic state of renewable energy development in rural
areas, entrepreneurs are usually required to do everything from
educating the marketplace to handling after sales service and
bill collection. See Sustainable Energy Solutions. 1998. Asia-
Pacifi c Economic Cooperation Guidebook for Financing New
and Renewable Energy Projects. New Energy and Industrial
Technology Development Organization, Japan. http://www.apec.
org/~/media/Files/Groups/EWG/98_ewg_guideproj.pdf, accessed
on 1 September 2014.
25. ‘Websites, Social Media, and Other Promotions’ Regardless
of whether a company uses on-product messaging, it typically
relies on its website as an additional means of communication.
Websites have minimal constraints, so companies may include
detailed descriptions of their involvement with renewable energy.
See Brannan, Deborah Baker, Heeter, Jenny and Lori Bird.
2012. Made with Renewable Energy: How and Why Companies
are Labeling Consumer Products. National Renewable Energy
Laboratory (NREL), Department of Energy, USA. http://www.nrel.
gov/docs/fy12osti/53764.pdf, accessed on 1 September 2014.

55
About WWF-India
WWF-India is one of the largest conservation organizations in the
country dealing with nature conservation, environment protection and
development-related issues. Established as a Charitable Trust in 1969, it
has an experience of over four decades in the fi eld. Its mission is to stop
the degradation of the planet’s natural environment, which it addresses
through its work in biodiversity conservation and reduction of humanity’s
ecological footprint.
WWF-India works across different geographical regions in the country to
implement focused conservation strategies on issues like conservation
of key wildlife species, protection of habitats, management of rivers,
wetlands and their ecosystems, climate change mitigation, enhancing
energy access, sustainable livelihood alternatives for local communities,
water and carbon footprint reduction in industries, and combating illegal
wildlife trade. WWF-India is actively engaged in promoting renewable
energy uptake, enabling energy access, demonstrating renewable energy
projects in critical landscapes, and overall promoting clean energy
solutions.
WWF-India has been working on issues related to biodiversity conservation,
sustainable livelihoods and governance, and climate change. The Climate
Change and Energy programme of WWF-India is working towards a climate
resilient future for people, places and species that support pathways for
sustainable and equitable economic growth. Low carbon development
and renewable energy at scale are the thrust areas of climate change and
energy programme.

© 1986 Panda Symbol WWF-World Wide Fund For Nature (Formerly World Wildlife Fund)WWF-India Secretariat172-B Lodi EstateNew Delhi 110003Tel: 011 4150 4814 Fax: 011 4150 4779