
People, Product Profit
52
2003 Annual Report & People, Product F ORGING A S TRATEGY FOR L ONG -T ERM G ROWTH Profit
Transcript of People, Product Profit
2003 Annual Report
&People,
Product
FORG ING A STRATEGY FOR LONG-TERM GROWTH
Profit

AREWHOwe
WMS INDUSTRIES INC. (NYSE: WMS) is exclusively focused on
the gaming industry through the creation, design, manufacture
and marketing of top-earning video and mechanical reel spin-
ning slot machines and video lottery terminals. WMS’ mission
is to create the most entertaining gaming products in the
world and service its customers with an uncompromising
passion for quality. All of our employees embrace our core
values of innovation, tenacity, passion, quality and integrity
and are guided by the fundamental principle of teamwork.
This report contains “forward-looking statements,” within the meaning of the federal securities laws. These statements describe our plans, strategies and goalsand our beliefs concerning future business conditions and the outlook for WMS based on currently available information. Forward-looking statements are typically identified by words such as “may,” “will,” “should,” “seek,” “expect,” “anticipate,” “believe,” “estimate,” “intend” and similar expressions. Our actual resultscould differ materially from those described in the forward-looking statements due to a number of risks and uncertainties. We assume no obligation to updatepublicly any forward-looking statements contained in this report, whether as a result of new information, future events or otherwise. Forward-looking statements may be found in the materials set forth under “Item 1. Business” and “Item 7. Management’s Discussion and Analysis of Financial Condition andResults of Operations,” among other items in our Form 10-K.

1W
MS
In
du
st
rie
s In
c. 2
00
3 A
R
Years Ended June 30,
(in millions) 1999 2000 2001 2002 2003
Total Revenues $127 $218 $264 $175 $179
Total Costs and Expenses 116 150 220 162 197
Operating Income (Loss) 11 68 44 13 (18)
Income (Loss) from Continuing Operations 9 44 32 10 (8)
Discontinued Operations, Net of Income Taxes (4) (14) 4 — —
Net Income (Loss) 5 30 36 10 (8)
2003f inancial highlights
$106’03
’02’01
’03
’02’01
’03
’02’01
CASH AND SHORT-TERM INVESTMENTS[in millions]
TOTAL ASSETS[in millions]
REVENUES[in millions]
$160
$351
$278$281
$179
$264$175
$86

2
Twenty-one months ago, we set out a
plan to regain our prominence in the slot
machine industry. Since then, WMS has under-
gone a remarkable technological and cultural
transformation. After six quarters of focused
investment in products and people, we entered
Fiscal 2004 ready to introduce customers to
a newly revitalized WMS brand—one that
promises wider, more appealing product lines
built on stable operating technology and backed
by an unwavering commitment to customer
satisfaction.
The plan to rebuild WMS stands on
three strategic operating initiatives—technology
improvement, product line expansion and invest-
ment in people—and on a prudent financial
strategy emphasizing aggressive cost manage-
ment and a conservative capital structure. Since
January 2002, we have invested heavily in
research and development, new technologies,
brand licenses, management and creative staff,
management information systems, and repur-
chases of our stock. As a result, we concurrently
satisfied our most urgent near-term goals:
preserving stockholder value and positioning
WMS for future growth.
Our financial performance in Fiscal 2003
reflects the impact of our investment and
re-emergence strategy. For Fiscal 2003, we
recorded a net loss of $8 million on revenues
of $179 million. This loss was largely attributable
to an increase of $14 million in research and
development spending as well as charges for
inventory and other asset write-downs.
Our ability to increase stockholder value
is tied directly to the quality and product
integrity of our gaming platform. Our products
must perform reliably on casino floors, which
today are sophisticated technological environ-
ments where players demand speed, visual
appeal and fun. To that end, we have devoted
tens of thousands of man-hours and millions of
dollars to a three-part technology improvement
program. The plan has already succeeded in
stabilizing our legacy operating system software
and now, in the second phase of the plan, we
have produced a whole new, more advanced
operating system, called CPU-NXT�, for the
products that we are now just beginning to
commercialize.
We designed CPU-NXT with the future
in mind. It is a powerful product engine and
provides a highly flexible game development
environment. The system has passed rigid new
testing protocols in our own labs and in inde-
pendent gaming test labs. We are confident
that it is fully capable of sustaining the large
and diverse array of games that we recently
began offering our customers. CPU-NXT also
brings the benefit of shortening our game
development cycle. We can now get to market
faster and more productively than ever before.
To enhance the gaming experience, our game
STOCKHOLDERS:
TOour
3W
MS
In
du
st
rie
s In
c. 2
00
3 A
R
Louis J. Nicastro Brian R. GamacheChairman of the Board President and CEOSeptember 18, 2003 September 18, 2003
designers now have powerful new video tools
with improved graphics and animation capabil-
ities and new audio tools to develop dynamic
soundtracks that take full advantage of the
world-renowned sound technology from BOSE�
to enhance the gaming experience. We received
the first regulatory approval of CPU-NXT in
September 2003 and expect approvals from the
other five North American gaming regulatory
laboratories by March 2004.
The availability of CPU-NXT comes at a
fortuitous time. We expect the global gaming
market to expand as governments around the
world move to legalize gaming as a source of
additional revenues. This will result in increased
levels of investment by the industry in newly
created markets. As these markets expand, we
believe nimble and technologically-advanced
suppliers will possess competitive superiority.
We are in an excellent position to capi-
talize on this evolving market environment.
We are now introducing the broadest array of
games in our history. Customers have hailed our
award winning Bluebird� gaming cabinet as a
breakthrough product, and we expect first reg-
ulatory approvals in November. Our improved
development cycle coincides with shorter game
replacement cycles and the adoption by casinos
of cashless gaming technologies.
We head into the future with a strong
balance sheet, which includes almost $160 mil-
lion in cash and short-term investments to fund
our growth. We recently completed a $115 mil-
lion convertible note offering, providing us
with greater financial flexibility as we move
into the next phase of our evolution.
As we invested in our future, we also
actively managed our costs and minimized
operating losses. In addition, our Board of
Directors acted to enhance the value of your
investment through an aggressive share repur-
chase program. Since January 2002, we have
repurchased 3.2 million WMS shares, or 9.9%
of the previous shares outstanding, for $42.5 mil-
lion, at an average price of $13.31 per share.
As of August 31, 2003, we had $12.5 million of
remaining availability under our repurchase
authorization.
Finally, we would like to highlight the
performance of our employees during the chal-
lenging times we faced throughout the twenty-
one month execution of the plan. Their passion
and tenacity have been our most revered assets
in this rebuilding cycle and their dedication
and creativity inspired innovation in our strate-
gies while rekindling our competitive spirits.
They earned the confidence and respect of
both our management team and our Board of
Directors. As we move into Fiscal 2004, we
believe our customers will respond positively
to the exciting, entertaining and innovative
gaming products developed by this incredibly
talented and dedicated team.
WMS has undergone a remarkable technological and cultural transformation.

4
WMSTHE“new”

Our vision for the “new” WMS is straight-
forward: to provide our customers with a broad
range of products with the best performing
games on reliable, technologically advanced
platforms. This mantra has been the guiding
principle for the brand and technology rebuild-
ing program we embarked on in January 2002.
Every new product we developed, every game
we created, every operation we improved, every
brand we licensed, every system we adapted,
every new process we implemented and every
new quality control we installed started with
the customer foremost in our thinking.
Making our vision a reality requires both
an attitude and a process. The attitude is one
that builds on our tradition of developing
games on which casino operators rely for high
earnings and that casino patrons want to play—
again and again. Our new CPU-NXT operating
system gives our game designers new tools to
unleash their true creativity, and our new
Bluebird cabinet contains features to enhance
the entertainment value of the games. By adding
new processes, discipline and accountability to
our engineering efforts, we successfully devel-
oped a reliable technology platform to run
today’s—and tomorrow’s—content-rich games.
Our rebuilding program has been about guar-
anteeing product reliability and ensuring the
appeal of our platforms to players.
To achieve the vision, our rebuilding plan
also contains many other mission-critical ele-
ments. We have successfully established a new
approach to service excellence to better antici-
pate and serve our customers. We optimized our
manufacturing operations with new demand-
flow processes and configured the manufactur-
ing floor to provide short lead times for product
delivery and other operating efficiencies. In
addition, we are implementing a new enterprise
resource planning system to gain flexibility and
insight for future business decisions. As we
move to launch the “new” WMS, our sales staff
has undergone extensive training on the new
features and functionality of our new games
and product lines, and we have developed a
comprehensive marketing and communications
strategy to highlight the “new” WMS.
Our success has always been, and will
always be, about creating great, innovative
games for customers and players. Today, we are
better positioned than ever to deliver on that
promise. We now have a product line of
unprecedented breadth, new games that we
believe will provide our customers with even
higher earnings and technologically advanced
platforms built on quality and product integrity,
all being driven by a passionate, customer-
focused team.
Our vision for the “new” WMS is straightforward: to provide our customers with a broadrange of products with the best performing games on reliable, technologically advanced platforms.
Orr in Ed id in
Execut ive V ice Pres id ent and COO
Br ian Gamache
Pres id ent and CEO
Scott Schwe in furth
Execut ive V ice Pres id ent , CFO
and Treasurer
5W
MS
In
du
st
rie
s In
c. 2
00
3 A
R

6
MANAGEMENT
STRONG f inancial

We prudently managed our business and successfully navigated this rebuilding period without incurring significant f inancial losses.
When our Board of Directors approved
our brand rebuilding program, they did so with
a long-range view of WMS’ market potential.
They endorsed our extensive rebuilding pro-
gram, despite the near-term operating challenges
as they recognized the potential for superior
long-term returns. The Board’s decision was sup-
ported by our historically strong financial posi-
tion, our track record for developing successful
games and by the ongoing revenue-producing
capacity of the brands we license for our gaming
operations product lines.
The concurrent rebuilding of our techno-
logical infrastructure, our product lines, our
human resources and our facilities required
significant financial and personal commitments
during a period of declining revenues. It was
mission critical to maintain a sharp focus
on revenue retention and cost containment.
Consequently, we prudently managed our
business and successfully navigated this
rebuilding period without incurring significant
financial losses.
From an operating perspective, these
objectives compelled us to leverage WMS’ par-
ticipation game assets. We have the second
largest installed base of participation games in
North America—games that generate some of
the industry’s highest net win per day. We
also have a track record for securing high-
profile entertainment brands and for trans-
lating their core entertainment values into
exciting game themes. As a result, in Fiscal
2003 our gaming operations generated more
than $93 million in revenue and almost $72 mil-
lion in gross profit.
The demands of our rebuilding strategy
required a measured, conservative approach to
our balance sheet. Today, nearing the end of our
period of enhanced infrastructure investments,
our balance sheet is stronger than ever, reflect-
ing the proceeds of our recent $115 million pri-
vate offering of convertible subordinated notes.
And this is after we spent $42 million on stock
repurchases since January 2002 and invested an
additional $24 million in incremental research
and development efforts in Fiscal 2003 over
Fiscal 2001.
Further, the strength of our balance sheet
provides us with the flexibility to fund future
growth opportunities. We are actively looking
to acquire new brand licenses to support our
game development efforts. We will also consider
acquisitions of complementary business interests
and intellectual properties to support our product
development efforts in the final phases of our
technology improvement plan.
Bob Rogowsk i
V ice Pres id ent o f F inance
and Controll er
Kathle en Mc John
Vice Pres id ent , General Counse l
and Secretary
WM
S In
du
st
rie
s In
c. 2
00
3 A
R
7

8
TECHNOLOGICAL foundation

The key tenet of our technology improvement plan is to redesign our technology based ontwo fundamental principles—quality and product integrity.
Laur i e Lass eter
V ice Pres id ent o f Eng ineer ing and Technology
In today’s rapidly evolving gaming tech-
nology environment, casinos and players demand
responsive and entertaining experiences from
their gaming devices and from the software
that powers them. The key tenet of our technol-
ogy improvement plan is to redesign our tech-
nology based on two fundamental principles—
quality and product integrity. To accomplish
this goal we instilled process, discipline and
accountability into our development efforts.
The ultimate goal is to radically improve
our games and operating system and to be rec-
ognized as a “best-in-class” development organ-
ization for design, engineering and technology.
The technology improvement plan encom-
passed a total re-engineering of our research
and development organization. It began with a
recruiting program aimed at acquiring an experi-
enced engineering management team and staffing
entirely new departments with the expertise to
oversee highly complex processes. We literally
reinvented every aspect of our processes, from
technical and regulatory compliance, to product
requirements, software development, program
management and quality control.
That was followed by the first phase ini-
tiative to upgrade and stabilize our legacy
operating system software. We put a dedicated,
experienced team on the project to make sure
that the systems were defect free and compli-
ant with regulatory quality standards. Our
efforts were rewarded with swift approvals
from regulators.
The second phase of the plan involved
the development of a new, highly flexible
operating system. We co-developed CPU-NXT,
a proprietary new operating platform that we
recently began to introduce to casinos. Notably,
at each stage of the CPU-NXT development
process, we met established project milestones
on time and at the highest quality levels. We
received the first regulatory approval of the
CPU-NXT operating system in September 2003
and expect other approvals to follow within
the next six months.
For the final phase of the improvement
plan we will use the processes, procedures and
discipline now in place to build on CPU-NXT
to develop a next generation operating system
to meet the anticipated needs of the gaming
floor of the future. This development phase,
like the ones before it, will be structured to
achieve the highest quality and product integrity,
and will provide a solid platform on which we
intend to develop even higher earning games
and operational efficiencies for our customers.
With the new processes, procedures and
controls we have put in place, and the suc-
cesses we have achieved to date, we believe we
have made enormous strides toward achieving
our goal of producing a best-in-class develop-
ment organization for design, engineering and
technology.
WM
S In
du
st
rie
s In
c. 2
00
3 A
R
9

10
ADVANTAGE
GAMEinnovation = competitive

Larry Pacey
V ice Pres id ent o f Game Deve lopment
With more game developers and a reduced development cycle, we expect to produce four times the number of games in Fiscal 2004 than in each of the last three f iscal years.
Creating great, innovative games is the
key fiber woven through every aspect of our
rich heritage that spans over 50 years. It is also
the enduring passion of the people who repre-
sent the backbone of our revitalized game
development organization.
At year end, our game design staff stood
at 112 energized people, more than double the
count at the end of Fiscal 2001. We also now
benefit from dramatic improvements in game
development afforded by our new CPU-NXT
operating system, including tools specifically
designed for developing games on CPU-NXT.
With more game developers and a reduced
development cycle, we expect to produce four
times the number of games in Fiscal 2004 as in
each of the last three fiscal years.
From a game design standpoint, CPU-NXT
has opened the door to a world of new oppor-
tunities for future growth. With enhanced
processing power, graphic capability and memory
capacity, our game designers have an exciting
new canvas to paint upon. Even our most pop-
ular legacy games are poised to excel on this
powerful new platform with upgraded graphics
and improved game play and audio.
We have analyzed the demographic and
psychographic attributes of casino players. We
now are able to specifically target games for
the different types of players: volatile games
with infrequent but high payouts, time on
device games with small but steady payouts
and traditional games with moderate payouts
and moderate time on device. Leveraging all
the benefits of CPU-NXT and our ergonomi-
cally friendly, award winning Bluebird gaming
cabinet, we will now deliver games that address
the entire slot floor, instead of the 25% of the
slot floor we previously served. To further
enhance game play and customer satisfaction
we entered into an exclusive agreement to pro-
vide the renowned sound technology of BOSE�
in our Bluebird cabinet.
The upshot is that we will be launching
creative new product lines of mechanical reel
spinning games, video poker games and some
experimental games that are aimed at capturing
new players for our games. In addition, we
expect to offer our first proprietary wide-area-
progressive games starting in July 2004. These
games are expected to be among the most pop-
ular and profitable games on a casino floor.
The innovation in our new games gen-
erates energy and excitement that electrifies
our sales force. It motivates customers. It
intrigues and attracts players. It delivers a com-
petitive advantage. And we expect its impact
to produce improved financial results for stock-
holders and enhance the reputation of our
Company and its employees.
WM
S In
du
st
rie
s In
c. 2
00
3 A
R
11

12
CUSTOMER f irst

With the ability to serve all of the gaming device needs of the typical slot f loor, plus an unprecedented game pipeline, we are well positioned to increase our market share
and enhance returns to our stockholders.
Ron Dinola
Vice Pres ident of
Gaming Operat ions
Seamus McG i l l
Execut ive V ice Pres id ent o f
Worldwide Sales and Market ing
In a customer centric culture like the one
we have developed at WMS, customer partner-
ships are highly valued assets. Maximizing these
relationships is a key element in our ability to
successfully deliver new products to market.
Today we interact with customers on the
basis of shared objectives and returns. We
offer high-earning games and value-added serv-
ice to deliver total customer satisfaction. We
also rely heavily on customers to gather input
and feedback on product and service develop-
ments. For our part, we provide updates about
our operating system and game design to our
customers, and we frequently invite customers
to our technology campus in Chicago. Here
they can see first-hand our people and processes
in action and they provide us with important
input to help guide our business strategies to
better serve their future needs.
The same dialogue-driven approach applies
to our relations with gaming regulators. As a
prominent game developer, we are part of a
triangle of interests in our industry, together
with casino operators and regulators. It is criti-
cal that we keep lines of communication open.
Consequently, we now manage the day-to-day
regulatory relationships with these industry
participants on a decentralized, regional basis
rather than centrally from our Chicago facilities.
We now have the proper infrastructure in place
to actively communicate and partner with the
regulatory community.
Customers tell us they are anxious to have
a broad range of choices for games and products
to maximize the profits of their slot floors.
With our rich history in providing high-earning
games, we look forward to enhancing our
brand image with all of our exciting new
games and products coupled with the enhanced
features and functionality of our new CPU-NXT
operating system and Bluebird gaming cabinets.
Now, with the ability to serve all of the gaming
device needs of the typical slot floor, plus an
unprecedented game pipeline, we are well posi-
tioned to increase our market share and enhance
returns to our stockholders.
WM
S In
du
st
rie
s In
c. 2
00
3 A
R
13
14
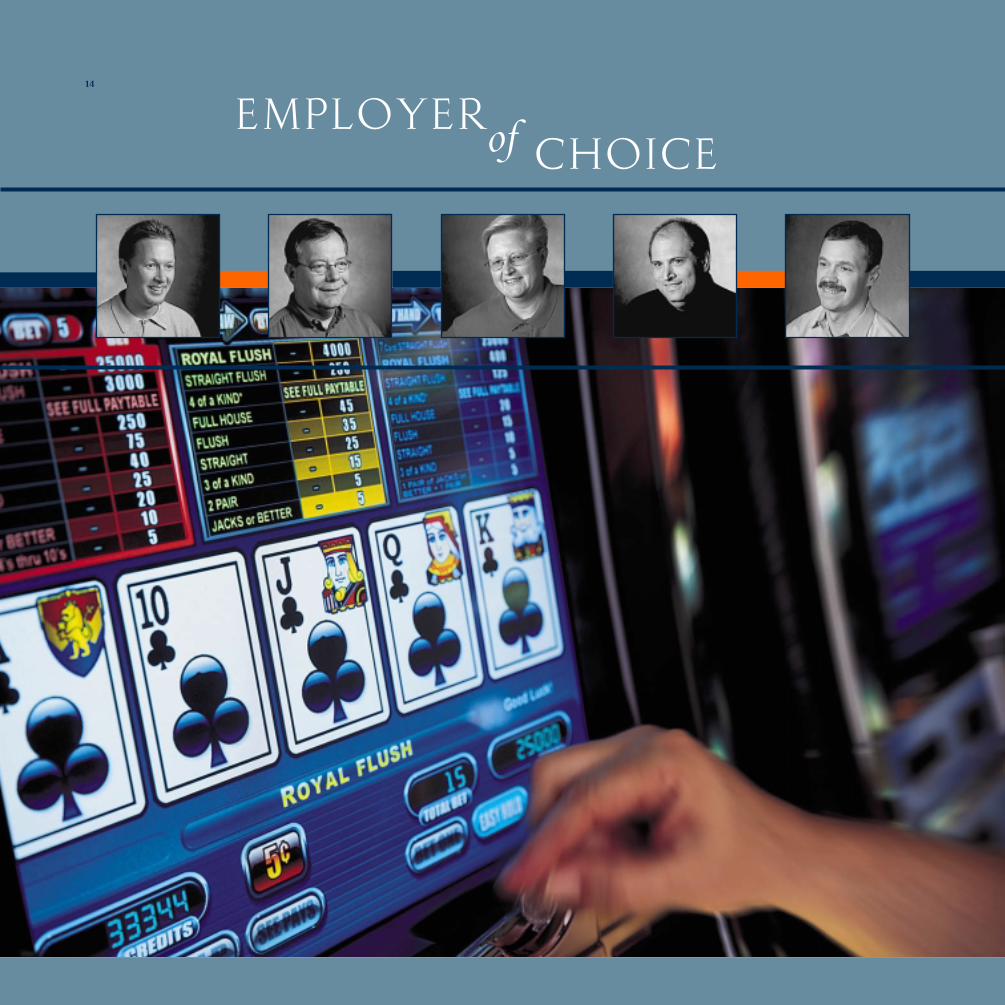
EMPLOYERofCHOICE
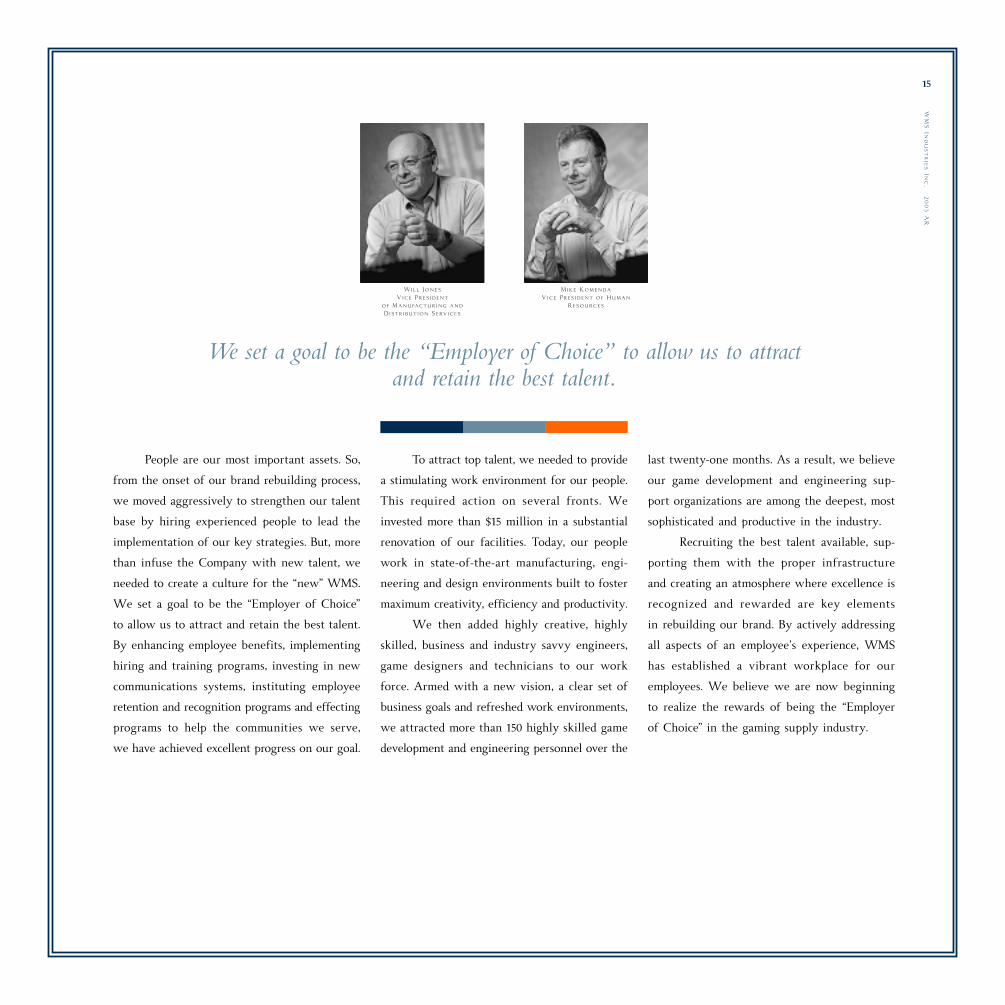
Will Jones
V ice Pres id ent
o f Manufactur ing and
D i str i but ion Serv ices
M ike Komenda
Vice Pres id ent o f Human
Resources
We set a goal to be the “Employer of Choice” to allow us to attract and retain the best talent.
People are our most important assets. So,
from the onset of our brand rebuilding process,
we moved aggressively to strengthen our talent
base by hiring experienced people to lead the
implementation of our key strategies. But, more
than infuse the Company with new talent, we
needed to create a culture for the “new” WMS.
We set a goal to be the “Employer of Choice”
to allow us to attract and retain the best talent.
By enhancing employee benefits, implementing
hiring and training programs, investing in new
communications systems, instituting employee
retention and recognition programs and effecting
programs to help the communities we serve,
we have achieved excellent progress on our goal.
To attract top talent, we needed to provide
a stimulating work environment for our people.
This required action on several fronts. We
invested more than $15 million in a substantial
renovation of our facilities. Today, our people
work in state-of-the-art manufacturing, engi-
neering and design environments built to foster
maximum creativity, efficiency and productivity.
We then added highly creative, highly
skilled, business and industry savvy engineers,
game designers and technicians to our work
force. Armed with a new vision, a clear set of
business goals and refreshed work environments,
we attracted more than 150 highly skilled game
development and engineering personnel over the
last twenty-one months. As a result, we believe
our game development and engineering sup-
port organizations are among the deepest, most
sophisticated and productive in the industry.
Recruiting the best talent available, sup-
porting them with the proper infrastructure
and creating an atmosphere where excellence is
recognized and rewarded are key elements
in rebuilding our brand. By actively addressing
all aspects of an employee’s experience, WMS
has established a vibrant workplace for our
employees. We believe we are now beginning
to realize the rewards of being the “Employer
of Choice” in the gaming supply industry.
WM
S In
du
st
rie
s In
c. 2
00
3 A
R
15

TABLE of CONTENTSf inancial
Selected Financial Data 17
Management’s Discussion and Analysis of Financial Condition and Results of Operations 18
Quantitative and Qualitative Disclosures About Market Risk 27
Controls and Procedures 28
Market for Registrant’s Common Equity and Related Stockholder Matters 28
Certif icate of Chief Executive Officer and Chief Financial Officer and Audit and Ethics Committee Report 29
Report of Independent Auditors 30
Consolidated Balance Sheets 31
Consolidated Statements of Operations 32
Consolidated Statements of Stockholders’ Equity and Comprehensive Income 33
Consolidated Statements of Cash Flows 34
Notes to Consolidated Financial Statements 35��
��
��
��
��
��

Selected FINANCIAL DATA17
WM
S In
du
st
rie
s In
c. 2
00
3 A
R
WMS Industries Inc.
Fiscal Year Ended June 30, 2003 2002 2001 2000 1999
(in thousands, except per share amounts)
STATEMENT OF OPERATIONS DATA:Revenues $178,726 $174,694 $263,772 $217,629 $126,524
Operating income (loss) (17,610) 12,609 44,239 67,984 10,678
Income (loss) from continuing operations before income taxes (15,031) 15,450 49,987 71,438 14,203
Provision (benefit) for income taxes (6,744) 5,596 18,069 27,016 5,397
Income (loss) from continuing operations (8,287)(1) 9,854(3) 31,918(4) 44,422(5) 8,806(6)
Discontinued operations, net of applicable income taxes:Pinball and cabinets segment — — 4,409 (13,539) (4,332)Contract manufacturing segment — — — (1,077) 779
Net income (loss) $ (8,287) $ 9,854 $ 36,327 $ 29,806 $ 5,253
Basic earnings per share of common stock:Income (loss) from continuing operations $ (0.27)(1) $ 0.31(3) $ 1.01(4) $ 1.45(5) $ 0.30(6)
Net income (loss) $ (0.27) $ 0.31 $ 1.15 $ 0.97 $ 0.18
Basic shares outstanding 30,382 32,054 31,557 30,615 29,308
Diluted earnings per share of common stock:Income (loss) from continuing operations $ (0.27)(1) $ 0.30(3) $ 1.00(4) $ 1.42(5) $ 0.30(6)
Net income (loss) $ (0.27) $ 0.30 $ 1.13 $ 0.95 $ 0.18
Diluted shares outstanding 30,382 32,542 32,050 31,322 29,511
As of June 30, 2003 2002 2001 2000 1999
(in thousands)
BALANCE SHEET DATA:Cash and cash equivalents $ 99,640(2) $ 31,421 $ 14,963 $ 19,869 $ 58,669Short-term investments 58,341 72,909 71,524 60,800 —Working capital 220,916 171,048 173,083 146,321 117,369Total assets 350,976 281,165 278,482 239,030 238,079Long-term debt 100,000(2) — — — —Stockholders’ equity 221,185 259,528 256,386 205,420 172,079
(1) Loss from continuing operations for f iscal 2003 includes: (i) an after-tax charge of $1.7 million to write-off a technology license agreement obligation that we no longer intend toimplement as an alternative operating system, (ii) an after-tax charge of $1.0 million related to an estimated impairment of the SURVIVOR� intellectual property license and related inventory, (iii) an after-tax charge of $2.2 million related to the purchase of rights to restricted stock at a discount from market value, (iv) an after-tax charge of $2.1 million to write-off inventory and distribution rights for RAPID ROULETTE�, and (v) an after-tax benefit of $0.7 million in the quarter ended March 31, 2003 andan after-tax charge of $0.6 million in the quarter ended June 30, 2003, for tax adjustments resulting from finalizing prior year tax returns.
(2) Reflects the receipt of the net proceeds from our June 2003 issuance and sale of $100 million of 2.75% convertible subordinated notes due July 15, 2010. Subsequent to thebalance sheet date, on July 3, 2003, we issued an additional $15 million of these notes upon exercise of the overallotment option in the note purchase agreement.
(3) Income from continuing operations for f iscal 2002 includes an after-tax charge of $0.8 million for employee separation costs.(4) Income from continuing operations for f iscal 2001 includes an after-tax charge of $13.0 million related to an executive buyout agreement, and an after-tax charge of
$2.3 million for the costs of relocating our manufacturing and executive off ices to Waukegan, Illinois during the year.(5) Income from continuing operations for f iscal 2000 includes an after-tax reversal of an excess accrual of $9.7 million related to patent litigation, and an after-tax charge of
$1.2 million from our 1998 spin-off of Midway Games Inc., or Midway, related to the adjustment of compensatory stock options.(6) Income from continuing operations for f iscal 1999 includes an after-tax charge of $1.9 million from our 1998 spin-off of Midway related to the adjustment of compensatory
stock options.

SIGNIFICANT EVENTS AND TRENDS
Technology Improvement Plan
In January 2002, we began to execute a three-part technology
improvement plan to stabilize and modernize our operating system
software that runs our gaming devices.
In the first phase of the plan, we improved the stability of
our operating system by introducing two upgrades, version 2.57 for
hopper-based games and version 2.59 for printer-based games.
Version 2.57 was approved by Mississippi regulators in June 2002
and has now been approved by all six of the North American
gaming labs. Four jurisdictions mandated that we upgrade all of
their WMS Gaming devices to version 2.57: Mississippi, Nevada,
Puerto Rico and Ontario, Canada. We completed the upgrade of
the hopper gaming devices in casinos to version 2.57 in Mississippi
in June 2002, Puerto Rico in December 2002, Nevada in January
2003 and Ontario in August 2003. Regulatory approval of the
version 2.57 upgrade resulted in our obtaining our first new game
approvals in Nevada and Mississippi in over 9 months. Since its
implementation, the 2.57 version has been substantially more
stable than previous software versions. Other regulators could
require upgrades in the future. We are making version 2.57 avail-
able in other jurisdictions as an optional upgrade.
Version 2.59, our printer upgrade version, was approved by
Gaming Laboratories Inc., or GLI, in March 2003, and the Nevada
gaming authorities in September 2003. We have installed version
2.59 in several riverboat and Native American casinos which use
GLI and are currently upgrading our printer gaming machines
installed in casinos in Nevada to version 2.59. Nevada is currently
the only jurisdiction requiring all printer games be upgraded to
version 2.59. Other regulators may require upgrades in the future,
and we are making version 2.59 available in other jurisdictions as
an optional upgrade.
Despite this progress in stabilizing our legacy operating sys-
tems, we anticipate that our revenues from sales of new gaming
devices through the December 2003 quarter will improve only
modestly over the levels experienced in fiscal 2003, as customers
await the introduction of our new operating system and platform.
We expect continued strength from game conversion revenues
in the next six months, as operators seek the benefits of our
new games.
The second phase of our technology improvement plan is
to introduce a new operating system and circuit board, and the
plan continues on schedule. Called CPU-NXT, the new operating
system contains features and functionality currently demanded by
our customers that our existing platform lacks. In order to mitigate
risk, we initially adopted a dual path development strategy for
CPU-NXT. We have an internally-developed version of CPU-NXT
and an alternative version of CPU-NXT being developed externally
by SDG. Both versions have been submitted to the six major
North American gaming labs. As a result of the positive response
from the regulators to the first submission of the CPU-NXT ver-
sion designed by SDG, along with its superior technology, which
facilitates more rapid game development and ease of future evolu-
tion, we have elected to commercialize the SDG-developed version
of CPU-NXT instead of the internally-developed version.
We received GLI approval of CPU-NXT in September 2003
and expect to receive approvals from the remaining North American
gaming labs by March 2004. We submitted nine new games on
CPU-NXT to GLI in August 2003 and received approvals for all of
these games in September 2003. With the approval for CPU-NXT
and new games in hand, we have begun selling CPU-NXT upgrade
kits to those customers who want all the features and functional-
ity of the new operating system without the cost of purchasing a
new cabinet. We expect first shipment of these kits in October
2003. We expect to receive approval from GLI on our new
Bluebird cabinet in November 2003, with the remaining North
American lab approvals expected by March 2004. We believe that
some of our customers may wait to purchase our gaming devices
until after we begin to offer CPU-NXT in our new cabinet design,
Bluebird. CPU-NXT and Bluebird include additional features and
functionality desired by our customers that are lacking in the ver-
sion 2.57 and 2.59 operating systems and our current cabinet.
MANAGEMENT’S DISCUSSION and Analysis of Financial Condition and Results of Operations18
WMS Industries Inc.
19W
MS
In
du
st
rie
s In
c. 2
00
3 A
R
We are evaluating specifications and requirements for an
even more advanced operating system that will be developed in
the long-term, third phase of the technology improvement plan.
We continue to refine the design and specifications to incorporate
additional features we desire for this platform and have recently
begun allocating more resources to this longer-term effort.
New Products and Licenses
In December 2002 and January 2003, we received approval
for new versions of the MONOPOLY� branded games in Nevada
and Mississippi, version 1.5 of our HOLLYWOOD SQUARES�
themed game for the Nevada, riverboat and Native American
markets, and our PAC-MAN� branded game in Mississippi. In
the March 2003 quarter, we received additional approvals for
the following game themes: PAC-MAN FRENZY�, HOLLYWOOD
SQUARES version 1.5, and the first approvals of HOLLYWOOD
SQUARES version 2.0, called THE CENTER SQUARE�. We also
received the first approvals of the next version of our MONOPOLY
branded series, called FREE PARKING�, ahead of schedule. With
these new approvals, we were able to update a portion of the
installed base of games in the June 2003 quarter, which resulted in
our average revenue per day increasing sequentially in the June
2003 quarter from the March 2003 quarter by 12%. We expect
additional approvals for new game themes for these participation
game series throughout fiscal 2004.
We submitted the first version of our new mechanical reel-
spinning game platform, developed for use on our Bluebird
cabinet, to regulators in February 2003. We have now received
approvals from three of the six North American gaming labs on
the first submission and are preparing for a field trial in another
jurisdiction. We expect to submit the marketable version of this
product line to the six North American gaming labs in October
2003 and expect to receive the first approvals for this platform in
April 2004.
We expect to submit the marketable version of the Bluebird
cabinet to the six North American gaming labs in October 2003
and we expect first approval from GLI in November 2003. With
approvals for CPU-NXT, new games and the Bluebird cabinet,
we expect to ship our first complete new gaming devices in
December 2003.
In April 2003, the Nevada Gaming Commission approved us
as an operator of inter-casino linked systems, which was the first
of several key steps in launching our proprietary wide-area pro-
gressive, or WAP, system. A WAP links multiple gaming devices
in multiple locations. We have since submitted the first associated
equipment components of our WAP system to the Nevada and GLI
gaming labs. Our WAP system will require three sets of approvals:
• an associated equipment approval for the linked system
itself, which we have recently submitted to the Nevada
and GLI gaming labs;
• a WAP-enabled gaming device approval; and
• approval of the game theme.
We expect to begin the field trial of our WAP system at
the beginning of calendar 2004, and to receive final regulatory
approvals late in the June 2004 quarter, targeting product launch
in July 2004.
Other Recent Matters
On June 25, 2003, we issued $100 million aggregate principal
amount of 2.75% convertible subordinated notes due July 15, 2010
in a private offering to qualified institutional buyers, and granted
to the initial purchasers of the notes an option to purchase up to
an additional $15 million aggregate principal amount of notes,
which they exercised on July 3, 2003. The notes are convertible, at
the option of the holders, into shares of our common stock at a
conversion price of $19.78. The notes are non-callable for the
entire seven-year term. The net proceeds of the offering will be
used for working capital, capital expenditures and other general
corporate purposes, which may include acquisitions and repurchase
of shares of our common stock under our existing share buyback
program. In June 2003, upon completion of the offering, the
authorization of the existing share buyback program was expanded
by $15 million to $25 million.
(continued)

As part of our technology improvement plan, we have pur-
sued alternative development strategies for each phase of the plan,
including licensing technology from third parties. For the short-term
phase of the plan, our internally developed version 2.57 and 2.59
operating systems have operated successfully to date in casinos in
jurisdictions where they have been installed and, as a result, we
no longer intend to implement an alternative operating system
which was originally licensed, among other uses, to provide a
back-up during the short-term phase of the plan. In fiscal 2003, we
recorded a pre-tax charge of $2.8 million to write-off this license
agreement obligation.
We have an agreement with IGT for the operation of
SURVIVOR branded games on IGT’s wide-area progressive system.
Under this agreement we record in our consolidated financial
statements our 50% proportionate share of revenues and costs, and
all of the assets we own and liabilities we incur, in connection
with the operating activities under this agreement. In fiscal 2003,
we expensed $0.4 million pre-tax related to an estimated impair-
ment of the SURVIVOR intellectual property license, and $1.1 mil-
lion pre-tax to write down the SURVIVOR inventory to its net
realizable value. At June 30, 2003, the remaining net book value of
SURVIVOR related inventory and intellectual property assets and
commitments for both companies was approximately $2.6 million.
On May 7, 2003, we purchased rights to 250,000 restricted
shares of our common stock for a purchase price of $3.5 million.
This share price reflected a discount of $0.50 per share from the
closing market price on May 6, 2003. We recorded a pre-tax
charge in our statement of operations of $3.5 million to reflect this
transaction. These restricted shares had been issued March 1, 2002
to Mr. Louis J. Nicastro, our Chairman of the Board of Directors
and a non-employee director in consideration for his service as
Chairman of the Technology Committee of the Board of Directors,
which was established to provide enhanced oversight of the timely
completion of the first phase of our technology improvement plan.
On June 17, 2003, we announced that we would allow our
agreement with Stargames Corporation Pty. Ltd., for exclusive
North American distributorship rights to their RAPID ROULETTE
table gaming product, to expire on June 30, 2003. We encountered
several significant obstacles in bringing this product to market,
including regulatory, technical, and customer acceptance issues. As
a result of the expiration of the agreement, we recorded a non-
cash, pre-tax charge of $3.4 million in fiscal 2003 to write down
RAPID ROULETTE inventory to net realizable value and write-off
distribution rights assets.
Our effective income tax rate for fiscal 2003 includes a small
net benefit stemming from the adjustment and settlement of prior
year income tax returns with the Internal Revenue Service and the
resulting impact of various tax agreements between WMS and its
former subsidiary, Midway. We have now fully reserved our tax
advance receivables from Midway due to the uncertainty of the
timing of the payback period. In addition, due to the increase in
our foreign business and research and development spending, the
effective tax rate was favorably impacted by larger benefits from
increased export sales and research and development tax credits.
CRITICAL ACCOUNTING POLICIES
Inventory Obsolescence
We value inventory based on estimates of potentially excess
and obsolete inventory after considering forecasted demand and
forecasted average selling prices. However, forecasts are subject to
revisions, cancellations and rescheduling. In fiscal 2004, we expect
to introduce a new gaming platform, and it is reasonably possible
that this will accelerate the obsolescence of existing product lines.
In addition, demand for parts inventory is subject to technical
obsolescence. Inventory on hand in excess of forecasted demand is
written down to net realizable value. Actual demand may differ
from anticipated demand, and such differences may have a mate-
rial effect on the financial statements.
Participation Gaming Machine Depreciation
We depreciate our participation gaming machines and top
boxes over a two-year useful life to a small salvage value. A mate-
rial adverse impact could occur if the actual useful life of the
participation games or top boxes is less than what was used in
MANAGEMENT’S DISCUSSION and Analysis of Financial Condition and Results of Operations20

21W
MS
In
du
st
rie
s In
c. 2
00
3 A
R
estimating depreciation expense, or if actual salvage value is less
than the anticipated salvage value. We plan to introduce our new
Bluebird cabinet style participation games in the June 2004 quarter.
We anticipate depreciating the Bluebird gaming devices over three
years with a small salvage value, and the top box over one year.
Intellectual Property Valuation
We license intellectual property from third parties that we
use in some of our gaming machines. As part of our contracts
with the licensors, we typically provide a guaranteed minimum
and prepayment of royalties and license fees, usually at the time
the contract is signed, even though the product may not be intro-
duced until months or years later. We capitalize the prepaid
royalty and license fees as other assets. At June 30, 2003, the min-
imum guaranteed royalty payments totaled $21.0 million of which
$16.7 million has been paid and the balance is payable over various
periods up to three years. In addition, the contracts provide for an
additional $7.8 million of contingent royalty payments based upon
future events occurring. Total prepaid royalties at June 30, 2003
were $13.2 million of which $2.1 million is in other current assets
and $11.1 million is in other assets. Subsequent to June 30, 2003,
we entered into new licensing agreements with guaranteed mini-
mum royalties and commitments of $38.8 million. We begin to
amortize prepaid royalties when the product is introduced, based
upon contractual terms of the license agreements and as appro-
priate to match costs and related revenues. If we determine that
the products we develop will not fully recover the guaranteed
minimum amounts, we would record an immediate charge against
earnings once such determination is made.
Licensed Technology Valuation
As part of our technology improvement plan, as discussed
above, we have pursued alternative strategies for each phase of the
plan, including licensing technologies from third parties. At June
30, 2003, our minimum guaranteed payments related to technology
alternatives totaled $5.4 million, which had been paid as advances
with an additional $6.4 million of contingent royalty payments
subject to future events, and these amounts are included in the
amounts described above. If we determine that we will not realize
the value of the guaranteed commitment for a particular licensed
technology alternative, we will record an immediate charge against
earnings, at the time of our determination, of up to $11.8 million if
all of the alternatives were to have no further value to us.
Accrued Liabilities
We accrue expenses related to employee benefits, software
anomalies and other contingencies based upon our best estimates
of the costs that are probable of occurrence and reasonably
estimable. These estimates are updated monthly based on current
information. However, changes in estimates or actual expenses
may exceed accrued amounts.
RECENTLY ISSUED ACCOUNTING STANDARDS
We have adopted SFAS No. 143, SFAS No. 144, SFAS No. 146,
SFAS No. 148, and FASI No. 45 as discussed in Note 2 to our finan-
cial statements. Such adoption did not have a material effect on
our balance sheet, statement of operations or cash flows.
OFF-BALANCE SHEET ARRANGEMENTS AND
CONTRACTUAL OBLIGATIONS
We are not dependent on off-balance sheet financing
arrangements to fund our operations. We utilize financing arrange-
ments for operating leases of equipment and facilities, none of
which are in excess of our current needs. We also have minimum
guaranteed royalty payments for intellectual property used in our
gaming machines. Our obligations under these arrangements at
June 30, 2003 are as follows:Payment Due by Period
Contractual Less than 1–3 3–5 More thanObligations Total 1 Year Years Years 5 Years
(in thousands)
Long-Term Debt $100,000 — — — $100,000Operating Leases 2,230 $1,030 $1,177 $ 23 —Minimum Royalty
Payments 5,151 1,460 3,191 500 —
Total $107,381 $2,490 $4,368 $523 $100,000
(continued)
Subsequent to June 30, 2003, we entered into amended
licensing agreements with contractual obligations totaling $38.8
million, due as follows: $5.4 million less than 1 year, $9.7 million
1–3 years, $9.2 million 3–5 years, $14.5 million more than 5 years.
The total potential royalty commitments, including payments
already made and those contingent upon future events, decreased
from $17.2 million at June 30, 2002 to $13.0 million at June 30, 2003.
Please refer to Note 11 to our financial statements in this report
for additional details. We do not have any special purpose entities
for investment or the conduct of our operations. We do have
an agreement with IGT related to the operation of SURVIVOR
branded participation games on its wide-area progressive system,
under which we record in our consolidated financial statements
our 50% proportionate share of revenues and costs from operating
activities under that agreement, and the full value of assets we
own and liabilities we incur in connection with the operating
activities. We have not entered into any derivative financial
instruments, although we have granted stock options and restricted
stock to employees, officers, directors and consultants, and war-
rants to a licensor. We do not currently have any significant firm
purchase commitments for raw material inventory.
LIQUIDITY AND CAPITAL RESOURCES
We believe that cash and cash equivalents and short-term
investments of $158.0 million at June 30, 2003, exclusive of $2.3
million of restricted cash, along with our available $50.0 million
bank revolving line of credit that extends to May 21, 2004, and
cash flow from operations, will be adequate to fund the antici-
pated level of expenses, capital expenditures, cash to be invested
in participation games, and the levels of inventories and receiv-
ables required in the operation of our business for the next
twelve months.
Our cash balance on June 30, 2003 reflects $100 million we
received in a private placement of 2.75% convertible subordinated
notes due July 15, 2010. In July, subsequent to the end of fiscal
2003, we received an additional $15 million upon the exercise of
the overallotment option granted to the initial purchaser of the
notes. Net proceeds from the sale of the notes will be used for
working capital, capital expenditures and other general corporate
purposes, which may include acquisitions or repurchases of shares
of our common stock under our existing $25 million stock buy-
back program.
Our short-term investments primarily consist of Auction
Market Preferred Stocks stated at cost, which approximates market
value. These investments generally have no fixed maturity date
but most have dividend reset dates every 49 days or more. These
investments can be liquidated under an auction process on the
dividend reset dates subject to a sufficient number of bids being
submitted. Our policy is to invest cash with issuers that have a
high credit rating and to limit the amount of credit exposure to
any one issuer.
Due to our operating loss in fiscal 2003, we have $7.7 million
of current income tax receivables on our balance sheet as of June
30, 2003. This tax receivable is based on our ability to receive tax
refunds from applying our fiscal 2003 loss against prior years’
income and for refunds of tax payments made in fiscal 2003.
We also have $9.2 million of deferred tax assets on our bal-
ance sheet as of June 30, 2003. These represent taxable temporary
differences expected to reverse in future years, and tax credits and
operating losses generated in fiscal 2003 that can be claimed on
future returns to reduce current tax due in those years. We believe
it is more likely than not that we will realize the benefits of these
deferred tax assets. On this basis, we have not provided any valu-
ation allowance as of June 30, 2003. However, valuation allowances
could be recorded against these deferred tax assets in future peri-
ods if our future estimates of amounts realizable are reduced.
MANAGEMENT’S DISCUSSION and Analysis of Financial Condition and Results of Operations22

23W
MS
In
du
st
rie
s In
c. 2
00
3 A
R
Cash provided by operating activities was $20.0 million for
fiscal 2003, which was $40.1 million less than the $60.1 million of
cash provided for fiscal 2002. The decrease was due to an $18.2
million decrease in net income from $9.9 million net income in
fiscal 2002 to a net loss of $8.3 million in fiscal 2003 and a $24.4
million decrease in changes in operating assets and liabilities from
$25.9 million cash inflow in fiscal 2002 to $1.5 million cash inflow
in fiscal 2003, partially offset by a $2.8 million increase in depre-
ciation expense. We also recorded a $1.8 million non-cash charge
for the write-off of an operating system license agreement in the
current year period, and $1.6 million of other non-cash expenses
related to intellectual property impairment charges offset by $3.5
million of deferred income taxes. The cash flow from changes in
operating assets and liabilities for fiscal 2003 was an inflow of
$1.5 million due to an $8.3 million increase in accounts payable and
accrued liabilities, a $2.2 million decrease in inventory, largely off-
set by a $10.1 million increase in other assets from the comparable
balances at June 30, 2002. The largest component of the increase in
other assets was a $5.6 million increase in long-term prepaid roy-
alties due to advance payments made on brand and technology
licensing agreements. The increase in current liabilities includes a
$4.0 million accrued liability to our former subsidiary, Midway,
related to our tax sharing and tax separation agreements. Cash
inflow for fiscal 2002 was primarily due to a decrease in receiv-
ables, as a result of lower sales, and inventories, partially offset by
an increase in other current assets. We have not experienced sig-
nificant bad debt expense in any of the periods presented. We
anticipate continued low levels of cash provided by operating
activities over the next six months due to decreased game sales
and higher research and development expenses to implement our
technology improvement plan and product line expansion plans.
Cash used for investing activities was $20.7 million for fiscal
2003, compared with $36.5 million for fiscal 2002. Cash used for
the purchase of property, plant and equipment for fiscal year 2003
was $13.6 million compared with $16.3 million for the comparable
prior-year period. This decrease is due to lower renovation costs in
the current fiscal year related to converting our Chicago facility
into a technology campus, partially offset by increased costs related
to the ongoing implementation of our new enterprise resource
planning information system. Cash used for additions to participa-
tion games was $21.6 million and $18.5 million for fiscal 2003 and
2002, respectively. The participation game expenditures in fiscal
2003 and fiscal 2002 reflect a relatively greater number of top box
conversions and higher component costs. We expect to invest
more in participation games in fiscal 2004 than in fiscal 2003 as
we begin to convert our installed base to our new Bluebird cabinet
and prepare for the launch of our proprietary WAP system. We
used $2.5 million of cash in fiscal 2002 for the acquisition of
Bigfoot Software Research and Development, LLC, which has
allowed us to design and develop a proprietary wide-area progres-
sive system. We also received $2.3 million in fiscal 2002 on the
sale of land and a building to Midway that they had previously
been renting from us. Net cash of $14.6 million was provided by
the redemption of short-term investments in fiscal 2003, compared
to $1.4 million used for the net purchase of short-term investments
in fiscal 2002.
Cash provided by financing activities was $68.1 million for
fiscal 2003, compared to cash used in financing activities of $7.5
million in fiscal 2002. In fiscal 2003, we received $100 million from
a private offering of 2.75% convertible subordinated notes due July
15, 2010 and incurred $3.5 million in debt issuance costs. We
received $0.5 million from the exercise of options to purchase
common stock for fiscal 2003, compared with $1.2 million for fis-
cal 2002 due to a lower number of option exercises. We purchased
$28.9 million of outstanding common stock in fiscal 2003, com-
pared to $8.6 million of outstanding common stock purchases in
fiscal 2002. The increase in stock purchases in fiscal 2003 compared
to fiscal 2002 was based on additional stock repurchase plans
authorized by the Board of Directors.
(continued)

In August 2002, we completed our twelve-month, $20 million
common stock share repurchase program that had been authorized
by our Board of Directors in January 2002. In September 2002, our
Board of Directors authorized an additional twelve-month, $10
million common stock share repurchase program, which we com-
pleted in the March 2003 quarter. In April 2003, our Board of
Directors authorized a new twelve-month plan to repurchase up to
an additional $10 million of our common stock from time to time
in open market or privately negotiated transactions. In June 2003,
in conjunction with the completion of our $100 million convert-
ible subordinated notes offering, our Board of Directors authorized
an expansion of the existing $10 million common stock repurchase
plan to $25 million. During the fiscal year ended June 30, 2003,
we repurchased 2,348,900 shares for an aggregate price of $28.9
million under all of these programs. Since the inception of the
first common stock repurchase program in January 2002, we have
repurchased 3,193,500 shares of our common stock, or 9.9% of our
previously outstanding shares, for $42.5 million at an average price
of $13.31 per share. As of September 1, 2003, we had $12.5 million
remaining under the latest buyback program authorized by our
Board of Directors. This program could further reduce our cash
balance and number of outstanding common shares through April
2004. The timing and actual number of shares to be purchased, if
any, will depend on market conditions.
RESULTS OF OPERATIONS
Fiscal 2003 Compared with Fiscal 2002
Consolidated revenues increased 2.3% to $178.7 million in fis-
cal 2003 from $174.7 million in fiscal 2002. Total revenue increased
$4.0 million: $10.2 million from increased product sales partially
offset by a $6.2 million decrease in gaming operations revenue.
We shipped 6,867 video and mechanical reel-spinning games in
fiscal 2003, resulting in product and parts sales of $85.7 million
versus 6,916 gaming devices shipped and $75.6 million of product
and parts sales in fiscal 2002. Gaming device sales were flat as
higher sales to customers outside North America were offset
by lower domestic sales as we believe some customers delayed
purchases until we introduce our new game platform and cabinet
in fiscal 2004. Parts, used games, OEM and game conversion
revenues, which are included in product sales revenues, increased
65.0% in the current fiscal year to $28.6 million, compared to
$17.3 million in the prior fiscal year. The average sales price
decreased from $8,419 in the prior fiscal year to $8,318 in the current
fiscal year, primarily due to a change in our mix of products sold.
The decrease in gaming operations revenue was due to a
decrease in the average installed base of participation games to a
total of 5,509 units in fiscal 2003, compared to 5,790 units installed
in fiscal 2002, while the actual installed base declined from 6,162
units at June 30, 2002 to 5,086 units at June 30, 2003. We believe
the decline in the installed base resulted from three factors. First,
in the first half of fiscal 2003, the average net win of our partici-
pation games decreased and casino operators removed games as we
were unable to obtain approvals for new games as gaming regulators
reviewed upgrades to our legacy operating system. Second, we
removed participation games from locations that had low net rev-
enue per day. Third, the decline in the installed base resulted from
our current gaming platform not supporting key features and func-
tionality that casino operators now demand, such as some cashless
gaming options, multi-denomination and tokenization, as well as
an increasingly competitive environment. Following new participa-
tion game approvals in the March and June 2003 quarters, we were
able to partially refresh our installed base of participation games
in the June 2003 quarter. As a result, average net revenue per day
per machine increased 11.7% from $37.10 in the March 2003 quarter
to $41.44 in the June 2003 quarter. For fiscal 2003, the net revenue
per day decreased 2.1% to $39.19 from $40.05.
Consolidated gross profit in fiscal 2003 decreased 3.6% to
$105.6 million from $109.6 million in fiscal 2002. The gross margin
MANAGEMENT’S DISCUSSION and Analysis of Financial Condition and Results of Operations24

25W
MS
In
du
st
rie
s In
c. 2
00
3 A
R
percentage decreased from 62.7% in fiscal 2002 to 59.1% in fiscal
2003. The decrease in the gross margin percentage resulted from
the impact of higher margin gaming operations revenues being
52.0% of total revenue in fiscal 2003 versus 56.7% of total revenues
in fiscal 2002. The gross margin on product sales increased from
33.8% in fiscal 2002 to 39.2% in fiscal 2003 due to higher produc-
tion volumes and higher margin products representing a greater
percentage of product sales revenue, partially offset by a decrease
in the average sales price per unit. The gross profit margin on
gaming operations revenues decreased from 84.8% in fiscal 2002 to
77.4% in fiscal 2003 due to a $1.1 million write down of SURVIVOR
inventory, a $0.9 million write down of RAPID ROULETTE inven-
tory upon the expiration of the distribution agreement, higher roy-
alty rates payable to licensors and the decrease in the average net
revenue per day for participation games.
Research and development expenses increased $14.3 million,
or 55.1%, in the current fiscal year to $40.3 million from $26.0 mil-
lion in fiscal 2002 due to the ongoing execution of our technology
improvement plan, while preparing to expand our product offer-
ings and increase the number of games we offer our customers.
The increase was due to increased headcount and higher engi-
neering project and prototype expenditures, and included costs to
adapt our games for distribution to international markets. We
expect sequential quarterly increases in research and development
expenses in the upcoming fiscal year, after which such expenses
should stabilize. During fiscal 2003, we introduced four new games
for sale and six new participation games.
Selling and administrative expenses increased 19.4% from
$47.1 million in fiscal 2002 to $56.2 million in the current
fiscal year. The fiscal 2003 amount includes a $3.5 million pre-tax
charge for the purchase of rights to restricted stock at a discount
from market value, a $2.5 million write-off of the RAPID
ROULETTE distribution rights and higher costs incurred related to
our re-emergence and the implementation of a new enterprise
resource planning information system. We expect that our selling
and administrative expenses will continue to grow as we begin
commercializing our CPU-NXT operating system and Bluebird
cabinet in order to support our re-emergence and expansion into
multiple product lines, which we expect will result in greater
operating activities.
Depreciation and amortization increased during the current
fiscal year to $26.7 million from $23.9 million in the prior fiscal
year. The 11.7% increase in depreciation expense reflects higher
depreciation on our recently renovated Chicago technology cam-
pus, higher equipment cost per participation game unit, and
increased depreciation on video lottery terminals under contract
with state lotteries, partially offset by the 4.9% decrease in the
average installed base of participation games.
Operating loss was $17.6 million in the current fiscal year,
compared to operating income of $12.6 million in the prior fiscal
year. The financial results of the current fiscal year reflect lower
gross profit of $4.0 million, including a $1.1 million write down of
SURVIVOR inventory and a $0.9 million write down of RAPID
ROULETTE inventory upon the expiration of the distribution
agreement, $14.3 million increase in research and development
spending, and a $9.1 million increase in selling and administrative
expense, including a $3.5 million charge from the costs associated
with the purchase of rights to restricted stock at a discount from
market and a $2.5 million write-off of the RAPID ROULETTE
distribution rights. The operating income for fiscal 2002 reflects
$1.3 million of employee separation costs.
The benefit for income taxes was $6.7 million in the current
fiscal year, in contrast to a provision for income taxes of $5.6 mil-
lion in the prior fiscal year. The benefit was due to the pre-tax
loss from continuing operations, and a benefit of $0.7 million from
(continued)

a reduction in fiscal year 2002 taxes as compared to amounts pre-
viously provided, partially offset by a $0.6 million provision stem-
ming from the settlement of prior year income tax returns with
the Internal Revenue Service and the resulting impact of various
tax agreements between us and Midway. The effective tax rate
was 44.9% in fiscal 2003, compared to 36.2% in fiscal 2002. This
effective rate reflects the beneficial tax treatment of increased
export sales, dividend investment income and increased research
and development tax credits.
Our net loss was $8.3 million, or $0.27 per diluted share, in
the current fiscal year, compared to net income of $9.9 million, or
$0.30 per diluted share, in the prior fiscal year. Diluted shares out-
standing decreased by 6.6%, due to our repurchase of common
stock outstanding.
Fiscal 2002 Compared with Fiscal 2001
Consolidated revenues decreased 33.8% to $174.7 million in
fiscal 2002 from $263.8 million in fiscal 2001. Total revenue
decreased $89.1 million: $98.0 million from decreased product sales
partially offset by an $8.9 million increase in gaming operations
revenue. We shipped 6,916 video and mechanical reel type gaming
devices in fiscal 2002, resulting in product and parts sales of $75.6
million versus 19,070 gaming devices shipped and $173.6 million of
product and parts sales in fiscal 2001. Gaming device sales were
lower due to our inability to sell into certain jurisdictions until
the summer of 2002 upgrade of our operating system software was
approved. The average sales price increased from $8,355 in fiscal
2001 to $8,419 in fiscal 2002, primarily due to a change in our mix
of products sold.
The increase in gaming operations revenue was due to an
increase in the installed base of participation games to a total of
6,162 units installed at June 30, 2002, compared to 5,857 units
installed at June 30, 2001. The installed base increased due to
the introduction of three new series of participation games:
HOLLYWOOD SQUARES, PAC-MAN, and SURVIVOR. Average net
revenue per day per machine decreased from $43.76 in fiscal 2001
to $40.05 in fiscal 2002. This decrease resulted primarily from the
lack of approvals for new game titles to refresh the installed base
of MONOPOLY and Puzzle Pays participation games as regulators
awaited approval of the summer of 2002 upgrade of our operating
system software.
Consolidated gross profit in fiscal 2002 decreased 29.4% to
$109.6 million from $155.2 million in fiscal 2001. The gross margin
percentage increased from 58.9% in fiscal 2001 to 62.7% in fiscal
2002. The increase in the gross margin percentage resulted from
the impact of higher margin gaming operations revenues being
56.7% of total revenue in fiscal 2002 versus 34.2% of total revenues
in fiscal 2001. The gross margin on product sales decreased from
44.8% in fiscal 2001 to 33.8% in fiscal 2002 due to lower overall
sales of products. The gross profit margin on gaming operations
revenues decreased slightly from 85.8% in fiscal 2001 to 84.8% in
fiscal 2002 due to higher replacement part and conversion costs on
fully depreciated machines still in service and the lower average
net revenue per day per machine.
Research and development expenses increased $9.6 million,
or 58.0%, in fiscal 2002 to $26.0 million from $16.4 million in fiscal
2001 as we continued to invest in people and technologies to develop
new games, product platforms and operating systems, to execute
on our three-part technology improvement plan, and to pursue our
business strategy to become a full service gaming device provider
to our customers. The increase was due to higher engineering
expenditures and increased headcount, and included costs to adapt
our games for distribution to international markets. We anticipate
that higher staffing levels will allow us to increase the number
of new games we introduce in the coming years. During fiscal
2002, we introduced five new games for sale and four new par-
ticipation games.
Selling and administrative expenses decreased 35.0% from
$72.4 million in fiscal 2001 to $47.1 million in fiscal 2002. The fiscal
MANAGEMENT’S DISCUSSION and Analysis of Financial Condition and Results of Operations26

27W
MS
In
du
st
rie
s In
c. 2
00
3 A
R
2001 amount includes a $20.3 million pre-tax charge for an executive
buyout agreement. Excluding this nonrecurring charge and the
$0.7 million charge in the December 2001 quarter to effect a reduc-
tion in force, selling and administration expenses decreased 11.0%
due to our efforts to manage controllable expenses and the head-
count reductions.
Corporate relocation expenses of $3.7 million in fiscal 2001
represents costs associated with the relocation and centralization
of our corporate headquarters, manufacturing, Chicago regional
distribution and warehousing facilities to Waukegan, Illinois.
Depreciation and amortization increased during fiscal 2002
to $23.9 million from $18.5 million in fiscal 2001 due to the
increased average installed base of participation games and higher
top box costs. The average installed base was 5,790 units for fiscal
2002 compared to 4,850 units for fiscal 2001. The 29.2% increase in
depreciation expense reflects the 19.4% increase in the average
installed base of participation games and more expensive top box
costs, partially offset by a reduction in depreciation on those par-
ticipation games originally installed in fiscal 1999 and 2000 that
have been depreciated to estimated salvage value.
Operating income was $12.6 million in fiscal 2002, compared
to $44.2 million in fiscal 2001. The financial results of fiscal 2001
reflect the pre-tax charge of $20.3 million from the costs associated
with an executive buyout agreement and $3.7 million of costs asso-
ciated with our relocation to Waukegan, Illinois, while the financial
results for fiscal 2002 reflect lower gross profits coupled with
$1.3 million of employee separation costs, higher research and
development costs related to new products and the three-part tech-
nology improvement plan, as well as higher depreciation costs
related to participation games.
The provision for income taxes on continuing operations
decreased to $5.6 million in fiscal 2002 from $18.1 million in fiscal
2001. The decrease was due to lower pre-tax income in fiscal 2002.
The effective tax rate was 36.2% in fiscal 2002, compared to 36.1%
in fiscal 2001. This effective rate reflects the beneficial tax treat-
ment of foreign sourced income, dividend investment income and
tax credits.
Income from continuing operations was $9.9 million, or $0.30
per diluted share, in fiscal 2002, compared to $31.9 million, or
$1.00 per diluted share, in fiscal 2001.
Net income, which includes continuing operations and dis-
continued operations was $9.9 million in fiscal 2002, or $0.30 per
diluted share, compared to $36.3 million, or $1.13 per diluted share
in fiscal 2001.
IMPACT OF INFLATION
During the past three years, the general level of inflation
affecting us has been relatively low. Our ability to pass on future
cost increases in the form of higher sales prices will depend on the
prevailing competitive environment and the acceptance of our
products in the marketplace.
QUANTITATIVE AND QUALITATIVE DISCLOSURES
ABOUT MARKET RISK
We are subject to market risks in the ordinary course of our
business, primarily associated with interest rate and foreign cur-
rency fluctuations. We do not currently hedge either of these
risks, or utilize financial instruments for trading or other specula-
tive purposes.
Interest Rate Risk
We have exposure to interest rate risk from our convertible
subordinated notes and short-term line of credit. The notes are at
a fixed rate and the short-term line of credit is at a variable rate.
As of June 30, 2003, we had $100 million of convertible
fixed-rate debt with an interest rate of 2.75% and a fair value of
$100 million. Using a discounted cash flow model, we currently
estimate that a 50 basis point change in the prevailing market
(continued)

interest rates would impact the fair value of our fixed rate debt by
approximately $3.7 million, but would not be material to cash
flows or future results of operations.
In May 2003, we renewed a $50 million 364-day revolving
line of credit to provide us with additional liquidity to meet our
short-term financing needs. Borrowings under this facility bear inter-
est at a certain percentage above the agent’s prime rate. There were
no outstanding borrowings under this facility as of June 30, 2003.
Foreign Currency Risk
We have subsidiaries in Spain, Canada, South Africa and
Australia for distribution, marketing and development operations.
These subsidiaries transact business in their respective foreign
currencies and are exposed to risks resulting from fluctuations in
foreign currency exchange rates. We estimate that a hypothetical
10% strengthening (or weakening) of the U.S. dollar for fiscal 2003
would have resulted in a pretax loss (or gain) of about $0.4 million.
In addition, we cannot be assured that there will not be restric-
tions of currency movements imposed by foreign governments.
The net assets of these subsidiaries are exposed to foreign
currency translation gains and losses, which are included as a com-
ponent of accumulated other comprehensive loss in stockholders’
equity. Such translation resulted in unrealized gains of $0.3 million
and $0.9 million for fiscal 2003 and 2002, respectively.
CONTROLS AND PROCEDURES
As of the end of the period covered by our report on
Form 10-K, our Chief Executive Officer and our Chief Financial
Officer carried out an evaluation of the effectiveness of the design
and operation of our disclosure controls and procedures, as
required by Exchange Act Rule 13a-15. Based upon that evaluation,
the Chief Executive Officer and Chief Financial Officer concluded
that our disclosure controls and procedures are effective in ensur-
ing that material information about us and our subsidiaries,
including the material information required to be disclosed in our
filings under the Exchange Act, is recorded, processed, summarized
and communicated to them as appropriate to allow timely deci-
sions regarding required disclosure.
MARKET FOR REGISTRANT’S COMMON EQUITY
AND RELATED STOCKHOLDER MATTERS
Our common stock, par value $0.50, trades publicly on the
New York Stock Exchange under the symbol “WMS.” The follow-
ing table shows the high and low sale prices of our common stock
for the two most recent fiscal years, as reported on the NYSE:
High ($) Low ($)
Fiscal Year Ended June 30, 2003First Quarter 16.30 9.28Second Quarter 18.10 11.96Third Quarter 15.82 10.50Fourth Quarter 17.70 12.00
Fiscal Year Ended June 30, 2002First Quarter 32.40 15.50Second Quarter 21.67 16.90Third Quarter 20.95 14.25Fourth Quarter 19.20 12.15
On September 16, 2003, there were approximately 981 hold-
ers of record of our common stock.
No cash dividends were declared or paid on our common
stock during fiscal 2003 or 2002. The payment of future cash divi-
dends will depend upon, among other things, our earnings, antici-
pated expansion and capital requirements and financial condition.
We do not expect to pay cash dividends in the foreseeable future.
We have agreed to make additional payments of interest on
our convertible subordinated notes if we declare a cash dividend
on our common stock. The amount of the payments will be equal
to the cash dividends that would be payable to the holders of
the notes if the holders had converted their notes into shares of
our common stock on the record date for the dividend. However,
no such payment will be made if the dividend that would other-
wise trigger the payment causes an adjustment to the note con-
version rate.
28

CERTIFICATE OF CHIEF EXECUTIVE OFFICER PURSUANTTO 18 U.S.C. SECTION 1350, AS ADOPTED PURSUANT TOSECTION 906 OF THE SARBANES-OXLEY ACT OF 2002
I, Brian R. Gamache, Chief Executive Officer of WMS IndustriesInc., certify that:
1. I have reviewed the annual report on Form 10-K of WMSIndustries Inc.;
2. Based on my knowledge, this annual report does not contain anyuntrue statement of a material fact or omit to state a material fact neces-sary to make the statements made, in light of the circumstances underwhich such statements were made, not misleading with respect to theperiod covered by this annual report; and
3. Based on my knowledge, the financial statements, and other finan-cial information included in this annual report, fairly present in all materialrespects the financial condition, results of operations and cash flows of theregistrant as of, and for, the periods presented in this annual report.
Date: September 24, 2003 Brian R. GamachePresident and Chief Executive Officer
CERTIFICATE OF CHIEF FINANCIAL OFFICER PURSUANTTO 18 U.S.C. SECTION 1350, AS ADOPTED PURSUANT TOSECTION 906 OF THE SARBANES-OXLEY ACT OF 2002
I, Scott D. Schweinfurth, Chief Financial Officer of WMS IndustriesInc., certify that:
1. I have reviewed the annual report on Form 10-K of WMSIndustries Inc.;
2. Based on my knowledge, this annual report does not contain anyuntrue statement of a material fact or omit to state a material fact neces-sary to make the statements made, in light of the circumstances underwhich such statements were made, not misleading with respect to theperiod covered by this annual report; and
3. Based on my knowledge, the financial statements, and other finan-cial information included in this annual report, fairly present in all materialrespects the financial condition, results of operations and cash flows of theregistrant as of, and for, the periods presented in this annual report.
Date: September 24, 2003 Scott D. SchweinfurthExecutive Vice President,
Chief Financial Officer and Treasurer
AUDIT AND ETHICS COMMITTEE REPORTThe Audit and Ethics Committee of our Board of Directors is
composed of three independent directors, as defined in the existing NYSEListed Company Manual, paragraph 303.01(B), and operates under a writ-ten charter adopted by the Board. WMS’ management is responsible forits internal accounting controls and the financial reporting process. Ourindependent auditors, Ernst & Young LLP, are responsible for performingan independent audit of our consolidated financial statements in accord-ance with auditing standards generally accepted in the United States andto issue a report thereon. The Audit and Ethics Committee’s responsibilityis to monitor and oversee these processes.
In keeping with that responsibility, the Audit and Ethics Committeehas reviewed and discussed WMS’ audited consolidated financial state-ments with management. In addition, the Audit and Ethics Committee has discussed with WMS’ independent auditors the matters required to be discussed by Statement on Auditing Standards No. 61, “Communicationswith Audit Committees,” as amended.
The Audit and Ethics Committee has received the written dis-closures and the letter from the independent auditors required byIndependence Standards Board Standard No. 1, “Independence Discussionswith Audit Committees,” and has discussed with the independent auditorstheir independence.
Based on the Audit and Ethics Committee’s discussions with management and the independent auditors and the Audit and EthicsCommittee’s review of the representations of management and the reportof the independent auditors, the Audit and Ethics Committee recom-mended to our Board of Directors that the audited consolidated financialstatements be included in WMS’ Annual Report on Form 10-K for theyear ended June 30, 2003 for filing with the United States Securities andExchange Commission.
This report is respectfully submitted by the Audit and EthicsCommittee of the Board of Directors.
William E. McKenna (Chairman)
William C. Bartholomay
Ira S. Sheinfeld
WM
S In
du
st
rie
s In
c. 2
00
3 A
R
CERTIFICATE of Chief Executive Officer and Chief Financial Officer and Audit and Ethics Committee Report 29

To the Stockholders and Board of Directors
WMS Industries Inc.
We have audited the accompanying consolidated balance
sheets of WMS Industries Inc. and subsidiaries as of June 30, 2003
and 2002, and the related consolidated statements of operations,
stockholders’ equity and comprehensive income and cash flows for
each of the three years in the period ended June 30, 2003. These
financial statements are the responsibility of the Company’s man-
agement. Our responsibility is to express an opinion on these
financial statements based on our audits.
We conducted our audits in accordance with auditing stand-
ards generally accepted in the United States. Those standards
require that we plan and perform the audit to obtain reasonable
assurance about whether the financial statements are free of mate-
rial misstatement. An audit includes examining, on a test basis,
evidence supporting the amounts and disclosures in the financial
statements. An audit also includes assessing the accounting princi-
ples used and significant estimates made by management, as well
as evaluating the overall financial statement presentation. We
believe that our audits provide a reasonable basis for our opinion.
In our opinion, the consolidated financial statements referred
to above present fairly, in all material respects, the consolidated
financial position of WMS Industries Inc. and subsidiaries at June
30, 2003 and 2002, and the consolidated results of their operations
and cash flows for each of the three years in the period ended
June 30, 2003, in conformity with accounting principles generally
accepted in the United States.
Chicago, Illinois
August 11, 2003
Report of INDEPENDENT AUDITORS30

31W
MS
In
du
st
rie
s In
c. 2
00
3 A
R
June 30, 2003 2002
(in thousands, except share amounts)
ASSETSCurrent assets:
Cash and cash equivalents $ 99,640 $ 31,421Restricted cash 2,326 1,250Short-term investments 58,341 72,909
160,307 105,580Receivables, net of allowances of $2,354 in 2003 and $2,642 in 2002 25,073 24,820Notes receivable, current portion 12,033 11,589Income tax receivable 7,722 9,491Inventories:
Raw materials and work in progress 13,937 15,448Finished goods 15,869 14,225
29,806 29,673Other current assets 15,766 11,532
Total current assets 250,707 192,685Gaming operations machines, net 27,590 31,514Property, plant and equipment, net 50,213 41,546Other assets 22,466 15,420
Total assets $350,976 $281,165
LIABILITIES AND STOCKHOLDERS’ EQUITYCurrent liabilities:
Accounts payable $ 10,717 $ 7,646Accrued compensation and related benefits 3,065 4,770Other accrued liabilities 16,009 9,221
Total current liabilities 29,791 21,637Convertible subordinated notes 100,000 —
Commitments and contingencies (see Note 11)
Stockholders’ equity:Preferred stock (5,000,000 shares authorized, none issued) — —Common stock (32,358,315 shares issued in 2003 and 32,346,519 shares issued in 2002) 16,179 16,173Additional paid-in capital 197,009 198,347Retained earnings 43,958 52,245Accumulated other comprehensive income 1,107 67Unearned restricted stock (29,912 shares in 2003 and 250,000 shares in 2002) (298) (1,960)Treasury stock, at cost (2,882,995 shares in 2003 and 372,812 shares in 2002) (36,770) (5,344)
Total stockholders’ equity 221,185 259,528
Total liabilities and stockholders’ equity $350,976 $281,165
See notes to consolidated financial statements.
Consolidated BALANCE SHEETSWMS Industries Inc.

Years Ended June 30, 2003 2002 2001
(in thousands, except per share amounts)
Revenues:Product sales $ 85,721 $ 75,558 $173,572Gaming operations 93,005 99,136 90,200
Total revenues 178,726 174,694 263,772
Costs and expenses:Cost of product sales 52,108 50,020 95,765Cost of gaming operations 21,026 15,108 12,772Research and development 40,300 25,977 16,443Selling and administrative 56,225 47,088 72,404Depreciation and amortization 26,677 23,892 18,496Corporate relocation — — 3,653
Total costs and expenses 196,336 162,085 219,533
Operating income (loss) (17,610) 12,609 44,239Interest and other income 2,579 2,841 5,748
Income (loss) from continuing operations before income taxes (15,031) 15,450 49,987Provision (benefit) for income taxes (6,744) 5,596 18,069
Income (loss) from continuing operations (8,287) 9,854 31,918Discontinued operations, net of applicable income taxes:
Income related to discontinuance of pinball and cabinets segments — — 4,409
Net income (loss) $ (8,287) $ 9,854 $ 36,327
Basic earnings (loss) per share of common stock:Income (loss) from continuing operations $ (0.27) $ 0.31 $ 1.01
Net income (loss) $ (0.27) $ 0.31 $ 1.15
Diluted earnings (loss) per share of common stock:Income (loss) from continuing operations $ (0.27) $ 0.30 $ 1.00
Net income (loss) $ (0.27) $ 0.30 $ 1.13
Average number of shares outstanding—basic 30,382 32,054 31,557
Average number of shares outstanding—diluted 30,382 32,542 32,050
See notes to consolidated financial statements.
Consolidated Statements of OPERATIONS32
WMS Industries Inc.
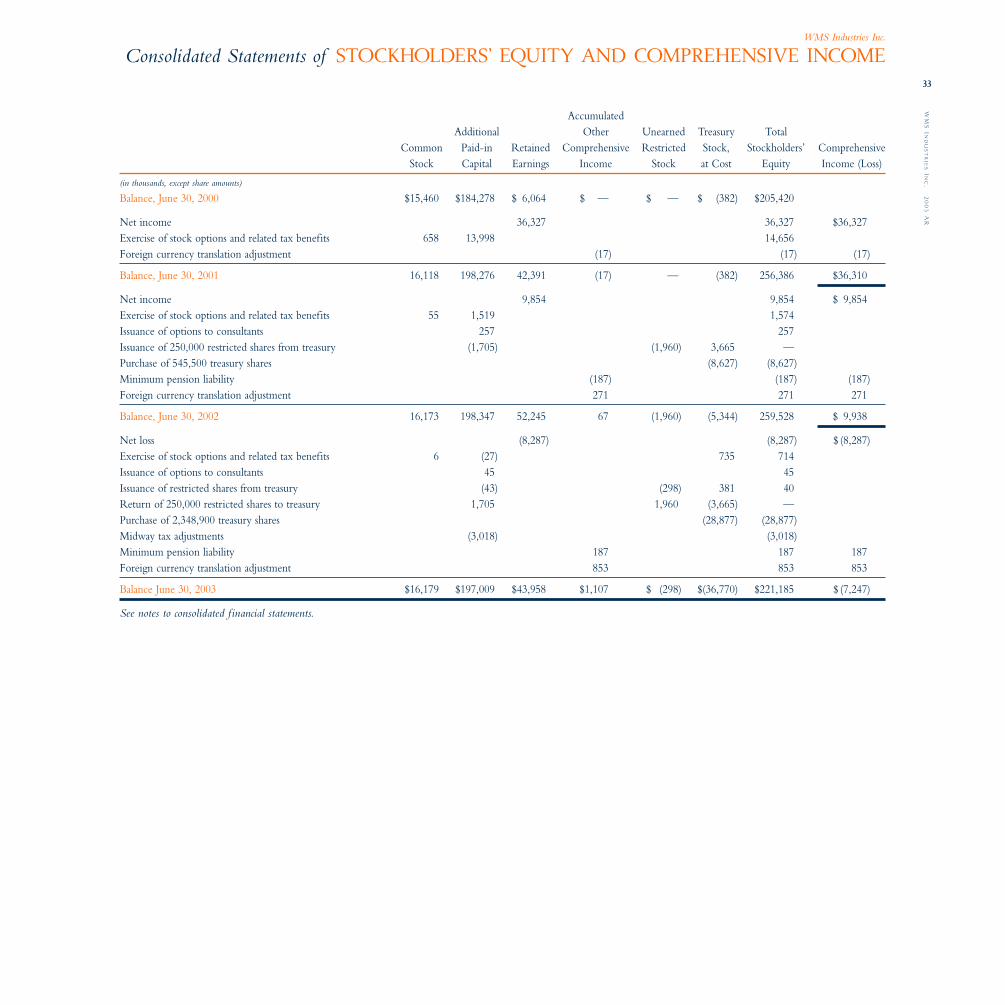
33W
MS
In
du
st
rie
s In
c. 2
00
3 A
R
AccumulatedAdditional Other Unearned Treasury Total
Common Paid-in Retained Comprehensive Restricted Stock, Stockholders’ ComprehensiveStock Capital Earnings Income Stock at Cost Equity Income (Loss)
(in thousands, except share amounts)
Balance, June 30, 2000 $15,460 $184,278 $ 6,064 $ — $ — $ (382) $205,420
Net income 36,327 36,327 $36,327Exercise of stock options and related tax benefits 658 13,998 14,656Foreign currency translation adjustment (17) (17) (17)
Balance, June 30, 2001 16,118 198,276 42,391 (17) — (382) 256,386 $36,310
Net income 9,854 9,854 $ 9,854Exercise of stock options and related tax benefits 55 1,519 1,574Issuance of options to consultants 257 257Issuance of 250,000 restricted shares from treasury (1,705) (1,960) 3,665 —Purchase of 545,500 treasury shares (8,627) (8,627)Minimum pension liability (187) (187) (187)Foreign currency translation adjustment 271 271 271
Balance, June 30, 2002 16,173 198,347 52,245 67 (1,960) (5,344) 259,528 $ 9,938
Net loss (8,287) (8,287) $ (8,287)Exercise of stock options and related tax benefits 6 (27) 735 714Issuance of options to consultants 45 45Issuance of restricted shares from treasury (43) (298) 381 40Return of 250,000 restricted shares to treasury 1,705 1,960 (3,665) —Purchase of 2,348,900 treasury shares (28,877) (28,877)Midway tax adjustments (3,018) (3,018)Minimum pension liability 187 187 187Foreign currency translation adjustment 853 853 853
Balance June 30, 2003 $16,179 $197,009 $43,958 $1,107 $ (298) $(36,770) $221,185 $ (7,247)
See notes to consolidated financial statements.
Consolidated Statements of STOCKHOLDERS’ EQUITY AND COMPREHENSIVE INCOMEWMS Industries Inc.

Years Ended June 30, 2003 2002 2001
(in thousands)
Cash Flows From Operating ActivitiesNet income (loss) $ (8,287) $ 9,854 $ 36,327Adjustments to reconcile net income (loss) to net cash provided by operating activities:
(Income) related to discontinued operations — — (4,409)Depreciation 26,677 23,892 18,496Provision for bad debts — — 815Non-cash write-off of licensed technology 1,750 — —Non-cash losses and expenses 1,583 288 3,177Deferred income taxes (3,528) (215) (2,954)Tax benefit from exercise of common stock options 250 406 7,228Increase (decrease) resulting from changes in operating assets and liabilities:
Restricted cash (1,076) (1,250) —Receivables (697) 23,666 (6,623)Income taxes 1,769 3,483 (7,325)Inventories 2,212 3,273 (11,804)Other current assets 1,054 (7,428) (880)Other assets (10,079) 4,809 (7,600)Accounts payable and accrued liabilities 8,341 (646) (449)
Net cash provided by operating activities 19,969 60,132 23,999
Cash Flows From Investing ActivitiesPurchase of property, plant and equipment (13,641) (16,344) (8,124)Additions to participation gaming machines (21,622) (18,531) (18,844)Acquisition, net of cash acquired — (2,500) —Proceeds from asset disposal — 2,274 —Purchase of short-term investments (7,832) (1,385) (93,024)Proceeds from short-term investments 22,400 — 82,300
Net cash used by investing activities (20,695) (36,486) (37,692)
Cash Flows From Financing ActivitiesCash received on exercise of stock options 464 1,168 7,428Gross proceeds from issuance of convertible notes 100,000 — —Debt issuance costs (3,495) — —Purchase of treasury stock (28,877) (8,627) —
Net cash provided (used) by financing activities 68,092 (7,459) 7,428
Cash Flows From Discontinued Operations — — 1,376Effect of Exchange Rates on Cash 853 271 (17)
Increase (decrease) in cash and cash equivalents 68,219 16,458 (4,906)Cash and cash equivalents at beginning of year 31,421 14,963 19,869
Cash and cash equivalents at end of year $ 99,640 $ 31,421 $ 14,963
See notes to consolidated financial statements.
Consolidated Statements of CASH FLOWS34
WMS Industries Inc.

35W
MS
In
du
st
rie
s In
c. 2
00
3 A
R
NOTE 1Business Overview
We are engaged in one business segment: the design, manu-
facture, and marketing of slot machines (video and mechanical reel
type) and video lottery terminals and gaming operations consisting
of placement of participation and wide-area progressive games in
gaming venues and licensing our games to third parties. We serve
the gaming industry worldwide. Although production remains
exclusively in the United States, sales and service offices are located
in the United States, Canada, Australia, Spain and South Africa.
International business activities have become increasingly important
to us. See Note 3, below.
We market our gaming machines in two principal ways.
First, we sell gaming machines, conversion kits, parts, used equip-
ment and equipment manufactured under original equipment
manufacturing agreements to casinos and other licensed gaming
machine operators. Second, we license our games to third parties
for distribution and we lease gaming machines to casinos and
other licensed gaming machine operators for payments based upon
(1) a percentage of the net win of the gaming machines, (2) fixed
daily fees or (3) in the case of games on a WAP system, a percentage
of the amount wagered. WAP systems are electronically linked
systems of gaming devices joined by a central computer, that allow
the system to build a progressive jackpot with every wager made
on the system. The current WAP systems are operated under an
agreement with a WAP system provider whereby the profits of the
games on the WAP system are shared equally. We refer to games
leased under any of these arrangements as “participation games”
and when combined with royalties we receive under license
agreements with third parties to distribute our games, we refer to
this as our “gaming operations.”
On June 25, 2003, we completed a private placement of $100
million principal amount of 2.75% convertible subordinated notes
due July 15, 2010. On July 3, 2003, we issued an additional $15 mil-
lion upon exercise of the overallotment option in the note agree-
ment. We have registered the resale of the notes and underlying
common stock with the SEC.
On August 10, 2000, we announced the discontinuance of
our contract manufacturing segment with operations ceasing on
September 30, 2000. Accordingly, the financial position, results of
operations and cash flows of this segment has been reported as
discontinued operations in the consolidated financial statements.
In fiscal 2001, we recorded an after-tax gain of $1.3 million,
which reflects the final adjustments to our fiscal 2000 estimated
loss on the disposal of our pinball and cabinet segment and the
related tax expense. In addition, we recorded a tax benefit of
$3.1 million related to the write-off for tax purposes of $8.6 mil-
lion of goodwill associated with the original acquisition of our
discontinued pinball business in 1969. The basic and diluted earn-
ings per share of discontinued operations, net of applicable income
taxes, for fiscal 2001 was $0.14 and $0.13 per share, respectively.
NOTE 2Principal Accounting Policies
CONSOLIDATION POLICY
Our consolidated financial statements include the accounts
of WMS and its wholly-owned subsidiaries. All significant inter-
company accounts and transactions have been eliminated. We
account for our joint operating agreement with IGT for the current
WAP systems for which no legal entity exists, in our consolidated
financial statements by recording our proportionate share of
revenues and expenses from operating activities and the full value
of all of the assets we own and liabilities we owe related to this
agreement. The purpose of the joint operating agreement is to
combine our licensing rights and game design expertise with the
proprietary WAP computer system of IGT. We design and market
the games manufactured by IGT who places such games in casinos
on its WAP system.
Certain prior year balances have been reclassified to con-
form with the current year presentation.
NOTES to Consolidated Financial StatementsWMS Industries Inc.

USE OF ESTIMATES
The consolidated financial statements have been prepared in
conformity with generally accepted accounting principles. Such
preparation requires management to make estimates and assump-
tions that affect the amounts reported in the financial statements
and accompanying notes. Actual results could differ from those
estimates.
CASH AND CASH EQUIVALENTS , AND RESTRICTED CASH
All highly liquid investments with maturities of three months
or less when purchased are considered to be cash equivalents.
Restricted cash of $2.4 million and $1.3 million at June 30, 2003
and 2002, respectively, is required for funding WAP systems jack-
pot payments.
SHORT-TERM INVESTMENTS
All investments are recorded at cost, which approximates
market value. Short-term investments consist principally of
Auction Market Preferred Stocks that generally have no fixed
maturity dates but have dividend reset dates generally every 49
days or more.
ACCOUNTS RECEIVABLE , NOTES RECEIVABLE AND
ALLOWANCE FOR DOUBTFUL ACCOUNTS
We carry our accounts and notes receivable at face amounts
less an allowance for doubtful accounts. On a periodic basis, we
evaluate our receivables and establish the allowance for doubtful
accounts based on a combination of specific customer circum-
stances, credit conditions and our history of write-offs and collec-
tions. Our policy is to generally not charge interest on trade
receivables after the invoice becomes past due. A receivable is con-
sidered past due if payments have not been received within agreed
upon invoice terms. With regard to notes receivable, interest
income is recognized ratably over the life of the note receivable
and any related fees or costs to establish the notes are charged to
expense as incurred, as they are considered to be insignificant.
INVENTORIES
Inventories are valued at the lower of cost (determined by
the first-in, first-out method) or market.
FREIGHT AND WAREHOUSING COSTS
Freight and warehousing costs are included in costs of
product sales and costs of gaming operations in the statement
of operations.
LONG-LIVED ASSETS
Property, plant and equipment and gaming operations
machines are stated at cost and depreciated by the straight-line
method over their estimated useful lives. Significant replacements
and improvements are capitalized. Other maintenance and repairs
are expensed. The annual provision for depreciation has been com-
puted in accordance with the following ranges of asset lives: build-
ings and improvements, 10 to 30 years; leasehold improvements
over the lease term; machinery and equipment, 3 to 8 years; par-
ticipation games, 2 years; and furniture and fixtures, 10 years.
We review the carrying amount of long-lived assets whenever
events or changes in circumstances indicate that the carrying
amount of an asset may not be recoverable. An impairment loss
would be recognized when estimated future cash flows expected
to result from the use of the asset and its eventual disposition are
less than its carrying amount. When an impairment loss is to be
recognized for an asset, it is measured by comparing the carrying
value to the fair value. Fair value is generally measured as the
present value of estimated future cash flows.
Goodwill and indefinite lived intangible assets are not amor-
tized but are reviewed annually, or more frequently if an event
occurs or circumstances change, for indications that the asset
might be impaired. Any impairment loss is charged to expense in
the period in which such loss is determined. Identified intangible
NOTES to Consolidated Financial Statements36
37W
MS
In
du
st
rie
s In
c. 2
00
3 A
R
assets with finite lives, including licensed technology and patents,
are amortized using the straight-line method over their estimated
useful lives. We continually evaluate the reasonableness of the
useful lives of these assets, and any change in the lives assigned to
amortizable assets will impact results of operations.
We recorded $0.8 million of goodwill associated with our
acquisition of Big Foot Software Development and Research, LLC
in July 2001. An additional $1.5 million of contingent considera-
tion had been deposited into an escrow account subject to the
future fulfillment of specified conditions in the purchase contract.
As of June 30, 2003, we determined that specified milestones had
been achieved and $0.8 million of the contingent consideration
was recorded and goodwill was increased accordingly. We did not
record any impairment charges related to goodwill for fiscal 2003,
2002 or 2001.
Other assets include royalty and licensing advances made in
connection with licensing agreements we have for the use of
third-party intellectual property. The royalty and licensing
advances will be amortized based on the contractual terms or the
life of the asset once the products are commercialized. At June 30,
2003, $13.2 million of advance payments of royalties are included
in the balance sheet. Amortization expense, which is included in
cost of gaming operations in the statement of operations is esti-
mated, for fiscal years 2004, 2005, 2006, 2007 and 2008 to be $2.1
million, $5.5 million, $4.1 million, $1.4 million and $0.1 million,
respectively. To the extent the products developed would not fully
recover the guaranteed minimum amounts, we would record an
immediate charge against earnings at the time of such determina-
tion. In fiscal 2003, we recorded charges of $5.7 million for the
impairment of royalty and licensing advances, because we had
determined that these intangible assets had no future value to us.
REVENUE RECOGNITION
Product sales are made for cash, on normal credit terms of 90
days or less, and over longer term payment plans. Revenue is rec-
ognized from product sales when the title to the product and the
risk and rewards of ownership transfer to the customer. Gaming
operations revenues under operating type lease agreements are
estimated and recognized when earned. Lease agreements are
based on either a pre-determined percentage of the daily net win
of each gaming machine or a fixed daily rental fee. WAP revenues
are based upon a predetermined percentage of amounts wagered,
or coin in, on each gaming machine and are recognized as earned.
ADVERTIS ING EXPENSE
The cost of advertising is charged to earnings as incurred
and for fiscal years 2003, 2002 and 2001 was $0.7 million, $0.8
million, and $0.8 million, respectively.
RESEARCH AND DEVELOPMENT COSTS
Expenditures relating to the development of new products,
including improvements to existing products are expensed as
incurred.
FOREIGN CURRENCY TRANSLATION
The local currency is the functional currency (primary cur-
rency in which business is conducted) for our operations in
Canada, Spain, Australia and South Africa. Adjustments resulting
from translating foreign functional currency assets and liabilities
into U.S. dollars are recorded in a separate component of stock-
holders’ equity. Gains or losses resulting from transactions in other
than the functional currency are reflected in net income.
EARNINGS (LOSS) PER SHARE
The reconciliation of the numerators and denominators of
the basic and diluted earning (loss) per share from continuing
operations was:Per Share
Year Ended June 30, 2003 (Loss) Shares Amount
(in thousands, except per share amounts)
Basic EPSLoss applicable to common stock $(8,287) 30,382 $(0.27)Effect of dilutive securities:
—options — — ——convertible notes — — —
Diluted EPSLoss applicable to common stock $(8,287) 30,382 $(0.27)
(continued)

Per ShareYear Ended June 30, 2002 Income Shares Amount
(in thousands, except per share amounts)
Basic EPSIncome applicable to common stock $ 9,854 32,054 $ 0.31Effect of dilutive securities—options — 488 0.01
Diluted EPSIncome applicable to common stock $ 9,854 32,542 $ 0.30
Per ShareYear Ended June 30, 2001 Income Shares Amount
(in thousands, except per share amounts)
Basic EPSIncome applicable to common stock $31,918 31,557 $ 1.01Effect of dilutive securities—options — 493 .01
Diluted EPSIncome applicable to common stock $31,918 32,050 $ 1.00
Shares of common stock underlying options and our $100 mil-
lion of convertible subordinated notes were not included in the
computation of diluted earnings per share because their effect would
have been anti-dilutive. Had we earned net income in fiscal 2003,
incremental shares attributable to the assumed exercise of out-
standing options and issuance of shares assuming conversion of the
convertible notes would have increased diluted shares outstanding
by 366,908 shares.
The options expire between 2007 and 2010 and the convertible
notes mature in 2010. The 29,912 shares of unearned restricted
stock were also not included in the computation of diluted earnings
per share in fiscal years 2003 or 2002.
Options to purchase 835,000 shares of common stock were
outstanding during the year ended June 30, 2002 but were not
included in the computation of diluted earnings per share because
the exercise price of these options was greater than the average
market price of the common shares for the year. The options
expire between 2007 and 2010.
The 250,000 shares of unearned restricted stock were not
included in the computation of diluted earnings per share in fiscal
2003 or 2002.
STOCK-BASED EMPLOYEE COMPENSATION
We have elected to continue to follow the intrinsic value
based method prescribed by APB Opinion No. 25 to account for
stock options granted to employees and directors, as allowed by
SFAS No. 123. Under APB No. 25, we do not recognize compensa-
tion expense upon the issuance of stock options because the
option terms are fixed and the exercise price equals the market
price of the underlying stock on the grant date.
The following table presents a comparison of the reported
net income, earnings per share and compensation cost of options
granted to employees to the pro forma amounts that would have
been reported if stock option compensation expense had been
determined using the fair value method allowed by SFAS No. 123
for the three years ended June 30, 2003:
(in thousands, except per share amounts) 2003 2002 2001
As reported:Net income (loss) $ (8,287) $9,854 $36,327
Earnings (loss) per share:Basic $ (0.27) $ 0.31 $ 1.15Diluted $ (0.27) $ 0.30 $ 1.13
Stock-based employee compensation cost, net of related tax effects, included in the determination of net income (loss) $ — $ — $ —
Pro forma amounts if the fair value method had been applied to all stock compensations awards:
Pro forma net income (loss) $(15,212) $3,262 $33,230
Pro forma earnings (loss) per share:Basic $ (0.50) $ 0.10 $ 1.05Diluted $ (0.50) $ 0.10 $ 1.04
Stock-based employee compensation cost, net of related tax effects, that would have been included in the determination of net income (loss) $ 6,925 $6,592 $ 3,097
The pro forma fair value of each option grant is estimated
on the date of grant or modification using the Black-Scholes
option-pricing model with the following weighted average assump-
tions used for modifications and grants in fiscal 2003, 2002 and
2001: dividend yield 0% for all three years; expected volatility of
.46 in fiscal 2003, .44 in fiscal 2002 and .60 in fiscal 2001; risk-free
NOTES to Consolidated Financial Statements38

39W
MS
In
du
st
rie
s In
c. 2
00
3 A
R
interest rates of 3.56% in 2003, 4.00% in 2002, and 5.00% in 2001;
and expected life of the options of six years for all three years. The
weighted average pro forma fair value, using the Black-Scholes
assumptions noted above, of the options granted during fiscal
years 2003, 2002 and 2001 was $6.52, $8.04 and $11.25, respectively.
RECENTLY ISSUED ACCOUNTING STANDARDS
In June 2001, the FASB issued SFAS No. 143, “Accounting for
Asset Retirement Obligations.” This statement addresses financial
accounting and reporting for obligations associated with the
retirement of tangible long-lived assets and the associated asset
retirement costs. It applies to all legal obligations associated with
the retirement of long-lived assets that result from the acquisition,
construction, development and normal operation of a long-lived
asset. We adopted SFAS No. 143 effective July 1, 2002 and such
adoption did not have a material effect on our balance sheet, state-
ment of operations or cash flows.
In August 2001, the FASB issued SFAS No. 144, “Accounting
for the Impairment and Disposal of Long-Lived Assets.” This state-
ment requires that the same accounting model be used to recog-
nize an impairment loss for long-lived assets, whether they are to
be held and used, disposed of by sale, or disposed of other than by
sale. This would apply to both previously held and used or newly
acquired assets. It also broadens the presentation of discontinued
operations to include more disposal transactions. We adopted
SFAS No. 144 effective July 1, 2002 and such adoption did not have
a material effect on our balance sheet, statement of operations or
cash flows.
In June 2002, the FASB issued SFAS No. 146, “Accounting for
Costs Associated with Exit or Disposal Activities.” SFAS No. 146
requires that a liability for a cost associated with an exit or dis-
posal activity be recognized when the liability is incurred, and
that an entity’s commitment to a plan, by itself, does not create a
present obligation to others that meets the definition of a liability.
It nullifies Emerging Issues Task Force Issue 94-3, “Liability
Recognition for Certain Employee Termination Benefits and Other
Costs to Exit an Activity.” The provisions of this statement are
effective for exit or disposal activities that are initiated after
December 31, 2002, with earlier application encouraged. We early
adopted SFAS No. 146 effective July 1, 2002 and such adoption did
not have a material effect on our balance sheet, statement of oper-
ations or cash flows.
In December 2002, the FASB issued SFAS No. 148, “Account-
ing for Stock-Based Compensation—Transition and Disclosure.”
SFAS No. 148 provides alternative methods of transition to SFAS
No. 123’s fair value method of accounting for stock-based employee
compensation, but does not require companies to use the fair value
method. It also amends the disclosure provisions of SFAS No. 123
and APB Opinion No. 28 to require disclosures in the summary of
significant accounting policies of the effects of an entity’s account-
ing policy with respect to stock-based employee compensation on
reported net income and earnings per share in annual and interim
financial statements. The provisions of this statement are effective
for fiscal years ending after December 15, 2002 and for interim
reporting periods beginning after December 15, 2002. We adopted
the disclosure provisions of SFAS No. 148 in the quarter ending
December 31, 2002 and such adoption did not have a material
effect on our balance sheet, statement of operations or cash flows.
In November 2002, the FASB issued FASI No. 45, “Guarantor’s
Accounting and Disclosure Requirements for Guarantees, Including
Indirect Guarantees of Indebtedness of Others.” This interpretation
requires certain guarantees to be initially recognized and recorded
at fair value, and also increases disclosure requirements related to
guarantees. The initial recognition provisions are applicable to
guarantees issued or modified after December 31, 2002. We
adopted FASI No. 45 in the quarter ending December 31, 2002, and
such adoption did not have a material impact on our balance sheet,
statement of operations or cash flows.
NOTE 3Information on Geographic Areas
Product sales and gaming operations revenues from customers
in Europe, Canada, Latin America and Asia amounted to approxi-
mately $48.4 million or 27.1%, $30.7 million or 17.6%, $21.0 million
or 8.0% of total revenues for fiscal years 2003, 2002 and 2001,
respectively. Substantially all of our revenues from customers
(continued)

outside the United States are usually denominated in U.S. dollars.
At June 30, 2003, 2002 and 2001, 19.7%, 19.2% and 5.5%, respec-
tively, of trade accounts receivable are from customers located out-
side of the United States.
Year Ended June 30 2003 2002 2001
(in thousands)
Revenues:United States $130,300 $143,997 $242,772Russia 16,340 3,698 —Canada 9,660 11,824 11,929All others, less than 3% each 22,426 15,175 9,071
Total $178,726 $174,694 $263,772
Long-lived assets:United States $ 75,762 $ 71,195 $ 62,545Canada 989 1,286 856All others, less than 1% each 1,052 579 981
Total $ 77,803 $ 73,060 $ 64,382
The geographic sales information is by country of destina-
tion. Our operations outside the United States include participa-
tion games located in Canada, Europe and South Africa, sales
offices in Spain and South Africa and a research and development
office in Australia.
NOTE 4Property, Plant and Equipment and Gaming Operations Machines
At June 30, net property, plant and equipment were:
(in thousands) 2003 2002
Land $ 2,608 $ 2,608Buildings and improvements 35,152 30,264Machinery and equipment 28,747 21,127Furniture and fixtures 6,479 5,404
72,986 59,403Less accumulated depreciation (22,773) (17,857)
Net property, plant and equipment $ 50,213 $ 41,546
At June 30, net gaming operations machines were:
(in thousands) 2003 2002
Gaming machines $ 76,283 $ 78,748Less accumulated depreciation (48,693) (47,234)
Net gaming operations machines $ 27,590 $ 31,514
The Company reclassified $2.3 million net book value of
gaming operations machines to inventory during fiscal 2003.
NOTE 5Other Assets
At June 30, other assets were:
(in thousands) 2003 2002
Deferred tax assets—non-current $ 1,909 $ 3,669Notes receivable 2,038 800Prepaid royalties and licensing advances 11,051 5,414Receivable from Midway — 3,207Goodwill 1,578 828Deferred financing costs 3,495 —Other 2,395 1,502
Total other assets $22,466 $15,420
NOTE 6Other Accrued Liabilities
At June 30, other accrued liabilities were:
(in thousands) 2003 2002
Accrued property taxes $ 1,134 $ 1,211Midway tax separation liability 4,000 —Royalties payable 3,947 3,897Software anomaly reserves 2,661 1,163Sales taxes payable 1,014 872Other accrued liabilities 3,253 2,078
Total other accrued liabilities $16,009 $ 9,221
NOTE 7Income Taxes
The following is a summary of income (loss) from con-
tinuing operations before income taxes of U.S. and international
operations for the three years ended June 30, 2003:
(in thousands) 2003 2002 2001
United States $(16,131) $14,846 $49,869International 1,100 604 118
Total $(15,031) $15,450 $49,987
NOTES to Consolidated Financial Statements40

41W
MS
In
du
st
rie
s In
c. 2
00
3 A
R
Significant components of the provision (benefit) for income
taxes for the three years ended June 30, 2003 were:
(in thousands) 2003 2002 2001
CurrentFederal $(3,926) $4,449 $11,064State — 637 2,570Foreign 460 319 161
Total current (3,466) 5,405 13,795Deferred
Federal (2,655) (101) (2,721)State (978) (9) (233)Foreign 105 (105) —
Total deferred (3,528) (215) (2,954)Provision for tax benefit resulting from
stock options 250 406 7,228
Provision (benefit) for income taxes on continuing operations (6,744) 5,596 18,069
Benefit for income taxes on discontinued operations — — (1,807)
Income tax provision (benefit), net $(6,744) $5,596 $16,262
Deferred income taxes reflect the net tax effects of tempo-
rary differences between the amount of assets and liabilities for
financial reporting purposes and the amounts used for income
taxes. Significant components of our deferred tax assets and liabil-
ities at June 30 were:
(in thousands) 2003 2002
Deferred tax assets resulting from:Current:
Net operating loss carryforward $2,312 $ —Research and development tax credit
carryforward 1,229 —Receivables valuation 1,050 1,187Inventory valuation 1,541 175Accrued items not currently deductible 1,517 969
Total current 7,649 2,331
Non-current:Foreign tax credit carryforward 1,254 —Book over tax depreciation 457 3,366Other 198 303
Total deferred tax assets 9,558 6,000
Deferred tax liabilities resulting from:Other 335 305
Net deferred tax assets $9,223 $ 5,695
No deferred tax provision has been made for United States
taxes related to approximately $1.7 million of undistributed earn-
ings of foreign subsidiaries, which are considered to be perma-
nently reinvested. Determination of the deferred income tax
liability on these unremitted earnings is not practicable because
such liability, if any, is dependent on circumstances existing, if and
when the remittance occurs.
At June 30, 2003, we had $1.2 million of research and devel-
opment tax credit carryforwards expiring from 2021 through 2023,
$1.3 million of foreign tax credit carryforwards expiring from 2006
through 2008, $22.1 million of state operating loss carryforwards
expiring from 2008 through 2018, and $3.8 million of federal oper-
ating loss carryforwards expiring in 2023. At June 30, 2003, manage-
ment believes it is more likely than not that we will realize the
benefit of these net deferred tax assets, including the net operating
loss carryforwards and research and development tax credit carry-
forwards. Accordingly, we believe that no valuation allowance is
required for the deferred tax assets. We consider the scheduled
reversal of deferred tax liabilities, projected future taxable income,
and tax planning strategies in making this assessment.
The provision (benefit) for income taxes on continuing oper-
ations differs from the amount computed using the statutory fed-
eral income tax rate for fiscal years 2003, 2002 and 2001 as follows:
2003 2002 2001
Statutory federal income tax rate (35.0)% 35.0% 35.0%State income taxes, net of federal benefit (2.9) 2.9 2.9Dividend received deduction on
investment income (2.0) (2.6) (1.3)Research tax credits (3.8) (1.8) (0.6)Permanent items 0.9 1.4 0.8Foreign rate differential 2.4 (0.4) (1.0)Reduction of prior year’s taxes (4.4) — —Other, net (0.1) 1.7 0.3
Effective tax rate (44.9)% 36.2% 36.1%
For fiscal 2003, we have included in “other, net” a 10.6% or
$1.6 million alternate minimum tax credit refund, an 11.3% or $1.7 mil-
lion benefit related to the settlement of prior year tax returns as
a result of an examination by the Internal Revenue Service, and a
(continued)

2.8% or $1.1 million ETI benefit, largely offset by a provision of
25.7% or $3.9 million related to fully reserving our tax advance
receivables from Midway, a former subsidiary, under terms of tax
sharing and separation agreements entered into prior to the spin-off
date, due to the uncertainty of the payback period. For federal
purposes, our income tax returns have been examined through
fiscal 2001.
NOTE 8Line of Credit and Convertible Subordinated Notes
We recently renewed an unused line of credit for $50.0 mil-
lion under a revolving credit agreement for a one-year term to
May 21, 2004, which contains usual credit terms for a bank line.
No borrowing occurred on the line in fiscal 2003 and 2002.
In June 2003, we issued $100.0 million of convertible subor-
dinated notes bearing interest at 2.75% maturing on July 15, 2010.
The notes are exchangeable at any time into an aggregate of
5,055,611 shares of our common stock at a conversion price of
$19.78 per share, subject to adjustment. The notes are subordinated
in right of payment to all existing and future senior debt and will
be effectively subordinated to all of the indebtedness and liabili-
ties of our subsidiaries. The notes are not callable. On July 3, 2003,
we issued an additional $15 million of convertible subordinated
notes under identical terms to cover an overallotment option
granted to the initial purchaser of the notes, exchangeable at any
time into an aggregate of 758,342 shares of common stock at a
conversion price of $19.78 per share.
We have no maturities of debt or sinking fund requirements
through June 30, 2008.
NOTE 9Stockholders’ Equity and Common Stock Plans
Our authorized common stock consists of 100,000,000 shares
of $.50 par value. Additionally, there are 5,000,000 shares of
$.50 par value preferred stock authorized. The preferred stock is
issuable in series, and the relative rights and preferences and the
number of shares in each series are to be established by our Board
of Directors.
On April 6, 1998, the WMS Rights Agreement became effec-
tive. Under the Rights Agreement, each share of our common
stock has an accompanying right to purchase, under certain con-
ditions, one one-hundredth of a share of our Series A Preferred
Stock at an exercise price of $100, permitting each holder to
receive $200 worth of our common stock valued at the then
current market price. The rights become exercisable if any person
or entity that did not, before the Plan was adopted, own 15% or
more of our common stock acquires beneficial ownership of 15%
or more of our common stock. The rights are redeemable by us
at $.01 per right, subject to certain conditions, at any time and
expire in 2007.
At June 30, 2003, 5,224,277 shares of common stock were
reserved for possible issuance under stock option plans. We utilize
the Black-Scholes pricing model to determine the fair value of equity
instruments issued in exchange for goods or services. No such
options were issued in fiscal 2003 or 2001. During fiscal 2002, we
incorporated the following assumptions into the model: risk-free
rate of 4.00%; expected volatility of .44; and expected dividend of
zero. The risk-free rate is determined based on the interest rate
of U.S. Government treasury obligations with a maturity date
comparable to the life of the option issued. Other assumptions,
relating to option life, strike price and stock price, are determined
at the date the option is issued. The expense recognized is based
on the vesting schedule of the options granted to consultants.
During fiscal 2003 and 2002, we expensed $45,000 and $0.3 million,
respectively, for the value of common stock options issued for
services from consultants.
NOTES to Consolidated Financial Statements42
43W
MS
In
du
st
rie
s In
c. 2
00
3 A
R
In January 2002, our Board of Directors authorized a $20
million common stock repurchase plan to repurchase our common
stock from time to time in open market or privately negotiated
transactions. By August 2, 2002, this repurchase program was com-
pleted. In total, we repurchased 1,568,000 shares, or approximately
5% of the previously outstanding shares, at an average share price
of $12.75 under this $20 million authorization.
In September 2002, our Board of Directors authorized a
twelve-month plan to repurchase an additional $10 million of our
common stock from time to time in open market or privately
negotiated transactions. As of March 31, 2003, this repurchase pro-
gram was completed. We repurchased 833,200 shares, or approxi-
mately 2.4% of the previously outstanding shares, at an average
price of $12.00 per share under this $10 million authorization.
In April 2003, our Board of Directors authorized a new
twelve-month plan to repurchase up to an additional $10 million
of our common stock from time to time in open market or pri-
vately negotiated transactions. In June 2003, in conjunction with
the completion of our private placement of convertible subordi-
nated notes due 2010 to qualified institutional buyers, our Board of
Directors authorized the expansion of this repurchase plan to $25
million. During the fiscal year ended June 30, 2003, we repur-
chased 493,200 shares for an aggregate price of $7.5 million under
this authorization. The timing and actual number of shares to be
purchased will depend on market conditions.
In fiscal 2003, we repurchased stock under all three stock
repurchase plans totaling 2,348,900 shares for an aggregate price of
$28.9 million at an average price of $12.29 per share. Since June 30,
2003 through September 1, 2003, we have repurchased 299,100
shares for an aggregate price of $5.0 million at an average price of
$16.75 per share. Since the inception of the first common stock
repurchase program in January 2002 through September 1, 2003,
we have repurchased 3,193,500, or 9.9%, of our previously out-
standing shares for an aggregate price of $42.5 million at an
average price of $13.31 per share.
We have stock option and treasury share bonus plans as well
as a policy of granting restricted stock under which certain
employees, officers, directors and consultants are participants.
Under the stock option plans, we may grant both incentive stock
options and nonqualified options on shares of common stock through
the year 2012. Options may be granted to employees and under
certain conditions to officers, non-employee directors and consult-
ants. The stock option committee has the authority to fix the
terms and conditions upon which each option is granted, but in no
event shall the term exceed ten years or the strike price generally
be granted at less than 100% of the fair market value of the stock
on the date of grant.
Under Delaware law and our certificate of incorporation,
authorized but unissued shares of our common stock may be
granted as restricted stock from time to time as determined by our
Board of Directors, except as limited by NYSE rules. Upon
issuance of stock, unearned compensation equivalent to the tax-
effected market value of the shares granted on the grant date is
charged to stockholders’ equity. The grant is adjusted to current
market value as of the balance sheet date and subsequently amor-
tized to expense over the vesting period. In fiscal 2002, 250,000
restricted shares were granted with a weighted average fair value
at grant date of $4.2 million, which were subsequently repur-
chased in fiscal 2003. In fiscal 2003, 29,912 shares with a weighted
average fair value at grant date of $0.5 million were granted.
Under these grants, grantees are entitled to any cash dividends and
to vote their shares, but may not sell or transfer their shares during
the one-year vesting period.
Effective March 1, 2002, we issued a restricted stock grant of
250,000 shares of common stock held in treasury to Mr. Louis J.
Nicastro, Chairman of our Board of Directors and a non-employee
director. This grant was issued in consideration for his service as
Chairman of the Technology Committee of the Board of Directors,
which was established to provide enhanced oversight of the timely
(continued)
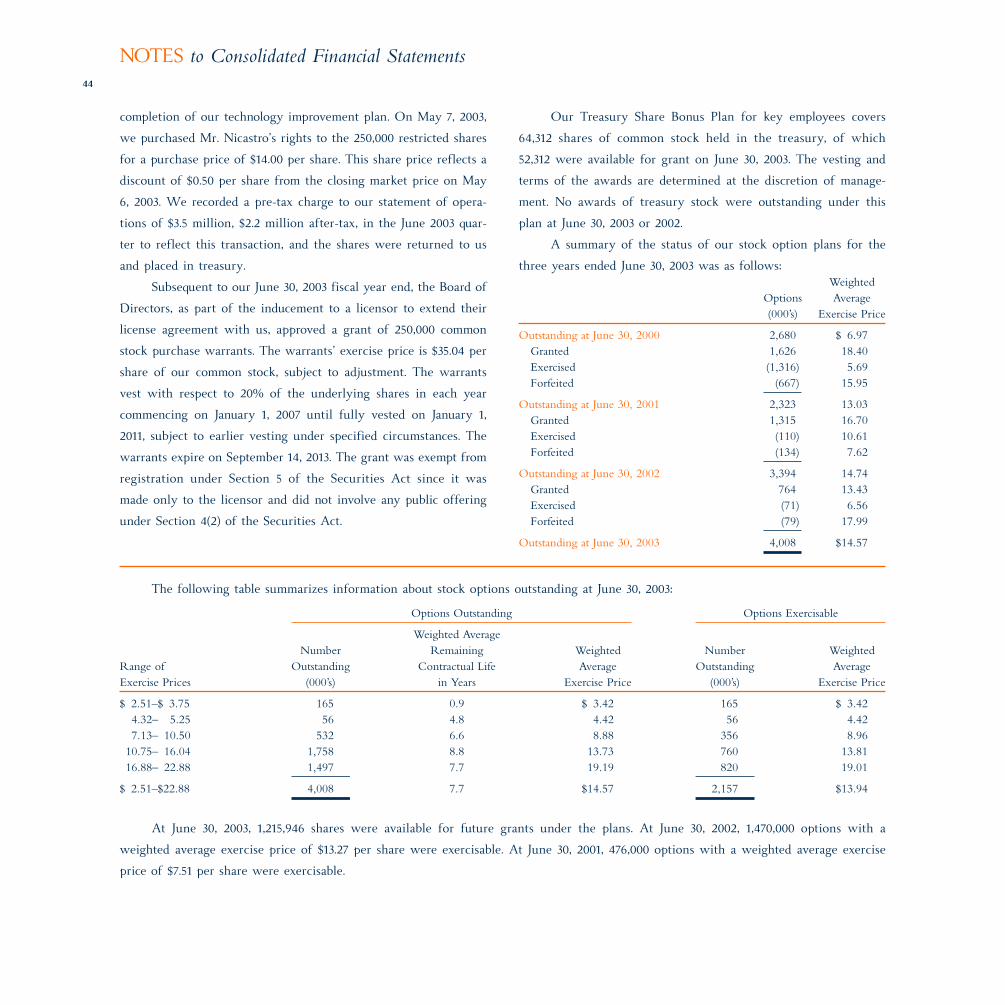
completion of our technology improvement plan. On May 7, 2003,
we purchased Mr. Nicastro’s rights to the 250,000 restricted shares
for a purchase price of $14.00 per share. This share price reflects a
discount of $0.50 per share from the closing market price on May
6, 2003. We recorded a pre-tax charge to our statement of opera-
tions of $3.5 million, $2.2 million after-tax, in the June 2003 quar-
ter to reflect this transaction, and the shares were returned to us
and placed in treasury.
Subsequent to our June 30, 2003 fiscal year end, the Board of
Directors, as part of the inducement to a licensor to extend their
license agreement with us, approved a grant of 250,000 common
stock purchase warrants. The warrants’ exercise price is $35.04 per
share of our common stock, subject to adjustment. The warrants
vest with respect to 20% of the underlying shares in each year
commencing on January 1, 2007 until fully vested on January 1,
2011, subject to earlier vesting under specified circumstances. The
warrants expire on September 14, 2013. The grant was exempt from
registration under Section 5 of the Securities Act since it was
made only to the licensor and did not involve any public offering
under Section 4(2) of the Securities Act.
Our Treasury Share Bonus Plan for key employees covers
64,312 shares of common stock held in the treasury, of which
52,312 were available for grant on June 30, 2003. The vesting and
terms of the awards are determined at the discretion of manage-
ment. No awards of treasury stock were outstanding under this
plan at June 30, 2003 or 2002.
A summary of the status of our stock option plans for the
three years ended June 30, 2003 was as follows:Weighted
Options Average(000’s) Exercise Price
Outstanding at June 30, 2000 2,680 $ 6.97Granted 1,626 18.40Exercised (1,316) 5.69Forfeited (667) 15.95
Outstanding at June 30, 2001 2,323 13.03Granted 1,315 16.70Exercised (110) 10.61Forfeited (134) 7.62
Outstanding at June 30, 2002 3,394 14.74Granted 764 13.43Exercised (71) 6.56Forfeited (79) 17.99
Outstanding at June 30, 2003 4,008 $14.57
The following table summarizes information about stock options outstanding at June 30, 2003:
Options Outstanding Options Exercisable
Weighted AverageNumber Remaining Weighted Number Weighted
Range of Outstanding Contractual Life Average Outstanding AverageExercise Prices (000’s) in Years Exercise Price (000’s) Exercise Price
$ 2.51–$ 3.75 165 0.9 $ 3.42 165 $ 3.424.32– 5.25 56 4.8 4.42 56 4.427.13– 10.50 532 6.6 8.88 356 8.96
10.75– 16.04 1,758 8.8 13.73 760 13.8116.88– 22.88 1,497 7.7 19.19 820 19.01
$ 2.51–$22.88 4,008 7.7 $14.57 2,157 $13.94
At June 30, 2003, 1,215,946 shares were available for future grants under the plans. At June 30, 2002, 1,470,000 options with a
weighted average exercise price of $13.27 per share were exercisable. At June 30, 2001, 476,000 options with a weighted average exercise
price of $7.51 per share were exercisable.
NOTES to Consolidated Financial Statements44

45W
MS
In
du
st
rie
s In
c. 2
00
3 A
R
NOTE 10Concentration of Credit and Market Risk and Fair Value Disclosures of Financial Instruments
Financial instruments which potentially subject us to con-
centrations of credit and market risk consist primarily of cash
equivalents, short-term investments and trade notes and accounts
receivable. By policy, we place our cash equivalents and short-term
investments only in high credit quality securities and limit the
amounts invested in any one security. The accounts and notes
receivable from the sale of gaming devices are generally from a
large number of customers with no significant concentration other
than in Nevada and Russia. No customers accounted for more than
10% of consolidated revenues in fiscal years 2003, 2002 and 2001.
The carrying amounts of cash, investments, accounts receiv-
able, accounts payable, and accrued liabilities approximates fair
value due to the short-term maturities of these assets and liabili-
ties. The fair value of notes receivable is estimated by discounting
expected future cash flows using current interest rates at which
similar loans would be made to borrowers with similar credit rat-
ings and remaining maturities. As of June 30, 2003 and 2002, the
fair value of the notes receivable approximated the carrying value.
The carrying value of our convertible subordinated notes issued
June 25, 2003 approximated fair value at June 30, 2003.
NOTE 11Commitments and Contingencies
We lease certain office facilities and equipment under non-
cancelable operating leases with net future lease commitments for
minimum rentals at June 30, 2003 as follows:
(in thousands)
2004 $1,0302005 8842006 2932007 232008 —Thereafter —
Total $2,230
Rent expense for fiscal 2003, 2002 and 2001 was $1.8 million,
$1.7 million and $1.7 million, respectively.
We routinely enter into license agreements with others for
the use of intellectual properties in our products. These agree-
ments generally provide for royalty and license advances when the
agreements are signed, and provide for minimum guarantees as
well as additional contingent payments based on future events.
The total potential commitments at June 30, 2003 of $29.6 million
was the same amount as that as of June 30, 2002. At June 30, 2003,
we had total potential royalty and license commitments, advances
and payments made, and potential future payments as follows:
Guaranteed Contingent Total PotentialJune 30, 2003 Minimums Payments Payments
(in thousands)
Total royalty and license commitments $ 21,807 $7,814 $ 29,621
Advances and payments made (16,656) — (16,656)
Potential future payments $ 5,151 $7,814 $ 12,965
Of the $16.7 million total advances and payments made
through June 30, 2003, $3.5 million has been charged to expense
and the remaining $13.2 million is included in the June 30, 2003
balance sheet; $2.1 million in other current assets and $11.1 million
in other assets.
As of June 30, 2003, we have potential royalty and license
payments as follows:Guaranteed Contingent Total Potential
Year Ended June 30, Minimums Payments Payments
(in thousands)
2004 $ 1,460 $6,039 $ 7,4992005 1,916 1,250 3,1662006 1,275 525 1,8002007 500 — 5002008 — — —Thereafter — — —
Total $ 5,151 $7,814 $ 12,965
(continued)
In January 2002, we announced a three-part technology
improvement plan to stabilize the operating system software in
our gaming devices. As part of this technology improvement plan,
we have pursued alternative strategies for each phase of the plan,
including licensing technologies from third parties. For the short-
term phase of the plan, our internally developed version of the
operating system continues to successfully operate in casinos in
jurisdictions where it has been installed. As a result, we no longer
intend to use an alternative operating system, which was origi-
nally licensed, among other uses, to serve as a backup during the
short-term phase of the plan. In the December 2002 quarter, we
recorded a pre-tax charge of $2.8 million, or $1.7 million after-tax,
to write-off this license agreement obligation. At June 30, 2003, we
had guaranteed minimum payments related to technology alterna-
tives aggregating $5.4 million, all of which had been paid as
advances. An additional $6.4 million of contingent payments may
become payable based on future events. These amounts are
included in the table above. If we determine that we will not realize
the value of a particular licensed technology alternative, we will
record an immediate charge against earnings at the time of such
determination of up to $11.8 million if all of the alternatives were
to have no further value to us.
We have an agreement with IGT for the operation of
SURVIVOR branded games on its wide-area progressive system.
Under this agreement we record our 50% proportionate share of
revenues and costs from operating activities and all of the assets
we own and liabilities we incur in connection with the operating
activities in our consolidated financial statements under this agree-
ment. In fiscal 2003, we expensed $0.4 million pre-tax related to
an estimated impairment of the SURVIVOR intellectual property
license and we recorded a pre-tax write down of approximately
$1.1 million, to reduce the carrying value of SURVIVOR inventory
to net realizable value. At June 30, 2003, the net remaining book
value of SURVIVOR related inventory and intellectual property
assets and commitments for both companies is approximately
$2.6 million.
On June 17, 2003, we announced that we would allow our
agreement with Stargames Corporation Pty. Ltd., for exclusive
North American distributorship rights to their RAPID ROULETTE
table gaming product, to expire on June 30, 2003. We encountered
several significant obstacles in bringing this product to market,
including regulatory, technical, and customer acceptance issues. As
a result of the expiration of the agreement, we recorded a non-
cash pre-tax charge of $3.4 million in fiscal 2003 to write down
RAPID ROULETTE inventory to net realizable value and write-off
distribution rights assets.
Subsequent to June 30, 2003, we entered into amended
licensing agreements with contractual obligations totaling $38.8
million, due as follows: $5.4 million less than 1 year, $9.7 million
1–3 years, $9.2 million 3–5 years, $14.5 million more than 5 years.
NOTE 12Retirement Plans
We sponsor 401(k) defined contribution plans within the
United States. The plans cover full-time employees and provide for
our contributions of up to 4.5 percent of covered employees’ com-
pensation as defined in the plan. Our expense for the defined con-
tribution plans totaled $1.0 million, $0.6 million and $0.4 million
in fiscal 2003, 2002 and 2001, respectively.
We have two frozen defined benefit pension plans related to
discontinued operations. Pension expense for these plans was not
significant in the aggregate.
NOTES to Consolidated Financial Statements46

47W
MS
In
du
st
rie
s In
c. 2
00
3 A
R
NOTE 13Quarterly Financial Information (unaudited)
Summarized quarterly financial information for fiscal 2003
and 2002 is as follows:Sept. 30, Dec. 31, Mar. 31, June 30,
(in thousands, except per share amounts) 2002 2002 2003 2003
Fiscal 2003 QuartersRevenues $42,394 $43,642 $41,781 $50,909Gross profit 26,415 27,699 24,340 27,138Net income (loss) 660 (1,837) (1,948) (5,162)Per share of common stock:
Basic:Net income (loss) $ 0.02 $ (0.06) $ (0.06) $ (0.17)
Shares used 30,901 30,585 30,259 29,775
Diluted:Net income (loss) $ 0.02 $ (0.06) $ (0.06) $ (0.17)
Shares used 31,156 30,585 30,259 29,775
The December 2002 quarter includes an after-tax charge of
$1.7 million, to write-off a license agreement obligation associated
with an alternate operating system to serve as a backup to our ver-
sion 2.57 operating system.
The March 2003 quarter includes an after-tax charge of $0.3
million, related to an estimated impairment of the SURVIVOR
intellectual property license, and an after-tax benefit of $0.7 mil-
lion resulting from truing up the prior year tax return.
The June 2003 quarter includes an after-tax charge of $2.2
million, related to the purchase of rights to restricted stock at a
discount from market value, an after-tax charge of $2.1 million to
write-off inventory and distribution rights for RAPID ROULETTE,
an after-tax charge of $0.7 million, related to the estimated impair-
ment of SURVIVOR related inventory, and an after-tax charge of
$0.6 million, for tax adjustments resulting from finalizing prior
year tax returns and settlement of tax agreements with Midway.
Sept. 30, Dec. 31, Mar. 31, June 30,(in thousands, except per share amounts) 2001 2001 2002 2002
Fiscal 2002 QuartersRevenues $46,306 $49,087 $36,090 $43,211Gross profit 31,222 30,578 21,965 25,801Net income 5,830 3,285 31 707Per share of common stock:
Basic:Net income $ 0.18 $ 0.10 $ 0.00 $ 0.02
Shares used 32,180 32,189 32,028 31,817
Diluted:Net income $ 0.18 $ 0.10 $ 0.00 $ 0.02
Shares used 32,770 32,684 32,463 32,119
The December 2001 quarter includes an after-tax charge of
$0.8 million for employee separation costs.
NOTE 14Supplemental Disclosure of Cash Flow Information and Summary of Non-Cash Investing and Financing Activities
Year Ended June 30, 2003 2002 2001
(in thousands)
Supplemental Disclosure of Cash Flow Information
Income taxes paid $ 310 $11,496 $20,316Income tax refunds received $9,568 $10,367 $ 1,031Investment income received $2,089 $ 2,656 $ 5,428Interest paid $ — $ — $ —
Schedule of Non-Cash Investing Activities
Gaming operations machines transferred to inventory $2,345 $ — $ —
Gaming operations machines transferred from inventory $ — $ — $ 8,100
Schedule of Non-Cash Financing Activities
Write down of tax advance receivables from Midway under tax sharing and separation agreements $3,018 $ — $ —
(continued)
The tax advance receivables from Midway under tax sharing
and separation agreements represent cash advanced in fiscal 2000
to this former subsidiary that was spun-off from WMS in 1998.
The payment was made because operating losses of Midway pre-
vented it from realizing tax benefits associated with WMS options
granted to Midway employees. The payment represents an adjust-
ment to the spin-off value of Midway, which was treated as a tax-
free dividend to WMS stockholders at the spin-off date. The
amount is repayable by Midway under the agreements, upon a
change of control of Midway or on its return to profitability for
tax purposes which would enable Midway to realize the tax bene-
fit on its tax returns. Repayment of this advance will be accounted
for as additional paid-in capital at the time it is received.
NOTES to Consolidated Financial Statements48

Des
igne
d by
Cur
ran
& C
onno
rs,
Inc.
/ w
ww
.cur
ran-
conn
ors.
com
DIRECTORS
Louis J. NicastroChairman of the Board WMS Industries Inc.
Brian R. GamachePresident and Chief Executive Officer WMS Industries Inc.
Norman J. MenellVice Chairman of the Board WMS Industries Inc.
William C. Bartholomay*Group Vice Chairman Willis Group Holdings Ltd. (Insurance Brokers) Chairman of the Board of the Atlanta Braves
William E. McKenna*General Partner MCK Investment Company (Private Investment Company)
Donna MorePresident More Law Group (Attorneys-at-Law)
Neil D. NicastroChairman of the Board Midway Games Inc.
Harvey ReichAttorney-at-Law
David M. Satz, Jr.Partner Saiber Schlesinger Satz & Goldstein (Attorneys-at-Law)
Ira S. Sheinfeld*Partner Hogan & Hartson LLP (Attorneys-at-Law)
*Members of Audit and Ethics Committee
OFFICERS
Brian R. GamachePresident and Chief Executive Officer
Scott D. SchweinfurthExecutive Vice President, Chief Financial Officerand Treasurer
Orrin J. EdidinExecutive Vice President and Chief Operating Officer
Seamus McGillExecutive Vice President, Worldwide Sales and Marketing WMS Gaming Inc.
Kathleen J. McJohnVice President, General Counsel and Secretary
Robert R. RogowskiVice President of Finance and Controller
EXECUTIVE OFFICE
800 S. Northpoint Blvd. Waukegan, IL 60085 (847) 785-3000
AUDITORS
Ernst & Young LLP 233 South Wacker Drive Chicago, IL 60606
COUNSEL TO THE COMPANY
Shack Siegel Katz & Flaherty P.C. 530 Fifth Avenue New York, NY 10036
TRANSFER AGENT AND REGISTRAR
Shareholder Inquiries: The Bank of New York Shareholder Relations Department-11E P.O. Box 11258 Church Street Station New York, NY 10286 (800) 524-4458
Certificate Transfers and Address Changes:The Bank of New York Receive and Deliver Department-11W P.O. Box 11002 Church Street Station 101 Barclay Street New York, NY 10286
COMMON STOCK
WMS Industries Inc. common stock is listed on the New York Stock Exchange under the symbol WMS.
SHAREHOLDER RELATIONS
Scott D. Schweinfurth (847) 785-3760
PUBLICATIONS
A copy of our Annual Report on Form 10-K is available without charge upon writtenrequest to: WMS Industries Inc. 800 S. Northpoint Blvd. Waukegan, IL 60085 Attn: Treasurer
WEBSITE
www.wmsgaming.com
Corporate DATA
LEGAL NOTICES:
BOSE is a trademark of Bose Corporation.
HOLLYWOOD SQUARES and THE CENTER SQUARE are trademarks of King World Productions, Inc.
The MONOPOLY name and logo, the distinctive design of the game board, the four corner squares, FREE PARKING, the MR. MONOPOLY name and character as well as each of the distinctive elements of the board and the playing pieces are trademarks of Hasbro for its property trading game and game equipment. © 2003 Hasbro. All rights reserved. Used with permission.
PAC-MAN and PAC-MAN FRENZY� & © 1980 Namco Ltd. All rights reserved.
PICTIONARY is a trademark of Pictionary Incorporated.
RAPID ROULETTE is a trademark of Stargames Corporation Limited and Crown Limited.
SURVIVOR is a trademark of Survivor Productions LLC.
Bluebird, CPU-NXT, Diamonds in the Rough, Kaboom, Robin Hood’s Sherwood Treasure, and Puzzle Pays are trademarks of WMS Gaming Inc.

WMS Industries Inc.
800 S. Northpoint Blvd., Waukegan, IL 60085
Tel. (847) 785-3000 Fax (847) 785-3058
www.wmsgaming.com


