People of India - IIMA
12
The People of India database contains detailed identity information on about 885,000 individual members who reside in households in the Consumer Pyramids sample. The sample is large and well spread across India. It is therefore a good database to study the demographic profile of the people of India. The database contains information on age, gender, religion, caste, state of origin, occupation, literacy, education level and discipline in case of higher education, status of health and financial inclusion. Caste is an important identity characteristic in India based on traditional social stratifications. State of origin is an identity based on recent clustering of administrative regions. Status of health is captured in three self-assessed statuses. There are eight different indicators to represent financial inclusion and an indicator for mobile phone ownership. Complete demographic data of all households in the Consumer Pyramids sample is collected thrice in a year. The People of India database is therefore updated thrice a year. The data always pertains to the date of the survey. Centre for Monitoring Indian Economy Pvt. Ltd. Consumer Pyramids India’s Largest Survey of Households People of India dx
Transcript of People of India - IIMA

The People of India database contains detailed identity
information on about 885,000 individual members who
reside in households in the Consumer Pyramids sample.
The sample is large and well spread across India. It is
therefore a good database to study the demographic
profile of the people of India.
The database contains information on age, gender,
religion, caste, state of origin, occupation, literacy,
education level and discipline in case of higher education,
status of health and financial inclusion.
Caste is an important identity characteristic in India based
on traditional social stratifications. State of origin is an
identity based on recent clustering of administrative
regions.
Status of health is captured in three self-assessed
statuses. There are eight different indicators to represent
financial inclusion and an indicator for mobile phone
ownership.
Complete demographic data of all households in the
Consumer Pyramids sample is collected thrice in a year.
The People of India database is therefore updated thrice
a year. The data always pertains to the date of the survey.
Centre for Monitoring Indian Economy Pvt. Ltd.
Consumer PyramidsIndia’s Largest
Survey of Households
People of Indiadx

Centre for Monitoring Indian Economy Pvt. Ltd.
Wave Number of
From To Members
Jan 1 2014 Apr 30 2014 723,481
May 1 2014 Aug 31 2014 694,228
Sep 1 2014 Dec 31 2014 675,838
Jan 1 2015 Apr 30 2015 673,881
May 1 2015 Aug 31 2015 664,415
Sep 1 2015 Dec 31 2015 660,660
Jan 1 2016 Apr 30 2016 660,471
May 1 2016 Aug 31 2016 665,556
Sep 1 2016 Dec 31 2016 663,335
Jan 1 2017 Apr 30 2017 658,731
May 1 2017 Aug 31 2017 652,465
Sep 1 2017 Dec 31 2017 697,694
Number of Observations in Waves
No. Data field name 1. Household ID
2. Country Name
3. State Name
4. State and Homogeneous Region No
5. Town/Village No.
6. Region Type
7. Survey status assigned to the household
8. Failure Reason of the household
9. Stratification of the Homogenous Region by type of Region
10. Member weight at Strata level
11. Adjustment factor for Non-Response, at Strata level
12. Extended weight for Non-Surveyed States, at Strata level
13. Slotted Month for execution
14. Member identity
15. Relation with the Head of Household
16. Gender
17. Age years
18. Age month
19. State of origin
20. Religion
21. Caste Category
22. Caste
23. Literacy
24. Education
25. Discipline
26. Occupation
27. Member is healthy
28. Member is on regular medication
29. Member is hospitalised
30. Member has a credit-card
31. Member has a kisan credit-card
32. Member has a demat account
33. Member has a bank account
34. Member has Employee Provident Fund account
35. Member has a Life Insurance
36. Member has a Health insurance
37. Member has a mobile
Data fields per member per household
People of Indiadx

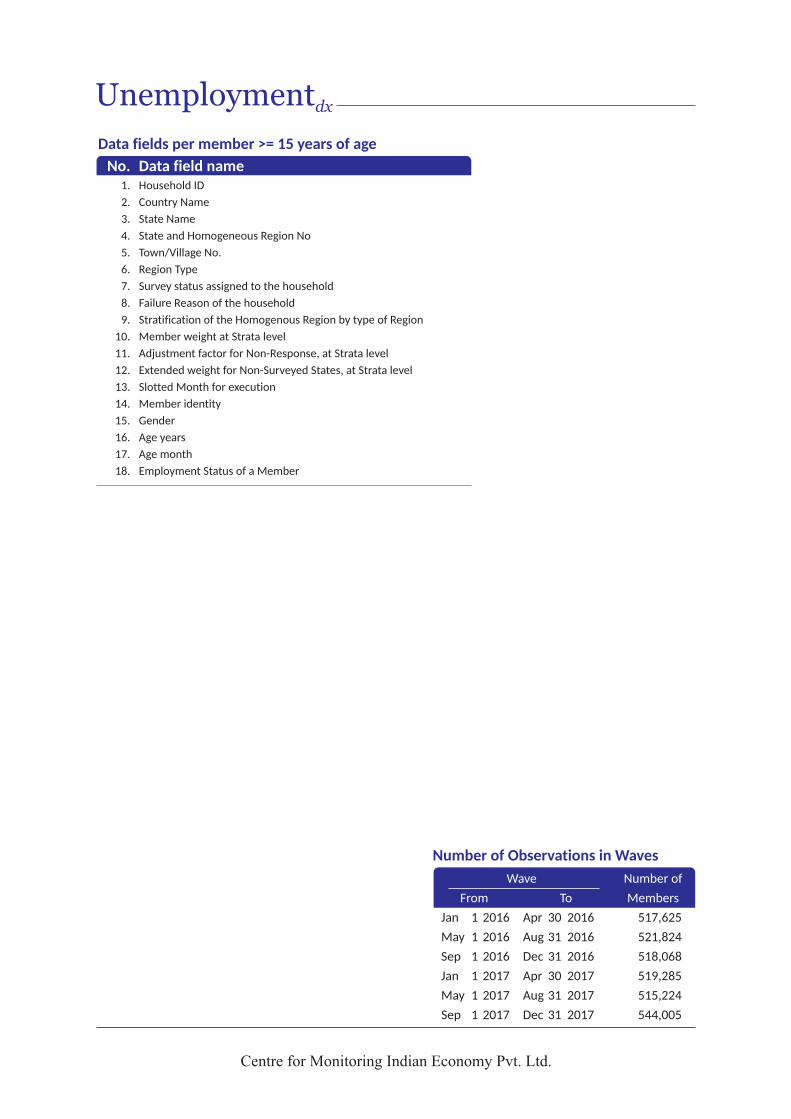
The Unemployment database contains detailed
information on employment and unemployment status
about the members residing in all households in the
Consumer Pyramids sample. This is a database of about
522,000 people. It provides employment or
unemployment status for each member (who is greater
than or equal to 15 years of age) of each household in the
database.
The database contains information on age and gender of
the member, employment or unemployment status of the
member.
Information on employment and unemployment statuses
of all individuals from households in the Consumer
Pyramids sample is collected during each Wave of the
Consumer Pyramids survey. Since there are three Waves
in a year, the complete employment and unemployment
information is collected thrice in a year for the entire
sample.
The data always pertains to the date of the survey.
If there is ambiguity of the status of an individual on the
day of the survey (as it could be for a daily wage worker)
we seek the status as of the day preceding the day of the
interview. This recall of a status that is in very close
proximity to the date of the survey ensures accurate
observations of the status.
Unemploymentdx
Centre for Monitoring Indian Economy Pvt. Ltd.
Consumer PyramidsIndia’s Largest
Survey of Households
Centre for Monitoring Indian Economy Pvt. Ltd.
Number of Observations in Waves
Wave Number of
From To Members
Jan 1 2016 Apr 30 2016 517,625
May 1 2016 Aug 31 2016 521,824
Sep 1 2016 Dec 31 2016 518,068
Jan 1 2017 Apr 30 2017 519,285
May 1 2017 Aug 31 2017 515,224
Sep 1 2017 Dec 31 2017 544,005
No. Data field name 1. Household ID
2. Country Name
3. State Name
4. State and Homogeneous Region No
5. Town/Village No.
6. Region Type
7. Survey status assigned to the household
8. Failure Reason of the household
9. Stratification of the Homogenous Region by type of Region
10. Member weight at Strata level
11. Adjustment factor for Non-Response, at Strata level
12. Extended weight for Non-Surveyed States, at Strata level
13. Slotted Month for execution
14. Member identity
15. Gender
16. Age years
17. Age month
18. Employment Status of a Member
Data fields per member >= 15 years of age
Unemploymentdx

The Composition of Incomes database contains detailed
information about the incomes of earning members
residing in households in the Consumer Pyramids sample.
It provides information regarding the monthly earning
and source of earning for each earning member of each
household in the database.
It provides an excellent view of the changing earning
capacity and the sources of earnings of the households of
India.
The database contains information on age and gender of
the member, month of income, income in the form of
wages, income from pensions, income in the form of
dividends and interest income. Each source of income is
shown separately against each member, wherever
applicable. Besides, it contains the households income
from rent, private transfers, government transfers,
business profits, profit from sale of assets, income from
lotteries or gambling and imputed income of production
for self-consumption.
Income data of all earning members of households and
the collective income of the households in the Consumer
Pyramids sample is collected during each Wave of the
Consumer Pyramids survey. Income is always collected for
the four months that immediately preceded the month of
the survey.
This is a longitudinal survey.
Composition of Incomesdx
Centre for Monitoring Indian Economy Pvt. Ltd.
Consumer PyramidsIndia’s Largest
Survey of Households

Centre for Monitoring Indian Economy Pvt. Ltd.
No. Data field name Household Income
1. Household ID
2. Country name
3. State name
4. Homogeneous Region no.
5. Town/village no.
6. Region type
7. Survey status assigned to the household
8. Reason for failure of the survey
9. Stratification of the Homogenous Region by type of Region
10. Household weight at Strata level
11. Adjustment factor for Non-Response, at Strata level
12. Extended Household Weight for Non-Surveyed States, at Strata level
13. Slotted Month for execution
14. Month for which the income is captured
15. Total Income
16. Household income from all sources
17. Household income from rent
18. Household income from imputed income
19. Household income from private transfers
20. Household income from government transfers
21. Household income from business profit
22. Household income from the sale of assets
23. Household income from lotteries, gambling, etc.
24. Household income from all income of all members
25. Household income from wages of all members
26. Household income from pension of all members
27. Household income from dividends of all members
28. Household income from interest earned by all members
29. Total Members in the Household
30. Total Earning Members in the Household
Data fields per household and per member per household
Composition of Incomesdx
Number of Observations in Waves
Wave Number of
From To Households
Jan 1 2014 Apr 30 2014 166,744
May 1 2014 Aug 31 2014 160,705
Sep 1 2014 Dec 31 2014 157,442
Jan 1 2015 Apr 30 2015 158,443
May 1 2015 Aug 31 2015 158,666
Sep 1 2015 Dec 31 2015 158,624
Jan 1 2016 Apr 30 2016 158,624
May 1 2016 Aug 31 2016 159,778
Sep 1 2016 Dec 31 2016 160,511
Jan 1 2017 Apr 30 2017 161,167
May 1 2017 Aug 31 2017 160,847
Sep 1 2017 Dec 31 2017 168,165
Member Income
1. Household ID
2. Country name
3. State name
4. Homogeneous Region no.
5. Town/village no.
6. Region type
7. Survey status assigned to the household
8. Reason for failure of the survey
9. Stratification of the Homogenous Region by type of Region
10. Member weight at Strata level
11. Adjustment factor for Non-Response, at Strata level
12. Extended weight for Non-Surveyed States, at Strata level
13. Member identity
14. Gender
15. Age years
16. Age month
17. Slotted Month for execution
18. Month for which the income is captured
19. Member income from all sources
20. Member income from wages
21. Member income from pension
22. Member income from dividends
23. Member income from interest

This database contains information on the availability of
basic amenities in households, ownership of assets,
pattern of investments and sources & purpose of
borrowing.
Basic amenities include data on availability of toilet inside
the household, access to electricity and water inside the
household and also type of material used in walls and
roof of the household. Access to transport infrastructure
is captured by asking the time it takes household
members to travel ten kilometers from the household.
Asset ownership includes data on the ownership of
eleven kinds of assets as of the date of the survey,
purchase of these assets 120 days before the date of
survey and intentions to buy them within 120 days after
the date of survey.
Similarly, the database includes investments in financial
assets and land and intentions to invest in the next 120
days.
The database also provides information on whether the
household has an outstanding borrowing or not and if it
does have an outstanding borrowing then what are the
sources and what are the purposes of the borrowing.
Consumer PyramidsIndia’s Largest
Survey of Households
Centre for Monitoring Indian Economy Pvt. Ltd.
Household Amenities, Assets & Liabilitiesdx

Household Amenities, Assets & Liabilitiesdx
Centre for Monitoring Indian Economy Pvt. Ltd.
Number of Observations in Waves
Wave Number of
From To Households
Jan 1 2014 Apr 30 2014 166,744
May 1 2014 Aug 31 2014 160,705
Sep 1 2014 Dec 31 2014 157,442
Jan 1 2015 Apr 30 2015 158,443
May 1 2015 Aug 31 2015 158,666
Sep 1 2015 Dec 31 2015 158,624
Jan 1 2016 Apr 30 2016 158,624
May 1 2016 Aug 31 2016 159,778
Sep 1 2016 Dec 31 2016 160,511
Jan 1 2017 Apr 30 2017 161,167
May 1 2017 Aug 31 2017 160,847
Sep 1 2017 Dec 31 2017 168,165
1. Household ID
2. Country name
3. State name
4. State and Homogeneous Region No.
5. Town / Village No.
6. Region Type
7. Survey status assigned to the household
8. Failure Reason of the household
9. Stratification of the Homogenous Region by type of Region
10. Household weight at Strata level
11. Adjustment factor for Non-Response, at Strata level
12. Extended Household Weight for Non-Surveyed States, at Strata level
13. Slotted Month for execution
Assets owned by household
1. House/plot
2. Refrigetaor
3. Air-conditioner
4. Cooler
5. Washing machine
6. Television
7. Computer
8. Car
9. Two-wheeler
10. Genset/inverter
11. Tractor
12. Cattle
~Owned as of date of survey
~Bought 120 days preceding date of survey
~Intention to buy in 120 days following date of survey
Household Investments
1. Bank deposits
2. Post office savings
3. NSC/bonds/PPF
4. Kisan Vikas Patra
5. Provident fund
6. Life insurance
7. Mutual funds
8. Listed shares
9. Business loans
10. Gold
11. Real estate housing
12. Chit funds
13. Other financial instruments
~Household has savings as of date of survey
~Saved during 120 days preceding date of survey
~Will save within 120 days from date of survey
Household Liabilities
Sources of borrowing
1. Any Source
2. Bank
3. Chitfunds
Data fields per household
No. Data field name 4. Credit Cards
5. Employer
6. Money Lender
7. NBFC/Dealer
8. Other Sources
9. Relatives/Friends
10. SHG
11. MFI
12. Shops
Purpose of borrowing
1. Any purpose
2. Business
3. Consumer Durables
4. Consumption Expenditure
5. Education
6. Housing
7. Investments
8. Marriage
9. Medical Expenses
10. Other Purposes
11. Repaying Debts
12. Vehicles
Household Amenities
1. Household has power access
2. Availability of power in hours for a day
3. Household has water access
4. Availability of water in days for a week
5. Availibility of water in hours for a day
6. Household has toilet within premises
7. Travel time to work in minutes
8. Type of Roof
9. Type of Wall

The Household Expense Details database contains
information on household spends across over 80 expense
items.
The sample is large and well spread across India with
detailed data of expenditure of households on 82
household items during each month of the surveyed
period. It therefore provides an excellent view of the
changing spending capacity and the pattern of
expenditure of the households of India.
The database contains information on monthly expense
of 29 food items and 53 non-food items.
The 29 food items include whole-grain cereals, pulses,
edible oils, vegetables, fruits, potatoes & onions, tea,
coffee, jam/pickle/ketchup, sweeteners, bread, milk &
milk-products, meat/eggs & fish, biscuits, namkeen &
salty snacks, chocolates/cakes & ice-creams, etc.
The 53 non-food items include intoxicants, cosmetic &
toiletries, clothing, footwear, restaurants, recreation,
purchase of household appliances, education, health,
electricity, petrol, transport, communication, bills & rent,
transport, communication, Equated Monthly Installment
(EMI) and miscellaneous expenses, etc.
Expenses are always collected for the four months that
immediately preceded the month of the survey.
Household Expenses Detailsdx
Centre for Monitoring Indian Economy Pvt. Ltd.
Consumer PyramidsIndia’s Largest
Survey of Households

Household Expenses Detailsdx
Centre for Monitoring Indian Economy Pvt. Ltd.
No. Data field name 1. Household ID 2. Country Name 3. State Name 4. State and Homogeneous Region No 5. Town/Village No. 6. Region Type 7. Survey status assigned to the household 8. Failure Reason of the household 9. Stratification of the Homogenous Region by type of Region 10. Household weight at Strata level 11. Adjustment factor for Non-Response, at Strata level 12. Extended Household Weight for Non-Surveyed States, at
Strata level 13. Slotted Month for execution 14. Month for which the income is captured 15. Total Expenditure 16. Household Expenditure on Food 17. Household Expenditure on Cereals & Pulses 18. Household Expenditure on Cereals Wholegrain 19. Household Expenditure on Cereals & Pulses Processed 20. Household Expenditure on Pulses, etc 21. Household Expenditure on Ghee 22. Household Expenditure on Edible Oils 23. Household Expenditure on Dry Spices 24. Household Expenditure on Vegetables & Wet Spices 25. Household Expenditure on Fruits 26. Household Expenditure on Dry Fruits & Saffron 27. Household Expenditure on Potatoes & onions 28. Household Expenditure on Milk & Milk Products 29. Household Expenditure on Mithai 30. Household Expenditure on Bread 31. Household Expenditure on Biscuit 32. Household Expenditure on Namkeen & Salty Snacks 33. Household Expenditure on Noodles/flakes 34. Household Expenditure on Chocolates & Cakes/Ice creams 35. Household Expenditure on Jam/Ketchup/Pickles 36. Household Expenditure on Health supplements 37. Household Expenditure on Meat/Eggs/Fish 38. Household Expenditure on Ready to Eat Food 39. Household Expenditure on Tea 40. Household Expenditure on Coffee 41. Household Expenditure on Sweetners (Sugar, Gur, etc.) 42. Household Expenditure on Beverages
(Softdrinks/Juices)/Bottled Water 43. Household Expenditure on Baby Food 44. Household Expenditure on Others (Food) 45. Household Expenditure on Intoxicants 46. Household Expenditure on Cigarettes/tobacco 47. Household Expenditure on Liquor 48. Household Expenditure on Clothing & Footwear 49. Household Expenditure on Clothing (Garments, jackets,
woolens, hosiery, etc) 50. Household Expenditure on Footwear 51. Household Expenditure on Clothing Accessories 52. Household Expenditure on Cosmetic & Toiletries 53. Household Expenditure on Dental care products 54. Household Expenditure on Bathing Soap 55. Household Expenditure on Cosmetics 56. Household Expenditure on Detergent bar, powder, liquids 57. Household Expenditure on Scourer & Housecleaning Agents 58. Household Expenditure on Other Housecare Products 59. Household Expenditure on Appliances 60. Household Expenditure on Restaurant
61. Household Expenditure on Recreation 62. Household Expenditure on Bills & Rent 63. Household Expenditure on House rent 64. Household Expenditure on Water Charges 65. Household Expenditure on Society charges 66. Household Expenditure on Others (Taxes) 67. Household Expenditure on Power & Fuel 68. Household Expenditure on Cooking fuel 69. Household Expenditure on Petrol & Diesel 70. Household Expenditure on Electricity 71. Household Expenditure on Transport 72. Household Expenditure on Communication/Information 73. Household Expenditure on Education 74. Household Expenditure on School/Academic Books 75. Household Expenditure on Fiction/Non-Fiction Books 76. Household Expenditure on Stationery 77. Household Expenditure on School/College Fees 78. Household Expenditure on Private Tuition Fees 79. Household Expenditure on Additional Professional
Education 80. Household Expenditure on Overseas Education 81. Household Expenditure on Hobby Classes 82. Household Expenditure on School Transport 83. Household Expenditure on Others (Education) 84. Household Expenditure on Health 85. Household Expenditure on Medicines 86. Household Expenditure on Doctors/Physiotherapist's Fee 87. Household Expenditure on X-ray/Tests 88. Household Expenditure on Hospitalisation Fees 89. Household Expenditure on Premium for Health Insurance 90. Household Expenditure on Health/Beauty enhancements
products & services 91. Household Expenditure on EMIs (all EMIs) 92. Household Expenditure on EMI House 93. Household Expenditure on EMI Vehicle 94. Household Expenditure on EMI Durables 95. Household Expenditure on EMI Other 96. Household Expenditure on Miscellaneous 97. Total Members in the Household
Data fields per household
No. Data field name
Number of Observations in Waves
Wave Number of
From To Households
Jan 1 2014 Apr 30 2014 166,744
May 1 2014 Aug 31 2014 160,705
Sep 1 2014 Dec 31 2014 157,442
Jan 1 2015 Apr 30 2015 158,443
May 1 2015 Aug 31 2015 158,666
Sep 1 2015 Dec 31 2015 158,624
Jan 1 2016 Apr 30 2016 158,624
May 1 2016 Aug 31 2016 159,778
Sep 1 2016 Dec 31 2016 160,511
Jan 1 2017 Apr 30 2017 161,167
May 1 2017 Aug 31 2017 160,847
Sep 1 2017 Dec 31 2017 168,165

Consumer sentiments in the Consumer Pyramids survey
are measured on the lines of the work done in this regard
by the Survey Research Center at the University of
Michigan. This effort, called the Survey of Consumers,
began in 1946 and has produced several measures that
are well established lead indicators in the US.
Five questions are asked to measure consumer
sentiments. The first two questions pertain to consumers
perceptions regarding their current well-being and
expectations of their future well-being. The next two
questions take into account perceptions that consumers
have regarding current and prospective economic
conditions of the country as a whole. The last question is
with respect to the household's propensity to spend on
consumer durables around the time of the interview.
All this data is as of a point in time - as of the date of the
survey.
This is a longitudinal survey. The identity of households is
kept constant over time with the help of household
identity codes.
Consumer Sentimentsdx
Centre for Monitoring Indian Economy Pvt. Ltd.
Consumer PyramidsIndia’s Largest
Survey of Households

Consumer Sentimentsdx
Centre for Monitoring Indian Economy Pvt. Ltd.
Number of Observations in Waves
Wave Number of
From To Households
Jan 1 2016 Apr 30 2016 158,624
May 1 2016 Aug 31 2016 159,778
Sep 1 2016 Dec 31 2016 160,511
Jan 1 2017 Apr 30 2017 161,167
May 1 2017 Aug 31 2017 160,847
Sep 1 2017 Dec 31 2017 168,165
No. Data field name 1. Household ID
2. Country name
3. State name
4. Homogeneous Region no.
5. Town/village no.
6. Region type
7. Survey status assigned to the household
8. Reason for failure of the survey
9. Stratification of the Homogenous Region by type of Region
10. Household weight at Strata level
11. Adjustment factor for Non-Response, at Strata level
12. Extended Household Weight for Non-Surveyed States, at Strata level
13. Slotted Month for execution
14. Response of the first question of Consumer Sentiments“Compared to a year ago, how is your family faring financially these days?”
15. Response of the second question of Consumer Sentiments“How do you think that a year from now your family would be faring financially?”
16. Response of the third question of Consumer Sentiments“How would you describe the financial and business conditions in our country in the next 12 months?”
17. Response of the fourth question of Consumer Sentiments“What do you think would the financial and business conditions in our country be in the next 5 years?”
18. Response of the fifth question of Consumer Sentiments“Do you think that this is generally a good or bad time to buy things like furniture, refrigerator, television, two-wheeler, car?”
19. Gender of the respondent
20. Age years (of the respondent)
21. Age month (of the respondent)
Data fields per household