PENSION FUND - CERN Document Server · In closing, I would like to thank the Pension Fund...
83
CERN/FC/6120 CERN/3306 Original: English 11 May 2017 PENSION FUND Annual Report and Financial Statements for the year ended 31 December 2016 Audited by representatives of the SUPREME AUDIT OFFICE OF POLAND NAJWYŻSZA IZBA KONTROLI (NIK)
Transcript of PENSION FUND - CERN Document Server · In closing, I would like to thank the Pension Fund...

CERN/FC/6120 CERN/3306 Original: English 11 May 2017
PENSION FUND
Annual Report and Financial Statements
for the year ended 31 December 2016
Audited by representatives of the SUPREME AUDIT OFFICE OF POLAND NAJWYŻSZA IZBA KONTROLI (NIK)

Action to be taken Voting Procedure
For recommendation FINANCE COMMITTEE 360th Meeting 13-14 June 2017
Simple majority of Member States represented and voting and 51% of the contributions of all Member States
For approval COUNCIL 185th Session 15-16 June 2017
Simple majority of Member States represented and voting
The Finance Committee is invited to recommend to the Council and the Council is invited: - to take note of the Annual Report of the CERN Pension Fund; - to approve the Financial Statements of the CERN Pension Fund for the Financial
Year 2016 and to grant discharge to the Pension Fund Governing Board.

PENSION FUND
Annual Report
and Financial Statements
for the year ended 31 December 2016
The Financial Statements included in this Report are published in accordance with
International Public Sector Accounting Standards (IPSAS) and the Rules and
Regulations of the Pension Fund.


1 | 76
Table of contents
CHAIR’S LETTER ............................................................................................................................................... 3
ANNUAL REPORT
I. PENSION FUND GOVERNING BOARD REPORT....................................................................................... 7
1. Composition of the bodies of the Fund and Advisers (2016) ............................................... 7
2. Overview of the year 2016 ........................................................................................................ 10
3. Members and beneficiaries ...................................................................................................... 12
4. Actuarial Status of the Fund ..................................................................................................... 13
5. Investment Report ...................................................................................................................... 17
II. ANNEX........................................................................................................................................................ 25
FINANCIAL STATEMENTS
III. AUDIT OPINION ........................................................................................................................................ 33
IV. FINANCIAL STATEMENTS ........................................................................................................................ 38
1. Statement of Financial Position ................................................................................................ 38
2. Statement of Financial Performance ..................................................................................... 39
3. Cash Flow Statement ................................................................................................................. 40
4. Statement of Changes in Net Assets Available for Benefits ............................................... 41
V. NOTES TO THE FINANCIAL STATEMENTS ............................................................................................... 42
VI. EXTRACT OF ACTUARY’S REPORT ON THE FUND AS AT 31 DECEMBER 2016 ................................ 73

2 | 76

3 | 76
Chair’s Letter
As Chair of the CERN Pension Fund Governing Board (PFGB), it is my pleasure to present you with the Fund’s Annual Report and Financial Statements for the Financial Year ending 31 December 2016. I trust that this report will give you an informative update on the financial status of the Fund, as well as a summary of the investment strategy and performance over the last year.
During the year the Fund’s Actuary conducted a Periodic Actuarial Review as at 1 January 2016 using a Best Estimate Approach to setting the actuarial assumptions, an approach which was in line with that requested by CERN Council. The results of the review were presented to CERN Council in June and showed an improvement in the projected funding level, as at 1 January 2041, from 95.5% in the 2013 Actuarial Review to 113.6% in the 2016 Actuarial Review, thus confirming that the 2010/2011 package of measures is having the desired effect of helping to restore the financial balance of the Fund.
At its September session CERN Council approved the technical amendments to the Rules of the Pension Fund required for the implementation of the new career structure, resulting from the five-yearly review. At its December session CERN Council also approved the amendments to the CERN-ESO Agreement in relation to the new career structure.
Following his appointment as Director for Finance and Human Resources, Martin Steinacher joined the PFGB at the beginning of the year in his capacity as ex-officio. Marcus Klug was appointed by the ESO Council as a member of the PFGB. Peter Hristov and Andreas Glindemann were also welcomed to the PFGB following their appointments by the CERN and ESO Staff Associations respectively.
On behalf of the PFGB, I would like to extend my warm appreciation to Sylvain Weisz, Antoine Mantel and Pascal Ballester for their contribution to the Pension Fund over the last six years. During that time Sylvain served as Vice-Chair of the PFGB, as well as a member of and then Chair of the ATC. Antoine was also a member and Chair of the ATC, whilst Pascal served as a member of the PFIC. In addition, I would like to wish Sylvain a very happy and healthy retirement.
The Fund’s achievements were again recognised in 2016 with an award for “Best Medium Real Estate Investor”, IPE (Investment Pension Europe) and “Chief Investment Officer of the Year Peer-to-Peer (Switzerland, Germany and Austria)” by Institutional Investor.
In closing, I would like to thank the Pension Fund Management Unit’s staff for all their hard work this year, and also all the members of the Governing Board and committees for their continued service and support.
Thomas Roth, Chair, Pension Fund Governing Board

4 | 76

5 | 76
ANNUAL REPORT

6 | 76
7 | 76
I. Pension Fund Governing Board Report
The PFGB hereby presents its Annual Report and Financial Statements for the year ended 31 December 2016.
A description of the Fund and its governance structure can be found in Note 1 “General Information” of the Financial Statements.
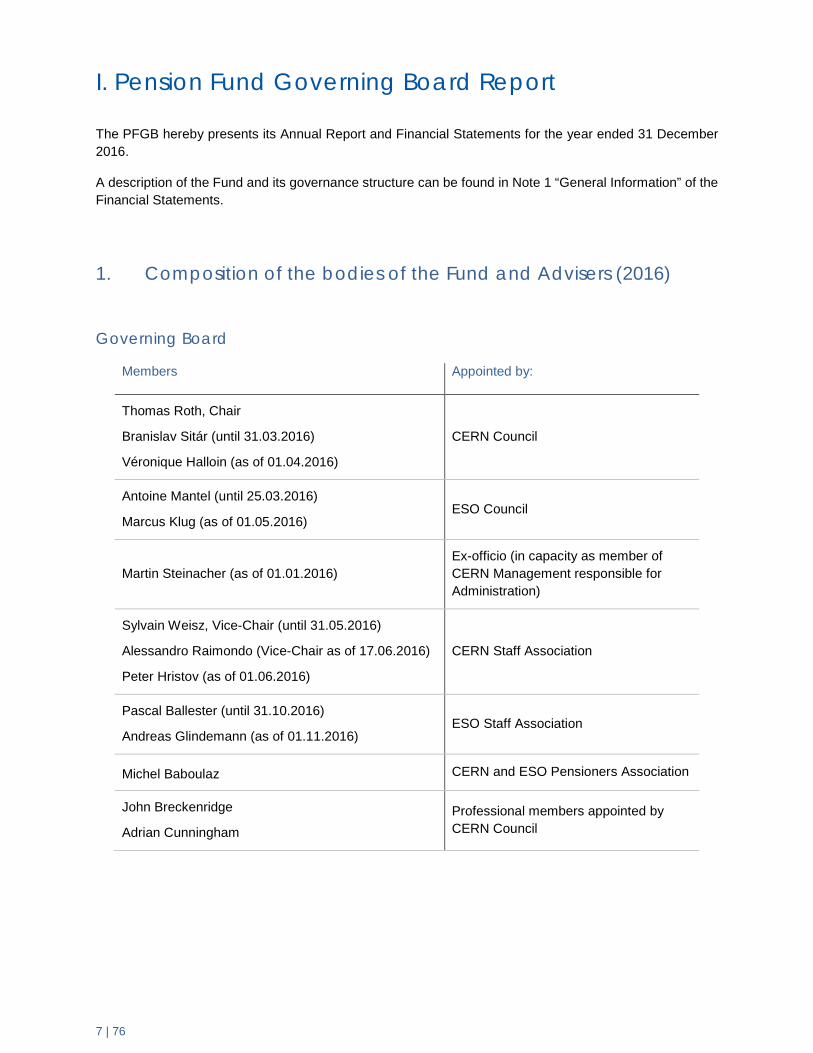
1. Composition of the bodies of the Fund and Advisers (2016)
Governing Board
Members Appointed by:
Thomas Roth, Chair
Branislav Sitár (until 31.03.2016)
Véronique Halloin (as of 01.04.2016)
CERN Council
Antoine Mantel (until 25.03.2016)
Marcus Klug (as of 01.05.2016) ESO Council
Martin Steinacher (as of 01.01.2016) Ex-officio (in capacity as member of CERN Management responsible for Administration)
Sylvain Weisz, Vice-Chair (until 31.05.2016)
Alessandro Raimondo (Vice-Chair as of 17.06.2016)
Peter Hristov (as of 01.06.2016)
CERN Staff Association
Pascal Ballester (until 31.10.2016)
Andreas Glindemann (as of 01.11.2016) ESO Staff Association
Michel Baboulaz CERN and ESO Pensioners Association
John Breckenridge
Adrian Cunningham Professional members appointed by CERN Council

8 | 76
Investment Committee
Members
Alessandro Raimondo, Chair
Jayne Atkinson
Pascal Ballester (until 31.10.2016)
Pierre Sauvagnat
Martin Steinacher (as of 22.09.2016)
Matthew Eyton-Jones Ex-officio (in capacity as Chief Executive Officer)
Actuarial and Technical Committee
Members
Sylvain Weisz, Chair (until 31.05.2016)
Adrian Cunningham (as of 07.04.2016), Chair (as of 01.06.2016)
Michel Baboulaz (as of 12.05.2016)
Richard Balfe
Marcus Klug (as of 12.05.2016)
Antoine Mantel (until 25.03.2016)
Matthew Eyton-Jones Ex-officio (in capacity as Chief Executive Officer)
Chief Executive Officer
Matthew Eyton-Jones
Auditors
Appointed by:
CERN External Auditors
Najwyższa Izba Kontroli (NIK), Warsaw, Poland CERN Council
Auditors specialised in pension fund matters
Mazars SA, Geneva, Switzerland Pension Fund Governing Board
9 | 76
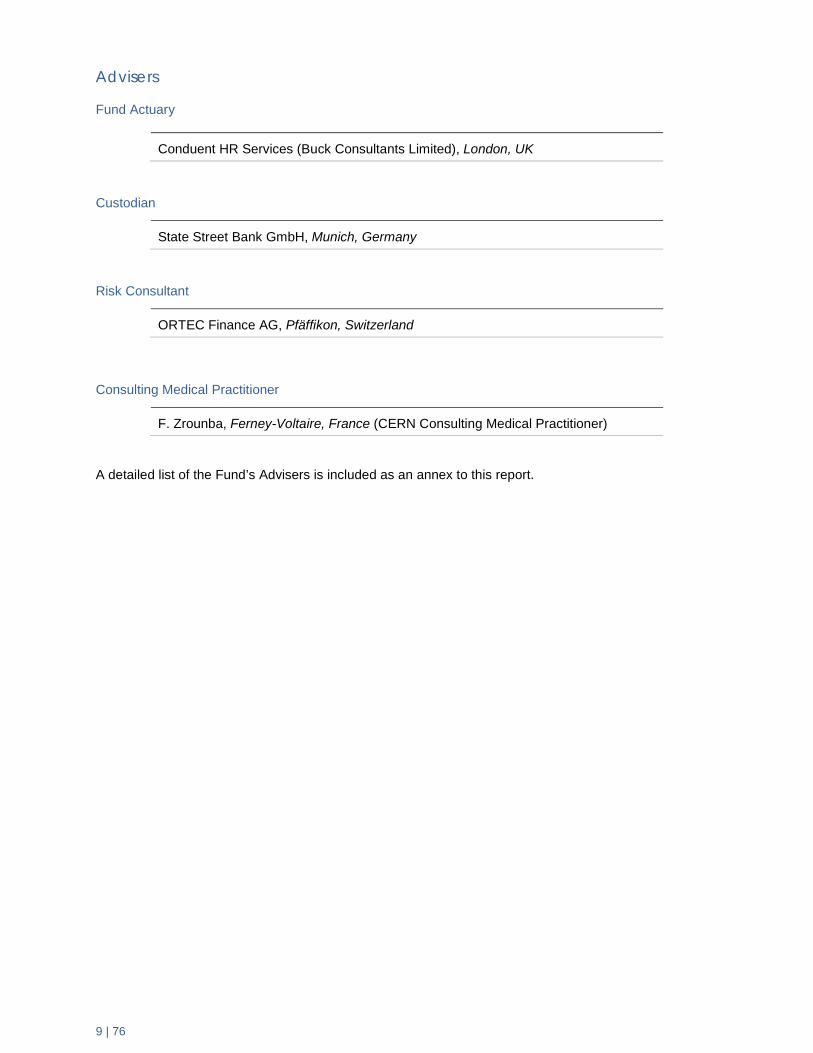
Advisers
Fund Actuary
Conduent HR Services (Buck Consultants Limited), London, UK
Custodian
State Street Bank GmbH, Munich, Germany
Risk Consultant
ORTEC Finance AG, Pfäffikon, Switzerland
Consulting Medical Practitioner
F. Zrounba, Ferney-Voltaire, France (CERN Consulting Medical Practitioner)
A detailed list of the Fund’s Advisers is included as an annex to this report.

10 | 76
2. Overview of the year 2016 Pension Fund Governing Board
The PFGB met six times during the year (2015: six times). There was a 93% attendance record by the members of the PFGB.
The PFGB agendas included recurrent items such as the approval of the submission of Fund’s financial statements to CERN Council, the approval of the Fund’s risk measure, the review of the Fund’s actuarial “dashboard” presented by the Fund’s Actuary, the review and approval of the audit plan of the specialised auditor, as well as the approval of the Fund’s budget for administrative expenses.
At its meeting on 12 May 2016, the PFGB approved the results of the Periodic Actuarial Review as at 1 January 2016, conducted by the Fund’s Actuary. These results were presented to CERN Council in June 2016. Further details of the Periodic Actuarial Review are available in section 4 of this report: “Actuarial Status of the Fund”.
During the year, the PFGB reviewed the draft amendments to the Pension Fund Rules, resulting from the CERN five-yearly review of employment conditions to assess their possible impact on the Fund and concluded that there was negligible impact. These amendments were subsequently approved by CERN Council in its September session.
Following a decision by the PFGB in 2015, a tender of the Fund’s global custodian service was launched during the year.
During 2016, the PFGB also launched a tender process for the auditor specialised in pension fund matters, the tender was launched in order to ensure auditor rotation, which is considered best practice. The tender process is expected to be completed in early 2017.
Pension Fund Investment Committee
The PFIC met five times during the year (2015: six times) including a joint meeting with the PFGB. During the year the PFIC received regular reporting from the Pension Fund Management Unit (PFMU) on the performance of the individual asset classes and examined and reviewed the actions by the PFMU aimed at optimizing the performance of the Fund in line with the risk limit set by the PFGB.
In particular, the PFIC endorsed the strategy defined by the PFMU regarding the continuing review and restructuring of the hedge fund portfolio.
In May the PFIC conducted site visits of the Fund’s real estate properties in Paris and endorsed the PFMU decision to sell three non-core properties in France.
In September the PFIC reviewed the existing external advisory services for real estate, private equity and hedge funds and approved the updates proposed by the PFMU.
In November the PFIC reviewed the assumptions and modelling techniques used by the Fund’s risk consultant to measure the Fund's risk and expected returns. At the same meeting, the PFIC approved the Fund’s Strategic Asset Allocation for 2017.
During the year, the PFIC also reviewed and updated the Statement of Investment Principles and Investment Policy and the Investment Guidelines, reviewed the Fund’s processes for addressing counterparty risk, and reviewed the Fund’s processes for managing proxy voting. The PFIC received regular reporting from the PFMU on the advancement of the custodian tendering process and endorsed the tendering documents prepared by the PFMU including the specification of services and the compliance criteria.

11 | 76
Actuarial and Technical Committee
The Actuarial and Technical Committee (ATC) met four times during the year (2015: four times).
The review of the Periodic Actuarial Review as at 1 January 2016 was an important part of the work performed by the ATC during the year. The ATC also reviewed work performed by the Fund’s Actuary regarding the possible actuarial impact of the proposed amendments to the Fund’s Rules as a result of the CERN five-yearly review. The ATC also reviewed the work by the Actuary regarding the ESO special contributions.
As mentioned above, the ATC was delegated responsibility by the PFGB for the selection and oversight of the tender process for the auditor specialised in pension fund matters. The ATC reviewed the tender documents prior to dispatch and will be the designated evaluation panel as the tender reaches completion in early 2017.

12 | 76
3. Members and beneficiaries The number of members and beneficiaries as at 31 December was as follows:
The number of members as at 31 December 2016 was 3,767 (3,618 as at 31 December 2015), representing an increase of 4.1% compared to 31 December 2015.
The number of beneficiaries as at 31 December 2016, excluding participants in the Progressive Retirement Programme, was 3,610 (3,564 as at 31 December 2015), representing an increase of 1.3% compared to 31 December 2015.
There were 301 members who left the two Organisations (CERN and ESO) during the year 2016 (359 in 2015), 50 of which were retirements (45 in 2015):
2016 2015
CERN ESO Total CERN ESO Total
Members (pre 01.01.2012) 1,915 341 2,256 2,018 356 2,374
Members (post 01.01.2012) 1,395 116 1,511 1,158 86 1,244
Total Members 3,310 457 3,767 3,176 442 3,618
Deferred retirement pensions 152 47 199 134 43 177
Retirement pensions 2,496 92 2,588 2,517 83 2,600
Surviving spouse pensions 732 11 743 702 11 713
Orphan pensions 41 4 45 37 6 43
Disability and ex-gratia 30 5 35 25 6 31
Total Beneficiaries 3,451 159 3,610 3,415 149 3,564
2016 2015
Men Women Total % Men Women Total %
Retirement 44 6 50 17% 40 5 45 13%
Deferred Pension 3 3 6 2% 13 6 19 5%
Disability 4 2 6 2% 3 - 3 1%
Transfer Value 188 47 235 78% 223 66 289 80%
Deaths 3 1 4 1% 3 - 3 1%
Total Departures 242 59 301 100% 282 77 359 100%

13 | 76
4. Actuarial Status of the Fund A key measure when assessing the financial situation of a defined-benefit pension fund such as the CERN Pension Fund (the “Fund”) is the funding ratio. The funding ratio indicates the degree to which the Fund’s assets cover the value of liabilities to be paid now and in the future and is calculated by dividing the net assets at the balance sheet date with the present value of the liabilities.
A funding ratio of 100% means that a pension fund is in a position to service all of its obligations whereas funding ratios in excess of 100% and below 100% indicate overfunding and underfunding scenarios respectively. Funding levels can fluctuate hence many pension funds target a funding ratio above 100%.
Liability Measurement
It is important to note that a pension fund’s liabilities can be defined and measured in a variety of ways and therefore different funding ratios may be calculated for the same fund.
The accumulated benefit obligation (ABO) measure takes into account those liabilities accumulated or accrued at a given valuation date. Only those benefit payments that are due to be made to members and existing beneficiaries at the valuation date are included in this measure and therefore no future accumulation of benefits is assumed.
Another approach to liability measurement which does take into account anticipated increases in benefits is the projected benefit obligation (PBO) method. This measure accounts for expected salary advancement and indexation, and also pension indexation. The funding ratio based on the PBO is generally considered the single most appropriate measure for assessing the financial position of the Fund at a given date.
When considering how a pension fund’s liabilities will evolve over time the PBO liability is projected forward using a consistent set of actuarial assumptions. The PBO can be projected forward on either a ‘closed fund’ or ‘open fund’ basis. For a closed fund projection, no allowance is made for any new entrants to the Fund over time such that the analysis focuses only on the current membership. Conversely, an open fund projection will anticipate new entrants to the Fund, making allowance for the accrual of benefits for these members as time progresses.
Table 1 below summarises the elements of the different liability measures described above:
Table 1
Actuarial Assumptions
In addition, these different methods of determining a funding ratio may use different actuarial assumptions including, salary and pension indexation, longevity and the discount rate. These assumptions are typically derived from studies of previous experience of trends in these variables over different periods of time. The Fund’s actual experience over the study period is compared to the current actuarial assumptions used in the Fund’s actuarial models and where variations are detected adjustments may be made to better reflect, in the actuarial model, the recent and accumulated history of these assumptions. Note that where an experience study is not feasible, actuarial assumptions may instead be set with reference to a fund’s investment strategy, current market conditions, publicly available statistics, legislation, accounting standards, or a best estimate of future trends. The Fund’s Actuary is appointed by the PFGB to carry out the actuarial studies on an independent basis.
Liability Measure Accrued service Salary Indexation Pension Indexation New Entrants
ABO X
PBO (Closed Fund) X X X
PBO (Open Fund) X X X X

14 | 76
In 2016 the CERN Pension Fund has disclosed information on the financial situation of the Fund based on the following different liability measures:
1. The Accounting Measure under International Accounting Standard 26 (IAS 26) – Accounting and Reporting by Retirement Benefit Plans (PBO – Closed Fund)
2. The Updated Funding Measure – Best Estimate assumptions (PBO – Closed Fund) 3. The Periodic Actuarial Review as at 1 January 2016 – Best Estimate assumptions (PBO – Open
Fund)
The key actuarial assumptions applied in the different liability measures are indicated in Table 2 below. The actuarial assumptions used for the Updated Funding Measure as at 31 December 2016 were the “Best Estimate” assumptions. These assumptions are those that were used in the Periodic Actuarial Review as at 1 January 2016.
Table 2
*The underlying best estimate assumption has the following term structure: 1% p.a. until 2024, 1.50% p.a. from 2025 and is unchanged from 31 December 2015. The single equivalent spot rate describes this underlying term structure.
** Following analysis of the mortality experience of the Fund over the years 2003 to 2015, CERN’s best estimate for the Life Expectancy assumption is 83% of the mortality rates contained within the pension VZ2010 base tables. The pension VZ2010 base tables are based on statistics from over 21 public pension funds. The tables include an exponential projection model for future mortality improvements and also use the official demographic projection of the Swiss Federal Office for Social Insurance.
Discount Rate
A key actuarial assumption is the discount rate which is used to calculate the present value of a pension fund’s future liabilities and can be determined in different ways. Given the long term nature of pension fund liabilities, discount rates can be based on long term market interest rates or on actuarial assumptions that are more stable. Even small differences in the discount rate used can have a significant effect on the value of the liabilities and therefore the funding ratio. Different discount rates may be used under different approaches to liability measurement disclosed by the Fund. For further details regarding the discount rate applied under IAS 26 please refer to section VI. “Extract of Actuary’s Report on the Fund as at 31 December 2016”
Accounting Measure under IAS 26
Updated Funding Measure
Periodic Actuarial Review
Actuarial Assumptions Best Estimate Best EstimatePBO (Closed Fund) PBO (Closed Fund) PBO (Open Fund)
31 December 2016 31 December 2016 1st January 2016
4.0%: 2017-2019 4.0%: 2016-2019
Discount Rate 1.37%* 4.5%: 2020-2024 4.5%: 2020-2024
5.0%: 2025 onwards 5.0%: 2025 onwards1.0%: 2017-2024 1.0%: 2016-2024
1.5%: 2025 onwards 1.5%: 2025 onwards
1.0%: 2017-2024 1.0%: 2016-2024
1.5%: 2025 onwards 1.5%: 2025 onwards
Fellows: 0.0% Fellows: 0.0%
Life Expectancy 83% VZ 2010 GEN** 83% VZ 2010 GEN** 83% VZ 2010 GEN**
Non fellows: 1.4% to 0.6%. Linear
reduction between age 18 to 64
Salary Advancement 1.50%Non fellows: 1.4% to
0.6%. Linear reduction between
age 18 to 64
Future Salary increase 1.37%*
Future Pension increase 1.37%*
15 | 76
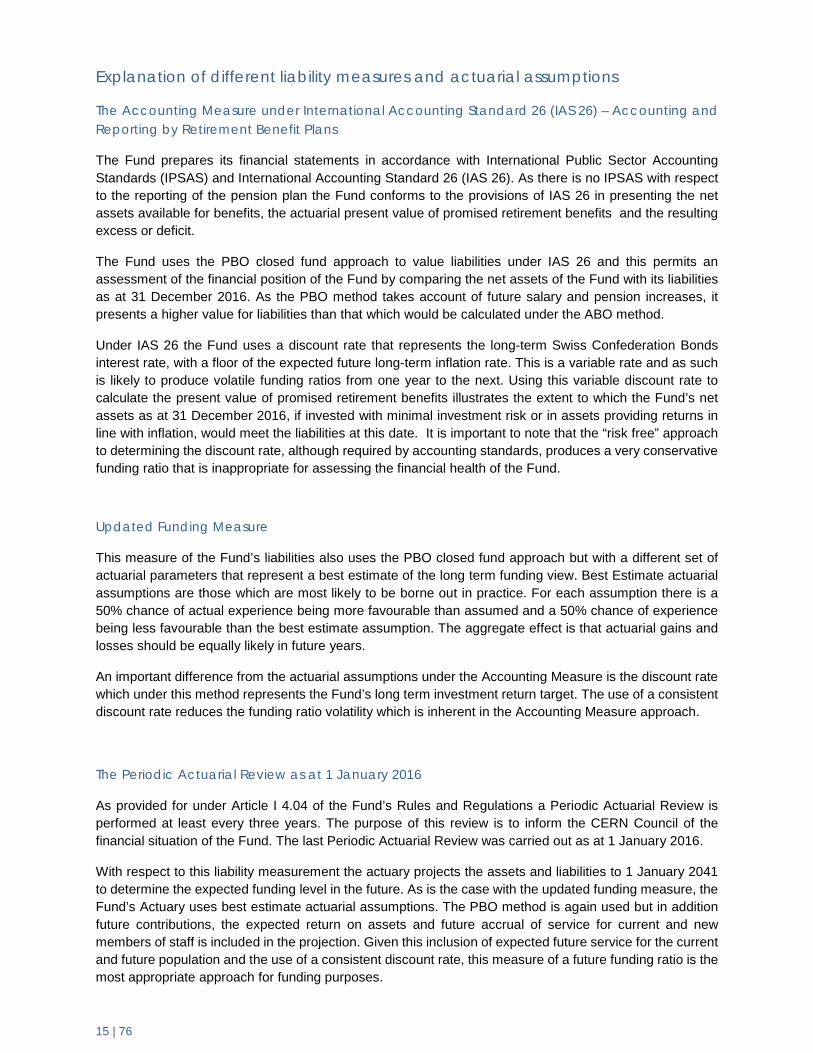
Explanation of different liability measures and actuarial assumptions
The Accounting Measure under International Accounting Standard 26 (IAS 26) – Accounting and Reporting by Retirement Benefit Plans
The Fund prepares its financial statements in accordance with International Public Sector Accounting Standards (IPSAS) and International Accounting Standard 26 (IAS 26). As there is no IPSAS with respect to the reporting of the pension plan the Fund conforms to the provisions of IAS 26 in presenting the net assets available for benefits, the actuarial present value of promised retirement benefits and the resulting excess or deficit.
The Fund uses the PBO closed fund approach to value liabilities under IAS 26 and this permits an assessment of the financial position of the Fund by comparing the net assets of the Fund with its liabilities as at 31 December 2016. As the PBO method takes account of future salary and pension increases, it presents a higher value for liabilities than that which would be calculated under the ABO method.
Under IAS 26 the Fund uses a discount rate that represents the long-term Swiss Confederation Bonds interest rate, with a floor of the expected future long-term inflation rate. This is a variable rate and as such is likely to produce volatile funding ratios from one year to the next. Using this variable discount rate to calculate the present value of promised retirement benefits illustrates the extent to which the Fund’s net assets as at 31 December 2016, if invested with minimal investment risk or in assets providing returns in line with inflation, would meet the liabilities at this date. It is important to note that the “risk free” approach to determining the discount rate, although required by accounting standards, produces a very conservative funding ratio that is inappropriate for assessing the financial health of the Fund.
Updated Funding Measure
This measure of the Fund’s liabilities also uses the PBO closed fund approach but with a different set of actuarial parameters that represent a best estimate of the long term funding view. Best Estimate actuarial assumptions are those which are most likely to be borne out in practice. For each assumption there is a 50% chance of actual experience being more favourable than assumed and a 50% chance of experience being less favourable than the best estimate assumption. The aggregate effect is that actuarial gains and losses should be equally likely in future years.
An important difference from the actuarial assumptions under the Accounting Measure is the discount rate which under this method represents the Fund’s long term investment return target. The use of a consistent discount rate reduces the funding ratio volatility which is inherent in the Accounting Measure approach.
The Periodic Actuarial Review as at 1 January 2016
As provided for under Article I 4.04 of the Fund’s Rules and Regulations a Periodic Actuarial Review is performed at least every three years. The purpose of this review is to inform the CERN Council of the financial situation of the Fund. The last Periodic Actuarial Review was carried out as at 1 January 2016.
With respect to this liability measurement the actuary projects the assets and liabilities to 1 January 2041 to determine the expected funding level in the future. As is the case with the updated funding measure, the Fund’s Actuary uses best estimate actuarial assumptions. The PBO method is again used but in addition future contributions, the expected return on assets and future accrual of service for current and new members of staff is included in the projection. Given this inclusion of expected future service for the current and future population and the use of a consistent discount rate, this measure of a future funding ratio is the most appropriate approach for funding purposes.

16 | 76
Funding Situation under different Liability Measures
Table 3 below shows the funding situation under each of the liability measurement approaches:
Table 3
There is no Funding Ratio at 1 January 2041 under the first two measurement approaches above as they are projected on a closed fund basis.
Summary
Different approaches to the measurement of liabilities may be applied to determine the financial situation of a pension fund under different scenarios and to meet the requirements of accounting standards.
The most appropriate method of liability measurement for assessing the funding situation is the PBO in an open fund scenario as determined in the Fund’s three-yearly Periodic Actuarial Review.
Funding Position Funding Position Funding Position
Liability MeasureAccounting Measure
under IAS 26 Updated Funding
MeasurePeriodic Actuarial
Review
As at 31 December 2016
As at 31 December 2016
As at 1 January 2016
kCHF kCHF kCHF
Net assets of the Fund 4,059,952 4,059,952 4,092,809
Acturial Liabilities 10,165,786 5,598,243 5,604,318
Surplus/(Deficit) in the Fund (6,105,834) (1,538,291) (1,511,509)
Funding Ratio at date of measure 39.9% 72.5% 73.0%
Funding Ratio at 1 January 2041 N/A N/A 113.6%

17 | 76
5. Investment Report Macroeconomics highlights
2016 was marked by important political events, volatile financial markets and a pick-up in business confidence in the latter part of the year.
The uncertainty surrounding the resilience of developed and especially emerging markets affected asset prices in the first quarter of the year. The one-off devaluation of the Chinese yuan in early January was interpreted as a sign that the government was concerned about domestic economic momentum. This led to a tightening of global financial conditions (higher corporate spreads, an increase in the value of the US dollar and lower stock prices), which further dampened the global growth expectations. Financial market participants reduced their inflation forecasts as asset prices fell sharply.
These developments pushed central banks to signal that they would be more accommodative. The Federal Reserve surprised investors by significantly lowering the number of rate hikes it anticipated during the year. The European Central Bank (ECB) indicated early on that easing policies were likely and in March announced a larger monetary stimulus than expected. The Bank of Japan also cut rates to bring them into negative territory for the first time.
The monetary loosening, together with signs of stabilisation in China and other economies, set the stage for a strong rebound in risk assets. A rise in commodity prices, in particular oil prices, helped to support the creditworthiness of energy companies. This also had an impact on headline inflation, which started to increase in a number of economies.
Market volatility returned after the UK’s unexpected decision to leave the European Union (Brexit). In late June, when the results of the referendum were announced, the global financial markets experienced large declines. The European and US equity markets were hit, while government bond yields fell to historic lows across most developed economies.
Expectations of supportive central bank actions and signs that the economic impact would be less dramatic than feared buoyed the equity markets, which quickly reversed their losses. Monetary policy became somewhat more expansive: the Federal Reserve again postponed rate hikes to the end of the year, while the Bank of England cut interest rates and expanded its bond purchase programme. However, there was no increase in quantitative easing by the ECB or the Bank of Japan.
The surprise election of Donald Trump in November, together with signs that global business confidence had picked up, sent equity markets soaring. Bond yields also rose rapidly as inflation expectations picked up and the European Central Bank signalled that it would reduce bond purchases in 2017. However, this did not derail the improved sentiment seen across the globe. Certain indicators, such as the US small firm business confidence index and the consumer confidence indices, surged to reach multi-year highs.
In this context, the Federal Reserve increased interest rates for the second time in twelve months and announced that it expected to raise rates three times in 2017.

18 | 76
Risk Management and Asset Allocation
The Fund’s risk management and asset allocation policy is set out in the Statement of Investment Principles and Investment Policy (SIP), which is approved by the PFGB. It is based on setting an annual risk limit and an annual Strategic Asset Allocation (SAA), and on managing the asset allocation exposure in a manner compatible with both the risk limit and the investment return objective.
The Fund’s return objective is to meet or exceed a 3% annualised return above Geneva inflation over the long term. The PFGB set the same risk limit for 2016 as for 2015, namely a 5% CVaR (Conditional Value-at-Risk) limit of -8%.The SAA for 2016, defined by the PFMU in collaboration with the Risk Consultant (Ortec Finance) and endorsed by the PFIC, is shown in Table 4:
Asset class SAA 2016 SAA 2015 Fixed Income 30% 35% Equity 25% 20% Real Estate 20% 20% Timber/Farmland 5% - Private Equity 5% 5% Hedge Funds 10% 10% Cash 5% 10%
Table 4: SAA
The 2016 SAA approved in November 2015 was above the risk limit from the beginning of 2016 and ranged between 8.5% and 10% for most of the year. This was due to major shifts in the macroeconomic indicators that impact the forward-looking scenarios used to evaluate the allocation risk.
This drift towards higher risk continued throughout the year. It was therefore necessary to modulate the Fund’s allocation away from the SAA, in collaboration with the risk consultant, in order to remain compliant with the risk limit. To this end, as most of the risk identified by the models was coming from the equity allocation, the Fund maintained a lower net exposure to equities of more than 5 percentage points throughout the year. This was implemented mostly through optional strategies and futures hedges in order to allow the allocation to capture upside and alpha, albeit in a reduced way. The allocations to other asset classes remained in line with the SAA, with the exception of a 1% allocation to gold, which was introduced for diversification and risk reduction purposes.
Throughout 2016, the Fund’s risk, as estimated by Ortec Finance remained close to but within the 1-year 5% CVaR limit of -8%.
During the year, the PFMU further developed its portfolio diagnostics tools and fostered the development of macroeconomic and market diagnostics tools, which collectively provided valuable input for risk management in a highly challenging year.

19 | 76
Portfolio Performance in 2016
In 2016 the Fund returned 1.48%1 net of external management fees, as reported by the custodian. Figure 1 below shows the Fund’s cumulative returns compared to the return objective since December 2011, as reported by the custodian. The cumulated returns of the Fund over the 5 year period from 31 December 2011 exceed the objective by 11 percentage points as at 31 December 2016.
Figure 1: Cumulative Returns vs. Objective
Currency Hedging Policy
Throughout the year the Fund maintained a prudent currency hedging policy, hedging between 90% and 100% of its overall currency exposure on average. This prudent approach allowed the Fund to minimise the impact of Brexit.
Fixed income
The Fund’s fixed income portfolio was largely invested throughout the year, with cash representing an average of 2% to 5%. Government bonds accounted for about a third of the fixed income portfolio, while corporate and private debt made up the rest.
The government bond allocation was weighted more heavily towards developed markets while retaining some exposure to higher-risk emerging market debt. The PFMU adopted a cautious approach to the emerging market (EM) allocation to avoid sharp losses. The exposure to EM debt was gradually increased to reach 8% of the fixed income portfolio by the end of 2016. EM bonds were carefully selected in favour of the least volatile instruments issued by states with strong macroeconomic and political fundamentals.
The corporate bond allocation also focuses on higher-quality issuers and is highly diversified, comprising instruments issued by over 120 different entities. The PFMU has been quite successful in actively trading insurance company subordinated debt and subordinated corporate bonds. The two allocations returned more than 6% and 9%, respectively, in Swiss franc terms.
With interest rates at close to all-time lows and as governments signalled that they would be more willing to increase spending, it seemed that the risk of a rise in the cost of borrowing had increased. The fixed income portfolio’s exposure to interest rates was therefore kept low, with a duration (a measure of interest rate sensitivity) of only around 3 to 5 years. In addition, the portfolio was actively managed with hedges to reduce the risk. Moreover, the allocation to bonds with maturities exceeding 10 years, was significantly reduced during the year. This allowed the Fund to avoid significant losses when US interest rates started to rise. Taking the view that inflation was set to rise, the PFMU also decided to keep a significant exposure to inflation-linked bonds of between 10% and 15%.
1 The performance figure provided by the custodian is the time weighted return which aims to measure the true investment performance by eliminating the effects of capital flows pertaining to membership activities. It should be noted that the direct administrative costs of the Fund (personnel and material) are eliminated from the investment performance figure.
95%
100%
105%
110%
115%
120%
125%
130%
Dec-11 Jun-12 Dec-12 Jun-13 Dec-13 Jun-14 Dec-14 Jun-15 Dec-15 Jun-16 Dec-16
Figure 1: Cumulative Return vs. Objective
CERN PF
3% + GenevaInflation

20 | 76
Early in the year, risk asset prices declined on the back of global growth concerns, while government bonds increased in value. During this period, the corporate bond and emerging market allocation of the fixed income portfolio suffered despite its high quality bias. However, exposure to government bonds offset some of these losses and limited the overall decline. From mid-February, global asset prices reversed most of these falls as central banks signalled that they would be more accommodative. Government bond prices generally performed positively, although there was some volatility. In April, for example, the performance of the government bond allocation was slightly negative.
From mid-February, corporate debt prices rose sharply as confidence about economic growth improved and the ECB announced a new bond-buying programme aimed at this sector. The rally moderated in May, partly due to very large amounts of debt issuance that took advantage of lower long-term interest rates and anticipated the start of the ECB programme. The Fund opportunistically bought some of these assets to capture the new issue premium.
In late June, market volatility returned following the UK’s vote to leave the European Union. Although lower-quality names suffered, the Fund’s defensive and higher-quality stance allowed the fixed income portfolio to remain broadly resilient to the gyrations in asset prices.
The end of the year was in general positive for the fixed income market. The Fund made substantial profits on its exposure to inflation-linked instruments and scaled down its exposure to France and Italy to avoid being buffeted by the anticipated volatility linked to political events in 2017. The Fund also continued to acquire some emerging market exposure (Mexico for example). Finally, the significant decline in the government bond market was mitigated by the hedges in place for Italy, France and corporate credits.
On the private debt side, the US market was characterised by an increasing number of borrowers accessing this alternative credit market. In Europe, the private credit markets closed the year with a robust deal volume in spite of the slowdown in the UK market, which is the largest in Europe.
As at December 2016, the Fund had committed, the equivalent of more than 85 million Swiss francs across six vehicles of private debt. The European fund allocation comprises one 40 million euros fund focused on European syndicated loans. The US fund allocation comprises five funds with a total commitment of 42 million US dollars. Most of these, which are direct lending funds, invest in the senior secured loans of US middle-market companies with earnings before interest, tax, depreciation and amortisation (EBITDA) of between 10 and 75 million US dollars. The private debt fixed income portfolio also includes one CLO (collateralised loan obligation) fund in which the Pension Fund has invested 55 million US dollars.
By the end of 2016 the fixed income portfolio had returned 1.56% in Swiss franc terms including hedging costs.
Equities
Macro events significantly impacted the equity markets and volatility at key moments during the year, particularly in June at the time of the EU membership referendum in the UK and early in November in the period leading up to the US presidential election. However, the equity performance was quite positive for the year as a whole, in spite of the market turbulence.
Of the Fund’s three major equity market allocations, the US portfolio outperformed. The total return of the S&P 500 was +12.0%, driven by strong contributions from energy, financials and industrials. European equities performed solidly but less so than the US market, returning +3.3%. Notable detractors from performance were European financials, which returned -1.1%, and the healthcare sector, which returned -8.6%. European markets were also hindered by political events in the region, including the UK referendum and the Italian banking crisis. It was a difficult year for Japanese stocks. The Bank of Japan adopted a negative interest rate policy, causing a sell-off in the Japanese banking sector and in Japanese equities in general. An extremely strong yen in the first three quarters of the year also put negative pressure on

21 | 76
Japanese stocks. Despite a strong equity rally from September onwards, the Topix index ended the year flat. In the first quarter, the PFMU cut the Fund’s US small cap equity exposure by 15 million US dollars to reduce risk. It also switched 30 million US dollars of equity exposure from the US S&P 500 index to the US energy sector to take advantage of this sector’s undervaluation, as well as investing 20 million US dollars in the gold mining sector via the VanEck Vectors Gold Miners Exchange-traded fund. Overall equity risk was further reduced by selling 40 million euros of Eurostoxx futures and by increasing put options in the US by a notional amount of 75 million dollars. The severe drawdown during the quarter was particularly detrimental to the Japanese equity portfolio (3.5% allocation), the US small cap portfolio and parts of the European equity portfolio, such as technology stocks and the allocation to the Swiss pharmaceutical companies Roche and Novartis, which represents a large overweight. However, the positions in the US energy sector and the gold mining sector helped to offset some of this weakness.
During the second quarter, the uncertainty surrounding the Brexit referendum in June brought significant market turmoil in the lead-up to the vote. After the result in favour of leaving the EU was announced the market experienced a brief sell-off, but this was quickly followed by the beginnings of a rally, which continued throughout the rest of the year. The result of the vote had a significant negative effect on UK domestic stocks such as banks, retail and real estate, and it remains to be seen how badly these sectors will be affected going forward. On the flip side, global companies listed in the UK, mostly FTSE 100 constituents, performed very well due to the large drop of around 12% in the pound’s value against the US dollar since the Brexit result. As risk continued to increase despite the Fund’s considerable equity hedges, the PFMU was forced to reduce risk once again in the second quarter and to cut positions in Japanese equities by approximately 50 million Swiss francs. At the end of the quarter, the negative effect of the Japanese equity allocation continued to be a strong negative contributor to performance.
In the third quarter, a supportive monetary policy, better macro data than anticipated and moderate micro fundamentals led to a continued strong recovery in equity prices. Within the European book, UK large cap companies such as UK pharmaceuticals, mining and consumer staples performed extremely well on the back of the weakening pound. Japanese equities as well as the US and European small cap portfolios also began to outperform in the recovery phase of the markets. The US equity book benefited from the large energy overweight.
The equity market continued to perform strongly throughout the fourth quarter. After the election victory of Donald Trump on 8 November, equity prices climbed significantly thanks to renewed optimism that Trump and the Republican clean sweep in Congress could foster better US growth and improve future earnings. Earnings growth appeared to have finally troughed in the third quarter after five consecutive quarters of negative growth.
The Fund’s equity book performed well in the fourth quarter, helped by the Japanese book and the internal portfolio. The latter’s performance benefited from an overweight in quality energy companies and from the inclusion of successful technology companies such as Temenos, which announced a new core banking deal in early October, and ST Micro, which raised 4th quarter guidance in sales and margins. A large holding in the Swiss biotech company Actelion also made a large positive contribution, ending the year up by 60% after announcing that it was negotiating a deal to be acquired by Johnson & Johnson. On the negative side, the position in the VaNeck Vectors Gold Mining ETF had a negative impact on the US equity book, as the price of gold suffered amidst a strongly appreciating dollar and a rapidly rising US yield curve. In line with its constructive view on European equities, the PFMU reduced the European equity hedge by 35 million Swiss francs. It also adjusted the US book towards a reflation/value bias, with increases in financials, materials and industry. At year end, the PFMU implemented a further hedge of 100 million US dollars by selling S&P 500 E-mini futures.
The year-end performance of the Fund’s equity portfolio stood at 2.6% in Swiss franc terms including hedging costs.

22 | 76
Real Assets: Real Estate – Farmland – Timber
During 2016, the global real-estate market was characterised by a demand/supply issue. More specifically, the solid performance of properties attracted the persistent and aggressive allocation of capital as investors sought yield in a low-growth world. For example, Preqin, a leading independent data provider in the real-asset industry, reported that its real-estate index had risen for 20 consecutive quarters. At the same time, a continued shortage of available assets made it challenging for many investors to access quality assets, thus creating a long-term shift in the pricing of real estate globally. As a result of these trends, yields compressed further. This was particularly evident for prime offices in several markets. According to Preqin, Paris, Sydney and Toronto experienced reductions in Q3 of -0.25%, -0.2% and -0.1%, respectively.
In Europe, with the exception of the UK, the market performed well in spite of difficulties such as subdued economic growth, historically high valuations, the high likelihood of higher long-dated government bond yields and geopolitical risks. For example, commercial vacancy rates fell as a result of robust activity and high investment demand for high-quality buildings. In the UK, the market dynamics were different. Following the Brexit vote, the UK saw a slowdown of its commercial market, especially for offices, whose investment volume was down 36% in US dollar terms year on year (Q1-Q3 2016 vs Q1-Q3 2015).
So far the Brexit vote did not impact the Fund’s UK portfolio. Between 31 December 2015 and 31 December 2016 the overall value of Fund’s building in London increased by +0.40% in local currency. This is explained by several factors, including the good diversification of the properties in terms of size. The farm in the UK, 664 hectares in Cambridge, largely comprises arable land and residential reported a decrease in value of -0.56% in local currency mostly due to reduction in land value of 5%. The reduction in land value of the farm was offset by an increase in the value of residential dwellings driven by a continued demand against a limited supply.
At the end of 2016 the Fund’s Investment Property portfolio comprised 17 properties with a total Net Asset Value of 764 million Swiss francs, which represents about 20% of the Fund’s total assets. The Fund was invested in three residential buildings in Switzerland, seven residential and commercial properties in France, including four parcels of woodland with a total area of 2,000 hectares, plus two office buildings in Germany and five buildings in the UK, mostly offices but also a farm. In addition, the Fund also has exposure to US forests and New Zealand dairy farmland through a limited partnership.
In 2016 the Fund sold off office buildings in Levallois, Paris, France (1605 m2), Boulogne, Paris, France (6617 m2) and Hoofddorp, Amsterdam, Netherlands (8382 m2) in line with its strategy of taking profits on assets with uncertain upside and risky income streams.
The property in Levallois was sold for 7.3 million euros, compared to an historical acquisition price of 1.7 million euros in 1984. The final net IRR in local currency was 15.9%. The property in Boulogne was sold for 26.5 million euros, compared to an historical acquisition price of 15.9 million euros in 1989. The net IRR since inception was 7.74%. The property in Hoofddorp was sold for 4 million euros, compared to an acquisition price of 14.2 million euros in 1994. The asset delivered a net IRR of 4.97% in local currency. With the sale of Hoofddorp, the Fund completely exited the Dutch real-estate market.
Despite thoroughly scanning the market throughout 2016, the Fund did not purchase any new real estate assets, due to the low yield of properties caused by a material imbalance in supply and demand. This imbalance translated into higher prices and lower yields.
In spite of pressure on commodity prices, global farmland prices remained strong. The Savills Global Farmland Index recorded an average annualised growth of 14.8% since 2002 and of 6.6% over the past five years. According to this index, farmland values are less volatile on average than the values of other commodities and have not recorded the significant falls of oil and soft commodities in recent years. The key points for successful investment are: portfolio diversification, in order to spread risk across regions and companies; and performance fuelled by both income yields and capital growth.
23 | 76
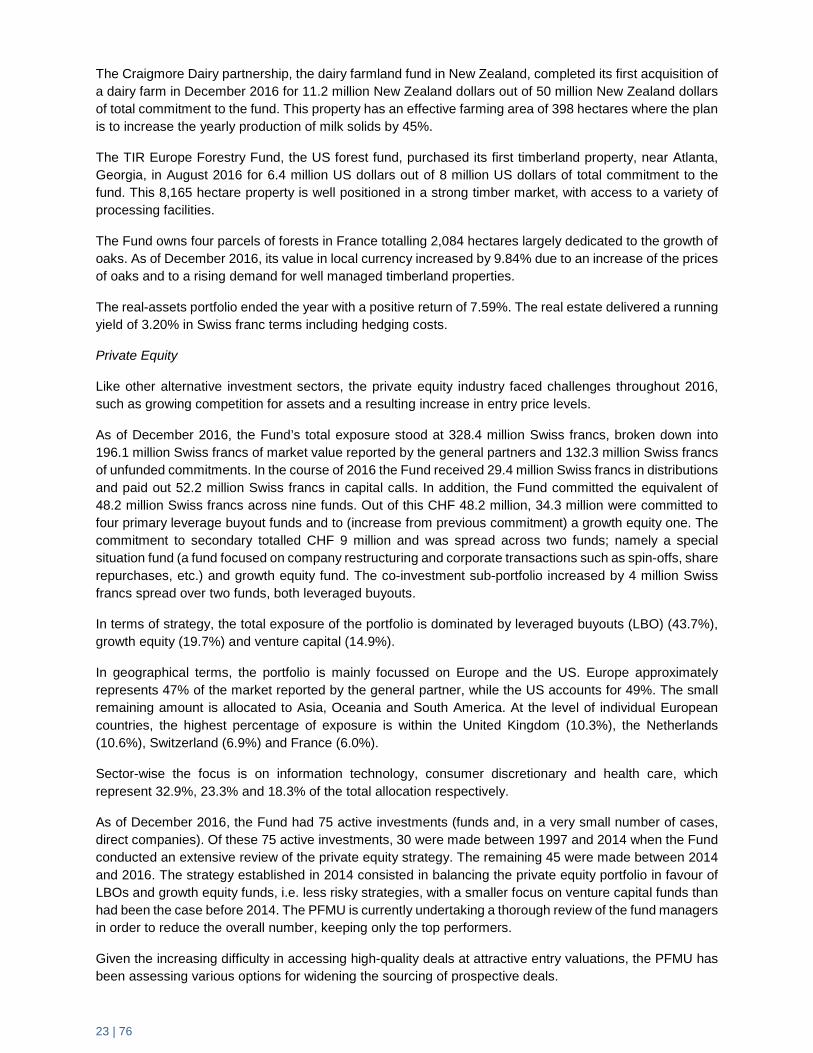
The Craigmore Dairy partnership, the dairy farmland fund in New Zealand, completed its first acquisition of a dairy farm in December 2016 for 11.2 million New Zealand dollars out of 50 million New Zealand dollars of total commitment to the fund. This property has an effective farming area of 398 hectares where the plan is to increase the yearly production of milk solids by 45%.
The TIR Europe Forestry Fund, the US forest fund, purchased its first timberland property, near Atlanta, Georgia, in August 2016 for 6.4 million US dollars out of 8 million US dollars of total commitment to the fund. This 8,165 hectare property is well positioned in a strong timber market, with access to a variety of processing facilities.
The Fund owns four parcels of forests in France totalling 2,084 hectares largely dedicated to the growth of oaks. As of December 2016, its value in local currency increased by 9.84% due to an increase of the prices of oaks and to a rising demand for well managed timberland properties.
The real-assets portfolio ended the year with a positive return of 7.59%. The real estate delivered a running yield of 3.20% in Swiss franc terms including hedging costs.
Private Equity
Like other alternative investment sectors, the private equity industry faced challenges throughout 2016, such as growing competition for assets and a resulting increase in entry price levels.
As of December 2016, the Fund’s total exposure stood at 328.4 million Swiss francs, broken down into 196.1 million Swiss francs of market value reported by the general partners and 132.3 million Swiss francs of unfunded commitments. In the course of 2016 the Fund received 29.4 million Swiss francs in distributions and paid out 52.2 million Swiss francs in capital calls. In addition, the Fund committed the equivalent of 48.2 million Swiss francs across nine funds. Out of this CHF 48.2 million, 34.3 million were committed to four primary leverage buyout funds and to (increase from previous commitment) a growth equity one. The commitment to secondary totalled CHF 9 million and was spread across two funds; namely a special situation fund (a fund focused on company restructuring and corporate transactions such as spin-offs, share repurchases, etc.) and growth equity fund. The co-investment sub-portfolio increased by 4 million Swiss francs spread over two funds, both leveraged buyouts.
In terms of strategy, the total exposure of the portfolio is dominated by leveraged buyouts (LBO) (43.7%), growth equity (19.7%) and venture capital (14.9%).
In geographical terms, the portfolio is mainly focussed on Europe and the US. Europe approximately represents 47% of the market reported by the general partner, while the US accounts for 49%. The small remaining amount is allocated to Asia, Oceania and South America. At the level of individual European countries, the highest percentage of exposure is within the United Kingdom (10.3%), the Netherlands (10.6%), Switzerland (6.9%) and France (6.0%).
Sector-wise the focus is on information technology, consumer discretionary and health care, which represent 32.9%, 23.3% and 18.3% of the total allocation respectively.
As of December 2016, the Fund had 75 active investments (funds and, in a very small number of cases, direct companies). Of these 75 active investments, 30 were made between 1997 and 2014 when the Fund conducted an extensive review of the private equity strategy. The remaining 45 were made between 2014 and 2016. The strategy established in 2014 consisted in balancing the private equity portfolio in favour of LBOs and growth equity funds, i.e. less risky strategies, with a smaller focus on venture capital funds than had been the case before 2014. The PFMU is currently undertaking a thorough review of the fund managers in order to reduce the overall number, keeping only the top performers.
Given the increasing difficulty in accessing high-quality deals at attractive entry valuations, the PFMU has been assessing various options for widening the sourcing of prospective deals.

24 | 76
The private equity portfolio ended the year at 4.06% in Swiss franc terms including hedging costs.
Hedge funds
During 2016 the decision was made to further reduce the hedge fund allocation to 7% of the overall portfolio. As part of this reduction, the Fund opted to fully redeem from Event Driven strategies and also to trim some core multi-strategy holdings (Millennium, Citadel). The Event Driven strategies will be partly replaced by managed futures strategies in order to enhance diversification properties of the hedge fund portfolio with respect to traditional asset classes.
During the year, new allocations were made to Aeolus, the portfolio’s first Insurance-linked exposure (3 million US dollars), and to Systematica BlueTrend managed futures strategy (9 million US dollars).
2016 was a challenging environment for Multi-Strateqy and Systematic strategies however the environment stabilized in the second part of the year, particularly within Multi-Strategies. Amidst the reduction in size, the portfolio generated positive returns of +1.1% in US dollars during 2016.
Conclusions
Due to major shifts in the macroeconomic indicators, during most of the year the Strategic Asset Allocation (SAA) 2016 was above the risk limit ranging between 8.5% and 10%, while the Fund stayed within the limit by reducing equity exposure, increasing the allocation in anti-correlated assets, and using derivative overlays. As a result the Fund managed to navigate well through the three main periods of market distress during 2016: January sell off, Brexit vote and US elections. The Fund, mindful of dimensions of risk, run a very short duration Fixed Income allocation and exercised utmost scrutiny in the assessment of illiquid assets opportunities. Overall the Fund’s prudent approach enabled it to weather successfully the difficult markets of 2016.
In 2017 the economic and investment outlook remains highly uncertain despite heightened optimism around US elections and the improvement in some sentiment indicators.
The new US administration has signalled its intent to create a more business-friendly environment by cutting regulations, reducing taxation and launching a vast infrastructure spending program. While financial market participants have viewed this as positive for corporate profits and equity markets have risen there are reasons why this might also be less benign going forward. There are significant doubts about the timing, size and even feasibility of these proposals and any disappointments might be viewed negatively by investors. Political uncertainty in Europe is also elevated where elections results in some large countries might entail a sharp increase in market volatility. If the pickup in business sentiment does not translate itself into concrete rebound in profits this might also be viewed negatively by market participants. The investment outlook is relatively constructive but requires great caution given these concerns.

25 | 76
II. Annex
Bankers
ABN Amro Bank N.V., Utrecht, Netherlands
Banque Cantonale de Fribourg, Fribourg, Switzerland
Barclays Bank plc, Cambridge, UK
Bankhaus Ellwanger & Geiger KG, Stuttgart, Germany
Credit Agricole Centre-Est, Oyonnax, France
Credit Suisse AG, Zurich, Switzerland
Deutsche Bank AG, Berlin, Germany
Mirabaud & Cie Banquiers Privés SA, Geneva, Switzerland
Post Finance SA, Lausanne, Switzerland
Société Générale SA, Annemasse, France
UBS SA, Nyon, Switzerland
Brokers and Derivatives Counterparties
Bank of America Merrill Lynch, New York, USA
Barclays Bank PLC, London, UK
BBSP Partners SAS, Paris, France
Bloomberg L.P., New York, USA
BNP Paribas SA, Paris, France
Canaccord Genuity Corp., Vancouver, Canada
Cantor Fitzgerald L.P., New York, USA
Carax SA, Paris, France
Citigroup Inc., New York, USA
La Compagnie Benjamin de Rothschild SA, Geneva, Switzerland
Deutsche Bank AG, Frankfurt, Germany
Exane SA, Paris, France
Goldman Sachs Group, Inc., New York, USA
Helvea, Geneva, Switzerland
Jefferies, London, UK
J.P. Morgan Chase & Co., London, UK
Louis Capital Market, London, UK

26 | 76
Brokers and Derivatives Counterparties (continued)
MainFirst Bank AG, Frankfurt, Germany
Mirabaud Securities LLP, London, UK
Mizuho Intenational PLC, London, UK
Morgan Stanley & Co. International PLC, London, UK
Rabobank, Utrecht, Netherlands
Safra Sarasin Bank, Basel, Switzerland
Santander Investment, Santander, Spain
Sociéte Générale SA, Paris, France
State Street Corporation, Boston, USA
Stifel Financial Corp., Saint-Louis, Missouri, USA
Tachibana Securities Co.Ltd, Tokyo, Japan
UBS Limited, London, UK
UniCredit SPA, Munich, Germany
Wells Fargo & Co, London, UK
Data Services
Bloomberg Finance L.P., New York, USA
Capital Economics Ltd, London, UK
Equinoxe AIS Ltd, Dublin, Ireland
FTSE International Ltd, London, UK
FX Connect & Trade Services, Frankfurt, Germany
Haver Analytics, New York, USA
Hyperpyron International Partners Inc., Celina, USA
Highsoft, Vik I Sogn, Norway
IPD Investment Property Databank GmbH, Frankfurt, Germany
Morningstar Switzerland GmbH, Zurich, Switzerland
Ned Davis Research Inc., Venice, USA
NYSE Market Inc., Pittsburgh, USA
Preqin Ltd, London, UK
S&P Dow Jones Indices LLC, Chicago, USA
Towers Watson AG, Zurich, Switzerland

27 | 76
External Legal Advisers
Letulle Notaires, Paris, France
Freshfields, Frankfurt, Germany
Gowling WLG LLP, London, UK
Raue LLP, Berlin, Germany
Simmons & Simmons LLP, London, UK
Van Benthem & Keulen Advocaten & Notariaat, Utrecht, Netherlands
Wragge Laurence Graham & Co LLP, London, UK
External Investment Managers – Hedge Funds
Aeolus Capital Management Ltd., Hamilton, Bermuda
Bridgewater Associates Inc., Westport, USA
Capital Fund Management SA, Paris, France
Citadel Advisors LLC, Chicago, USA
Corvex Management L.P., New York, USA
Effissimo Capital Management, Singapore
King Street Capital Management L.P., New York, USA
Millennium International, New York, USA
Pentwater Capital Management L.P., Evanston, USA
Systematica Investments, Geneva, Switzerland
SYZ Asset Management Luxembourg, Luxembourg
Taconic Capital Advisors L.P., New York, USA
Tudor Investment Corporation, Greenwich, USA
Two Sigma Investments, New York, USA
External Investment Managers – Private Debt
Audax Group, New York, USA
Barings Global Credit Funds, Luxembourg
EQT Fund Management S.à r.l., Luxembourg
Freeport Financial Partners LLC, Chicago, USA
NXT Capital, Chicago, USA

28 | 76
External Investment Managers – Private Equity
AE Industrial Partners LLC, Florida, USA
AIF Capital Limited, Hong Kong
Alcuin Capital Partners LLP, London, UK
Alken Luxembourg SA, Luxembourg
American Capital Limited, Maryland, USA
Arbor Private Investment Company IV, LLC, Chicago, USA
CapVest Associates LLP, London, UK
Craigmore Sustainables, Christchurch, New Zealand
Cressey & Company L.P., Chicago, USA
Crestview Partners, New York, USA
DN Capital (UK) LLP, London, UK
Edmond De Rothschild Group, Luxembourg
Endeavour Vision SA, Geneva, Switzerland
Fortissimo Capital, L.P, Rosh Haayin, IL, USA
FTV Capital, San Francisco, USA
GHO Capital Management Limited, London, UK
Globetrotter Co-Investment (GP) Inc., Delaware, USA
Graham Partners, Newton Square, USA
Groupe Siparex, Lyon, France
HarbourVest Partners LLC, Boston, USA
Keensight Capital, Paris, France
L Catterton Partners, Greenwich, USA
LBO France FPCI, Paris, France
Littlejohn & Co., Greenwich, USA
Macquarie Funds Group, Sydney, Australia
Main Post Partners LP, San Francisco, USA
MML Capital Partners, London, UK
Montefiore Investment, Paris, France
Nemo Investor Aggregator Limited, Greenwich, USA
NeoMed Management, Oslo, Norway

29 | 76
External Investment Managers – Private Equity (continued)
Pacific Community Ventures Inc., San Francisco, USA
PAI Partners SAS., Paris, France
Parallax Capital Partners, Laguna Hills, USA
Paul Capital Investments, San Francisco, USA
Premiere Global Services Inc., New York, USA
Quilvest Switzerland Limited, Zurich, Switzerland
Silverstone Capital Partners, Atlanta, USA
Siris Capital Group LLC, New York, USA
Sofinnova Partners SAS, Paris, France
Spectrum Equity Investors, Boston, USA
Spindletop Capital, Austin, USA
Talde Gestion SGEIC SA., Bilbao, Spain
TDR Capital LLP, London, UK
Technology Crossover Ventures, Palo Alto, USA
The CapStreet Group LLC., Houston, USA
Timberland Investment Resources LLC, Boston, USA
TowerBrook Capital Partners L.P., New York, USA
TPG Capital, Texas, USA
Triangle Private Holdings I, LLC, New York, USA
Tudor Investment Corporation, Greenwich, USA
Veronis Suhler Stevenson LLC, New York, USA
Vision Capital Administration LLC, Burlingame, USA
Webster Capital Partners LLC, Waltham, USA
External Investment Managers – External Equity Mandate
Hedge Fund Adviser
Aksia Europe Limited, London, UK
Granahan Investment Management Inc., Waltham, USA
MFS International (U.K.) Limited, London, UK

30 | 76
Private Equity Adviser
Stepstone Group Europe LLP, London, UK
Real Estate Adviser
Rocval S.à r.l., Bailly, France
Real Estate Managers
Comité des forêts, Paris, France
Grontmij Vastgoedmanagement B.V., Amsterdam, Netherlands
Kinney Green, London, UK
Hayter International, Paris, France
IC Property Management GmbH, Berlin, Germany
Moser Vernet & Cie, Geneva, Switzerland
PRÄZISA, Berlin, Germany
Savills (UK) Limited, Cambridge, UK
Real Estate Valuation Experts
BNP Paribas Real Estate, Paris, France
Savills (Incorporating SmithGore), London, UK
EURL P Cochery, Rambouillet, France
Real Estate Auditors
BDO AG, Berlin, Germany
Cabinet Louis Planche, Lyon, France
Rawlinson & Hunter Audit LLP, London, UK
REVIDOR Société Fiduciaire SA, Geneva, Switzerland

31 | 76
FINANCIAL STATEMENTS

32 | 76

33 | 76
III. Audit Opinion
34 | 76
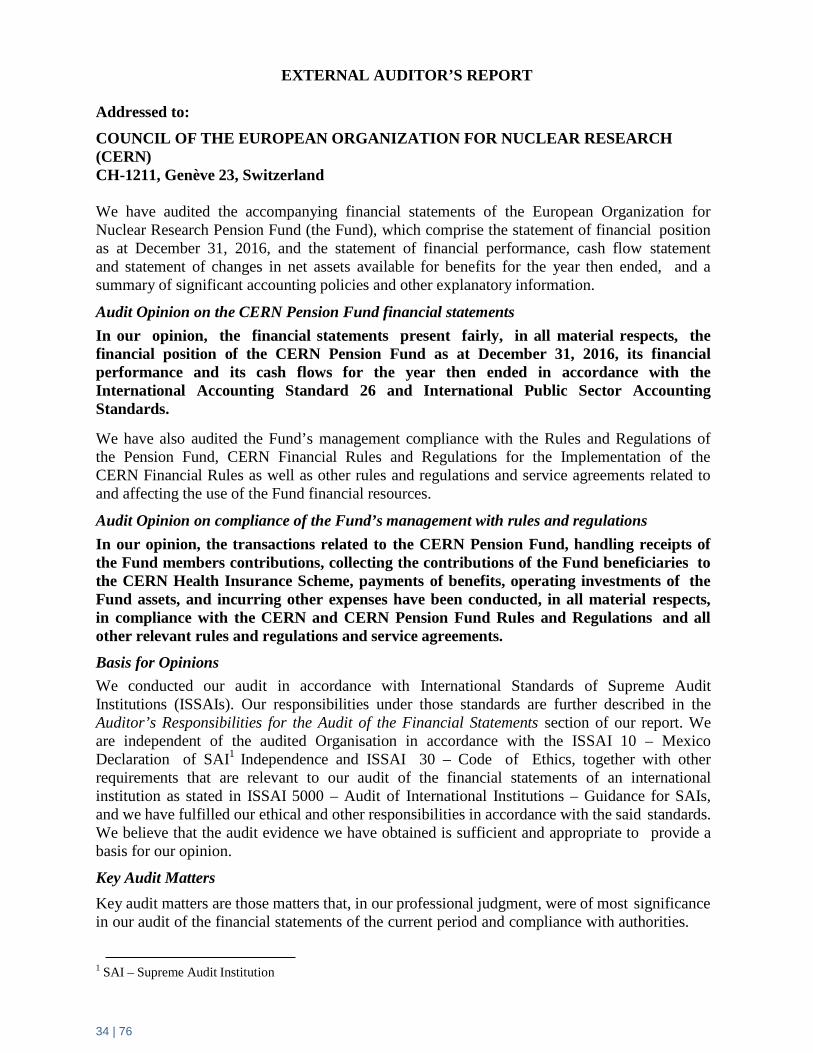
EXTERNAL AUDITOR’S REPORT Addressed to: COUNCIL OF THE EUROPEAN ORGANIZATION FOR NUCLEAR RESEARCH (CERN) CH-1211, Genève 23, Switzerland We have audited the accompanying financial statements of the European Organization for Nuclear Research Pension Fund (the Fund), which comprise the statement of financial position as at December 31, 2016, and the statement of financial performance, cash flow statement and statement of changes in net assets available for benefits for the year then ended, and a summary of significant accounting policies and other explanatory information.
Audit Opinion on the CERN Pension Fund financial statements In our opinion, the financial statements present fairly, in all material respects, the financial position of the CERN Pension Fund as at December 31, 2016, its financial performance and its cash flows for the year then ended in accordance with the International Accounting Standard 26 and International Public Sector Accounting Standards.
We have also audited the Fund’s management compliance with the Rules and Regulations of the Pension Fund, CERN Financial Rules and Regulations for the Implementation of the CERN Financial Rules as well as other rules and regulations and service agreements related to and affecting the use of the Fund financial resources.
Audit Opinion on compliance of the Fund’s management with rules and regulations In our opinion, the transactions related to the CERN Pension Fund, handling receipts of the Fund members contributions, collecting the contributions of the Fund beneficiaries to the CERN Health Insurance Scheme, payments of benefits, operating investments of the Fund assets, and incurring other expenses have been conducted, in all material respects, in compliance with the CERN and CERN Pension Fund Rules and Regulations and all other relevant rules and regulations and service agreements.
Basis for Opinions We conducted our audit in accordance with International Standards of Supreme Audit Institutions (ISSAIs). Our responsibilities under those standards are further described in the Auditor’s Responsibilities for the Audit of the Financial Statements section of our report. We are independent of the audited Organisation in accordance with the ISSAI 10 – Mexico Declaration of SAI1 Independence and ISSAI 30 – Code of Ethics, together with other requirements that are relevant to our audit of the financial statements of an international institution as stated in ISSAI 5000 – Audit of International Institutions – Guidance for SAIs, and we have fulfilled our ethical and other responsibilities in accordance with the said standards. We believe that the audit evidence we have obtained is sufficient and appropriate to provide a basis for our opinion.
Key Audit Matters Key audit matters are those matters that, in our professional judgment, were of most significance in our audit of the financial statements of the current period and compliance with authorities.
1 SAI – Supreme Audit Institution

35 | 76
These matters were addressed in the context of our audit of the financial statements as a whole and compliance with authorities, and in forming our opinion thereon. Key audit matters in the audit of the CERN PF Financial Statements for 2016 were as follows:
1) Valuation of Pension Fund Assets Pension Fund Assets constitute the crucial item in the Pension Fund Financial Statements of the total value MCHF 4,132. They form the basis of PF capability of providing benefits to CERN pensioners and other beneficiaries as well as meeting other Fund’s liabilities. The matter was addressed in the audit by verification of the information provided in the Custodian’s monthly reports against relevant account balances and reconciliation of the values reported in the Statement of Financial Position with the relevant accounting data.
2) Accuracy of reporting Pension Fund Investments
Pension Fund investment reflect active use of PF assets in excess of those utilised for the payment of defined benefits and other expenses of the Fund. As members’ and employers’ (CERN and ESO) contributions to the Fund are not alone sufficient to meet PF obligations the level of return from investments decides about PF long-term capability to pay benefits. The matter was addressed in the audit by verification of the information provided in the Custodian’s monthly reports against relevant account balances and reconciliation of the amounts reported in the Statement of Financial Performance with the relevant accounting data.
3) Accuracy of and compliance of payments of Pension Fund benefits
Payment of Pension Fund benefits is the ultimate goal of the PF operations. The objective of the Fund is to comply with the Rules and Regulations of the Fund in calculating benefits and to report accurately benefits paid. The matter was addressed by a sample check of calculating benefits for surviving spouses and analytical procedures performed in reference to other benefits.
Responsibilities of CERN Pension Fund Management and Those Charged with Governance for the Financial Statements CERN Pension Fund management is responsible for the preparation and fair presentation of these financial statements in accordance with the International Accounting Standard 26 and International Public Sector Accounting Standards, and for such internal control as the management determines is necessary to enable the preparation of financial statements that are free from material misstatement, whether due to fraud or error.
In preparing the financial statements, management is responsible for assessing the Fund’s ability to continue as a going concern, disclosing, as applicable, matters related to going concern and using going concern basis of accounting unless relevant authorities either intend to liquidate the Fund or to cease operations, or has no realistic alternative but to do so.
The Fund’s management is also responsible for the use of the Fund’s financial resources in compliance with all applicable policies, rules and regulations.
Those charged with governance are responsible for overseeing the Fund’s financial reporting process.
36 | 76
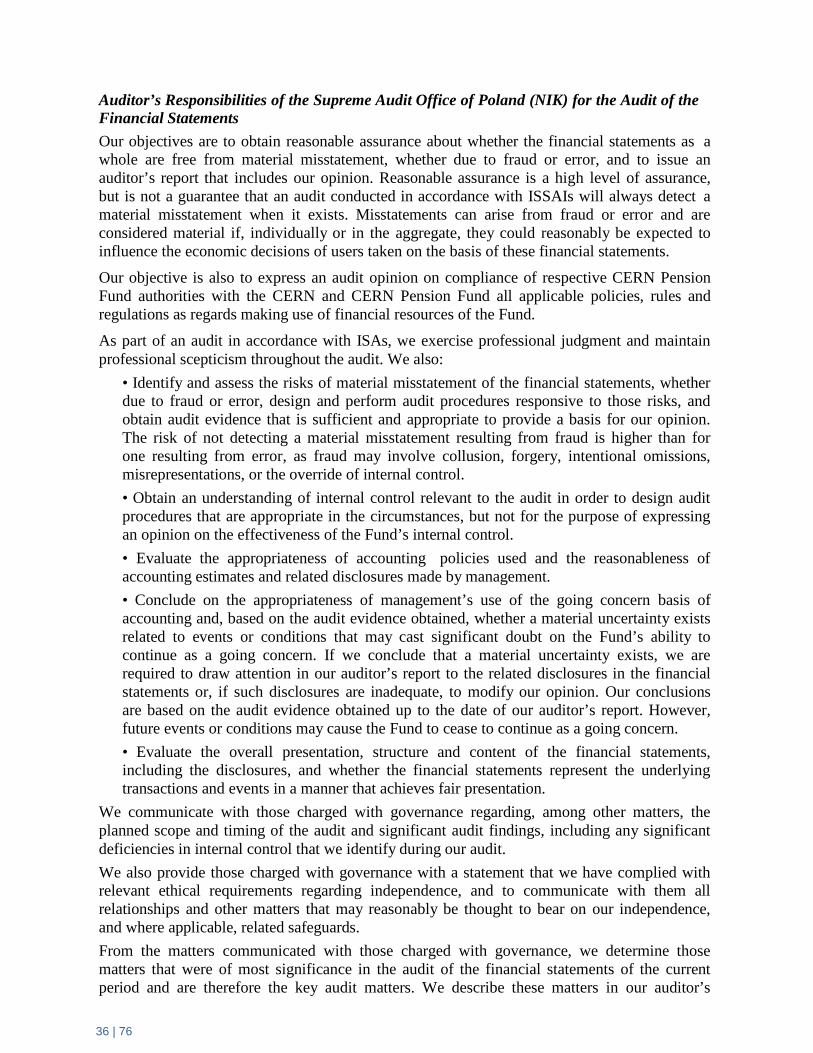
Auditor’s Responsibilities of the Supreme Audit Office of Poland (NIK) for the Audit of the Financial Statements Our objectives are to obtain reasonable assurance about whether the financial statements as a whole are free from material misstatement, whether due to fraud or error, and to issue an auditor’s report that includes our opinion. Reasonable assurance is a high level of assurance, but is not a guarantee that an audit conducted in accordance with ISSAIs will always detect a material misstatement when it exists. Misstatements can arise from fraud or error and are considered material if, individually or in the aggregate, they could reasonably be expected to influence the economic decisions of users taken on the basis of these financial statements.
Our objective is also to express an audit opinion on compliance of respective CERN Pension Fund authorities with the CERN and CERN Pension Fund all applicable policies, rules and regulations as regards making use of financial resources of the Fund.
As part of an audit in accordance with ISAs, we exercise professional judgment and maintain professional scepticism throughout the audit. We also:
• Identify and assess the risks of material misstatement of the financial statements, whether due to fraud or error, design and perform audit procedures responsive to those risks, and obtain audit evidence that is sufficient and appropriate to provide a basis for our opinion. The risk of not detecting a material misstatement resulting from fraud is higher than for one resulting from error, as fraud may involve collusion, forgery, intentional omissions, misrepresentations, or the override of internal control. • Obtain an understanding of internal control relevant to the audit in order to design audit procedures that are appropriate in the circumstances, but not for the purpose of expressing an opinion on the effectiveness of the Fund’s internal control. • Evaluate the appropriateness of accounting policies used and the reasonableness of accounting estimates and related disclosures made by management. • Conclude on the appropriateness of management’s use of the going concern basis of accounting and, based on the audit evidence obtained, whether a material uncertainty exists related to events or conditions that may cast significant doubt on the Fund’s ability to continue as a going concern. If we conclude that a material uncertainty exists, we are required to draw attention in our auditor’s report to the related disclosures in the financial statements or, if such disclosures are inadequate, to modify our opinion. Our conclusions are based on the audit evidence obtained up to the date of our auditor’s report. However, future events or conditions may cause the Fund to cease to continue as a going concern. • Evaluate the overall presentation, structure and content of the financial statements, including the disclosures, and whether the financial statements represent the underlying transactions and events in a manner that achieves fair presentation.
We communicate with those charged with governance regarding, among other matters, the planned scope and timing of the audit and significant audit findings, including any significant deficiencies in internal control that we identify during our audit. We also provide those charged with governance with a statement that we have complied with relevant ethical requirements regarding independence, and to communicate with them all relationships and other matters that may reasonably be thought to bear on our independence, and where applicable, related safeguards. From the matters communicated with those charged with governance, we determine those matters that were of most significance in the audit of the financial statements of the current period and are therefore the key audit matters. We describe these matters in our auditor’s

37 | 76
report unless law or regulation precludes public disclosure about the matter or when, in extremely rare circumstances, we determine that a matter should not be communicated in our report because the adverse consequences of doing so would reasonably be expected to outweigh the public interest benefits of such communication.
Emphasis of matter We draw the Council’s attention to increased technical deficit of the Fund (MCHF 6,106 as compared to MCHF 6,041 in 2015) and accompanied lower level of the PF Funding Ratio (39.9% as compared to 40.4% in 2015). Net assets available for benefits also decreased from MCHF 4,093 in 2015 to MCHF 4,060 in 2016. The level of net assets available for benefits went down below the level of 2013 (MCHF 4,070) or, if compared to the times before the financial crisis, below the level of 2005 (MCHF 4,209).
Signed by:
Ewa Polkowska Wieslaw Kurzyca
Vice-President of NIK Primary Auditor Chairman of CERN Audit of CERN External Audit Steering Committee
19 May 2017 Supreme Audit Office ul. Filtrowa 57 Warsaw, Poland

38 | 76

38 | 76
IV. Financial Statements
1. Statement of Financial Position
**Extract of Actuary’s Report – see section VI
(in kCHF) Note 2016 2015 AssetsCash and Cash Equivalents 5 351,160 440,915 Short-Term Deposits 6 103,600 104,370 Settlements Receivable 32,120 12,973 Sundry Debtors 7 3,612 4,191 Other Receivables 8 5,652 5,199 Derivatives 9 28,420 62,368 Bonds 10 938,358 978,290 Equities 11 727,315 560,733 Investment Funds 12 1,177,320 1,177,974 Total Financial assets 3,367,557 3,347,013 Investment Property 13 764,399 813,843 Total Non-Financial assets 764,399 813,843 Total assets 4,131,956 4,160,856 LiabilitiesSettlements Payable 1 154 Sundry Creditors 14 14,642 18,507 Other Payables 15 3,214 4,461 Derivatives 9 54,147 44,925 Total liabilities 72,004 68,047 Net assets available for benefits 4,059,952 4,092,809
(in kCHF) Note 2016 2015 Vested pension capital **
Transfer values of active members or current value of deferred pensions (without future adjustment) 5,030,941 4,753,200 Mathematical reserves of the beneficiaries 5,134,845 5,380,871 Vested pension capital 10,165,786 10,134,071 Technical deficit (6,105,834) (6,041,262) Funding Ratio 39.9% 40.4%
As at 31 December
As at 31 December

39 | 76
2. Statement of Financial Performance
(in kCHF) Note 2016 2015 Investment IncomeFinancial Assets
Dividend Income 37,129 40,042 Interest Income 16 26,150 26,195 Unrealised Gains/(Losses) on Financial Assets at Fair Value Through Profit & Loss 17 63,887 83,649 Realised Gains/(Losses) on Financial Assets at Fair Value Through Profit & Loss 18 (74,595) (48,078)
Non-Financial AssetsInvestment Property Income 19 28,901 54,195
Foreign Exchange Gains/(Losses) 20 14,996 12,835 Total Investment Income/(Loss) 96,468 168,838 Investment ExpensesFinancial Assets
Investment Management Fees 21 22,269 39,327 Custody Fees and Administration of Securities 1,291 1,295 Transaction Costs 2,357 1,516 Taxation 196 212
Non-Financial AssetsInvestment Property Expenditure 22 8,901 10,181
Investment Related Expenditure 3,348 3,106 Total Investment Expenses 38,362 55,637 Net Investment Income/(Loss) 58,106 113,201 Other ExpensesBank Charges 55 62 Other Financial Expenses 23 1,933 1,106 Administration Costs 24, 26 5,357 5,482 Total Other Expenses 7,345 6,650 Change in Net Assets before Membership Activities 50,761 106,551 Membership Activities 25ContributionsMember Contributions 59,307 57,480 Employer Contributions 110,159 108,270 Employer Special Contributions 61,300 61,300 Purchase of additional years of membership 2,113 983 Indemnities received from third parties 506 68 Compensations 27 1,065 2,033 Procurement of entitlement to pension for surviving spouse 65 71 Total Contributions 234,515 230,205 Benefits and Payments Retirement pensions 252,302 252,463 Disability pensions 2,581 2,507 Surviving spouse pensions 39,323 37,759 Orphans pensions 1,319 1,236 Family allowances 14,671 14,813 Ex gratia payments granted 66 74 Transfer values paid to members 7,365 13,670 Transfer values paid to other schemes 357 (283) Contributions paid to other schemes 149 170 Total Benefits and Payments 318,133 322,409 Net Membership Activities Cost (83,618) (92,204) Net Increase/(Decrease) in Net Assets During Year (32,857) 14,347 Net Assets Available for Benefits at Beginning of Year 4,092,809 4,078,462 Net Assets Available for Benefits at End of Year 4,059,952 4,092,809
Year ended 31 December

40 | 76
3. Cash Flow Statement
(in kCHF) Note 2016 2015 Cash flows from membership activitiesContributions and other receipts 234,355 230,100 Benefits and other payments (321,093) (322,633) Net cash flows from membership activities (86,738) (92,532) Cash flows from investing activities Financial AssetsPurchases of Short-Term Deposits (54,115) (162,065) Purchases of Bonds (1,260,170) (956,110) Purchases of Equities (667,528) (376,987) Purchases of Investment Funds (562,494) (483,115) Proceeds of Short-Term Deposits 54,115 229,688 Proceeds from sale of Bonds 1,307,573 872,228 Proceeds from sale of Equities 454,958 262,404 Proceeds from sale of Investment Funds 610,541 757,822 Net payments from Derivatives (40,105) (17,202) Dividends received 36,071 39,809Interest received 23,847 25,950Non-Financial AssetsInvestment Property payments (15,598) (15,988) Investment Property purchases - (172,850) Proceeds from sale of Investment Property 39,906 2,393 Investment Property receipts 44,642 40,370Tax reimbursements 120 10 Management and Custody Fees paid (7,222) (30,599) Administrative and other Operating expenses paid (10,922) (9,474) Net cash flows from investing activities (46,381) 6,283 Net (decrease) increase in cash and cash equivalents (133,118) (86,249) Cash at beginning of the year 440,915 568,692 Exchange gains /(losses) on cash and cash equivalents 43,363 (41,528) Cash at end of the year 351,160 440,915
Year ended 31 December

41 | 76
4. Statement of Changes in Net Assets Available for Benefits
(in kCHF) Note 2016 2015 Balance as at 1 January 4,092,809 4,078,462Employer Contributions 110,159 108,270 Member Contributions 59,307 57,480 Employer Special Contributions 61,300 61,300 Purchase of additional years 2,113 983 Indemnities and Compensations 1,571 2,101 Procurement of Entitlement to pension for surviving spouse 65 71 Benefits paid (310,262) (308,852) Transfer values and contributions paid (7,871) (13,557) Investment Income/(Loss) 96,468 168,838 Investment Expenses (38,362) (55,637) Other Expenses (7,345) (6,650) Balance as at 31 December 4,059,952 4,092,809

42 | 76
V. Notes to the Financial Statements
1. General Information ................................................................................................................... 43
2. Summary of Significant Accounting Policies ......................................................................... 46
3. Critical Accounting Estimates and Judgements .................................................................. 53
4. Financial Risks .............................................................................................................................. 56
5. Cash and Cash Equivalents ...................................................................................................... 65
6. Short-Term Deposits .................................................................................................................... 65
7. Sundry Debtors ............................................................................................................................ 65
8. Other Receivables ...................................................................................................................... 65
9. Derivatives .................................................................................................................................... 66
10. Bonds ............................................................................................................................................. 66
11. Equities .......................................................................................................................................... 66
12. Investment Funds ........................................................................................................................ 67
13. Investment Property ................................................................................................................... 67
14. Sundry Creditors .......................................................................................................................... 67
15. Other Payables............................................................................................................................ 68
16. Interest Income ........................................................................................................................... 68
17. Unrealised Gains/(Losses) on Financial Assets at Fair Value through Profit & Loss ......... 68
18. Realised Gains/(Losses) on Financial Assets at Fair Value through Profit & Loss ............ 69
19. Investment Property Income .................................................................................................... 69
20. Foreign Exchange Gains/(Losses) ............................................................................................ 70
21. Investment Management Fees ................................................................................................ 70
22. Investment Property Expenditure ............................................................................................ 70
23. Other Financial Expenses .......................................................................................................... 71
24. Administration Costs ................................................................................................................... 71
25. Membership Activities ................................................................................................................ 71
26. Related-Party Transactions ....................................................................................................... 72
27. Compensations ........................................................................................................................... 72
28. Events after the Balance Sheet Date ..................................................................................... 72

43 | 76
1. General Information 1.1. Fund description
Under Chapter IV of the CERN Staff Rules and Regulations, the European Organization for Nuclear Research (CERN), which has its seat in Geneva, is responsible for the social insurance coverage of its staff. Thus it set up in 1955 a pension fund which constitutes the CERN personnel’s social protection for disability, old age and death.
The governance structure of the Fund and its relations with the Council and the Director General of CERN are defined in the Rules of the Pension Fund (“the Rules,” available at: http://pensionfund.cern.ch). The Rules and Regulations of the Fund are approved by CERN Council.
The Rules state that “The purpose of the Fund is to insure its members and beneficiaries as well as the members of their families* against the economic consequences of the disability and old age of its members and of the death of its members and beneficiaries” (Art. I 1.01).
With respect to the status of the Fund within the Organisation, according to the Rules, “The Fund is an integral part of CERN, and, as such, has no separate legal personality and is under the supreme authority of Council” (Art. I 2.01). As well, “The Fund shall enjoy operational autonomy within CERN and shall be managed independently through bodies referred to in Article I 2.04, paragraph 1, of the Rules”. Article I 2.04, paragraph 1, states that “the management of the Fund shall be entrusted to the following bodies:
a) the Governing Board
b) the Fund’s Chief Executive Officer.”
The Rules also provide that the bodies of the Fund shall be assisted by:
a) the Investment Committee (PFIC), subsidiary and expert body of the Governing Board on investment matters;
b) the Actuarial and Technical Committee (ATC), subsidiary and expert body of the Governing Board on actuarial and technical matters.
Article I 2.03 of the Rules further provides that the assets of the Fund shall be held separately from those of CERN and shall be used solely for the purpose of the Fund.
The Fund operates as a defined-benefit scheme. The members of the personnel of CERN and the members of the personnel of the European Southern Observatory (ESO), which has its seat in Munich, are members of the CERN Pension Fund. Conditions relating to the admission of ESO staff to the Fund are defined in the Fund’s Rules and Regulations and the CERN/ESO Agreement.
Pensions are calculated in the following manner:
i. For members who joined the Fund on or before 31 December 2011, 2% of the Basis for the Calculation of Benefits, as set out in Article II 1.08 of the Rules, for each year of membership, up to a maximum of 35 years;
ii. For members who joined the Fund on or after 1 January 2012, 1.85% of the Basis for the Calculation of Benefits, as set out in Article II 1.08, of the Rules, for each year of membership, up to a maximum of 37 years and 10 months.

44 | 76
The retirement age is as follows:
i. For members who joined the Fund on or before 31 December 2011: 65 years;
ii. For members who joined the Fund on or after 1 January 2012: 67 years.
The entitlement to a pension begins after a minimum of five years’ contributions.
1.2. Funding arrangements
According to the Rules, the resources of the Fund derive from (a) contributions from CERN and ESO, (b) contributions from its members, (c) the income from the investment of its assets, and (d) gifts and legacies. The contributions are expressed as a percentage of each member's reference salary, which is equal to the basic remuneration for 40 hours’ work per week multiplied by a coefficient set out in Annex A to the Rules. Contributions are apportioned between the member and the participating Organizations as follows:
i. For members who joined the Fund on or before 31 December 2011: member: 11.33%; Organization: 22.67%; total: 34%;
ii. For members who joined the Fund on or after 1 January 2012: member: 12.64%; Organization: 18.96%; total: 31.6%.
1.3. Termination terms
When membership of the Fund terminates before the applicable age of retirement for a reason other than death or total incapacity, a transfer value is calculated on the basis of the reference salary at the date of termination:
i. Less than five years of service: where the member has less than five years of service, the transfer value is paid into another pension scheme, or, at his request, to the member himself;
ii. Between five and ten years of service: the member has the choice between a deferred retirement pension, or payment into another pension scheme, or, if the latter option is not possible, to himself;
iii. Ten or more years of service: the member has the choice between a deferred retirement pension, and payment into another pension scheme, or, if the latter option is not possible, into a private insurance scheme offering comparable guarantees.
Payment of a transfer value extinguishes any right to a pension, except that for partial disability that is already being paid.

45 | 76
1.4. Significant Activities for the period
There were no significant activities during the year.
1.4.1. Beneficiaries
As at 31 December 2016 the number of beneficiaries was 3,610 (3,564 as at 31 December 2015), representing an increase of 1.3%.
1.4.2. Members
As at 31 December 2016 the number of members of the Fund was 3,767 (CERN: 3,310 and ESO: 457) compared to 3,618 (CERN: 3,176 and ESO: 442) as at 31 December 2015. This represents an increase of 4.1%.
1.5. Investment policy
The Fund’s principles governing the investment policy are set out in the Statement of Investment Principles and Investment Policy (SIP) CERN/PFGB/66.8/Rev./A which is approved by the PFGB.
The Fund strives to maximise returns while remaining below a maximum level of risk. The maximum level of allowable risk is referred to as the “risk limit”.
The Fund’s portfolio is constructed and managed with the objective of remaining at all times within the risk limits approved by the PFGB, while striving to attain the Fund’s investment return objective.
When selecting and managing investments, the Fund considers adapting the time horizon to the market conditions or to the circumstances of the Fund. In addition, the requirement for active management and the sensitivity of the risk and return to market cycles are also considered.
The Fund may invest in a wide range of asset classes including listed equity, government and non-government debt, currencies, money market instruments, property, commodities, private equity/debt. The Fund may also invest in strategies with absolute return focus. Investments may be undertaken directly (internally), or indirectly (e.g. via funds or investment agreements), in physical assets or derivatives.

46 | 76
2. Summary of Significant Accounting Policies 2.1. Basis of preparation
The CERN Pension Fund Financial Statements for the financial year ended 31 December 2016 have been prepared on a going-concern basis and pursuant to Article I 4.02 of the Rules of the Pension Fund, in accordance with International Public Sector Accounting Standards (IPSAS) and International Accounting Standard 26, Accounting and Reporting by Retirement Benefit Plans, as there is no such equivalent IPSAS. The preparation of financial statements in conformity with IPSAS requires the use of certain critical accounting estimates. It also requires the Fund to exercise its judgement in the process of applying the Pension Fund’s accounting policies. The areas involving a higher degree of judgement or complexity, or areas where assumptions and estimates are significant to the financial statements are disclosed under note 3. If such estimates and assumptions deviate from the actual circumstances, the original estimates and assumptions will be modified as appropriate in the year in which the circumstances change.
At its meeting on 11 May 2017 the PFGB approved the submission of the CERN Pension Fund Financial Statements for 2016 to CERN Council, via the Finance Committee, for approval and discharge.
The accounting policies set out below have been applied consistently by the Fund and throughout all periods presented in these financial statements.
The following new standards, that are issued but not yet effective, up to the date of issuance of the Fund’s financial statements, are disclosed below. The Fund intends to adopt these standards, if applicable, when they become effective:
i. IPSAS 34, Separate Financial Statements - effective January 1, 2017
ii. IPSAS 35, Consolidated Financial Statements - effective January 1, 2017
iii. IPSAS 36, Investments in Associates and Joint Ventures - effective January 1, 2017
iv. IPSAS 37, Joint Arrangements - effective January 1, 2017
v. IPSAS 38, Disclosure of Interests in Other Entities - effective January 1, 2017.
vi. IPSAS 39, Employee Benefits (will replace IPSAS 25) - effective January 1, 2018.
Once effective, the above standards are not expected to have any effects on the amounts in the Statement of Financial Position, Statement of Financial Performance, Cash Flow Statement nor the Statement of Changes in Net Assets Available for Benefits.
2.2. Measurement base
The measurement base adopted is that of historical cost as modified by the revaluation of financial assets and financial liabilities (including derivative financial instruments) and investment property at fair value through profit or loss.

47 | 76
2.3. Foreign currency translation
2.3.1. Functional and presentation currency
Pursuant to Article I 4.02 of the Rules of the Pension Fund, the unit of account of the Pension Fund is the Swiss franc which is the functional and presentation currency.
2.3.2. Transaction and balances
At each balance sheet date monetary assets and liabilities that are denominated in foreign currencies are translated into Swiss francs at the exchange rates ruling on that date. Foreign currency transactions are accounted for at the exchange rates prevailing at the date of the transaction. Gains and losses arising on translation are shown separately in the Statement of Financial Performance for the period.
2.4. Classification of assets and liabilities
The CERN Pension Fund is an entity that, inter alia, manages assets used to pay pensions. As such, the assets and liabilities are disclosed in the Statement of Financial Position in an order that broadly reflects their relative liquidity.
2.5. Cash and cash equivalents
Cash and cash equivalents include cash in hand, deposits held at call with banks and other short-term highly liquid investments with original maturities of three months or less, margin accounts with brokers that cover margin calls on derivative positions.
2.6. Financial assets
Financial assets are recognised on the Fund’s Statement of Financial Position when the Fund becomes a party to the contractual provisions of the instrument.
The Fund classifies its financial assets in the following categories: at fair value through profit or loss and loans and receivables. The classification depends on the purpose for which the financial assets were acquired. Management determines the classification of its financial assets at initial recognition.
2.6.1. Financial assets at fair value through profit or loss
The Fund’s business is investing in assets with a view to profiting from their total return in the form of interest, dividends, distributions and increases in fair value.
A. Classification
The Fund classifies its investments in debt, equity securities, investment funds and derivatives as financial assets at fair value through profit or loss. Bonds, equities and investment funds are designated by the Fund at fair value through profit or loss. Derivatives are classified as assets held for trading.

48 | 76
The portfolio of investment funds and private equity investments are categorized as financial assets designated at fair value through profit or loss at inception and are shown under Investment Funds on the Statement of Financial Position.
B. Recognition and derecognition
Purchases and sales of unquoted and quoted investments are recognised and derecognised on trade date where a purchase or sale is made under a contract whose terms require delivery within the timeframe established by the market concerned.
Financial assets are derecognised when the rights to receive cash flows from the investments have expired or have been transferred and the Fund has transferred substantially all risks and rewards of ownership.
C. Measurement
Financial assets at fair value through profit or loss are initially recognised at acquisition cost. Transaction costs are expensed in the Statement of Financial Performance. Subsequent to initial recognition, all financial assets at fair value through profit or loss are measured at fair value which is based on the last reported bid price (sales price) at the balance sheet date. Unrealised gains and losses arising from changes in the fair value of the “financial assets at fair value through profit or loss” category are presented in the Statement of Financial Performance in the period in which they arise.
Interest, dividends and investment management fees arising from financial assets are shown separately in the Statement of Financial Performance and are not included in Unrealised or Realised Gains/(Losses) on Financial Assets at Fair Value Through Profit and Loss.
2.6.2. Loans and receivables
Loans and receivables are non-derivative financial assets with fixed or determinable payments that are not quoted in an active market. Sundry debtors include recoverable withholding tax levied at source on dividends and reimbursable value added tax paid on investment property transactions, investment property debtors and other due amounts.
Settlements receivable represent amounts due to the Fund for securities sold that have been contracted for but not yet settled or delivered at the balance sheet date.
Other receivables include accrued interest on cash and short-term deposits, dividends receivable and outstanding receipts.
These amounts which do not carry any interest are expected to be received within twelve months and are accordingly stated at their nominal value. Loans and receivables are subsequently carried at amortised cost using the effective interest method less any impairment losses.
2.7. Impairment of financial assets
Financial Assets carried at amortised costs are Loans and Receivables.
The Fund assesses at the end of each reporting period whether there is objective evidence that this group of financial assets is impaired. A financial asset or a group of financial assets is impaired and impairment losses are incurred only if there is objective evidence of impairment as a result of one or more events that occurred after the initial recognition of the asset (a “loss event”) and that loss event (or events) has an impact on the estimated future cash flows of the financial asset or group of financial assets that can be reliably estimated.

49 | 76
Evidence of impairment may include indications that the debtors or a group of debtors is experiencing significant financial difficulty, default or delinquency in interest or principal payments, the probability that they will enter bankruptcy or other financial reorganisation, and where observable data indicates that there is a measureable decrease in the estimated future cash flows, such as changes in arrears or economic conditions that correlate with defaults.
For loans and receivables, the amount of loss is measured as the difference between the asset’s carrying amount and the present value of the estimated future cash flows (excluding future credit losses that have been not been incurred) discounted at the financial asset’s original effective interest rate. The carrying amount of the asset is reduced and the amount of the loss is recognised in the Statement of Financial Performance.
2.8. Offsetting financial instruments
Financial assets and liabilities are offset and the net amount reported in the Statement of Financial Position when there is a legally enforceable right to offset the recognised amounts and there is an intention to settle on a net basis or realise the asset and settle the liability simultaneously.
2.9. Non-financial assets
Those assets where there is no contractual right to receive cash or another financial asset are listed under this heading.
2.9.1. Investment property
Investment property is defined as land, buildings and forests held to earn rental income and capital appreciation and is not occupied by the Fund.
Investment property is measured initially at its cost, including related transaction costs. After initial recognition investment property is carried at fair value, representing open market value determined annually by external valuators with professional qualifications and experience. Fair value is based on active market prices, adjusted, if necessary, for any difference in the nature, location or condition of the specific asset. If the information is not available, the Fund uses alternative valuation methods such as recent prices on less active markets or discounted cash flow projections. Changes in fair values are recorded in the Statement of Financial Performance, as part of Investment Property Income.
The costs of the day-to-day running of the properties, e.g. repairs and maintenance, are recognised in the Statement of Financial Performance as incurred. Expenditure incurred in the replacement or renovation of part of an existing investment property that is 5% or more of the value of that property is recognised in the carrying amount, only when it is probable that future economic benefits associated with the item will flow to the Fund and the cost of the item can be reliably measured.

50 | 76
2.10. Other financial liabilities
Other financial liabilities include Settlements Payable, Sundry Creditors and Other Payables.
Settlements payable represent amounts due by the Fund for securities purchased that have been contracted for but not yet settled or delivered at the balance sheet date.
These amounts are not interest-bearing and are due within twelve months. They are initially recognised at their fair value and subsequently measured at amortised cost using the effective interest method.
2.11. Derivative financial instruments and hedging activities
The Fund's activities expose it to the financial risks such as foreign currency risk, interest rate risk and credit risk. Therefore the Fund may use derivative instruments such as foreign exchange forward contracts, interest rate swap contracts and credit default swaps to hedge these exposures. The Fund may also use derivative instruments for investment purposes, principally to gain exposure to specific markets.
Derivatives are initially recognised at fair value on the date on which a derivative contract is entered into and are subsequently re-measured at fair value. Any gains and losses arising from changes in the fair value are recognised in the Statement of Financial Performance. The Fund does not apply hedge accounting.
Derivatives are carried as financial assets when the fair value is positive and as financial liabilities when the fair value is negative.
The Fund may, at a given time, hold the following derivative instruments:
A. Forward contracts
Forward contracts are contractual obligations to buy or sell financial instruments on a future date at a specified price. A forward contract is a non-standardised contract written by the Fund and the counterparty to the agreement. The contracts are collateralised by cash and changes in the forward contracts’ value are settled on reset, rollover or closure of the contract. The forward contracts are settled on a gross basis.
B. Options
An option is a contractual arrangement under which the seller (writer) grants the purchaser (holder) the right, but not the obligation, either to buy (a call option) or sell (a put option) at or by a set date or during a set period, a specific amount of securities or a financial instrument at a predetermined price. The seller receives a premium from the purchaser in consideration for the assumption of the future securities price. Options are settled on a gross basis.
C. Swaps
Swaps are contracts to exchange cash (flows) on or before a specified future date based on the underlying value of currencies/exchange rates, bonds/interest rates, commodities, stocks or other assets.

51 | 76
D. Futures
Future contracts are contractual obligations to buy or sell financial instruments on a future date at a specified price established in an organised market. The futures contracts are collateralised by cash and changes in the futures contracts’ value are settled daily with the exchange. Futures are settled on a net basis.
E. Credit default swaps
Credit default swaps are contractual obligations under which the seller receives a premium or interest-related payments in return for agreeing to compensate the buyer in the event of a credit event on an underlying reference obligation. Credit events usually include bankruptcy and payment default.
2.12. Provisions
Provisions are recognised when the Fund has a present obligation (legal or constructive) as a result of a past event, it is probable that an outflow of resources embodying economic benefits or service potential will be required to settle the obligation and a reliable estimate can be made of the amount of the obligation.
2.13. Actuarial liabilities
The PFGB approves the significant actuarial assumptions for the calculation of the actuarial present value of promised retirement benefits at the end of the period, taking advice from an independent actuary concerning the appropriateness of the assumptions. The actuarial present value of promised retirement benefits at the end of the period is included in the Statement of Financial Position under the heading “Vested pension capital”.
Another set of assumptions reflect the actuarial assumptions referred to as “Best Estimate”. The actuarial present value of promised retirement benefits in 2016 under these assumptions is included in Section VI “Extract of Actuary’s Report on the Fund as at 31 December 2016” for information purposes.
The actuarial present value of the promised retirement benefits, based on projected salaries and capitalised pension indexation, is disclosed to indicate the magnitude of the potential obligation on a going concern basis.
In accordance with IAS 26, the actuarial method used to calculate the actuarial commitments is the projected unit credit method (PUC method). The projected unit credit method considers that each service period allows for an additional unit of benefits rights and evaluates each of these units separately to obtain the final value of the liability.

52 | 76
2.14. Revenue recognition
2.14.1. Revenue from exchange transactions
i. Interest income is recognised on time proportionate basis using the effective interest method;
ii. Rental income is recognised over the term of the lease on a straight line basis;
iii. Dividend income is recognised when the right to receive payment is established.
2.14.2. Revenue from non-exchange transactions
The Fund does not recognise revenue from non-exchange transactions. Non-exchange transactions include administrative support and office accommodation provided free of charge by CERN.

53 | 76
3. Critical Accounting Estimates and Judgements The Fund makes estimates and assumptions that affect the reported amounts of assets and liabilities. Estimates and judgements are continually evaluated by the Fund, with input from independent experts, and are based on historical experience and other factors, including assumptions about future events that are believed to be reasonable under the circumstances. The resulting accounting estimates will, by definition, seldom equal the related actual results.
The most significant estimates made during the period are outlined below. The Fund has not been required to make any significant judgements for the financial years 2016 and 2015.
3.1. Actuarial assumptions
The liabilities of the Fund, in respect of promised benefits to be paid, have been determined using methods relying on actuarial estimates and assumptions. These assumptions reflect the long-term nature of future benefits. Changes in these estimates and assumptions could materially affect liabilities in respect of benefits.
The basis for the Fund’s actuarial assumptions is set out under note 2. “Summary of Significant Accounting Policies”.
The table hereafter shows the significant actuarial assumptions proposed by the Fund’s Actuary and approved by the PFGB at its meeting of 9 February 2017 (CERN/PFGB/67.4) and also those used in the corresponding period. The reference discount rate is the interest rate on long-term Swiss Confederation Bonds, however, the principle that the discount rate should not fall below the best estimate of future inflation has been applied in 2016. The best estimate of future inflation is 1.37%. As a result the discount rate applied for 2016 is 1.37% (1.35% in 2015).
*The underlying best estimate assumption has the following term structure: 1% p.a. until 2024, 1.50% p.a. from 2025 and is unchanged from 31 December 2015. The single equivalent spot rate describes this underlying term structure.
Conduent HR Services (Buck Consultants Limited), London is the Fund’s Actuary. An extract of the Actuary’s Report on the Fund as at 31 December 2016 is included in section VI for information purposes.
In 2016, the Fund’s Actuary did not propose changes to the actuarial assumptions compared to 2015 and these were accepted by the PFGB.
Total liabilities, as at 31 December 2016, were 10,166 MCHF (10,134 MCHF as at 31 December 2015).
Actuarial Assumptions 2016 2015
Discount Rate 1.37%* 1.35%*
Future Salary Increase 1.37%* 1.35%*
Future Pension Increase 1.37%* 1.35%*
Salary Advancement 1.50% 1.50%
Life Expectancy 83% VZ 2010 GEN 83% VZ 2010 GEN

54 | 76
3.2. Fair value of Investment Property
The fair value of the Fund’s investment property is considered to be its market value. As at 31 December 2016 the fair value of Investment Property was 764,399 kCHF (813,843 kCHF as at 31 December 2015).
The fair values of the Investment Property were determined based on valuations performed by independent valuers, as at 31 December 2016 and 2015. The fair values of the properties (excluding the forests) have been determined using a sales comparison approach, where possible, and supported by a discounted cash flow method, in order to arrive at the most reliable estimate of the fair value within a range of reasonable fair value estimates. The independent valuers use assumptions that are mainly based on market conditions existing at each balance sheet date. The fair values of the forests have been determined by an expert in the forest industry, using market practice for valuing forest land.
The principal considerations underlying the estimation of fair value are those related to:
− Current or recent prices of similar properties;
− Appropriate discount rates ranging from 3.55% to 5.75% (3.7% to 7.5% in 2015);
− The receipt of contractual rentals;
− Expected future market rentals;
− Void periods;
− Maintenance requirements.
These valuations are regularly compared to actual market yield data, and actual transactions and those reported by the market. The expected future market rentals are determined on the basis of current market rentals for similar properties in the same location and condition.
3.3. Fair value of financial assets not quoted in an active market
In arriving at the fair value of financial assets not quoted in an active market, the Fund considers factors such as industry performance, company performance, quality of management, the price of the most recent financing round, exit opportunities which are available, liquidity preference, comparable market transactions, discounted cash-flows, earnings multiples and net present value analysis. The maximum use of market inputs is made with as little reliance as possible on entity-specific inputs.
3.3.1. Investment Funds
The Fund holds positions in investment funds, many of whom have the same reporting period as the Fund. Consequently, in some cases, audited financial statements attesting, inter alia, to the value of the Fund’s investments in these funds were not available at the reporting date. Where audited statements were not in evidence, the Fund used unaudited statements as at 31 December 2016 provided by the independent administrators or fund. In the case of fifty three private equity/debt funds (forty three in 2015) unaudited statements as at 30 September 2016 were used, as adjusted for capital movements between the last received statements and 31 December 2016.

55 | 76
As at 31 December 2016 the Fund had holdings in investment funds totalling 625,600 kCHF (711,583 kCHF in 2015) that are not quoted in an active market. Valuations totalling 526,617 kCHF (687,662 kCHF in 2015) were based on unaudited statements.
The Fund has the following outstanding commitments to Private Equity, Real Estate and Private Debt funds as at 31 December:
3.3.2. Over- the-counter derivatives instruments
The fair value of over-the-counter derivatives instruments is determined using quoted prices at the balance sheet date. When an instrument or its equivalent does not have a market price, its valuation is determined using a valuation model that is based on observable market inputs.
(in kCHF) Total Net
Asset ValueOutstanding Commitment
Total Net Asset Value
Outstanding Commitment
European Private Equity 82,673 43,457 94,503 34,524
US Private Equity 82,107 59,157 46,522 38,769
Private Debt 55,981 30,477 11,885 47,627
Real Estate funds 31,340 29,709 17,653 685
Total 252,101 162,800 170,563 121,605
2016 2015
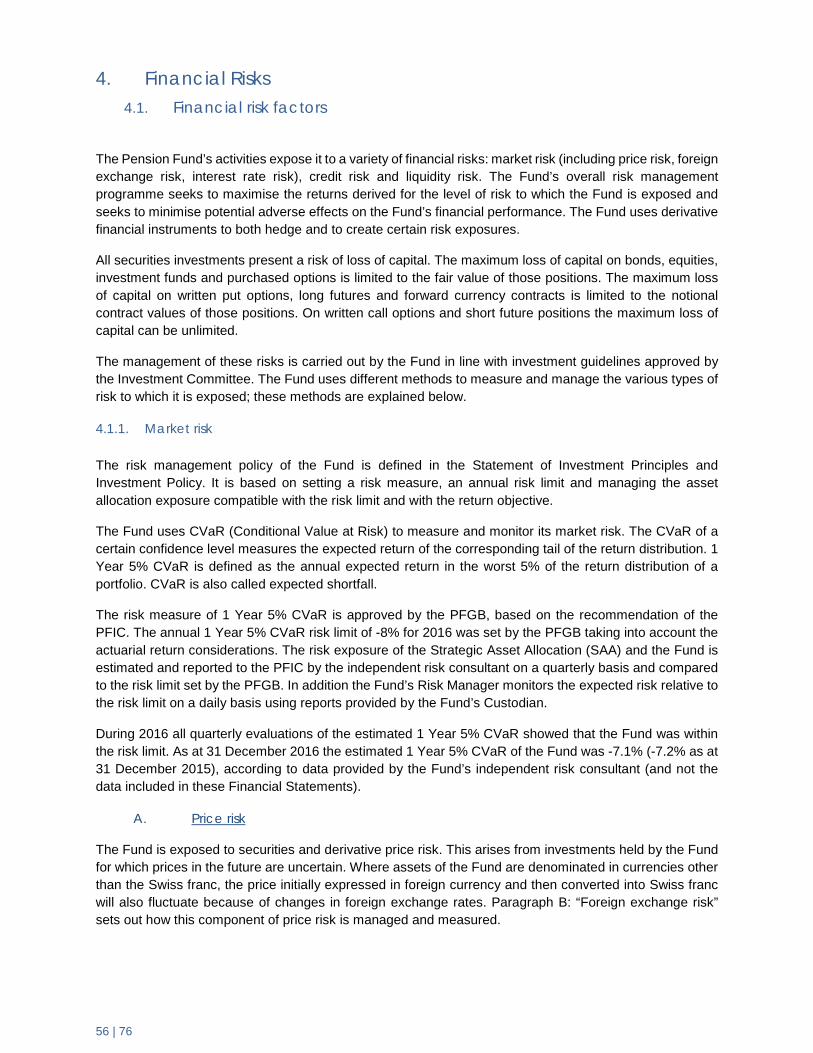
56 | 76
4. Financial Risks 4.1. Financial risk factors
The Pension Fund’s activities expose it to a variety of financial risks: market risk (including price risk, foreign exchange risk, interest rate risk), credit risk and liquidity risk. The Fund’s overall risk management programme seeks to maximise the returns derived for the level of risk to which the Fund is exposed and seeks to minimise potential adverse effects on the Fund’s financial performance. The Fund uses derivative financial instruments to both hedge and to create certain risk exposures.
All securities investments present a risk of loss of capital. The maximum loss of capital on bonds, equities, investment funds and purchased options is limited to the fair value of those positions. The maximum loss of capital on written put options, long futures and forward currency contracts is limited to the notional contract values of those positions. On written call options and short future positions the maximum loss of capital can be unlimited.
The management of these risks is carried out by the Fund in line with investment guidelines approved by the Investment Committee. The Fund uses different methods to measure and manage the various types of risk to which it is exposed; these methods are explained below.
4.1.1. Market risk
The risk management policy of the Fund is defined in the Statement of Investment Principles and Investment Policy. It is based on setting a risk measure, an annual risk limit and managing the asset allocation exposure compatible with the risk limit and with the return objective.
The Fund uses CVaR (Conditional Value at Risk) to measure and monitor its market risk. The CVaR of a certain confidence level measures the expected return of the corresponding tail of the return distribution. 1 Year 5% CVaR is defined as the annual expected return in the worst 5% of the return distribution of a portfolio. CVaR is also called expected shortfall.
The risk measure of 1 Year 5% CVaR is approved by the PFGB, based on the recommendation of the PFIC. The annual 1 Year 5% CVaR risk limit of -8% for 2016 was set by the PFGB taking into account the actuarial return considerations. The risk exposure of the Strategic Asset Allocation (SAA) and the Fund is estimated and reported to the PFIC by the independent risk consultant on a quarterly basis and compared to the risk limit set by the PFGB. In addition the Fund’s Risk Manager monitors the expected risk relative to the risk limit on a daily basis using reports provided by the Fund’s Custodian.
During 2016 all quarterly evaluations of the estimated 1 Year 5% CVaR showed that the Fund was within the risk limit. As at 31 December 2016 the estimated 1 Year 5% CVaR of the Fund was -7.1% (-7.2% as at 31 December 2015), according to data provided by the Fund’s independent risk consultant (and not the data included in these Financial Statements).
A. Price risk
The Fund is exposed to securities and derivative price risk. This arises from investments held by the Fund for which prices in the future are uncertain. Where assets of the Fund are denominated in currencies other than the Swiss franc, the price initially expressed in foreign currency and then converted into Swiss franc will also fluctuate because of changes in foreign exchange rates. Paragraph B: “Foreign exchange risk” sets out how this component of price risk is managed and measured.

57 | 76
Some of the Funds’ financial assets and liabilities are exposed to market price risk. The fair value of these assets as at 31 December is as follows:
B. Foreign exchange risk
The Fund is exposed to foreign exchange risks arising essentially upon investments in assets denominated in foreign currencies as outlined in the table below. As a general policy, the Fund hedges its exchange rate risk to the level of 100% of its exposure, but may alter the hedge ratios depending on tactical considerations. The Fund uses three month rolling forward foreign exchange contracts and currency options to cover the currency exposure of existing and anticipated investments in foreign currency. The value of currency forward contracts as at 31 December 2016 is disclosed in note 9. “Derivatives”.
As at 31 December 2016, given a shift of 10% in foreign currency rates against the Swiss Franc with all other variables held constant, the Statement of Financial Performance would have shown a higher/lower result of 2,757 kCHF (1,978 kCHF as at 31 December 2015).
The table below summarises the Fund’s net assets that are denominated in a currency other than the Swiss franc. The table excludes the forward foreign exchange contracts that are used to hedge foreign exchange rate exposure:
The Fund uses year-end exchange rates supplied by its custodian. The source of these rates is Reuters World Markets.
(in kCHF) 2016 2015
Assets
Bonds 938,358 978,290
Equities 727,315 560,733
Investment Funds 1,177,320 1,177,974
Derivatives 28,420 62,368
Total Financial assets 2,871,413 2,779,365
Liabilities
Derivatives 54,147 44,925
Total Financial liabilities 54,147 44,925
(in kCHF) 2016 2015
US dollar 1,606,500 1,549,910
Euro 1,425,197 1,398,323
Pound sterling 491,647 719,795
Japanese yen 94,774 160,026
Swedish krona 27,581 7,195
Other currencies 33,538 9,892
Total 3,679,237 3,845,141
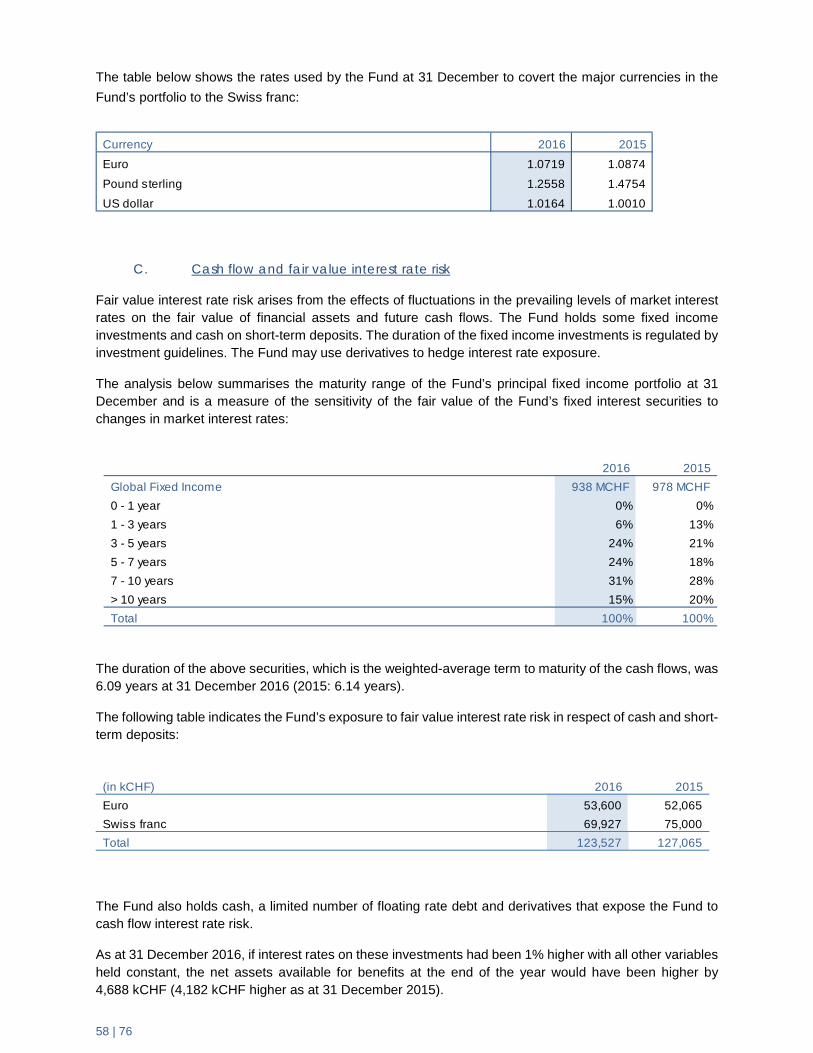
58 | 76
The table below shows the rates used by the Fund at 31 December to covert the major currencies in the Fund’s portfolio to the Swiss franc:
C. Cash flow and fair value interest rate risk
Fair value interest rate risk arises from the effects of fluctuations in the prevailing levels of market interest rates on the fair value of financial assets and future cash flows. The Fund holds some fixed income investments and cash on short-term deposits. The duration of the fixed income investments is regulated by investment guidelines. The Fund may use derivatives to hedge interest rate exposure.
The analysis below summarises the maturity range of the Fund’s principal fixed income portfolio at 31 December and is a measure of the sensitivity of the fair value of the Fund’s fixed interest securities to changes in market interest rates:
The duration of the above securities, which is the weighted-average term to maturity of the cash flows, was 6.09 years at 31 December 2016 (2015: 6.14 years).
The following table indicates the Fund’s exposure to fair value interest rate risk in respect of cash and short-term deposits:
The Fund also holds cash, a limited number of floating rate debt and derivatives that expose the Fund to cash flow interest rate risk.
As at 31 December 2016, if interest rates on these investments had been 1% higher with all other variables held constant, the net assets available for benefits at the end of the year would have been higher by 4,688 kCHF (4,182 kCHF higher as at 31 December 2015).
Currency 2016 2015
Euro 1.0719 1.0874
Pound sterling 1.2558 1.4754
US dollar 1.0164 1.0010
2016 2015 Global Fixed Income 938 MCHF 978 MCHF0 - 1 year 0% 0%1 - 3 years 6% 13%3 - 5 years 24% 21%5 - 7 years 24% 18%7 - 10 years 31% 28%> 10 years 15% 20%Total 100% 100%
(in kCHF) 2016 2015 Euro 53,600 52,065 Swiss franc 69,927 75,000 Total 123,527 127,065

59 | 76
4.1.2. Credit risk
The Fund is exposed to credit risk, which is the risk that the counterparty will be unable to pay amounts in full when they fall due.
Credit risk arises from cash and cash equivalents short-term deposits, derivative financial instruments and bonds, as well as credit exposures including outstanding receivables and committed transactions.
All transactions in listed securities are contracted using approved brokers and settled/paid for upon delivery. The risk of default is considered minimal, as delivery of the securities sold is only made once the custodian has received payment. Payment is made on a purchase once the securities have been received by the custodian. The trade will fail if either party fails to meet its obligation.
The Fund invests in fixed income securities issued by various bodies such as governments, agencies or corporations. These holdings are managed in line with the investment guidelines to ensure issuer quality and diversification. In addition, the Fund limits the amount of credit exposure to any financial institution through diversification of its counterparties and strict monitoring of open receivables on derivatives instruments. If a derivative position is showing a profit, the Fund may ask for collateral or force the reset of the position.
The analysis below summarises the issuer quality of the Fund’s principal fixed income portfolio at 31 December:
The maximum exposure to credit risk at 31 December is set out below:
No material financial assets were past due as at 31 December 2016.
2016 2015 Global Fixed Income 938 MCHF 978 MCHFAAA 5% 7%AA 15% 26%A 16% 11%BBB 47% 46%BB-B 16% 9%NR/NA 1% 2%Total 100% 100%Source of issuer data: provided by Custodian (minimum of Standards & Poor's and Moody's)
(in kCHF) 2016 2015
Bonds 938,358 978,290
Cash and Cash Equivalents 351,160 440,915
Short Term Deposits 103,600 104,370
Derivatives 28,420 62,368
Settlements Receivable 32,120 12,973
Other assets 9,264 9,390
Total 1,462,922 1,608,306

60 | 76
4.1.3. Liquidity risk
Liquidity risk is the risk that the Fund may not be able to generate sufficient cash resources to settle its obligations in full as they fall due, or can only do so on terms that are materially disadvantageous. In addition to its commitments to pay monthly benefits, the Fund is exposed to the periodic settlement of margin calls and gains and losses on derivative positions. The hedging of exchange rate risk can generate substantial cash flows that are difficult to predict. Therefore the Fund aims to maintain sufficient levels of cash and cash equivalents to meet its short-term liabilities. The Fund does not take leveraged positions on the market.
The table below analyses the Fund’s financial liabilities (excluding the derivative financial instruments in a loss position) into relevant maturity groupings, based on the remaining period at the balance sheet date to the contractual maturity date:
(in kCHF) < 7 days 1-3 months 3-12 months
As at 31 December 2016
Settlements payable 1
Members and Beneficiaries 3,701
Investment property deposits 3,564
Taxes Payable 684
Investment property Creditors 6,336
Reimbursements of contributions 2,052
Payments Outstanding 1,162
Total 5,754 8,182 3,564
As at 31 December 2015
Settlements payable 154
Members and Beneficiaries 5,993
Investment property deposits 4,370
Taxes Payable 482
Investment property Creditors 7,301
Reimbursements of contributions 1,942
Payments Outstanding 2,519
Total 8,089 10,302 4,370

61 | 76
The following table analyses the Fund’s derivative financial instruments in a loss position that will be settled on a gross basis into relevant maturity groupings based on the remaining period at the balance sheet to the contractual maturity date:
4.2. Fair value estimation
The fair value of financial assets traded in active markets (such as trading securities) is based on quoted market prices at the close of trading on the reporting date.
An active market is a market in which transactions for the asset take place with a sufficient frequency and volume to provide pricing information on an on-going basis.
The fair value of assets not traded in an active market is determined using valuation techniques. The Fund uses a variety of methods and makes assumptions that are based on market conditions existing at each year end date. Valuation techniques include the use of recent arm’s length transactions, reference to other instruments that are substantially the same, discounted cash flow analysis, and option pricing models, making maximum use of market inputs and relying as little as possible on entity-specific inputs.
The carrying amounts of the financial assets and liabilities not measured at fair value in the Statement of Financial Position approximate their fair value.
Specific valuation techniques used to value financial instruments include:
i. Quoted market prices or dealer quotes for similar instruments;
ii. Prices sourced from broker quotes, inter-dealer prices or other reliable pricing services;
iii. The present value of the estimated future cash flows using observable yield curves, prices and other available market information;
iv. The latest available valuation received from fund administrators;
v. Other techniques, such as discounted cash flow analysis.
(in kCHF) 1-6 months
At 31 December 2016
Forwards 50,570
Credit default swaps 2,652
Swaps 611
Options 314
Total 54,147
At 31 December 2015
Forwards 29,983
Credit default swaps 3,110
Swaps -
Options 11,832
Total 44,925

62 | 76
The fair value hierarchy has the following levels:
- Level 1 inputs are quoted prices (unadjusted) in active markets for identical assets that the Fund can access at the measurement date;
- Level 2 inputs are inputs other than quoted prices included within Level 1 that are observable for the asset or liability, either directly, or indirectly;
- Level 3 inputs are based on unobservable market inputs for the asset or liability.
The level in the fair value hierarchy within which the fair value measurement is categorised in its entirety is determined on the basis of the lowest level input that is significant to the fair value measurement in its entirety. For this purpose the significance of an input is assessed against the fair value measurement in its entirety. If a fair value measurement uses observable inputs that require significant adjustment based on unobservable inputs, that measurement is a Level 3 measurement. Assessing the significance of a particular input to the fair value measurement in its entirety requires judgement, considering factors specific to the asset.
The determination of what constitutes “observable” requires significant judgement by the Fund. The Fund considers observable data to be that market data that is readily available, regularly distributed or updated, reliable and verifiable, not proprietary, and provided by independent sources that are actively involved in the relevant market.
The following table analyses within the fair value hierarchy the Fund’s assets measured at fair value at 31 December 2016:
(in kCHF) Level 1 Level 2 Level 3 Total
Assets
Financial assets designated at fair value through profit or loss:
Equities 727,081 - 234 727,315
Bonds 938,358 - 938,358
Investment Funds 541,028 - 636,292 1,177,320
Sub total 1,268,109 938,358 636,526 2,842,993
Financial assets held for trading:
Derivatives 804 27,411 205 28,420
Sub total 804 27,411 205 28,420
Total assets at fair value through profit or loss 1,268,913 965,769 636,731 2,871,413
Liabilities
Financial liabilities held for trading:
Derivatives (2,493) (51,487) (168) (54,147)
Total liablities at fair value through profit or loss (2,493) (51,487) (168) (54,147)

63 | 76
The following table analyses within the fair value hierarchy the Fund’s assets measured at fair value at 31 December 2015:
Investments whose values are based on quoted market prices in active markets, and are therefore classified within Level 1, include listed equities, exchange-traded derivatives and exchange-traded funds.
Financial instruments that trade in markets that are not considered to be active but are valued based on quoted market prices, dealer quotations or alternative pricing sources supported by observable inputs are classified within Level 2. These include government bonds, corporate bonds, and over the counter derivatives. As Level 2 investments include positions that are not traded in active markets and/or subject to transfer restrictions, valuations may be adjusted to reflect illiquidity and/or non-transferability, which are generally based on available market information.
Investments classified within Level 3 have significant unobservable inputs, as they trade infrequently. Level 3 instruments include unlisted investment funds, over the counter derivatives and unlisted equities. As observable prices are not available for these securities, the Fund has used valuation techniques to derive the fair value.
There were no transfers between levels for the year ended 31 December 2016 nor 31 December 2015.
(in kCHF) Level 1 Level 2 Level 3 Total
Assets
Financial assets designated at fair value through profit or loss:
Equities 560,485 - 248 560,733
Bonds - 978,290 - 978,290
Investment Funds 466,391 - 711,583 1,177,974
Sub total 1,026,876 978,290 711,831 2,716,997
Financial assets held for trading:
Derivatives 28,212 33,334 822 62,368
Sub total 28,212 33,334 822 62,368
Total assets at fair value through profit or loss 1,055,088 1,011,624 712,653 2,779,365
Liabilities
Financial liabilities held for trading:
Derivatives (11,462) (33,092) (371) (44,925)
Total liablities at fair value through profit or loss (11,462) (33,092) (371) (44,925)

64 | 76
The following table presents the movement in level 3 instruments for the year ended 31 December 2016 by class of financial instrument:
The following table presents the movement in level 3 instruments for the year ended 31 December 2015 by class of financial instrument:
4.3. Investments exceeding five percent of net assets available for benefits
There were no investments representing five percent or more of net assets available for benefits as at 31 December 2016 nor as at 31 December 2015.
There were no bonds representing five percent or more of Bonds as at 31 December 2016. (As at 31 December 2015: 63,293 kCHF in one government bond).
The Fund was also invested in a total of 347,310 kCHF, including two exchange-traded funds and two unlisted funds, as at 31 December 2016, each investment representing five percent or more of Investment Funds. (As at 31 December 2015: 551,689 kCHF in three exchange-traded funds and two unlisted funds). The Fund had currency forward asset positions hedging US dollars, Pound Sterling, Euro and Japanese Yen against Swiss francs, totalling 24,631 kCHF as at 31 December 2016, each representing five percent or more of the Derivatives assets balance. (As at 31 December 2015: 29,773 kCHF representing currency forward positions hedging US dollars and Pound Sterling against Swiss francs).
As at 31 December 2016 the Fund had currency forward liability positions hedging US dollars and Pound Sterling totalling 47,342 kCHF, representing five percent or more of the Derivatives liabilities balance. (As at 31 December 2015: 23,332 kCHF representing currency forward positions hedging US dollars).
(in kCHF) Equities Derivatives Investment
Funds Total
Opening balance 248 451 711,583 712,282
Purchases - 75,061 75,061
Sales - - (161,281) (161,281)
Transfers into level 3 -
Unrealised Gains/(Losses) on Financial Assets at Fair Value -
Through Profit & Loss 12,213 12,213
Realised Gains/(Losses) on Financial Assets at Fair Value -
Through Profit & Loss (14) (414) (1,284) (1,712)
Closing balance 234 37 636,292 636,563
(in kCHF) Equities Derivatives Investment
Funds Total
Opening balance 260 (704) 1,056,413 1,055,969
Purchases - 97,625 97,625
Sales - - (581,190) (581,190)
Transfers into level 3 - - - -
Unrealised Gains/(Losses) on Financial Assets at Fair Value -
Through Profit & Loss - - 142,796 142,796
Realised Gains/(Losses) on Financial Assets at Fair Value -
Through Profit & Loss (12) 1,155 (4,061) (2,918)
Closing balance 248 451 711,583 712,282

65 | 76
5. Cash and Cash Equivalents For the purposes of the cash flow statement, cash and cash equivalents comprise the following balances with original maturity of 90 days or less:
The amounts under the heading “Margin accounts with brokers” concern cash collateral pledged with derivative counterparties of the Fund. The cash is held in segregated accounts with the brokers and is callable by the Fund to the extent that collateral balances are in excess of the net fair value liability amount of the open derivative positions held with each broker.
6. Short-Term Deposits Short-term deposits are made for varying periods, depending on the immediate cash requirements of the Fund and earn interest at the respective short-term rate. The deposits are made for more than 3 months and hence are classified as short-term deposits.
7. Sundry Debtors
8. Other Receivables
(in kCHF) 2016 2015
Current accounts 313,799 398,483
Deposit accounts 19,927 25,000
Margin accounts with brokers 17,434 17,432
Total 351,160 440,915
(in kCHF) 2016 2015
Recoverable taxes 1,115 1,292
Investment property debtors 2,460 2,863
Other due amounts 37 36
Total 3,612 4,191
(in kCHF) 2016 2015
Accrued interest 154 182
Dividends receivable 553 642
Outstanding receipts 78 101
Payments in advance 4,867 4,274
Total 5,652 5,199

66 | 76
9. Derivatives The following table shows the types of derivative contracts held by the Fund as at 31 December:
10. Bonds The fair value of investments in bonds, 938,358 kCHF as at 31 December 2016 (978,290 kCHF as at 31 December 2015) is as follows:
The exposure of bonds to market and credit risk is described under note 4.1. “Financial Risk Factors”.
11. Equities The fair value of investments in equities, 727,315 kCHF as at 31 December 2016 (560,733 kCHF as at 31 December 2015) is as follows:
The exposure of equities to market risk is described under note 4.1. “Financial Risk Factors”.
2016 2015
(in kCHF) Assets Liabilities Assets Liabilities
Forwards:
Currency Overlay programme 23,240 (47,504) 32,105 (28,754)
Other 2,461 (3,066) 2,870 (1,229)
Credit default swap 1,464 (2,652) - (3,110)
Swaps 766 (611) - -
Options 490 (314) 27,392 (11,832)
Total 28,420 (54,147) 62,368 (44,925)
(in kCHF) 2016 2015
Europe, Middle East and Africa 622,742 733,572
North America 242,095 235,082
Asia 55,561 9,636
Emerging Markets 17,960 -
Total 938,358 978,290
Source of geographical data: country of risk data provided by Custodian
(in kCHF) 2016 2015
Europe, Middle East and Africa 590,834 443,523
North America 122,493 116,362
Asia 6,529 848
Emerging Markets 7,459 -
Total 727,315 560,733
Source of geographical data: country of risk data provided by Custodian

67 | 76
12. Investment Funds The fair value of Investment Funds, 1,177,320 kCHF as at 31 December 2016 (1,177,974 kCHF as at 31 December 2015) is as follows:
13. Investment Property The fair value of Investment Property, 764,399 kCHF as at 31 December 2016 (813,843 kCHF as at 31 December 2015) is as follows:
During the year, there were three sales of Investment Property, two in France and one in the Netherlands. There was one sale in the Netherlands in 2015.
14. Sundry Creditors Sundry creditors include rent guarantee deposits, rents received in advance, amounts due to members leaving the Fund and value added tax payable.
(in kCHF) 2016 2015
Alternative funds 373,499 592,054
Equity funds 430,191 412,664
Fixed Income funds 121,529 2,693
Private Debt 55,981 11,885
Private Equity 164,780 141,025
Real Estate funds 31,340 17,653
Total 1,177,320 1,177,974
(in kCHF) 2016 2015
As at 1 January 813,843 622,915
Purchases - 175,154
Sales (40,587) (2,410)
Net gain/(loss) for fair value adjustments (price) 37,782 53,304
Net gain/(loss) for fair value adjustments (foreign exchange) (46,637) (35,120)
As at 31 December 764,399 813,843
(in kCHF) 2016 2015
Members and Beneficiaries 3,701 5,993
Investment property deposits 3,564 4,370
Taxes Payable 684 482
Investment property creditors 6,336 7,301
Deferred Income 357 361
Total 14,642 18,507

68 | 76
15. Other Payables Other Payables include contributions to be reimbursed to members leaving the Fund and amounts due mainly in respect of management and custody fees.
16. Interest Income
17. Unrealised Gains/(Losses) on Financial Assets at Fair Value through Profit & Loss
The following table shows the amount of unrealised gains/(losses) on financial assets at fair value through profit and loss and discloses the gains and losses arising as a result of changes in price and changes in foreign exchange currency movements for Bonds, Equities, Investment Funds and Derivatives. The Fund hedges the foreign exchange exposure it has to assets denominated in non-Swiss franc currencies.
The unrealised gains/(losses) arising as a result of changes in price and changes in foreign exchange currency movements on derivative products are on a best estimate basis.
(in kCHF) 2016 2015
Reimbursements of Contributions 2,052 1,942
Payments Outstanding 1,162 2,519
Total 3,214 4,461
(in kCHF) 2016 2015
Cash and Cash Equivalents 181 63
Short term deposits 521 947
Bonds 25,448 25,185
Total 26,150 26,195
2016 2015 (in kCHF) Price Currency Total Price Currency Total
Bonds 5,328 (3,048) 2,280 (17,622) 936 (16,686)
Equities 39,351 (22,628) 16,723 9,611 (7,052) 2,559
Investment Funds 33,147 13,872 47,019 72,827 23,214 96,041
Derivatives (2,140) 5 (2,135) 1,668 67 1,735
Total 75,686 (11,799) 63,887 66,484 17,165 83,649

69 | 76
18. Realised Gains/(Losses) on Financial Assets at Fair Value through Profit & Loss
The following table shows the amount of realised gains/(losses) on financial assets at fair value through profit and loss and discloses the gains and losses arising as a result of changes in price and changes in foreign exchange currency movements for Bonds, Equities, Investment Funds and Derivatives. The Fund hedges the foreign exchange exposure it has to assets denominated in non-Swiss franc currencies.
The realised gains/(losses) arising as a result of changes in price and changes in foreign exchange currency movements on derivative products are on a best estimate basis.
19. Investment Property Income The following table shows Investment Property Income arising from both rental income and non-rental income:
With regard to its Investment Property the Fund is a lessor of operating leases and as such is required to make the following disclosures in respect of future minimum lease payments.
The Fund has leases that are contracted for remaining periods of between one and ten years. Some of the operating leases include break clauses.
2016 2015 (in kCHF) Price Currency Total Price Currency Total
Bonds 11,630 (8,165) 3,465 (430) (46,831) (47,261)
Equities (11,540) (6,704) (18,244) 10,018 (14,393) (4,375)
Investment Funds (11,615) 4,925 (6,690) 17,026 (776) 16,250
Derivatives (55,169) 2,043 (53,126) (11,295) (1,397) (12,692)
Total (66,694) (7,901) (74,595) 15,319 (63,397) (48,078)
(in kCHF) 2016 2015
Rental Income:
Residential Property 12,007 11,898
Office Property 23,917 22,102
Agricultural property 214 240
Non-Rental Income:
Residential Property 18 18
Agricultural property 1,377 1,426
Forests 496 424
Changes in fair value (8,855) 18,184
Gains/(Losses) on Sales (273) (97)
Total 28,901 54,195
(in kCHF) 2016 2015
Not later than 1 year 31,467 36,203
Between 1 and 5 years 82,028 98,466
Later than 5 years 14,729 14,160
Total 128,224 148,829

70 | 76
20. Foreign Exchange Gains/(Losses) Foreign Exchange Gains/(Losses) includes gains of 20,899 kCHF (gains of 93,298 kCHF in 2015) relating to trades executed as part of the Currency Overlay programme that is used by the Fund to hedge its exchange rate risk.
21. Investment Management Fees 21.1. Recorded Investment Management Fees
The following table shows Investment Management Fees recognised in the Statement of Financial Performance. Reported Investment Management Fees in 2015 of 38,971 kCHF includes 7,401 kCHF for funds that were subsequently redeemed during 2016.
The above Investment Management fees also include performance fees.
21.2. Non-recorded Investment Management Fees
For less than 3% of Total Financial assets (less than 2% in 2015) there was insufficient information available regarding Investment Management Fees. As a result no Investment Management Fees have been disclosed for these assets that are all Private Equity/Debt funds. The total carrying value of these assets as at 31 December 2016 was 98,537 kCHF (56,304 kCHF as at 31 December 2015).
22. Investment Property Expenditure
(in kCHF) 2016 2015
Currency Overlay programme 20,899 93,298
Other exchange rate movements (5,903) (80,463)
Total 14,996 12,835
(in kCHF) 2016 2015
Reported Investment Management Fees 21,108 38,971
Calculated Investment Management Fees 1,161 356
Total 22,269 39,327
(in kCHF) 2016 2015
Residential Property 4,280 4,218
Office Property 3,272 4,263
Agricultural property 1,170 1,542
Forests 179 158
Total 8,901 10,181

71 | 76
23. Other Financial Expenses Other Financial Expenses were 1,933 kCHF for the period ending 31 December 2016 (1,106 kCHF in 2015). During the year the Fund was exposed to negative interest rates in some currencies, notably Swiss Franc and Euro rates that further declined compared to 2015.
24. Administration Costs Administration costs of 5,357 kCHF in the period ending 31 December 2016 (5,482 kCHF for the period ending 31 December 2015) were as follows:
25. Membership Activities This heading shows the contributions of the members of the Fund and the participating Organisations and other amounts received, as well as the various benefits and other amounts paid during the period.
(in kCHF) 2016 2015
Personnel Costs 3,686 3,602
Operating Expenses 1,369 1,606
Supplies 60 68
Audit/Valuation costs relating to Investment Property 242 206
Total 5,357 5,482

72 | 76
26. Related-Party Transactions Parties are considered to be related if one party has the ability to control the other party or exercise significant influence over the other party in making financial or operational decisions.
Related parties of the Fund during the period were:
i. Professional members appointed by the CERN Council to act as experts in the PFGB and professional members appointed by the PFGB to the PFIC and ATC. These professional members provide advice on Governance, Investment and Actuarial issues respectively. Fees in 2016 totalled 102 kCHF (99 kCHF in 2015);
ii. Key personnel are the Chair of the PFGB, Chair of the PFIC, Chair of the ATC and the Chief Executive Officer of the Fund. The Chair of the PFGB and the Chair of the PFIC do not receive any remuneration in the execution of these roles. The aggregate remuneration paid to the remaining key personnel includes salaries, allowances and other entitlements paid in accordance with the Staff Rules and Regulations;
iii. CERN, the Organization, contributes a significant portion of the Fund’s financing. While the Fund is an autonomous operating entity without separate legal identity, for the purposes of IPSAS 20 disclosure requirements, CERN is considered a related party. Although the Fund meets the cost of its operating expenses, CERN provides free of charge some central support services and office accommodation. During the year the Fund paid the CERN Finance and Administrative Processes department 179.4 kCHF for the development of a new Benefits Management System (130.4 kCHF in 2015). The Fund also paid the CERN Industry, Procurement and Knowledge Transfer department 52 kCHF for procurement services (52 kCHF in 2015) and CERN IT department 6 kCHF (6 kCHF in 2015) for the maintenance cost of two servers.
In 2016 the Fund did not grant any loan or pay any other remuneration (except for the above mentioned amounts) to the key management personnel or to their close family members.
27. Compensations The Fund is compensated by CERN for the additional cost associated with Administrative Circular No. 22 A (Rev.1) “Award of additional periods of membership in the Pension Fund for long-term shift work”. Compensations received for the period ending 31 December 2016 were 1,065 kCHF (2,033 kCHF in 2015) as a result of a 50% decrease in the number of long-term shift workers who retired in 2016 compared to 2015.
28. Events after the Balance Sheet Date There were no material events after the Balance Sheet Date.
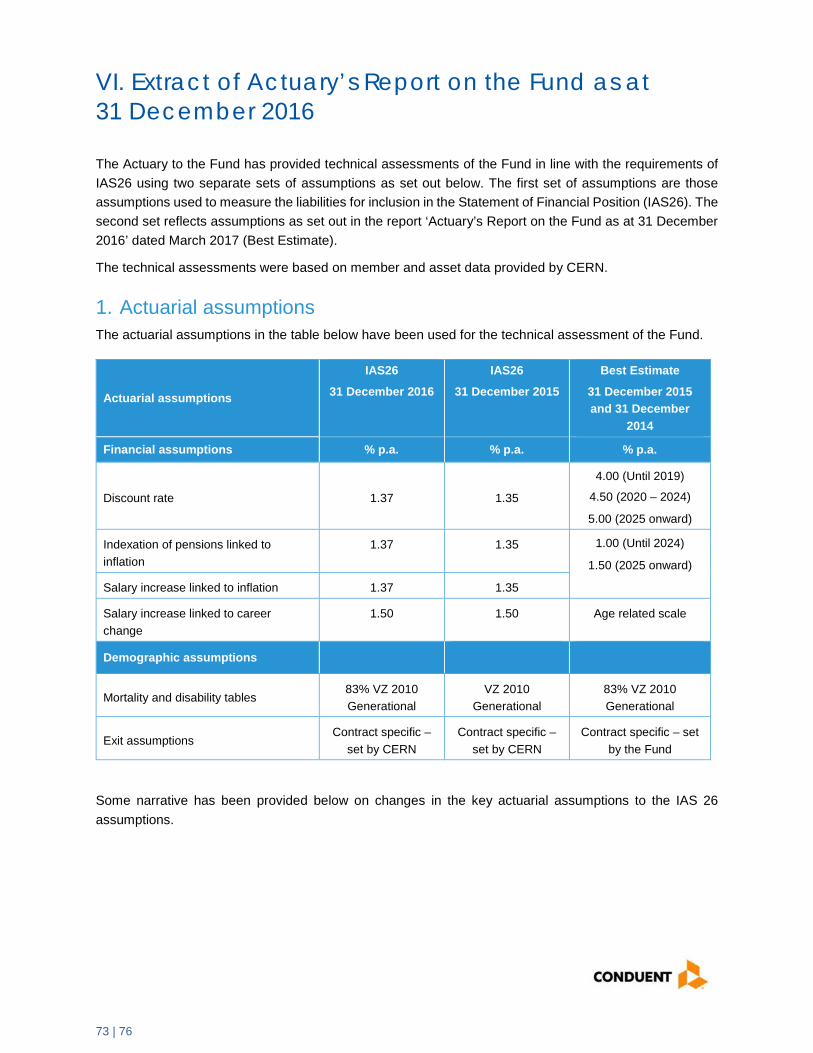
73 | 76
VI. Extract of Actuary’s Report on the Fund as at 31 December 2016
The Actuary to the Fund has provided technical assessments of the Fund in line with the requirements of IAS26 using two separate sets of assumptions as set out below. The first set of assumptions are those assumptions used to measure the liabilities for inclusion in the Statement of Financial Position (IAS26). The second set reflects assumptions as set out in the report ‘Actuary’s Report on the Fund as at 31 December 2016’ dated March 2017 (Best Estimate).
The technical assessments were based on member and asset data provided by CERN.
1. Actuarial assumptions The actuarial assumptions in the table below have been used for the technical assessment of the Fund.
Actuarial assumptions
IAS26
31 December 2016
IAS26
31 December 2015
Best Estimate
31 December 2015 and 31 December
2014
Financial assumptions % p.a. % p.a. % p.a.
Discount rate 1.37 1.35
4.00 (Until 2019)
4.50 (2020 – 2024)
5.00 (2025 onward)
Indexation of pensions linked to inflation
1.37 1.35 1.00 (Until 2024)
1.50 (2025 onward)
Salary increase linked to inflation 1.37 1.35
Salary increase linked to career change
1.50 1.50 Age related scale
Demographic assumptions
Mortality and disability tables 83% VZ 2010 Generational
VZ 2010 Generational
83% VZ 2010 Generational
Exit assumptions Contract specific –
set by CERN Contract specific –
set by CERN Contract specific – set
by the Fund
Some narrative has been provided below on changes in the key actuarial assumptions to the IAS 26 assumptions.

74 | 76
Discount rate IAS26 measures pension fund liabilities by reference to a discount rate which reflects the time value of money of an appropriate duration and currency. In order to ensure that the discount rate more adequately reflects the time value of money, I believe that it is reasonable for CERN to continue to adopt the principle that the discount rate should never fall below the best estimate of future inflation. Applying a consistent approach to the 31 December 2015 disclosures results in a discount rate of 1.37% p.a. when expressed as a 30 year spot rate (1.35% p.a. as at 31 December 2015). The underlying best estimate assumption has the following term structure: 1% p.a. until 2024, 1.50% p.a. from 2025 and is unchanged from 31 December 2015. The single equivalent spot rate describes this underlying term structure.
Prior to 2015, the determination of the discount rate by CERN was made on the basis of the spot yield on Swiss Confederation bond issues at term 30 years as published by the Swiss National Bank. At 31 December 2016 the yield was 0.35% p.a. As this yield is below the inflation assumption, the relevant floor has been applied.
Inflation – related assumptions IAS26 does not state any method for determining the rate of inflation to be assumed. Consequently the rate of inflation, on which indexation of benefits provided by the Fund and also salary increases are dependant, has been set by the principles of best estimate and also of mutual compatibility with other assumptions. The assumption adopted is a long term assumption appropriate over the entire remaining lifetime of existing members and beneficiaries of the Fund in relation to their accrued benefits as at 31 December 2016.
For the 31 December 2016 disclosure CERN have set their assumption to be consistent with the current best estimate of future inflation suggested by the Fund’s risk adviser, Ortec. This results in an inflation assumption of 1.37% p.a. as at 31 December 2016 when expressed as a 30 year spot rate (1.35% p.a. as at 31 December 2015). The underlying best estimate assumption has the following term structure: 1% p.a. until 2024, 1.50% p.a. from 2025 and is unchanged from 31 December 2015. The single equivalent spot rate describes this underlying term structure.
Mortality assumption Following analysis of the mortality experience of the Fund over the years 2003 to 2015 CERN’s best estimate for the morality assumption is 83% of the VZ2010 base table. This is consistent with the assumption used at 31 December 2015.

75 | 76
2. Technical balance sheet under IAS26
Balance sheet 31 December 2016
as reported 000’s CHF
31 December 2016 with 2015 IAS assumptions 000’s CHF*
31 December 2015 as reported 000’s CHF
Total assets of the Fund 4,059,952 4,059,952 4,092,809
Liabilities in respect of members (5,030,941) (5,030,941) (4,753,200)
Liabilities in respect of beneficiaries
(5,134,845) (5,134,845) (5,380,871)
Total liabilities (10,165,786) (10,165,786) (10,134,071)
Surplus/(Deficit) in the Fund (6,105,834) (6,105,834) (6,041,262)
Funding Level under IAS26 (%) 39.9 39.9 40.4
Method of evaluating benefits on exit
18% Transfer Value / 82% present value of
accrued deferred pension
18% Transfer Value / 82% present value of
accrued deferred pension
18% Transfer Value / 82% present value of
accrued deferred pension
* The underlying term structure for the discount rate and inflation assumption, and all other assumptions, are unchanged from 31 December 2015. Consequently, the IAS26 balance sheet position at 31 December 2016 is identical under the prior year assumptions. The sensitivity of the total liabilities of 10,165,786 k CHF at 31 December 2016 to changes in the discount rate, inflation and salary increase assumptions is as set out below. Please note that for the purpose of these sensitivities, all assumptions are changed in isolation while keeping the other assumptions constant:
Assumption changed*
(Increase)/decrease to liabilities resulting from a 0.5% increase in
the assumption 000’s CHF
(Increase)/decrease to liabilities resulting from a 0.5% decrease in
the assumption 000’s CHF
Discount rate 951,155 (1,113,263)
Inflation (including impact on indexation of pensions and salaries)**
(1,013,432) 817,156
Indexation of salaries (282,683) 261,032
*Please note that the changes in the liabilities resulting from the increase/decrease to the individual assumptions shown in the table above are slightly asymmetric around the base value of the liabilities of 10,165,786 k CHF. The asymmetry occurs a result of compounding the inflation related assumptions and the discount rate assumption as part of the present value liability calculation. In this instance, the asymmetry is more significant than might be expected owing to a fairly low discount rate (in nominal terms).
**For this sensitivity there is no corresponding change to the discount rate, which remains fixed at the stated assumption.

76 | 76
3. Technical balance sheet using the Best Estimate actuarial assumptions
Balance sheet 31 December 2016
000’s CHF
31 December 2015
000’s CHF
Total assets of the Fund 4,059,952 4,092,809
Liabilities in respect of members (1,943,925) (1,832,640)
Liabilities in respect of beneficiaries
(3,654,318) (3,771,678)
Total liabilities (5,598,243) (5,604,318)
Surplus/(Deficit) in the Fund (1,538,291) (1,511,509)
Funding Level using the Best Estimate assumptions
72.5 73.0
Method of evaluating benefits on exit
Percentage assumed to take transfer values: - Age under 35: 70% - Age 35 to 45: 65% - Age 45 to 55: 15% - Over 55: 5%
Percentage assumed to take transfer values: - Age under 35: 70% - Age 35 to 45: 65% - Age 45 to 55: 15% - Over 55: 5%
For the purposes of the figures at 31 December 2015 above, I have provided prior year comparative figures on the Best Estimate assumptions using membership data as at 31 December 2015.