PENSION AND OTHER POST EMPLOYMENT BENEFIT COSTS · 1 PENSION AND OTHER POST EMPLOYMENT BENEFIT...
48
Filed: 2016-05-27 EB-2016-0152 Exhibit F4 Tab 3 Schedule 2 Page 1 of 23 PENSION AND OTHER POST EMPLOYMENT BENEFIT COSTS 1 2 1.0 PURPOSE 3 The purpose of this exhibit is to: 4 Describe OPG’s proposal to maintain the same treatment for pension and other post - 5 employment benefit (“OPEB”) costs as that resulting from the OEB’s EB-2013-0321 6 Decision With Reasons (“EB-2013-0321 Decision”), pending the outcome of the 7 OEB’s generic consultation on pension and OPEB costs (EB-2015-0040); 8 Detail the forecast test period pension contributions and OPEB benefit payments 9 (“cash amounts”) included in the proposed nuclear revenue requirements; and 10 Present the pension and OPEB amounts for the nuclear facilities determined in 11 accordance with US GAAP (“accrual costs”) as well as the differential between 12 pension and OPEB accrual costs and cash amounts. 13 14 2.0 OVERVIEW 15 OPG’s pension and OPEB programs consist of a registered pension plan (“RPP”), a 16 supplementary pension plan, other post-retirement benefits such as group life insurance and 17 health and dental care for pensioners and their dependants, as well as long-term disability 18 (“LTD”) benefits for current employees. 1 19 20 OPG proposes to maintain the same treatment for recovering pension and OPEB costs 21 during the test period as that resulting from the EB-2013-0321 Decision (pp. 87-89), pending 22 the outcome of the OEB’s EB-2015-0040 consultation on pension and OPEB costs. In 23 particular, OPG proposes to include pension and OPEB cash amounts in the test period 24 nuclear revenue requirements, and, for both regulated hydroelectric and nuclear facilities, to 25 record differences between actual and forecast cash amounts in the Pension & OPEB Cash 26 Payment Variance Account, and the difference between actual accrual costs and actual cash 27 amounts in the Pension & OPEB Cash Versus Accrual Differential Deferral Account. 28 1 The term “other post-retirement benefits” is used to refer to post employment benefit plans other than the RPP and LTD benefits. Unless otherwise noted, OPEB is used to refer to all post-employment benefits other than the RPP benefits.
Transcript of PENSION AND OTHER POST EMPLOYMENT BENEFIT COSTS · 1 PENSION AND OTHER POST EMPLOYMENT BENEFIT...

Filed: 2016-05-27 EB-2016-0152
Exhibit F4 Tab 3
Schedule 2 Page 1 of 23
PENSION AND OTHER POST EMPLOYMENT BENEFIT COSTS 1
2
1.0 PURPOSE 3
The purpose of this exhibit is to: 4
Describe OPG’s proposal to maintain the same treatment for pension and other post-5
employment benefit (“OPEB”) costs as that resulting from the OEB’s EB-2013-0321 6
Decision With Reasons (“EB-2013-0321 Decision”), pending the outcome of the 7
OEB’s generic consultation on pension and OPEB costs (EB-2015-0040); 8
Detail the forecast test period pension contributions and OPEB benefit payments 9
(“cash amounts”) included in the proposed nuclear revenue requirements; and 10
Present the pension and OPEB amounts for the nuclear facilities determined in 11
accordance with US GAAP (“accrual costs”) as well as the differential between 12
pension and OPEB accrual costs and cash amounts. 13
14
2.0 OVERVIEW 15
OPG’s pension and OPEB programs consist of a registered pension plan (“RPP”), a 16
supplementary pension plan, other post-retirement benefits such as group life insurance and 17
health and dental care for pensioners and their dependants, as well as long-term disability 18
(“LTD”) benefits for current employees.1 19
20
OPG proposes to maintain the same treatment for recovering pension and OPEB costs 21
during the test period as that resulting from the EB-2013-0321 Decision (pp. 87-89), pending 22
the outcome of the OEB’s EB-2015-0040 consultation on pension and OPEB costs. In 23
particular, OPG proposes to include pension and OPEB cash amounts in the test period 24
nuclear revenue requirements, and, for both regulated hydroelectric and nuclear facilities, to 25
record differences between actual and forecast cash amounts in the Pension & OPEB Cash 26
Payment Variance Account, and the difference between actual accrual costs and actual cash 27
amounts in the Pension & OPEB Cash Versus Accrual Differential Deferral Account. 28
1 The term “other post-retirement benefits” is used to refer to post employment benefit plans other than the RPP
and LTD benefits. Unless otherwise noted, OPEB is used to refer to all post-employment benefits other than the RPP benefits.

Filed: 2016-05-27 EB-2016-0152 Exhibit F4 Tab 3 Schedule 2 Page 2 of 23
Consistent with the OEB’s findings in EB-2013-0321, OPG is proposing that the future 1
consideration of recovery of the difference between accrual costs and cash amounts for the 2
test period be limited to the outcome of the generic consultation and not be subject to a 3
future prudence review beyond the proceeding for this Application. OPG is providing 4
evidence in this exhibit, Ex. F4-3-1 and elsewhere in the Application to support a review of 5
the forecast accrual costs. 6
7
Forecast pension and OPEB cash amounts attributed to the nuclear facilities for the test 8
period are $272.0M in 2017, $280.4M in 2018, $289.5M in 2019, $271.3M in 2020 and 9
$279.9M in 2021. The total difference between pension and OPEB accrual costs and cash 10
amounts is forecast to decease significantly over the period, from an average of $230.8M in 11
2014-2015 to $49.8M by 2021. Pension cash amounts are forecast to exceed accrual costs 12
starting in 2018. Total forecast pension cash amounts for the nuclear facilities are higher 13
than accrual amounts by $31.5M over the test period, while total forecast OPEB cash 14
amounts are $434.0M lower than the accrual costs over the test period. On an annual basis, 15
test period pension and OPEB accrual costs and cash amounts are significantly lower than 16
in 2014 and 2015. 17
18
As discussed in Ex. H1-1-1, given that the EB-2015-0040 generic consultation is ongoing, 19
OPG is not proposing to clear amounts accumulated in the Pension & OPEB Cash Versus 20
Accrual Differential Deferral Account since November 1, 2014. OPG is proposing to clear the 21
December 31, 2015 balance in the Pension & OPEB Cash Payment Variance Account. 22
23
Although OPG has aligned its test period proposal for pension and OPEB costs with the 24
OEB’s EB-2013-0321 Decision, OPG continues to be of the view that it would be appropriate 25
for OPG to recover its accrual pension and OPEB costs for the following reasons, as set out 26
in detail in OPG’s July 31, 2015 submission in the EB-2015-0040 consultation: 27
Using accrual accounting for rate setting ensures that rates reflect the true cost of 28
providing the service during the periods to which the rates relate, which minimizes 29
intergenerational inequity and supports efficient consumption through appropriate 30
price signals; 31

Filed: 2016-05-27 EB-2016-0152
Exhibit F4 Tab 3
Schedule 2 Page 3 of 23
The use of accrual pension and OPEB costs for rate recovery purposes is consistent 1
with financial accounting requirements, which are developed through a transparent 2
and rigorous process with an objective of appropriately attributing costs across 3
periods. The use of financial reporting requirements provides a reliable and verifiable 4
basis to set just and reasonable rates, and minimizes the financial burden of keeping 5
two sets of records; 6
The accrual basis of recovery would provide OPG with revenues on the same basis 7
and in a similar timeframe as the accounting requirement to recognize post-retirement 8
obligations on the company’s balance sheet. As such, using the accrual accounting 9
basis for rate-setting would avoid significant adverse financial consequences to OPG 10
(including reductions in net income, write-offs of regulatory asset balances and 11
erosion of shareholder’s equity) and corresponding increases in the risks to the 12
shareholder, which are likely to arise if a different basis of recovery is adopted; and 13
Maintaining the recovery of costs on an accrual basis promotes consistency and 14
simplicity and supports period-over-period comparability of results, particularly when 15
that basis was previously applied to set the utility’s rates, as is the case for OPG. 16
17
As OPG is proposing that the EB-2013-0321 regulated hydroelectric payment amounts form 18
the starting point for determining the regulated hydroelectric payment amounts for 2017 to 19
2021, pension and OPEB cash amounts and accrual costs for the regulated hydroelectric 20
business are not presented in this exhibit. 21
22
Section 3 presents the cash amounts, accrual costs and the difference between the two for 23
the nuclear facilities for the historical, bridge and test periods. It also further details OPG’s 24
proposed treatment of pension and OPEB costs in this Application. Sections 4 and 5, 25
respectively, set out how the cash amounts and accrual costs presented in section 3 were 26
developed and discuss related trends and variances. 27
28
Cash and accrual amounts presented in this Application reflect changes to RPP provisions 29
from the 2015 round of collective bargaining with the Power Workers’ Union (“PWU”) and 30
Filed: 2016-05-27 EB-2016-0152 Exhibit F4 Tab 3 Schedule 2 Page 4 of 23
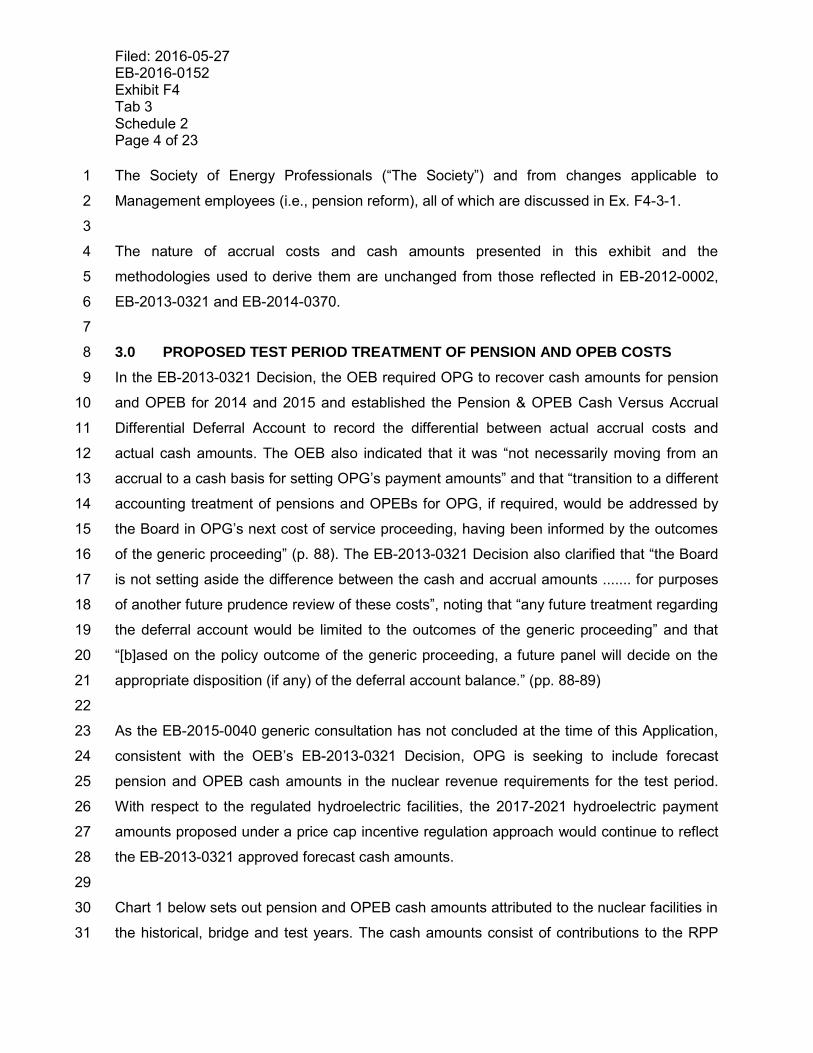
The Society of Energy Professionals (“The Society”) and from changes applicable to 1
Management employees (i.e., pension reform), all of which are discussed in Ex. F4-3-1. 2
3
The nature of accrual costs and cash amounts presented in this exhibit and the 4
methodologies used to derive them are unchanged from those reflected in EB-2012-0002, 5
EB-2013-0321 and EB-2014-0370. 6
7
3.0 PROPOSED TEST PERIOD TREATMENT OF PENSION AND OPEB COSTS 8
In the EB-2013-0321 Decision, the OEB required OPG to recover cash amounts for pension 9
and OPEB for 2014 and 2015 and established the Pension & OPEB Cash Versus Accrual 10
Differential Deferral Account to record the differential between actual accrual costs and 11
actual cash amounts. The OEB also indicated that it was “not necessarily moving from an 12
accrual to a cash basis for setting OPG’s payment amounts” and that “transition to a different 13
accounting treatment of pensions and OPEBs for OPG, if required, would be addressed by 14
the Board in OPG’s next cost of service proceeding, having been informed by the outcomes 15
of the generic proceeding” (p. 88). The EB-2013-0321 Decision also clarified that “the Board 16
is not setting aside the difference between the cash and accrual amounts ....... for purposes 17
of another future prudence review of these costs”, noting that “any future treatment regarding 18
the deferral account would be limited to the outcomes of the generic proceeding” and that 19
“[b]ased on the policy outcome of the generic proceeding, a future panel will decide on the 20
appropriate disposition (if any) of the deferral account balance.” (pp. 88-89) 21
22
As the EB-2015-0040 generic consultation has not concluded at the time of this Application, 23
consistent with the OEB’s EB-2013-0321 Decision, OPG is seeking to include forecast 24
pension and OPEB cash amounts in the nuclear revenue requirements for the test period. 25
With respect to the regulated hydroelectric facilities, the 2017-2021 hydroelectric payment 26
amounts proposed under a price cap incentive regulation approach would continue to reflect 27
the EB-2013-0321 approved forecast cash amounts. 28
29
Chart 1 below sets out pension and OPEB cash amounts attributed to the nuclear facilities in 30
the historical, bridge and test years. The cash amounts consist of contributions to the RPP 31

Filed: 2016-05-27 EB-2016-0152
Exhibit F4 Tab 3
Schedule 2 Page 5 of 23
and benefit payments to retirees and dependants under the OPEB plans. OPG’s total 1
projected cash amounts for pension and OPEB for 2016-2021 were calculated by an 2
independent actuary, Aon Hewitt, as shown in Attachment 1. Pension contributions, which 3
are typically set by triennial actuarial valuations, are projected to decrease after each such 4
assumed valuation during the test period, effective January 1, 2017 and January 1, 2020, as 5
discussed in section 4.2. Forecast amounts for pension contributions represent estimated 6
minimum required company contributions for current service cost and going concern special 7
payments.2 Increasing OPEB benefit payments over the period reflect the growing retiree 8
population and expected increases in per capita medical and other costs. 9
10
Chart 1 11
Pension and OPEB Cash Amounts – Nuclear3 ($M)
2013 Actual
2014 Actual
2015 Actual
2016 Projection
2017 Plan
2018 Plan
2019 Plan
2020 Plan
2021 Plan
Pension 231.6 280.9 284.5 283.3 171.1 175.5 180.3 157.2 162.1
OPEB 78.1 84.5 93.1 96.6 100.9 104.9 109.2 114.1 117.8
Total 309.7 365.4 377.6 379.9 272.0 280.4 289.5 271.3 279.9
12
Chart 2 sets out pension and OPEB accrual costs attributed to the nuclear facilities in the 13
historical, bridge and test years. OPG’s total accrual costs for these periods were determined 14
by Aon Hewitt in accordance with US GAAP, as set out in Attachment 1 for the 2016-2021 15
projection and Attachment 2 for the 2014-2015 actual amounts. 16
17
2 No solvency special payments are projected for 2016-2021 and none were made in 2013-2015.
3 Nuclear pension and OPEB amounts presented in this exhibit exclude amounts related to the Nuclear Waste
Management Organization (“NWMO”), which is consolidated into OPG’s financial statements.

Filed: 2016-05-27 EB-2016-0152 Exhibit F4 Tab 3 Schedule 2 Page 6 of 23
Chart 2 1
2
As set out in section 2.0 and Ex. H1-1-1, OPG proposes to record the difference between 3
actual accrual costs and actual cash amounts during the test period in the Pension & OPEB 4
Cash Versus Accrual Differential Deferral Account, and the difference between actual and 5
forecast cash amounts in the Pension & OPEB Cash Payment Variance Account. 6
Notwithstanding this proposal in light of the OEB’s ongoing generic consultation on pension 7
and OPEB, OPG continues to be of the view that it would be appropriate for it to recover 8
accrual costs for pension and OPEB for the regulated business for reasons summarized in 9
section 2.0. 10
11
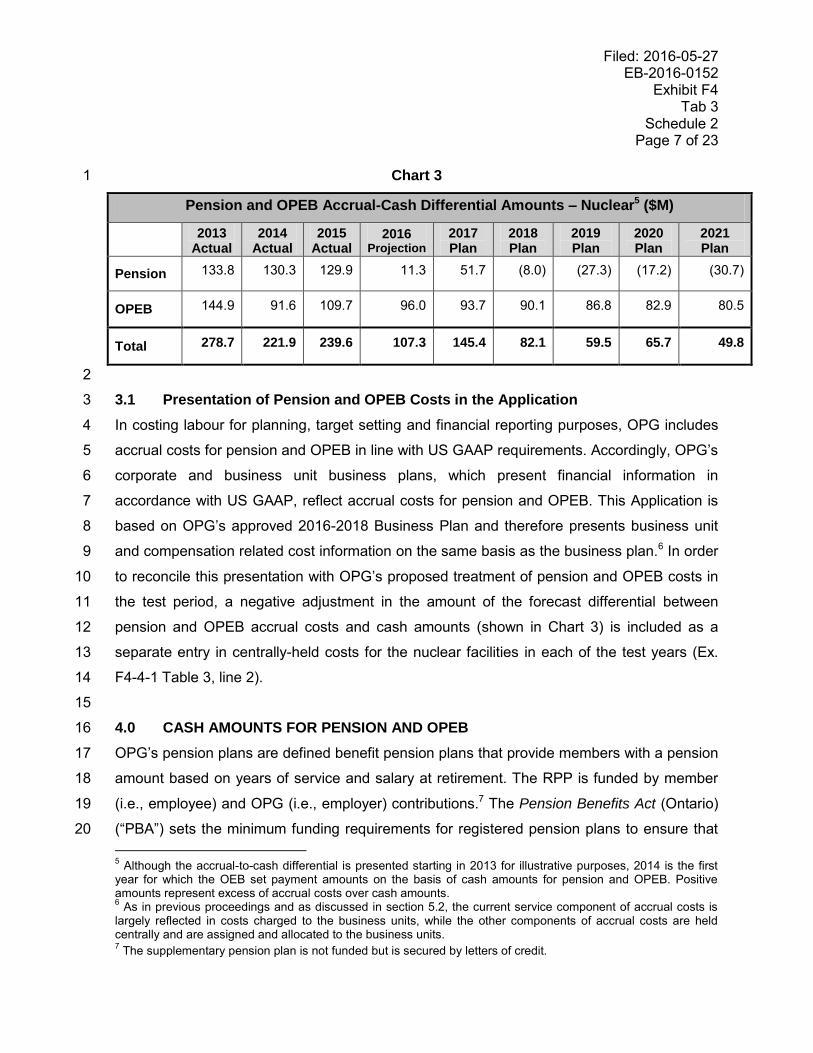
Chart 3 below sets out the difference between pension and OPEB accrual costs and cash 12
amounts attributed to the nuclear facilities for the historical, bridge and test periods (i.e., the 13
difference between the amounts in Chart 2 and the amounts in Chart 1). The difference is 14
expected to decline significantly by the end of the test period. Cash amounts for pension are 15
expected to exceed accrual costs starting in 2018. This trend reflects lower pension accrual 16
costs discussed in section 5.3. The OPEB cash-to-accrual difference is projected to decline 17
gradually over the test period as cash amounts increase. 18
19
20
4 Ibid.
Total Pension and OPEB Accrual Costs – Nuclear4 ($M)
2013 Actual
2014 Actual
2015 Actual
2016 Projection
2017 Plan
2018 Plan
2019 Plan
2020 Plan
2021 Plan
Pension 365.4 411.2 414.4 294.6 222.8 167.5 153.0 140.0 131.4
OPEB 223.0 176.1 202.8 192.6 194.6 195.0 196.0 197.0 198.3
Total 588.4 587.3 617.2 487.2 417.4 362.5 349.0 337.0 329.7
Filed: 2016-05-27 EB-2016-0152
Exhibit F4 Tab 3
Schedule 2 Page 7 of 23
Chart 3 1
Pension and OPEB Accrual-Cash Differential Amounts – Nuclear5 ($M)
2013 Actual
2014 Actual
2015 Actual
2016 Projection
2017 Plan
2018 Plan
2019 Plan
2020 Plan
2021 Plan
Pension 133.8 130.3 129.9 11.3 51.7 (8.0) (27.3) (17.2) (30.7)
OPEB 144.9 91.6 109.7 96.0 93.7 90.1 86.8 82.9 80.5
Total 278.7 221.9 239.6 107.3 145.4 82.1 59.5 65.7 49.8
2
3.1 Presentation of Pension and OPEB Costs in the Application 3
In costing labour for planning, target setting and financial reporting purposes, OPG includes 4
accrual costs for pension and OPEB in line with US GAAP requirements. Accordingly, OPG’s 5
corporate and business unit business plans, which present financial information in 6
accordance with US GAAP, reflect accrual costs for pension and OPEB. This Application is 7
based on OPG’s approved 2016-2018 Business Plan and therefore presents business unit 8
and compensation related cost information on the same basis as the business plan.6 In order 9
to reconcile this presentation with OPG’s proposed treatment of pension and OPEB costs in 10
the test period, a negative adjustment in the amount of the forecast differential between 11
pension and OPEB accrual costs and cash amounts (shown in Chart 3) is included as a 12
separate entry in centrally-held costs for the nuclear facilities in each of the test years (Ex. 13
F4-4-1 Table 3, line 2). 14
15
4.0 CASH AMOUNTS FOR PENSION AND OPEB 16
OPG’s pension plans are defined benefit pension plans that provide members with a pension 17
amount based on years of service and salary at retirement. The RPP is funded by member 18
(i.e., employee) and OPG (i.e., employer) contributions.7 The Pension Benefits Act (Ontario) 19
(“PBA”) sets the minimum funding requirements for registered pension plans to ensure that 20
5 Although the accrual-to-cash differential is presented starting in 2013 for illustrative purposes, 2014 is the first
year for which the OEB set payment amounts on the basis of cash amounts for pension and OPEB. Positive amounts represent excess of accrual costs over cash amounts. 6 As in previous proceedings and as discussed in section 5.2, the current service component of accrual costs is
largely reflected in costs charged to the business units, while the other components of accrual costs are held centrally and are assigned and allocated to the business units. 7 The supplementary pension plan is not funded but is secured by letters of credit.

Filed: 2016-05-27 EB-2016-0152 Exhibit F4 Tab 3 Schedule 2 Page 8 of 23
plans have sufficient assets in place to meet existing and future obligations. Contributions 1
must be made to fund the plan’s current service cost (also known as normal cost), as well as 2
deficiencies (i.e., deficits), if any, through defined special payments over a period of time. 3
4
The PBA requires actuarial valuations on both going concern and solvency bases to be 5
performed at least once every three years to determine the funded status of a registered 6
pension plan (i.e., the difference between the value of pension fund assets and the actuarial 7
present value of the accrued liability8 as of the valuation date) and required future 8
contributions. The going concern valuation measures the financial position of the pension 9
plan assuming that the plan continues indefinitely into the future. The solvency valuation 10
measures the financial position of the pension plan, as defined pursuant to the PBA, 11
assuming that the plan is wound-up on the valuation date and all benefits are settled by 12
either lump sum payments or annuity purchases. To the extent that going concern special 13
payments will not eliminate the solvency deficit over a 5-year period, additional payments 14
towards the solvency deficit (i.e., solvency special payments) are required over the 5-year 15
period. Going concern special payments are made over a 15-year period. Valuations are 16
prepared and certified by an independent actuary and must be filed with the Financial 17
Services Commission of Ontario (“FSCO”) and the Canada Revenue Agency (“CRA”). 18
19
In determining the going concern accrued liability and current service cost, an actuary 20
attributes the present value of future expected benefits over each plan member’s projected 21
service. The obligation at a particular date is the actuarial present value of the benefits 22
attributed to each member’s service rendered up to that date. Employer’s current service 23
cost represents the actuarial present value of benefits earned in respect of each additional 24
year of employee service, less any required employee contributions to the pension plan. 25
26
In order to establish funding requirements, economic and demographic assumptions are 27
required to determine the plan’s accrued liability as of the valuation date and to project 28
current service cost for future years. Examples of economic assumptions include discount 29
rates, inflation rate, and salary escalation rate. Examples of demographic assumptions 30
8 The term “accrued liability” and “benefit obligation” may be used interchangeably in this exhibit.

Filed: 2016-05-27 EB-2016-0152
Exhibit F4 Tab 3
Schedule 2 Page 9 of 23
include mortality rates and improvement scale, termination rates, and retirement rates. As 1
discussed below, certain assumptions differ between going concern valuations and solvency 2
valuations. Many of the assumptions used in the going concern funding valuations are also 3
applied in accounting valuations for determining the pension obligation and accrual costs. 4
5
Going concern valuation assumptions and methods are determined by the actuary preparing 6
the valuation, in accordance with accepted actuarial practice and taking into account 7
regulatory and legislative constraints and guidance issued by the Canadian Institute of 8
Actuaries (“CIA”), with input from plan sponsors. As prescribed by the PBA, key assumptions 9
used in the solvency valuation are required to be set in accordance with specific CIA 10
standards of practice. 11
12
The going concern benefit obligation and funding requirements are determined using a 13
discount rate based on the expected long-term rate of return on pension plan assets, taking 14
into account a margin for adverse deviation for some potential barriers to achieving this 15
return. This long-term rate of return is based on the pension fund asset mix and capital 16
market expectations of future risk and return for each asset class within the fund portfolio, net 17
of passive investment management fees.9 For the solvency valuation, the discount rates 18
used to determine the benefit obligation are required to be determined in accordance with 19
specific standards of practice issued by the CIA and with reference to government of Canada 20
bonds.10 21
22
The most recently filed actuarial valuation of OPG’s RPP is as at January 1, 2014. That 23
valuation showed that the pension fund was in a deficit position. Specifically, the RPP was 24
90.5 per cent funded on a going concern basis and 99 per cent funded on a solvency basis. 25
Funding requirements pursuant to the valuation included going concern special payments 26
9 The long-term expected rate of return used for US GAAP accrual accounting purposes is determined in a similar
way to the going concern discount rate, with the main differences being that the accounting rate does not take into account either a margin for adverse deviation or an allowance for passive investment management fees. 10
The solvency discount rates are typically lower than the going concern discount rates, as the solvency rates reflect current government bond yields and annuity purchase rates determined using information provided by insurance companies rather than the rate of return expected to be earned on pension fund assets.

Filed: 2016-05-27 EB-2016-0152 Exhibit F4 Tab 3 Schedule 2 Page 10 of 23
(over 15 years), but no solvency special payments.11 In 2014 and 2015, OPG made 1
approximately the minimum required contributions pursuant to the January 1, 2014 valuation 2
and, subject to employee contribution increases discussed in Ex. F4-3-1, is forecasting 3
contributions on the same basis for 2016. The January 1, 2014 valuation was previously 4
filed with the OEB in EB-2013-0321.12 5
6
The next actuarial valuation of the OPG RPP is expected to be completed in 2017 using data 7
and assumptions as of January 1, 2017, and must be filed with FSCO and CRA by 8
September 30, 2017. A subsequent valuation would need to be completed as of January 1, 9
2020 at the latest. The test period nuclear revenue requirements reflect projected RPP 10
contributions for the 2017-2021 period as determined by Aon Hewitt. As discussed further in 11
section 4.1, Aon Hewitt prepared this projection based on information available as of 12
December 31, 2015, extrapolating to the assumed January 1, 2017 and January 1, 2020 13
future valuation dates. 14
15
Cash amounts for OPEB reflect OPG’s benefit payments to retirees and dependants in 16
accordance with the provisions of the plans. Forecast OPEB payments for the 2016-2021 17
period represent the nuclear portion of total estimated future cash flows used by Aon Hewitt 18
to project OPEB benefit obligations over this period. 19
20
4.1 Forecasting Pension and OPEB Cash Amounts 21
Forecasting RPP contributions requires estimating the funded status of the plan as of the 22
date of each assumed future funding valuation. Developing these estimates requires 23
expectations of assumptions that will be used to determine the accrued liability as of these 24
dates, and projections of the actual pension fund performance to those dates. OPG’s total 25
projected required RPP contributions for 2017-2021 were calculated by Aon Hewitt, as set 26
out in Attachment 1, by projecting the going concern and solvency funded status of the plan 27
11
Although the pension plan was less than 100 per cent funded on a solvency basis, there was no requirement for additional solvency funding since the going concern special payments were determined by the valuation to be sufficient to fund the solvency deficit within 5 years. 12
EB-2013-0321 Ex. J9.6, Attachment 1.

Filed: 2016-05-27 EB-2016-0152
Exhibit F4 Tab 3
Schedule 2 Page 11 of 23
as at January 1, 2017 and January 1, 2020 based on year-end 2015 information. These 1
projections are reflected in OPG’s approved 2016-2018 Business Plan. 2
3
In order to project the January 1, 2017 and January 1, 2020 benefit obligations, Aon Hewitt 4
applied the January 1, 2014 funding valuation assumptions, subject to certain updates as at 5
year-end 2015.13 For the going concern valuation, the main update was a decrease in the 6
discount rate from 5.60 per cent per annum to 5.50 per cent per annum to reflect lower 7
expected long-term returns from pension fund assets based on the pension fund asset 8
allocation and capital market return expectations. For the solvency valuation, the changes 9
were to update the prescribed assumptions, including discount rates as at December 31, 10
2015 and the mortality assumption, which the CIA has now aligned with the 11
recommendations in their February 2014 CIA Final Report: Canadian Pensioners’ Mortality. 12
The January 1, 2017 and January 1, 2020 pension asset values were projected by Aon 13
Hewitt based on the actual December 31, 2015 value, at the expected long-term rate of 14
return of 6.0 per cent per annum discussed in section 5.1.14 15
16
Aon Hewitt’s projections of the funded status of the RPP based on year-end 2015 information 17
indicate that the plan will have a minimal going concern deficit as at January 1, 2017, and will 18
be fully funded on both going concern and solvency bases as at January 1, 2020. As such, 19
the projected minimum required pension plan contributions for 2017 to 2019 based on the 20
projected January 1, 2017 valuation comprise employer current service costs and small 21
going concern special payments. The total minimum required contributions for 2020 and 22
2021 based on the projected January 1, 2020 valuation represent the employer’s current 23
service cost only. For all years of the projection, the employer’s current service cost has 24
been reduced to reflect increases in employee contribution levels discussed in Ex. F4-3-1. 25
26
Projected benefit payments for OPEB plans reflect the cash flows of the underlying 27
accounting benefit obligations discussed in section 5.0. 28
13
Attachment 1, pp. 7-8. 14
This is the same assumption that was used to project accrual pension costs discussed in section 5.0. The difference between the going concern discount rate of 5.5 per cent and the expected long-term rate of return of 6.0 per cent relates to the factors described in footnote 9.

Filed: 2016-05-27 EB-2016-0152 Exhibit F4 Tab 3 Schedule 2 Page 12 of 23
1
As in previous proceedings, total OPG projected RPP contributions and OPEB payments for 2
2016-2021 were attributed to the nuclear facilities in proportion to the respective benefit 3
costs, which are allocated using the methodology discussed in section 5.2. The resulting 4
cash amounts for the nuclear facilities are presented in Chart 1 above. 5
6
4.2 Comparison of Pension and OPEB Cash Amounts 7
Pension contributions for the nuclear facilities were lower in 2013 relative to the 2014-2016 8
period primarily due to the higher going concern special payments required pursuant to the 9
January 1, 2014 valuation. Pension contributions are forecasted to decrease in 2017 relative 10
to the 2014-2016 period as the projected January 1, 2017 funding valuation indicates a lower 11
going concern deficit and therefore lower going concern special payments for the 2017-2019 12
period. As noted above, the going concern special payments are forecasted to be eliminated 13
in the January 1, 2020 valuation. There are no actual or projected solvency special payments 14
during the 2013-2021 period. 15
16
OPEB benefit payments increased gradually during the historical period and are expected to 17
continue to increase during the bridge and test periods. This trend reflects a growing retiree 18
population and expected increases in per capita medical and other costs. 19
20
Charts 4 below presents the EB-2013-0321 projected (2013) and OEB-approved (2014 and 21
2015) pension and OPEB cash amounts for the nuclear facilities. 22
23

Filed: 2016-05-27 EB-2016-0152
Exhibit F4 Tab 3
Schedule 2 Page 13 of 23
Chart 4 1
2
EB-2013-0321 Projected Pension and OPEB Cash Amounts –
Nuclear ($M)
2013 201415
201516
Pension 290.0 277.9 283.4
OPEB 80.9 77.3 82.4
Total 370.9 355.2 365.8
3
Actual pension contributions for 2013 were lower than projected primarily because OPG did 4
not make an additional, voluntary contribution to the pension plan assumed in the budget. 5
The actual pension contributions for 2014 and 2015 were largely in line with the OEB-6
approved forecast amounts. Actual OPEB payments for 2013 were close to projected 7
amounts, while the 2014 and 2015 amounts were higher than the OEB-approved forecast, 8
mainly as a result of retirements. 9
10 5.0 ACCRUAL COSTS FOR PENSION AND OPEB 11
As in EB-2013-0321, OPG’s accrual costs for pension and OPEB continue to be determined 12
in accordance with US GAAP and comprise several components. These components are: 13
current service cost (net of required employee contributions for funded plans), interest cost 14
on the benefit obligations at the appropriate discount rate, the expected return on RPP fund 15
assets using an assumed long-term rate of return, amounts for past service costs arising 16
from plan amendments, and amounts for actuarial gains or losses. Actuarial gains and losses 17
consist of experience gains and losses, which arise because actual experience differs from 18
that assumed (e.g., investment experience different than expected or higher or lower inflation 19
15
The total of EB-2013-0321 OEB-approved pension and OPEB cash amounts for the nuclear facilities for each of 2014 and 2015 can be re-calculated as follows (subject to rounding): EB-2013-0321 Ex. N2-1-1, Chart 1, “December 31, 2013 Update” lines for Nuclear for each of 2014 and 2015 less EB-2013-0321 Payment Amounts Order, App. A, Table 3a, Note 4, line 1a, col. (a) for 2014 and col. (b) for 2015. The total of 2014 and 2015 OEB-approved nuclear cash amounts for each of pension and OPEB can be re-calculated as follows (subject to rounding): EB-2013-0321 Payment Amounts Order, App G., p. 15, $23.38M x 24 mos. for pension and $6.66M x 24 mos. for OPEB.

Filed: 2016-05-27 EB-2016-0152 Exhibit F4 Tab 3 Schedule 2 Page 14 of 23
than assumed), and adjustments for changes in assumptions (e.g., discount rates or 1
mortality assumptions16). 2
3
In accordance with US GAAP, OPG’s pension and other post-retirement benefit accrual 4
costs for a given year are based on the measurement of benefit obligations and RPP fund 5
assets at the end of the previous year. As discussed below, the full impact of certain events 6
arising during a year is not charged to pension and OPEB costs for that year; rather, certain 7
amounts are accumulated and amortized over future periods. OPG’s LTD costs for the 8
current year are based on the measurement of the benefit obligation at the end of both the 9
current and the previous year, in accordance with US GAAP. The full impact of events arising 10
during a year related to LTD benefits is charged to OPEB costs for that year. 11
12
Similar to the going concern pension funding benefit obligation, the accounting obligations for 13
pension and other post-retirement benefits continue to be determined using the projected 14
benefit method pro-rated on service. Under this method, an equal portion of the total 15
estimated benefit liability is attributed to each year of service until the date the plan 16
participant would be entitled to the full benefit. The obligation at a particular date is the 17
actuarial present value of the benefits attributed to the service rendered up to that date. The 18
LTD obligation continues to be determined using the projected benefit method on a terminal 19
basis. Under this method, the total estimated future benefit is attributed to the year of service 20
in which a disability occurs. 21
22
OPG’s pension and OPEB costs and obligations continue to be determined annually by an 23
independent actuary using management’s best estimate assumptions, both economic (e.g., 24
inflation, salary escalation and health care cost trends) and demographic (e.g., mortality 25
rates and improvement scale, termination rates and retirement rates).17 The long-term 26
inflation assumption is based on the most recent long-term outlook view of the consumer 27
price index, informed by economic forecasts and the Bank of Canada’s target range of 28
16
There have been no changes to mortality assumptions used to develop OPG’s US GAAP based pension and OPEB benefit obligations, from those outlined in EB-2013-0321 Ex. N2-1-1, section 2.2 and EB-2013-0321 Ex. L-6.8-1 Staff-112. 17
Many of the pension assumptions used for accounting purposes are the same as those used in the actuarial valuations for funding purposes discussed in section 4.0.

Filed: 2016-05-27 EB-2016-0152
Exhibit F4 Tab 3
Schedule 2 Page 15 of 23
inflation. The salary escalation rate builds on the long-term inflation assumption, subject to 1
adjustments in the near term for known short-term salary expectations based on collective 2
agreement provisions and other expectations of salary growth. As in EB-2013-0321, the 3
longer term salary escalation rate continues to be equal to the long-term inflation rate plus 4
0.5 per cent. 5
6
In accordance with US GAAP, the discount rates used in determining benefit obligations and 7
accrual costs for pension and OPEB continue to be based on AA corporate bond yields in 8
Canada for the appropriate duration of the benefit obligation. The discount rates used to 9
establish the accrual costs for the historical, bridge and test years were determined using the 10
same approach as in EB-2013-0321.18 11
12
For purposes of determining pension costs, RPP fund assets continue to be valued using a 13
market-related value of assets. The market-related value used in determining OPG’s pension 14
costs recognizes gains and losses on equity assets relative to a six per cent assumed real 15
return over a five-year period. This contributes to the smoothing of impacts from equity 16
market volatility over time. Gains and losses on other than equity assets continue to be 17
recognized in the market-related value of assets immediately. 18
19
The expected long-term rate of return on the RPP fund assets continues to be calculated by 20
Aon Hewitt based on the pension fund asset mix and capital market expectations of future 21
risk and return for each asset class within the fund portfolio.19 22
23
Actuarial gains and losses for pension and other post-retirement benefits are generally 24
amortized over future periods. In accordance with US GAAP, OPG amortizes the net 25
cumulative unamortized gain or loss for each of these plans in excess of 10 per cent of the 26
greater of the benefit obligation and the market-related value of the plan assets over the 27
expected average remaining service life of the employees (i.e., the “corridor approach.”) Past 28
service costs or credits for pension and other post-retirement benefits continue to be 29
18
EB-2013-0321 Ex. F4-3-1, section 6.3.3. 19
See footnote 9.

Filed: 2016-05-27 EB-2016-0152 Exhibit F4 Tab 3 Schedule 2 Page 16 of 23
amortized over the expected average remaining service period to full eligibility of the affected 1
employee groups. All actuarial gains and losses and past service costs related to LTD 2
benefits continue to be recognized in the year they arise, in accordance with US GAAP. 3
4
5.1 Forecasting Pension and OPEB Accrual Costs 5
Forecasting pension and OPEB accrual costs requires estimating the values of the benefit 6
obligations and pension fund asset value at the end of the year preceding the forecast year. 7
Developing these estimates requires making projections of the actual pension fund 8
performance as well as projections of assumptions that will be used to determine the actual 9
obligations. Forecasting LTD costs also requires estimating the value of the benefit obligation 10
at the end of the last year in the forecast period. 11
12
OPG’s total projected pension and OPEB accrual costs for 2016-2021 underpinning this 13
Application were determined by Aon Hewitt using the actual December 31, 2015 values of 14
the benefit obligations and pension fund assets, and the final assumptions as at December 15
31, 2015. The forecast 2017-2021 costs reflect projections of benefit obligations and pension 16
fund assets at the end of each year in the 2016-2020 period using the December 31, 2015 17
final assumptions.20 18
19
Chart 5 below presents the assumptions used to determine OPG’s 2013-2015 actual and 20
2016-2021 projected pension and OPEB accrual costs in accordance with US GAAP.21 21
20
As the final December 31, 2015 assumptions were used in the projection, the 2016 pension and OPEB costs are expected to be close to the actual costs for the year with the exception of LTD costs, absent any significant unexpected changes in legislation or OPG’s operations. The 2016 LTD cost projections are less definitive because the actual costs will be calculated using information as of year-end 2016. 21
Assumptions for 2013 and 2014 were previously presented in EB-2014-0370 Ex. H1-1-1, Chart 1, in accordance with Canadian GAAP. The only assumption difference between US GAAP and Canadian GAAP applicable to OPG’s pension and OPEB costs in those years is the use of the year-end discount rate to determine LTD costs under US GAAP rather than the beginning of year discount rate under Canadian GAAP. As such, the LTD discount rate assumptions shown in Chart 5 for 2013 and 2014 differ from those presented in EB-2014-0370.

Updated: 2017-02-10 EB-2016-0152
Exhibit F4 Tab 3
Schedule 2 Page 17 of 23
1
Chart 5 2
Pension and OPEB Accrual Cost Assumptions (rate per annum)
2013
Actual22
2014
Actual22
2015
Actual 2016
Projection23
2017-2021
Plan23
Discount rate for pension 4.30% 4.90% 4.00% 4.10% 4.10%
Discount rate for other post-retirement benefits
4.40% 5.00% 4.10% 4.20% 4.20%
Discount rate for long-term disability
4.10% 3.30% 3.40% 3.40% 3.40%
Expected long-term rate of return on pension fund assets
6.25% 6.25% 6.25% 6.0% 6.0%
Inflation rate 2.0% 2.0% 2.0% 2.0% 2.0%
Weighted average salary schedule escalation rate
24
2.5% 2.5%
2.0% from Jan 1, 2015 to Dec 31, 2020
and 2.5% thereafter
1.6% from Jan 1, 2016 to Dec 31, 2021
and 2.5% thereafter
1.6% from Jan1, 2016 to Dec 31, 2021
and 2.5% thereafter
Rate of return used to project year-end pension fund asset values
25
N/A N/A N/A N/A 6.0% in
2016 to 2020
3
The actual returns on pension fund assets were 9.2 per cent in 2013, 16.2 per cent in 2014, 4
and 9.7 per cent in 2015. 5
22
Except for the LTD discount rate determined at year end, these are the same assumptions used to develop the 2013 and the final 2014 pension and OPEB cost projections presented in EB-2013-0321 (see EB-2013-0321: Ex. F4-3-1, Chart 1 for 2013 and OPG’s Argument-in-Chief, p. 97 for 2014). 23
The assumptions for 2016-2021 can also be found at pp. 6-7 of Aon Hewitt’s report in Attachment 1. 24
The weighted average salary schedule escalation rate of 1.6 per cent per year to the end of 2021 reflects assumptions (1.0 per cent per year to the end of 2017 for PWU-represented employees and 1.0 per cent to the end of 2018 for employees represented by The Society) based on current collective agreement provisions discussed in Ex. F4-3-1, and 2.0 per cent per year (i.e., inflation rate) thereafter. The longer term salary schedule escalation (after 2021) is set at the assumed inflation rate plus 0.5 per cent, as in EB-2013-0321. 25
Projections of rates of return to determine year-end pension fund asset values are not required for the calculation of the 2013-2016 costs because the actual prior year-end asset values are known.

Filed: 2016-05-27 EB-2016-0152 Exhibit F4 Tab 3 Schedule 2 Page 18 of 23
5.2 Pension and OPEB Accrual Cost Distribution 1
A portion of OPG’s total pension and OPEB accrual costs continues to be charged to the 2
business units as part of standard labour rates and other direct charges. The portion of the 3
costs that is charged to the business units26 is based on an estimate of the accrual current 4
service cost for pension and OPEB. The remainder of pension and OPEB accrual costs, 5
which includes interest costs on the obligations, the expected return on pension plan assets, 6
amounts for past service costs and actuarial gains and losses, and any current service cost 7
variance from the estimate reflected in standard labour rates and related direct charges to 8
the business units,26 continues to be recorded as a centrally-held cost (line 1 of Ex. F4-4-1 9
Table 1 and Table 3). 10
11
The centrally-held portion of pension and OPEB costs continues to be directly assigned and 12
allocated to the nuclear business unit, in proportion to amounts of pension and OPEB costs 13
charged to the business unit (including amounts assigned and allocated as part of corporate 14
Support Services costs). This methodology was used in EB-2010-0008, EB-2012-0002, EB-15
2013-0321 and EB-2014-0370. It was reviewed by HSG Group, Inc. in the cost allocation 16
study filed in EB-2013-0321, as well as by Black & Veatch Corporation Inc. in the cost 17
allocation study filed in EB-2010-0008. 18
19
5.3 Comparison of Pension and OPEB Accrual Costs 20
Chart 6 below provides a breakdown of the 2013-2021 pension and OPEB costs shown in 21
Chart 2 for the nuclear facilities between amounts charged to the business units and those 22
recorded in centrally held costs. As noted above, OPG is providing in Attachments 1 and 2 23
independent actuarial reports in support of the total OPG forecast 2016-2021 costs and the 24
actual 2014 an 2015 costs, respectively. An actuarial report in support of 2013 actual costs 25
was filed in EB-2014-0370.27 26
26
Includes pension and OPEB costs assigned and allocated as part of corporate Support Services costs. 27
Refer to EB-2014-0370 Ex. H1-1-2, Attachment 2. Although that report was prepared on a Canadian GAAP basis, the differences from US GAAP accrual costs are limited to LTD costs. These differences were described in EB-2013-0321 Ex. A2-1-1 and EB-2012-0002 Ex. A3-1-2.

Filed: 2016-05-27 EB-2016-0152
Exhibit F4 Tab 3
Schedule 2 Page 19 of 23
Chart 628 1
2 3
Total pension accrual costs for the nuclear facilities increased from 2013 to 2014 primarily 4
due to the updated mortality assumptions arising from a comprehensive accounting valuation 5
of pension plan obligations as at December 31, 2013, as discussed in EB-2013-032130, and 6
the impact of a lower than expected year-end 2013 pension fund asset value for fixed income 7
investments. The increase was partially offset by the impact of the higher discount rate as at 8
December 31, 2013. The pension accrual costs were largely stable in 2015 compared to 9
2014, primarily as the impact of the lower discount rate as at December 31, 2014 was largely 10
offset by the impact of a higher than expected year-end 2014 pension fund asset value and 11
negative expected net growth in cost components during 2015.31 Pension costs for the 12
28
“Business Unit Charge” amounts presented in Chart 6 and Chart 7 are equivalent to amounts labelled “Standard Labour Rate Component” in EB-2013-0321 evidence. 29
See footnote 3. 30
EB-2013-0321: Ex. N-1-1, Ex. N2-1-1 and Ex. L-6.8-1 Staff-112. 31
As in previous proceedings, expected net growth (i.e. change) in cost components refers to the impact of changes in current service costs in the normal course, higher interest costs on a higher benefit obligation due to the passage of time, expected changes in the pension asset value, and related changes in amortization of historical actuarial gains or losses.
Total Pension and OPEB Accrual Costs – Nuclear29 ($M)
2013
Actual 2014
Actual 2015
Actual
2016 Projec-
tion
2017 Plan
2018 Plan
2019 Plan
2020 Plan
2021 Plan
Pension – Business Unit Charge
222.2 214.6 218.6 228.6 243.0 230.4 239.0 242.4 244.3
Pension – Centrally Held
143.2 196.6 195.8 66.0 (20.2) (62.9) (86.0) (102.4) (112.9)
Total Pension Cost
365.4 411.2 414.4 294.6 222.8 167.5 153.0 140.0 131.4
OPEB – Business Unit Charge
77.2 74.2 55.6 58.5 67.8 66.2 67.1 68.1 68.6
OPEB – Centrally Held
145.8 101.9 147.2 134.1 126.8 128.8 128.9 128.9 129.7
Total OPEB Cost 223.0 176.1 202.8 192.6 194.6 195.0 196.0 197.0 198.3
Total Pension and OPEB Costs
588.4 587.3 617.2 487.2 417.4 362.5 349.0 337.0 329.7

Filed: 2016-05-27 EB-2016-0152 Exhibit F4 Tab 3 Schedule 2 Page 20 of 23
nuclear facilities are projected to decrease significantly over the 2016-2021 period reflecting 1
negative expected net growth in cost components, primarily due to projected increases in the 2
pension asset value and lower amortization of historical net actuarial losses under the 3
corridor approach. The year-over-year decreases in forecast pension costs in 2016 and 2017 4
also reflect increases in employee contributions discussed in Ex. F4-3-1. Additionally, the 5
impact of the slightly higher discount rate at December 31, 2015 and the impact of lower 6
staffing levels contribute to the decrease in the costs in 2016 compared to 2015. 7
8
Total OPEB accrual costs for the nuclear facilities decreased from 2013 to 2014, mainly due 9
to the lower expected per capita health care benefit costs reflected as part of the 10
comprehensive accounting valuation as at December 31, 2013 and the impact of the higher 11
discount rate as at December 31, 2013. The increase in OPEB costs from 2014 to 2015 was 12
primarily due to the decrease in discount rates at December 31, 2014. OPEB costs are 13
forecast to decrease from 2015 to 2016, mainly as a result of the slightly higher discount rate 14
as at December 31, 2015 and lower staffing levels. In the projection for 2017 to 2021, OPEB 15
costs for the nuclear facilities are expected to remain largely stable. 16
17
Chart 7 presents the current service cost component of the total pension and OPEB accrual 18
costs shown in Chart 6. As discussed in section 5.2, total current service cost is comprised of 19
estimated amounts charged to the business units through standard labour rates and other 20
direct charges as well as variances from these estimated amounts, which are included in 21
centrally-held costs. The sum of pension and OPEB current service cost shown in Chart 7 is 22
presented as part of total compensation details at Ex. F4-3-1, Attachment 1, line 45. 23
24
25

Filed: 2016-05-27 EB-2016-0152
Exhibit F4 Tab 3
Schedule 2 Page 21 of 23
Chart 732 1
Pension and OPEB Accrual Current Service Cost – Nuclear33 ($M)
2013 Actual
2014 Actual
2015 Actual
2016 Projec-
tion
2017 Plan
2018 Plan
2019 Plan
2020 Plan
2021 Plan
Pension – Business Unit Charge
34
222.2 214.6 218.6 228.6 243.0 230.4 239.0 242.4 244.3
Pension – Centrally Held
(0.2) (30.9) 32.0 (9.4) (18.6) (9.2) (12.2) (15.8) (18.3)
Total Pension Current Service Cost
222.0
183.7
250.6
219.2
224.4
221.2
226.8
226.6
226.0
OPEB – Business Unit Charge
34
77.2 74.2 55.6 58.5 67.8 66.2 67.1 68.1 68.6
OPEB – Centrally Held
(4.5) (19.1) 5.1 (0.5) (9.0) (8.7) (10.3) (11.7) (12.5)
Total OPEB Current Service Cost
72.7
55.1
60.7
58.0
58.8
57.5
56.8
56.4
56.1
Total Pension and OPEB Current Service Cost
294.7 238.8 311.3 277.2 283.2 278.7 283.6 283.0 282.1
2
Pension accrual current service cost for the nuclear facilities was lower in 2014 than in 2013 3
mainly on account of the higher discount rate as at December 31, 2013, partly offset by the 4
impact of updated mortality assumptions from the comprehensive accounting valuation of 5
plan obligations as at December 31, 2013. OPEB accrual current service cost was also lower 6
in 2014 than in 2013, primarily as a result of the higher discount rate as at December 31, 7
2013 and lower expected per capita health care benefit costs reflected as part of the 8
comprehensive accounting valuation. The higher pension and OPEB current service cost in 9
2015, compared to 2014, reflected a lower discount rate as at December 31, 2014. The lower 10
pension and OPEB current service cost in 2016 compared to 2015 is mainly due to lower 11
staffing levels and slightly higher discount rates, and, for pension, increased employee 12
32 See footnote 28. 33 See footnote 3. 34 As shown in Chart 6.

Filed: 2016-05-27 EB-2016-0152 Exhibit F4 Tab 3 Schedule 2 Page 22 of 23
pension plan contributions. The current service cost for both pension and OPEB is largely 1
stable over the test period. 2
3
The split of each year’s accrual current service cost between business unit charges35 and 4
centrally-held costs primarily varies with differences between actual and budgeted current 5
service cost amounts, and differences between total estimated payroll for regular employees 6
used to develop standard labour rates and the company’s actual payroll. 7
8
6.0 CONCLUSION 9
Although OPG continues to be of the view that it is appropriate for it to recover its pension 10
and OPEB costs on an accrual basis, OPG proposes to continue the treatment for pension 11
and OPEB costs adopted by the OEB in the EB-2013-0321 Decision pending the outcome of 12
the OEB’s generic consultation on pension and OPEB. 13
14
Both accrual costs and cash amounts for OPG’s pension and OPEB plans are projected to 15
decline during the test period. As accrual costs are decreasing at a faster pace, the annual 16
difference between accrual costs and cash amounts is expected to narrow significantly from 17
an average of about $230M per year in 2014-2015 to just under $50M by 2021 (for the 18
nuclear facilities). These decreases reflect, among other factors, pension reforms for 19
represented employees achieved through the 2015 round of collective bargaining with direct 20
involvement and support of the Government of Ontario, as well as similar reforms introduced 21
for the Management group. Cash amounts for pension are expected to exceed accrual costs 22
starting in 2018. 23
35
Includes pension and OPEB costs assigned and allocated as part of corporate support services costs.

Filed: 2016-05-27 EB-2016-0152
Exhibit F4 Tab 3
Schedule 2 Page 23 of 23
ATTACHMENTS 1
2
Attachment 1: Aon Hewitt Report on OPG’s Estimated Pension and OPEB Costs 3
for 2016-2021 4
5
Attachment 2: Aon Hewitt Report on OPG’s Pension and OPEB Costs for 2014 6
and 2015 7

Aon Hewitt
Risk. Reinsurance. Human Resources.
Report on the Estimated Accounting Cost for Post Employment Benefit Plans for Fiscal Years 2016 to 2021 Ontario Power Generation Inc.
January 1, 2016 to December 31, 2021
Filed: 2016-05-27
EB-2016-0152
Exhibit F4-3-2
Attachment 1
Page 1 of 15
Davellal
Rectangle

Aon Hewitt
Report on the Estimated Accounting Cost for Post Employment Benefit Plans for Fiscal Years 2016 to 2021 2
Table of Contents Introduction 3
Actuarial Report 5
Results for Fiscal Years 2016 to 2021 5
Actuarial Methods and Assumptions 6
Schedule 1—Summary of Estimated 2016 US GAAP Results 9
Schedule 2—Summary of Estimated 2017 US GAAP Results 10
Schedule 3—Summary of Estimated 2018 US GAAP Results 11
Schedule 4—Summary of Estimated 2019 US GAAP Results 12
Schedule 5—Summary of Estimated 2020 US GAAP Results 13
Schedule 6—Summary of Estimated 2021 US GAAP Results 14
Filed: 2016-05-27
EB-2016-0152
Exhibit F4-3-2
Attachment 1
Page 2 of 15

Aon Hewitt
Report on the Estimated Accounting Cost for Post Employment Benefit Plans for Fiscal Years 2016 to 2021 3
Introduction This report summarizes the estimated accounting costs for fiscal years 2016 through 2021 for the post employment benefit plans sponsored by Ontario Power Generation Inc. (“OPG”).
This report covers the following plans sponsored by OPG:
Ontario Power Generation Inc. Pension Plan (“RPP”);
Ontario Power Generation Inc. Supplementary Pension Plan (“SPP”) ;
Non-pension Post Retirement Plan which provides other post retirement benefits (“OPRB”) including retiree medical, dental, life insurance, and retirement bonus benefits; and
Post Employment Plan which provides long-term disability benefits (“LTD”) including sick leave benefits before LTD begins and the continuation of medical, dental and life insurance while on LTD.
Collectively SPP, OPRB and LTD are known as Other Post Employment Benefits (“OPEB”).
The results cover the fiscal years from January 1, 2016 to December 31, 2021. The results have been developed in accordance with US generally accepted accounting principles (“US GAAP”) under ASC 715, 712 and 710.
The results in this report do not include amounts related to the benefit plans of the Nuclear Waste Management Organization, which are included in OPG’s consolidated financial statements.
Unless otherwise stated all assumptions, data elements, methodologies, plan provisions, and information about assets reflected in this report are the same as those underlying and/or contained in the December 31, 2015 disclosure reports (“the Reports”) prepared by Aon Hewitt in accordance with US GAAP for the post employment benefit plans sponsored by OPG. These disclosure reports were dated March 2016 and are titled as follows:
US GAAP Accounting Information Non-pension Post-retirement and Post-employment Benefits Plans; and
US GAAP Accounting Information – Pension Plans.
Filed: 2016-05-27
EB-2016-0152
Exhibit F4-3-2
Attachment 1
Page 3 of 15
Aon Hewitt
Report on the Estimated Accounting Cost for Post Employment Benefit Plans for Fiscal Years 2016 to 2021 4
Sincerely,
Aon Hewitt Inc. Aon Hewitt Inc. [Original signed by]
[Original signed by]
Linda M. Byron Fellow of the Society of Actuaries Fellow of the Canadian Institute of Actuaries
May 2016
Gregory W. Durant Fellow of the Society of Actuaries Fellow of the Canadian Institute of Actuaries
Filed: 2016-05-27
EB-2016-0152
Exhibit F4-3-2
Attachment 1
Page 4 of 15

Aon Hewitt
Report on the Estimated Accounting Cost for Post Employment Benefit Plans for Fiscal Years 2016 to 2021 5
Actuarial Report
Results for Fiscal Years 2016 to 2021 OPG’s total estimated pension and OPEB costs for fiscal years 2016 through 2021 as determined in accordance with US GAAP are as follows:
All figures are shown in Canadian $000's.
US GAAP
2016 2017 2018 2019 2020 2021
RPP $ 367,277 $ 276,001 $ 206,870 $ 188,085 $ 172,093 $ 161,479SPP 22,112 21,750 21,560 21,257 21,151 21,033OPRB 199,546 201,470 202,065 203,238 205,056 207,160LTD 18,348 17,715 17,095 16,510 15,965 15,466Total $ 607,283 $ 516,936 $ 447,590 $ 429,090 $ 414,265 $ 405,138 The estimated 2016 costs for the RPP, SPP and OPRB plans are not expected to change, unless a significant event, such as a curtailment or settlement or other unexpected changes to OPG’s operations were to take place prior to December 31, 2016. The final 2016 cost under US GAAP for the LTD plan will be determined at December 31, 2016 based on applicable information and assumptions at that date.
The final 2017 to 2021 costs for all plans under US GAAP will be determined based on applicable information, experience and assumptions in the future.
Further details of the above OPG-wide estimated costs, by plan, as well as OPG’s estimated contributions to the RPP fund and benefit payments for OPEB are provided in Schedules 1 through 6 to this report.
Filed: 2016-05-27
EB-2016-0152
Exhibit F4-3-2
Attachment 1
Page 5 of 15

Aon Hewitt
Report on the Estimated Accounting Cost for Post Employment Benefit Plans for Fiscal Years 2016 to 2021 6
Actuarial Methods and Assumptions The actuarial methodology and accounting policies used in the development of the estimated costs for fiscal years 2016 through 2021 under US GAAP are summarized below.
Benefit obligations for RPP, SPP and OPRB are determined using the projected benefit method prorated on service;
Benefit obligations for LTD are determined using the projected benefit method on a terminal basis such that the total estimated future benefit is attributed to the year of service in which a disability occurs;
The discount rates have been determined in accordance with US GAAP. The discount rates have been set with reference to those representative of AA corporate bond yields in Canada having duration similar to the liabilities of the plans. The December 31, 2015 discount rates were 4.10% per annum for determining the estimated 2016 through 2021 RPP and SPP costs, 4.20% per annum for determining the estimated 2016 through 2021 OPRB costs, and 3.40% per annum for determining the estimated 2016 through 2021 LTD costs. The actual discount rate as at December 31, 2016 will be used to determine the final 2016 LTD cost under US GAAP;
A building block approach is used in determining the expected long-term rate of return on plan assets. Historical markets are studied and long-term historical relationships between equities and fixed-income are preserved consistent with the widely accepted capital market principle that assets with higher volatility generate a greater return over the long run. Current market factors such as inflation and interest rates are evaluated before long-term capital market assumptions are determined. The long-term portfolio return is established using the fund’s asset allocations, via a building block approach with proper consideration of diversification and rebalancing. Aon Hewitt calculated the expected return based on this methodology. An expected rate of return on assets of 6.00% per annum determined using the above approach was used for determining the estimated 2016 through 2021 RPP costs;
Other actuarial assumptions are management’s best estimate of future events, as determined in consultation with us and as set out in the Reports. These assumptions include the inflation rate, which was established at 2.00% for determining 2016 to 2021 costs, and the salary scale increase rate, which was established at 1.00% per annum to end of 2017 for Power Workers’ Union (“PWU”) represented employees and to the end of 2018 for employees represented by The Society of Energy Professionals (“The Society”), 2.00% per annum to the end of 2021, and 2.50% per annum thereafter (plus Promotion, Progression, Merit for all years). These salary scale increase assumptions for the 2016-2017 period for PWU-represented employees and for the 2016-2018 period for employees represented by The Society are consistent with the provisions of the corresponding collective agreements;
The active membership headcount is first calculated for each business unit based on the assumed decrements, and then compared to the estimated active December 31, 2016 to December 31, 2021 headcounts for each business unit. If the calculated headcounts exceed the estimated headcounts at year-end, additional employees are assumed to retire or terminate to reduce the headcounts. Conversely, new
Filed: 2016-05-27
EB-2016-0152
Exhibit F4-3-2
Attachment 1
Page 6 of 15

Aon Hewitt
Report on the Estimated Accounting Cost for Post Employment Benefit Plans for Fiscal Years 2016 to 2021 7
entrants are assumed to be added to the plan in order to achieve anticipated headcounts, if the calculated headcounts are lower than the estimated headcounts at year-end. The estimated December 31, 2016 to December 31, 2021 active headcounts used are as follows:
2016 2017 2018 2019 2020 2021
Nuclear 6,185 6,237 6,229 6,179 6,048 5,978
Hydro / Thermal 1,517 1,469 1,447 1,406 1,389 1,358
Support Services 2,101 2,068 2,043 2,026 2,001 1,994
Total 9,803 9,774 9,719 9,611 9,438 9,330
Actuarial gains or losses for RPP, SPP and OPRB have been amortized using the 10% corridor method, except where immediate recognition is required under US GAAP for non-routine events during the year (none expected during 2016 through 2021);
Past service costs for RPP, SPP and OPRB have been amortized on a straight-line basis over the expected average remaining service lifetime at the amendment date, except where immediate recognition is required under US GAAP during the year (none expected during 2016 through 2021);
For LTD, all actuarial gains and losses and past service costs are required to be recognized immediately in the cost. Therefore, under US GAAP, the cost is equal to the change in the benefit obligation plus benefit payments; and
Expected return on assets and amortization of actuarial gains/losses are based on a market-related value of assets where investment gains and losses on equity assets in excess of an expected return of 6.0% per annum plus the increase in Consumer Price Index are smoothed over five years.
The 2016 contributions to the RPP fund are based on the latest actuarial valuation as of January 1, 2014 for funding purposes of the RPP, updated to reflect increases in required member contributions coming into effect for represented and non-represented members during 2016. The next actuarial valuation for funding purposes must have an effective date no later than January 1, 2017. We have assumed that based on a triennial filing, the subsequent actuarial valuation for funding purposes would have an effective date of January 1, 2020.
In order to project contributions to the RPP for 2017 to 2021, an estimate of the going concern and solvency positions of the RPP is required. The contributions for 2017 to 2019 are estimated based on the projected going concern and solvency funded status as of January 1, 2017. The estimated contributions for 2020 to 2021 are based on the projected going concern and solvency funded status as of January 1, 2020, Contributions during the period 2017 to 2021 reflect increases in required member contributions coming into effect during that period for represented and non-represented members. All assumptions used for the determination of the projected going concern funded status are the
Filed: 2016-05-27
EB-2016-0152
Exhibit F4-3-2
Attachment 1
Page 7 of 15

Aon Hewitt
Report on the Estimated Accounting Cost for Post Employment Benefit Plans for Fiscal Years 2016 to 2021 8
same as those used for the funding valuation as of January 1, 20141, updated to reflect a discount rate of 5.50% per annum which reflects lower expected returns from pension fund assets determined using our capital market expectation model based on the pension fund’s asset allocation.
All assumptions used for the determination of the projected solvency funded status are the same as those used for the funding valuation as at January 1, 2014, updated to reflect the following prescribed assumptions:
The non-indexed discount rates are 2.10% per annum for the first 10 years and 3.70% per annum thereafter for commuted values, and 3.20% per annum for annuity purchases. The indexed discount rates for commuted values are 1.30% per annum for the first 10 years and 1.80% per annum thereafter; and
The mortality assumption is per the 2014 Canadian Pensioners’ Mortality Table combined with the Canadian Pensioners Mortality Improvement Scale B (CPM-B), both as published in the February 2014 CIA Final Report: Canadian Pensioners’ Mortality.
The projected benefit payments for the OPEB plans reflect the estimated cashflows of the underlying benefit obligations.
1 Includes application of the January 1, 2014 valuation 3‐year salary scale assumption as at January 1, 2017.
Filed: 2016-05-27
EB-2016-0152
Exhibit F4-3-2
Attachment 1
Page 8 of 15

Aon Hewitt
Report on the Estimated Accounting Cost for Post Employment Benefit Plans for Fiscal Years 2016 to 2021 9
Schedule 1—Summary of Estimated 2016 US GAAP Results The following table provides a summary of the estimated US GAAP results for 2016 for the post employment benefit plans sponsored by OPG. The estimated net periodic pension/benefit cost for the period January 1, 2016 to December 31, 2016 is determined based on the balance sheet items at January 1, 2016.
(in Canadian $000's) RPP SPP OPRB LTD
Net Asset (Liability) Recognized as at January 1, 2016
Projected Benefit Obligation $ (15,404,062) $ (295,295) $ (2,914,927) $ (259,900)Fair Value of Plan Assets 13,072,299 0 0 0 Net Asset (Liability) Recognized $ (2,331,763) $ (295,295) $ (2,914,927) $ (259,900)
Amounts Recognized in Accumulated Other Comprehensive Income as at January 1, 2016
Unrecognized Past Service Costs (Credits) $ 0 $ 0 $ 5,851 $ 0 Unrecognized Net Actuarial Loss (Gain) 3,017,663 77,532 537,802 0 Total Accumulated Other Comprehensive Loss (Income) $ 3,017,663 $ 77,532 $ 543,653 $ 0
Components of Estimated Net Periodic Pension/Benefit Cost, January 1, 2016 to December 31, 2016
Employer Current Service Cost $ 273,247 $ 6,092 $ 56,497 $ 9,647 Interest Cost 630,810 11,986 123,223 8,701 Expected Return on Plan Assets (728,898) 0 0 0 Amortization of Past Service Cost 0 0 583 0 Amortization of Net (Gain) Loss 192,118 4,034 19,243 0 Total Cost $ 367,277 $ 22,112 $ 199,546 $ 18,348
2016 Estimated Employer Pension Contributions / Benefit Payments $ 353,316 $ 18,107 $ 75,094 $ 27,280
Filed: 2016-05-27
EB-2016-0152
Exhibit F4-3-2
Attachment 1
Page 9 of 15

Aon Hewitt
Report on the Estimated Accounting Cost for Post Employment Benefit Plans for Fiscal Years 2016 to 2021 10
Schedule 2—Summary of Estimated 2017 US GAAP Results The following table provides a summary of the estimated US GAAP results for 2017 for the post employment benefit plans sponsored by OPG. The estimated net periodic pension/benefit cost for the period January 1, 2017 to December 31, 2017 is determined based on the projected balance sheet items at January 1, 2017.
(in Canadian $000's) RPP SPP OPRB LTD
Projected Net Asset (Liability) Recognized as at January 1, 2017
Projected Benefit Obligation $ (15,724,926) $ (295,266) $ (3,019,658) $ (250,968)Fair Value of Plan Assets 13,619,630 0 0 0 Net Asset (Liability) Recognized $ (2,105,296) $ (295,266) $ (3,019,658) $ (250,968)
Estimated Amounts Recognized in Accumulated Other Comprehensive Income as at January 1, 2017
Unrecognized Past Service Costs (Credits) $ 0 $ 0 $ 5,268 $ 0 Unrecognized Net Actuarial Loss (Gain) 2,777,235 73,498 518,664 0 Total Accumulated Other Comprehensive Loss (Income) $ 2,777,235 $ 73,498 $ 523,932 $ 0
Components of Estimated Net Periodic Pension/Benefit Cost, January 1, 2017 to December 31, 2017
Employer Current Service Cost $ 277,972 $ 6,194 $ 57,285 $ 9,316 Interest Cost 643,048 11,981 127,550 8,399 Expected Return on Plan Assets (778,316) 0 0 0 Amortization of Past Service Cost 0 0 583 0 Amortization of Net (Gain) Loss 133,297 3,575 16,052 0 Total Cost $ 276,001 $ 21,750 $ 201,470 $ 17,715
2017 Estimated Employer Pension Contributions / Benefit Payments $ 211,838 $ 18,469 $ 80,053 $ 26,514
Filed: 2016-05-27
EB-2016-0152
Exhibit F4-3-2
Attachment 1
Page 10 of 15
Aon Hewitt
Report on the Estimated Accounting Cost for Post Employment Benefit Plans for Fiscal Years 2016 to 2021 11
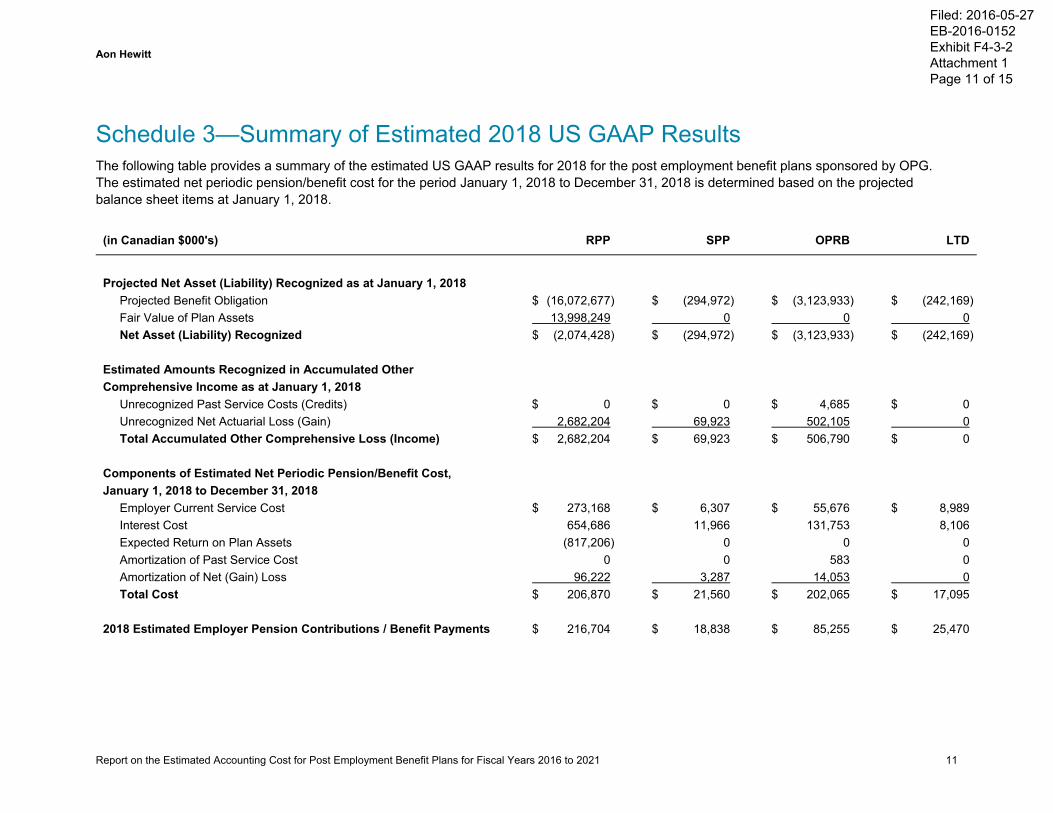
Schedule 3—Summary of Estimated 2018 US GAAP Results The following table provides a summary of the estimated US GAAP results for 2018 for the post employment benefit plans sponsored by OPG. The estimated net periodic pension/benefit cost for the period January 1, 2018 to December 31, 2018 is determined based on the projected balance sheet items at January 1, 2018.
(in Canadian $000's) RPP SPP OPRB LTD
Projected Net Asset (Liability) Recognized as at January 1, 2018
Projected Benefit Obligation $ (16,072,677) $ (294,972) $ (3,123,933) $ (242,169)Fair Value of Plan Assets 13,998,249 0 0 0 Net Asset (Liability) Recognized $ (2,074,428) $ (294,972) $ (3,123,933) $ (242,169)
Estimated Amounts Recognized in Accumulated Other Comprehensive Income as at January 1, 2018
Unrecognized Past Service Costs (Credits) $ 0 $ 0 $ 4,685 $ 0 Unrecognized Net Actuarial Loss (Gain) 2,682,204 69,923 502,105 0 Total Accumulated Other Comprehensive Loss (Income) $ 2,682,204 $ 69,923 $ 506,790 $ 0
Components of Estimated Net Periodic Pension/Benefit Cost, January 1, 2018 to December 31, 2018
Employer Current Service Cost $ 273,168 $ 6,307 $ 55,676 $ 8,989 Interest Cost 654,686 11,966 131,753 8,106 Expected Return on Plan Assets (817,206) 0 0 0 Amortization of Past Service Cost 0 0 583 0 Amortization of Net (Gain) Loss 96,222 3,287 14,053 0 Total Cost $ 206,870 $ 21,560 $ 202,065 $ 17,095
2018 Estimated Employer Pension Contributions / Benefit Payments $ 216,704 $ 18,838 $ 85,255 $ 25,470
Filed: 2016-05-27
EB-2016-0152
Exhibit F4-3-2
Attachment 1
Page 11 of 15

Aon Hewitt
Report on the Estimated Accounting Cost for Post Employment Benefit Plans for Fiscal Years 2016 to 2021 12
Schedule 4—Summary of Estimated 2019 US GAAP Results The following table provides a summary of the estimated US GAAP results for 2019 for the post employment benefit plans sponsored by OPG. The estimated net periodic pension/benefit cost for the period January 1, 2019 to December 31, 2019 is determined based on the balance sheet items at January 1, 2019.
(in Canadian $000's) RPP SPP OPRB LTD
Projected Net Asset (Liability) Recognized as at January 1, 2019
Projected Benefit Obligation $ (16,335,705) $ (294,407) $ (3,225,414) $ (233,794)Fair Value of Plan Assets 14,282,869 0 0 0 Net Asset (Liability) Recognized $ (2,052,836) $ (294,407) $ (3,225,414) $ (233,794)
Estimated Amounts Recognized in Accumulated Other Comprehensive Income as at January 1, 2019
Unrecognized Past Service Costs (Credits) $ 0 $ 0 $ 4,102 $ 0 Unrecognized Net Actuarial Loss (Gain) 2,670,446 66,636 487,359 0 Total Accumulated Other Comprehensive Loss (Income) $ 2,670,446 $ 66,636 $ 491,461 $ 0
Components of Estimated Net Periodic Pension/Benefit Cost, January 1, 2019 to December 31, 2019
Employer Current Service Cost $ 278,903 $ 6,433 $ 54,681 $ 8,678 Interest Cost 666,847 11,941 135,855 7,832 Expected Return on Plan Assets (840,623) 0 0 0 Amortization of Past Service Cost 0 0 583 0 Amortization of Net (Gain) Loss 82,958 2,883 12,119 0 Total Cost $ 188,085 $ 21,257 $ 203,238 $ 16,510
2019 Estimated Employer Pension Contributions / Benefit Payments $ 221,692 $ 19,215 $ 90,910 $ 24,257
Filed: 2016-05-27
EB-2016-0152
Exhibit F4-3-2
Attachment 1
Page 12 of 15

Aon Hewitt
Report on the Estimated Accounting Cost for Post Employment Benefit Plans for Fiscal Years 2016 to 2021 13
Schedule 5—Summary of Estimated 2020 US GAAP Results The following table provides a summary of the estimated US GAAP results for 2020 for the post employment benefit plans sponsored by OPG. The estimated net periodic pension/benefit cost for the period January 1, 2020 to December 31, 2020 is determined based on the balance sheet items at January 1, 2020.
(in Canadian $000's) RPP SPP OPRB LTD
Projected Net Asset (Liability) Recognized as at January 1, 2020
Projected Benefit Obligation $ (16,646,750) $ (293,566) $ (3,323,905) $ (226,047)Fair Value of Plan Assets 14,647,094 0 0 0 Net Asset (Liability) Recognized $ (1,999,656) $ (293,566) $ (3,323,905) $ (226,047)
Estimated Amounts Recognized in Accumulated Other Comprehensive Income as at January 1, 2020
Unrecognized Past Service Costs (Credits) $ 0 $ 0 $ 3,519 $ 0 Unrecognized Net Actuarial Loss (Gain) 2,650,873 63,753 474,105 0 Total Accumulated Other Comprehensive Loss (Income) $ 2,650,873 $ 63,753 $ 477,624 $ 0
Components of Estimated Net Periodic Pension/Benefit Cost, January 1, 2020 to December 31, 2020
Employer Current Service Cost $ 278,643 $ 6,561 $ 54,332 $ 8,391 Interest Cost 678,648 11,903 139,841 7,574 Expected Return on Plan Assets (862,245) 0 0 0 Amortization of Past Service Cost 0 0 539 0 Amortization of Net (Gain) Loss 77,047 2,687 10,344 0 Total Cost $ 172,093 $ 21,151 $ 205,056 $ 15,965
2020 Estimated Employer Pension Contributions / Benefit Payments $ 193,346 $ 19,599 $ 97,362 $ 23,326
Filed: 2016-05-27
EB-2016-0152
Exhibit F4-3-2
Attachment 1
Page 13 of 15

Aon Hewitt
Report on the Estimated Accounting Cost for Post Employment Benefit Plans for Fiscal Years 2016 to 2021 14
Schedule 6—Summary of Estimated 2021 US GAAP Results The following table provides a summary of the estimated US GAAP results for 2021 for the post employment benefit plans sponsored by OPG. The estimated net periodic pension/benefit cost for the period January 1, 2021 to December 31, 2021 is determined based on the balance sheet items at January 1, 2021.
(in Canadian $000’s) RPP SPP OPRB LTD
Projected Net Asset (Liability) Recognized as at January 1, 2021
Projected Benefit Obligation $ (16,929,550) $ (292,431) $ (3,419,351) $ (218,686)Fair Value of Plan Assets 14,956,659 0 0 0 Net Asset (Liability) Recognized $ (1,972,891) $ (292,431) $ (3,419,351) $ (218,686)
Estimated Amounts Recognized in Accumulated Other Comprehensive Income as at January 1, 2021
Unrecognized Past Service Costs (Credits) $ 0 $ 0 $ 2,980 $ 0 Unrecognized Net Actuarial Loss (Gain) 2,645,361 61,066 462,396 0 Total Accumulated Other Comprehensive Loss (Income) $ 2,645,361 $ 61,066 $ 465,376 $ 0
Components of Estimated Net Periodic Pension/Benefit Cost, January 1, 2021 to December 31, 2021
Employer Current Service Cost $ 277,673 $ 6,693 $ 54,112 $ 8,118 Interest Cost 689,795 11,854 143,716 7,348 Expected Return on Plan Assets (880,396) 0 0 0 Amortization of Past Service Cost 0 0 539 0 Amortization of Net (Gain) Loss 74,407 2,486 8,793 0 Total Cost $ 161,479 $ 21,033 $ 207,160 $ 15,466
2021 Estimated Employer Pension Contributions / Benefit Payments $ 199,146 $ 19,991 $ 103,326 $ 21,400
Filed: 2016-05-27
EB-2016-0152
Exhibit F4-3-2
Attachment 1
Page 14 of 15
Aon Hewitt
Report on the Estimated Accounting Cost for Post Employment Benefit Plans for Fiscal Years 2016 to 2021 15
About Aon Hewitt Aon Hewitt is the global leader in human capital consulting and outsourcing solutions. The company partners with organizations to solve their most complex benefits, talent and related financial challenges, and improve business performance. Aon Hewitt designs, implements, communicates and administers a wide range of human capital, retirement, investment management, health care, compensation and talent management strategies. With more than 30,000 professionals in 90 countries, Aon Hewitt makes the world a better place to work for clients and their employees.
For more information on Aon Hewitt, please visit aonhewitt.com.
About Aon Aon plc (NYSE:AON) is the leading global provider of risk management, insurance and reinsurance brokerage, and human resources solutions and outsourcing services. Through its more than 66,000 colleagues worldwide, Aon unites to empower results for clients in over 120 countries via innovative and effective risk and people solutions and through industry-leading global resources and technical expertise. Aon has been named repeatedly as the world’s best broker, best insurance intermediary, best reinsurance intermediary, best captives manager, and best employee benefits consulting firm by multiple industry sources. Visit aon.com for more information on Aon and aon.com/manchesterunited to learn about Aon’s global partnership with Manchester United.
© 2016 Aon Hewitt Inc. All Rights Reserved.
Filed: 2016-05-27
EB-2016-0152
Exhibit F4-3-2
Attachment 1
Page 15 of 15

Aon Hewitt
Risk. Reinsurance. Human Resources.
Report on the Accounting Cost for Post Employment Benefit Plans For Fiscal Years 2014 and 2015 Ontario Power Generation Inc. January 1, 2014 to December 31, 2015
Filed: 2016-05-27
EB-2016-0152
Exhibit F4-3-2
Attachment 2
Page 1 of 10
Davellal
Rectangle

Aon Hewitt
Report on the Accounting Cost for Post Employment Benefit Plans for Fiscal Years 2014 and 2015 2
Table of Contents Introduction 3 Actuarial Report 5 Schedule 1―Summary of 2014 US GAAP Results 8 Schedule 2―Summary of 2015 US GAAP Results 9
Filed: 2016-05-27
EB-2016-0152
Exhibit F4-3-2
Attachment 2
Page 2 of 10

Aon Hewitt
Report on the Accounting Cost for Post Employment Benefit Plans for Fiscal Years 2014 and 2015 3
Introduction This report summarizes the accounting costs for fiscal years 2014 and 2015 for the post employment benefit plans sponsored by Ontario Power Generation Inc. (“OPG”). In addition, Aon Hewitt prepared this report to provide an independent actuary’s confirmation of information for the post employment benefit plans sponsored by OPG in relation to the December 31, 2015 balances in OPG’s Pension & OPEB Cash Versus Accrual Differential Deferral Account and the Pension & OPEB Cash Payment Variance Account established by the Ontario Energy Board (“OEB”). We understand that this report is expected to be filed with the OEB.
This report covers the following plans sponsored by OPG:
Ontario Power Generation Inc. Pension Plan (“RPP”);
Ontario Power Generation Inc. Supplementary Pension Plan (“SPP”);
Non-pension Post Retirement Plan which provides other post retirement benefits (“OPRB”) including retiree medical, dental, life insurance, and retirement bonus benefits, and
Post Employment Plan which provides long-term disability benefits (“LTD”) including sick leave benefits before LTD begins and the continuation of medical, dental and life insurance while on LTD.
Collectively SPP, OPRB and LTD are known as Other Post Employment Benefits (“OPEB”).
The results cover the fiscal years from January 1, 2014 to December 31, 2014 and from January 1, 2015 to December 31, 2015. The results have been developed in accordance with US generally accepted accounting principles (“US GAAP”) under ASC 715, 712 and 710.
The results in this report do not include amounts related to the benefit plans of the Nuclear Waste Management Organization, which are included in OPG’s consolidated financial statements.
Unless otherwise stated, all assumptions, data elements, methodologies, plan provisions, and information about assets reflected in this report are the same as those underlying and/or contained in the December 31, 2014 or the December 31, 2015 disclosure reports (“the Reports”) prepared by Aon Hewitt in accordance with US GAAP for the post employment benefit plans sponsored by OPG. These disclosure reports were dated February 2015 and March 2016, respectively, and are titled as follows:
US GAAP Accounting Information Non-pension Post-retirement and Post-employment Benefits Plans; and
US GAAP Accounting Information – Pension Plans.
Filed: 2016-05-27
EB-2016-0152
Exhibit F4-3-2
Attachment 2
Page 3 of 10

Aon Hewitt
Report on the Accounting Cost for Post Employment Benefit Plans for Fiscal Years 2014 and 2015 4
Sincerely,
Aon Hewitt Inc. Aon Hewitt Inc. [Original signed by]
[Original signed by]
Linda M. Byron Fellow of the Society of Actuaries Fellow of the Canadian Institute of Actuaries
May 2016
Gregory W. Durant Fellow of the Society of Actuaries Fellow of the Canadian Institute of Actuaries
Filed: 2016-05-27
EB-2016-0152
Exhibit F4-3-2
Attachment 2
Page 4 of 10

Aon Hewitt
Report on the Accounting Cost for Post Employment Benefit Plans for Fiscal Years 2014 and 2015 5
Actuarial Report
Results for 2014 and 2015 This report confirms OPG’s total actual pension and OPEB costs for the period from January 1, 2014 to December 31, 2015, as determined in accordance with US GAAP, are as follows:
(in Canadian $ 000’s) January 1 to
October 31, 2014 November 1 to
December 31, 2014 Total for January 1 to
December 31, 2014 January 1 to
December 31, 2015 RPP $ 439,303 $ 87,861 $ 527,164 $ 523,447SPP 21,532 4,306 25,838 25,332OPRB 150,546 30,109 180,655 206,799LTD 18,670 444 19,114 24,096Total $ 630,051 $ 122,720 $ 752,771 $ 779,674
Further details of the OPG-wide costs provided above, by plan, as well as OPG’s actual contributions to the RPP fund and benefit payments for OPEB for the periods from January 1, 2014 to December 31, 2015 are provided in Schedules 1 and 2 to this report.
The above pension and OPRB costs for the period January 1 to October 31, 2014 are the same as those previously reported by us in the following report in support of the balance in OPG’s Pension and OPEB Cost Variance Account established by the OEB, which was filed by OPG with the OEB under case number EB-2014-0370:
“Report on the Accounting Cost for Post Employment Benefit Plans in Support of Pension and OPEB Cost Variance Account Calculations – Fiscal Year 2013 and the Period from January 1 to October 31, 2014” dated February 2015.
Up to October 31, 2014, the Pension and OPEB Cost Variance Account recorded the difference between actual pension and OPEB costs under Canadian GAAP for OPG’s regulated operations and related tax impacts, and those reflected in the regulated prices established by the OEB under case number EB-2010-0008.
In its November 2014 decision under case number EB-2013-0321, the OEB established the Pension & OPEB Cash Versus Accrual Differential Deferral Account and the Pension & OPEB Cash Payment Variance Account for OPG’s nuclear and regulated hydroelectric businesses, effective November 1, 2014. Additions to the Pension & OPEB Cash Versus Accrual Differential Deferral Account for the period from November 1, 2014 to December 31, 2015 were calculated by OPG by comparing the portion of the above November 1, 2014 to December 31, 2015 OPG-wide US GAAP costs attributed to OPG’s nuclear and regulated hydroelectric businesses to the regulated businesses’ portion of OPG’s total actual contribution to the RPP fund and actual benefit payments under OPEB plans for the corresponding periods, (which are found in Schedules 1 and 2
Filed: 2016-05-27
EB-2016-0152
Exhibit F4-3-2
Attachment 2
Page 5 of 10
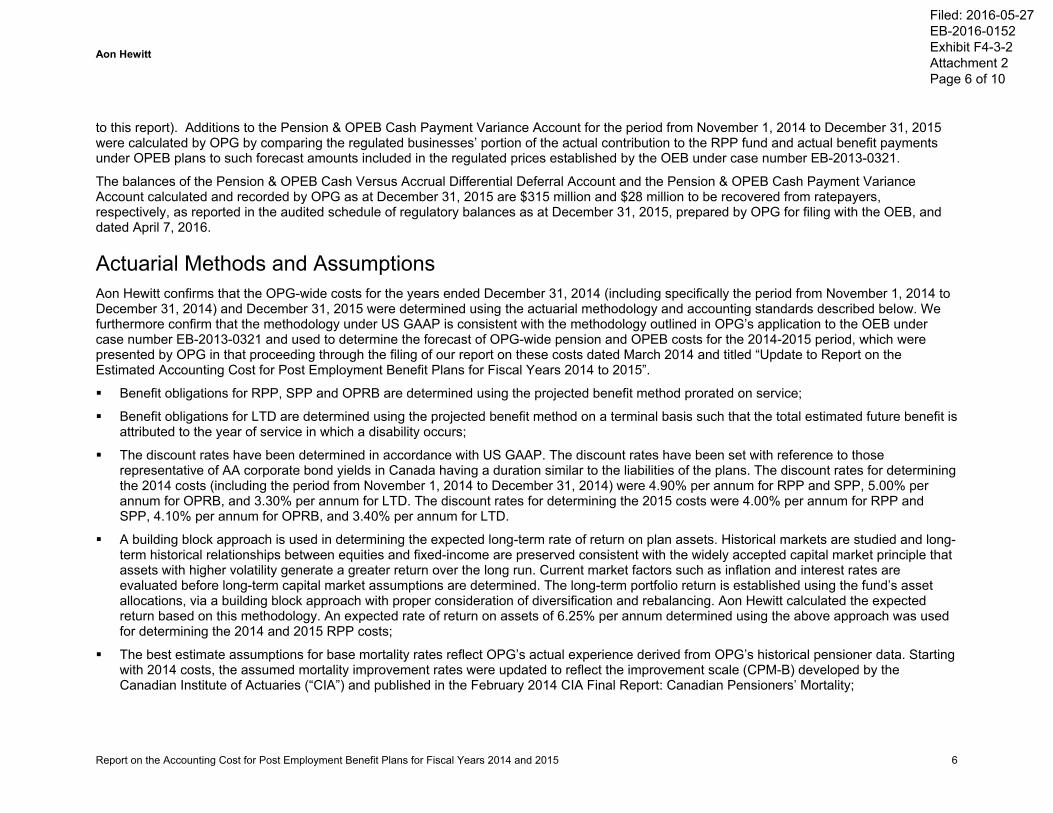
Aon Hewitt
Report on the Accounting Cost for Post Employment Benefit Plans for Fiscal Years 2014 and 2015 6
to this report). Additions to the Pension & OPEB Cash Payment Variance Account for the period from November 1, 2014 to December 31, 2015 were calculated by OPG by comparing the regulated businesses’ portion of the actual contribution to the RPP fund and actual benefit payments under OPEB plans to such forecast amounts included in the regulated prices established by the OEB under case number EB-2013-0321.
The balances of the Pension & OPEB Cash Versus Accrual Differential Deferral Account and the Pension & OPEB Cash Payment Variance Account calculated and recorded by OPG as at December 31, 2015 are $315 million and $28 million to be recovered from ratepayers, respectively, as reported in the audited schedule of regulatory balances as at December 31, 2015, prepared by OPG for filing with the OEB, and dated April 7, 2016.
Actuarial Methods and Assumptions Aon Hewitt confirms that the OPG-wide costs for the years ended December 31, 2014 (including specifically the period from November 1, 2014 to December 31, 2014) and December 31, 2015 were determined using the actuarial methodology and accounting standards described below. We furthermore confirm that the methodology under US GAAP is consistent with the methodology outlined in OPG’s application to the OEB under case number EB-2013-0321 and used to determine the forecast of OPG-wide pension and OPEB costs for the 2014-2015 period, which were presented by OPG in that proceeding through the filing of our report on these costs dated March 2014 and titled “Update to Report on the Estimated Accounting Cost for Post Employment Benefit Plans for Fiscal Years 2014 to 2015”.
Benefit obligations for RPP, SPP and OPRB are determined using the projected benefit method prorated on service;
Benefit obligations for LTD are determined using the projected benefit method on a terminal basis such that the total estimated future benefit is attributed to the year of service in which a disability occurs;
The discount rates have been determined in accordance with US GAAP. The discount rates have been set with reference to those representative of AA corporate bond yields in Canada having a duration similar to the liabilities of the plans. The discount rates for determining the 2014 costs (including the period from November 1, 2014 to December 31, 2014) were 4.90% per annum for RPP and SPP, 5.00% per annum for OPRB, and 3.30% per annum for LTD. The discount rates for determining the 2015 costs were 4.00% per annum for RPP and SPP, 4.10% per annum for OPRB, and 3.40% per annum for LTD.
A building block approach is used in determining the expected long-term rate of return on plan assets. Historical markets are studied and long-term historical relationships between equities and fixed-income are preserved consistent with the widely accepted capital market principle that assets with higher volatility generate a greater return over the long run. Current market factors such as inflation and interest rates are evaluated before long-term capital market assumptions are determined. The long-term portfolio return is established using the fund’s asset allocations, via a building block approach with proper consideration of diversification and rebalancing. Aon Hewitt calculated the expected return based on this methodology. An expected rate of return on assets of 6.25% per annum determined using the above approach was used for determining the 2014 and 2015 RPP costs;
The best estimate assumptions for base mortality rates reflect OPG’s actual experience derived from OPG’s historical pensioner data. Starting with 2014 costs, the assumed mortality improvement rates were updated to reflect the improvement scale (CPM-B) developed by the Canadian Institute of Actuaries (“CIA”) and published in the February 2014 CIA Final Report: Canadian Pensioners’ Mortality;
Filed: 2016-05-27
EB-2016-0152
Exhibit F4-3-2
Attachment 2
Page 6 of 10
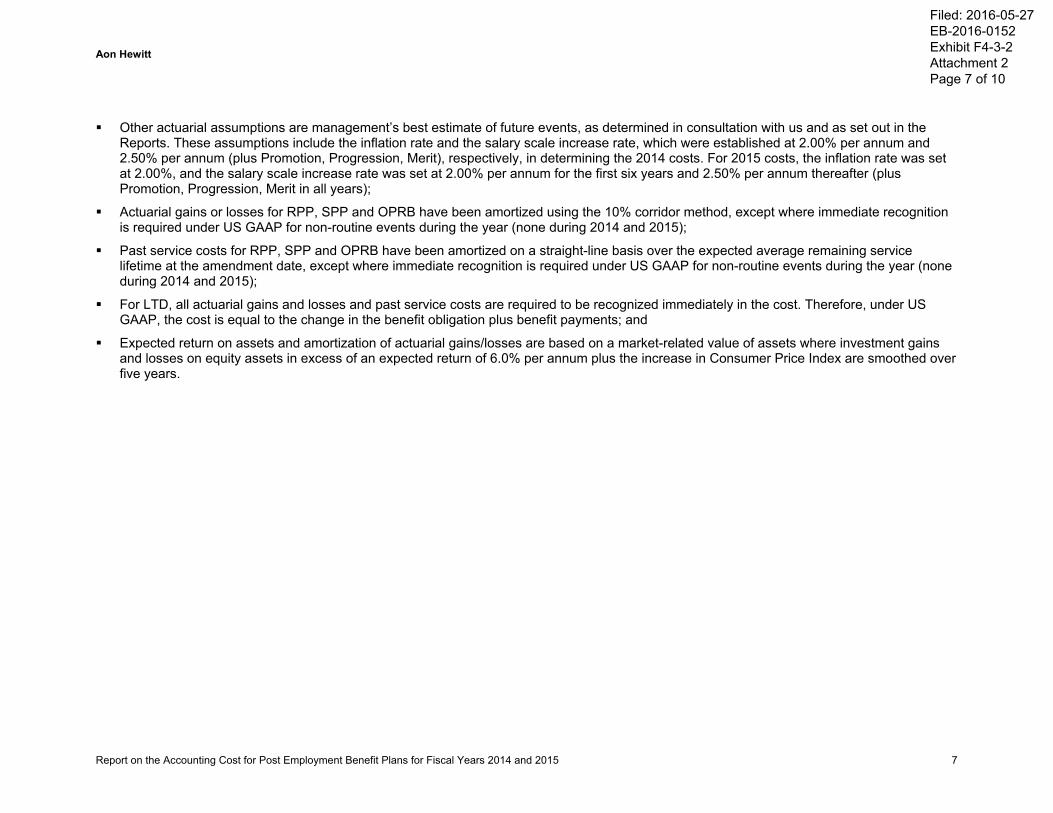
Aon Hewitt
Report on the Accounting Cost for Post Employment Benefit Plans for Fiscal Years 2014 and 2015 7
Other actuarial assumptions are management’s best estimate of future events, as determined in consultation with us and as set out in the Reports. These assumptions include the inflation rate and the salary scale increase rate, which were established at 2.00% per annum and 2.50% per annum (plus Promotion, Progression, Merit), respectively, in determining the 2014 costs. For 2015 costs, the inflation rate was set at 2.00%, and the salary scale increase rate was set at 2.00% per annum for the first six years and 2.50% per annum thereafter (plus Promotion, Progression, Merit in all years);
Actuarial gains or losses for RPP, SPP and OPRB have been amortized using the 10% corridor method, except where immediate recognition is required under US GAAP for non-routine events during the year (none during 2014 and 2015);
Past service costs for RPP, SPP and OPRB have been amortized on a straight-line basis over the expected average remaining service lifetime at the amendment date, except where immediate recognition is required under US GAAP for non-routine events during the year (none during 2014 and 2015);
For LTD, all actuarial gains and losses and past service costs are required to be recognized immediately in the cost. Therefore, under US GAAP, the cost is equal to the change in the benefit obligation plus benefit payments; and
Expected return on assets and amortization of actuarial gains/losses are based on a market-related value of assets where investment gains and losses on equity assets in excess of an expected return of 6.0% per annum plus the increase in Consumer Price Index are smoothed over five years.
Filed: 2016-05-27
EB-2016-0152
Exhibit F4-3-2
Attachment 2
Page 7 of 10

Aon Hewitt
Report on the Accounting Cost for Post Employment Benefit Plans for Fiscal Years 2014 and 2015 8
Schedule 1―Summary of 2014 US GAAP Results The following table provides a summary of US GAAP results for 2014 for the post employment benefit plans sponsored by OPG. The net periodic pension/benefit cost for this period was determined based on the balance sheet items at January 1, 2014.
(in Canadian $ 000s) RPP SPP OPRB LTD
Net Asset (Liability) Recognized as at January 1, 2014 Projected Benefit Obligation $ (13,368,826) $ (285,169) $ (2,439,305) $ (267,830)Fair Value of Plan Assets 10,893,428 0 0 0 Net Asset (Liability) Recognized $ (2,475,398) $ (285,169) $ (2,439,305) $ (267,830)
Amounts Recognized in Accumulated Other Comprehensive Income as at January 1, 2014
Unrecognized Past Service Costs (Credits) 0 0 950 0 Unrecognized Net Actuarial Loss (Gain) 3,492,617 78,721 319,518 0 Total Accumulated Other Comprehensive Loss (Income) $ 3,492,617 $ 78,721 $ 320,468 $ 0
Components of Net Periodic Pension/Benefit Cost, January 1, 2014 to December 31, 2014
Employer Current Service Cost $ 235,496 $ 7,437 $ 51,620 $ 11.517 Interest Cost 655,696 14,110 122,963 10,887 Expected Return on Plan Assets (624,026) 0 0 0 Recognition of LTD Actuarial (Gain) Loss 0 0 0 (3,290) Amortization of Past Service Cost (Credit) 0 0 120 0 Amortization of Net (Gain) Loss 259,998 4,291 5,952 0 Total Cost (Annual) $ 527,164 $ 25,838 $ 180,655 $ 19,114 Total Cost (January to October) $ 439,303 $ 21,532 $ 150,546 $ 18,670 Total Cost (November to December) $ 87,861 $ 4,306 $ 30,109 $ 444
2014 Estimated Employer Pension Contributions / Benefit Payments Annual amounts used for developing net periodic pension/benefit costs $ 400,000 $ 9,278 $ 63,336 $ 27,644
2014 Actual Employer Pension Contributions / Benefit Payments Annual $ 360,000 $ 15,690 $ 66,456 $ 26,317 January to October 300,000 12,804 53,788 18,355 November to December 60,000 2,886 12,668 7,962
Filed: 2016-05-27
EB-2016-0152
Exhibit F4-3-2
Attachment 2
Page 8 of 10

Aon Hewitt
Report on the Accounting Cost for Post Employment Benefit Plans for Fiscal Years 2014 and 2015 9
Schedule 2―Summary of 2015 US GAAP Results The following table provides a summary of US GAAP results for 2015 for the post employment benefit plans sponsored by OPG. The net periodic pension/benefit cost for this period was determined based on the balance sheet items at January 1, 2015.
(in Canadian $ 000s) RPP SPP OPRB LTD
Net Asset (Liability) Recognized as at January 1, 2015
Projected Benefit Obligation $ (15,601,615) $ (313,377) $ (2,866,895) $ (260,627)Fair Value of Plan Assets 12,328,171 0 0 0 Net Asset (Liability) Recognized $ (3,273,444) $ (313,377) $ (2,866,895) $ (260,627)
Amounts Recognized in Accumulated Other Comprehensive Income as at January 1, 2015
Unrecognized Past Service Costs (Credits) 0 0 830 0 Unrecognized Net Actuarial Loss (Gain) 4,123,499 96,781 633,029 0 Total Accumulated Other Comprehensive Loss (Income) $ 4,123,499 $ 96,781 $ 633,859 $ 0
Components of Net Periodic Pension/Benefit Cost, January 1, 2015 to December 31, 2015
Employer Current Service Cost $ 316,533 $ 7,158 $ 60,943 $ 8,601 Interest Cost 626,909 12,628 118,678 8,450 Expected Return on Plan Assets (711,656) 0 0 0 Recognition of LTD Actuarial (Gain) Loss 0 0 0 7,045 Amortization of Past Service Cost (Credit) 0 0 120 0 Amortization of Net (Gain) Loss 291,661 5,546 27,058 0 Total Cost $ 523,447 $ 25,332 $ 206,799 $ 24,096
2015 Estimated Employer Pension Contributions / Benefit Payments $ 364,000 $ 9,678 $ 66,521 $ 26,334
Amounts used for developing net periodic pension/benefit cost 2015 Actual Employer Pension Contributions / Benefit Payments $ 359,292 $ 24,165 $ 68,561 $ 24,823
Filed: 2016-05-27
EB-2016-0152
Exhibit F4-3-2
Attachment 2
Page 9 of 10

Aon Hewitt
Report on the Accounting Cost for Post Employment Benefit Plans for Fiscal Years 2014 and 2015 10
About Aon Hewitt Aon Hewitt is the global leader in human capital consulting and outsourcing solutions. The company partners with organizations to solve their most complex benefits, talent and related financial challenges, and improve business performance. Aon Hewitt designs, implements, communicates and administers a wide range of human capital, retirement, investment management, health care, compensation and talent management strategies. With more than 30,000 professionals in 90 countries, Aon Hewitt makes the world a better place to work for clients and their employees.
For more information on Aon Hewitt, please visit aonhewitt.com/canada.
About Aon Aon plc (NYSE:AON) is the leading global provider of risk management, insurance and reinsurance brokerage, and human resources solutions and outsourcing services. Through its more than 66,000 colleagues worldwide, Aon unites to empower results for clients in over 120 countries via innovative and effective risk and people solutions and through industry-leading global resources and technical expertise. Aon has been named repeatedly as the world’s best broker, best insurance intermediary, best reinsurance intermediary, best captives manager, and best employee benefits consulting firm by multiple industry sources. Visit aon.com for more information on Aon and aon.com/manchesterunited to learn about Aon’s global partnership with Manchester United.
© 2016 Aon Hewitt Inc. All Rights Reserved.
Filed: 2016-05-27
EB-2016-0152
Exhibit F4-3-2
Attachment 2
Page 10 of 10