Penn State’splantscience.psu.edu/research/centers/ssrc/documents/heat-progress... · Synthetic...
15
Synthetic Turf Heat Evaluation – Progress Report January 2012 Penn State’s Center for Sports Surface Research
Transcript of Penn State’splantscience.psu.edu/research/centers/ssrc/documents/heat-progress... · Synthetic...
Synthetic Turf Heat Evaluation – Progress Report
January 2012
Penn State’s
Center for
Sports Surface Research
1
Executive Summary
Laboratory and outdoor tests were conducted to compare surface temperatures of infilled
synthetic turfs composed of various fiber and infill colors/materials. In the laboratory study, the
following surface temperature tests were performed: 1) synthetic turf system (infill installed into
fibers), 2) fiber, and 3) infill. Surface temperature was evaluated by placing each sample under a
250 W infrared heat lamp. A total of 11 fiber/infill combinations were tested in the synthetic turf
system trial. While temperature differences of up to 20 degrees were found among synthetic turf
components (fibers and infills) when tested independently, when combined into synthetic turf
systems, differences were 12 degrees or less. With temperatures of all tested treatments
exceeding 150° F when evaluated as synthetic turf systems, no product in this study produced a
substantial reduction in surface temperature compared to a standard green fiber/black rubber
system. Outdoor testing was also conducted in the summer of 2011. The surface temperatures of
many of the same treatments included in the laboratory test were also evaluated outdoors during
warm, clear conditions. Outdoor testing only included synthetic turf systems and did not include
individual component tests. Results from the outdoor testing were similar to the laboratory tests.
Introduction
The issue of high surface temperature on infilled synthetic turf continues to be a significant
concern. Because surface temperatures can reach up to 200° F (Williams and Pulley, 2002),
usage of synthetic turf fields may be limited during the peak heating hours of the day in the
interest of athlete safety. Numerous methods have been attempted to mitigate high surface
temperature (Serensits, et al., 2011). For example, the use of irrigation water has been shown to
rapidly drop surface temperatures immediately after watering; however, temperatures quickly
rebound to near pre-irrigation levels (McNitt et al., 2008). Other research has examined the
effect of painting black crumb rubber infill white in an attempt to lower surface temperature
(Devitt et al., 2007). Once installed in the carpet fibers, the white infill reduced surface
temperature by only a few degrees.
Because some have questioned the safety of crumb rubber infill, alternatives to standard infill
have become increasingly available to consumers. Many of these products claim advantages
over traditional crumb rubber infill including reduced surface temperature. While marketing
materials may claim lower surface temperatures, no scientific reports exist that substantiate such
claims. The influence of fibers on surface temperature has also been recognized. One
manufacturer claims to produce a fiber that significantly reduces surface temperature; however,
again, there is no publicly available scientific evidence to support the claim.

2
The goal of this study was to evaluate the effects of fibers (color and type) and infills (color and
type) on surface temperature.
Testing Procedure
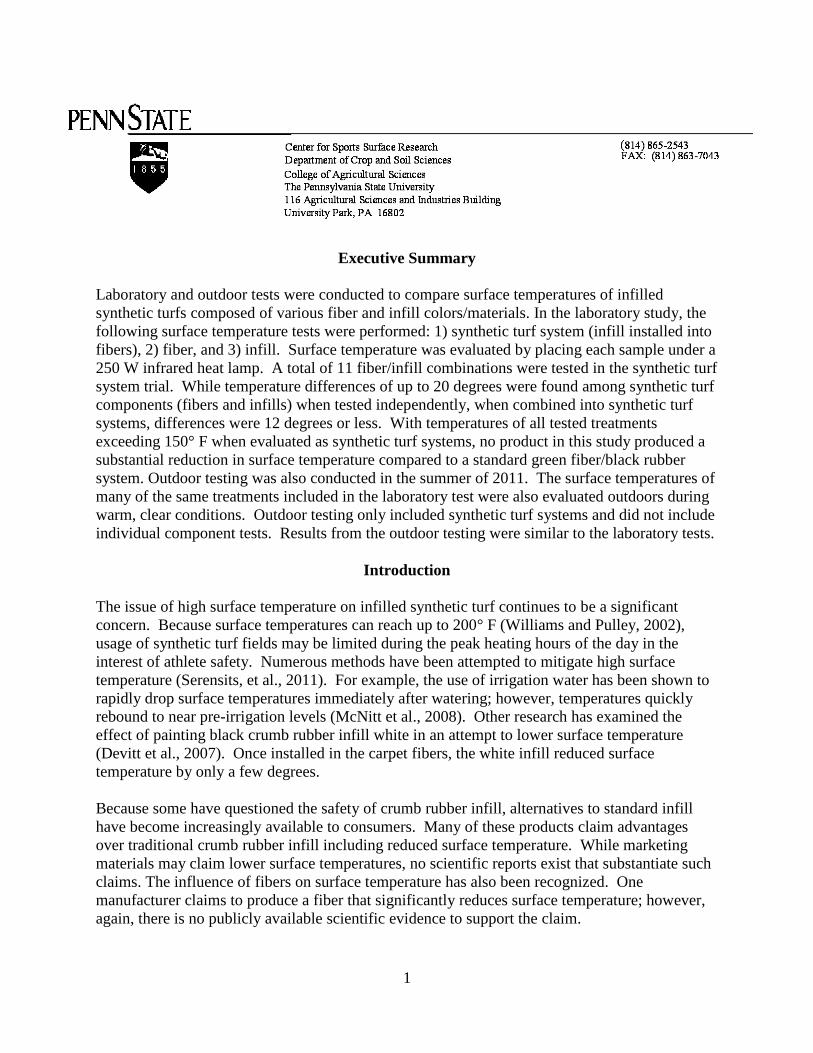
Laboratory Setup
All samples were placed under a 250-watt infrared heat lamp suspended 17 inches above the
sample surface (Figure 1). This testing setup has been correlated to outdoor sunny conditions.
In the synthetic turf system study, samples were placed under the heat lamp for 3 hours. A
temperature sensor was placed on the surface of each sample at the same location under the heat
lamp. The temperature sensor was connected to a Watchdog data logger (Spectrum
Technologies, Plainfield, IL.). Temperature data was collected every 1 minute. An infrared
thermometer (Kintrex IRT0421) was used on a routine basis throughout the testing period to
ensure the accuracy of the temperature sensor. Typically, temperatures were within 1 to 2
degrees when comparing temperature measuring methods. In the fiber and infill tests, each
sample was placed under the heat lamp for 1 hour. Temperature measurements were made using
an infrared thermometer (Kintrex IRT0421) after 15, 30, and 60 minutes under the lamp.
Synthetic Turf System Test
The following 11 synthetic turf systems were evaluated (all infills were installed into FieldTurf
Duraspine Pro fibers unless otherwise noted; all infill was black cryogenic rubber unless
otherwise noted):
1. White fibers with black rubber 7. Green fibers-AstroFlect (with ambient SBR)
2. Gold fibers with black rubber 8. Green fibers with green rubber
3. Silver fibers with black rubber 9. Green fibers with tan rubber
4. Black fibers with black rubber 10. Green fibers with EcoFill (green)
5. Green fibers (Duraspine) with black rubber 11. Green fibers with TPE (green)
6. Green fibers (Revolution) with black rubber
Fiber Test
The following 7 fiber colors/types were evaluated (all fibers were FieldTurf Duraspine Pro
unless otherwise noted, Figure 2):
1. White 5. Green
2. Gold 6. Green ( FieldTurf Revolution)
3. Silver 7. Green (AstroTurf AstroFlect)
4. Black

3
Infill Test
The following 5 infill colors/types were evaluated (all rubber was cryogenic, Figure 3):
1. Black rubber 4. EcoFill (green)
2. Green rubber 5. TPE (green)
3. Tan rubber
Statistical Analysis
In all tests, each treatment was replicated three times. ANOVA testing was performed for each
trial. Tukey’s Honestly Significantly Different (HSD) test was used to separate treatment means
when the F ratio was significant at the 0.05 level.
Outdoor Testing Setup
Test specimens were installed onto a crushed stone base at the Joseph Valentine Turfgrass
Research Center, located in University Park, PA. Surface temperatures were recorded using an
infrared thermometer (Kintrex IRT0421). All fibers tested were FieldTurf Duraspine Pro with
the exception of AstroTurf Astroflect fibers. The following surfaces were evaluated:
Fiber Infill
White Black
Green Ecofill
Green TPE (green)
Gold Black
Black Black
Silver Black
Green Green
Green Tan
Astroflect Black
Green Black
Green Gray*
*July 21 test only
The outdoor test was not replicated in space, but independent data was collected on three days
during the summer of 2011. As a result, no statistical testing was performed on the outdoor data.
1
Figure 1. Laboratory testing setup
Figure 2. Various colors and types of fibers were tested
Figure 3. Various infills were tested including colored crumb rubber (left), EcoFill (bottom
right), and TPE (middle right)

Results – Synthetic Turf System Test
Table 1. Surface temperatures of various fiber-infill combinations after 3 hours under heat lamp.
Fiber Color Infill Surface Temperature (F)
Gold Black Rubber 171.1 a†
White Black Rubber 170.4 ab
Silver Black Rubber 169.2 ab
Black Black Rubber 169.2 ab
Green Ecofill 167.3 abc
Green (FieldTurf Revolution) Black Rubber 165.6 abcd
Green Black Rubber 165.5 abcd
Green Green Rubber 163.8 bcde
Green Tan Rubber 161.1 cde
Green TPE 160.5 de
Green (AstroTurf AstroFlect) Black Rubber 158.9 e
All fibers were FieldTurf Duraspine Pro unless otherwise noted †Temperatures that do not share the same letter are significantly (statistically) different
Figure 4. Surface temperature of various fiber-infill combinations after 3 hours under heat lamp
140
150
160
170
180
Gold Fibers White Fibers Silver Fibers Black Fibers EcoFill Green Fibers (Revolution)
Green Fibers (Duraspine)
Green Rubber
Tan Rubber TPE AstroFlect
Surf
ace
Te
mp
era
ture
(F)
Treatment*same data as in table above

3
Figure 5. Temperature data collected every one minute by temperature probe placed on turf's surface
60
80
100
120
140
160
180
0 hr 1 hr 2 hr 3 hr
Surf
ace
Te
mp
era
ture
(F)
Time under heat lamp
Synthetic Turf Systems Test
AstroFlect Green fibers - Duraspine Pro Green rubberTan rubber Silver fibers Black fibersGold fibers EcoFill White fibers black rubberTPE Green fibers - Revolution

4
Results - Fiber Test
Table 2. Surface temperatures of various fibers after 1 hour under
heat lamp
Fiber Color Surface Temperature (F)
Silver 149.4 a†
Black 144.3 b
Green 140.5 bc
Gold 139.8 bc
Green (FieldTurf Revolution) 138.6 c
Green (AstroTurf AstroFlect) 137.9 c
White 128.7 d
All fibers were FieldTurf Duraspine Pro unless otherwise noted †Temperatures that do not share the same letter are significantly
(statistically) different
Figure 6. Surface temperature of various fibers after 1 hour under heat lamp
115
125
135
145
155
Silver Black Green (Duraspine)
Gold Green (Revolution)
AstroFlect White
Surf
ace
Te
mp
era
ture
(F)
Fiber*same data as in table above
5
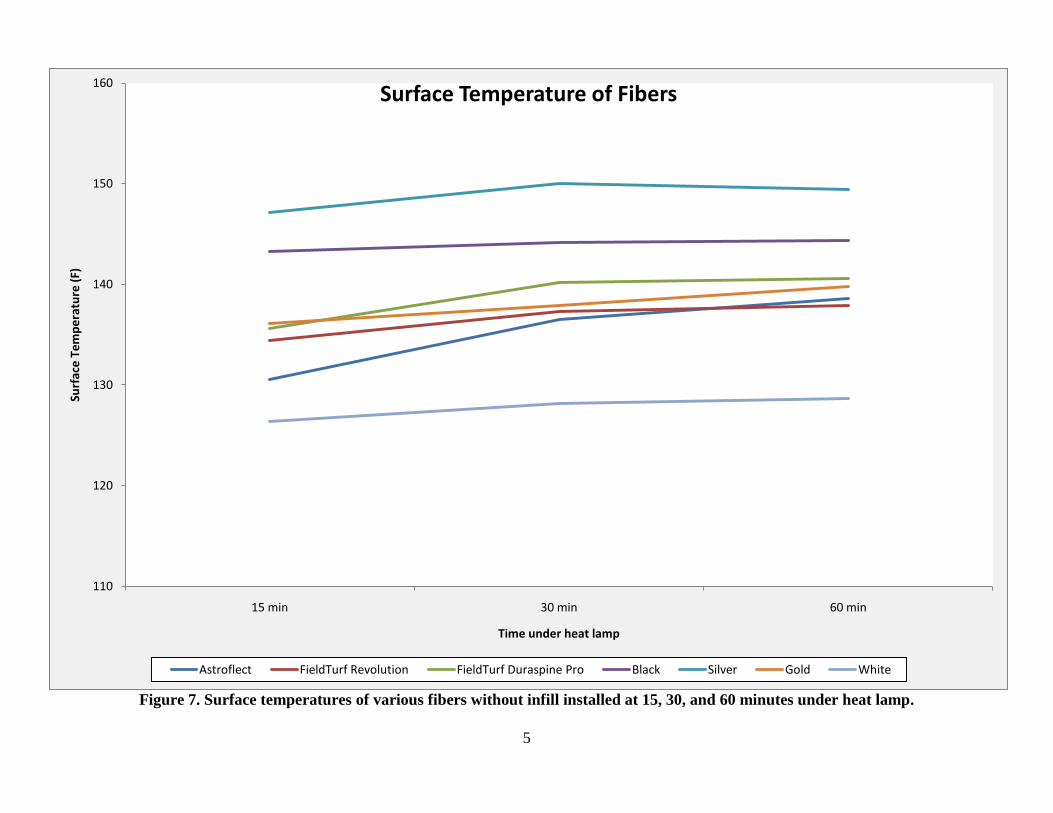
Figure 7. Surface temperatures of various fibers without infill installed at 15, 30, and 60 minutes under heat lamp.
110
120
130
140
150
160
15 min 30 min 60 min
Surf
ace
Te
mp
era
ture
(F)
Time under heat lamp
Surface Temperature of Fibers
Astroflect FieldTurf Revolution FieldTurf Duraspine Pro Black Silver Gold White

6
Results - Infill Only Test
Table 3. Surface temperatures of various infills after 1
hour under heat lamp
Infill Surface Temperature (F)
Black Rubber 156.0 a†
Tan Rubber 153.4 a
Green Rubber 147.9 b
Ecofill 141.6 c
TPE 136.4 d †Temperatures that do not share the same letter are
significantly (statistically) different
Figure 8. Surface temperature of various infills after 1 hour under heat lamp
100
110
120
130
140
150
160
170
Black Rubber Tan Rubber Green Rubber EcoFill TPE
Surf
ace
Te
mp
era
ture
(F)
Infill*same data as in table above
7
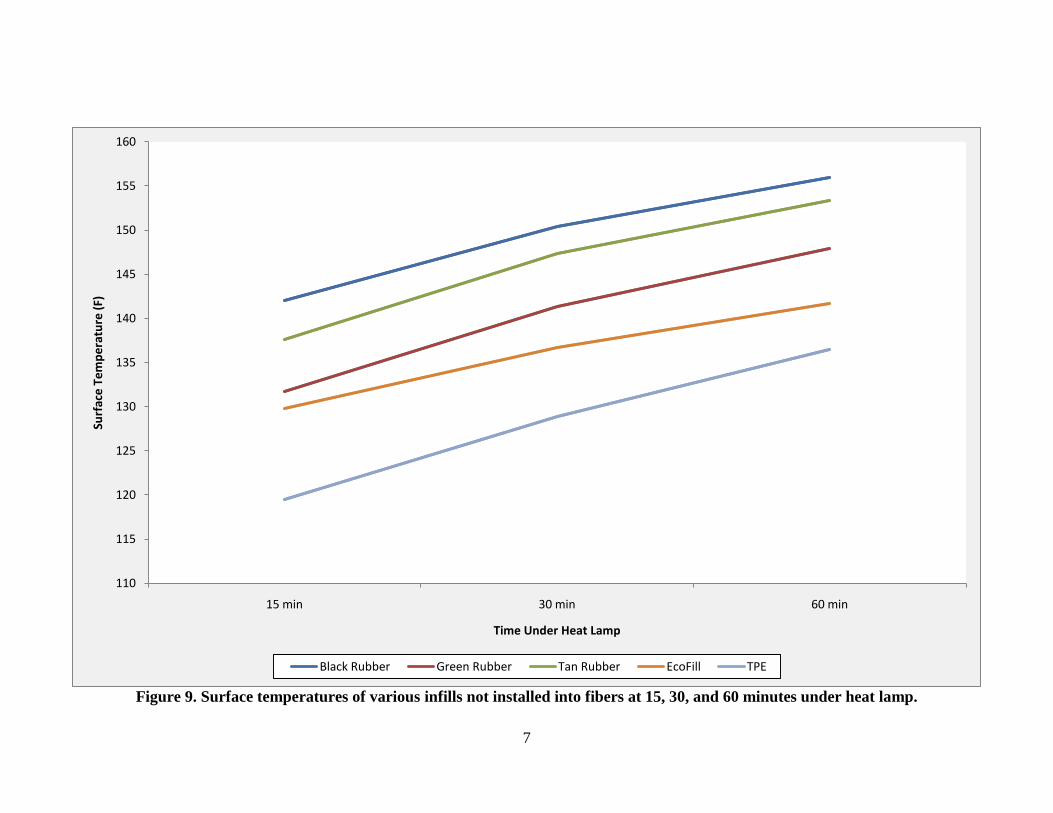
Figure 9. Surface temperatures of various infills not installed into fibers at 15, 30, and 60 minutes under heat lamp.
110
115
120
125
130
135
140
145
150
155
160
15 min 30 min 60 min
Surf
ace
Te
mp
era
ture
(F)
Time Under Heat Lamp
Black Rubber Green Rubber Tan Rubber EcoFill TPE
8
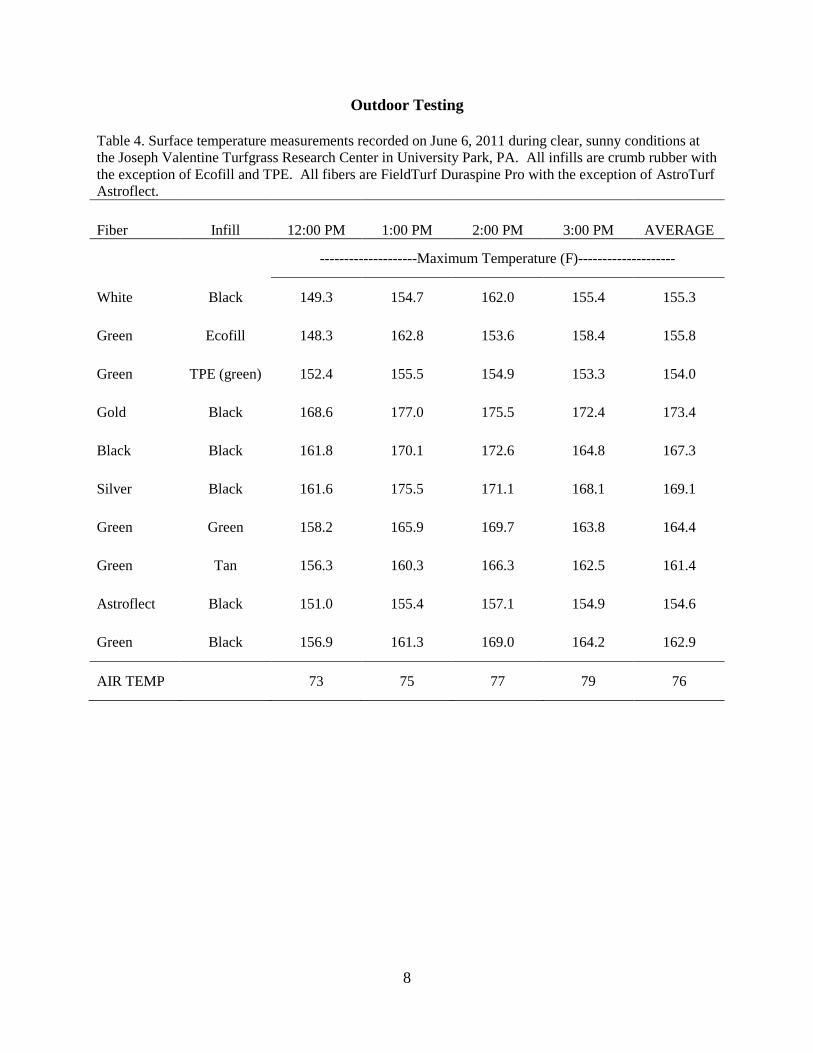
Outdoor Testing
Table 4. Surface temperature measurements recorded on June 6, 2011 during clear, sunny conditions at
the Joseph Valentine Turfgrass Research Center in University Park, PA. All infills are crumb rubber with
the exception of Ecofill and TPE. All fibers are FieldTurf Duraspine Pro with the exception of AstroTurf
Astroflect.
Fiber Infill 12:00 PM 1:00 PM 2:00 PM 3:00 PM AVERAGE
--------------------Maximum Temperature (F)--------------------
White Black 149.3 154.7 162.0 155.4 155.3
Green Ecofill 148.3 162.8 153.6 158.4 155.8
Green TPE (green) 152.4 155.5 154.9 153.3 154.0
Gold Black 168.6 177.0 175.5 172.4 173.4
Black Black 161.8 170.1 172.6 164.8 167.3
Silver Black 161.6 175.5 171.1 168.1 169.1
Green Green 158.2 165.9 169.7 163.8 164.4
Green Tan 156.3 160.3 166.3 162.5 161.4
Astroflect Black 151.0 155.4 157.1 154.9 154.6
Green Black 156.9 161.3 169.0 164.2 162.9
AIR TEMP 73 75 77 79 76
9
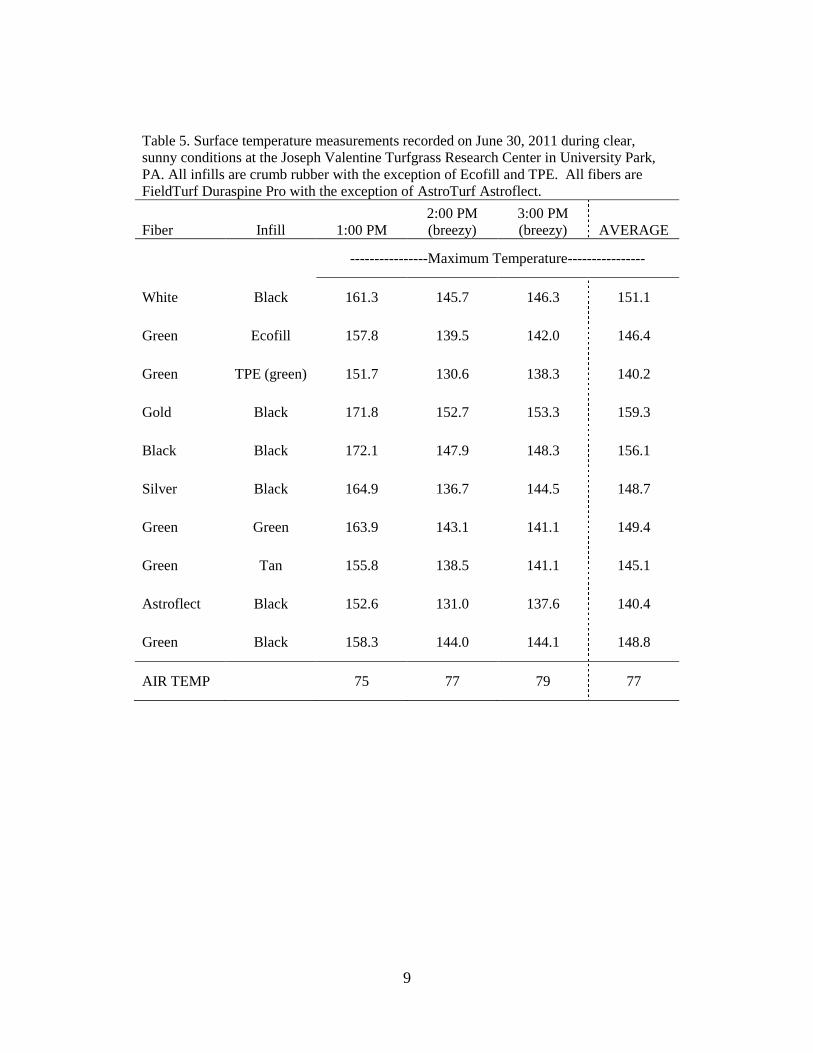
Table 5. Surface temperature measurements recorded on June 30, 2011 during clear,
sunny conditions at the Joseph Valentine Turfgrass Research Center in University Park,
PA. All infills are crumb rubber with the exception of Ecofill and TPE. All fibers are
FieldTurf Duraspine Pro with the exception of AstroTurf Astroflect.
Fiber Infill 1:00 PM 2:00 PM
(breezy) 3:00 PM
(breezy) AVERAGE
----------------Maximum Temperature----------------
White Black 161.3 145.7 146.3 151.1
Green Ecofill 157.8 139.5 142.0 146.4
Green TPE (green) 151.7 130.6 138.3 140.2
Gold Black 171.8 152.7 153.3 159.3
Black Black 172.1 147.9 148.3 156.1
Silver Black 164.9 136.7 144.5 148.7
Green Green 163.9 143.1 141.1 149.4
Green Tan 155.8 138.5 141.1 145.1
Astroflect Black 152.6 131.0 137.6 140.4
Green Black 158.3 144.0 144.1 148.8
AIR TEMP 75 77 79 77

10
Table 6. Surface temperature measurements recorded on July 21, 2011 during
hazy, breezy, hot conditions at the Joseph Valentine Turfgrass Research Center in
University Park, PA. All infills are crumb rubber with the exception of Ecofill and TPE.
All fibers are FieldTurf Duraspine Pro with the exception of AstroTurf Astroflect.
Fiber Infill 11:00 AM
1:00 PM
(breezy)
3:00 PM
(breezy) AVERAGE
----------------Maximum Temperature----------------
White Black 136.8 155.4 155.3 149.2
Green Ecofill 134.9 144.8 148.8 142.8
Green TPE
(green) 128.4 145.1 146.1 139.9
Gold Black 135.4 161.0 160.3 152.2
Black Black 137.2 155.9 155.5 149.5
Silver Black 134.4 147.8 150.1 144.1
Green Green 135.7 159.0 155.6 150.1
Green Tan 131.6 154.8 151.4 145.9
Astroflect Black 126.6 148.4 146.1 140.4
Green Black 129.6 150.8 144.3 141.6
Green Gray 130.5 147.9 149.8 142.7
AIR TEMP 88 92 99 93
Summary
No product in this test substantially reduced surface temperature compared to the traditional
system of green fibers filled with black rubber in both the indoor and outdoor test. Reductions of
five or even ten degrees offer little advantage when temperatures still exceed 150° F. Until
temperatures can be reduced by at least twenty or thirty degrees for an extended period of time,
surface temperature will remain a major issue on synthetic turf fields.
11
References
Devitt, D.A., M.H. Young, M. Baghzouz and B.M. Bird. 2007. Surface temperature, heat loading
and spectral reflectance of artificial turfgrass. J. of Turfgrass and Sports Surf. Sci. 83:68-
82.
McNitt, A.S., D.M. Petrunak and T.J. Serensits. 2008. Temperature amelioration of synthetic turf
surfaces through irrigation. Acta Hort. 783:573-582.
Serensits, T.J., A.S. McNitt, and D.M. Petrunak. 2011. Human health issues on synthetic turf in
the USA. Proceedings of the Institution of Mechanical Engineers, Part P, Journal of
Sports Engineering and Technology 225(3):139-146.
Williams, C.F. and G.E. Pulley. 2002. Synthetic surface heat studies. Available at
http://aces.nmsu.edu/programs/turf/documents/brigham-young-study.pdf (verified 9 Dec.
2011).