Pengantar Data Analysis - cdn-edunex.itb.ac.id
42
Pengantar Data Analysis Tim Penyusun Materi Pengenalan Komputasi Institut Teknologi Bandung © 2021
Transcript of Pengantar Data Analysis - cdn-edunex.itb.ac.id

Pengantar Data Analysis
Tim Penyusun Materi Pengenalan Komputasi
Institut Teknologi Bandung © 2021

Objektif
• Mahasiswa memahami latar belakang dan pentingnya data analisis
• Mahasiswa dapat membedakan terminologi Data, Informasi, Knowledge, Wisdom (DIKW)
• Mahasiswa mengerti lingkup dan workflow Data Analisis
30/09/2021 Pengenalan Komputasi 2

Motivasi
• Bigdata dan IoT
• Information Overload
• People are getting stupider?
30/09/2021 Pengenalan Komputasi 3

Big Data
• “if all the data used in the world today where written to CD ROMs and the CD ROMs piled up in a single stack, the stack will stretch all the way from the Earth to the Moon and a quarter of the way back again”
• Hilbert, M & Lopez, P. (2011), “The world’s technological capacity to store, communicate and compute information”, Science 332, 1 April 2011, 60-65
• “by 2020 the digital universe will reach 40 zettabytes (ZB), which is 40 trillion GB of data, or 5,200 GB of data for every person on Earth”
• IDC (2010), “IDC Digital Uiverse Study, sponsored by EMC”, May 2010
430/09/2021 Pengenalan Komputasi 4

Big Data, IoT
30/09/2021 Pengenalan Komputasi 5
24 PB/day
(2009)
2.5 PB of user data +
15 TB/day (2009)
6.5 PB of user data +
50 TB/day (2009)
1018 bytes/day
(2024, est.)
22 PB (2012,
the Large Hadron
Collider)
Web, Social Media & Network
Scientific Data,
Scientific Instruments
Mobile Devices, IoT, Sensor Technology & Networks

Information OverloadThe difficulty in understanding an issue and effectively making decisions when one has too much information about that issue
(Yang et al, 2003)
30/09/2021 Pengenalan Komputasi 6
Information overload occurs when the amount of input to a system exceeds its processing capacity. Decision makers have fairly limited cognitive processing capacity. Consequently, when information overload occurs, it is likely that a reduction in decision quality will occur. (Speier et al., 1999)

People are getting stupider?
30/09/2021 Pengenalan Komputasi 7
Adopted from: John Stasko http://www.cc.gatech.edu/~stasko/7450/Notes/overview.pdf

Data, Information, Knowledge, and Wisdom (1)by Gene Bellinger, Durval Castro, Anthony Mills
According to Russell Ackoff, a systems theorist and professor of organizational change, the content of the human mind can be classified into five categories:• Data: symbols• Information: data that are processed to
be useful; provides answers to "who", "what", "where", and "when" questions
• Knowledge: application of data and information; answers "how" questions
• Understanding: appreciation of "why“• Wisdom: evaluated understanding.
30/09/2021 Pengenalan Komputasi 8
Sumber: http://www.systems-thinking.org/dikw/dikw.htm

Data, Information, Knowledge, and Wisdom (2)by Gene Bellinger, Durval Castro, Anthony Mills
• Data represents a fact or statement of event without relation to other things.
• E.g.: It is raining.• Information embodies the understanding of a relationship of some sort,
possibly cause and effect.• E.g.: The temperature dropped 15 degrees and then it started raining.
• Knowledge represents a pattern that connects and generally provides a high level of predictability as to what is described or what will happen next.
• E.g.: If the humidity is very high and the temperature drops substantially the atmospheres is often unlikely to be able to hold the moisture so it rains.
• Wisdom embodies more of an understanding of fundamental principles embodied within the knowledge that are essentially the basis for the knowledge being what it is. Wisdom is essentially systemic.
• E.g.: It rains because it rains. And this encompasses an understanding of all the interactions that happen between raining, evaporation, air currents, temperature gradients, changes, and raining.
30/09/2021 Pengenalan Komputasi 9

More on DIKW (1)
• Data: notice that they are raw and insignificant.• Ages of employees: 25; 29; 45; 23; 60; 51; 35 …• Names of employees: Ben; Anna: Mark; Kathy; Rose; Jack; Jane …
• Information: now we arrange the data to make sense and create information.• Ages of Employees: Ben is 25 yrs old; Anna is 29 yrs old; Mark is 45 yrs old; Kathy is 35 yrs
old; Rose is 60 yrs old; while Jack is 51 yrs old…
• Knowledge: • so now we already have the knowledge of the ages of our employees, so now we can connect
that with our other knowledge, so we may have wisdom on this situation.
• Other knowledge: (for examples sake lets assume that we conducted a survey and found out that:)
• Young people have still a lot to learn, and are inexperienced, and are available for learning; and 35 yrs old is still young; And that older folks possess a lot of knowledge regarding work processes; and has a lot of experience; and that most of old folks today prefer to retire early; and say we would out that the usual retirement age is 60, yet some employees would retire early at the age of 55.
30/09/2021 Pengenalan Komputasi 10

More on DIKW (2)
• So now we create Wisdom:• Our employees Ben, Anna, and Kathy are still young and they are prospective
leaders of the firm.• They might want to earn a degree in a University and lets offer them promotion
to encourage them.• We know that Rose is retiring this year, so we might as well train someone to
replace her in her position. That might be either Ben, Anna or Kathy, or Mark since he has more experience and has more knowledge in our business processes already. And since Jack is 51 yrs old already, we might want to prepare for hist retirement. That will mean that we might loss one or two employees in at least 4 years now.
• Shall we hire more employees? (further knowledge acquired) yes we might need more employees since our business is growing and we need more manpower.
• Sumber: https://www.quora.com/Can-someone-give-a-simple-example-for-data-information-knowledge-and-wisdom
30/09/2021 Pengenalan Komputasi 11

30/09/2021 Pengenalan Komputasi 12
Sumber: https://www.researchgate.net/publication/221437134_Are_you_searching_for_ways_to_find_information/figures?lo=1

DIKW
30/09/2021 Pengenalan Komputasi 13

Data Analysis
• how to break down and structurecomplex problems and data sets to get right to the heart of the problems in their business. [1]
• a process of inspecting, cleansing, transforming, and modeling datawith the goal of discovering useful information, informing conclusions, and supporting decision-making [2]
30/09/2021 Pengenalan Komputasi 14
1. Michael Milton, Head First Data Analysis, O’Reilly 2009 2. https://en.wikipedia.org/wiki/Data_analysis

Klasifikasi Data Analytics
30/09/2021 Pengenalan Komputasi 15
Sumber:2017 Planning Guide for Data and Analytics

Descriptive Analytics
• Jenis paling sederhana dari Data Analytics• Analisis terhadap data history untuk mendapatkan profil umum dalam
bentuk summary dari data atau hubungan antar data untukmenjelaskan situasi yang telah terjadi.
• Contoh hasil analisis:• Banyaknya friend, mention, followers• Banyaknya page views• Perbandingan banyaknya mahasiswa antar prodi di ITB• Rata-rata nilai mahasiswa peserta KU1102• Hubungan antara banyaknya jam belajar dengan prestasi akademik• Ada kecenderungan bahwa orang beli roti tawar bersamaan dengan
butter/mentega• dll
30/09/2021 Pengenalan Komputasi 16

Predictive Analytics
• Analisis terhadap data history untuk mendapatkan hubungan dantrend yang ada (yang direpresentasikan dalam bentuk model prediksi) dalam rangka untuk memperkirakan apa yang akanterjadi di masa yang akan datang.
• Contoh:• Memperkirakan nilai saham atau mata uang tertentu berdasarkan data
nilai saham atau mata uang pada periode waktu sebelumnya• Memperkirakan apakah seseorang dengan karakteristik tertentu (usia,
penghasilan, jumlah tanggungan, frekwensi sakit berat) layak/tidakdiberikan kredit bank, berdasarkan data history pengambilan keputusanoleh ahli keuangan.
• dll
30/09/2021 Pengenalan Komputasi 17

Prescriptive Analytics
• Analisis terhadap data history untuk dapat menghasilkankesimpulan berupa rekomendasi bagaimana sesuatu harusdilakukan
• Contoh:• Menentukan rute terbaik dari satu tempat ke tempat lain, berdasarkan
data yang ada
• Analisis oleh travel agent terhadap berbagai faktor terkait travel (customer, tujuan, waktu, dll) untuk optimasi harga tiket
• Tidak dibahas detail di kuliah ini
30/09/2021 Pengenalan Komputasi 18

Tipe Data
• Categorical-Nominal • Nama negara, warna kulit, nama program studi, dll
• Categorical-Ordinal• Likert scale (“sangat setuju” s.d. “sangat tidak setuju”)• Indeks nilai A, B, C, D, E
• Categorical-Binary• Jenis kelamin, status mahasiswa (aktif, tidak aktif), dll
• Quantitative-Discrete• Banyaknya anak, banyaknya mahasiswa, banyaknya sks lulus
• Quantitative-Continues• Usia, berat badan, tinggi, suhu
30/09/2021 Pengenalan Komputasi 19

Representasi Data berdasar Strukturnya
• Structured Data• Data dalam bentuk table/relational
• Contoh: data dalam xls, data tersimpan dalam relational DBMS
• Semi-structured Data• Data yang tidak direpresentasikan dalam bentuk table, namun masih
memiliki struktur/pengorganisasian yang memudahkan proses/analisis
• Contoh: data dalam format xls, json, noSQL database
• Unstructured Data• Data yang tidak memiliki struktur yang memudahkan proses/analisis
• Contoh: data teks, data video, data foto
30/09/2021 Pengenalan Komputasi 20

Contoh-contoh kegiatan Data AnalysisDescriptive Analytics dan Exploratory DA• Retrieve Value (Selection)• Filter• Compute Derived Value• Find Extremum• Sort• Determine Range• Characterize Distribution• Find Anomalies• Correlation• Clustering
30/09/2021 Pengenalan Komputasi 21
https://en.wikipedia.org/wiki/Data_analysis

Data Analysis Workflow
30/09/2021 Pengenalan Komputasi 22
Sumber: https://ketakirk.wordpress.com/2016/04/03/an-end-to-end-data-analysis-workflow/

Data Store
• Adalah sebuah repository untuk secara persisten (bersifat tetap) menyimpan dan mengelola kumpulan data
• Bentuk-bentuk data store:• File, semacam csv file, spreadsheet
• Database
• Distributed Data Store
• Directory Services
• dll
30/09/2021 Pengenalan Komputasi 23

Data Gathering
• Data dapat dikumpulkan dari berbagai sumber:• Transactional data: data yang berasal dari transaksi sebuah organisasi
• Tersimpan dalam database organisasi, membutuhkan cara akses khusus
• Log files: data mengenai event yang terjadi dalam suatu sistem, misalnyabanyaknya klik atau page-request pada suatu website
• API (Application Programming Interface): aplikasi khusus yang disediakanwebsite untuk men-download data
• Format data yang umum: XML, JSON, XLS
• Online-datasets: data tersedia secara online dari berbagai website baikpemerintah maupun swasta, dapat di-download secara manual
• Format data yang umum: CSV, TXT, PDF, JSON, XML, HTML, XLS
Data yang tersedia untuk publik dapat bersifat gratis (free) atau berbayar(for-purchase)
30/09/2021 Pengenalan Komputasi 24

Mengenal berbagai format data (1)
30/09/2021 Pengenalan Komputasi 25
CSV (Comma-Separated Values):Text file, data dipisahkan comma atau separator lain
XLS (excel spreadsheet):Format khusus MS Excel, menyimpan data, chart, macro, dll.

Mengenal berbagai format data (2)
30/09/2021 Pengenalan Komputasi 26
XML (eXtensible Mark-up Language):Data ditandai dengan menggunakan tag.
JSON (JavaScript Object Notation):
JSON (Java-Script O

Data Cleansing (1)
30/09/2021 Pengenalan Komputasi 27
Sumber: https://web.archive.org/web/20171205042031/https://spotlessdata.com/blog/importance-data-cleaning-user-generated-content

Data Cleansing
process of detecting and correcting (or removing) corrupt or inaccurate records from a record set, table, or database and
refers to identifying incomplete, incorrect, inaccurate or irrelevant parts of the data and then replacing, modifying, or
deleting the dirty or coarse data
Wu, S. (2013), "A review on coarse warranty data and analysis“
incorrect or inconsistent data can lead to false conclusions and misdirected investments
30/09/2021 Pengenalan Komputasi 28

Kualitas Data
• Hasil analisis sangatdipengaruhi oleh kualitasdata
• Ada banyak dimensi kualitasdata
30/09/2021 Pengenalan Komputasi 29
Sumber: https://www.whitepapers.em360tech.com/wp-content/files_mf/1407250286DAMAUKDQDimensionsWhitePaperR37.pdfhttps://www.cdc.gov/ncbddd/hearingloss/documents/dataqualityworksheet.pdfhttps://www.rfigroup.com/rfi-group/news/rfi-group-opinion-australia-why-business-leaders-need-own-data-quality

Problems with Data (1)
• Duplicate entries• Data yang sama tercatat lebih dari 1 kali• Bisa jadi yang dibutuhkan sebenarnya hanya 1 data, tetapi dalam beberapa kasus
entry lebih dari 1 kali menjadi penting
• Multiple entries of single entity• Data yang berhubungan dengan objek yang sama dientri lebih dari 1 kali, bisa
dengan nilai yang berbeda. Contoh: Mahasiswa A, di satu data tercatat tingginya150cm, di data lain tercatat tingginya 148cm
• Missing entries• Data yang seharusnya ada, tidak ditemukan. Data lengkap penting untuk analisis
yang menyeluruh.
• Null values• Sebagian data terdefinisi nilainya, sebagian lagi null (unknown/tidak terdefinisi)
30/09/2021 Pengenalan Komputasi 30

Problems with Data (2)• Huge outliers
• Outlier: data point that differs significantly from other observations.• Outlier mungkin terjadi karena kesalahan pada proses pengambilan data atau
eksperimen• Outlier dapat menyebabkan masalah pada data analysis →menyebabkan akurasi
analysis menjadi rendah
• Out-of-date data• Data yang sudah tidak akurat pada saat analysis dilakukan
• Artificial entries• Banyak data buatan ditambahkan ke data asli dalam rangka kebutuhan testing
(misalnya)
• Irregular Spacings• Pengukuran data sering dilakukan dalam jarak/jangka yang regular. Misalnya:
lalu lintas suatu website diambil per jam, data temperature wilayah diambil per meter persegi
• Jarak/jangka yang tidak regular akan menyebabkan masalah pada pemrosesan
30/09/2021 Pengenalan Komputasi 31

Problems with Data (3)Formatting Issues• Data berasal dari tabel-tabel dengan kolom-kolom yang berbeda
• Kolom yang sama bisa memiliki data yang berbeda. Contoh: Jenis Kelamin bisabernilai {“laki-laki”, “perempuan”}, bisa {“M”,”F”}, bisa {0,1}
• Extra whitespace: jumlah spasi yang berbeda dalam teks untuk data yang sama
• Contoh: “ABC” dengan “A B C”
• Irregular capitalization: penggunaan huruf kapital (dan huruf kecil) yang berbeda
• Contoh: “Bandung” atau “bandung”
• Inconsistent delimiter• Contoh: pada data CSV, digunakan semicolon atau comma atau tab untuk file data
yang sama
30/09/2021 Pengenalan Komputasi 32

Problems with Data (3)Formatting Issues• Format data null (unknown) yang berbeda-beda
• Bisa digunakan: null, N/A, atau hanya sekedar kosong
• Invalid characters: karakter-karakter tidak valid yang tidak dapatdiproses oleh tools
• Data tanggal yang tidak compatible:• Perbedaan format: August 1, 2013 atau AUG 1, 2013 atau 2013-8-13
• Perbedaan format berdasarkan negara: 10/9/2019 dalam format US adalah 9 Oktober 2019, sedangkan dalam format Indonesia adalah 10 September 2019
30/09/2021 Pengenalan Komputasi 33

Data Exploration: Understanding the Data
30/09/2021 Pengenalan Komputasi 34
Sumber:Cady (2017), “The Data Science Handbook”

Useful Statistics for Data Exploration
• Mean (rata-rata)
• Extreme values (nilai ekstrim): Minimum, maximum
• Standard Deviation (simpangan baku)
• Percentiles
• Correlation
30/09/2021 Pengenalan Komputasi 35

Mean (1)
[Population] mean:
• measure of the central tendency either of a probability distribution or of the random variable characterized by that distribution
30/09/2021 Pengenalan Komputasi 36

Mean (2)
• When to use mean:• Is a good measure of the average when a dataset contains values that are
relatively evenly spread with no exceptionally high or low values
• When not to use mean:• If a dataset contains one or two very high or very low values, the mean
will be less typical as it will be adversely influenced by these exceptional value(s)
• generally an inappropriate measure of average for data that are measured on ordinal scales
• Median and mode are other alternatives of central tendency measure →what are they?
30/09/2021 Pengenalan Komputasi 37

Extreme Values
• Minimum: the lowest value of data
• Maximum: the highest value of data
• Extreme values are used to define the range of data [min..max]
30/09/2021 Pengenalan Komputasi 38

Standard Deviation
Standard deviation:
• measure of the amount of variation or dispersion of a set of values
• A low standard deviation means that most of the numbers are close to the mean
• A high standard deviation means that the numbers are more spread out
30/09/2021 Pengenalan Komputasi 39
A plot of normal distribution (or bell-shaped curve) where each band has a width of 1 standard deviation
s is sample standard deviation{x1, x2, …, xN} are the observed values of the sample itemsx̅ : is the mean value of these observationsN is the number of observations in the sample
Percentiles
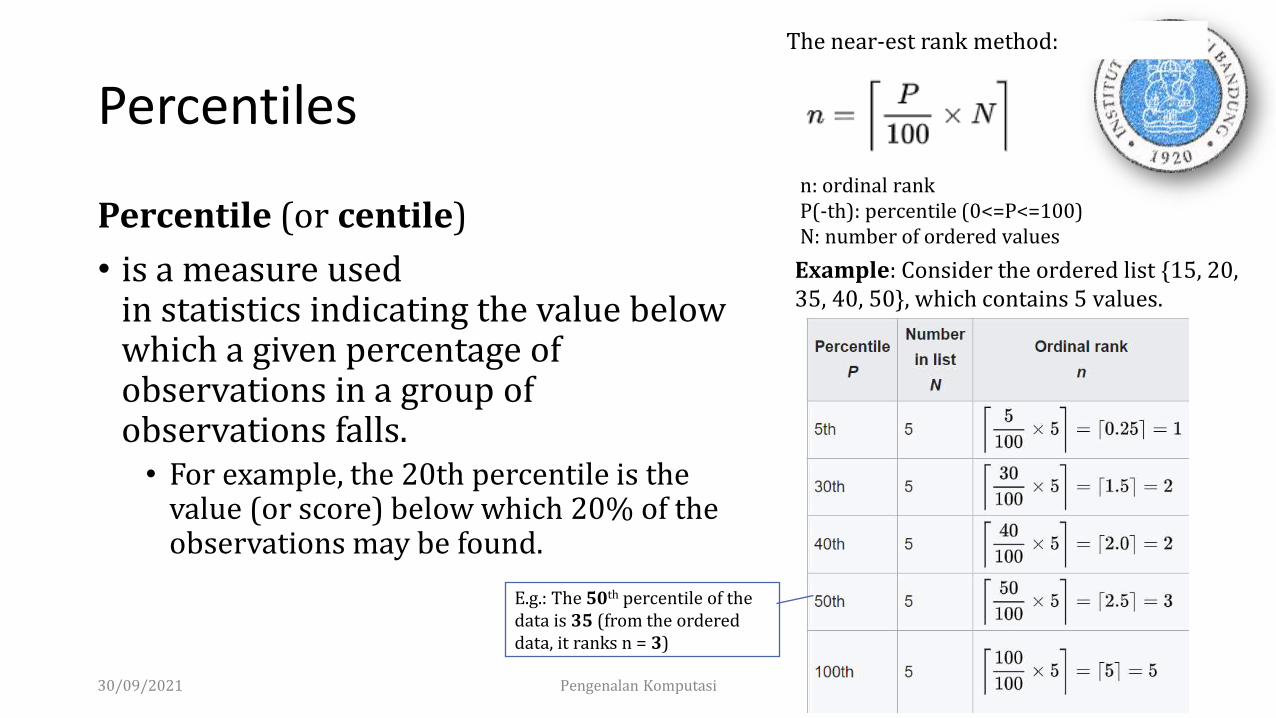
Percentile (or centile)
• is a measure used in statistics indicating the value below which a given percentage of observations in a group of observations falls.
• For example, the 20th percentile is the value (or score) below which 20% of the observations may be found.
30/09/2021 Pengenalan Komputasi 40
The near-est rank method:
n: ordinal rankP(-th): percentile (0<=P<=100)N: number of ordered values
Example: Consider the ordered list {15, 20, 35, 40, 50}, which contains 5 values.
E.g.: The 50th percentile of the data is 35 (from the ordered data, it ranks n = 3)

Correlation
Correlation
• a statistical technique that can show whether and how strongly pairs of variables are related.
• For example: height and weight are related: taller people tend to be heavier than shorter people
• The main result of a correlation is called the correlation coefficient (r): ranges from -1.0 to +1.0
• If r is close to 0, it means there is no relationship between the variables.
• If r is positive, it means that as one variable gets larger the other gets larger.
• If r is negative it means that as one gets larger, the other gets smaller (often called an "inverse" correlation).
30/09/2021 Pengenalan Komputasi 41

Persiapan untuk kuliah berikutnya
• Install program Python
• Unduh data dari folder Class Materials > Data
30/09/2021 Pengenalan Komputasi 42