Pengana International Equities Limited - ASX2019/08/26 · PENGANA.COM PENGANA INTERNATIONAL...
57
PENGANA.COM PENGANA INTERNATIONAL EQUITIES I ABN 107 462 966 I Level 12, 167 Macquarie Street, Sydney I T: +61 2 8524 9900 I E: [email protected] Pengana International Equities Limited ACN 107 462 966 Appendix 4E Preliminary Final Report for the year ended 30 June 2019 Results announcement to the market 2019 2018 Change $'000 $'000 % Income from ordinary activities 27,517 39,934 (31)% Profit from ordinary activities after tax attributable to members 16,707 24,608 (32)% Basic and diluted earnings per share (cents per share) 6.63 10.04 (34)% Dividend Information Cents per share Franked amount per share Tax rate for franking 2019 Interim dividend 3.5 Cents 3.5 Cents 27.5% 2019 Final dividend 3.5 Cents 2.35 Cents 27.5% Final Dividend Dates Ex-dividend Date Monday, 4 November 2019 Record Date Tuesday, 5 November 2019 Last date for DRP Wednesday, 6 November 2019 Payment Date Tuesday, 19 November 2019 Dividend Reinvestment Plan The Dividend Reinvestment Plan (DRP) is active and available to shareholders for the final dividend of 3.5 cents per share, of which 2.35 cents per share is franked at 27.5%. Participating shareholders will be entitled to be allotted the number of shares which the cash dividend would purchase at the relevant price. The relevant price will be the weighted average sale price of all shares in the Company sold on the Australian Securities Exchange during the five trading days commencing on and including the Record Date, with no discount applied. Option Issue On 12 December 2017, the Company issued 244,589,252 listed PIA options to eligible shareholders on the basis of 1 listed PIA option for every 1 ordinary share held on 28 November 2017. During the year ended 30 June 2019, 5,361,901 PIA options were exercised at an exercise price of $1.18. The options expired on 10 May 2019. Net Tangible Assets Per Share 30 June 2019 30 June 2018 Net Tangible Assets (before provision for tax on unrealised gains) per share $1.23 $1.23 Net Tangible Assets (after provision for tax on unrealised gains) per share $1.21 $1.22 This report is based on the Annual Report which has been audited by Ernst & Young. The audit report is included with the Company's Annual Report which accompanies this Appendix 4E. All the documents comprise the information required by Listing Rule 4.3A. For further information on the results for the Company refer to the Chairman's report to shareholders and the Investment Manager's Report contained in the attached Annual Report. Dividends Paid During the year the company paid fully franked dividends totalling 7 cents per share, comprising the final fully franked dividend of 3.5 cents per share for the 30 June 2018 financial year, paid on 28 September 2018 and the interim fully franked dividend 3.5 cents per share for the 30 June 2019 financial year, paid on 7 May 2019. Both dividends were fully franked at a 27.5% tax rate. For personal use only
Transcript of Pengana International Equities Limited - ASX2019/08/26 · PENGANA.COM PENGANA INTERNATIONAL...
PENGANA.COM
PENGANA INTERNATIONAL EQUITIES I ABN 107 462 966 I Level 12, 167 Macquarie Street, Sydney I T: +61 2 8524 9900 I E: [email protected]
Pengana International Equities Limited ACN 107 462 966 Appendix 4E Preliminary Final Report for the year ended 30 June 2019 Results announcement to the market 2019 2018 Change $'000 $'000 %
Income from ordinary activities 27,517 39,934 (31)%
Profit from ordinary activities after tax attributable to members
16,707 24,608 (32)%
Basic and diluted earnings per share (cents per share) 6.63 10.04 (34)% Dividend Information
Cents per share
Franked amount per share
Tax rate for franking
2019 Interim dividend 3.5 Cents 3.5 Cents 27.5% 2019 Final dividend 3.5 Cents 2.35 Cents 27.5% Final Dividend Dates Ex-dividend Date Monday, 4 November 2019 Record Date Tuesday, 5 November 2019 Last date for DRP Wednesday, 6 November 2019 Payment Date Tuesday, 19 November 2019
Dividend Reinvestment Plan
The Dividend Reinvestment Plan (DRP) is active and available to shareholders for the final dividend of 3.5 cents per share, of which 2.35 cents per share is franked at 27.5%. Participating shareholders will be entitled to be allotted the number of shares which the cash dividend would purchase at the relevant price. The relevant price will be the weighted average sale price of all shares in the Company sold on the Australian Securities Exchange during the five trading days commencing on and including the Record Date, with no discount applied.
Option Issue On 12 December 2017, the Company issued 244,589,252 listed PIA options to eligible shareholders on the basis of 1 listed PIA option for every 1 ordinary share held on 28 November 2017. During the year ended 30 June 2019, 5,361,901 PIA options were exercised at an exercise price of $1.18. The options expired on 10 May 2019. Net Tangible Assets Per Share 30 June 2019 30 June 2018 Net Tangible Assets (before provision for tax on unrealised gains) per share $1.23 $1.23 Net Tangible Assets (after provision for tax on unrealised gains) per share $1.21 $1.22
This report is based on the Annual Report which has been audited by Ernst & Young. The audit report is included with the Company's Annual Report which accompanies this Appendix 4E. All the documents comprise the information required by Listing Rule 4.3A.
For further information on the results for the Company refer to the Chairman's report to shareholders and the Investment Manager's Report contained in the attached Annual Report.
Dividends Paid During the year the company paid fully franked dividends totalling 7 cents per share, comprising the final fully franked dividend of 3.5 cents per share for the 30 June 2018 financial year, paid on 28 September 2018 and the interim fully franked dividend 3.5 cents per share for the 30 June 2019 financial year, paid on 7 May 2019. Both dividends were fully franked at a 27.5% tax rate.
For
per
sona
l use
onl
y
ANNUAL REPORT
ANNUAL REPORTACN 107 462 966
PENGANA INTERNATIONAL EQUITIES LIMITED
PENGANA CAPITAL HEAD OFFICE
Level 12, 167 Macquarie Street Sydney NSW 2000 Australia
Ph: +61 2 8524 9900
PENGANA.COM/PIA
30 JUNE 2019
For
per
sona
l use
onl
y

PENGANA.COM/PIA
For
per
sona
l use
onl
y

Chairman's Letter to Shareholders 4
Investment Managers' Letter 7
Ethical Investment Policy 10
Directors' Report 12
Remuneration Report 16
Auditor's Independence Declaration 22
Statement of Profit or Loss and Other Comprehensive Income 23
Statement of Financial Position 24
Statement of Changes in Equity 25
Statement of Cash Flows 26
Notes to the Financial Statements 27
Directors' Declaration 44
Independent Auditor's Report 45
ASX Information 50
Corporate Directory 55
TABLE OF CONTENTS
ANNUAL REPORT 2019 | 3
For
per
sona
l use
onl
y

CHAIRMAN’S LETTER TO SHAREHOLDERS
ANNUAL REPORT
Dear shareholders,
I am pleased to present the Annual Report of Pengana International Equities Limited (ASX: PIA) for the year ended 30 June 2019.
FINANCIAL PERFORMANCE
The Company posted an operating profit before tax of $22.2 million and net profit after tax of $16.7 million for the year ending 30 June 2019 delivering earnings per share of 6.6 cents.
Over the year the Company’s net assets increased from $301 million to $308 million at 30 June 2019. The increase was due to additional shares issued through the Dividend Reinvestment Plan and the exercise of options prior to their expiration in May 2019.
The fully franked dividends of 7 cents per share paid during the year absorbed $17.7 million of the Profit Reserve which was marginally higher than the net profit after tax for the year.
With the Company paying out all of its earnings for the year the net asset backing per share, before providing for tax on unrealised gains, (“NTA”) of $1.23 was in line with that of the prior year.
FINAL DIVIDEND
The Board declared a final dividend of 3.5 cents per share, of which 2.35 cents per share will be franked at the 27.5% tax rate. Dividends declared out of the 2019 financial year profits totalled 7 cents per share, which is in line with the prior comparable period.
INVESTMENT PERFORMANCE
Pengana Capital Group (ASX: PCG) has been managing the investments for our company since June 2017 at which time its global investment strategy was implemented.
This strategy involves investing in 30-50 ethically screened companies across developed and developing global markets to provide diversity and lower risk for shareholders.
In the two years since June 2017, the manager has remained true to its strategy and has maintained a diversified portfolio of companies from both emerging markets and developed markets without accepting excessive risk from any specific sector. The portfolio return of 9.7% per annum compounded over the two years demonstrates the quality of the stock selection inherent in the strategy.
4 | PENGANA INTERNATIONAL EQUITIES LIMITED
For
per
sona
l use
onl
y

ANNUAL REPORT 2019 | 5
In this period, the portfolio has remained largely underweight US based technology companies as the manager considers many of these companies to be fundamentally expensive with buyers in the sector chasing momentum gains at the expense of increased risk.
The manager has demonstrated the ability to generate strong returns across sectors, geographies and under volatile economic conditions and your directors consider the strategy will continue to deliver sound risk adjusted returns to our shareholders over the medium to long term.
In the report from the Investment Manager that follows, Jordan Cvetanovski and Steven Glass discuss the portfolio performance for the year and the outlook for 2020.
SHARE PRICE
It is disappointing that the Company’s share price has not tracked the NTA despite the positive initiatives undertaken over the last two years.
The Listed Investment Company (LIC) sector, as a whole, has seen a widening of discounts in the second half of the financial year. This graph shows the discounts at which the 11 largest global LICs were trading at 30 June 2019.
There are many factors that have contributed to the widening discounts including: general market uncertainty, a broad share market sell off in late calendar 2018, additional LICs listing absorbing capital and the Labor Party’s controversial proposed reform to dividend imputation credits.
Regardless of the external factors that may have affected the share price your directors and PCG continue to implement additional initiatives to bring the share price more in line with the NTA.
PROMOTION
The format and content of communications with the market are being improved to better inform shareholders and to appeal to a broader base of prospective investors.
To reach these prospective investors, PCG has enhanced its strategy to better promote the benefits of investing in PIA through various distribution channels. Obtaining positive ratings from key research houses is an important step in this process and to this end PIA has received two favourable ratings and we are awaiting a rating from a third research house.
BOARD RENEWAL
We are pleased to announce that Ms Sandi Orleow will join the Board as an independent Non-Executive Director effective 1 September 2019.
Ms Orleow brings to the PIA Board over two decades of experience in financial services across superannuation, asset management, consulting and research.
Ms Orleow currently holds several committee and director roles, including Independent Member Investment Committee Statewide Super, Investment Committee Infrastructure Partners Investment Fund (IPIF), Investment
Advisory Board ACT Treasury, Investment Committee Over Fifty Guardian Friendly Society Ltd and is a Director of the CFA Sydney Society.
Ms Orleow is a CFA Charterholder, a graduate of the Australian Institute of Company Directors and a Banking + Finance Oath Signatory.
Mr Julian Constable will retire as a director at the conclusion of the 2019 Annual General Meeting.
Mr Constable joined the Board in May 2010, he has been a member of the Company’s Audit, Risk and Compliance Committee since his appointment and was appointed its chair in 2016.
The Board would like to thank Julian for his extensive contribution to the Company over the last 9 years.
BUYBACK
The Board has announced its intention to implement an on-market buy back of no more than 10% of the Company’s shares over the following twelve months.
The buyback may be actioned when it is considered that it provides a better long term benefit to continuing shareholders than an alternative investment of funds.
DIVIDEND POLICY
Changes in the medium term global economic outlook and the prevailing low interest rate environment have understandably raised questions regarding the sustainability of the current annual dividend of 7 cents per share, with shareholders seeking confidence in the amount of future dividends.
Therefore, the board has undertaken a review of the potential effects of a lower growth global economy on the returns to PIA over the medium term and how this may impact PIA’s ability to deliver both capital growth and consistent and reliable dividend returns to shareholders.
40.0%
1 2 3 5 6 7 8 9 PIA 11
-5.0%
-10.0%
-15.0%
-20.0%
!"#$#%
!&'$#%
!&#$#%
!'$#%
#$#%
& " ( ) ' * + , - ./0 &&
For
per
sona
l use
onl
y

The board is very much aware of the importance of the dividend to many shareholders and this was demonstrated when the FY 2019 interim dividend of 3.5 cents per share was maintained even though the Company recorded a loss for the six months to December 2018.
However, having considered the results of the review, the Board is of the opinion that it would not be prudent to continue paying dividends at the current level as this substantially affects the Company’s ability to grow the value of its assets, dividends and share price.
The review did indicate that an annual dividend of 5 cents per share would be more sustainable over the short term and would provide a base from which shareholders could look forward to growth in dividends and capital over the medium to long term.
Accordingly and in the absence of unforeseen circumstances, the board expects to reset the annual dividend in the financial year 2020 with dividends franked to the maximum extent possible.
The dividend payments will remain semi-annual, with the first reset dividend being the interim dividend payable in March 2020. The Company's ability to fully frank future dividends will largely rely upon the realisation of capital gains from its investments.
ETHICAL POLICY
The board and the manager believe that implementation of a well-developed ethical framework will ultimately deliver improved decision making and enhanced portfolio returns.
During the financial year the manager undertook a review of the ethical framework that overlays the investment process for the Company. The review included stakeholder engagement regarding activities that are screened out and as a result of the review, additional screens have been added.
Further, considerations of Environmental, Social and Governance (ESG) factors have been made more explicit in the financial decision models used by the fund managers and voting and engagement policies have been formalised.
The Ethical Policy included in the Annual Report provides more information on the process undertaken by the manager.
COMMUNICATION
Our senior fund manager, Jordan Cvetanovski, and I met with many of our shareholders when we presented to investors in most of Australia’s capital cities. These meetings provided shareholders with an update on the performance of the company and an opportunity to ask questions of Jordan and me.
To ensure you remain fully informed, we recommend that you elect to receive all your investor communications via email. Please contact Paula Ferrao, our Company Secretary, on +61 02 8524 9900 if you require any assistance in this regard or if you have any questions or comments regarding the Company.
ANNUAL GENERAL MEETING
Our Annual General Meeting will be held at 2:30 pm on 31 October 2019 at the offices of Computershare on Level 3, 60 Carrington Street, Sydney.
We greatly appreciate your support and look forward to seeing you at the 2019 Annual General Meeting.
Frank Gooch Chairman
Pengana International Equities Limited
6 | PENGANA INTERNATIONAL EQUITIES LIMITED
For
per
sona
l use
onl
y

On 1 July 2019, the Pengana International Equity team celebrated its second year of managing the investments for Pengana International Equities Limited (“PIA”).
Over this period, we have witnessed increased volatility in global markets driven by heightened trade tensions between US and China, the unresolved Brexit chaos, a slowdown in global growth expectations, continued low inflationary pressures in developed countries and importantly, continued low interest rates. In this highly uncertain market, we chose to position the portfolio conservatively, protecting against losses and reducing volatility.
We aim to generate long-term attractive returns whilst reducing both volatility and the risk of losing capital, through investments in companies that operate in diverse sectors and geographies. While we are seeking the highest possible returns, we are also seeking to achieve this with lower risk.
PIA’s ability to operate with substantially reduced downside risk relative to the MSCI World Indexi has been proven on multiple occasions over the last two years, including during the December quarter of 2018, in which the market had its largest fall since the Global Financial Crisis. In fact, since inception of our mandate and 30 June 2019, PIA’s portfolio outperformed the benchmark on each of the days that the benchmark fell by greater than 1.5%, as shown in the graph below.
We believe our risk management strategy has served our fellow investors well and will do so in the future.
INVESTMENT MANAGERS’ LETTER
0%
4 Fe
b 18
10 O
ct 1
8
24 O
ct 1
8
4 D
ec 1
8
11 O
ct 1
8
23 M
ar 1
8
8 Fe
b 18
7 M
ay 1
8
17 D
ec 1
8
22 M
ar 1
8
-1%
-2%
-3%
-4%MSCI World Net Return (AUD) PIA
INSTANCES WHEN DAILY PORTFOLIO PERFORMANCEii < -1.5%
ANNUAL REPORT 2019 | 7
For
per
sona
l use
onl
y

ETHICAL FRAMEWORK
PIA is committed to a highly stringent and effective ethical framework, utilising a detailed screen to avoid investing in companies that derive operating revenues from direct and material business involvement in activities that are considered harmful to humans, animals and/or the environment. During the year we conducted a full review of the ethical investment process with the help of the Ethics Centre, a Sydney based ethical consultant and think tank. This has resulted in a more contemporary and robust application of responsible investing principles, further formulation of the voting and engagement processes and increased transparency, with our quarterly newsletter now also including an ethically focused discussion.
YEAR IN REVIEW
The portfolio delivered a net return of 7.4%iii in the 2019 financial year. Whilst we underperformed the MSCI World Index during this period, we nevertheless consider this to be an attractive return as it was generated with substantially lower risk than the index.
The stocks that performed strongly and made the larger positive contributions to the portfolio’s performance over the year include: Rakuten (Japanese internet commerce business), Dollar General (US discount retailer), CME Group (US derivatives exchange), Huazhu Group (Chinese hotel management company) and ASML Holdings (Dutch semiconductor business). It is worth highlighting the diversity of the industries in which these companies operate and the absence of large capitalisation technology companies such as Microsoft, Amazon and Apple.
The portfolio’s performance has been strong in the sectors and regions in which it has invested, outperforming most sectors and regions. Despite this performance, the portfolio underperformed the broader MSCI World Index due to the portfolio’s underweight position in large cap growth stocks, which have been the key driver of the positive returns of the broader index. This positioning reflects our long held view that many of the US large cap growth companies have become unjustifiably expensive.
After a strong start to the financial year, the MSCI World Indexiv fell by -11.0% in the December 2018 quarter. In contrast, the PIA portfolio delivered -4.7%v and while we lost capital, it was reassuring to see the portfolio exhibit defensive qualities in the face of heightened volatility and weakness across most sectors.
We had been warning of the possibility of a market selloff and heightened uncertainty. We acted on our concerns as we entered the December quarter by repositioning the portfolio to a significantly more defensive stance. The cash and derivative protection levels were increased to a maximum, as was the exposure to companies that benefit from market volatility, such as derivative exchanges. During the quarter, as equity markets plummeted our defensive position enabled us to take advantage of opportunities to invest in seven new companies, which had fallen below our valuations.
The market’s rotation to more defensive sectors proved to be short lived with the US Federal Reserve’s pivot in 1Q19 to a more accommodative monetary policy. This was the cue for money to flood back into the equity markets, resulting in the S&P 500 delivering its best quarterly return for almost 10 years.
OUTLOOK
We have opted to have increased exposure to Emerging Markets (“EM”), both directly and via companies listed in Developed Markets that have large EM exposure rather than invest in the “in-vogue” US growth stocks.
Our attraction to EM is twofold. Firstly, EM countries are the primary source of global economic growth and secondly, valuations are attractive. According to the International Monetary Fund, EMs generated approximately 75% of global economic growth in recent years. This is likely to persist and we note Citibank forecasts that, over the next five years, industrial countries will grow less than 2% while EM will deliver almost 5% growth. We believe it is always helpful investing with a strong tailwind and that tailwind is originating from EM.
In the last quarter of the Financial Year 2019, the MSCI World index was up 5.3%, the 13th positive quarter out of the last 16. This is an almost unprecedented period of stock market prosperity. A key driver of the strong continuing performance was essentially the same as in prior ones – expansionary monetary policy during a non-recessionary economic environment.
While we concur with the general consensus that lower interest rates should be supportive of equity markets, our concern is that this has resulted in the share prices of many growth companies exceeding any reasonable valuations.
The strong performance of large cap growth stocks, particularly those listed in the US, has been the dominant theme of the current buoyant market.
Markets are defined by themes and in recent times the key theme has been US large-cap growth. Without the support of a strong economy, investors
8 | PENGANA INTERNATIONAL EQUITIES LIMITED
For
per
sona
l use
onl
y

are seeking companies that can grow on their own. These companies have rapidly growing customer bases or revenues and are often labelled ‘disruptors’ or ‘quality’ or ‘growth’ stocks.
We remain concerned with the level of risk that is attached to investments in US large-cap growth stocks and have largely avoided the sector. Ironically the current theme could be up-ended by accelerating economic growth, which would push the market into more cyclical companies, or an increase in interest rates (due to the re-emergence of inflation), which would result in a devaluation of growth stocks.
The ethereal nature of market themes is part of the reason our portfolio is always well diversified. We continue to seek companies of all sizes, located in a variety of industries and countries that provide the optimal diversification for PIA’s shareholders and the best risk/return characteristics. Our performance attribution demonstrates that we have made sound returns over a wide range of sectors and geographies. This gives us the confidence that, when the current market theme shifts away from the narrow focus on large cap growth, we are well placed to continue delivering good returns.
We are currently seeing great value in many sectors and are very excited about the variety of holdings in our portfolio.
We look forward to this year and beyond and we thank you for entrusting us with your hard-earned capital. It is a responsibility we take very seriously.
i. MSCI World Total Return Index, Net Dividends Reinvested, in A$
ii. Pengana International Equities Limited has been managed under the new investment mandate by the Pengana investment team since 1 July 2017. The performance since inception in the table above refers to the movement in net assets per share since the inception of PIA in March 2004. Performance figures refer to the movement in net assets per share, reversing out the impact of option exercises and payments of dividends, before tax paid or accrued on realised and unrealised gains. Past performance is not a reliable indicator of future performance, the value of investments can go up and down. Inception date of PIA: 19 March 2004, new investment team with new mandate adopted: 1 July 2017.
iii. Performance figures refer to the movement in net assets per share, reversing out the impact of option exercises and payments of dividends, before tax paid or accrued on realised and unrealised gains. Past performance is not a reliable indicator of future performance, the value of investments can go up and down.
iv. MSCI World Total Return Index, Net Dividends Reinvested, in A$
v. Performance figures refer to the movement in net assets per share, reversing out the impact of option exercises and payments of dividends, before tax paid or accrued on realised and unrealised gains. Past performance is not a reliable indicator of future performance, the value of investments can go up and down.
Jordan Cvetanovski Portfolio Manager
Steven Glass Deputy Portfolio Manager and Analyst
ANNUAL REPORT 2019 | 9
For
per
sona
l use
onl
y

ANNUAL REPORT
PROCESS
Pengana International Equities Limited’s (“PIA”) ethical investment policy is implemented by the Investment Team of its Investment Manager, Pengana Capital Group Limited (“PCG”). Before a company is added to the portfolio, the extent of an investee company’s business involvement in screened activities is assessed by reference to a Business Involvement report sourced from Sustainalytics, an independent provider of Environmental, Social and Governance (“ESG”) and corporate governance research and ratings.
Consideration of environmental, social and ethical issues raised by prospective and existing investments are investigated within the investment research process and discussed at the Investment Team meeting on an ad-hoc basis. The PCG Risk Officer has final veto power on whether a stock meets the screening criteria for inclusion in the portfolio.
PCG engages an independent ESG researcher, to conduct an annual review of companies newly introduced to the portfolio since the last review. The outcome of the review is a report highlighting investments which may not be compliant with the ethical investment policy. The report is considered by the Investment Team and follow-up analysis of possible non-compliant investments may be undertaken. PCG has final discretion on whether or not to divest non- compliant investments.
Where it is decided to divest, the asset is disposed as soon as practicable, as determined on a case-by-case basis, whilst endeavouring to realise the best price it reasonably can, taking into account liquidity and other market forces. On occasion PCG may choose to engage with an investee company rather than divest as a better way to effect change.
ETHICAL INVESTMENT POLICY
10 | PENGANA INTERNATIONAL EQUITIES LIMITED
For
per
sona
l use
onl
y

NEGATIVE SCREENS
PIA is committed to responsible investing and seeks to avoid investing in businesses that are, in its opinion, currently involved in activities that are unnecessarily harmful to people, animals or the environment. These activities include:
• Animal cruelty
• Fossil fuels (coal, coal seam gas, oil)
• Gambling
• Human rights abuses and exploitation
• Mining
• Nuclear
• Tobacco
• Weapons
During the year, following a review of the policy and taking into account the feedback of stakeholders, the following screen were added.
• Adult content
• Alcohol
• Old growth forest logging
• Mining
• GMO
PIA utilises a negative screening process which seeks to avoid investment in companies that derive operating revenues from direct and material business involvement in these sectors.
ESG INTEGRATION
PCG is a member of the Responsible Investment Association of Australasia (RIAA) and is a signatory to the United Nations-backed Principles for Responsible Investment (PRI). This is a voluntary global initiative to encourage investment institutions to incorporate ESG considerations into their decision-making and reporting practices.
ESG considerations are not only sector and company specific, but can also encompass global thematic issues such as climate change or country specific issues such as political risks. Using Sustainalytics as our quant data source, we have developed a filter that identifies the subset of relevant sustainability factors most likely to have financially material impacts for a sector/industry to derive an ESG score card for each investee company.
This supplements meetings with management, company reporting and other desk top research and also forms the basis for on-going engagement with investee companies.
Investment decisions are based on both financial and non-financial considerations, including the results from the ESG score card. Significant ESG issues that affect a company’s value drivers such as sales or profit margins may impact our assessment of intrinsic value or may lead us not to invest or to divest from a holding.
ACTIVE OWNERSHIP
We aim to engage with investee companies to gain understanding of both financial and ESG issues.
ESG issues covered are company specific but range from supply chain management to product quality and safety to ecological impacts of operations. We will raise issues that we believe have the potential to erode shareholder value, however due to our size we will consider joining shareholder action groups.
We consider voting at company meetings such as Annual General Meetings a key part of our fiduciary duty to maximise long term shareholder value.
ANNUAL REPORT 2019 | 11
For
per
sona
l use
onl
y

ANNUAL REPORT
DIRECTORS’ REPORT
Your Directors present their report on Pengana International Equities Limited (“the Company”), for the financial year ended 30 June 2019.
DIRECTORS
The names of Directors in office at any time during or since the end of the year are:
Francis Gooch Non-Executive Director and Chairman
Julian Constable Non-Executive Director
David Groves Non-Executive Director
Russel Pillemer Managing Director (Appointed Managing Director on 21 February 2019)
Directors have been in office since the start of the financial year to the date of this report, unless stated otherwise.
INFORMATION ON DIRECTORS
During the year, the following persons held office as Director:
Francis Gooch - B.Bus, CPAIndependent, Chairman (appointed 6 December 2017), Non-Executive Director (appointed 5 June 2017)
Mr Francis Gooch was appointed as a non-executive Director of the Company by the Board on 5 June 2017 and was elected by shareholders at the Company’s 2017 Annual General Meeting. On 6 December 2017 he was appointed Chairman of Directors. He is also a member of the Company’s Audit, Risk and Compliance Committee and of the Independent Board Committee.
Mr Gooch has over 23 years’ experience in the LIC industry after having been an executive of Milton Corporation Limited since 1996. He became Chief Executive in 1999 and was made the Managing Director in 2004. Mr Gooch retired from Milton on 31 July 2018.
Mr Gooch has also served as chairman of the LIC industry body, Australian Listed Investment Companies Association. Prior to joining Milton Corporation Limited Mr Gooch worked at Macquarie Bank Limited for 11 years.
Julian Constable - MAICDIndependent, Non-Executive Director (appointed 25 May 2010)
Mr Constable is a Non-executive Director of the Company. He is also Chairman of the Company’s Audit, Risk and Compliance Committee and of the Independent Board Committee.
Mr Constable is a senior investment advisor at Bell Potter Securities Ltd, having worked in this capacity since 1998. In this role his key attributes are developing new business and building relationships with clients. He has worked in the stockbroking industry since 1984, in both trading and advisory areas, at firms including Pembroke Securities Ltd, Pring Dean McNall, Hambros Equities and Potter Warburg Dillon Read.
Mr Constable has been a Non-executive Director of the ASX-listed HGL Ltd since August 2003 and is a member of its Remuneration Committee.
12 | PENGANA INTERNATIONAL EQUITIES LIMITED
For
per
sona
l use
onl
y

David Groves - BCom., MCom., CA, FAICDNon-independent, Non-Executive Director (appointed 13 January 2017)
Mr Groves is a Non-executive Director of the Company. He is also a member of the Company’s Audit, Risk and Compliance Committee.
Mr Groves has over 25 years’ experience as a company director. He is Chairman of Tasman Sea Salt Pty Ltd and is a non-executive director of Pengana Capital Group Limited, Redcape Hotel Group Management Ltd as responsible entity of the Redcape Hotel Group and of Pipers Brook Vineyard Pty Ltd.
He is a former director of EQT Holdings Ltd, Tassal Group Ltd and GrainCorp Ltd and a former executive with Macquarie Bank Limited and its antecedent, Hill Samuel Australia.
Mr Groves is a member of the Council of Wollongong University. He is a member of the Institute of Chartered Accounts Australia and New Zealand and a fellow of the Australian Institute of Company Directors.
Mr Groves is also a Non-executive Director of Pengana Capital Group Limited, Chairman of the Pengana Group Audit, Risk and Compliance Committee and a member of the Pengana Group Nomination and Remuneration Committee.
Mr Groves is a member of the Australian Institute of Chartered Accountants and a fellow of the Australian Institute of Company Directors.
Russel Pillemer - B.Com, CANon-independent Managing Director (appointed Non-Executive Director 5 June 2017, Managing Director 21 February 2019)
Mr Pillemer is the Managing Director of the Company.
Mr Pillemer is also a Director and Chief Executive Officer of Pengana Capital Group Limited. Mr Pillemer co-founded Pengana in 2003 and has been its Chief Executive Officer since inception. Prior to founding Pengana, Mr Pillemer worked in the Investment Banking Division of Goldman Sachs in New York where he specialised in providing advice to funds management businesses. Before moving to New York, he was responsible for leading Goldman Sachs’ Australian Financial Institutions Group. Mr Pillemer was previously Chairman of Centric Wealth Group and a Principal of Turnbull Pillemer Capital.
He is a member of the Institute of Chartered Accountants in Australia and has a Bachelor of Commerce (Hons) from the University of New South Wales.
ANNUAL REPORT 2019 | 13
For
per
sona
l use
onl
y
ANNUAL REPORTANNUAL REPORT
DIRECTORS’ REPORT (CONTINUED)
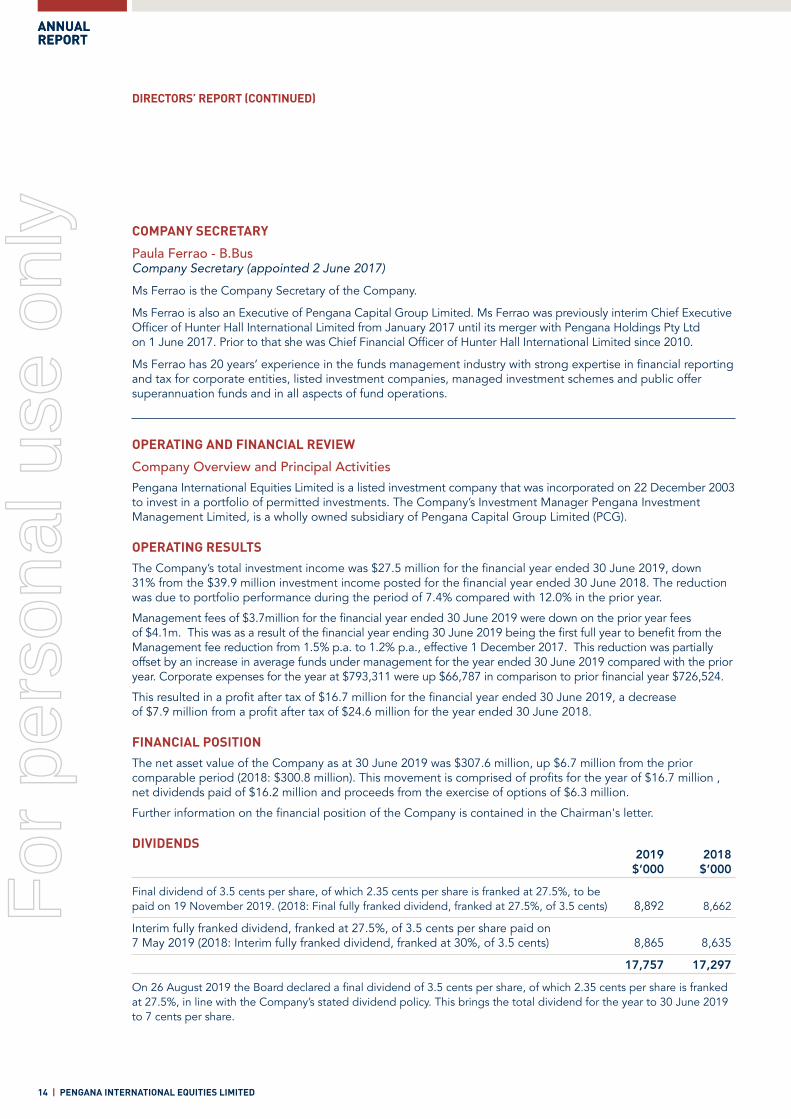
COMPANY SECRETARY
Paula Ferrao - B.BusCompany Secretary (appointed 2 June 2017)
Ms Ferrao is the Company Secretary of the Company.
Ms Ferrao is also an Executive of Pengana Capital Group Limited. Ms Ferrao was previously interim Chief Executive Officer of Hunter Hall International Limited from January 2017 until its merger with Pengana Holdings Pty Ltd on 1 June 2017. Prior to that she was Chief Financial Officer of Hunter Hall International Limited since 2010.
Ms Ferrao has 20 years’ experience in the funds management industry with strong expertise in financial reporting and tax for corporate entities, listed investment companies, managed investment schemes and public offer superannuation funds and in all aspects of fund operations.
OPERATING AND FINANCIAL REVIEW
Company Overview and Principal ActivitiesPengana International Equities Limited is a listed investment company that was incorporated on 22 December 2003 to invest in a portfolio of permitted investments. The Company’s Investment Manager Pengana Investment Management Limited, is a wholly owned subsidiary of Pengana Capital Group Limited (PCG).
OPERATING RESULTSThe Company’s total investment income was $27.5 million for the financial year ended 30 June 2019, down 31% from the $39.9 million investment income posted for the financial year ended 30 June 2018. The reduction was due to portfolio performance during the period of 7.4% compared with 12.0% in the prior year.
Management fees of $3.7million for the financial year ended 30 June 2019 were down on the prior year fees of $4.1m. This was as a result of the financial year ending 30 June 2019 being the first full year to benefit from the Management fee reduction from 1.5% p.a. to 1.2% p.a., effective 1 December 2017. This reduction was partially offset by an increase in average funds under management for the year ended 30 June 2019 compared with the prior year. Corporate expenses for the year at $793,311 were up $66,787 in comparison to prior financial year $726,524.
This resulted in a profit after tax of $16.7 million for the financial year ended 30 June 2019, a decrease of $7.9 million from a profit after tax of $24.6 million for the year ended 30 June 2018.
FINANCIAL POSITIONThe net asset value of the Company as at 30 June 2019 was $307.6 million, up $6.7 million from the prior comparable period (2018: $300.8 million). This movement is comprised of profits for the year of $16.7 million , net dividends paid of $16.2 million and proceeds from the exercise of options of $6.3 million.
Further information on the financial position of the Company is contained in the Chairman's letter.
DIVIDENDS 2019 2018 $’000 $’000
Final dividend of 3.5 cents per share, of which 2.35 cents per share is franked at 27.5%, to be paid on 19 November 2019. (2018: Final fully franked dividend, franked at 27.5%, of 3.5 cents) 8,892 8,662
Interim fully franked dividend, franked at 27.5%, of 3.5 cents per share paid on 7 May 2019 (2018: Interim fully franked dividend, franked at 30%, of 3.5 cents) 8,865 8,635
17,757 17,297
On 26 August 2019 the Board declared a final dividend of 3.5 cents per share, of which 2.35 cents per share is franked at 27.5%, in line with the Company’s stated dividend policy. This brings the total dividend for the year to 30 June 2019 to 7 cents per share.
14 | PENGANA INTERNATIONAL EQUITIES LIMITED
For
per
sona
l use
onl
y

DIVIDEND POLICY
The Board is committed to paying a regular and growing stream of fully franked dividends to its shareholders, provided the Company has sufficient profit reserves and franking credits and it is within prudent business practices.
STRATEGY AND FUTURE OUTLOOK
The Company aims to meet its investment objective of generating long-term consistent returns whilst reducing volatility and the risk of losing capital, and to pay a regular and growing stream of fully franked dividends to our shareholders, provided the Company has sufficient profit reserves and franking credits and it is within prudent business practices.
The Board is continuously seeking to improve communication with shareholders, deploy value creating capital management strategies and being disciplined in managing the Company’s expenses.
The Company’s portfolio is primarily invested in equities and given the volatility in investment markets it is extremely difficult to forecast profit for the coming year. The Company provides weekly NTA announcements to the Australian Securities Exchange (ASX), and they can also be accessed via the website of the Company’s Investment Manager: www.pengana.com
SIGNIFICANT CHANGES IN THE STATE OF AFFAIRS
On 21 February 2019, Russel Pillemer was appointed Managing Director of the Company. There were no other significant changes in the state of affairs during the reporting period.
EVENTS SUBSEQUENT TO BALANCE SHEET DATE
On 26 August 2019 the Board declared a final dividend of 3.5 cents per share, of which 2.35 cents per share is franked at 27.5%, in line with the Company’s stated dividend policy. This brings the total dividend for the year to 30 June 2019 to 7 cents per share.
The yield of this final dividend of 3.5 cents per share taken together with the interim fully franked dividend of 3.5 cents per share paid on 7 May 2019 is 6.64%, based on $1.055, the closing share price at 21 August 2019.
This final dividend is 67.14% franked, while the interim was 100% franked, both at a tax rate of 27.5%. Taken together, the dividend yield for the year grossed up for franking credits is 8.74%.
The NTA after provision for tax and urealised gains of the Company at 16 August 2019 was $1.2210, an increase of $0.0109 or 0.90% from the $1.2101 recorded at 30 June 2019.
On 26 August 2019 the Board announced its intention to reset the dividend payable for the financial year ending 30 June 2020 to 5 cent per share, franked to the maximum extent possible, provided the Company has sufficient profit reserves and franking credits and it is within prudent business practices.
On 26 August 2019 the Board announced that Ms Sandi Orleow will join the Board as an independent Non-Executive Director effective 1 September 2019 and that Mr Julian Constable will retire as a director at the conclusion of the 2019 Annual General Meeting.
On 26 August 2019 the Board announced its intention to implement an on-market buy back of no more than 10% of the Company’s shares over the following twelve months.
Other than the above, the Directors are not aware of any other matter or circumstance not otherwise dealt with in this financial report that has significantly or may significantly affect Company’s operations, the results of those operations or the Company’s state of affairs in future years.
ANNUAL REPORT 2019 | 15
For
per
sona
l use
onl
y
ANNUAL REPORT
DIRECTORS’ REPORT (CONTINUED)
REMUNERATION REPORT (AUDITED)
The Board presents the Remuneration Report for the Company for the year ended 30 June 2019, which forms part of the Directors’ Report and has been prepared in accordance with the Corporations Act 2001 and the Corporations Regulations 2001.
1. REMUNERATION GOVERNANCE
The Company has no employees and so remuneration is limited to Directors’ fees.
The Board is responsible for ensuring that the level of fees paid to the Directors is reasonable.
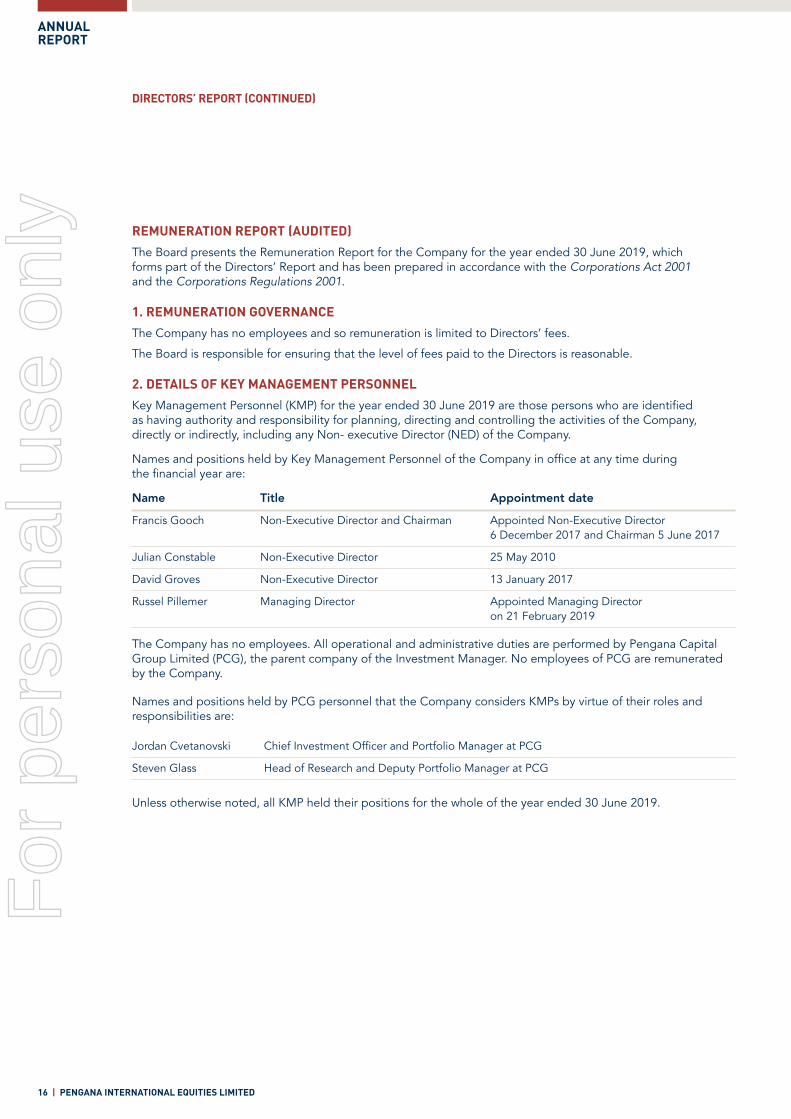
2. DETAILS OF KEY MANAGEMENT PERSONNEL
Key Management Personnel (KMP) for the year ended 30 June 2019 are those persons who are identified as having authority and responsibility for planning, directing and controlling the activities of the Company, directly or indirectly, including any Non- executive Director (NED) of the Company.
Names and positions held by Key Management Personnel of the Company in office at any time during the financial year are:
Name Title Appointment date
Francis Gooch Non-Executive Director and Chairman Appointed Non-Executive Director 6 December 2017 and Chairman 5 June 2017
Julian Constable Non-Executive Director 25 May 2010
David Groves Non-Executive Director 13 January 2017
Russel Pillemer Managing Director Appointed Managing Director on 21 February 2019
The Company has no employees. All operational and administrative duties are performed by Pengana Capital Group Limited (PCG), the parent company of the Investment Manager. No employees of PCG are remunerated by the Company.
Names and positions held by PCG personnel that the Company considers KMPs by virtue of their roles and responsibilities are:
Jordan Cvetanovski Chief Investment Officer and Portfolio Manager at PCG
Steven Glass Head of Research and Deputy Portfolio Manager at PCG
Unless otherwise noted, all KMP held their positions for the whole of the year ended 30 June 2019.
16 | PENGANA INTERNATIONAL EQUITIES LIMITED
For
per
sona
l use
onl
y

3. REMUNERATION
a. Remuneration PolicyDirectors are remunerated by way of fees and superannuation contributions.
Each year the fees are determined by the Board of Directors who take into account the responsibilities, qualifications and experience of the directors as well as the demands made on directors and the remuneration of non-executive directors of comparable Australian companies.
Fees (including superannuation contributions): 2019 2018 Change $ $ %
Chairman 65,700 65,700 Nil
Director 43,800 43,800 Nil
b. Aggregate Fees LimitThe Aggregate Fee Limit available to directors of $250,000 was approved by shareholders in 2013.
c. Equity-based RemunerationNEDs are remunerated by way of cash benefits. The Company currently has no intention to remunerate NEDs by any way other than cash benefits.
d. Directors RemunerationThe following table outlines the remuneration provided to NEDs for the years ended 30 June 2019 and 30 June 2018. Short-term Post-employment Total 2019 benefits benefits remuneration
Non-Executive Directors Directors’ fees Superannuation Total $ $ $
Francis Gooch 60,000 5,700 65,700
Julian Constable 40,000 3,800 43,800
David Groves 40,000 3,800 43,800
140,000 13,300 153,300
Russel Pillemer, who is also Director and Chief Executive Officer of Pengana Capital Group Limited (ASX: PCG), PIA’s Investment Manager, is not remunerated by PIA.
Short-term Post-employment Total 2018 benefits benefits remuneration
Non-Executive Directors Directors’ fees Superannuation Total $ $ $
Francis Gooch 50,000 4,750 54,750
Julian Constable 40,000 3,800 43,800
David Groves 50,000 4,750 54,750
140,000 13,300 153,300
ANNUAL REPORT 2019 | 17
For
per
sona
l use
onl
y

ANNUAL REPORT
DIRECTORS’ REPORT (CONTINUED)REMUNERATION REPORT (CONTINUED)
e. Service AgreementsRemuneration and other terms of employment for the Independent Non-executive Directors are formalised in service agreements with the Company.
Francis Gooch, Chairman, Independent Non-Executive Director and member of the Audit, Risk and Compliance Committee and of the Independent Board Committee• Commenced on 5 June 2017
• No term of agreement has been set unless the Director is not re-elected by shareholders of the Company
• Annual salary, inclusive of superannuation, for the year ended 30 June 2019 of $65,700.
David Groves, Non-independent Non-Executive Director and member of the Audit, Risk and Compliance Committee• Commenced on 13 January 2017
• No term of agreement has been set unless the Director is not re-elected by shareholders of the Company
• Annual salary, inclusive of superannuation, for the year ended 30 June 2019 of $43,800.
Julian Constable, Independent Non-Executive Director, Chair of the Audit, Risk and Compliance Committee and of the Independent Board Committee• Commenced on 25 May 2010
• No term of agreement has been set unless the Director is not re-elected by shareholders of the Company
• Annual salary, inclusive of superannuation, for the year ended 30 June 2019 of $43,800.
Russel Pillemer, Managing Director• Commenced on 5 June 2017 (appointed Managing Director 21 February 2019)
Mr Pillemer is not remunerated by the Company, and being Managing Director is not required to stand for re-election.
End of Audited Remuneration Report
18 | PENGANA INTERNATIONAL EQUITIES LIMITED
For
per
sona
l use
onl
y
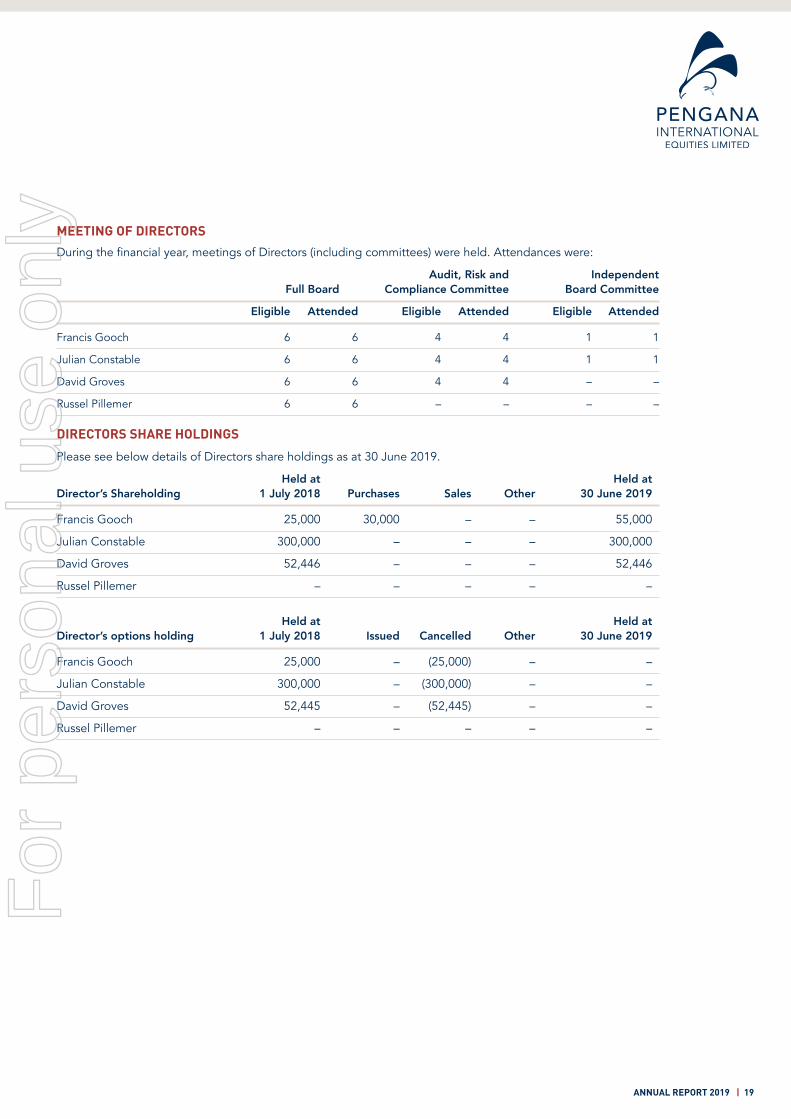
MEETING OF DIRECTORS
During the financial year, meetings of Directors (including committees) were held. Attendances were:
Audit, Risk and Independent Full Board Compliance Committee Board Committee
Eligible Attended Eligible Attended Eligible Attended
Francis Gooch 6 6 4 4 1 1
Julian Constable 6 6 4 4 1 1
David Groves 6 6 4 4 – –
Russel Pillemer 6 6 – – – –
DIRECTORS SHARE HOLDINGS
Please see below details of Directors share holdings as at 30 June 2019.
Held at Held at Director’s Shareholding 1 July 2018 Purchases Sales Other 30 June 2019
Francis Gooch 25,000 30,000 – – 55,000
Julian Constable 300,000 – – – 300,000
David Groves 52,446 – – – 52,446
Russel Pillemer – – – – –
Held at Held at Director’s options holding 1 July 2018 Issued Cancelled Other 30 June 2019
Francis Gooch 25,000 – (25,000) – –
Julian Constable 300,000 – (300,000) – –
David Groves 52,445 – (52,445) – –
Russel Pillemer – – – – –
ANNUAL REPORT 2019 | 19
For
per
sona
l use
onl
y
ANNUAL REPORT
DIRECTORS’ REPORT (CONTINUED)
ENVIRONMENTAL ISSUES
The Company’s operations are not subject to any environmental regulation under the law of the Commonwealth and state or territory.
PROCEEDINGS ON BEHALF OF THE COMPANY
No person has applied for leave of Court to bring proceedings on behalf of the Company or intervene in any proceedings to which the Company is a party for the purpose of taking responsibility on behalf of the Company for all or any part of those proceedings. The Company was not a party to any such proceedings during the year.
ROUNDING OF AMOUNTS
The Company is of a kind referred to in the Australian Securities and Investments Commission (ASIC) Corporations (Rounding in Financial/Directors’ Reports) Instrument 2016/191, relating to the ‘rounding off’ of amounts in the Directors’ report. Amounts in the Directors’ report have been rounded off in accordance with that instrument to the nearest thousand dollars, or in certain areas, to the nearest dollar (unless stated otherwise).
INDEMNIFYING AND INSURANCE OF DIRECTORS AND OFFICERS
The Company insures each of the Directors and Officers in office against liabilities for costs and expenses incurred by them in defending any legal proceedings arising out of their conduct while acting in the capacity of Directors and Officers of the Company, other than conduct involving a wilful breach of duty in relation to the Company. Details of the amount of premium paid in respect of insurance policies are not disclosed as such disclosure is prohibited under the terms of the contract.
INDEMNIFICATION OF AUDITORS
To the extent permitted by law, the Company has agreed to indemnify its auditors, Ernst & Young, as part of the terms of its audit engagement agreement against claims by third parties arising from the audit (for an unspecified amount). No payment has been made to indemnify Ernst & Young during or since the financial year.
20 | PENGANA INTERNATIONAL EQUITIES LIMITED
For
per
sona
l use
onl
y

AUDITOR
Ernst & Young was appointed as the auditor on 16 November 2016 in accordance with section 327 of the Corporations Act 2001.
NON-AUDIT SERVICES
Ernst & Young received or are due to receive $7,000 for the provision of non-audit services.
The Directors are satisfied that the provision of non-audit services is compatible with the general standard of independence for auditors imposed by the Corporations Act 2001. The nature and scope of each type of non-audit service provided means that auditor independence was not compromised.
AUDITOR’S INDEPENDENCE DECLARATION
A copy of the Auditor’s Independence Declaration as required under s307C of the Corporations Act 2001 is set out on the following page and forms part of this report.
Signed in accordance with a resolution of the Board of Directors
Frank Gooch Chairman Sydney 26 August 2019
ANNUAL REPORT 2019 | 21
For
per
sona
l use
onl
y

ANNUAL REPORT
AUDITOR’S INDEPENDENCE DECLARATION
13 A member firm of Ernst & Young Global Limited Liability limited by a scheme approved under Professional Standards Legislation
Ernst & Young 200 George Street Sydney NSW 2000 Australia GPO Box 2646 Sydney NSW 2001
Tel: +61 2 9248 5555 Fax: +61 2 9248 5959 ey.com/au
Auditor’s Independence Declaration to the Directors of Pengana International Equities Limited As lead auditor for the audit of Pengana International Equities Limited for the financial year ended 30 June 2019, I declare to the best of my knowledge and belief, there have been:
a) no contraventions of the auditor independence requirements of the Corporations Act 2001 in relation to the audit; and
b) no contraventions of any applicable code of professional conduct in relation to the audit. Ernst & Young Graeme McKenzie Partner 26 August 2019
22 | PENGANA INTERNATIONAL EQUITIES LIMITED
For
per
sona
l use
onl
y

STATEMENT OF PROFIT OR LOSS AND OTHER COMPREHENSIVE INCOME
For the year ended: 30 June 2019 30 June 2018 Note $’000 $’000
Revenue
Interest received 791 369
Dividend received 5,892 5,093
Change in fair value of investments 2 20,873 34,441
Foreign exchange (loss)/gain on foreign currency denominated cash (40) 29
Other operating income 1 2
Total investment income 27,517 39,934
Management fees 3 (3,706) (4,053)
Performance fees 3 – (315)
(3,706) (4,368)
Expenses
Directors’ fees (153) (153)
Audit and assurance fees 3 (68) (76)
Brokerage expenses (868) (1,279)
Disbursements, mailing and printing (9) (19)
Share registry fees (122) (134)
ASX listing fees (90) (80)
Legal and professional expenses (7) (16)
Custody and administration fees (139) (118)
Tax fees (10) (18)
Other expenses (195) (113)
(1,661) (2,006)
Total expenses (5,367) (6,374)
Profitbeforeincometax 22,150 33,560
Income tax expense 4 (5,443) (8,952)
Netprofitafterincometax 16,707 24,608
Other comprehensive income for the year, net of tax – –
Total comprehensive income for the year 16,707 24,608
Basic and diluted earnings per share (cents per share) 5 6.63 10.04
The statement of profit or loss and other comprehensive income should be read in conjunction with the accompanying notes.
ANNUAL REPORT 2019 | 23
For
per
sona
l use
onl
y

ANNUAL REPORT
STATEMENT OF FINANCIAL POSITION
As at: 30 June 2019 30 June 2018 Note $’000 $’000
Assets
Cash and cash equivalents 6 34,089 41,230
Trade and other receivables 7 5,065 2,339
Financial assets at fair value through profit or loss 8 275,825 269,218
Deferred tax assets 4 116 258
Total assets 315,095 313,045
Liabilities
Trade and other payables 10 1,302 7,095
Financial liabilities at fair value through profit or loss 9 – 1,103
Deferred tax liabilities 4 6,224 4,009
Total liabilities 7,526 12,207
Net assets 307,569 300,838
Equity
Issued capital 11 315,997 308,278
Profit reserve 13 105,485 106,473
Retained losses 12 (113,913) (113,913)
Total equity attributable to shareholders of the Company 307,569 300,838
The statement of financial position should be read in conjunction with the accompanying notes.
24 | PENGANA INTERNATIONAL EQUITIES LIMITED
For
per
sona
l use
onl
y

Retained Issued Profit earnings/ For the year ended: capital reserve (losses) Total Note $’000 $’000 $’000 $’000
Balance as at 1 July 2017 304,806 99,047 (113,913) 289,940
Profit for the year – – 24,608 24,608
Transfer to profit reserve – 24,608 (24,608) –
Transactions with shareholders in their capacity as owners:
Dividend reinvestment plan issues 11 1,517 – – 1,517
Options exercised 2,257 – – 2,257
Costs incurred on option issue (302) – – (302)
Dividends paid 14 – (17,182) – (17,182)
Balance at 30 June 2018 308,278 106,473 (113,913) 300,838
Balance at 1 July 2018 308,278 106,473 (113,913) 300,838
Profit for the year – – 16,707 16,707
Transfer to profit reserve – 16,707 (16,707) –
Transactions with shareholders in their capacity as owners:
Dividend reinvestment plan issues 11 1,399 – – 1,399
Options exercised 6,327 – – 6,327
Costs incurred on option issue (7) – – (7)
Dividends paid 14 – (17,695) – (17,695)
Balance at 30 June 2019 315,997 105,485 (113,913) 307,569
The above statement of changes in equity should be read in conjunction with the accompanying notes.
STATEMENT OF CHANGES IN EQUITY
ANNUAL REPORT 2019 | 25
For
per
sona
l use
onl
y
ANNUAL REPORT
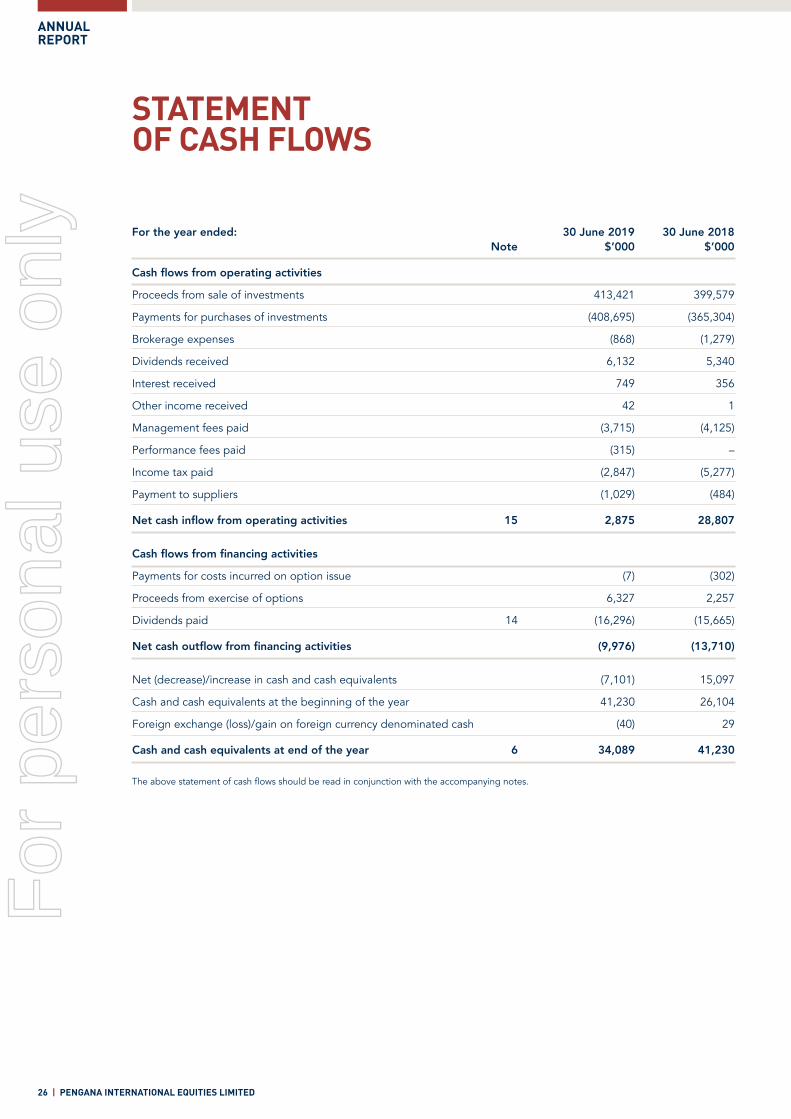
STATEMENT OF CASH FLOWS
For the year ended: 30 June 2019 30 June 2018 Note $’000 $’000
Cashflowsfromoperatingactivities
Proceeds from sale of investments 413,421 399,579
Payments for purchases of investments (408,695) (365,304)
Brokerage expenses (868) (1,279)
Dividends received 6,132 5,340
Interest received 749 356
Other income received 42 1
Management fees paid (3,715) (4,125)
Performance fees paid (315) –
Income tax paid (2,847) (5,277)
Payment to suppliers (1,029) (484)
Netcashinflowfromoperatingactivities 15 2,875 28,807
Cashflowsfromfinancingactivities
Payments for costs incurred on option issue (7) (302)
Proceeds from exercise of options 6,327 2,257
Dividends paid 14 (16,296) (15,665)
Netcashoutflowfromfinancingactivities (9,976) (13,710)
Net (decrease)/increase in cash and cash equivalents (7,101) 15,097
Cash and cash equivalents at the beginning of the year 41,230 26,104
Foreign exchange (loss)/gain on foreign currency denominated cash (40) 29
Cash and cash equivalents at end of the year 6 34,089 41,230
The above statement of cash flows should be read in conjunction with the accompanying notes.
26 | PENGANA INTERNATIONAL EQUITIES LIMITED
For
per
sona
l use
onl
y
NOTES TO THE FINANCIAL STATEMENTS
NOTE 1: CORPORATE INFORMATION AND SUMMARY OF SIGNIFICANT ACCOUNTING POLICIESThe financial statements of Pengana International Equities Limited (“the Company”), for the year ended 30 June 2019 were authorised for issue in accordance with a resolution of the Directors on 26 August 2019.
Pengana International Equities Limited is a for-profit company limited by shares incorporated and domiciled in Australia. The Company’s principal place of business is Level 12, 167 Macquarie Street, Sydney, NSW 2000 Australia.
Further information on the nature of the operations and principal activities of the Company is provided in the Directors’ report.
Basis of preparationThe financial report is a general purpose financial report, which has been prepared in accordance with the requirements of the Corporations Act 2001, Australian Accounting Standards (AASB) and other authoritative pronouncements of the Australian Accounting Standards Board.
The financial report has been prepared on a historical cost basis unless stated otherwise and is presented in Australian dollars. Investments in financial assets and liabilities are recorded at fair value through profit and loss.
The statement of financial position is presented on a liquidity basis. Assets and liabilities are presented in decreasing order of liquidity and are not distinguished between current and non-current.
Compliance with International Financial Reporting StandardsThe financial report also complies with International Financial Reporting Standards (IFRS) as issued by the International Accounting Standards Board.
Summary of significant accounting policiesThe following is a summary of the material accounting policies adopted by the Company in the preparation of the financial report. They have been consistently applied unless otherwise stated.
a. Revenue and other incomeDividend income is recognised on the date shares are quoted ex-dividend. Interest income is recognised on an accruals basis. All revenue is stated net of the amount of Goods and Services Tax (GST).
b. ExpensesAll expenses are recognised on an accrual basis. Management and performance fees are set out in Note 3.
c. Cash and cash equivalentsCash and cash equivalents include cash on hand and call deposits with banks or financial institutions.
d. Financial assets and liabilities
Recognition and measurementFinancial assets and liabilities are recognised when the Company becomes a party to the binding contractual provisions to the instrument. For financial assets this is equivalent to the date that the Company commits itself to either the purchase or sale of the asset (i.e. trade date accounting is adopted).
Financial assets and liabilities are recognised on initial recognition at fair value. Financial instruments are classified into the following categories and fair values of financial instruments are determined on the following basis:
i. Investments Financial assets and liabilities at fair value through profit and loss are measured initially at fair value excluding any
transaction costs that are directly attributable to the acquisition of the financial asset or liability. Transaction costs of financial assets carried at fair value through profit or loss are expensed in the Statement of Profit or loss and Other Comprehensive Income. After initial recognition, investments are classified as “fair value through profit or loss”. Gains and losses on investments are recognised in the Statement of Profit or loss and Other Comprehensive Income. Gains and losses do not include interest or dividend income.
Last market close price is used for all investments quoted in an active market. Where this price falls outside the bid-ask spread, discretion is used as to whether the most appropriate price is the bid price or last market close price.
ANNUAL REPORT 2019 | 27
For
per
sona
l use
onl
y

ANNUAL REPORT
NOTES TO THE FINANCIAL STATEMENTS (CONTINUED)NOTE 1: CORPORATE INFORMATION AND SUMMARY OF SIGNIFICANT ACCOUNTING POLICIES (CONTINUED)
d. Financial assets and liabilities (continued)
De-recognitionInvestments are de-recognised when the right to receive cashflows from the investments has expired or the Company has transferred substantially all risks and rewards of ownership.
ii. Derivativefinancialinstruments Forward foreign exchange hedging contracts
The Company only uses forward foreign exchange hedging contracts to hedge the risks associated with foreign currency fluctuations. The Company has established foreign exchange dealing lines with major banks. Forward foreign exchange hedging contracts are marked to market daily and are disclosed as financial assets or financial liabilities as the valuation requires. The Company does not apply hedge accounting as it manages such hedges as economic hedges.
The fair value of forward foreign exchange hedging contracts is calculated by reference to current forward exchange rates for contracts with the same maturity profiles.
Gains and losses arising from changes in fair value are taken directly to the Statement of Profit or loss and Other Comprehensive Income.
Exchange traded options
Exchange traded options are initially recognised at cost, being the fair value of the consideration given excluding brokerage and other acquisition charges associated with the exchange traded index options. Brokerage and other acquisition charges associated with the exchange traded index options are expensed in the Statement of Profit or loss and Other Comprehensive Income. After initial recognition, exchange traded options have been classified as “fair value through profit or loss”. Gains and losses on exchange traded options are recognised in the Statement of Profit or loss and Other Comprehensive Income.
iii. Trade and other receivables Trade and other receivables are initially recognised at fair value. They are subsequently stated at amortised cost.
At each reporting date, the Company shall measure the loss allowance on Trade receivables at an amount equal to the lifetime expected credit losses if the credit risk has increased significantly since initial recognition. If, at the reporting date, the credit risk has not increased significantly since initial recognition, the Company shall measure the loss allowance at an amount equal to 12-month expected credit losses. Significant financial difficulties of the broker, probability that the broker will enter bankruptcy or financial reorganisation, and default in payments are all considered indicators that a loss allowance may be required. If the credit risk increases to the point that it is considered to be credit impaired, interest income will be calculated based on the gross carrying amount adjusted for the loss allowance.
iv. Trade and other payables Trade and other payables are initially recognised at fair value. They are subsequently stated at amortised cost.
e. Foreign currency translationForeign currency transactions are translated into Australian Dollars (AUD) at the functional currency spot rates of exchange at the date of the transaction.
Foreign exchange gains and losses resulting from the settlement of such transactions and from the translation of foreign assets and liabilities at year end exchange rates are recognised in the Statement of Profit or loss and Other Comprehensive Income.
Translation differences on monetary assets and liabilities, forward foreign exchange hedging contracts, exchange traded options and investments are reported as part of the change of value of investments on the Statement of Profit or loss and Other Comprehensive Income. All other foreign exchange gains and losses are presented in the Statement of Profit or loss and Other Comprehensive Income within revenue.
Assets and liabilities denominated in a foreign currency are translated at the functional currency spot rates of exchange at reporting date.
28 | PENGANA INTERNATIONAL EQUITIES LIMITED
For
per
sona
l use
onl
y

f. Income TaxThe income tax expense or credit for the period is the tax payable on the current period’s taxable income based on the applicable income tax adjusted for changes in deferred tax assets and liabilities attributable to temporary differences and to unused tax losses. The current income tax charge is calculated on the basis of the tax laws enacted or substantively enacted at the end of the reporting period.
Deferred tax is provided for using the liability method on temporary differences between the tax bases of assets and liabilities and their carrying amounts for financial reporting purposes at the reporting date.
Deferred tax assets are recognised for all deductible temporary differences, the carry forward of unused tax credits and any unused tax losses. Deferred tax assets are recognised to the extent that it is probable that taxable profit will be available against which the deductible temporary differences, and the carry forward of unused tax credits and unused tax losses can be utilised.
The carrying amount of deferred tax assets is reviewed at each reporting date and reduced to the extent that it is no longer probable that sufficient taxable profit will be available to allow all or part of the deferred tax asset to be utilised. Unrecognised deferred tax assets are re-assessed at each reporting date and are recognised to the extent that it has become probable that future taxable profits will allow the deferred tax asset to be recovered.
The Company’s Aggregated Turnover, as defined in the Treasury Laws Amendment (Enterprise Tax Plan) Bill 2017 for the year ended 30 June 2019 amounted to approximately $40m (2018: $39m). The ATO considers the financial year 2018/19 Aggregated Turnover to be the best indicator of likely Aggregated Turnover for financial year 2019/20. As Aggregated Turnover for financial year 2018/19 was below $50m, the forecast tax rate for financial year 2019/20 is 27.5%. This forecast tax rate results in a franking rate of 27.5% for dividends paid during financial year 2019/20.
Whilst the forecast tax rate and franking rate is 27.5% for financial year 2019/20 (2018/19:27.5%), the actual tax rate for financial year 2019/20 will be determined by the Aggregated Turnover for financial year 2019/2020. In the event that this is greater than $50m the tax rate for financial year 2019/20 will be 30%.
g. Goods and Services Tax The GST incurred on the costs of various services provided to the Company by third parties such as custodial services and investment management fees have been passed onto the Company.
The Company qualifies for Reduced Input Tax Credits (RITC) at a rate of at least 55%, hence investment management fees, custodial fees and other expenses have been recognised in the statement of comprehensive income net of the amount of GST recoverable from the Australian Taxation Office (ATO). Accounts payable are inclusive of GST. The net amount of GST recoverable from the ATO is included in receivables in the statement of financial position.
Cash flows relating to GST are included in the statement of cash flows on a gross basis.
h.ProfitReserveThe profit reserve consists of amounts transferred from retained earnings that are preserved for future dividend payments.
i. Critical accounting estimates and judgementsThe Directors evaluate estimates and judgements incorporated into the financial report based on historical knowledge and best available current information. Estimates assume a reasonable expectation of future events and are based on current trends and economic data, obtained both externally and within the Company. For the majority of the financial instruments held by the Company, quoted market prices are readily available.
j. Rounding of amountsUnless otherwise shown in the financial statements, amounts have been rounded to the nearest thousand dollars and are shown in A$’000. Pengana International Equities Limited is a company of the kind referred to in ASIC Corporations (Rounding in Financial/Directors’ Reports) Instrument 2016/191.
ANNUAL REPORT 2019 | 29
For
per
sona
l use
onl
y

ANNUAL REPORT
NOTES TO THE FINANCIAL STATEMENTS (CONTINUED)NOTE 1: CORPORATE INFORMATION AND SUMMARY OF SIGNIFICANT ACCOUNTING POLICIES (CONTINUED)
k. New and amended standards adopted by the CompanyAASB 9 Financial Instruments (and applicable amendments) (effective from 1 July 2018)
AASB 9 Financial Instruments became effective for annual periods beginning on or after 1 January 2018. It addresses the classification, measurement and derecognition of financial assets and liabilities and replaces the multiple classification and measurement models in AASB 139.
Derivative and equity instruments are measured at fair value through profit or loss unless, for equity instruments not held for trading, an irrevocable option is taken to measure at fair value through other comprehensive income. AASB 9 also introduces a new expected credit loss (ECL) impairment model.
AASB 9 has been applied retrospectively by the Fund without the use of hindsight and it has determined that adoption did not result in a change to the classification or measurement of financial instruments in either the current or prior periods. The Fund has elected to restate the comparative period presented to comply with AASB 9. The Fund’s investment portfolio continues to be classified as fair value through profit or loss and other financial assets which are held for collection continue to be measured at amortised cost. There was no material impact on adoption from the application of the new impairment model.
AASB 15 Revenue from Contracts with Customers
AASB 15 Revenue from Contracts with Customers became effective for annual periods beginning on or after 1 January 2018.
The Company’s main sources of income are interest, dividends and distributions and gains on financial instruments at fair value. All of these are outside the scope of the new revenue standard. As a consequence, the adoption of AASB 15 did not have a significant impact on the Company’s accounting policies or the amounts recognised in the financial statements.
There are no other new standards, interpretations or amendments to existing standards that are effective for the first time for the financial year beginning 1 July 2018 that have a material impact on the Company.
l. New standards and interpretations not yet adoptedThere are no standards that are not yet effective and that are expected to have a material impact on the Company in the current or future reporting periods and on foreseeable future transactions.
m.ComparativefiguresComparative information has been reclassified where required for consistency with current year’s presentation.
NOTE 2: CHANGES IN FAIR VALUE OF INVESTMENTS 2019 2018 $’000 $’000
Change in the fair value of listed equities 24,771 37,022
Change in the fair value of derivative financial instruments (3,898) (2,581)
Total changes in the fair value of investments 20,873 34,441
30 | PENGANA INTERNATIONAL EQUITIES LIMITED
For
per
sona
l use
onl
y

NOTE 3: EXPENSES
a. Management feesIn accordance with the Investment Management Agreement between the Company and Pengana Investment Management Limited (the Investment Manager), the Investment Manager is entitled to a management fee based on the gross value of the investment portfolio, payable on a monthly basis.
The amounts paid and payable to the Investment Manager in accordance with the Investment Management Agreement were: 2019 2018 $’000 $’000
Management fees 3,706 4,053
b. Performance fees In accordance with the Investment Management Agreement between the Company and Pengana Investment Management Limited (the Investment Manager), the Investment Manager is entitled to a performance fee of 15% of any outperformance when the investment return of the portfolio outperforms the MSCI World Total Return Index, Net Dividends Reinvested in A$, subject to achievement of a high watermark. The method of calculating the fee is detailed in the Investment Management Agreement.
The amounts paid and payable to the Investment Manager in accordance with the Investment Management Agreement were:
Performance fee – 315
c. Auditor’s remuneration During the year the following fees were paid or payable by the Company for services provided by the auditor of the Company, Ernst & Young.
Ernst & Young
Audit and assurance services
Audit and review of financial statements 68 69
Other services – 7
Total remuneration for audit and other assurance services 68 76
Non-assurance services
Tax compliance services 7 7
Total remuneration for taxation services 7 7
Total remuneration of Ernst & Young 75 83
ANNUAL REPORT 2019 | 31
For
per
sona
l use
onl
y

ANNUAL REPORT
NOTES TO THE FINANCIAL STATEMENTS (CONTINUED)
NOTE 4: INCOME TAX EXPENSE 2019 2018 $’000 $’000
a. Income tax expense attributable for the year differs from the prima facie amountpayableontheoperatingprofit.Thedifferenceisreconciledasfollows:Profitbeforeincometaxexpense 22,150 33,560
Prima facie income tax expense on net profit at 27.5% (2018: 30%) (6,091) (10,068)
Adjustments to prior periods (286) (133)
Adjustment for the restating of the deferred tax balances at 27.5% – 341
Foreign withholding tax 934 814
Franking credits – 94
(5,443) (8,952)
b.Themajorcomponentsofincometaxexpenseare:Current income tax expense (3,109) (4,208)
Current tax adjustment for prior periods 23 (138)
Deferred income tax (2,357) (4,606)
(5,443) (8,952)
c.Deferredtaxliabilitiesrelatetothefollowing:Unrealised gains on investments (6,224) (3,977)
Other temporary differences – (32)
(6,224) (4,009)
d.Deferredtaxassetsrelatetothefollowing: Costs associated with the issue of shares 112 247
Other temporary differences 4 11
116 258
The Company’s Aggregated Turnover, as defined in the Treasury Laws Amendment (Enterprise Tax Plan) Bill 2017 for the year ended 30 June 2019 amounted to approximately $40m (2018: $39m). The ATO considers the financial year 2018/19 Aggregated Turnover to be the best indicator of likely Aggregated Turnover for financial year 2019/20. As Aggregated Turnover for financial year 2018/19 was below $50m, the forecast tax rate for financial year 2019/20 is 27.5%. This forecast tax rate results in a franking rate of 27.5% for dividends paid during financial year 2019/2020.
Whilst the forecast tax rate and franking rate is 27.5% for financial year 2019/20 (2018/19: 27.5%), the actual tax rate for financial year 2019/20 will be determined by the Aggregated Turnover for financial year 2019/20. In the event that this is greater than $50m the tax rate for financial year 2019/20 will be 30%.
32 | PENGANA INTERNATIONAL EQUITIES LIMITED
For
per
sona
l use
onl
y

NOTE 5: EARNINGS PER SHARE (EPS) 2019 2018 $’000 $’000
Net profit after tax used in the calculation of basic and diluted EPS 16,707 24,608
No. Shares No. Shares
Weighted average number of ordinary shares outstanding during the year used in calculation of basic EPS 251,827,656 245,197,921
Weighted average number of ordinary shares outstanding during the year used in calculation of diluted EPS 251,827,656 245,469,454
The basic and diluted earnings per share have been calculated using the profit attributable to the shareholders of the Company as the numerator.
NOTE 6: CASH AND CASH EQUIVALENTS
Cash at bank 19,089 25,690
Short-term deposits 15,000 15,540
34,089 41,230
NOTE 7: TRADE AND OTHER RECEIVABLES
Dividends receivable – 157
Interest receivable 63 21
Outstanding investment settlements receivable 4,081 894
GST receivable 50 80
Prepayments 31 15
Current tax receivable 831 1,069
Other receivables 9 20
Withholding tax reclaims receivable – 83
5,065 2,339
There are no past due or impaired receivables at reporting date. All trade receivables are expected to be received within 12 months of the reporting date.
NOTE 8: FINANCIAL ASSETS AT FAIR VALUE THROUGH PROFIT OR LOSS
Investments at fair value 275,825 267,537
Mark to market on forward foreign exchange hedging contracts – 311
Mark to market on options – 1,370
275,825 269,218
All investments held at 30 June 2019 were listed on recognised exchanges.
ANNUAL REPORT 2019 | 33
For
per
sona
l use
onl
y

ANNUAL REPORT
NOTES TO THE FINANCIAL STATEMENTS (CONTINUED)
NOTE 9: FINANCIAL LIABILITIES AT FAIR VALUE THROUGH PROFIT OR LOSS 2019 2018 $’000 $’000
Mark to market on forward foreign exchange hedging contracts – 1,103
– 1,103
NOTE 10: TRADE AND OTHER PAYABLES
Management fees payable 293 302
Outstanding investment settlements payable 928 6,377
Performance fees payable – 315
Reimbursable expenses – 13
Other expenses payable 81 88
1,302 7,095
All trade payables are expected to be settled within 12 months of the reporting date.
NOTE 11: ISSUED CAPITAL 2019 2018 No. shares No. shares
Issued ordinary shares at the beginning of the reporting period 247,448,622 244,204,945
Shares issued on options exercised 5,361,901 1,912,878
Dividends reinvested (DRP) 1,234,570 1,330,799
Issued ordinary shares at reporting date 254,045,093 247,448,622
2019 2018 $’000 $’000
Issued ordinary shares at the beginning of the reporting period 308,278 304,806
Options exercised net of expense incurred on option issue 6,320 1,955
Dividends reinvested (DRP) 1,399 1,517
Issued ordinary shares at reporting date 315,997 308,278
Ordinary shares entitle the holder to participate in dividends and the proceeds on the winding up of the Company in proportion to the number of and amounts paid on the shares held.
On a show of hands every member present at a meeting in person or by proxy shall have one vote and upon a poll each share shall have one vote. A reconciliation of the number of ordinary shares outstanding is shown in the table above.
34 | PENGANA INTERNATIONAL EQUITIES LIMITED
For
per
sona
l use
onl
y
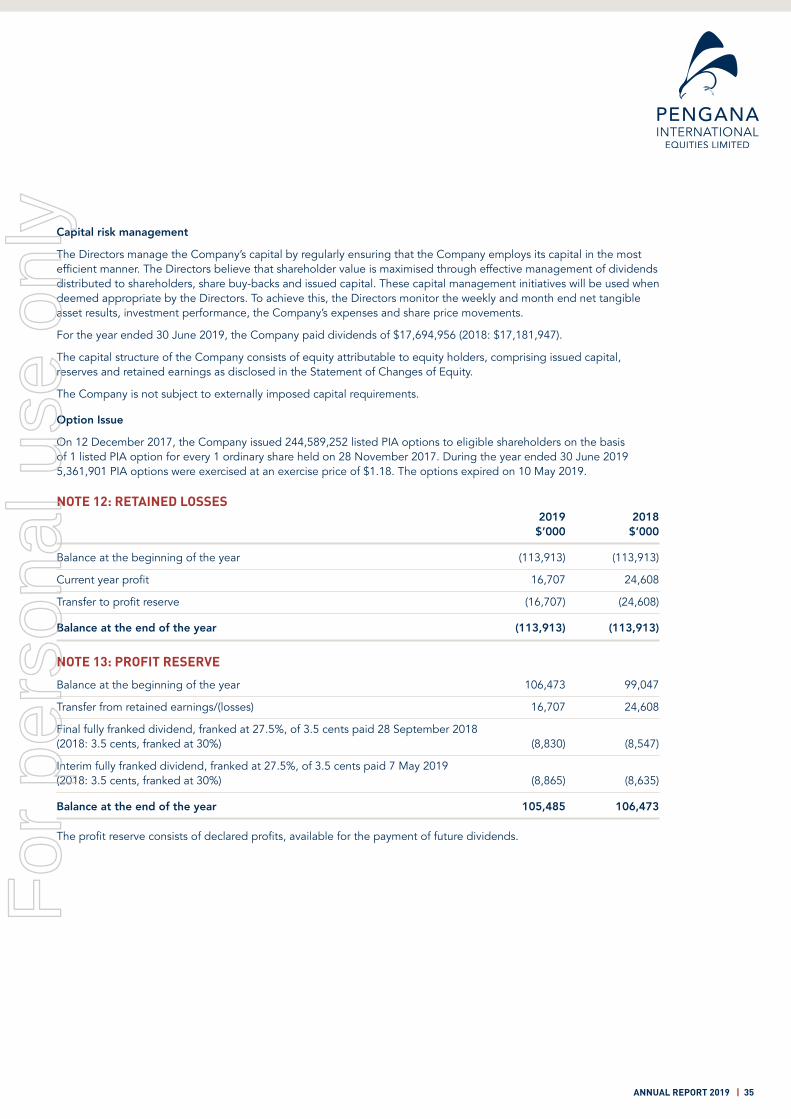
Capital risk management
The Directors manage the Company’s capital by regularly ensuring that the Company employs its capital in the most efficient manner. The Directors believe that shareholder value is maximised through effective management of dividends distributed to shareholders, share buy-backs and issued capital. These capital management initiatives will be used when deemed appropriate by the Directors. To achieve this, the Directors monitor the weekly and month end net tangible asset results, investment performance, the Company’s expenses and share price movements.
For the year ended 30 June 2019, the Company paid dividends of $17,694,956 (2018: $17,181,947).
The capital structure of the Company consists of equity attributable to equity holders, comprising issued capital, reserves and retained earnings as disclosed in the Statement of Changes of Equity.
The Company is not subject to externally imposed capital requirements.
Option Issue
On 12 December 2017, the Company issued 244,589,252 listed PIA options to eligible shareholders on the basis of 1 listed PIA option for every 1 ordinary share held on 28 November 2017. During the year ended 30 June 2019 5,361,901 PIA options were exercised at an exercise price of $1.18. The options expired on 10 May 2019.
NOTE 12: RETAINED LOSSES 2019 2018 $’000 $’000
Balance at the beginning of the year (113,913) (113,913)
Current year profit 16,707 24,608
Transfer to profit reserve (16,707) (24,608)
Balance at the end of the year (113,913) (113,913)
NOTE 13: PROFIT RESERVE
Balance at the beginning of the year 106,473 99,047
Transfer from retained earnings/(losses) 16,707 24,608
Final fully franked dividend, franked at 27.5%, of 3.5 cents paid 28 September 2018 (2018: 3.5 cents, franked at 30%) (8,830) (8,547)
Interim fully franked dividend, franked at 27.5%, of 3.5 cents paid 7 May 2019 (2018: 3.5 cents, franked at 30%) (8,865) (8,635)
Balance at the end of the year 105,485 106,473
The profit reserve consists of declared profits, available for the payment of future dividends.
ANNUAL REPORT 2019 | 35
For
per
sona
l use
onl
y

ANNUAL REPORT
NOTES TO THE FINANCIAL STATEMENTS (CONTINUED)
NOTE 14: DIVIDENDS 2019 2018 $’000 $’000
a. Dividends paidFinal fully franked dividend, franked at 27.5%, of 3.5 cents paid 28 September 2018 (2018: 3.5 cents, franked at 30%) 8,830 8,547
Interim fully franked dividend, franked at 27.5%, of 3.5 cents paid 7 May 2019 (2018: 3.5 cents, franked at 30%) 8,865 8,635
17,695 17,182
b. Dividend reinvestment planFinal fully franked dividend, franked at 27.5%, of 3.5 cents paid 28 September 2018 (2018: 3.5 cents, franked at 30%, reinvestment price: $1.17) (773) (759)
Interim fully franked dividend, franked at 27.5%, of 3.5 cents paid 7 May 2019 (2018: 3.5 cents, franked at 30%, reinvestment price $1.09) (626) (758)
(1,399) (1,517)
Net dividends paid in cash 16,296 15,665
c. Franking accountBalance at the beginning of the year 6,144 8,782
Franking credits on dividends received – 106
Franking credits from tax paid 2,836 4,621
Payment of interim fully franked dividend (3,362) (3,702)
Prior year final fully franked dividend (3,349) (3,663)
Franking account balance at year end 2,269 6,144
Payment of declared partially franked dividend 2,269 (3,349)
Frankingaccountbalancepostpaymentoffinaldividend – 2,795
On 26 August 2019 the Board declared a final dividend of 3.5 cents per share, of which 2.35 cents per share is franked at 27.5%, in line with the Company’s stated dividend policy. This brings the total dividend for the year to 30 June 2019 to 7 cents per share.
As at 30 June 2019, the $2.269m franking account balance post payment of final dividend is equivalent to a 2.35 cents per share fully franked dividend.
The Company’s ability to continue to pay franked dividends is dependent upon the receipt of franked dividends from investments and the payment of tax.
36 | PENGANA INTERNATIONAL EQUITIES LIMITED
For
per
sona
l use
onl
y

The Company’s Aggregated Turnover, as defined in the Treasury Laws Amendment (Enterprise Tax Plan) Bill 2017 for the year ended 30 June 2019 amounted to approximately $40m (2018: $39m). The ATO considers the financial year 2018/19 Aggregated Turnover to be the best indicator of likely Aggregated Turnover for financial year 2019/20. As Aggregated Turnover for financial year 2018/19 was below $50m, the forecast tax rate for financial year 2019/20 is 27.5%. This forecast tax rate results in a franking rate of 27.5% for dividends paid during financial year 2019/2020.
Whilst the forecast tax rate and franking rate is 27.5% for financial year 2019/20 (2018/19:27.5%), the actual tax rate for financial year 2019/20 will be determined by the Aggregated Turnover for financial year 20/20. In the event that this is greater than $50m the tax rate for financial year 2019/20 will be 30%.
NOTE 15: CASH FLOW INFORMATION 2019 2018 $’000 $’000
a.Reconciliationofnetcashflowfromoperatingactivities to netprofitafterincometax:Net profit after income tax 16,707 24,608
Change in fair value of investments and foreign cash held (20,873) (34,470)
Proceeds from sale of investments 413,421 399,579
Payments for purchase of investments (408,695) (364,944)
Change in prepayments (16) (11)
Change in other receivables 239 (127)
Change in other payables (317) 202
Net change in deferred tax assets/(deferred tax liabilities) 2,357 4,606
Change in income tax receivables 238 (276)
Reinvested dividend income (186) (360)
Netcashinflowfromoperatingactivities 2,875 28,807
b.Non-cashfinancingactivitiesIssue of shares under the dividend reinvestment plan (DRP) 1,399 1,517
1,399 1,517
ANNUAL REPORT 2019 | 37
For
per
sona
l use
onl
y

ANNUAL REPORT
NOTES TO THE FINANCIAL STATEMENTS (CONTINUED)
NOTE 16: FINANCIAL RISK MANAGEMENT
The Company holds the following financial instruments:
2019 2018 $’000 $’000
Financial assets
Cash and cash equivalents 19,089 25,690
Short-term deposits 15,000 15,540
Trade and other receivables 5,065 2,339
Investments at fair value 275,825 269,218
314,979 312,787
Financial liabilities
Trade and other payables 1,302 7,095
Investments at fair value – 1,103
1,302 8,198
From time to time, forward foreign exchange hedging contracts are used by the Company for risk management purposes. There is no gearing through the use of derivatives.
Financial risk exposures and managementThe main risks the Company is exposed to through its financial instruments are market risk and credit risk.
a. Market risk
i. Price riskThe Company is exposed to equity securities price risk arising from investments and exchange traded index options held by the Company and classified on the Statement of Financial Position as fair value through profit or loss of $275.8m (2018: $269.2m).
At reporting date, if the equity prices had been 10% lower/higher, profit or loss before income tax of the Company would have decreased/increased by $27.6m (2018:$26.8m). The analysis is performed on the same basis as for 2018.
The following investments constitute 5% or more of the Company’s equity portfolio:
Fair valueCompany $’000 % Business description
2019 Charter Communications Inc 16,197 5.9 Telecommunications
CME Group Inc 16,099 5.9 Financials
2018 Wacker Chemie AG 14,173 5.3 Materials
38 | PENGANA INTERNATIONAL EQUITIES LIMITED
For
per
sona
l use
onl
y
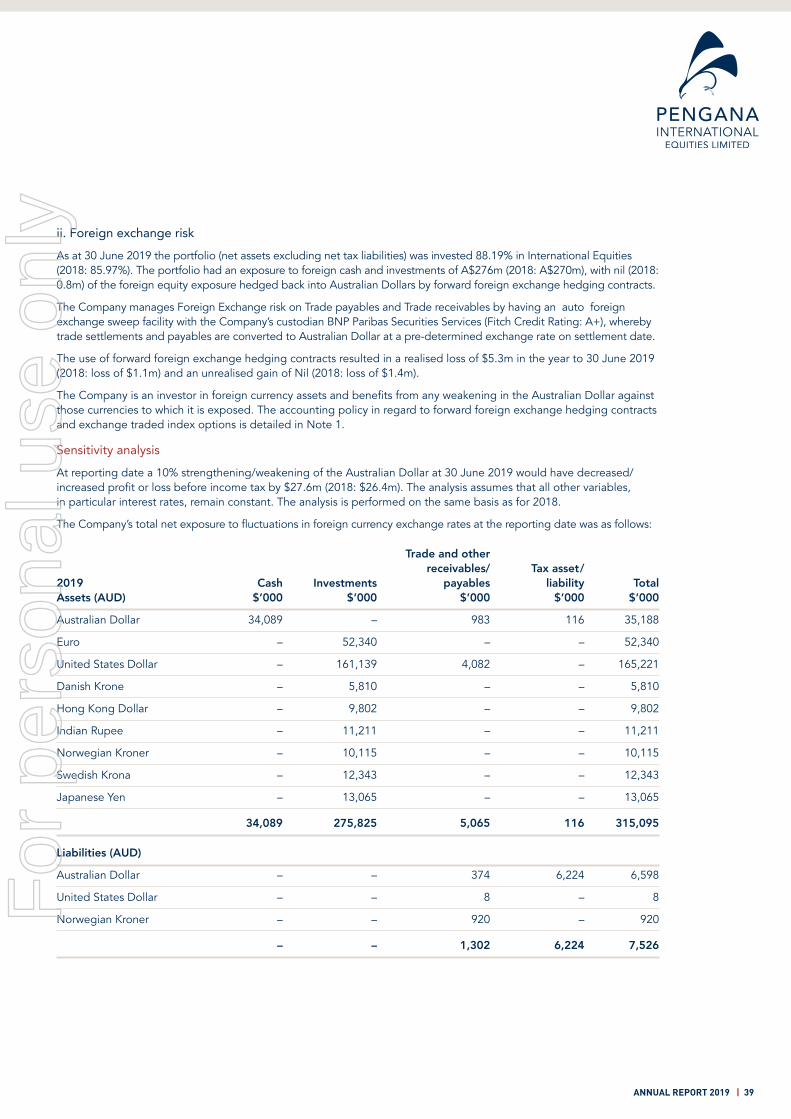
ii. Foreign exchange riskAs at 30 June 2019 the portfolio (net assets excluding net tax liabilities) was invested 88.19% in International Equities (2018: 85.97%). The portfolio had an exposure to foreign cash and investments of A$276m (2018: A$270m), with nil (2018: 0.8m) of the foreign equity exposure hedged back into Australian Dollars by forward foreign exchange hedging contracts.
The Company manages Foreign Exchange risk on Trade payables and Trade receivables by having an auto foreign exchange sweep facility with the Company’s custodian BNP Paribas Securities Services (Fitch Credit Rating: A+), whereby trade settlements and payables are converted to Australian Dollar at a pre-determined exchange rate on settlement date.
The use of forward foreign exchange hedging contracts resulted in a realised loss of $5.3m in the year to 30 June 2019 (2018: loss of $1.1m) and an unrealised gain of Nil (2018: loss of $1.4m).
The Company is an investor in foreign currency assets and benefits from any weakening in the Australian Dollar against those currencies to which it is exposed. The accounting policy in regard to forward foreign exchange hedging contracts and exchange traded index options is detailed in Note 1.
Sensitivity analysisAt reporting date a 10% strengthening/weakening of the Australian Dollar at 30 June 2019 would have decreased/increased profit or loss before income tax by $27.6m (2018: $26.4m). The analysis assumes that all other variables, in particular interest rates, remain constant. The analysis is performed on the same basis as for 2018.
The Company’s total net exposure to fluctuations in foreign currency exchange rates at the reporting date was as follows:
Trade and other receivables/ Taxasset/ 2019 Cash Investments payables liability TotalAssets (AUD) $’000 $’000 $’000 $’000 $’000
Australian Dollar 34,089 – 983 116 35,188
Euro – 52,340 – – 52,340
United States Dollar – 161,139 4,082 – 165,221
Danish Krone – 5,810 – – 5,810
Hong Kong Dollar – 9,802 – – 9,802
Indian Rupee – 11,211 – – 11,211
Norwegian Kroner – 10,115 – – 10,115
Swedish Krona – 12,343 – – 12,343
Japanese Yen – 13,065 – – 13,065
34,089 275,825 5,065 116 315,095
Liabilities (AUD)
Australian Dollar – – 374 6,224 6,598
United States Dollar – – 8 – 8
Norwegian Kroner – – 920 – 920
– – 1,302 6,224 7,526
ANNUAL REPORT 2019 | 39
For
per
sona
l use
onl
y

ANNUAL REPORT
NOTES TO THE FINANCIAL STATEMENTS (CONTINUED)NOTE 16: FINANCIAL RISK MANAGEMENT (CONTINUED)
Trade and other receivables/ Taxasset/ 2018 Cash Investments payables liability TotalAssets (AUD) $’000 $’000 $’000 $’000 $’000
Australian Dollar 40,063 – 1,289 258 41,610
Euro – 58,138 – – 58,138
British Pound – 25,596 – – 25,596
United States Dollar (8) 119,076 86 – 119,154
Danish Krone – 6,506 – – 6,506
Hong Kong Dollar 7 24,283 70 – 24,360
Indian Rupee 1 8,525 – – 8,526
Mexican Peso 7 1,658 894 – 2,559
Norwegian Kroner – 5,061 – – 5,061
Swedish Krona 1,160 20,375 – – 21,535
41,230 269,218 2,339 258 313,045
Liabilities (AUD)
Australian Dollar – – 719 4,009 4,728
Euro – – 889 – 889
British Pound – 70 1 – 71
United States Dollar – 1,029 937 – 1,966
Hong Kong Dollar – 4 1,778 – 1,782
Indian Rupee – – 466 – 466
Mexican Peso – – 3 – 3
Norwegian Kroner – – 146 – 146
Swedish Krona – – 2,156 – 2,156
– 1,103 7,095 4,009 12,207
iii. Interest rate riskThe main interest rate risk for the Company arises from its cash holdings. The Company’s exposure to interest rate risk is immaterial. 2019 2018Cash and cash equivalents $’000 $’000
Cash balance subject to floating interest rate 19,089 25,690
% %
Weighted average effective interest rate 2.11 1.43
40 | PENGANA INTERNATIONAL EQUITIES LIMITED
For
per
sona
l use
onl
y

Sensitivity analysisAt reporting date, if the interest rates had been 0.25% lower or higher profit or loss before income taxes of the Company would have (decreased)/increased by $0.5m (2018: $0.6m).
b. Credit riskThe Company measures credit risk and expected credit losses using probability of default, exposure at default and loss given default. Management consider both historical analysis and forward looking information in determining any expected credit loss. At 30 June 2019, trade and other receivables, cash and short-term deposits are held with counterparties with a credit rating of A-1or higher. Management consider the probability of default to be close to zero as these instruments have a low risk of default and the counterparties have a strong capacity to meet their contractual obligations in the near term. As such, no loss allowance is deemed to be necessary based on 12-month expected credit losses.
The Company manages credit risk associated with financial assets by only trading with reputable brokers and via established securities exchanges.
c. Liquidity riskBased on an assumption of trading 10% of the trailing three month daily volume 99.56% of the portfolio could be realised in one month (2018: 99.6%) and 99.9% of the portfolio in six months (2018: 99.9%).
MaturitiesoffinancialliabilitiesFinancial liabilities held by the Company include management fees payable to the Investment Manager, unsettled trades and other payables. The below table shows the maturities of financial liabilities held by the Company. Forward foreign exchange hedging contracts are also included below where any liability existed at reporting date. Forward foreign exchange hedging contracts are marked to market daily and are disclosed as financial assets or financial liabilities as the valuation requires. Further information on these instruments is in Note 16(a).
Less than 1 to 3 3 to 6 6 to 12 2019 1month months months months TotalFinancial liabilities $’000 $’000 $’000 $’000 $’000
Due to brokers 928 – – – 928
Other payables 412 – – – 412
Total 1,340 – – – 1,340
Less than 1 to 3 3 to 6 6 to 12 2018 1month months months months TotalFinancial liabilities $’000 $’000 $’000 $’000 $’000
Due to brokers 6,377 – – – 6,377
Other payables 718 – – – 718
Financial liabilities at fair value through profit or loss 1,103 – – – 1,103
Total 8,198 – – – 8,198
ANNUAL REPORT 2019 | 41
For
per
sona
l use
onl
y

ANNUAL REPORT
NOTES TO THE FINANCIAL STATEMENTS (CONTINUED)NOTE 16: FINANCIAL RISK MANAGEMENT (CONTINUED)
d. Net fair valuesThe following table provides an analysis of financial instruments as at reporting date that are measured subsequent to initial recognition at fair value, grouped into Levels 1 to 3 based on the degree to which fair value is observable.
• Level 1 fair value measurements are those derived from quoted prices (unadjusted) in active markets for identical assets and liabilities.
• Level 2 fair value measurements are those derived from inputs other than quoted prices included within Level 1 that are observable for the asset or liability, either directly (i.e. as prices) or indirectly (i.e. derived from prices).
• Level 3 fair value measurement are those derived from valuation techniques that include inputs for the asset or liability that are not based on observable market data (unobservable inputs).
Fair value of financial assets such as listed investments at fair value and exchange traded index options that are traded in active markets are based on quoted close prices.
Fair value of forward foreign exchange hedging contracts is calculated by reference to current forward exchange rates for contracts with similar maturity profiles.
There has been no transfer between levels from the previous reporting period.
2019 Level 1 Level 2 Level 3 TotalFinancial assets $’000 $’000 $’000 $’000
Listed investments at fair value 275,825 – – 275,825
Total 275,825 – – 275,825
2018 Level 1 Level 2 Level 3 TotalFinancial assets $’000 $’000 $’000 $’000
Listed investments at fair value 267,537 – – 267,537
Exchange traded index options 1,370 – – 1,370
Forward foreign exchange hedging contracts – 311 – 311
Total 268,907 311 – 269,218
Financial liabilities
Forward foreign exchange hedging contracts – 1,103 – 1,103
Total – 1,103 – 1,103
The carrying amount of cash, trade and other receivables and trade and other payables approximate their fair values.
42 | PENGANA INTERNATIONAL EQUITIES LIMITED
For
per
sona
l use
onl
y
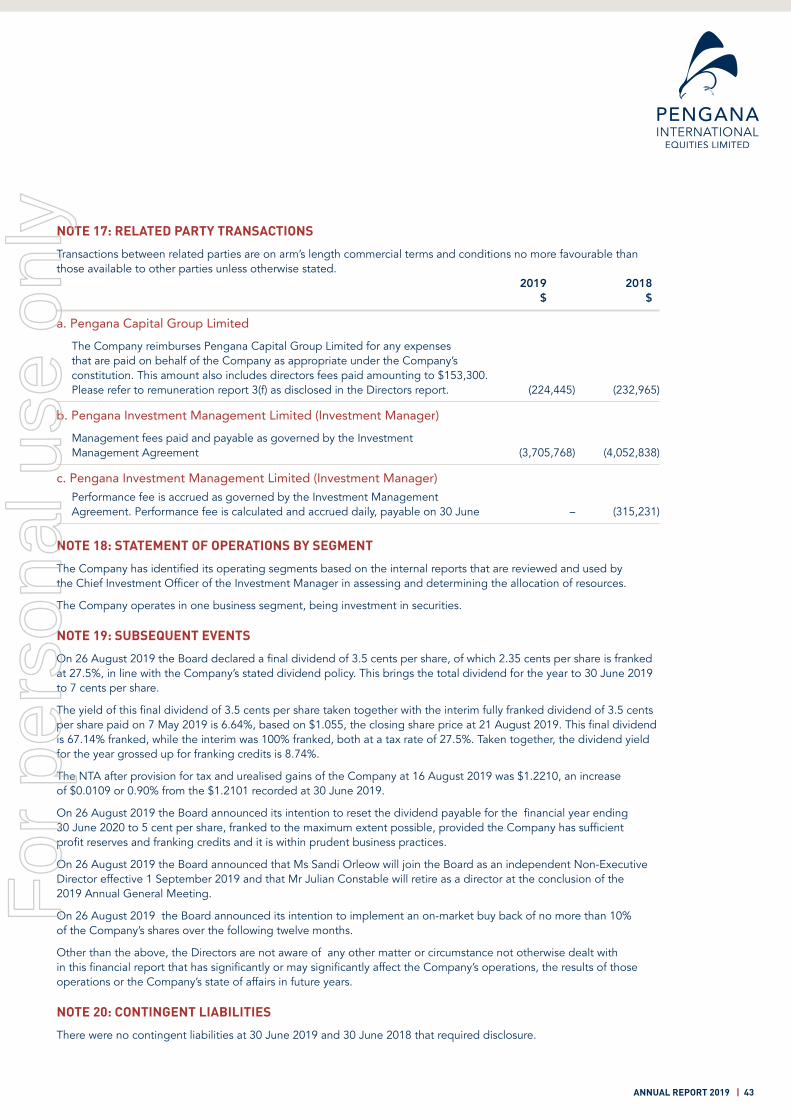
NOTE 17: RELATED PARTY TRANSACTIONS
Transactions between related parties are on arm’s length commercial terms and conditions no more favourable than those available to other parties unless otherwise stated. 2019 2018 $ $
a. Pengana Capital Group Limited The Company reimburses Pengana Capital Group Limited for any expenses
that are paid on behalf of the Company as appropriate under the Company’s constitution. This amount also includes directors fees paid amounting to $153,300. Please refer to remuneration report 3(f) as disclosed in the Directors report. (224,445) (232,965)
b. Pengana Investment Management Limited (Investment Manager) Management fees paid and payable as governed by the Investment
Management Agreement (3,705,768) (4,052,838)
c. Pengana Investment Management Limited (Investment Manager) Performance fee is accrued as governed by the Investment Management
Agreement. Performance fee is calculated and accrued daily, payable on 30 June – (315,231)
NOTE 18: STATEMENT OF OPERATIONS BY SEGMENT
The Company has identified its operating segments based on the internal reports that are reviewed and used by the Chief Investment Officer of the Investment Manager in assessing and determining the allocation of resources.
The Company operates in one business segment, being investment in securities.
NOTE 19: SUBSEQUENT EVENTS
On 26 August 2019 the Board declared a final dividend of 3.5 cents per share, of which 2.35 cents per share is franked at 27.5%, in line with the Company’s stated dividend policy. This brings the total dividend for the year to 30 June 2019 to 7 cents per share.
The yield of this final dividend of 3.5 cents per share taken together with the interim fully franked dividend of 3.5 cents per share paid on 7 May 2019 is 6.64%, based on $1.055, the closing share price at 21 August 2019. This final dividend is 67.14% franked, while the interim was 100% franked, both at a tax rate of 27.5%. Taken together, the dividend yield for the year grossed up for franking credits is 8.74%.
The NTA after provision for tax and urealised gains of the Company at 16 August 2019 was $1.2210, an increase of $0.0109 or 0.90% from the $1.2101 recorded at 30 June 2019.
On 26 August 2019 the Board announced its intention to reset the dividend payable for the financial year ending 30 June 2020 to 5 cent per share, franked to the maximum extent possible, provided the Company has sufficient profit reserves and franking credits and it is within prudent business practices.
On 26 August 2019 the Board announced that Ms Sandi Orleow will join the Board as an independent Non-Executive Director effective 1 September 2019 and that Mr Julian Constable will retire as a director at the conclusion of the 2019 Annual General Meeting.
On 26 August 2019 the Board announced its intention to implement an on-market buy back of no more than 10% of the Company’s shares over the following twelve months.
Other than the above, the Directors are not aware of any other matter or circumstance not otherwise dealt with in this financial report that has significantly or may significantly affect the Company’s operations, the results of those operations or the Company’s state of affairs in future years.
NOTE 20: CONTINGENT LIABILITIES
There were no contingent liabilities at 30 June 2019 and 30 June 2018 that required disclosure.
ANNUAL REPORT 2019 | 43
For
per
sona
l use
onl
y

ANNUAL REPORT
DIRECTORS’ DECLARATION
In accordance with a resolution of the Directors of Pengana International Equities Limited, I state that:
In the opinion of the directors of the Company:
a) the financial statements and notes of Pengana International Equities Limited for the financial year ended 30 June 2019 are in accordance with the Corporations Act 2001, including:
• giving a true and fair view of the Company’s financial position as at 30 June 2019 and of its performance for the year ended on that date; and
• complying with Australian Accounting Standards and the Corporations Regulations 2001; and
b) the financial statements and notes also comply with International Financial Reporting Standards as disclosed in Note 1; and
c) there are reasonable grounds to believe that the Company will be able to pay its debts as and when they become due and payable.
This declaration has been made after receiving the declarations required to be made to the directors by the Chief Executive Officer and Chief Financial Officer of the Investment Manager in accordance with section 295A of the Corporations Act 2001 for the financial year ended 30 June 2019.
On behalf of the Board,
Frank Gooch Chairman Sydney 26 August 2019
44 | PENGANA INTERNATIONAL EQUITIES LIMITED
For
per
sona
l use
onl
y

INDEPENDENT AUDITOR’S REPORT
33 A member firm of Ernst & Young Global Limited Liability limited by a scheme approved under Professional Standards Legislation
Ernst & Young 200 George Street Sydney NSW 2000 Australia GPO Box 2646 Sydney NSW 2001
Tel: +61 2 9248 5555 Fax: +61 2 9248 5959 ey.com/au
Independent Auditor’s Report to the members of Pengana International Equities Limited Report on the Audit of the Financial Report Opinion
We have audited the financial report of Pengana International Equities Limited (the Company), which comprises the statement of financial position as at 30 June 2019, the statement of profit or loss and other comprehensive income, statement of changes in equity and statement of cash flows for the year then ended, notes to the financial statements, including a summary of significant accounting policies, and the Directors’ declaration. In our opinion, the accompanying financial report of Pengana International Equities Limited is in accordance with the Corporations Act 2001, including: (i) giving a true and fair view of the Company’s financial position as at 30 June 2019 and of its
financial performance for the year ended on that date; and
(ii) complying with Australian Accounting Standards and the Corporations Regulations 2001.
Basis for Opinion
We conducted our audit in accordance with Australian Auditing Standards. Our responsibilities under those standards are further described in the Auditor’s Responsibilities for the Audit of the Financial Report section of our report. We are independent of the Company in accordance with the auditor independence requirements of the Corporations Act 2001 and the ethical requirements of the Accounting Professional and Ethical Standards Board’s APES110 Code of Ethics for Professional Accountants (the Code) that are relevant to our audit of the financial report in Australia. We have also fulfilled our other ethical responsibilities in accordance with the Code. We believe that the audit evidence we have obtained is sufficient and appropriate to provide a basis for our opinion. Key Audit Matters
Key audit matters are those matters that, in our professional judgment, were of most significance in our audit of the financial report of the current year. These matters were addressed in the context of our audit of the financial report as a whole, and in forming our opinion thereon, but we do not provide a separate opinion on these matters. For each matter below, our description of how our audit addressed the matter is provided in that context. We have fulfilled the responsibilities described in the Auditor’s Responsibilities for the Audit of the Financial Report section of our report, including in relation to these matters. Accordingly, our audit included the performance of procedures designed to respond to our assessment of the risks of material misstatement of the financial report. The results of our audit procedures, including the procedures performed to address the matters below, provide the basis for our audit opinion on the accompanying financial report.
ANNUAL REPORT 2019 | 45
For
per
sona
l use
onl
y

ANNUAL REPORT
INDEPENDENT AUDITOR’S REPORT (CONTINUED)
34 A member firm of Ernst & Young Global Limited Liability limited by a scheme approved under Professional Standards Legislation
1. Investment existence and valuation
Why significant How our audit addressed the key audit matter
The Company has a significant investment portfolio consisting primarily of listed equities. As at 30 June 2019, the value of these listed equities, was $275,825,000 which equates to 88% of the total assets of the Company.
As detailed in the Company’s accounting policy described in Note 1d of the financial report, these financial assets are recognised at fair value through profit or loss in accordance with Australian Accounting Standards.
Pricing, exchange rates and other market drivers can have a significant impact on the value of these financial assets and the financial report. Accordingly, valuation of the investment portfolio was considered a key audit matter.
We assessed the effectiveness of the controls relating to the recognition and valuation of investments.
We obtained and considered the assurance report on the controls of the Company’s administrator in relation to Fund Administration Services for the year ended 30 June 2019 and considered the auditor’s qualifications and objectivity and results of their procedures.
We agreed all investment holdings, including cash accounts, to third party confirmations at 30 June 2019.
We assessed the fair value of all investments in the portfolio held at 30 June 2019 to independently sourced market prices.
We assessed the adequacy of the disclosures in Note 16 of the financial report in accordance with the requirements of Australian Accounting Standards.
2. Management and Performance Fees
Why significant How our audit addressed the key audit matter
Management fees paid to the service provider, Pengana Investment Management Limited, are the most significant operating expense for the Company.
The Company’s accounting policy for management and performance fees is described in Note 3 to the financial report. Performance fees are recognised in the financial report if the performance hurdles for the Company have been met at the end of the relevant measurement period, which is the date that the performance criteria is met and the liability has been crystallised.
As at 30 June 2019, management fees totalled $3,705,768 which equates to 69% of total expenses. Of this amount, performance fees totalled $nil.
The quantum of these expenses and the impact that market volatility can have on the recognition of performance fees, resulted in this being a key audit
We assessed the effectiveness of the controls in relation to the calculation of management and performance fees at the service provider responsible for the calculation.
We recalculated management fees, in accordance with the relevant Services agreement, including agreeing the fee rate to the calculation.
We assessed the performance fee calculation, including testing the inputs into the calculation model and assessed whether the calculation was in line with the relevant Services agreement.
We also assessed whether the criteria for accrual of a performance fee liability were met at 30 June 2019.
46 | PENGANA INTERNATIONAL EQUITIES LIMITED
For
per
sona
l use
onl
y

35 A member firm of Ernst & Young Global Limited Liability limited by a scheme approved under Professional Standards Legislation
Why significant How our audit addressed the key audit matter
matter. The disclosure of these amounts is included in Note 3 to the financial report.
We assessed the adequacy of the disclosures in Note 3 of the financial report.
Information Other than the Financial Report and Auditor’s Report
The Directors are responsible for the other information. The other information comprises the information included in Company’s 2019 Annual Report, but does not include the financial report and our auditor’s report thereon.
Our opinion on the financial report does not cover the other information and accordingly we do not express any form of assurance conclusion thereon.
In connection with our audit of the financial report, our responsibility is to read the other information and, in doing so, consider whether the other information is materially inconsistent with the financial report or our knowledge obtained in the audit or otherwise appears to be materially misstated.
If, based on the work we have performed, we conclude that there is a material misstatement of this other information, we are required to report that fact. We have nothing to report in this regard.
Responsibilities of the Directors for the Financial Report
The Directors of the Company are responsible for the preparation of the financial report that gives a true and fair view in accordance with Australian Accounting Standards and the Corporations Act 2001 and for such internal control as the Directors determine is necessary to enable the preparation of the financial report that gives a true and fair view and is free from material misstatement, whether due to fraud or error. In preparing the financial report, the Directors are responsible for assessing the Company’s ability to continue as a going concern, disclosing, as applicable, matters relating to going concern and using the going concern basis of accounting unless the Directors either intend to liquidate the Company or cease operations, or have no realistic alternative but to do so. Auditor’s Responsibilities for the Audit of the Financial Report
Our objectives are to obtain reasonable assurance about whether the financial report as a whole is free from material misstatement, whether due to fraud or error, and to issue an auditor’s report that includes our opinion. Reasonable assurance is a high level of assurance, but is not a guarantee that an audit conducted in accordance with the Australian Auditing Standards will always detect a material misstatement when it exists. Misstatements can arise from fraud or error and are considered material if, individually or in the aggregate, they could reasonably be expected to influence the economic decisions of users taken on the basis of this financial report.
ANNUAL REPORT 2019 | 47
For
per
sona
l use
onl
y
ANNUAL REPORT
INDEPENDENT AUDITOR’S REPORT (CONTINUED)
36 A member firm of Ernst & Young Global Limited Liability limited by a scheme approved under Professional Standards Legislation
As part of an audit in accordance with the Australian Auditing Standards, we exercise professional judgment and maintain professional scepticism throughout the audit. We also: • Identify and assess the risks of material misstatement of the financial report, whether due to fraud or
error, design and perform audit procedures responsive to those risks, and obtain audit evidence that is sufficient and appropriate to provide a basis for our opinion. The risk of not detecting a material misstatement resulting from fraud is higher than for one resulting from error, as fraud may involve collusion, forgery, intentional omissions, misrepresentations, or the override of internal control.
• Obtain an understanding of internal control relevant to the audit in order to design audit procedures
that are appropriate in the circumstances, but not for the purpose of expressing an opinion on the effectiveness of the Company’s internal control.
• Evaluate the appropriateness of accounting policies used and the reasonableness of accounting
estimates and related disclosures made by the Directors.
• Conclude on the appropriateness of the directors’ use of the going concern basis of accounting and, based on the audit evidence obtained, whether a material uncertainty exists related to events or conditions that may cast significant doubt on the Company’s ability to continue as a going concern. If we conclude that a material uncertainty exists, we are required to draw attention in our auditor’s report to the related disclosures in the financial report or, if such disclosures are inadequate, to modify our opinion. Our conclusions are based on the audit evidence obtained up to the date of our auditor’s report. However, future events or conditions may cause the Company to cease to continue as a going concern.
• Evaluate the overall presentation, structure and content of the financial report, including the
disclosures, and whether the financial report represents the underlying transactions and events in a manner that achieves fair presentation.
We communicate with the Directors regarding, among other matters, the planned scope and timing of the audit and significant audit findings, including any significant deficiencies in internal control that we identify during our audit. We also provide the Directors with a statement that we have complied with relevant ethical requirements regarding independence, and to communicate with them all relationships and other matters that may reasonably be thought to bear on our independence, and where applicable, related safeguards. From the matters communicated to the Directors, we determine those matters that were of most significance in the audit of the financial report of the current year and are therefore the key audit matters. We describe these matters in our auditor’s report unless law or regulation precludes public disclosure about the matter or when, in extremely rare circumstances, we determine that a matter should not be communicated in our report because the adverse consequences of doing so would reasonably be expected to outweigh the public interest benefits of such communication.
48 | PENGANA INTERNATIONAL EQUITIES LIMITED
For
per
sona
l use
onl
y
37 A member firm of Ernst & Young Global Limited Liability limited by a scheme approved under Professional Standards Legislation
Report on the Audit of the Remuneration Report Opinion on the Remuneration Report
We have audited the Remuneration Report included in pages 9 to 10 of the Directors' Report for the year ended 30 June 2019. In our opinion, the Remuneration Report of Pengana International Equities Limited for the year ended 30 June 2019, complies with section 300A of the Corporations Act 2001. Responsibilities
The Directors of the Company are responsible for the preparation and presentation of the Remuneration Report in accordance with section 300A of the Corporations Act 2001. Our responsibility is to express an opinion on the Remuneration Report, based on our audit conducted in accordance with Australian Auditing Standards.
Ernst & Young
Graeme McKenzie Partner Sydney 26 August 2019
34 A member firm of Ernst & Young Global Limited Liability limited by a scheme approved under Professional Standards Legislation
1. Investment existence and valuation
Why significant How our audit addressed the key audit matter
The Company has a significant investment portfolio consisting primarily of listed equities. As at 30 June 2019, the value of these listed equities, was $275,825,000 which equates to 88% of the total assets of the Company.
As detailed in the Company’s accounting policy described in Note 1d of the financial report, these financial assets are recognised at fair value through profit or loss in accordance with Australian Accounting Standards.
Pricing, exchange rates and other market drivers can have a significant impact on the value of these financial assets and the financial report. Accordingly, valuation of the investment portfolio was considered a key audit matter.
We assessed the effectiveness of the controls relating to the recognition and valuation of investments.
We obtained and considered the assurance report on the controls of the Company’s administrator in relation to Fund Administration Services for the year ended 30 June 2019 and considered the auditor’s qualifications and objectivity and results of their procedures.
We agreed all investment holdings, including cash accounts, to third party confirmations at 30 June 2019.
We assessed the fair value of all investments in the portfolio held at 30 June 2019 to independently sourced market prices.
We assessed the adequacy of the disclosures in Note 16 of the financial report in accordance with the requirements of Australian Accounting Standards.
2. Management and Performance Fees
Why significant How our audit addressed the key audit matter
Management fees paid to the service provider, Pengana Investment Management Limited, are the most significant operating expense for the Company.
The Company’s accounting policy for management and performance fees is described in Note 3 to the financial report. Performance fees are recognised in the financial report if the performance hurdles for the Company have been met at the end of the relevant measurement period, which is the date that the performance criteria is met and the liability has been crystallised.
As at 30 June 2019, management fees totalled $3,705,768 which equates to 69% of total expenses. Of this amount, performance fees totalled $nil.
The quantum of these expenses and the impact that market volatility can have on the recognition of performance fees, resulted in this being a key audit
We assessed the effectiveness of the controls in relation to the calculation of management and performance fees at the service provider responsible for the calculation.
We recalculated management fees, in accordance with the relevant Services agreement, including agreeing the fee rate to the calculation.
We assessed the performance fee calculation, including testing the inputs into the calculation model and assessed whether the calculation was in line with the relevant Services agreement.
We also assessed whether the criteria for accrual of a performance fee liability were met at 30 June 2019.
ANNUAL REPORT 2019 | 49
For
per
sona
l use
onl
y

ANNUAL REPORT
ASX INFORMATION
The shareholder information set out below was applicable as at 16 August 2019:
DISTRIBUTION OF SHAREHOLDERSAnalysis of number of equitable security holders by size of holding: Number of Number of Range shareholders ordinary shares
1–1,000 377 157,685
1,001–5,000 1,143 3,896,241
5,001–10,000 1,356 11,113,240
10,001–100,000 3,906 121,217,425
100,001 and over 257 117,660,502
Total 7,039 254,045,093
Range Holders
Holders holding less than a marketable parcel 210
SUBSTANTIAL SHAREHOLDERSThe following shareholders have notified the Company that they are the substantial shareholders:
Number of % of total issued ordinary shares ordinary shares
Washington H. Soul Pattinson and Company Limited 30,734,274 12.62
Wilson Asset Management Group 27,825,087 11.00
50 | PENGANA INTERNATIONAL EQUITIES LIMITED
For
per
sona
l use
onl
y

20 LARGEST SHAREHOLDERS – ORDINARY SHARES Number of % of total issued ordinary shares ordinary shares
HSBC Custody Nominees (Australia) Limited 29,716,500 11.70
Washington H Soul Pattinson and Company Limited 16,932,474 6.67
Washington H Soul Pattinson and Company Limited 7,438,106 2.93
Pengana Capital Ltd 3,454,815 1.36
Pengana Investment Management Limited (Hunter Hall Inv Mgmt Ltd A/C) 2,042,720 0.80
Halcycon Pty Ltd 1,705,000 0.67
BNP Paribas Nominees Pty Ltd HUB24 Custodial Serv Ltd Drp 1,492,031 0.59
Pengana Investment Management Ltd 1,412,095 0.56
Karru Bay Pty Ltd (Leggett Unit A/C) 1,200,000 0.47
Mr Orlando Berardino Di Iulio + Ms Catharina Maria Koopman 1,000,000 0.39
Netwealth Investments Limited (Wrap Services A/C) 973,871 0.38
Mr Anthony John Simmonds + Mrs Maureen Simmonds (AJ & M Simmonds Partner A/C) 973,373 0.38
Netwealth Investments Limited (Super Services A/C) 784,611 0.31
Nulis Nominees (Australia) Limited (Navigator Mast Plan Sett A/C) 732,457 0.29
Mrs Jean Thyne Hadges 643,095 0.25
Mr Francis Maxwell Hooper 579,000 0.23
Di Iulio Homes Pty Limited (Di Iulio Super Fund A/C) 550,000 0.22
Ashmore Investments Pty Ltd 513,330 0.20
Navigator Australia Ltd (MLC Investment Sett A/C) 505,445 0.20
Gem Investments Pty Ltd 502,657 0.20
As at 16 August 2019 there were 7,039 shareholders.
ANNUAL REPORT 2019 | 51
For
per
sona
l use
onl
y

ANNUAL REPORT
ASX INFORMATION (CONTINUED)
VOTING RIGHTS
Subject to the Company’s constitution:
• At meetings of shareholders, each shareholder is entitled to vote in person, by proxy, by attorney or by representative;
• On a show of hands, each shareholder present in person, by proxy, by attorney or by representative is entitled to one vote;
• On a poll, each shareholder present in person, by proxy, by attorney or by representative is entitled to one vote for every share held by the shareholder.
In the case of joint holdings, only one joint holder may vote.
VOTING BY PROXY
Shareholders may appoint a proxy or attorney to represent them at a shareholder meeting. If a proxy is appointed and the shareholder attends the meeting then that proxy is automatically revoked.
A corporate shareholder may appoint a proxy, an attorney or a corporate representative.
DIVIDEND PAYMENTS
The Company offers shareholders the following choices of how dividend entitlements can be received:
• Cash – a cheque is mailed to the shareholder’s registered address
• Direct Credit Deposit – the dividend is paid directly to the nominated bank account. Direct credits avoid delay in postal delivery and the possibility of lost cheques and are therefore a preferred option.
TRANSACTIONS IN SECURITIES 30 June 2019 30 June 2018
Total number of transactions in securities during the year 715 1,007
Total brokerage paid or accrued during the year 824,394 1,227,323
52 | PENGANA INTERNATIONAL EQUITIES LIMITED
For
per
sona
l use
onl
y

PORTFOLIO HOLDINGS 30 JUNE 2019 Main country of Company Business description economic activity
Agilent Technologies Pharmaceuticals, Biotechnology & Life Sciences United States
Alibaba Group Internet & Direct Marketing Retail China
Alphabet Inc Interactive Media & Services United States
American Express Consumer Finance United States
Aon Insurance United Kingdom
Asml Holdings Semiconductor Equipment Netherlands
Atlas Copco Industrial Machinery Sweden
Bharti Infratel Integrated Telecommunication Services India
Booking Holdings Inc Internet & Direct Marketing Retail United States
CBS Corp Broadcasting United States
Charter Communications Inc Cable & Satellite United States
Cigna Corp Health Care Services United States
CME Group Financial Exchanges & Data United States
Corticeira Amorim Forest Products Portugal
Deutsche Boerse Financial Exchanges & Data Germany
Dollar General General Merchandise Stores United States
Epiroc Construction Machinery & Heavy Trucks Sweden
Flow Traders Investment Banking & Brokerage Netherlands
Howard Hughes Real Estate Development United States
IAA Inc Automotive Wholesalers United States
Interactive Brokers Investment Banking & Brokerage United States
Intercontinental Exchange Financial Exchanges & Data United States
KAR Auction Services Diversified Support Services United States
Lumentum Communications Equipment United States
Medtronic Health Care Equipment Ireland
Merck Group Pharmaceuticals Germany
Microsoft Systems Software United States
Mowi ASA Packaged Foods & Meats Norway
Novo Nordisk Pharmaceuticals Denmark
Rakuten Inc Internet & Direct Marketing Retail Japan
Sligro Food Group Food Distributors Netherlands
Tencent Holdings Interactive Media & Services China
TomTom Consumer Electronics Netherlands
Uber Technologies Inc Internet Based Services United States
UnitedHealth Group Inc Managed Health Care United States
Virtu Financial Inc Investment Banking & Brokerage United States
Wacker Chemie Specialty Chemicals Germany
ANNUAL REPORT 2019 | 53
For
per
sona
l use
onl
y

ANNUAL REPORT
ASX INFORMATION (CONTINUED)
PRINCIPAL REGISTERED ADDRESS OF THE COMPANYThe principal registered office is Level 12, 167 Macquarie Street, Sydney, NSW 2000 Australia. Telephone (02) 8524 9900.
REGISTRYComputershare Investor Services Pty Limited, Level 3, 60 Carrington Street, Sydney NSW 2000. Investor Enquiries 02 8216 5700.
STOCK EXCHANGE LISTINGQuotation has been granted for all the ordinary shares of the Company on all Member Exchanges of the Australian Securities Exchange Limited (“ASX”). The Company shares are traded under the symbol PIA. Details of trading activity are published in most daily newspapers and also obtainable from the ASX website: www.asx.com.au.
INVESTMENT MANAGEMENT AGREEMENTThe Company has appointed Pengana Investment Management Limited (the Manager), under an Investment Management Agreement dated 29 January 2004, to manage the investment portfolio of the Company. The Manager manages and supervises all investments of the Company, including providing monthly valuations, for the term of the contract.
TERMThe Investment Management Agreement is for an initial period of 25 years commencing on the date the Company listed on the ASX (March 2004), unless terminated earlier in accordance with terms of the Investment Management Agreement.
POWERS OF MANAGERFor the purpose of carrying out its functions and duties under the Investment Management Agreement, the Manager has the powers of a natural person and absolute and unfettered discretion to manage the investment portfolio and to do all things and execute all documents necessary for the purpose of managing the investment portfolio.
MANAGEMENT FEEIn return for the performance of its duties as Manager of the Company’s investment portfolio, the Manager is entitled to a management fee of 1.2% per annum of the gross value of the investment portfolio, payable on a monthly basis.
PERFORMANCE FEEThe Manager is also entitled to a Performance Fee, equal to 15% of any out-performance of the investment portfolio compared to its benchmark the MSCI World Accumulation Net Return Index in Australian Dollars. The fee is aggregated daily and paid annually, subject to the following:
i) if the aggregate Performance Fee for a Financial Year (including any amounts accrued from a previous year) is a positive amount but the Investment Return of the investment portfolio is not greater than zero, then that Performance Fee shall be carried forward (as an accrual) to the following Financial Year,
ii) if the aggregate Performance Fee for a Financial Year (including any positive or negative amount carried forward from the previous year) is a positive amount but the payment of the accrued Performance Fee would cause the adjusted Investment Return of the investment portfolio for the year to be negative, that portion of the Performance Fee that would cause the Investment Return of the investment portfolio to be negative shall be carried forward (as an accrual) to the following Financial Year,
iii) if the aggregate Performance Fee for a Financial Year is a negative amount, no Performance Fees shall be payable to the Manager in respect of that Financial Year, and the negative amount shall be added to the Performance Fee of the succeeding year.
REIMBURSEMENT OF EXPENSESThe Company must reimburse to the Manager, in addition to its remuneration and rights of indemnification or reimbursement conferred under any other provision of the Investment Management Agreement or by law, all charges and expenses reasonably and properly incurred by the Manager in respect of the Company.
54 | PENGANA INTERNATIONAL EQUITIES LIMITED
For
per
sona
l use
onl
y

CORPORATE DIRECTORY
DIRECTORS
Francis Gooch Non-Executive Director and Chairman
Julian Constable Non-Executive Director
David Groves Non-Executive Director
Russel Pillemer Managing Director
PRINCIPAL AND Pengana International Equities Limited REGISTERED OFFICE Level 12, 167 Macquarie Street Sydney NSW 2000 Australia
Tel: +61 2 8524 9900 Fax: +61 2 8524 9901 Email: [email protected] Website: www.pengana.com/pia
AUDITOR Ernst & Young 200 George Street Sydney NSW 2000 Australia
SHARE REGISTER Computershare Investor Services Pty Limited Level 3, 60 Carrington St Sydney NSW 2000 Australia Tel: (61 2) 8234 5000 Website: www.computershare.com/au
COMPANY SECRETARY Paula FerraoFor
per
sona
l use
onl
y

PENGANA INTERNATIONAL EQUITIES LIMITED ACN 107 462 966
Level 12, 167 Macquarie Street, Sydney, NSW 2000
T: +61 2 8524 9900 F: +61 2 8524 9901
PENGANA.COM/PIA
For
per
sona
l use
onl
y