Penetration Depth Measurement of Near-Infrared ... · Penetration Depth Measurement of...
11
sensors Article Penetration Depth Measurement of Near-Infrared Hyperspectral Imaging Light for Milk Powder Min Huang 1,2 , Moon S. Kim 2, *, Kuanglin Chao 2 , Jianwei Qin 2 , Changyeun Mo 3 , Carlos Esquerre 4,5 , Stephen Delwiche 5 and Qibing Zhu 1 1 Key Laboratory of Advanced Process Control for Light Industry, Ministry of Education, Jiangnan University, Wuxi 214122, China; [email protected] (M.H.); [email protected] (Q.Z.) 2 Environmental Microbial and Food Safety Laboratory, Agricultural Research Service, USDA, Beltsville, MD 20705, USA; [email protected] (K.C.); [email protected] (J.Q.) 3 National Institute of Agricultural Science, Rural Development Administration, 310 Nongsaengmyeong-ro, Wansan-gu, Jueonju-si, Jeollabuk-do 54875, Korea; [email protected] 4 School of Biosystems and Food Engineering, University College Dublin, Dublin 4, Ireland; [email protected] 5 Food Quality, Agricultural Research Service, USDA, Beltsville, MD 20705, USA; [email protected] * Correspondence: [email protected]; Tel.: +1-301-504-8462; Fax: +1-301-504-9466 Academic Editor: Gonzalo Pajares Martinsanz Received: 1 September 2015; Accepted: 22 March 2016; Published: 25 March 2016 Abstract: The increasingly common application of the near-infrared (NIR) hyperspectral imaging technique to the analysis of food powders has led to the need for optical characterization of samples. This study was aimed at exploring the feasibility of quantifying penetration depth of NIR hyperspectral imaging light for milk powder. Hyperspectral NIR reflectance images were collected for eight different milk powder products that included five brands of non-fat milk powder and three brands of whole milk powder. For each milk powder, five different powder depths ranging from 1 mm–5 mm were prepared on the top of a base layer of melamine, to test spectral-based detection of the melamine through the milk. A relationship was established between the NIR reflectance spectra (937.5–1653.7 nm) and the penetration depth was investigated by means of the partial least squares-discriminant analysis (PLS-DA) technique to classify pixels as being milk-only or a mixture of milk and melamine. With increasing milk depth, classification model accuracy was gradually decreased. The results from the 1-mm, 2-mm and 3-mm models showed that the average classification accuracy of the validation set for milk-melamine samples was reduced from 99.86% down to 94.93% as the milk depth increased from 1 mm–3 mm. As the milk depth increased to 4 mm and 5 mm, model performance deteriorated further to accuracies as low as 81.83% and 58.26%, respectively. The results suggest that a 2-mm sample depth is recommended for the screening/evaluation of milk powders using an online NIR hyperspectral imaging system similar to that used in this study. Keywords: penetration depth; hyperspectral imaging; milk powder; PLS-DA 1. Introduction Milk, both a nutritious food in itself and a functional ingredient in other food products, is a complex fluid consisting of fats, proteins, minerals, vitamins, enzymes, carbohydrates and water. However, fluid milk is difficult to transport and store. Therefore, milk powders are produced using drying technologies to turn fluid milk into dry milk powder. Nonfat milk and whole milk are the two most common milk powders and contribute nutritionally to many food formulations, including reconstituted milk, dairy products, baked goods, confectionery, processed meat products, nutritional beverages and prepared ready-to-eat foods. As an important food ingredient for human Sensors 2016, 16, 441; doi:10.3390/s16040441 www.mdpi.com/journal/sensors
-
Upload
nguyencong -
Category
Documents
-
view
220 -
download
2
Transcript of Penetration Depth Measurement of Near-Infrared ... · Penetration Depth Measurement of...
sensors
Article
Penetration Depth Measurement of Near-InfraredHyperspectral Imaging Light for Milk Powder
Min Huang 1,2, Moon S. Kim 2,*, Kuanglin Chao 2, Jianwei Qin 2, Changyeun Mo 3,Carlos Esquerre 4,5, Stephen Delwiche 5 and Qibing Zhu 1
1 Key Laboratory of Advanced Process Control for Light Industry, Ministry of Education, Jiangnan University,Wuxi 214122, China; [email protected] (M.H.); [email protected] (Q.Z.)
2 Environmental Microbial and Food Safety Laboratory, Agricultural Research Service, USDA, Beltsville,MD 20705, USA; [email protected] (K.C.); [email protected] (J.Q.)
3 National Institute of Agricultural Science, Rural Development Administration, 310 Nongsaengmyeong-ro,Wansan-gu, Jueonju-si, Jeollabuk-do 54875, Korea; [email protected]
4 School of Biosystems and Food Engineering, University College Dublin, Dublin 4, Ireland;[email protected]
5 Food Quality, Agricultural Research Service, USDA, Beltsville, MD 20705, USA;[email protected]
* Correspondence: [email protected]; Tel.: +1-301-504-8462; Fax: +1-301-504-9466
Academic Editor: Gonzalo Pajares MartinsanzReceived: 1 September 2015; Accepted: 22 March 2016; Published: 25 March 2016
Abstract: The increasingly common application of the near-infrared (NIR) hyperspectral imagingtechnique to the analysis of food powders has led to the need for optical characterization ofsamples. This study was aimed at exploring the feasibility of quantifying penetration depth of NIRhyperspectral imaging light for milk powder. Hyperspectral NIR reflectance images were collectedfor eight different milk powder products that included five brands of non-fat milk powder and threebrands of whole milk powder. For each milk powder, five different powder depths ranging from1 mm–5 mm were prepared on the top of a base layer of melamine, to test spectral-based detectionof the melamine through the milk. A relationship was established between the NIR reflectancespectra (937.5–1653.7 nm) and the penetration depth was investigated by means of the partial leastsquares-discriminant analysis (PLS-DA) technique to classify pixels as being milk-only or a mixtureof milk and melamine. With increasing milk depth, classification model accuracy was graduallydecreased. The results from the 1-mm, 2-mm and 3-mm models showed that the average classificationaccuracy of the validation set for milk-melamine samples was reduced from 99.86% down to 94.93%as the milk depth increased from 1 mm–3 mm. As the milk depth increased to 4 mm and 5 mm,model performance deteriorated further to accuracies as low as 81.83% and 58.26%, respectively. Theresults suggest that a 2-mm sample depth is recommended for the screening/evaluation of milkpowders using an online NIR hyperspectral imaging system similar to that used in this study.
Keywords: penetration depth; hyperspectral imaging; milk powder; PLS-DA
1. Introduction
Milk, both a nutritious food in itself and a functional ingredient in other food products, is acomplex fluid consisting of fats, proteins, minerals, vitamins, enzymes, carbohydrates and water.However, fluid milk is difficult to transport and store. Therefore, milk powders are producedusing drying technologies to turn fluid milk into dry milk powder. Nonfat milk and whole milkare the two most common milk powders and contribute nutritionally to many food formulations,including reconstituted milk, dairy products, baked goods, confectionery, processed meat products,nutritional beverages and prepared ready-to-eat foods. As an important food ingredient for human
Sensors 2016, 16, 441; doi:10.3390/s16040441 www.mdpi.com/journal/sensors
Sensors 2016, 16, 441 2 of 11
and animal food, milk powder safety is a worldwide concern. In recent years, incidents of milkpowder adulteration by melamine (2,4,6-triamino-1,3,5-triazine) to boost apparent protein contentcaused illnesses and resulted in wide recognition of melamine contamination as a food safety problem.Traditional methods of melamine detection in foods involve analytical techniques, such as massspectrometry and high performance liquid chromatography, are time consuming, expensive and requirecomplicated sample preparation procedures [1,2]. Visible (VIS) and near-infrared (NIR) spectroscopyhave been studied as non-destructive methods to detect melamine in milk by several researchgroups [3,4]; however, spectroscopic assessments with relatively small point-source measurementscannot provide information on the spatial distribution of melamine particles within a food sample.
As one of the most promising tools for non-destructive real-time evaluation of food qualityand safety in numerous applications, hyperspectral imaging combines features of both imagingand spectroscopy, such that it is capable of not only directly assessing the presence of differentcomponents simultaneously, but also locating the spatial distribution of those components in theproducts under examination [5]. Hyperspectral imaging may be operated in either reflectance ortransmittance modes, although reflectance is more commonly used. Generally, transmittance modeis used for thinly-prepared samples, allowing light to pass through the samples [6–9], while diffusereflectance is used for thicker samples in hyperspectral imaging measurements of whole or largerportions of foods, such as apples [10], peach [11], mushrooms [12], cucumbers [13] and chickens [14].Hyperspectral reflectance imaging has been used to detect defects and contaminants and to evaluatequality attributes for fruits, vegetables, meats and dairy products. Implemented with automatedimage processing and analysis algorithms, hyperspectral imaging has been demonstrated for effectivereal-time assessment of the quality and safety attributes of poultry [14]. For reflectance imaging,the NIR light must sufficiently penetrate the food material in order for the intensity of the remittedradiation, as a function of wavelength (or frequency), to have been influenced by the chemical natureof the absorbing compound.
Light penetration depth is defined as the depth in a sample material at which incident lightis reduced by 99% and will vary with the status of sample, the type of sample and the detectionwavelength [15]. Hyperspectral reflectance imaging is usually operated in the VIS-NIR (400–1000 nm)or NIR (1000–1700 nm) range. Limited research exists for the investigation of the penetration depthin the VIS and NIR ranges. Lammertyn et al. [16] reported light penetration depth in apples to beup to 4 mm in the 700–900-nm range and between 2 and 3 mm in the 900–1900-nm range. Qin andLu [15] found that the light penetration depth in fruit tissue varies depending on the type of fruit,ranging from 7.1 mm for plums to 65.2 mm for zucchini. Most studies reporting light penetrationdepths were conducted on fruits. Further research would provide not only helpful references forthickness determination, but also valuable insight into appropriate sensing configurations, especiallyfor milk powder products [17,18]. Fu et al. [18] coupled the NIR hyperspectral imaging technique(990–1700 nm) with spectral similarity analyses to detect melamine mixed into samples of dry milkpowder. Imaging allowed visualization of the distribution of melamine particles in the milk mixturesamples that were prepared at melamine concentrations ranging from 0.02%–1.00% and presented forimaging in plastic Petri dishes. However, it was not examined exactly how many millimeters the NIRhyperspectral imaging light could penetrate into the milk powder samples. The objective of this studywas to determine the penetration depth of NIR hyperspectral imaging light in milk powder for thewavelengths between 937.5 nm and 1653.7 nm.
2. Experimental Section
2.1. Sample Preparation
Eight different milk powder products were purchased from commercial retailers, including5 brands of nonfat milk powders (‘valley (N)’, Organic Valley, La Farge, WI, USA; ‘nestle (N)’, Nestle,Solon, OH, USA; ‘hoosier (N)’, Hoosier Hill Farm, Fort Wayne, IN, USA; ‘now (N)’, Now Real Food,
Sensors 2016, 16, 441 3 of 11
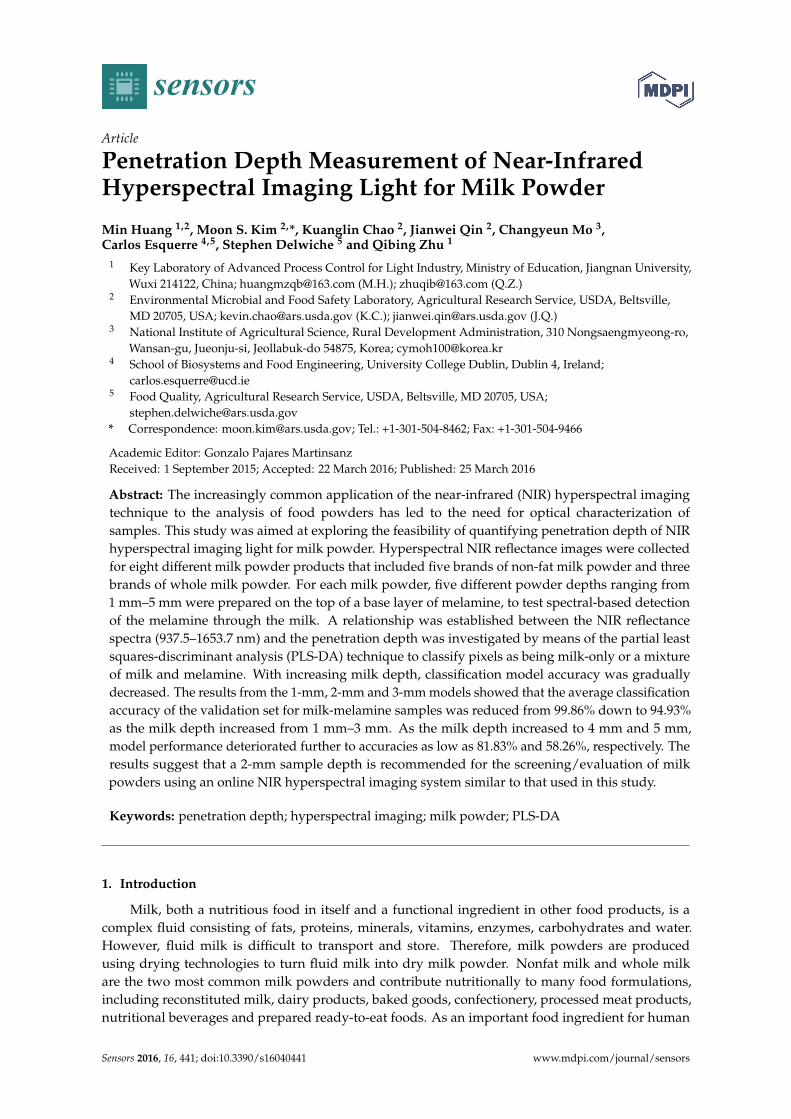
Blooming, IL, USA; ‘bob (N)’, Bob’s Red Mill, Pheasant Court Milwaukie, OR, USA) and three brandsof whole milk powders (‘hoosier (W)’, Hoosier Hill Farm, Fort Wayne, IN, USA; ‘nestle (W)’, Nestle,Glendale, CA, USA; ‘peak (W)’, Peak, Friesland Campina, P. Stuyvesantwet 1, AC Leeuwarden,Holland). Melamine powder (99% purity) was obtained from Sigma-Aldrich Company (M2659,St. Louis, MO, USA). For detecting the light penetration depth of the hyperspectral imaging system,different thicknesses (1 mm, 2 mm, 3 mm, 4 mm and 5 mm) of pure milk powders were layered on thetop of pure melamine. These milk-melamine samples were prepared in black electroplated aluminumplates precisely machined with square wells (30-mm width and height, 10-mm depth). Each samplewas first prepared with a leveled layer of pure melamine in the bottom of the well, followed by aleveled layer of pure milk powder on top of the melamine. The combined thicknesses of the melamineand milk powder layers completely filled the 10-mm depth of each well, with the milk depth rangingbetween 1 and 5 mm (i.e., 1 mm-thick milk layer over 9 mm of melamine, 2 mm-thick milk layer over8 mm of melamine, and so on). Figure 1 illustrates the preparation of a sample containing 3 mm ofmilk over 7 mm of melamine. For each kind of milk powder, three samples were prepared at eachof the five milk depths, as well as three samples of pure dry milk (10 mm of milk with no melamineunderneath) and one sample of pure melamine. With 19 plates prepared for each of the milk powderproducts, a total of 152 samples were measured for the eight milk products used in this study.
Sensors 2016, 16, 441 3 of 11
Blooming, IL, USA; ‘bob (N)’, Bob’s Red Mill, Pheasant Court Milwaukie, OR, USA) and three brands of whole milk powders (‘hoosier (W)’, Hoosier Hill Farm, Fort Wayne, IN, USA; ‘nestle (W)’, Nestle, Glendale, CA, USA; ‘peak (W)’, Peak, Friesland Campina, P. Stuyvesantwet 1, AC Leeuwarden, Holland). Melamine powder (99% purity) was obtained from Sigma-Aldrich Company (M2659, St. Louis, MO, USA). For detecting the light penetration depth of the hyperspectral imaging system, different thicknesses (1 mm, 2 mm, 3 mm, 4 mm and 5 mm) of pure milk powders were layered on the top of pure melamine. These milk-melamine samples were prepared in black electroplated aluminum plates precisely machined with square wells (30-mm width and height, 10-mm depth). Each sample was first prepared with a leveled layer of pure melamine in the bottom of the well, followed by a leveled layer of pure milk powder on top of the melamine. The combined thicknesses of the melamine and milk powder layers completely filled the 10-mm depth of each well, with the milk depth ranging between 1 and 5 mm (i.e., 1 mm-thick milk layer over 9 mm of melamine, 2 mm-thick milk layer over 8 mm of melamine, and so on). Figure 1 illustrates the preparation of a sample containing 3 mm of milk over 7 mm of melamine. For each kind of milk powder, three samples were prepared at each of the five milk depths, as well as three samples of pure dry milk (10 mm of milk with no melamine underneath) and one sample of pure melamine. With 19 plates prepared for each of the milk powder products, a total of 152 samples were measured for the eight milk products used in this study.
Figure 1. Milk-melamine sample holder (e.g., 3 mm-thick milk and 7 mm-thick melamine layers). The light grey area shows the sample surface (30 mm × 30 mm).
2.2. Instrument and Experiment
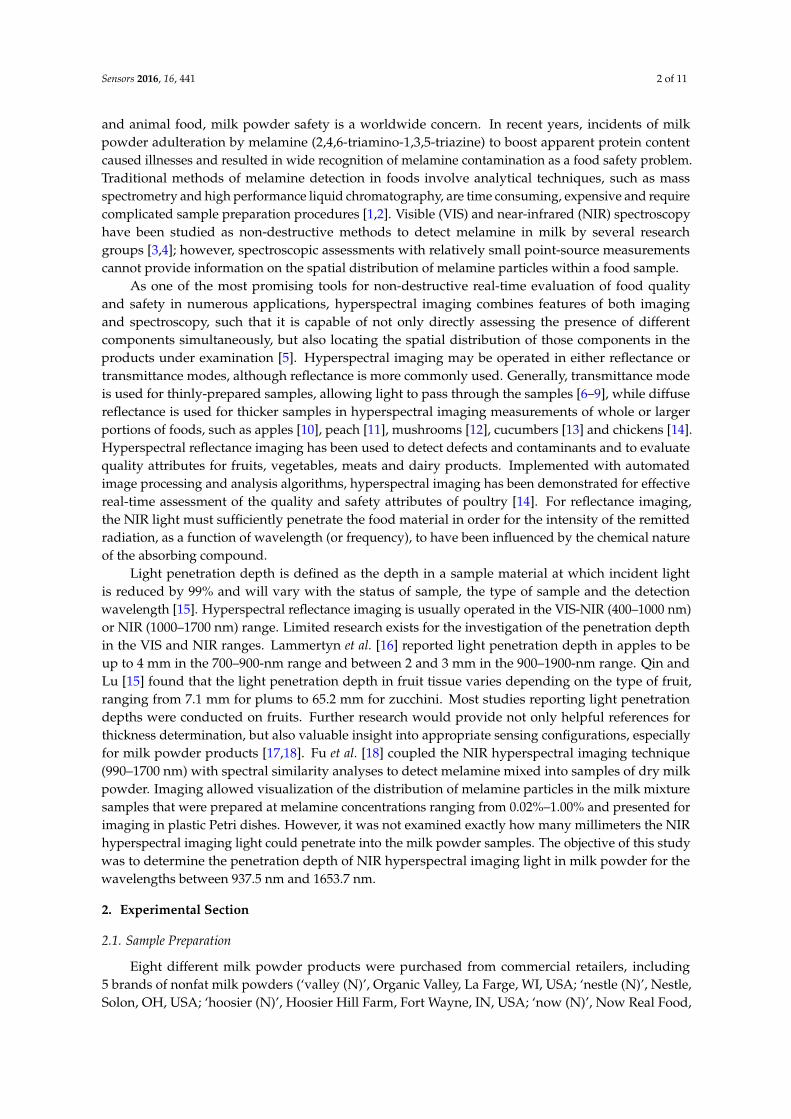
As shown in the schematic in Figure 2 and described in detail in Kim et al. [19], the line-scan NIR hyperspectral imaging system consists of an InGaAs focal-plane-array (FPA) camera with 320 × 256 pixels (Xenics, Model Xeva-1.7-320, Leuven, Belgium), an imaging spectrograph (SWIR Hyperspec, Headwall Photonics, MA, USA) and a 25-mm zoom lens (Optec, Model OB-SWIR25/2, Parabiago, Italy), as well as a computer for controlling the camera and acquiring images, two 150-W DC light sources with fiber optic bundles (Dolan Jenner, Model DC-950, Boxborough, MA, USA) and a motorized uniaxial stage (Velmex, Model XN10-0180-M02-21, Bloomfield, NY, USA). The camera array sensor consists of 150 usable pixels in the spectral dimension over a wavelength range of 937.5–1653.7 nm, with an average wavelength spacing of 4.8 nm. Except for the two 150-W quartz tungsten halogen light sources, the system is entirely housed with an aluminum-framed enclosure. The light is conveyed via the low-OH fiber optic bundles, with each bundle terminating in a 250 mm-long line of fibers encased in a machined aluminum head. The angle of incidence from the line lights is 30° (from surface normal), and the distance between line lights and sample surface is 20 mm. For each light source, a mechanical iris was used to allow approximately 75% of 150-W light intensity to arrive at the sample surface. The motorized stage moved the samples incrementally across the linear field of view for step-by-step acquisition of line-scan images.
7 mm Melamine
3 mm Milk
Figure 1. Milk-melamine sample holder (e.g., 3 mm-thick milk and 7 mm-thick melamine layers). Thelight grey area shows the sample surface (30 mm ˆ 30 mm).
2.2. Instrument and Experiment
As shown in the schematic in Figure 2 and described in detail in Kim et al. [19], the line-scanNIR hyperspectral imaging system consists of an InGaAs focal-plane-array (FPA) camera with320 ˆ 256 pixels (Xenics, Model Xeva-1.7-320, Leuven, Belgium), an imaging spectrograph (SWIRHyperspec, Headwall Photonics, MA, USA) and a 25-mm zoom lens (Optec, Model OB-SWIR25/2,Parabiago, Italy), as well as a computer for controlling the camera and acquiring images, two 150-WDC light sources with fiber optic bundles (Dolan Jenner, Model DC-950, Boxborough, MA, USA) anda motorized uniaxial stage (Velmex, Model XN10-0180-M02-21, Bloomfield, NY, USA). The cameraarray sensor consists of 150 usable pixels in the spectral dimension over a wavelength range of937.5–1653.7 nm, with an average wavelength spacing of 4.8 nm. Except for the two 150-W quartztungsten halogen light sources, the system is entirely housed with an aluminum-framed enclosure. Thelight is conveyed via the low-OH fiber optic bundles, with each bundle terminating in a 250 mm-longline of fibers encased in a machined aluminum head. The angle of incidence from the line lights is 30˝
(from surface normal), and the distance between line lights and sample surface is 20 mm. For eachlight source, a mechanical iris was used to allow approximately 75% of 150-W light intensity to arriveat the sample surface. The motorized stage moved the samples incrementally across the linear field ofview for step-by-step acquisition of line-scan images.

Sensors 2016, 16, 441 4 of 11Sensors 2016, 16, 441 4 of 11
Figure 2. Schematic of the NIR hyperspectral imaging system used to acquire reflectance images of milk powders. FPA, focal-plane-array.
In this study, square imaging pixels were achieved by setting the incremental step size to 0.1 mm to match the pixel-to-pixel distance along the imaging line, which included 320 pixels. The camera exposure time was set at 2.5 ms, and a total of 360 scans were acquired in 1 min. The camera digitized raw energy readings in 14-bit resolution. Finally, each sample’s spectral data were stored as a 16-bit hyperspectral image cube of dimensions 320 × 360 × 150 containing spatial and spectral data. The hypercube is a three-dimensional image, which represents a 2D spatial image with x-axis and y-axis coordinate information and z-axis spectral information.
2.3. Hyperspectral Data Analysis
2.3.1. Image Preprocessing
In this study, dark current and white reference images were collected to correct the raw reflectance images for wavelength-dependent system responses and heterogeneous dark current in the FPA camera. The dark current image was captured while the lens was covered by a lens cap. An image of an illuminated 99% diffuse reflectance standard (SpectralonTM, SRT-99-120, Labsphere, NH, USA) was acquired for use as the white reference image. These images were used to calculate the relative reflectance image of each sample, which was calculated by dividing the difference in energy readings between sample and dark current by the difference in energy readings between the white reference and dark current.
Figure 2. Schematic of the NIR hyperspectral imaging system used to acquire reflectance images ofmilk powders. FPA, focal-plane-array.
In this study, square imaging pixels were achieved by setting the incremental step size to 0.1 mmto match the pixel-to-pixel distance along the imaging line, which included 320 pixels. The cameraexposure time was set at 2.5 ms, and a total of 360 scans were acquired in 1 min. The camera digitizedraw energy readings in 14-bit resolution. Finally, each sample’s spectral data were stored as a 16-bithyperspectral image cube of dimensions 320 ˆ 360 ˆ 150 containing spatial and spectral data. Thehypercube is a three-dimensional image, which represents a 2D spatial image with x-axis and y-axiscoordinate information and z-axis spectral information.
2.3. Hyperspectral Data Analysis
2.3.1. Image Preprocessing
In this study, dark current and white reference images were collected to correct the raw reflectanceimages for wavelength-dependent system responses and heterogeneous dark current in the FPAcamera. The dark current image was captured while the lens was covered by a lens cap. An imageof an illuminated 99% diffuse reflectance standard (SpectralonTM, SRT-99-120, Labsphere, NH, USA)was acquired for use as the white reference image. These images were used to calculate the relativereflectance image of each sample, which was calculated by dividing the difference in energy readingsbetween sample and dark current by the difference in energy readings between the white referenceand dark current.
2.3.2. Spectral Preprocessing
The region of interest (ROI) for each sample was composed of a square region of 10,000 pixels(100 ˆ100 pixels around the image center), selected within the 30 mm ˆ 30 mm sample area (shown inFigure 1) so as to include only milk powder areas and exclude background (plate) regions for further

Sensors 2016, 16, 441 5 of 11
analyses. Spectral preprocessing techniques were used prior to develop a calibration model in thequest for improving the subsequent classification model. Common preprocessing methods for NIRspectra were used, including Standard Normal Variate (SNV), Multiplicative Scatter Correction (MSC),Extended MSC (EMSC), Normalized (NORMALIZED), the common (base 10) Logarithm (LOG10),Savitzky–Golay Smooth (SMOOTH) and the Savitzky–Golay 1st (1ST) and the Savitzky–Golay 2nd(2ND) derivative [20].
2.3.3. Development of the Classification Model
After spectral preprocessing, partial least squares discriminant analysis (PLS-DA) was used toclassify each pixel as belonging to either the pure milk class or the milk-melamine mixture class.PLS-DA, an extension of PLS modeling, aims to find the variables and directions in a multivariatespace that discriminate the known classes in the calibration set. PLS components are computed underthe constraint of the maximization of covariance between inputs and outputs. Therefore, it can providea set of orthogonal factors that have the best predictive power from the combinations of differentmethods with an increased number of variables [21–23].
Prior to model development, the triplicate samples (three samples imaged at each depth of milkover melamine and three samples for each pure milk powder product) were divided into two groups,with two samples (comprising 20,000 ROI pixels) assigned to a model development dataset and onesample (comprising 10,000 ROI pixels) assigned to a validation dataset for use in evaluating modelperformance. Model performance was compared based on classification accuracies, i.e., the percentageof correctly-classified pixels over the total number of pixels. To better assess the performance of theclassification models, calibrations and validations for each depth were run three times [24]. For each ofthe 5 different milk-melamine preparations, a separate PLS-DA model (1-mm model, 2-mm model,3-mm model, 4-mm model and 5-mm model) was developed. The number of components chosen forthe PLS-DA models was determined by a contiguous block cross-validation method, in which eachblock contained the samples from one milk powder product.
Image processing, selection of the square ROI, the spectral preprocessing operation and modeldevelopment were performed in MATLAB (R2007b, MathWorks, Natick, MA, USA) equipped with thePLS Toolbox (v. 7.5, Eigenvector Research, Manson, WA, USA).
3. Results and Discussion
3.1. Hyperspectral Spectra
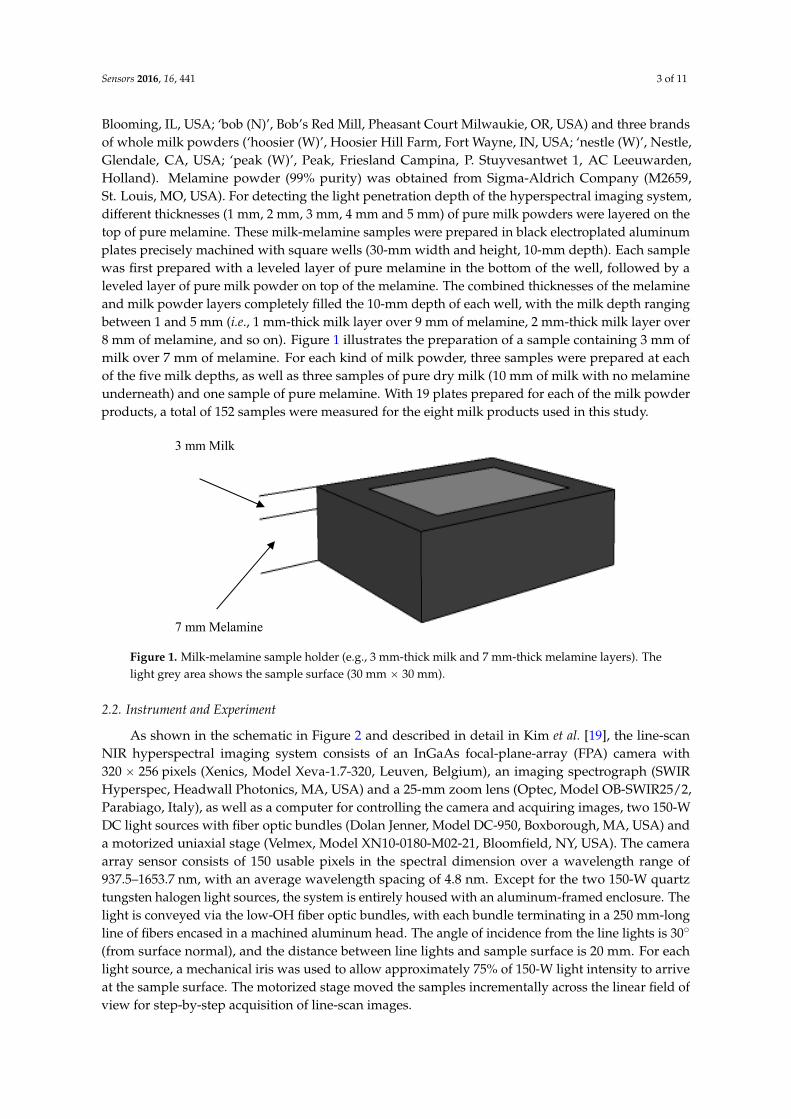
Figure 3 shows representative mean absorption spectra (calculated from 10,000-pixel ROI) ofpure melamine and the eight pure milk products (including five nonfat and three whole) obtainedfrom the LOG10 preprocessing technique. Significant differences, absorption peaks related to the firstand second N-H functional group, can be clearly observed between melamine and milk spectra. Themean melamine spectrum had peaks near 1523.9 and 1490.3 nm, corresponding to the first overtone ofN-H symmetric and anti-symmetric stretching vibration, respectively. The second overtone of N-Hstretching vibration is located near 985.6–1033.7 nm (centered at 1009.6 nm). The most significantspectral difference between melamine and milk occurred near 1466.3 nm, which is attributed toaromatic amine structures [3] and showed the highest absorption in the melamine spectrum. For thenonfat milk spectra, the spectral patterns of the five different brands are similar, and another similarspectral pattern was observed for the three brands of whole milk from Figure 3. The absorbanceof most nonfat milk spectra is lower than that of the whole milk spectra. For the visual differencebetween the nonfat and whole milk pattern, whole milk spectra have an evident absorption peakaround 1211.5 nm, which is due to the second overtone of C-H stretching vibration constituted bysaturated fat structures [25].
Sensors 2016, 16, 441 6 of 11
Sensors 2016, 16, 441 6 of 11
absorption peak around 1211.5 nm, which is due to the second overtone of C-H stretching vibration constituted by saturated fat structures [25].
Figure 3. Representative mean spectra of pure nonfat (N) and whole (W) milk powders and pure melamine, each calculated from a 10,000-pixel ROI.
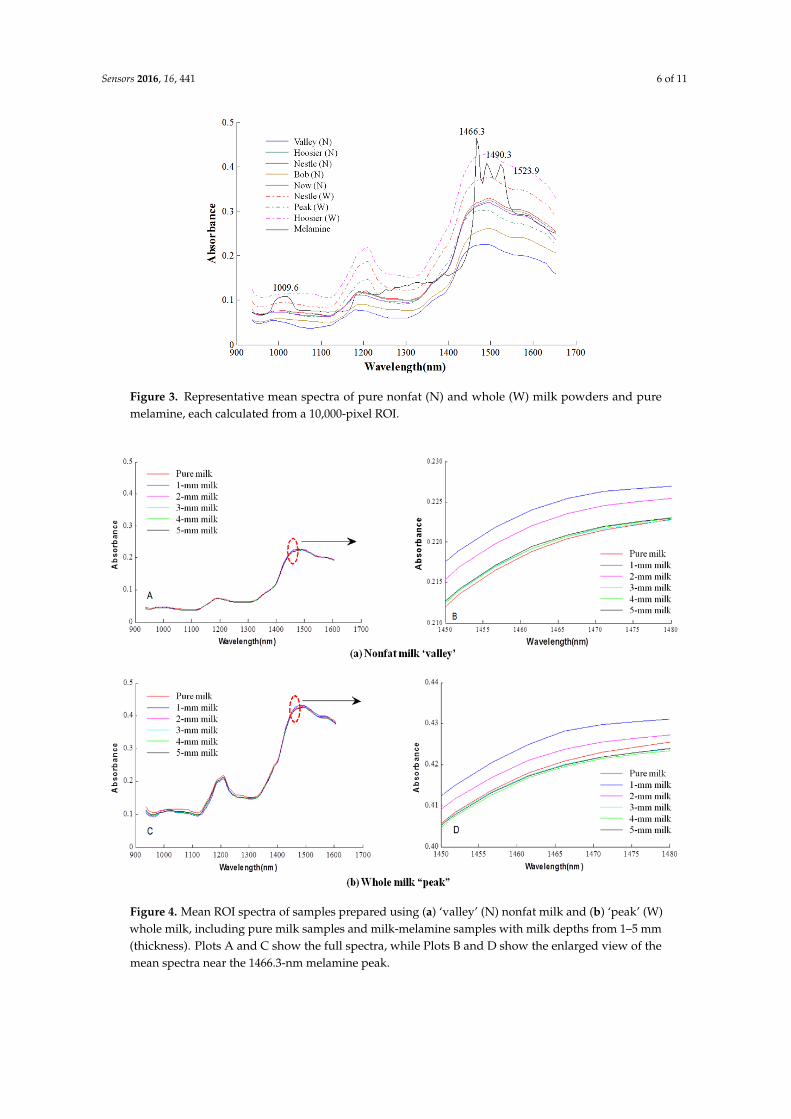
Figure 4. Mean ROI spectra of samples prepared using (a) ‘valley’ (N) nonfat milk and (b) ‘peak’ (W) whole milk, including pure milk samples and milk-melamine samples with milk depths from 1–5 mm (thickness). Plots A and C show the full spectra, while Plots B and D show the enlarged view of the mean spectra near the 1466.3-nm melamine peak.
Figure 3. Representative mean spectra of pure nonfat (N) and whole (W) milk powders and puremelamine, each calculated from a 10,000-pixel ROI.
Sensors 2016, 16, 441 6 of 11
absorption peak around 1211.5 nm, which is due to the second overtone of C-H stretching vibration constituted by saturated fat structures [25].
Figure 3. Representative mean spectra of pure nonfat (N) and whole (W) milk powders and pure melamine, each calculated from a 10,000-pixel ROI.
Figure 4. Mean ROI spectra of samples prepared using (a) ‘valley’ (N) nonfat milk and (b) ‘peak’ (W) whole milk, including pure milk samples and milk-melamine samples with milk depths from 1–5 mm (thickness). Plots A and C show the full spectra, while Plots B and D show the enlarged view of the mean spectra near the 1466.3-nm melamine peak.
Figure 4. Mean ROI spectra of samples prepared using (a) ‘valley’ (N) nonfat milk and (b) ‘peak’ (W)whole milk, including pure milk samples and milk-melamine samples with milk depths from 1–5 mm(thickness). Plots A and C show the full spectra, while Plots B and D show the enlarged view of themean spectra near the 1466.3-nm melamine peak.

Sensors 2016, 16, 441 7 of 11
Figure 4 shows representative mean spectra for one nonfat milk and one whole milk, valley (nonfat(N)) and peak (whole (W)), including milk-melamine samples for milk depths of 1–5 mm (thickness)and for pure milk. Among the eight milk products used in this study, ‘peak’ (W) had the strongestabsorbance and ‘valley’ (N) had the weakest absorbance. The mean spectra of milk-melamine samplesare very similar to the mean spectrum of pure milk; all exhibit no obvious melamine absorption features.This observation suggests that individual pixel-based spectral evaluations (instead of averaged spectraacross spatial image areas) may allow better detection of melamine to measure the penetration depthof milk [18]. In the region of the 1466.3-nm melamine absorption peak, the mean absorbance notablydecreased as the milk depth increased from 1 mm–3 mm. For 3 mm–5 mm, the mean spectra werenearly the same as that for pure milk. The same trends were observed for both nonfat milk ‘valley’ andwhole milk ‘peak’.
3.2. Discriminant Models for Milk Depth Classification
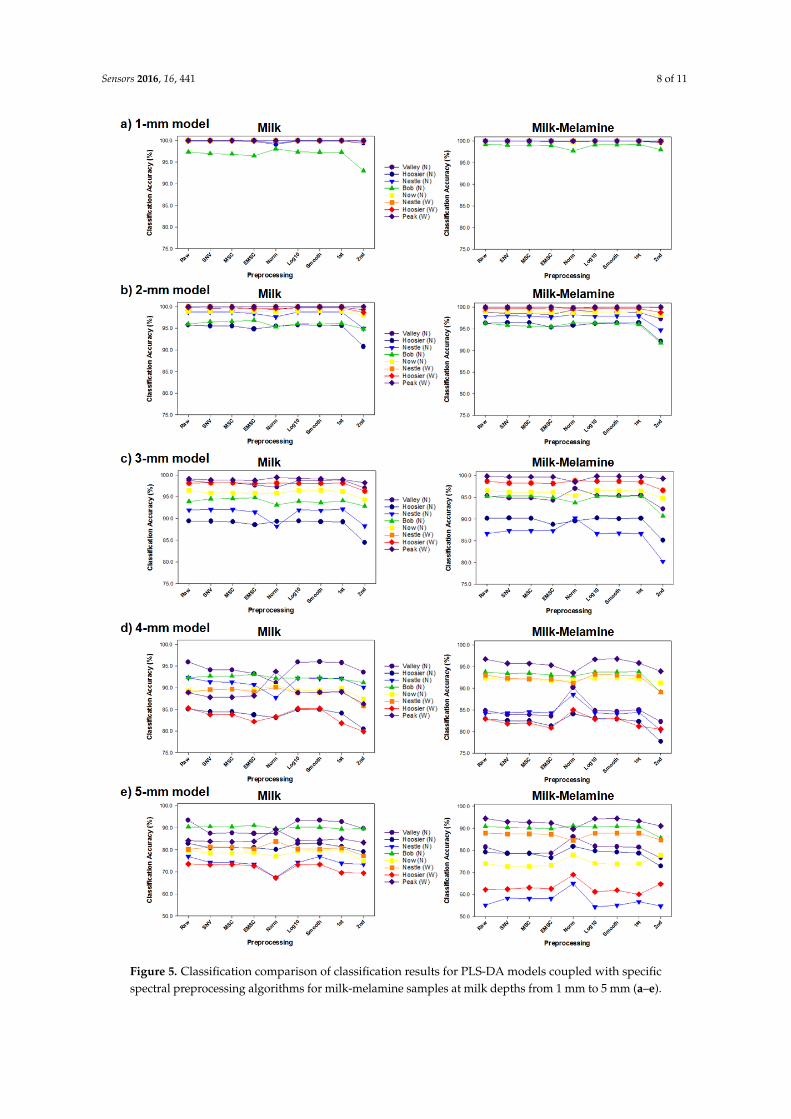
The plots in Figure 5 compare the validation set classification results (average of three runs) for thePLS-DA models coupled with specific spectral preprocessing algorithms, for milk-melamine at each ofthe five different milk depths (1-mm–5-mm models). As shown in Figure 5, the different preprocessingalgorithms can have a great impact on model accuracy. Compared to the other spectra preprocessingalgorithms, the 2ND derivative consistently resulted in low classification accuracy. The reason maybe that it has a more prominent spectra shoulder after derivative transformation, but it affects thecomponent number selection of PLS-DA. The models coupled with the SNV and MSC algorithm gavebetter, more robust performance than the NORMALIZED model (mean zero, unit variance), which isdue to reducing the scattering influence from particle size.
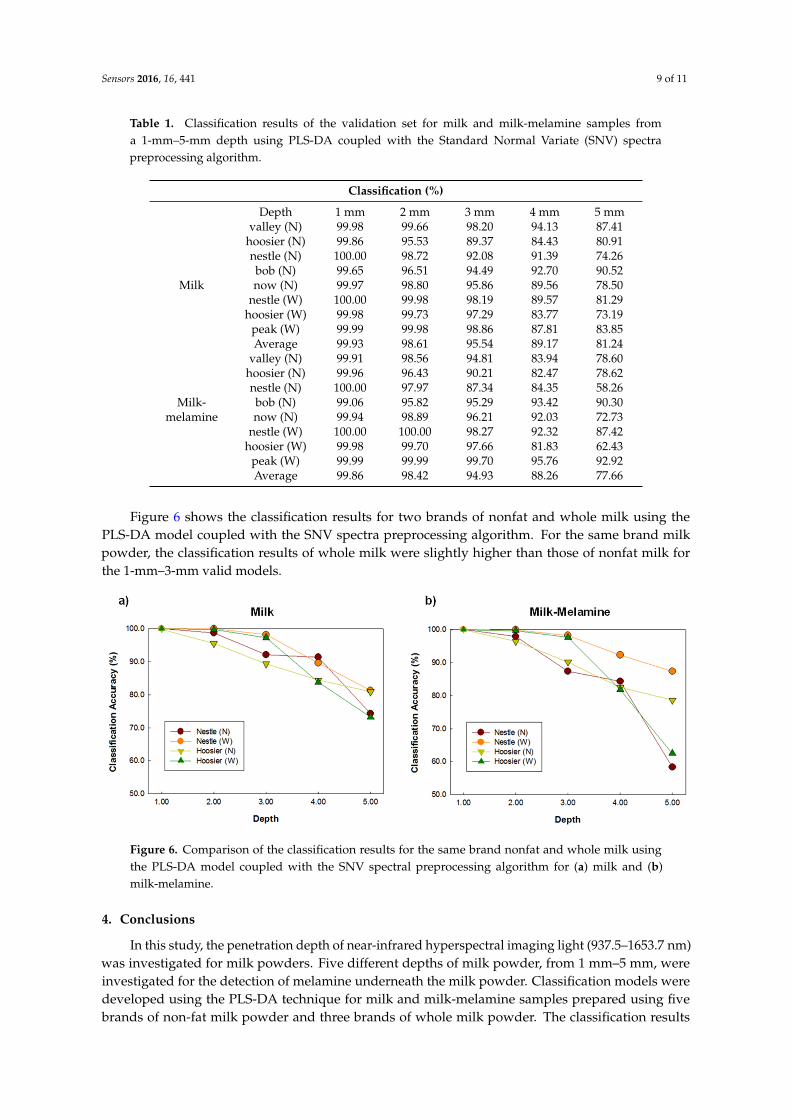
Since the classification accuracies of the calibration set were better than those of the validation sets,only the classification results of the validation set for milk and milk-melamine samples are presented.Table 1 shows the classification results of the validation set based on the PLS-DA model coupled withthe SNV preprocessing algorithm for the eight milk powders. The data show the classification accuracynotably decreasing as the milk depth increases from 1 mm–5 mm. For the 1-mm model, 99.65%–100%of milk samples (pixels) and 99.06%–100.00% of milk-melamine samples were correctly classified, foroverall accuracies of 99.93% and 99.86% for milk and milk-melamine samples, respectively, across theeight milk powders. The 2-mm model’s highest accuracy was the same as that for the 1-mm model,while its lowest accuracies were lower at 95.53% for milk and 96.4% for milk-melamine samples. Theaverage misclassification rates were 1.39% for milk and 1.58% for milk-melamine samples across alleight milk powders. Although the 3-mm model achieved an average accuracy 95.54% for milk and94.93% for milk-melamine samples, the classification accuracies of nonfat milk ‘hoosier’ and ‘nestle’were lower than 90%, which is not suitable for melamine detection at lower concentrations. As themilk depth increased to 4 mm and 5 mm, the nearly identical spectra for milk and for milk-melamine(shown in Figure 3) resulted in deteriorated model performance. The average misclassification rateof the 4-mm model was greater than 10%, while about 20% of the samples were misclassified by the5-mm model for some of the milk powders. This means that the 4-mm and 5-mm models were invalidfor classification.
Sensors 2016, 16, 441 8 of 11Sensors 2016, 16, 441 8 of 11
Figure 5. Classification comparison of classification results for PLS-DA models coupled with specific spectral preprocessing algorithms for milk-melamine samples at milk depths from 1 mm to 5 mm (a–e).
Figure 5. Classification comparison of classification results for PLS-DA models coupled with specificspectral preprocessing algorithms for milk-melamine samples at milk depths from 1 mm to 5 mm (a–e).
Sensors 2016, 16, 441 9 of 11
Table 1. Classification results of the validation set for milk and milk-melamine samples froma 1-mm–5-mm depth using PLS-DA coupled with the Standard Normal Variate (SNV) spectrapreprocessing algorithm.
Classification (%)
Depth 1 mm 2 mm 3 mm 4 mm 5 mmvalley (N) 99.98 99.66 98.20 94.13 87.41
hoosier (N) 99.86 95.53 89.37 84.43 80.91nestle (N) 100.00 98.72 92.08 91.39 74.26bob (N) 99.65 96.51 94.49 92.70 90.52
Milk now (N) 99.97 98.80 95.86 89.56 78.50nestle (W) 100.00 99.98 98.19 89.57 81.29
hoosier (W) 99.98 99.73 97.29 83.77 73.19peak (W) 99.99 99.98 98.86 87.81 83.85Average 99.93 98.61 95.54 89.17 81.24
valley (N) 99.91 98.56 94.81 83.94 78.60hoosier (N) 99.96 96.43 90.21 82.47 78.62nestle (N) 100.00 97.97 87.34 84.35 58.26
Milk- bob (N) 99.06 95.82 95.29 93.42 90.30melamine now (N) 99.94 98.89 96.21 92.03 72.73
nestle (W) 100.00 100.00 98.27 92.32 87.42hoosier (W) 99.98 99.70 97.66 81.83 62.43
peak (W) 99.99 99.99 99.70 95.76 92.92Average 99.86 98.42 94.93 88.26 77.66
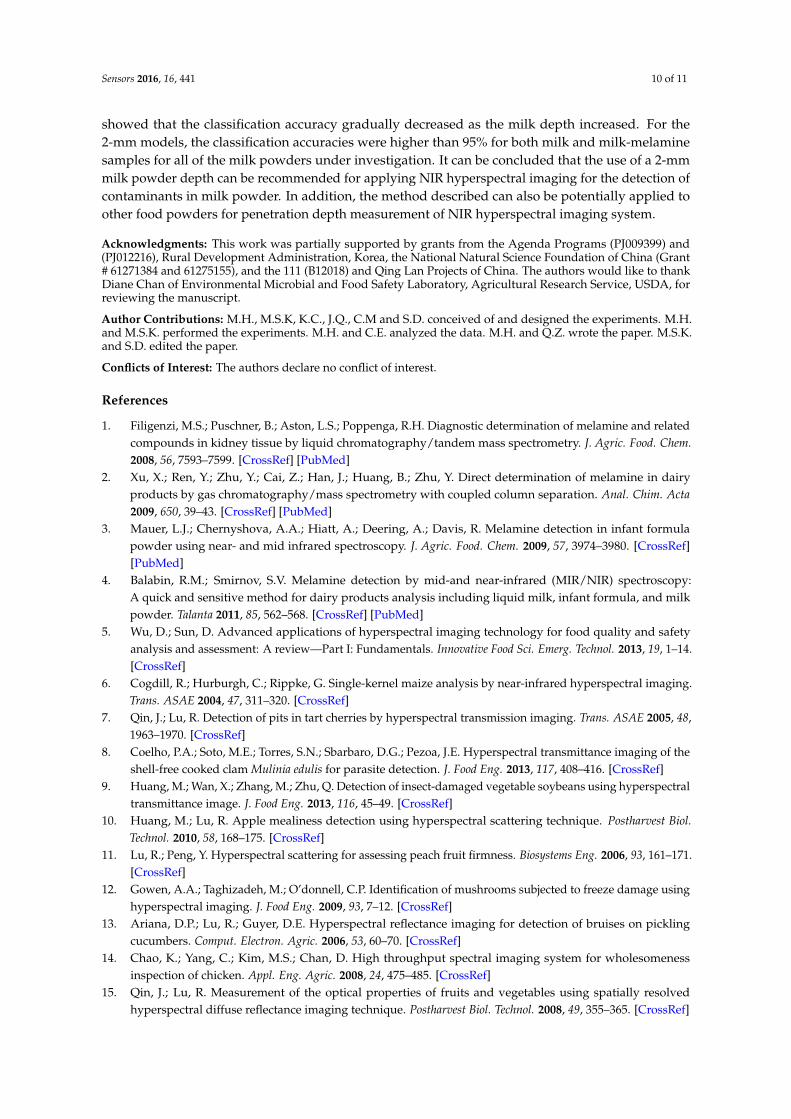
Figure 6 shows the classification results for two brands of nonfat and whole milk using thePLS-DA model coupled with the SNV spectra preprocessing algorithm. For the same brand milkpowder, the classification results of whole milk were slightly higher than those of nonfat milk forthe 1-mm–3-mm valid models.
Sensors 2016, 16, 441 9 of 11
Table 1. Classification results of the validation set for milk and milk-melamine samples from a 1-mm–5-mm depth using PLS-DA coupled with the Standard Normal Variate (SNV) spectra preprocessing algorithm.
Classification (%) Depth 1 mm 2 mm 3 mm 4 mm 5 mm valley (N) 99.98 99.66 98.20 94.13 87.41 hoosier (N) 99.86 95.53 89.37 84.43 80.91 nestle (N) 100.00 98.72 92.08 91.39 74.26 bob (N) 99.65 96.51 94.49 92.70 90.52
Milk now (N) 99.97 98.80 95.86 89.56 78.50 nestle (W) 100.00 99.98 98.19 89.57 81.29 hoosier (W) 99.98 99.73 97.29 83.77 73.19 peak (W) 99.99 99.98 98.86 87.81 83.85 Average 99.93 98.61 95.54 89.17 81.24 valley (N) 99.91 98.56 94.81 83.94 78.60 hoosier (N) 99.96 96.43 90.21 82.47 78.62 nestle (N) 100.00 97.97 87.34 84.35 58.26
Milk- bob (N) 99.06 95.82 95.29 93.42 90.30 melamine now (N) 99.94 98.89 96.21 92.03 72.73
nestle (W) 100.00 100.00 98.27 92.32 87.42 hoosier (W) 99.98 99.70 97.66 81.83 62.43 peak (W) 99.99 99.99 99.70 95.76 92.92 Average 99.86 98.42 94.93 88.26 77.66
Figure 6 shows the classification results for two brands of nonfat and whole milk using the PLS-DA model coupled with the SNV spectra preprocessing algorithm. For the same brand milk powder, the classification results of whole milk were slightly higher than those of nonfat milk for the 1-mm–3-mm valid models.
Figure 6. Comparison of the classification results for the same brand nonfat and whole milk using the PLS-DA model coupled with the SNV spectral preprocessing algorithm for (a) milk and (b) milk-melamine.
4. Conclusions
In this study, the penetration depth of near-infrared hyperspectral imaging light (937.5–1653.7 nm) was investigated for milk powders. Five different depths of milk powder, from 1 mm–5 mm, were investigated for the detection of melamine underneath the milk powder.
Figure 6. Comparison of the classification results for the same brand nonfat and whole milk usingthe PLS-DA model coupled with the SNV spectral preprocessing algorithm for (a) milk and (b)milk-melamine.
4. Conclusions
In this study, the penetration depth of near-infrared hyperspectral imaging light (937.5–1653.7 nm)was investigated for milk powders. Five different depths of milk powder, from 1 mm–5 mm, wereinvestigated for the detection of melamine underneath the milk powder. Classification models weredeveloped using the PLS-DA technique for milk and milk-melamine samples prepared using fivebrands of non-fat milk powder and three brands of whole milk powder. The classification results
Sensors 2016, 16, 441 10 of 11
showed that the classification accuracy gradually decreased as the milk depth increased. For the2-mm models, the classification accuracies were higher than 95% for both milk and milk-melaminesamples for all of the milk powders under investigation. It can be concluded that the use of a 2-mmmilk powder depth can be recommended for applying NIR hyperspectral imaging for the detection ofcontaminants in milk powder. In addition, the method described can also be potentially applied toother food powders for penetration depth measurement of NIR hyperspectral imaging system.
Acknowledgments: This work was partially supported by grants from the Agenda Programs (PJ009399) and(PJ012216), Rural Development Administration, Korea, the National Natural Science Foundation of China (Grant# 61271384 and 61275155), and the 111 (B12018) and Qing Lan Projects of China. The authors would like to thankDiane Chan of Environmental Microbial and Food Safety Laboratory, Agricultural Research Service, USDA, forreviewing the manuscript.
Author Contributions: M.H., M.S.K, K.C., J.Q., C.M and S.D. conceived of and designed the experiments. M.H.and M.S.K. performed the experiments. M.H. and C.E. analyzed the data. M.H. and Q.Z. wrote the paper. M.S.K.and S.D. edited the paper.
Conflicts of Interest: The authors declare no conflict of interest.
References
1. Filigenzi, M.S.; Puschner, B.; Aston, L.S.; Poppenga, R.H. Diagnostic determination of melamine and relatedcompounds in kidney tissue by liquid chromatography/tandem mass spectrometry. J. Agric. Food. Chem.2008, 56, 7593–7599. [CrossRef] [PubMed]
2. Xu, X.; Ren, Y.; Zhu, Y.; Cai, Z.; Han, J.; Huang, B.; Zhu, Y. Direct determination of melamine in dairyproducts by gas chromatography/mass spectrometry with coupled column separation. Anal. Chim. Acta2009, 650, 39–43. [CrossRef] [PubMed]
3. Mauer, L.J.; Chernyshova, A.A.; Hiatt, A.; Deering, A.; Davis, R. Melamine detection in infant formulapowder using near- and mid infrared spectroscopy. J. Agric. Food. Chem. 2009, 57, 3974–3980. [CrossRef][PubMed]
4. Balabin, R.M.; Smirnov, S.V. Melamine detection by mid-and near-infrared (MIR/NIR) spectroscopy:A quick and sensitive method for dairy products analysis including liquid milk, infant formula, and milkpowder. Talanta 2011, 85, 562–568. [CrossRef] [PubMed]
5. Wu, D.; Sun, D. Advanced applications of hyperspectral imaging technology for food quality and safetyanalysis and assessment: A review—Part I: Fundamentals. Innovative Food Sci. Emerg. Technol. 2013, 19, 1–14.[CrossRef]
6. Cogdill, R.; Hurburgh, C.; Rippke, G. Single-kernel maize analysis by near-infrared hyperspectral imaging.Trans. ASAE 2004, 47, 311–320. [CrossRef]
7. Qin, J.; Lu, R. Detection of pits in tart cherries by hyperspectral transmission imaging. Trans. ASAE 2005, 48,1963–1970. [CrossRef]
8. Coelho, P.A.; Soto, M.E.; Torres, S.N.; Sbarbaro, D.G.; Pezoa, J.E. Hyperspectral transmittance imaging of theshell-free cooked clam Mulinia edulis for parasite detection. J. Food Eng. 2013, 117, 408–416. [CrossRef]
9. Huang, M.; Wan, X.; Zhang, M.; Zhu, Q. Detection of insect-damaged vegetable soybeans using hyperspectraltransmittance image. J. Food Eng. 2013, 116, 45–49. [CrossRef]
10. Huang, M.; Lu, R. Apple mealiness detection using hyperspectral scattering technique. Postharvest Biol.Technol. 2010, 58, 168–175. [CrossRef]
11. Lu, R.; Peng, Y. Hyperspectral scattering for assessing peach fruit firmness. Biosystems Eng. 2006, 93, 161–171.[CrossRef]
12. Gowen, A.A.; Taghizadeh, M.; O’donnell, C.P. Identification of mushrooms subjected to freeze damage usinghyperspectral imaging. J. Food Eng. 2009, 93, 7–12. [CrossRef]
13. Ariana, D.P.; Lu, R.; Guyer, D.E. Hyperspectral reflectance imaging for detection of bruises on picklingcucumbers. Comput. Electron. Agric. 2006, 53, 60–70. [CrossRef]
14. Chao, K.; Yang, C.; Kim, M.S.; Chan, D. High throughput spectral imaging system for wholesomenessinspection of chicken. Appl. Eng. Agric. 2008, 24, 475–485. [CrossRef]
15. Qin, J.; Lu, R. Measurement of the optical properties of fruits and vegetables using spatially resolvedhyperspectral diffuse reflectance imaging technique. Postharvest Biol. Technol. 2008, 49, 355–365. [CrossRef]

Sensors 2016, 16, 441 11 of 11
16. Lammertyn, J.; Peirs, A.; de Baerdemaeker, J.; Nicolaï, B. Light penetration properties of NIR radiation in fruitwith respect to non-destructive quality assessment. Postharvest Biol. Technol. 2000, 18, 121–132. [CrossRef]
17. Fernández Pierna, J.A.; Vincke, D.; Dardenne, P.; Yang, Z.; Han, L.; Baeten, V. Line scan hyperspectralimaging spectroscopy for the early detection of melamine and cyanuric acid in feed. J. Near Infrared Spectrosc.2014, 22, 103–112. [CrossRef]
18. Fu, X.; Kim, M.S.; Chao, K.; Qin, J.; Lim, J.; Lee, H.; Garrido-Varo, A.; Pérez-Marín, D.; Ying, Y. Detection ofmelamine in milk powders based on NIR hyperspectral imaging and spectral similarity analysis. J. Food Eng.2014, 124, 97–104. [CrossRef]
19. Kim, M.S.; Chen, Y.R.; Mehl, P.M. Hyperspectral reflectance and fluorescence imaging system for food qualityand safety. Trans. ASAE 2001, 44, 721–729.
20. Rinnan, A.; van den Berg, F.; Engelsen, S.B. Review of the most common pre-processing techniques fornear-infrared spectra. Trends Anal. Chem. 2009, 28, 1201–1222. [CrossRef]
21. Barker, M.; Rayens, W. Partial least squares for discrimination. J. Chemom. 2003, 17, 166–173. [CrossRef]22. Westerhuis, J.A.; Hoefsloot, H.C.J.; Smit, S.; Vis, D.J.; Smilde, A.K.; van Velzen, E.J.J.; van Duijnhoven, J.P.M.;
van Dorsten, F.A. Assessment of PLSDA cross validation. Metabolomics 2008, 4, 81–89. [CrossRef]23. Huang, M.; Ma, Y.; Li, Y.; Zhu, Q.; Huang, G.; Bu, P. Hyperspectral image-based feature integration for
insect-damaged hawthorn detection. Anal. Methods 2014, 6, 7793–7800. [CrossRef]24. Lu, R.; Huang, M.; Qin, J. Analysis of hyperspectral scattering characteristics for predicting apple fruit
firmness and soluble solids content. In Proceedings of the International Conference on SPIE 7315, Sensingfor Agriculture and Food Quality and Safety, Orlando, FL, USA, 13 April 2009.
25. Nagarajan, R.; Singh, P.; Mehrotra, R. Direct determination of moisture in powder milk using near infraredspectroscopy. J. Autom. Methods Manag. Chem. 2006, 2006, 51342. [CrossRef] [PubMed]
© 2016 by the authors; licensee MDPI, Basel, Switzerland. This article is an open accessarticle distributed under the terms and conditions of the Creative Commons by Attribution(CC-BY) license (http://creativecommons.org/licenses/by/4.0/).