Pelvic Organ Prolapse Rate - Iowa State University · 2019-03-05 · Annualized rate of pelvic...
7
SOW MORTALITY PROJECT UPDATE 3-1-19 IOWA PORK INDUSTRY CENTER www.ipic.iastate.edu THIS PROJECT IS SUPPORTED BY THE NATIONAL PORK BOARD PROJECT #17-224. Overview: One hundred four sow farms representing an inventory of 386,338 sows, have submitted mortality records for 52 weeks starting on February 4, 2018 (week 6). The following figures summarize the distribution and variation of sow deaths across reporting sow farms. Figure 1 (Above). Annualized rate of pelvic organ prolapse (POP) varied across sow farms during the project period from over 10% to 0.3%. Figure 2 (Above). Annualized total mortality for reporting sow farms. The red portion of the bars represent the proportion of the sow mortalities that occurred that were not due to prolapse while the yellow portion of the bars indicates the proportion occurring due to prolapse. 0% 1% 2% 3% 4% 5% 6% 7% 8% 9% 10% 11% 3 60 79 99 84 26 86 87 5 25 85 102 83 19 100 41 88 36 57 97 77 22 65 20 2 56 37 80 108 109 8 101 6 14 62 78 1 11 48 10 23 58 34 33 72 74 98 29 82 4 42 94 27 12 9 71 35 7 73 13 105 81 38 28 47 92 91 95 30 68 15 103 66 59 70 21 39 32 113 104 45 112 107 24 106 31 54 17 93 40 96 44 90 111 75 18 110 114 49 46 76 43 16 89 Annualized POP, % Farm ID Pelvic Organ Prolapse Rate 0% 5% 10% 15% 20% 25% 12 85 79 99 3 72 84 88 101 100 75 19 87 8 34 83 73 78 89 94 80 21 23 86 91 20 5 26 10 109 112 47 77 25 15 74 103 105 14 22 16 33 95 11 110 108 97 1 93 82 13 58 27 71 31 6 48 36 81 28 60 98 57 38 65 18 30 102 7 35 76 111 9 29 4 45 96 92 106 37 62 2 90 114 56 41 17 24 113 46 68 42 32 59 39 66 107 104 43 40 70 44 54 49 Annualized Mortality, % Farm ID Cummulative Annualized Mortality Non-POP Mortality POP Mortality
Transcript of Pelvic Organ Prolapse Rate - Iowa State University · 2019-03-05 · Annualized rate of pelvic...
SOW MORTALITY PROJECT UPDATE 3-1-19 IOWA PORK INDUSTRY CENTER www.ipic.iastate.edu
THIS PROJECT IS SUPPORTED BY THE NATIONAL PORK BOARD PROJECT #17-224.
Overview: One hundred four sow farms representing an inventory of 386,338 sows, have submitted mortality records for 52 weeks starting on February 4, 2018 (week 6). The following figures summarize the distribution and variation of sow deaths across reporting sow farms.
Figure 1 (Above). Annualized rate of pelvic organ prolapse (POP) varied across sow farms during the project period from over 10% to 0.3%.
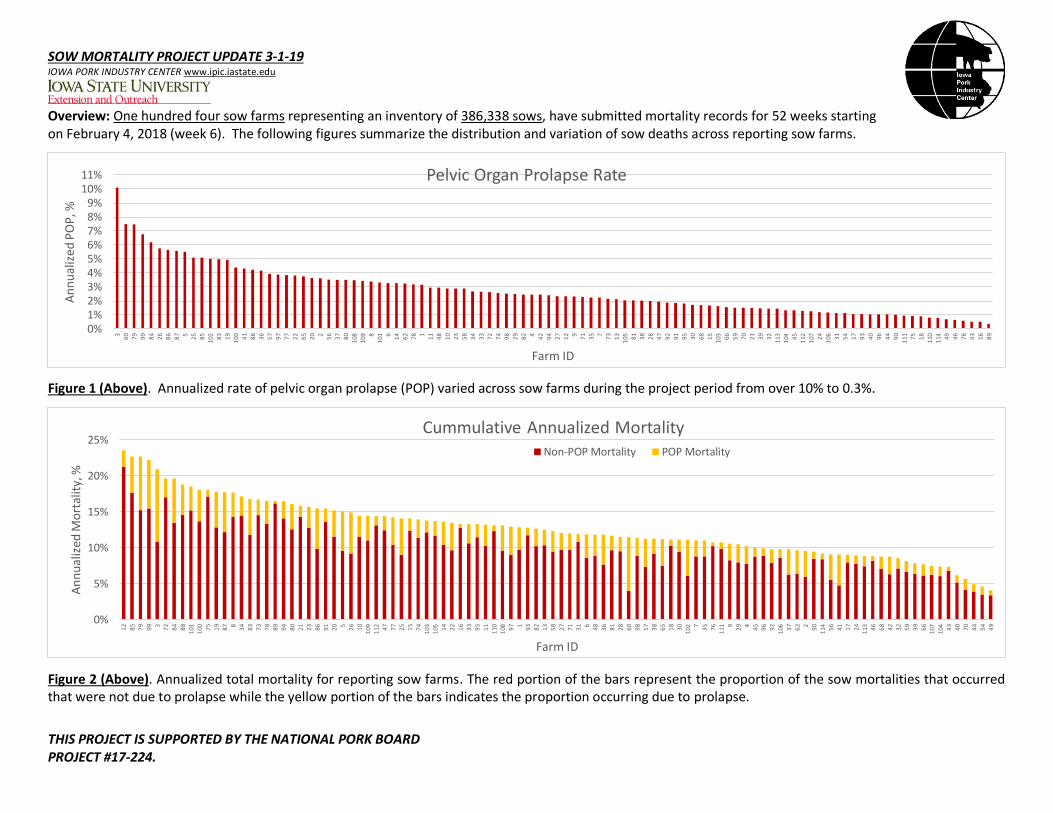
Figure 2 (Above). Annualized total mortality for reporting sow farms. The red portion of the bars represent the proportion of the sow mortalities that occurred that were not due to prolapse while the yellow portion of the bars indicates the proportion occurring due to prolapse.
0%1%2%3%4%5%6%7%8%9%
10%11%
3
60
79
99
84
26
86
87 5
25
85
102 8
3
19
100 4
1
88
36
57
97
77
22
65
20 2
56
37
80
108
109 8
101 6
14
62
78 1
11
48
10
23
58
34
33
72
74
98
29
82 4
42
94
27
12 9
71
35 7
73
13
105 8
1
38
28
47
92
91
95
30
68
15
103 6
6
59
70
21
39
32
113
104 4
5
112
107 2
4
106 3
1
54
17
93
40
96
44
90
111 7
5
18
110
114 4
9
46
76
43
16
89
An
nu
aliz
ed P
OP
, %
Farm ID
Pelvic Organ Prolapse Rate
0%
5%
10%
15%
20%
25%
12
85
79
99 3
72
84
88
101
100 7
5
19
87 8
34
83
73
78
89
94
80
21
23
86
91
20 5
26
10
109
112 4
7
77
25
15
74
103
105 1
4
22
16
33
95
11
110
108 9
7 1
93
82
13
58
27
71
31 6
48
36
81
28
60
98
57
38
65
18
30
102 7
35
76
111 9
29 4
45
96
92
106 3
7
62 2
90
114 5
6
41
17
24
113 4
6
68
42
32
59
39
66
107
104 4
3
40
70
44
54
49
An
nu
aliz
ed M
ort
alit
y, %
Farm ID
Cummulative Annualized MortalityNon-POP Mortality POP Mortality

SOW MORTALITY PROJECT UPDATE 3-1-19 IOWA PORK INDUSTRY CENTER www.ipic.iastate.edu
THIS PROJECT IS SUPPORTED BY THE NATIONAL PORK BOARD PROJECT #17-224.
Overview: Quarter 1 (weeks 6-18 of 2018; Feb 4-May 5, 2018). One hundred four sow farms representing an inventory of 386,338 sows, have submitted mortality records. The following figures summarize the distribution and variation of sow deaths across reporting sow farms.
Figure 3 (Above). Annualized rate of pelvic organ prolapse (POP) for the first quarter of the project varied across sow farms during the project period from 12% to 0.2%.
Figure 4 (Above). Annualized total mortality for reporting sow farms for the first quarter of the project. The red portion of the bars represent the proportion of the sow mortalities that occurred that were not due to prolapse while the yellow portion of the bars indicates the proportion occurring due to prolapse.
0%1%2%3%4%5%6%7%8%9%
10%11%12%13%
3
79
37
84
85
60
83
87
26
77
102 5
99
86
88
22
48
41
25
23
19
100 7
1
57 6
80
78
74 2
72
101 1
21
109 5
6
97
108 9
8
11 8 4
36
82
105 9
10
73
65
81
42
29
34
58
62
35
91
94
20 7
95
27
113 9
0
68
12
30
14
40
70
107 3
2
13
54
104 2
8
39
47
44
59
15
24
33
103 4
9
45
18
31
111 4
3
106 7
5
96
66
93
92
17
114 1
6
112
110 7
6
89
38
46
An
nu
aliz
ed P
OP
, %
Farm ID
Week 6-18 Pelvic Organ Prolapse Rate
0%
5%
10%
15%
20%
25%
85
79
101 3
87
72
84
12
99
83
15
19
26
88
75
80
78
100 3
4
73 8
89
21 1
86
37
77
91
48
93
94 5
16
74
108 7
1
95
25
81
23
22
20 6
109 4
7
11
28
33
13
31
82
97
46
112 1
0
58
76
29
36
24
98
45
102 7
27
106 5
7
18 4
92 9 2
110
111
103 1
4
60
35
30
32
38
65
90
105 4
1
96
62
56
17
68
113 4
2
40
59
43
107 3
9
70
114 6
6
44
54
104 4
9
An
nu
aliz
ed M
ort
alit
y, %
Farm ID
Week 6-18 Cummulative Annualized MortalityNon-POP Mortality POP Mortality

SOW MORTALITY PROJECT UPDATE 3-1-19 IOWA PORK INDUSTRY CENTER www.ipic.iastate.edu
THIS PROJECT IS SUPPORTED BY THE NATIONAL PORK BOARD PROJECT #17-224.
Overview: Quarter 2 (weeks 19-31 of 2018; May 6-Aug 4, 2018). One hundred two sow farms representing an inventory of 379,928 sows, have submitted mortality records. The following figures summarize the distribution and variation of sow deaths across reporting sow farms.
Figure 5 (Above). Annualized rate of pelvic organ prolapse (POP) for the first quarter of the project varied across sow farms during the project period from 8.5% to 0%.
Figure 6 (Above). Annualized total mortality for reporting sow farms for the first quarter of the project. The red portion of the bars represent the proportion of the sow mortalities that occurred that were not due to prolapse while the yellow portion of the bars indicates the proportion occurring due to prolapse.
0%
1%
2%
3%
4%
5%
6%
7%
8%
9%
3
79
60
36
86
26
99
84
85
25 2
83 5
87
102 2
2
62
100 4
1 8
88
35
97
19
101 6
5
42
109 9
8
14
11
10 6
23
94
108 1
33 7
105 5
7
78
58
20
73
38
82
71
66
30
29
72
27
74
13
77
48
103 8
1
47 9
28
106 9
2
91 4
59
80
24
45
12
107 9
5
114
104 3
7
93
15
112 1
7
49
39
113 4
6
70
31
111 7
5
21
96
40
54
44
76
32
90
110 4
3
89
16
18
68
An
nu
aliz
ed P
OP
, %
Farm ID
Week 19-31 Pelvic Organ Prolapse Rate
0%
5%
10%
15%
20%
25%
30%
99
12
85
79
84
72 3 8
21
101 7
5
109
100
103 7
3
23
86
89
16
91 5
83
88
19
74
78 1
87
97
94
26
47
14
60
77
30
110
108 8
0
35
11
31
36
20
48
18
10
25
13 7
27 6
22
111 9
38
98
71
95
81
96 2
32
102 9
3
33
28
90
58
82
65
114
106 4
5
105 7
6
113
112 6
2 4
66
104 5
7
92
42
15
41
107 2
4
59
29
39
17
43
46
37
49
68
40
44
70
54
An
nu
aliz
ed M
ort
alit
y, %
Farm ID
Week 19-31 Cummulative Annualized MortalityNon-POP Mortality POP Mortality

SOW MORTALITY PROJECT UPDATE 3-1-19 IOWA PORK INDUSTRY CENTER www.ipic.iastate.edu
THIS PROJECT IS SUPPORTED BY THE NATIONAL PORK BOARD PROJECT #17-224.
Overview: Quarter 3 (weeks 32-44 of 2018; Aug 5-Nov 3, 2018). Ninety one sow farms representing an inventory of 347,639 sows, have submitted mortality records. The following figures summarize the distribution and variation of sow deaths across reporting sow farms.
Figure 7 (Above). Annualized rate of pelvic organ prolapse (POP) for the first quarter of the project varied across sow farms during the project period from over 9% to 0%.
Figure 8 (Above). Annualized total mortality for reporting sow farms for the first quarter of the project. The red portion of the bars represent the proportion of the sow mortalities that occurred that were not due to prolapse while the yellow portion of the bars indicates the proportion occurring due to prolapse.
0%
1%
2%
3%
4%
5%
6%
7%
8%
9%
10%
3
99
86
60
25
100 5
84
26
79
65
87
19
109 8
0
41
20
88
58
57
85
108 9
7
33 2 1
22
98
78
10
12
83
14
11 6
38
82 4
28
101 9
2
94
42
27 7
48
72
15
32
45 9
77
105 3
9
95
37
103 2
1
112 7
3
13
35
113 4
7
91
70
30
81
23
40
66
104 5
4
71
44
107
111 7
5
96
24
31
110 9
3
17
106 7
4
114 1
6
46
43
49
An
nu
aliz
ed P
OP
, %
Farm ID
Week 32-44 Pelvic Organ Prolapse Rate
0%
5%
10%
15%
20%
25%
12
85
79
88
72 3
99
100 7
5
112 1
9
94
10
20
84
33
78
109 8
0
73
23
87
47
26
86
101
103 3
8
110 2
7 5
83
25
15
11
14
91
97
22
28
82
58
108 6
5
77
95
98
93
35
111 1
7
30 1
74
16
114 9
2
71
57
13 7
21
45 4
81
31
39 6
96
106 9
48 2
60
113 4
3
24
107 4
1
105
104 4
2
37
66
32
46
70
40
54
44
49
An
nu
aliz
ed M
ort
alit
y, %
Farm ID
Week 32-44 Cummulative Annualized MortalityNon-POP Mortality POP Mortality

SOW MORTALITY PROJECT UPDATE 3-1-19 IOWA PORK INDUSTRY CENTER www.ipic.iastate.edu
THIS PROJECT IS SUPPORTED BY THE NATIONAL PORK BOARD PROJECT #17-224.
Overview: Quarter 4 (week 45 of 2018 through week 5 of 2019; Nov 4, 2018-Feb 2, 2019). Ninety sow farms representing an inventory of 346,701 sows, have submitted mortality records. The following figures summarize the distribution and variation of sow deaths across reporting sow farms.
Figure 9 (Above). Annualized rate of pelvic organ prolapse (POP) for the first quarter of the project varied across sow farms during the project period from over 10% to 0%.
Figure 10 (Above). Annualized total mortality for reporting sow farms for the first quarter of the project. The red portion of the bars represent the proportion of the sow mortalities that occurred that were not due to prolapse while the yellow portion of the bars indicates the proportion occurring due to prolapse.
0%
1%
2%
3%
4%
5%
6%
7%
8%
9%
10%
11%
3 60
99
79
19 5 84
20
87
14
57
25
83
41
97
86
26
77
88
65
108 8
0
100
101 7
4 6 78
85
47
12 1 22
33
13
10 9
109 2
7
38
23
11
48
58 2 37
72
94 4 92 7 81
28
15
95
70
91
82
73
112 7
1
42
35
66
31
17
32
113 3
0
39
96
110
106 9
3
46
104 2
4
105 5
4
75
107
111 9
8
44
114 1
6
45
43
49
40
90
An
nu
aliz
ed P
OP
, %
Farm ID
Week 45-5 Pelvic Organ Prolapse Rate
0%
5%
10%
15%
20%
25%
30%
105 7
9
12
99
85
88 3
84
94
87
19
100 8
3
101 7
8
14
80
75
20
91
72
112 4
7
73
23
25
10 5
95
77
74
22
86
110 8
2
57
15
58
13
60
11
26
93
97
33
31 6
108 6
5
27
16
81
71
41 4
109 9 7
98
46
48
96
30
42
28 1
35
38
37
111 9
2
106
113 4
5 2
17
24
114 6
6
104 3
9
90
32
43
40
70
107 4
4
54
49
An
nu
aliz
ed M
ort
alit
y, %
Farm ID
Week 45-5 Cummulative Annualized MortalityNon-POP Mortality POP Mortality

SOW MORTALITY PROJECT UPDATE 3-1-19 IOWA PORK INDUSTRY CENTER www.ipic.iastate.edu
THIS PROJECT IS SUPPORTED BY THE NATIONAL PORK BOARD PROJECT #17-224.
Figure 11 (above). Breakdown of all mortalities reported for the whole year. A total of 21% of sow mortalities were the result of some form prolapse. Approximately 29% died due to lameness and related causes and 39% died due to other or unknown causes.
15% 4% 2%
6%
2%
3%
29%
39%
Breakdown of Causes of Mortality
Vaginal/Uterine Prolapse
Rectal/Anal Prolapse
Both Rectal and Vaginal/UterineProlapse
Difficulty Farrowing/Retained Pig(s)
Disease
Intestinal (Ulcer) Complications
Lame/Injured/Downer
Unknown/Other

SOW MORTALITY PROJECT UPDATE 3-1-19 IOWA PORK INDUSTRY CENTER www.ipic.iastate.edu
THIS PROJECT IS SUPPORTED BY THE NATIONAL PORK BOARD PROJECT #17-224.
Figure 12 (below). Breakdown of all mortalities reported for the four quarters of the project. Prolapses accounted for 24% of mortality in quarters 1 and 4 and 19% in quarters 2 and 3.
17%5%
2%
6%
2%4%28%
36%
Breakdown of Weeks 6-18 Causes of Mortality
Vaginal/Uterine Prolapse
Rectal/Anal Prolapse
Both Rectal and Vaginal/Uterine Prolapse
Difficulty Farrowing/Retained Pig(s)
Disease
Intestinal (Ulcer) Complications
Lame/Injured/Downer
Unknown/Other
13% 4%1%
6%1%
3%
30%
42%
Breakdown of Weeks 19-31 Causes of Mortality
Vaginal/Uterine Prolapse
Rectal/Anal Prolapse
Both Rectal and Vaginal/Uterine Prolapse
Difficulty Farrowing/Retained Pig(s)
Disease
Intestinal (Ulcer) Complications
Lame/Injured/Downer
Unknown/Other
14% 4% 1%
6% 1%
3%
30%
41%
Breakdown of Weeks 32-44 Causes of Mortality
Vaginal/Uterine Prolapse
Rectal/Anal Prolapse
Both Rectal and Vaginal/Uterine Prolapse
Difficulty Farrowing/Retained Pig(s)
Disease
Intestinal (Ulcer) Complications
Lame/Injured/Downer
Unknown/Other
17%5%
2%
4%
4%3%27%
38%
Breakdown of Weeks 45-5 2019 Causes of Mortality
Vaginal/Uterine Prolapse
Rectal/Anal Prolapse
Both Rectal and Vaginal/Uterine Prolapse
Difficulty Farrowing/Retained Pig(s)
Disease
Intestinal (Ulcer) Complications
Lame/Injured/Downer
Unknown/Other
Quarter 1: Weeks 6-18 (Feb 4-May 5, 2018) Quarter 2: Weeks 19-31 (May 6-Aug 4, 2018) Quarter 3: Weeks 32-44 (Aug 5-Nov 3, 2018)
Quarter 4: Weeks 45-5 (Nov 4, 2018-Feb 2, 2019)