Peggie Lusk J. -...
62
Senate Advisory Committee on University Affairs REPORT OF THE COMMITTEE ON THE ECONOMIC STATUS OF THE FACULTY September 1988 Members: Jesse E. Gordon, Chair (Social Work) Frederick J. Beutler (Engineering) Thomas E. Carey (Otorhinolaryngology) Richard Courtney (Dentistry) Lyubica Dabich (Medicine) Alan Deardorf f (Economics) Aaron Gordon, Sr. (Alumnus) Peggie Hollingsworth (Pharmacology) Don Jones (Mathematics) Wendy Lougee (Libraries) Sally Lusk (Nursing) Richard Lichtenstein (SPH) Cecil J. Nesbitt (Math, Emeritus, ex officio) Lawrence Root (Social Work) Lawrence Waggoner (Law) L. Yvonne Wulff (Libraries) Staff: Glenda Haskell, Research Associate Sharon K. Wieland, Secretary
-
Upload
truongminh -
Category
Documents
-
view
212 -
download
0
Transcript of Peggie Lusk J. -...

Senate Advisory Committee on University Affairs
REPORT OF THE COMMITTEE ON THE ECONOMIC STATUS OF THE FACULTY
September 1988
Members:
J e s se E. Gordon, Chair (Social Work) Frederick J. Beutler (Engineering) Thomas E. Carey (Otorhinolaryngology) Richard Courtney (Dentistry) Lyubica Dabich (Medicine) Alan Deardorf f (Economics) Aaron Gordon, Sr. (Alumnus) Peggie Hollingsworth (Pharmacology) Don Jones (Mathematics) Wendy Lougee (Libraries) Sally Lusk (Nursing) Richard Lichtenstein (SPH) Cecil J. Nesbitt (Math, Emeritus, ex officio) Lawrence Root (Social Work) Lawrence Waggoner (Law) L. Yvonne Wulff (Libraries)
Staff:
Glenda Haskell, Research Associate Sharon K. Wieland, Secretary


TABLE OF CONTENTS
I. Summary of 1987-88 Committee Activities and . . . . . . . . . . . . . Comments by the Chair 1
11. Subcommittee Reports
. . . . . . . . . . . . . . 1. Employee Benefits 6 . . . . . . . . . . 2. Merit Review and Equity .I0 . . . . . . . . . . . . . . . . . 3. Retirement 11
IV.
Presentations to the Regents
Remarks by the Chair, September 17, 1987 . . . . 14 . . . . . . . . Presentation of October 16, 1987 16
Compensation Statement, April 15, 1988 . . . . . 25 Salary Tables
. . . . . . . . . . . . . . . . . . Introduction 43
. . . . . . . . . . . . . . . . NotestoTables .45
1. UM Real Salary Program Change, . . . . . . . . . . . 1977/78 to 1987/88 ' 4 6
2. Index of Faculty Compensation at Major . . . . . . . . . Competing Universities . 4 7
3. Average Compensation by Rank for Michigan and . . . . . . Major Competing Universities .48
4. Mean and Median Salaries of Regular Full-Time and Part-Time Instructional Staff, Paid from all University Sources, 1986/87 to . . . . . . . . . . 1987/88, Professors. .50
5. Mean and Median Salaries of Regular Full-Time and Part-Time Instructional Staff, Paid from All University Sources, 1986/87 to . . . . . . 1987/88, Associate Professors 52
6. Mean and Median Salaries of Regular Full-Time and Part-Time Instructional Staff, Paid from All University Sources, 1985/86 to 1987/88, Assistant Professors . . . . . . 54

Table of Contents, Continued
7. Mean Salaries of Persons Appointed as Researchers and Librarians, 1986/87 to . . . . . . . . . . . . . . . . . 1987/88 56
8. Mean Salaries of Regular Full-TIme and Part-Time Instructional Staff, by Sex
. . . . . . . . . . . . . . . and R a c e . 57
9. Fringe Benefits Included in Determining . . . . Compensation, 1986/87 to 1987/88 58

SUMMARY O F CESF ACTIVITIES ANI) COMMENTS BY THE CHAIR Jesse E. Gordon, Chair 1987-88
Last year at t h i s time, outgoing CESF Chairman Professor Eugene Feingold asked, a f te r reviewing CESFts work of the year, whether the game was worth the candle.
A t tha t t i m e , I responded tha t it was the only game i n town, and our only option was to play it well.
CESF has played tha t game with vigor and assertiveness, and has made some noteworthy gains. In considering them, please keep i n mind tha t t he game is one of "consultative negotiation," s o t ha t none of these gains were made by CESF acting alone; almost all a r e the products of collaborative work with various committees and officials of the University. Among the gains a r e the following:
-A substantial feasibil i ty study of a "cafeteria" o r "flexible benefitst1 employee benefits plan is under way. CESF has neither endorsed nor rejected flexible benefits i n principle, but is active i n trying to make s u r e the Flexible Benefits Planning Committee fashions a plan that w i l l be the best one possible from a faculty point of view.
-The University has accepted the Calvert Fund, a socially- responsible investment vehicle, as an al ternative t o Fidelity and TIAA-CREF for SRA investments. Though the implementation process has been delayed by programming problems in the computerized payroll system, these problems are expected to be resolved shortly.
-The Executive Officers have supported i n principle the CESF proposal that the vehicles available for SRA investment should be available for regular retirement contributions. There a r e likely t o be some res t r ic t ions t o prevent investment i n the se lect portfolio funds within the Fidelity group, but even so, t h i s w i l l represent an enormous expansion i n the abil i ty of UM employees t o control the i r own retirement investments. This comes at about the same time tha t TIAA- CREF is also increasing the number of options available within its set of offerings, no doubt not coincidentally.
-A new and more appropriate set of peer ins t i tu t ions fo r sa la ry and employee benefits comparisons has been developed and adopted, with CESF participation.

-CESFts res is tance t o the policy of 50/50 sharing of increases i n heal th ca re premiums has begun t o pay off. A t t h e September, 1988. Regents meeting, t h e policy w a s revised--the University w i l l contribute a maximum of 85% of a weighted average of premium costs f o r t he 1988-89 year.
-CESF and t he Committee on Staff Benefits have increased t h e i r u se of a l iaison committee as a means fo r communication of i s sue s a t ea r ly s tages, s o t ha t w e are less l ike ly t o be i n a position of having t o respond a f t e r t h e fact.
-We have developed new direct ions i n t h e analys is of faculty salaries and incorporated these i n to our repor t s t o t h e Regents. These analyses enabled u s t o identify a marked t rend t o a g rea te r spread of salaries within ranks and among schools and colleges, and g rea te r overlap between ranks. Comparison over time of mean and median faculty salaries, by rank, show increasing gaps between them, which may be t he r e su l t of higher s a l a r i e s f o r a re la t ive ly few faculty, which push t he mean upward but not t he median. Further, they have ra ised quest ions regarding t he possibly divisive consequences of allowing t he e f fec t s of market forces on t he various f i e lds of s tudy t o d i f ferent ia l ly advantage and disadvantage t he earnings of facul ty members i n the various f i e lds of endeavor, i r respect ive of individual merit i n research, teaching and service.
-CESF has been act ive i n University planning fo r a dependent care program.
-What had heretofore been a temporary set of ru les regarding ea r ly retirement has been made permanent (for all faculty and s ta f f whose appointments began p r io r t o June 1, 1988).
Some matters continue on the CESF agenda. These include:
-Developing some mechanism fo r better benefi ts and retirement counseling of faculty, a matter made more urgent by t h e inc reases i n t h e investment, annuity, and health ca re options available.
-Policies regarding t he legal defense and indemnification of facul ty members.
-Housing ass i s t ance t o t h e faculty.
-A Wellness Program for t h e University.
-Tuition Benefits fo r family members.

CESF has failed in some of its init iat ives:
-Our proposal for supplementation of the annuities of faculty who ret ired between 1956 and 1966 w a s rejected by the Executive Officers.
-We have seen no evidence tha t inequit ies i n the faculty merit review procedures of certain schools and colleges have been resolved. It is of some in te res t t o those with a t a s t e for irony to note that the University is now studying dispar i t ies among the affluent and non-affluent uni ts i n the sa la r ies of P&A s taff at the same grade levels.
-Similarly, we know of no effor ts t o address the i s sue of the comparability of merit standards for administrators and faculty. This i s sue was raised i n our report t o the Regents i n which we noted tha t sa la ry increases for administrators and executives were significantly larger, on the average, than those provided t o the faculty,
A s I have noted, I believe tha t CESF has "played the only game i n town" well th i s year. Nevertheless, I would l ike t o ra i se the question of whether it need be the only game i n town, and whether we might do better t o play some other games as well.
Our game has been almost exclusively concerned with decisions made within the University. But when I think about what has been happening t o University appropriations throughout the l a s t decade, and t o higher education appropriations i n general during tha t period, I come t o the conclusion tha t we a r e devoting ourselves t o relat ively marginal matters having relatively little impact. We have been working on one of the s ide shows while the main event, i n center ring, is beyond our l ine of vision.
If what has been happening t o higher education i n Michigan i n the Michigan Legislature and the Office of the Governor had happened t o farmers, t o re t i rees , t o labor, t o veterans, t o physicians needing malpractice insurance, we would have seen and have seen streams of busses carrying farmers, t he elderly, workers, veterans, and physicians to Lansing. There would have been ra l l i es on the Capitol lawn, and delegations going from office t o office with protests , demands, poli t ical pressure, and the power of the ballot box as a source of influence. There would have been statements t o the press, feature news ar t ic les , TV pictures i n Michigan living rooms tha t dramatize and inform the state's ci t izens about what is going on.
I a m not here speaking only of faculty salaries. The sa la ry picture a t Michigan is largely an epiphenomenon of what has turned out t o be a continuous ser ious decline i n the Staters support of higher education. There is no mistaking the facts; we a r e witnessing a progressive deterioration of what was once a model

for a l l people of what public higher education can be, What has happened to faculty sa la r ies is the resul t of necessary, and I believe wise, ef for ts of the University t o accommodate t o and minimize the adverse effects of t h i s decline. Nevertheless, these accommodations have thei r own l i m i t s . W e are being driven t o cannibalization of our own colleagues; some legitimate and honorable f ields of scholarship have become endangered species, on the point of extinction; our effor ts t o share the pleasures of knowledge and enlightenment a r e increasingly restr icted t o those who can pay high prices t o hear and study with us.
Where has t h i s faculty, and the facult ies of other state colleges and universities, been all t h i s time? W e are inclined t o be tolerant; when the State gets in to a financial crunch, w e a r e l ikely t o take it philosophically for a year o r two, accepting that times a r e tough and tha t we must share t he troubles, with the expectation tha t when things get better, the State w i l l once again support higher education as it had i n t he past. But then, when a year o r two s t re tches into a decade, w e switch from tolerance to despair; w e decide tha t the trend is too pronounced t o be reversible, and tha t w e a r e being victimized by forces too powerful for us t o wrestle with.
Thus we go from feeling tha t we should do nothing t o feeling tha t w e can do nothing, writing our own prescription for passivity. Our form of academic governance is one i n which we ask t he University administration to do certain things i n pursuit of our common goals, and s o it is natural for us t o tu rn t o administrators and ask tha t they do something about higher education funding i n the s ta te , thus -- f i l l ing our own prescription for passivity.
Surely there is room between tolerance and despair for something else.
I offer the hypothesis tha t the consultative negotiations form of academic governance is a ra ther appropriate one for dealing with i s sues in ternal t o the University, but tha t such a s t ruc ture is too limited by the requirements for effective consultation t o be useful i n issues beyond the w a l l s of the university. I believe tha t w e need an organization--a different game--which is not dependent on the University for its resources, and which, by tha t fact, is able t o use techniques of influence which are precluded by consultative negotiation.
I hasten t o add tha t I a m not talking about collective bargaining. There are numerous higher education collective bargaining organizations i n the s ta te , and they do no bet ter than w e i n participating i n events outside the i r inst i tut ions. I a m talking about an association of those i n higher education i n Michigan, perhaps s ta r t ing here, which can operate as a force i n the s t a t e to

represent the needs of higher education and the needs for higher education--an organization which can complement the effor ts of University officials to res tore the role of higher education i n the social and political economy of the s ta te , while remaining at arm's length from University officials.
I suggest tha t you give serious consideration t o adding a new game t o the only one i n town.

REPORTS FROM SUBCOMMITTEES
REPORT FROM THE EMPLOYEE BENEFITS SUBCOMMITTEE
Lawrence S. Root (Chair), Richard Lichtenstein and Samuel Meisels.
The Subcommittee on Employee Benefits is charged with addressing issues related t o the employee benefits which are not within the specific province of the other CESF subcommittees (most notably, Retirement and Health Benefits). Our discussions during th i s year included a number of i ssues , with special at tention to:
1. Flexible benefits and the University plans for exploring the implementation of such a benefit arrangement;
2. Provisions for child care; and
3. Housing assistance for faculty.
Because of broad in te res t i n the University community i n the f i r s t two items, separate committees have been formed t o address them. These groups include representat ives of the faculty and the Subcommittee has not gone fur ther into these areas a f t e r its preliminary meeting with the Staff Benefits personnel.
The Need for Attention to Housing.
With regard t o housing assistance, the Subcommittee has discussed several areas of concern. These center on the conditions of the local housing market. While Ann Arbor housing costs remain below the levels of many a reas (e.g., California, New York City, Washington, and Boston), they a r e high re la t ive t o other areas. University policies which address t he housing problems faculty face may be necessary i f w e a r e t o a t t r ac t and re ta in faculty and if we a r e t o continue t o enjoy the benefits of a community-based university i n which faculty can l ive close t o the campus.
Housing ass is tance may be part icularly important for minority faculty members who a r e less l ikely t o come t o the University with an "economic cushion" t o enable them t o enter the housing market. For female faculty members, who most often have responsibility fo r children i n single-parent families, housing ass is tance may a l so be a cr i t ica l factor.
While we have not undertaken a systematic examination of the need for developing a housing policy, t h i s may be a useful approach. We a r e addressing t h i s i s sue because of the individual s i tuat ions which have come t o our at tention and i n anticipation of the combination of continued inflat ion i n the housing market coupled with the University's commitment t o developing greater diversi ty on campus.

Current ------ University H ~ u s i n g ~ ~ o l i c y .
The University does not have a specified housing policy for faculty. Two aspects of University policy, however, have part icular relevance:
1. University Mortgage Program - This is intended t o provide a service t o faculty members by offering mortgages. The mortgage program is not intended t o compete with private- sector lenders and, therefore, charges in teres t r a t e s which a r e a t o r above those i n the private-sector market. The advantages for faculty members (when it exis ts) a r e lower closing costs and, presumably, a greater willingness t o lend t o faculty members when there might be problems i n the private market (e.g., an income which doesn't quite reach the threshold for borrowing the amount needed). The extent t o which the l a t t e r benefit is actually operative is not known.
2. North Campus Housing - Faculty members a r e permitted t o live i n North Campus Housing for up t o two years. Although department chairs or deans can request extensions due to extenuating circumstances, t h e 2-year l i m i t is considered necessary because of the very high occupancy r a t e and the demand by students for family housing.
In addition, the University owns 15 houses and 11 apartments which a r e rented, generally t o visi t ing professors.
Possible A_~~roaches, --------- ------ --
Currently there is no specified housing "policy" for faculty. The close relationship between the c i ty of Ann Arbor and the University suggests a tradit ional link between the community and the campus which is an important aspect of the ambiance at Michigan. With inflat ions i n housing costs, t he natural development of t h i s relationship may be threatened. Within t h i s context, it may be appropriate t o consider art iculat ing a policy which focuses our at tention on the importance of strengthening th i s tradit ional tie. Such a policy could be expressed i n broad terms, such as:
"In recognition of the tradit ional ties between the University and the Ann Arbor community, it is the policy of the University of Michigan t o encourage the continuation of ties through programs which assist faculty members to find appropriate housing i n the area."
Implementing t h i s policy involves a number of possible approaches. In the deliberations of the Subcommittee we have t r ied to re ta in two key principles: (1) as a State-supported institution, t he University generally seeks t o avoid competing with the private market and ( 2 ) new programs i n t h i s area which require large net expenditures a r e l e s s likely t o be approved.
Several approaches suggest themselves for consideration, depending upon the problems which a r e identified.
Problem
Rental cost 1. renta l subsidies o r availability
2. University housing
Purchase cost 3. downpayment loans
4. low-rate mortgages
5. co-purchase plans
Rental Subsidies. I f the abil i ty t o afford renta l property is the -- --- --- ----- -- - - main problem, some form of rent subsidy may be useful. This could take the form of supplemental pay calculated on the basis of pay level and renta l costs. The nature of the formula would be the key t o whether t h i s was a costly program or not. For example, it might be relat ively inexpensive i f the subsidies only applied i n unusual o r atypical cases (e.g., a new as s i s t an t professor with dependents who takes an appointment a t the University i n one of the lower- paid f ields) . An al ternate t o a pay subsidy could be special contracts with local real tors for discounts for University faculty. Benefits for real tors could include such things a s greater s tabi l i ty i n the renta l unit and direct payroll deductions for rent.
University Hous i . , The University currently provides housing for students and, t o a limited extent, some faculty. This could be expanded. While such an approach would involve expenditures, it might be possible t o develop approaches which take advantage of the r is ing housing costs to use University funds in a way which develops equity. For example, the University could enter in to a partnership on an apartment development which includes some provision for greater access by faculty, while not sacrificing ren ta l income or investment potential.
Downpayment Loans. I f the problem is the cost of housing i n t h e area, one form of assistance t o faculty could be loans t o help new homeowners with the downpayment needed for home purchase. Among the programs a t Stanford University is downpayment assistance which combines a loan with an income supplement. While the Palo Alto a rea has experienced a f a r greater level of housing inflat ion which poses much more severe problems for faculty, the experience there provides a precedent and an example for the si tuation i n Ann Arbor.
Low-Rate Mortgaqes. Special mortgage programs have long been a par t of academic benefits. Endowment funds were often used t o

provide mortgage assistance i n private colleges and universities. The current University of Michigan program is designed more a s a convenience than an economic benefit. Mortgage assistance usually takes the form of below-market rates. A t Princeton University, there is a program for faculty members with at least a 3-year appointment which provides mortgages a t 1.5 percent below market rates. A t Yale University, contracts have been negotiated with local banks t o provide discounts and lower fees for mortgage payments, as well a s services such as payroll deductions for mortgage payments.
Co-Purchase Plans. In a co-purchase plan, the university is a partner i n the purchase. A t Stanford, t h i s is done through a second mortgage which is designed (along with the i r other programs) t o make housing i n the local area more affordable for faculty and t o "share the financial re turns and risks" of the transaction. The investment re turn on these co-purchases appears t o have more than paid for the program and resulted in significant gains for Stanford.
Recommendations - The discussions of the Subcommittee have been brought t o the at tention of CESF for discussion. If there is sufficient in te res t i n proceeding, the next s t eps a r e t o refine our understanding of these approaches and explore further the extent t o which housing is a significant enough problem for faculty t o warrant fur ther consideration.
REPORT FROM THE MERIT REVIEW AND EQUITY SUBCOMMITTEE -----
Lyubica Dabich, Peggie Hollingswor th, and Yvonne Wulff.
The Subcommittee met with Sue Rasmussen, t he U M t s Affirmative Action Compliance Officer, i n December, 1987, t o d iscuss t he 1985-86 Faculty Salary Equity Study. Rasmussen distr ibuted a document about and discussed the research procedures used i n t h e Study. Because affordable and accessible sources of information i n regard t o research productivity were not available fo r faculty throughout t h e University, rank served a s t h e indicator of quality.
Two conclusions were drawn from the study. Fi rs t , s a l a ry inequi t ies between e i the r women o r minorities and white males at t h e department and uni t l eve l were widespread, especial ly f o r women, although not subs tant ia l . Second, t he s a l a ry s t r uc tu r e a t t h e University (85-86) had not become more inequitable s ince t he late 1970s and ea r ly 1980s. However,. one purpose of t he s tudy was t o identify sa la ry "outliers," individuals who appeared t o be earning less than individuals with similar character is t ics (rank, t i m e i n rank, etc.). Twenty departments had suff icient ly negative coeff icients for minority or female salaries t o warrant fu r the r s tudy and were subsequently contacted. The deans were asked t o repor t back t o Virginia Nordby regarding s a l a ry increases o r speci f ic comparisons between ou t l i e r s and individual white males whose s a l a r i e s were at the predicted level.
Rasmussen a l so answered quest ions about t he Faculty Cohort Studies, an ongoing project of t h e Affirmative Action Office designed t o examine the problem of lower representat ion of females i n t he senior ranks of faculty. A repor t is available from the Affirmative Action Office.
Relative t o the charge t o follow up on the 1985-86 CESF Faculty Salary and Compensation Survey, t h e Subcommittee recommended t ha t CESF as a whole should decide what i s sue s deserve fu r the r at tent ion. A t a subsequent meeting of t he en t i r e Committee, t he following were identified a s such areas:
1. Criteria fo r merit review. 2. The dispersion of resources ac ross units . 3. The dispersion of s a l a r y money within units . 4. V i e w s of f a i rness of women and minorities.
Other quest ions posed by t h e Subcommittee t h i s year:
1. What is the h is tory of t h e employment of part-time faculty members? H a s the re been an increase?
2. Are the re inequi t ies i n pract ice among un i t s r e la t ive t o t h e granting of sabbaticals?
3. What UM policy e x i s t s r e la t ive t o t he employment of i n s t ruc to r s fo r lengthy periods of time?

REPORT FROM THE RETIREMENT SUBCOMMITTEE
Lawrence Waggoner, Chair; Cecil Nesbitt, Sally Lusk
1. CESF Annuity Supplemental Proposal
In December, the Executive Officers decided not t o approve the proposal because 1) they didn't wish t o endorse a program only for the faculty, 2) if offered t o faculty and s taff , such a program would be too costly for the University, and 3) they didn't wish t o establish a precedent of supplementing the annuities of those who re t i red from the UM a f te r 1956.
It is unclear as to what further action CESF w i l l take i n regard to t h i s issue.
2. Follow-up t o the CESF proposal tha t SRA options be expanded t o include the Calvert Social Investment Fund, This proposal was --- approved by the Regents i n the Fall of 1987. The University planned originally t o implement t h i s change a s of July 1, 1988, but due to administrative difficulties, it w i l l not be available unti l January 1, 1989.
3. CESF Resolution on a proposal t o increase retirement investment w t ions .
The following resolution was adopted by the Committee on September 19 and endorsed by SACUA on October 26, and short ly thereafter transmitted by SACUA t o the Executive Officers.
"CESF hereby petitions the University administration t o make the following changes i n the retirement program.
1. We propose tha t during the retirement accumulation phase that the Fidelity Group of Mutual Funds and the Calvert Social Investment Funds be made available as optional investment vehicles fo r all o r any portion of future retirement contributions, including the employee-paid 5% and the University-paid 10%. Further, such investments should remain fluid throughout t he accumulation phase t o the extent tha t the employee can t ransfer all o r any specified portion of funds accumulated i n Fidelity accounts t o the Calvert group and vice versa or back t o TIAA-CREF.
2. We propose tha t for as long as TIAA-CREF requires the purchase of an annuity a t the point of pay-out, retirement accumulations i n Fidelity and Calvert must be used t o purchase an approved annuity (but not necessari ly a TIAA-CREF annuity). In the ideal, we fur ther support t he option of cashability at t he point of pay-out but a t a minimum propose tha t any employee be allowed t o receive up t o 10% of one's to ta l retirement accumulations i n cash, as is now available through TIAA-CREF."
Members of t he Retirement Subcommittee met with Vice President Brinkerhoff i n January, 1988, to discuss concerns. The Investment Options Committee was subsequently formed and expects t o have a set of recommendations by ear ly fall , 1988. Professor Waggoner, CESFrs representat ive on th i s committee, reported t o the Senate Assembly on th i s topic i n June, 1988.
4. Review of proposed change i n the Early Retirement Rules
The Committee on Staff Benefits recommended the following changes:
1, To permanently adopt the "new" ru les which had been temporarily adopted beginning October 1, 1983, and
2. Require tha t employees hired a f t e r June 1, 1988, who achieve eligibility for paid retirement benefits and choose t o r e t i r e prior t o age 62 be required t o pay for thei r benefits un t i l age 62.
The Retirement Subcommittee recommended t o CESF tha t it not voice any opposition t o the proposal. CESF elected to follow the subcommittee's advice. The proposal was later adopted by the Regents at the i r June meeting.
5. _Retirement Counseling/Information for the Faculty
Elizabeth Baxter from the Human Resource Development Office (HRD) was contacted for information about the Retirement Planning Seminars offered through HRD. The Committee may want t o hear more about these programs, especially i n regard t o how they f i t into an overall plan for meeting faculty needs i n the area of retirement information and counseling.

PRESENTATIONS TO THE REGENTS

September, 1987
CESF statement to the Board of Regents on the Health Care Cost-Sharing Proposal
Jesse E. Gordon, Chair
The Committee on the Economic Status of the Faculty (CESF) vigorously opposes the de facto policy of requiring cost-sharing of health insurance premium increases by faculty with family coverage. Our opposition is both to the substantive and procedural aspects of t h i s initiative. This de facto policy is unfair, unjustified, and unwise.
This proposal constitutes a selective sa la ry reduction i n a year i n which University of Michigan faculty have received the lowest sa la ry increase of any s t a t e college or university i n t h i s s ta te . It is selective because it applies only t o those with coverage for 2 o r more persons (about 50% of covered employees), regardless of merit; it is a salary reduction because it is not accompanied by any increase i n benefits for those who a r e now required t o pay additional dollars out of the i r earnings,
It is unjustified. The only evidence bearing on the justification of th i s policy comes from a faculty-administration committee appointed by the president t o study and recommend means for the containment of health care costs--a committee which concluded tha t pas t applications of t h i s policy were not justified by real increases i n premiums.
According t o the report of the Health Care Cost Committee, some portion of l a s t year's and th i s year's premium increases a r e due i n par t t o a seriously ar t i f ic ia l premium reduction on 12-1-85. A s a resu l t of that error , the University's share of health care premiums has fal len precipitously from 85% to 75% i n less than 2 years, while other s t a t e colleges and universi t ies i n Michigan now contribute substantial ly more. Indeed, EMU, CMU and MSU pay 100% of t he health care premiums of thei r faculties.
It is our view tha t it was unjustified and unwise to in i t i a te a n enduring policy i n a year i n which prior administrative e r ro r s by health insurance car r ie r s which resulted i n an ar t i f ic ia l ly low premium were compensated by an ar t i f ic ia l ly high premium increase, giving the inaccurate impression of a sudden and dras t ic rise i n health insurance rates. W e are deeply concerned tha t the successive i tera t ion of a policy based on those administrative e r ro r s have thus accelerated the r a t e of erosion of faculty compensation.
In the more than 40 years of its existence, CESF has always made i tse l f available t o the University t o participate i n solving problems affecting the faculty's economic well-being. This collaboration has often been f rui t ful , A s an example, the new
program of Benefits Reimbursement Accounts was ini t ial ly proposed by CESF and developed by the administration in consultation with CESF; it is expected t o yield substantial dollar savings t o both the University and individual faculty members.
However, i n the current instance, the faculty's readiness t o consult with the University administration in a search for solutions t o University problems has not been reciprocated. CESF was not consulted or notified of the proposal being made to the Regents today. Nor was it consulted l a s t year when t h i s policy was implemented i n recommendations to the Regents. Nor has the University availed i t se l f of any of the other channels of communication available t o it to make the case for th i s policy t o the faculty. We understood the f i r s t time t o be a regrettable omission. On th i s occasion, we again make an urgent appeal for an opportunity t o part icipate i n a review and reformulation of the University's policy on its health insurance r a t e structure, and we urge the Regents t o s e t planning in motion which w i l l resul t i n a reversal of th i s erosion of faculty compensation.
(NOTE: In September, 1988, the Regents voted t o revise t h i s policy. Following the recommendations of the Health Care Cost Committee, the University's maximum contribution for t he 12/1/88 - 11/30/89 year w i l l be 85% of the cost of the weighted average of family coverage.)

Committee on the Economic Status of the Faculty Presentation to the Regents
October 16, 1987 Jesse E. Gordon, Chair
This is my second t r i p t o t h i s chair i n as many months. It has been customary for CESF t o use t h i s time t o review its compensation request of the previous year and the current economic s t a tu s of the faculty i n general with regard t o compensation. But we would l ike t o do something different today; we would l ike t o take a s t e p back and view CESF's role and what the requirements a r e for performing tha t role within the University. You have an outline of the topics I plan t o talk about; I w i l l t a lk about some of the characterist ics of the academic labor market a s it impacts on the way in which we do our business here, then about the various ways i n which facult ies organize themselves and can organize themselves t o do thei r work, and finally w i l l i l lus t ra te some of these matters by making reference t o i t e m s which a r e of recent o r current in te res t t o our faculty i n order f i r s t t o l e t you know what it is tha t the faculty is thinking about and working on and secondly t o enhance the process of mutual consultative negotiations and collaboration i n solving these problems.
First, a few comments on the academic labor market. One of its characterist ics tha t is quite important t o us is the mobility of academics. They move around a great deal; there are a very few of u s who have not worked at other universi t ies and there are very few of us who could not be induced t o work for other universities, Indeed, t h i s is a kind of self-induced mobility; we fos te r our own competition because we encourage our faculty members t o publish. W e acquire reputations. We a r e encouraged t o go t o other universi t ies t o make presentations, and t o part icipate i n conferences and academic forums. A l l of these occasions a r e implicitly a lso a "looking-over" of the visi tor and a wondering by those at the host ins t i tu t ion as t o whether t h i s is not someone they might l ike t o a t t r ac t t o t h i s place. Hence, w e fos te r our own competition.
A second characterist ic of academics is tha t individual professors have enormous discretion i n how w e do the work s e t before us, specifically what ac t iv i t i es we w i l l devote time to, where the work w i l l be done, and the extent t o which care w i l l be exercised in doing various par t s of the job. This range of discretion almost defies the abil i ty of management t o r e s t r i c t and t o regularize i t , t o be su re tha t the faculty member chooses act iv i t ies t h a t contribute most directly to the University's goals.
A th i rd characterist ic I want t o point t o is what I have called "diversity within commonality." W e a r e i n a ra ther peculiar circumstance i n tha t other than the research faculty, l ibrarians, and curators, we a r e all i n the same job classification--we a r e all professors. So there is a great deal of commonality among us and a

great deal of collegiality, even though within the larger classification we have our special t ies, our academic a reas tha t t o some extent constitute a range of diversity. We a r e therefore pulled i n two different directions--to our particular field of inquiry and t o our academic discipline, but on the other hand by our loyalty t o the professoriate i n general.
The last matter to which I want t o draw your attention is our ra ther di rect influence on the character of the candidate pool for our own replacements; one of our products is ourselves, through our graduate training programs. We a r e especially aware tha t when it comes t o recruitment of minority and women faculty, one of t he f i r s t places we turn our at tention t o is the production of minority and women Ph.D.s a s one of the ways i n which we can solve some of our recruitment problems. This i s sue becomes especially important because our graduate students' observations of our working conditions affect the extent to which they wish to devote themselves t o academic careers. I believe th i s is becoming a matter of increasing concern, part icularly i n the sciences, where very many graduate students a r e turning away from academic careers t o go into other areas, and th i s consti tutes a rea l and growing problem for universities.
There are , no doubt, other characterist ics of the academic labor market which could be spoken to, but I would l ike t o now ta lk about the ways i n which, given those characterist ics, w e organize ourselves. One way i n which many universi t ies have gone is the collective bargaining route. We a r e not very familiar with tha t here and obviously do not know very much about i t , but i n t ha t route, compensation and many aspects of work conditions a r e matters of explicit negotiated contracts between the faculty and the University. Many universi t ies have gone th i s way, and I real ly don't know what the effect is. It does seem tha t various expectations of imminent d i sas te r for universi t ies with faculty unions have turned out not t o be the case. Whether they have achieved what they hoped t o by tha t method of organization I can't speak t o at t h i s time. In any case, w e here at the University of Michigan have chosen a very different model, one which I w i l l ca l l consultative negotiations. This model places certain requirements on u s for effective implementation. I'd l ike to talk about some of these requirements.
One requirement is a degree of mutuality of objectives between the faculty and the University and I think we need t o keep i n mind tha t many of CESFts activi t ies, many of the i s sues tha t it addresses i t se l f to, have t o do with the University's abil i ty t o do th ree

things: 1) recrui t faculty, 2) re ta in faculty who a r e capable of achieving University goals, and 3) produce the kinds of conditions which support the faculty's performance i n pursuit of University goals. These a r e the ultimate goals o r objectives behind the various concerns of CESF regarding compensation, fringe benefits, and so on. We do have a mutuality of objectives i n that respect.
The consultative negotiations model puts faculty i n a particular set of roles, One of the things w e contribute t o tha t model is our knowledge of faculty views and faculty needs as represented by our own views and needs; on CESF w e have access t o some kinds of information which can come to the University through other sources. Yes, it is t rue tha t Deans can t e l l the Executive Officers some things about what thei r faculty is thinking: I daresay that an inquiry would show two things about Deanst knowledge of faculty: 1) they know a good deal more about what the faculty is thinking than the faculty thinks they know, and 2) they a r e almost the l a s t ones to know what's going on with the faculty i n thei r own units. So, we have something t o contribute through our particular close contacts with our colleagues,
A second aspect of our role, however, is tha t we are, all sixteen of us who se rve on CESF, volunteers. This is an additional job for us, and therefore the time tha t we have t o devote t o it is by necessity limited--our time is not completely elast ic. This limitation creates some diff icult ies i n the process of consultative negotiations. I am now in my twenty-ninth year a t the University of Michigan, and there is still a great deal that I ought t o know i n order t o perform my job a s Chair of CESF more effectively, and yet I cannot devote tha t kind of time t o learning those aspects of the job, and hence my abil i ty t o part icipate i n consultative negotiations is restr icted.
What a r e the s t ruc tures for problem-solving within the model of consultative negotiations that a r e available to us? One is access t o informatior,. The consultative negotiation model, unlike, let us say, the collective bargaining model, is one i n which the faculty must re ly t o a g rea t extent on the University and particularly on the Administration for information needed i n order t o be able t o part icipate i n important decisions. We do not have the resources for generating much information on our own. We do not have the time, and w e do not have the money.
A second s t ruc ture tha t is needed for u s t o work together is a number of joint working groups, arenas i n which w e may discuss i s sues as they a r i s e and examine various viewpoints, and seek solutions which a r e sat isfactory among the various in te res t s t h a t a r e represented. We do have some of these structures: indeed, my

presence here today consti tutes one of them. But I think you a l l recognize that many of these issues need t o be worked on and developed a t much lower levels, as well. Although w e have a range of joint faculty-administration committees, there a r e a lso a reas i n which such s t ructures a r e lacking. I w i l l now i l lus t ra te some of those things by making reference to current and potential a reas of consultative negotiations.
The f i r s t general area is health care.
1. Long Term Care Insurance, Long-term care is one of the uncovered social need a reas i n the nation as a whole and is increasingly becoming a focal problem. Long-term care is needed by those who a r e chronically ill and who require ongoing nursing care. W e need t o perhaps examine whether some kinds of insurances can be made available t o faculty tha t w i l l cover long-term care.
2. Wellness Programs. The Wellness Committee, which was formed last year, was asked t o study whether the University ought t o develop wellness programs and was a lso charged with examining the role of the Periodic Health Appraisal Unit. The Committee's preliminary report recommended further study and the creation of a UM t e s t group; CESF w i l l continue t o monitor t h i s area.
3. Benefit Reimbursement Accounts. As you w i l l recall, t h i s is an arrangement which enables faculty and staff t o pay dependent care and medical expense costs with pre-tax income. This arrangement was in i t ia l ly suggested by CESF t o the University and w i l l be a cost-saver to both faculty and staff a s well a s t o the University. W e w i l l continue t o monitor the implementation of the program; w e a l so recognize, however, tha t current act iv i t ies i n Congress may sharply l i m i t the advantages of t h i s kind of program.
4. _Health Care Cost Containment. A joint faculty-administration group, The Health Care Cost Committee, has looked into methods by which health care cost increases could be limited. I understand tha t the act iv i t ies of tha t committee w i l l be continued, although the exact s t ructure of the group is yet t o be determined. This area is of great in te res t t o the faculty, and we w i l l continue t o be involved.
5. University Contributions t o Health Insurance. This matter, about which I spoke t o you last month, continues t o be a problem of enormous concern and importance t o the faculty. The Health Care Cost Committee has recommended an upward adjustment i n the level of the University's contributions t o premiums, and we w i l l be greatly interested i n how the University w i l l respond. This is one of the areas i n which CESF feels t ha t the channels and t he s t ruc tures for problem solving a r e inadequate. A s mentioned to you a t your September meeting, we were not directly involved i n the discussions which resulted in tha t decision and hence did not have
an opportunity t o make arguments against the kind of policy tha t w a s recommended and eventually adopted. Even assuming that , as your own votes l a s t month suggested, CESF was wrong i n its opposition to tha t policy, we are l e f t with a feeling tha t we have unnecessarily spent much t i m e and effor t i n an area where potential existed for ea r l i e r agreement with you had w e been involved and been made aware of the situation.
A second area of in te res t is matters of retirement.
1. Annuity Supp,Lementatio~l, CESF proposed supplementation t o the annuit ies of faculty members, o r thei r survivors, who re t i red between 1956 and 1966. Some of these individuals are qui te old. Their sa la r ies were low compared t o current salaries, the i r contributions t o retirement w e r e therefore small, and they a r e living on very small incomes. We have a le t ter , for example, from a re t i red professor who spent 30 years at the University and repor ts tha t she is receiving $1500 annually from her UM annuity. This is obviously insufficient.
CESF has proposed a formula for supplementation, but watching glaciers move has been more exciting than watching the progress of t h i s proposal. It got bogged down, recommended against, and was revived by CESF. We understand tha t it w i l l be coming t o the Executive Officers soon and hope tha t t h i s matter can be deal t with very expeditiously, because as we indicate, w e are talking about a population of very old people who a r e i n great need.
2. A Socially Responsible SRA Option. In the f a l l of 1986 a substantial number of UM employees petitioned the University t o make available t o them an investment vehicle for the i r supplementary retirement accounts (SRAs) consistent with the i r moral beliefs. There a r e a number of mutual funds t ha t screen the i r investments s o as not t o be invested i n weapons production work, business i n South Africa, environmental degradation, and the like. Currently, TIAA-CREF SRAs and Fidelity SRAs are the only investment vehicles available t o us. CESF then proposed tha t t he Calvert Social Investment Fund be made available t o UM faculty and s taff . This proposal has been approved by the Executive Officers and w i l l be available soon.
3. Increased Investment Options. Along very similar l ines, t he re is considerable criticism of TIAA-CREF as the major vehicle fo r retirement investments i n t h e higher education community. This problem has reached enormous proportions; recently there is hardly an i s sue of the Chronicle of Hiqher Education without an a r t i c l e about the controversies over TIAA-CREF; a r t i c les have a l so appeared i n the W a l l S t reet Journal and Barrons. CESF has proposed tha t the University make other investment vehicles available t o the faculty and s taff as al ternatives t o TIAA-CREF for the basic retirement plan, and tha t furthermore these should be the same investment vehicles available fo r SRAs. CESF's proposal has

been endorsed by SACUA and forwarded t o t he Executive Officers. It is the general belief tha t providing some alternatives puts TIAA-CREF i n a position of competition, which should improve thei r performance and the i r services.
4. Benefits Information and Counseling Resources. The last item under retirement is information and counseling resources, A s our options for health care have proliferated i n t he past several years, and as the options for the investments i n SRAs and the basic retirement plan increase, the needs of the faculty member for information and counseling i n order t o choose one's options has increased greatly. One of the matters, then, tha t CESF w i l l be concerned with t h i s year is what s t ruc ture can be put i n place t o provide more counseling and information t o the faculty about retirement and investment matters.
A th i rd a rea of i n t e r e s t is fringe benefits.
1. Tuition Loan Plan. In May, 1985, CESF forwarded a proposal for a tui t ion loan program t o the Executive Officers. Essentially, the proposal was for a loan fund. A s universi ty tui t ions have r isen so dramatically, not only here but elsewhere, tui t ion for our children has constituted a major problem for many faculty members, whereby some find themselves i n the unfortunate position of being unable t o afford t o send their children t o the ins t i tu t ion a t which they teach. This consti tutes a problem, I think, fo r our abil i ty t o re ta in faculty members, especially when we a r e competing with other ins t i tu t ions tha t provide tui t ion assistance. About the time that one's children a r e i n high school would be a very good time t o consider moving t o one of those inst i tut ions, even a t a lesse r salary, considering the enormous dollar worth of the tuition tha t would be provided by these inst i tut ions.
2. Flexible Benefits. A s you know the University is moving ahead on a feasibil i ty study for a cafeteria plan for fr inge benefits, and tha t is of great in te res t t o CESF and w e w i l l continue to work with you on t h i s issue.
The last th ree i t e m s under fr inge benefits may be new t o you.
3. Housing Assistance. T h e housing market i n Ann Arbor has changed dramatically recently, and it has put us in to a very diff icult position as f a r as recruitment of new young faculty members. They come here f resh from the i r doctoral t raining program; they typically have no money, no capital; they are paying off student loans, and therefore cannot afford a downpayment on a house. Some come here with children and they find the available housing i n some cases less adequate, less comfortable for them, than the faci l i t ies they were living i n when they were doctoral s tudents elsewhere. Our abil i ty t o re ta in these people is becoming a matter of great, great concern. I know some young new women

faculty a t the University; they have children and a r e one-income families, and they find it is almost unaffordable t o l ive here. We have to look into the extent t o which th i s is a problem and what the University can do about it.
4. Child Care. The same is t rue i n regard t o child care. Many of - our new faculty a r e responsible for young children; they come here at a time when they are beginning their academic careers, and th i s consti tutes a s t r a in on them which makes them quite discouraged about thei r abi l i ty t o achieve tenure, thei r abil i ty t o devote the kind of time and effor t t o the i r research tha t w i l l advance them. We know tha t Ann Arbor is cr i t ica l ly shor t of child care facilities, and it is something the University w i l l have t o examine and perhaps take some ini t ia t ive on.
5. Maternity Leave. There is, a s f a r as I know, no University- wide policy on this ; it is i n practice handled separately by the units, and some uni ts a r e quite responsive to the needs of women faculty for maternity leave whereas others a r e not. Women faculty members, especially those new t o the University, do not wish t o make excess demands on the i r units , don't want t o make waves, a r e trying to position themselves s o they can do thei r work well, don't know what is available, and a r e sometimes quite reluctant t o in i t i a te conversations about t h i s matter. Practices vary greatly across schools, and another area we need t o look at is the impact of maternity leave on the tenure clock, And here too, t o the best of my knowledge, we have no inst i tut ional policy.
A fourth area of general concern is that of merit reviews. A section of t he 1985-86 CESF Faculty Salary and Compensation Survey concerned the views of the faculty regarding the i r experience with merit review procedures and outcomes. The survey data have shown tha t there is enormous variabil i ty among uni ts on the campus in the adequacy of the i r merit review procedures, i n t he explicitness of the c r i t e r ia which faculty members must meet, and i n the mode of administration and the amount of knowledge tha t faculty have of the merit review procedures and cri teria. This variabil i ty across campus is rea l ly enormous. W e want t o ask ourselves whether o r not w e may want t o move towards some University-wide minimum standard for t h e m e r i t review program. Minority faculty who responded t o t he survey reported significantly less satisfaction with the i r pay, less knowledge of the c r i t e r ia for sa la ry determination, and less confidence i n the fa i rness of the reviews.
In our e f for t s t o in te rpre t these data, w e recognize t ha t it is often the case t ha t minority faculty are not as directly plugged in to the informal information network tha t other faculty are familiar with, and s o a r e often less likely t o receive information about these matters. Indeed, one of the most personal matters for faculty members is the i r compensation. It is a topic t ha t they a r e l ea s t l ikely t o ta lk about with t he i r colleagues, and even less

l ikely t o ta lk about with colleagues who are i n some way different from them, with whom they have relat ively l i t t l e social interaction, and so on.
New faculty members who have themselves not come from academic families, from professional and academic careers, a r e l e f t not knowing what the rules of the game are. They don't know, and know tha t they don't know, or sometimes have misunderstood, and don't real ize it; the resul t can be feelings of suspiciousness and alienation.
So we need t o look a t the explici tness of the cr i ter ia used by the units, the i r relevance to University goals, the objectivity and fa i rness of the administration of merit review procedures, the adequacy of the related information which is made available t o the faculty, and the balance between merit and equity.
The i s sue I referred to earlier--diversity within commonality-- becomes particularly relevant here. There are ra ther large cross- discipline differences i n sa la ry level as a resul t of market factors, but we a lso feel tha t we a r e engaged i n a common enterprise, and the s ize of the differences exceeds the extent t o which we feel tha t commonality. W e can identify faculty members i n a particular discipline who, when they were i n thei r academic discipline's department, received one sa la ry but l a t e r practiced the same academic discipline i n another college of the University, and subsequently had thei r sa la r ies doubled or tripled. So we want t o a sk how great ought the differences t o be, and how should we s t r i k e the balance between these market factors and the sense of collegiality across units within the University?
L e t me tu rn now t o the l a s t item, faculty compensation, which is typically one of the items we discuss with you.
1. Race an& Gender Salary Equity The f i r s t and largest pr ior i ty for CESF t h i s year is race and gender sa la ry equity and w e a r e currently trying t o gain access-to such information i n order t o determine whether minority and women faculty a r e indeed earning appropriate salaries. I don't know whether the information is available; nor do I know i f CESF w i l l be given access t o i t , but the matter of sa la ry equity is of primary concern t o the faculty.
2. Merit Review. A second i t e m here, which I have already touched upon, is inter-unit and intra-unit differentials, especially i n regard t o the operation of the merit system. We need t o ask ourselves, how wide ought t he gap be between the "stars1' and those faculty who a r e doing a good and substantial job, but who a r e not "stars.ll This question is one CESF w i l l study t h i s year.
3. Peer Universities. In conjunction with Associate Vice President Bob Holbrook's office, CESF has been involved i n reexamining a list of peer universi t ies and how we use it. That consultative process has gone forward and I think very successfully. We may a l so look at other market forces tha t affect the way i n which we think about

compensation. For example, l a s t month we talked about health care costs, and the question arose a s t o the quality of our fringe benefit package, compared with, for example, industry or our competitors. The view was expressed tha t our health care benefits are relat ively good. Whether t h i s is t r u e remains t o be seen, and we w i l l need more information before we respond. We can all c i te aspects of our benefits which we believe are insufficient. Certainly, for example, we know tha t some organizations, as par t of a flexible benefits plan, w i l l pay some portion of employees1 child care costs. Others w i l l pay up t o a maximum amount per year for legal expenses of thei r employees. We a l so know tha t many public employees have thei r health care costs covered completely and tha t they have much better insurance (medical, dental, and s o on) than is provided t o the University faculty.
There a r e cer ta in benefits which a r e simply not available t o us; we do not receive annual bonuses, such as those i n industry; we do not have access t o profi t sharing, stock investment plans, etc. These a r e all matters tha t affect our judgment of the adequacy of our package as compared t o peer univers i t ies and other market forces,
Finally, the l a s t item I wish t o address is the annual compensation request tha t CESF makes to the Regents i n the Spring. W e a r e not happy with the format we have used, and w e a r e certainly not happy with the outcomes, and we a r e casting about for ways in which we can make our compensation request t o you more successful. I want to particularly appeal t o you for help, because you can t e l l us what you need t o hear from us i n order t o understand our points of view. These considerations a r i s e because i n l a s t year's CESF report, i n a section enti t led "Is the G a m e Worth the Candle?", pas t chair Eugene Feingold asked whether it is worthwhile tha t we invest s o much of our voluntary time and effor t i n these activi t ies. When we look a t the outcome, we're not s o very sure, and I must t e l l you tha t t ha t s t ruck a very responsive chord among the members of Senate Assembly. There was a good deal of discussion about whether we ought t o keep playing the game. I, when my turn came t o speak t o the faculty, suggested tha t s ince it is the only game i n town, w e can ask only how w e can improve the way the game is played. If we can't improve i t , the only other option is t o change games.
I a m here today t o ask for your advice about how we can improve the way the game is played.

CESF APRIL COMPENSATION STATEMENT TO THE REGENTS
Jesse E. Gordon, Chair April 15, 1988
(Edited for Inclusion in the CESF Annual Report)
It has been customary for CESF t o use t h i s time t o review its compensation request of the previous year and the current economic s t a tu s of the faculty i n general with regard t o compensation. But today we would l ike to take a s t e p back and view CESF's role and what the requirements a r e for performing tha t role within the University.
CHARACTERISTICS OF THE E A D E M f C LABOR MARKET ----
1. Academics a r e relat ively mobile. Publishing and presenting papers lend themselves t o increased mobility.
2. Individual professors have enormous discretion in how and when we do our work.
3. We experience "Diversity within Commonality."
W e a r e pulled i n two different directions - loyalty t o our particular field of inquiry and our academic discipline, and loyalty t o the professoriat i n general.
4. W e can influence the character pool of our replacements by working t o increase the pool of minority and women faculty. Graduate students' observations of our working conditions can affect the extent t o which they consider an academic career,
THE WAYS I N WHICH FACULTY ORGANIZE
One s ty le of organization is collective bargaining, i n which compensation and many aspects of work conditions are matters of explici t negotiated contracts between the faculty and the University. We at the University have chosen a different model, which we ca l l consultative negotiations. One requirement of a Consultative Negotiation process is a degree of mutuality of objectives between the faculty and the University.
W e share a mutuality i n tha t many of CESFfs act ivi t ies address the U f s abil i ty t o do th ree things:
-recruit faculty
-retain faculty capable of achieving U t s goals; and
-create conditions of work which support University goals.

The Consultative Negotiations model puts faculty i n a particular set of roles:
-We contribute t o the model because w e a r e the designated representatives of the larger population of the faculty, yet
-CESF consists of volunteers (with limited time), and t h i s creates some difficulty i n the process.
The following s t ructures for problem-solving ex is t within the model of Consultative Negotiations.
CESF relies on the Administration for information the Committee needs i n order to participate i n important decisions because CESF lacks the necessary resources (time and money).
Joint working groups exis t t o discuss issues, examine viewpoints, and seek solutions which a r e sat isfactory t o all groups. There Is a need for more of these types of joint working groups at the lower levels of decision-making.
CURRENT AND POTENTLAL AREAS O F CONSULTATIVE NEGOTIATIONS
1. Long-Term Care Insurance
This insurance is needed by the chronically ill who require ongoing nursing care, There is a need to examine whether such insurance can realist ical ly be made available t o the faculty.
2. Wellness Programs
The Wellness Committee, which w a s formed l a s t year, was asked t o study whether the University ought to develop wellness programs and w a s a l so charged with examinning the role of the Periodic Health Appraisal Unit, The Committee's preliminary report recommended further study and the creation of a UM t e s t group; CESF w i l l continue t o monitor t h i s area.
3. Benefit Reimbursement Accounts
This arrangement enables faculty and staff t o pay dependent care and medical expense costs with pre-tax income. It w a s in i t ia l ly suggested by CESF t o t he University and is a cost-saver t o both faculty and staff as well as t o the University. CESF w i l l continue t o monitor the implementation of t he program.

4. Health Care Cost Containme~t
A joint faculty-administration group, the Health Care Cost Committee, has looked into methods by which health care cost increases could be limited. I understand tha t the act iv i t ies of that committee w i l l be continued, although the exact s t ructure of the group is yet t o be determined. This a rea is of great in te res t t o the faculty, and w e w i l l continue t o be involved.
5. University Contributions t o Health Insurance
This matter continues to be a problem of enormous concern and importance t o the faculty. The Health Care Cost Committee has recommended an upward adjustment i n the level of the University's contributions t o premiums, and we w i l l be greatly interested i n how the University w i l l respond. This is one of the a reas i n which CESF fee l s tha t the channels and the s t ruc tures for problem solving a r e inadequate. We a r e l e f t with a feeling that we have unnecessarily spent much time and effor t i n an area where potential existed for ear l ier agreement with you had w e been involved and been made aware of the situation.
CESF wants the opportunity to be directly involved in the discussions leading t o the recommendations which go t o the Regents.
6. e t i r e m e n t Matters
a. Annuity Supplementation.
CESF has proposed a formula for supplementation of annuity payments t o those faculty (or t he i r survivors) who re t i red between 1956-66. [Postscript note: t h i s proposal w a s not approved by the Executive Officers.]
b. A SociaJly Responsible SRA Option
CESF proposed tha t the Calvert Social Investment Fund be made available t o the UM faculty and s taff . The proposal has been approved by the Executive Officers, and w i l l be available soon [scheduled t o be available i n July, 19881.
c. Increased Investment Options.
There has been considerable criticism of TIAA-CREF as the only investment vehicle available for regular retirement contributions. CESF has proposed tha t the UM make available other investment vehicles (those available for UM SRA contributions). [Postscript note: t h i s matter was brought t o t he Executive Officers, and a committee has been appointed t o study th i s i s sue and make a s e t of recommendations. J

d. Benefits Information and Counseling Resources
The information necessary to well-thought-out retirement and health insurance decisions has increased considerably.
CESF w i l l be looking into what s t ructures can be put into place t o provide more such information and counseling t o the faculty.
7. Employee Benefits.
Tuition Loan Plan
Tuition for our dependents is becoming an ever greater problem, and the UM is i n some instances competing for faculty with other inst i tut ions tha t provide such assistance. CESF forwarded a tuition loan plan proposal i n May, 1985.
b. Flexible Benefits
The U. is moving ahead on a feasibil i ty study for a cafeteria plan. CESF w i l l continue to address th i s issue.
c. Housing Assistance
The current housing market makes it diff icult for new young faculty members, expecially those who come from economically disadvantaged backgrounds, t o afford the purchase of a home, and the UM1s abil i ty to re ta in such individuals is becoming a matter of great concern. CESF wants to look into the extent t o which th i s is a problem and what the UM can do t o address it.
Child Care ----
New faculty who a r e responsible for young children a t the same time as they a r e beginning their academic careers may feel discouraged about the i r abil i ty t o find sufficient time t o devote t o the i r research, upon which advancement and tenure hinge. The need for support i n the area of child care is an i s sue the University w i l l have t o examine and take some ini t ia t ive on.
e. Maternity Leave
Maternity leave is i n practice handled separately and i n varied fashion by the units. Women faculty members may not know what is available and a r e sometimes qui te reluctant t o in i t i a te conversations about t h i s matter. W e a l so need t o examine the impact of maternity leave on the tenure clock.
MERIT REVIEWS
The data from the 1985-86 CESF Faculty Salary and Compensation Survey have shown tha t there is enormous variabil i ty among uni ts i n the adequacy of merit review procedures, the explicitness of

merit cr i ter ia , the mode of administration, and the amount of information available to the faculty. We ask whether we may want t o move toward some University-wide standard for the merit review program. Of particular concern are the survey responses of minority faculty members, who reported less satisfaction with pay, less knowledge of cri teria, and less confidence i n review fairness.
We need t o look a t the explicitness of the cr i ter ia used by the units, thei r relevance to University goals, the objectivity and fa i rness of the administration of merit review procedures, the adequacy of the related information which is made available to the faculty, and the balance between merit and equity.
A related i s sue is the matter of large cross-discipline differences i n sa lary level. We want t o ask how great the differences ought t o be, and how we can s t r i ke a balance between market factors and the sense of collegiality across uni ts within the University.
FACULTY COMPENSATION -.-. --.
Race and Gender Salary Equity. -The f i r s t and largest pr ior i ty I* - - - fo r CESF th i s year is race and gender sa lary equity and we are currently trying t o gain access t o such information. The matter of sa la ry equity is of primary concern to the faculty.
2. Merit Review. How wide ought the gap be between the "stars" and those faculty who a r e doing a good and substantial job, but who are not "Stars?" This question is one CESF plans t o study th i s year.
3. Peer Universities, In conjunction with Associate Vice President Bob Holbrook's office, CESF has been involved in reexaming a list of peer universi t ies and how we use it. That consultative process has gone forward very successfully.
4. Employee B e n e f i w a t the UM Relative t o Benefits i n Industry, In September we talked about health care costs, and the question arose a s t o the quality of our fr inge benefit package, compared with, for example, industry o r our competitors. The view was expressed tha t our benefits are relat ively good. Whether t h i s is t r u e remains t o be seen, and w e w i l l need more information before w e respond.
Other organizations offer such things as payment of child care cos t s through a flexible benefits plan, some degree of coverage for legal expenses, and more comprehensive health insurance coverage. Other benefits, such as annual bonuses, profi t sharing, and stock investment plans, a r e simply not available t o us. These are all matters which affect our judgment of the adequacy of our benefits package.

ANNUAL COMPENSATION STATEMENT
We on CESF a r e casting about for ways i n which we can make our compensation statement t o you more successful. Last year's CESF Chair posed the question t o the Senate Assembly a s t o whether it is worthwhile for us t o invest s o much voluntary effort i n these act iv i t ies ("Is the Game Worth the Candle?"). When my turn came t o speak t o the faculty, I suggested tha t s ince it is the only game i n town, we might better ask, "How can we improve the way the game is played?" Only you can t e l l us what you need t o hear from us i n order t o understand our points of view.

FIGURE 3 CESF Presentation to the Board of Regents, April 15, 1988
Distributions of Assistant Professws' 1976-77 Salaries h ?he Three Lowest P3id and Three Hqhst Paid W*l Sctrcwk*
(in 1586-87 &llars)
Ctistrittutions of Assistant Professors' 1 986-57 Salaries in the Three Lowest Paid and Three Highest Paid UM Scbok*
20 22 24 26 28 30 32 34 36 38 40 42 44 46 48 50 52 54 56
In tftiwsands of dollars
&See Notes immediately following

FIGURE 2 CESF P r e s e n t a t i o n t o t h e Board o f Regents , A p r i l 1 5 , 1988
DiSkht ix is of Associate P T o f e ~ w s ' 1376-77 Salaries in the Thee Lowest Paid and Three M g f ~ s t Paid tiM Schcrok*
fin 1 986-87 dollars)
Ln thousands of dollars
I +- Lowest -0- Highest I
Distributions of Associate Professors' 1986-87 Salaries in +he Three Lowest Paid and Three Highest Paid UM Schools*
Ln thotisands of dollars
*See Notes f o l l o w i n g F i g u r e 3
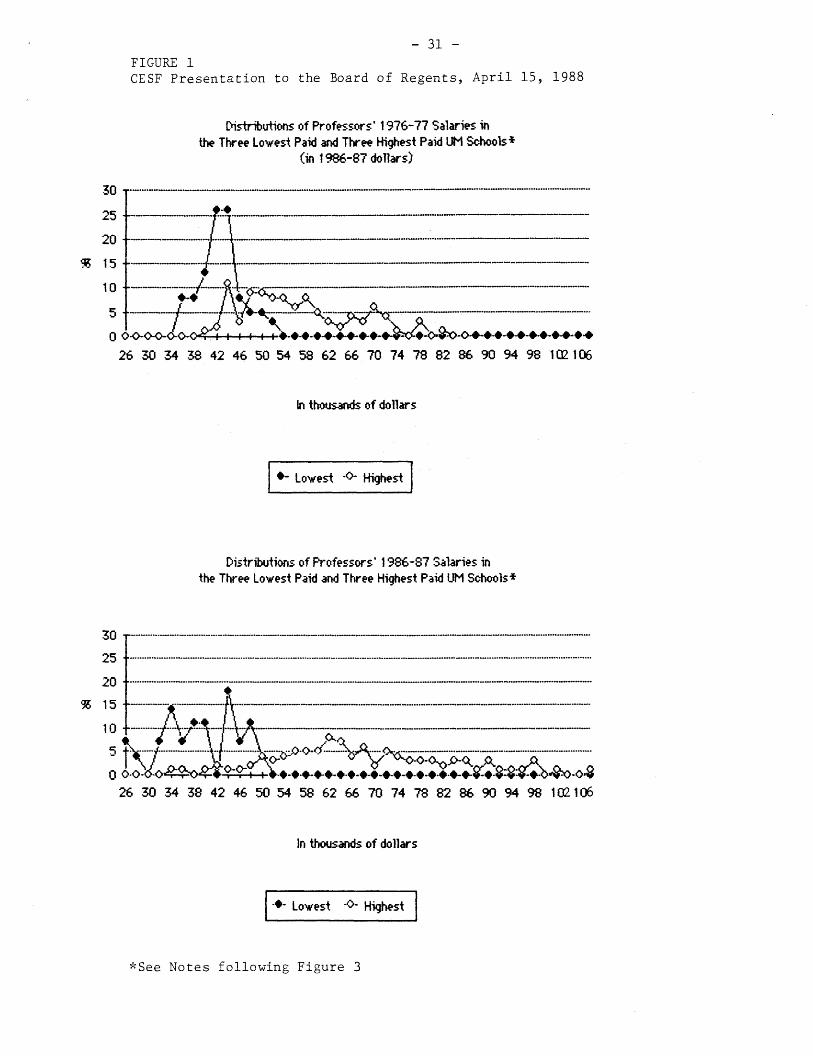
- 31 - FIGURE 1 CESF Presentation to the Board of Regents, April 15, 1988
Pisbibutions sf Professors' 1976-77 Salaries in the Three Lowest Paid and Three Hqhest Paid Uf.4 %hook*
fin 1986-87 dollars)
In Wzwrds o f dollars
Distributions o f F'rofessws' 1386-87 Salaries in the Tkw Lowest Paid and Ttrtre Hlghert Paid UN Schools*
In thousands of dollars
[[I ASee Notes following Figure 3

NOTES TO FIGURES 1, 2, and 3 CESF Presentation to the Board of Regents
April 15, 1988
Weighted average salaries (all ranks) for 1986-87 were used to determine the lowest paid and highest paid schools and colleges.
Lowest: Art, Information and Library Studies, and Nursing. Highest: Business Administration, Engineering, and Law.
For the sake of greater validity in the comparison of 1976- 77 and 1986-87 distributions, the lowest and highest paid schools were determined through the use of weighted average salaries for the 1986-87 year.
The percentage plotted at any given saiary value represents the midpoint of a $2,000 salary range. For example, at the $20,000 salary mark, faculty members whose salaries were between $19,000 and $21,000 are represented.
SOURCE: The Office of Faculty and Staff Data.

TABLE 1 A
Comparison of Average Faculty Salaries (Academic Year) at Michigan and Peer Schools
(thousands of dollars, except as noted)
Michigan Michigan Private Public As a Percentage of
Private Public
1 Based on data supplied by Maryse Eymonerie Associates. 2 Private Schools are Chic9g0, Columbia, Cornell, Harvard,
HIT, Northwestern, Pennsylvania, Princeton, Stanford, Yale. 3 Public Schools are Illinois, Indiana, Minnesota, North Carolina,
UC ~ e r k e l e ~ , - ~ ~ ~ ~ , Washington, Wisconsin.
Note: Data from the Universi ty of Cal i fornia a t San Francisco were not avai lable .

TABLE 1 B
Comparison of Average Faculty Compensation at Michigan and Peer Schools
(thousands of dollars, except as noted)
Michigan Michigan Private Public As a Percentage of
Private Public
1 Based on data supplied by Maryse Eymonerie Associates. 2 Private Schools are Chicago, Columbia, Cornell, Harvard,
MIT, Northwestern, Pennsylvania, Princeton, Stanford, Yale. 3 Public Schools are Illinois, Indiana, Minnesota, North Carolina,
UC Berkeley, UCLA, Washington, Wisconsin.
Note: Data from the University of California at San Francisco were not available.

TABLE 1 C
UM Average Annual Faculty Salaries as a Percentage of the Average for Peer Schools
Professor Associate Assistant
Private Public Private Public Private Public
1 Based on data supplied by Maryse Eymonerie Associates. 2 Private Schools are Chicago, Columbia, Cornell, Harvard,
MIT, Northwestern, Pennsylvania, Princeton, Stanford, Yale. 3 Public Schools are Illinois, Indiana, Minnesota, North Carolina,
UC Berkeley, UCLA, Washington, Wisconsin.
Note: Data fron the University of California at San Francisco were not available.

1987-88
TABLE 1 D
PROFESSORS
School Compensation Salary
MICHIGAN. . . . . 71.2. . . . . . -59.1
Private Peer Institutions
Chicago . .78. 6. . . . . .64.2 Columbia . . . .80. 4. . . 6 4.8 Cornell . .74.3. . . . . . .59.6 Harvard . . .87.9. . J3.2 MIT . . . . . . . .82. 4. . . . . . .66.6 Northwestern . .73. 8. . .6 1.0 Pennsylvania . J9.2. . .64.3 Princeton. . . .81. 2. . .67.8 Stanford . .84. 3. . .7 0.8 Yale . .81.5. . .6 7.7
Public Peer Institutions
UC/Berkeley . .76.6. . .6 4.2 UCLA . .75. 2. . .63.0 Illinois . . . . .59.2. . . . . . .5 3.8 Indiana . . . . . .64.5. . . . . . . 5 1.7 Minnesota . .64. 3. . .52.1 North Carolina . .65. 9. . .5 5.8 U . Washington . .60. 7. . .50.8 Wisconsin . .64. 7. . .5 2.1
ASSOCIATE PROFESSORS
School Compensation Salary
MICHIGAN . . . . . 55.0. . . . . . .44.5 Private Peer Institutions
Chicago . . .51. 4. . . . 4 1.9 . . . . . Columbia . .58.8. .4 5.8 Cornell . .52.8. . . 4 2 . 3 . . . . . Harvard . . . .45.9. .3 8.2
. . . . . MIT . . . . . . . .60.5. .4 8.2 Northwestern . .50. 4. . . . 41.0
. . . . . Pennsylvania . . .58.4. .46.3 Princeton . . .51. 3. . .42.3 Stanford . . . .61.7. . .5 0.1 . . . . . Yale . . . . . 4 8 . 9. . 4 0.8

Table 1 D. Continued
ASSOCIATE PROFESSORS. Continued
Public Peer Institutions
UC/Berkeley . . .52.6. . . . .4 2.3 UCLA . . . .51.2. . . .4 1.0 Illinois . . . . .42. 0. . . . . . .3 7.8 Indiana . . . . . .46.0. . . . . . .36.2 Minnesota . .48. 4. . . . .3 8.3 NorthCarolina . .47.8. . . .4 0.1 U . Washington . .43. 7 . . . . .3 5.7 Wisconsin . . .48.5. . .3 8.2
ASSISTANT PROFESSORS
School . Compensation Salary
. . . . . MICHIGAN . . . . . 46.0. .3 6.8
Private Peer Institutions
. . . . . Chicago . . . .43.4. .3 5.4 Columbia . .44. 2. . .3 3.6 Cornell . . . .43. 7. . .3 5.5 Harvard . .41. 9. . .3 4.9
. . . . . . . . . . . . MIT .48.3. .37.8 . . . . . Northwestern . . .43. 0. .3 7.0 . . . . . Pennsylvania . . .46. 6. .3 8.3 . . . . . Princeton . .40. 2 . .32.8 . . . . . Stanford . .50.6. .3 9.6 . . . . Yale .38. 6. .3 2.3
Public Peer Institutions
. . . . . . . UC/Berkeley . 4 5 . 7 . .3 6.1 UCLA . . . .45.8. e m . . .3 6.2 . . , . . . . . . Illinois 3 7 . 4. .3 3.6 . . . . . , * . . . Indiana .39. 4. .30.9 Minnesota . . .41. 8. . . . . .3 2.7 North Carolina . .40.9. . . . .3 4.5 . . . . . . . U . Washington .40. 3. .3 2.8 Wisconsin . .43.0. . . . .3 3.7

TABLE 1 E
1987-88 SALARY AND FRINGE BENEFITS FOR THE UNIVERSITY OF MICHIGAN AND ITS PUBLIC AND PRIVATE PEERS
ALL RANKS COMBINED
- Salary $ fi Fringe$ Fringe % UM pubL privL UM Pub Priv UM Pub Priv
PROFESSORS
F r i nge-. % S a_l_a,rx -S-.- - ---- ----- --2rA~s1eS_ - - - -- ---------- ---_ UM Pub Priv UM Pub Priv UM Pub Priv
(In a comparison of average salary, UM ranks 3rd out of 9 among its public peers and ilth out of 11 among its private peers)
ASSOCIATE PROFESSORS
---- - 3 . . - - - - - _ .&rinse3 Frinse % UM Pub Priv i J M Pub Priv UM Pub Priv
(In a comparison of average salary, UM ranks first out of 9 among its public peers and 5th out of 11 among its private peers)
ASSISTANT PROFESSORS
S a l a X Y ~ ~ Fringe $ Fringe % UM Pub Priv UM Pub Priv UM Pub Priv
(In a comparison of average salary, UM ranks first out of 9 among its public peers and 5th out of 11 among its private peers)
'public peers are Illinois, Indiana, Minnesota, North Carolina. UC Berkeley, UCLA, Washington, Wisconsin. 2~rivate peers are Chicago, Columbia. Cornell, Harvard, MIT, Northwestern, Pennsylvania, Princeton, Stanford, Yale. '~igures in column 1 (salary) and column 2 (fringe $ ) represent thousands of dollars.

TABLE 2
CESF Presentation to the Board of Regents April 15, 1988
The difference between the mean and the median of UM faculty salaries by rank,
when divided by the mean and expressed as a percentage
Prof. Assoc. Prof. Asst. Prof.
Source: "An Analysis of Salaries Paid to the University of Michigan Instructional Staff," 1917 -78 to 1 9 8 7 - 8 8 .
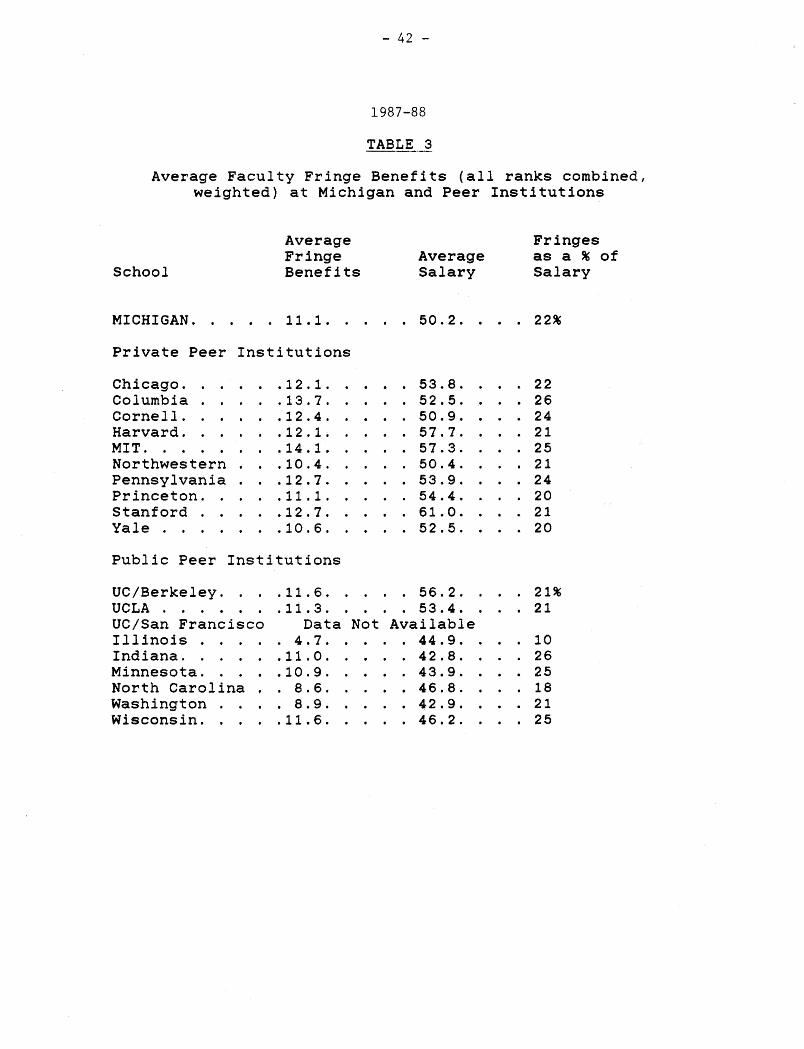
TABLE 3
Average Faculty Fringe Benefits (all ranks combined. weighted) at Michigan and Peer Institutions
School
Average Fringe Average Benefits Salary
Fringes as a % of Salary
. . . . . . . . . . . . MICHIGAN 11.1. 50.2. 22%
Private Peer Institutions
. . . . . . . . . . . . Chicago .12. 1. 53.8. 22 . . . . . Columbia .13. 7. 52.5. 26
. . . . . . Cornell J2.4. 50.9. 24
. . . . . Harvard .12. 1. 57.7. 21 . . . . . . . . . . . . . . MIT .14. 1. 57.3. 25 . . . . Northwestern . . .10.4. 50.4. 21 . . . . . . . Pennsylvania . . J2.7. 53.9. 24
. . . . Princeton .11. 1. 54.4. 20
. . . . . . . Stanford .12. 7. 61.0. 21 . . * . . Yale .lo. 6. 52.5. 20
Public Peer Institutions
. . . . . . . UC/Berkeley .11. 6. 56.2. 21% . . . . . UCLA .11. 3. 53.4. 21
UC/San Francisco Data Not Available . . . . . . . . . . . . Illinois 4.7. 44.9. 10
. . . * . . . . . . . Indiana .11. 0. 42.8. 26 . . . . Minnesota .lo. 9. 43.9. 25
* . . . . North Carolina 8.6. 46.8. 18 . . . . . . . . . . . Washington 8.9. 42.9. 21 . . . . Wisconsin .11.6. 46.2. 25

I V . SALARY TABLES
Introduction
A routine feature of the CESF Annual Report is the presentation of annual salary data. The following tables a r e updated versions of those presented in earl ier years. Table 1 presents the changes in the faculty salary program a t The University of Michigan from the 1977-78 to the 1987-88 academic years. Indices are presented which control for the cost-of-living over th is period. Tables 2 and 3 compare various aspects of faculty compensation among The University of Michigan and most of our peer universities (data a r e not provided for Cornell University, MIT, the University of California a t San Francisco, and the University of Pennsylvania). The peer schools for which data a re provided in Tables 2 and 3 a r e as follows:
The University of Chicago Columbia University Harvard University Northwestern University Princeton University Stanford University Yale University The University of California a t Berkeley The University of California a t Los Angeles The University of Illinois, Champaign/Urbana The University of North Carolina, Chapel H i l l Indiana University, Bloomington The University of Minnesota, Minneapolis/St. Paul The University of Wisconsin, Madison The University of Washington
Tables 4 through 6 present mean and median salary data for Professors, Associate Professors, and Assistant Professors for academic years 1986/87 and 1987/88 in schools and colleges at The University of Michigan. Table 7 shows mean salaries for Research Scientists and Librarians i n 1986/87 and 1987/88 and Table 9 shows these data for Professors, Associate Professors, and Assistant Professors grouped by gender and race. Table 9 shows the changes i n University expenditures on fringe benefits from 1986/87 t o 1987/88.
This year, 1987/88, marked the s ixth consecutive year in which the average faculty salary increased by more than the ra te of inflation. By contrast, salary increases in each of the previous eight years fe l l short of the ra te of inflation and by as much as 12.4% in 1979/80. The cumulative effect of the rate of inflation over the past years is that the real average salary in 1987/88 was approximately 107.1% of its 1970/71 level (See Table 1).

A s was noted i n the April Compensation Statement t o the Regents, a comparison with peer private inst i tut ions reveals that the UM average faculty sa la ry has been i n general decline since 1975-76 when it reached a high of 103%. The UM faculty i n 1987-88 earned on an average only 92.7% of the salaries paid t o faculty at the private peers.
Compared with our public peers (Illinois, Indiana, Minnesota, North Carolina, UC Berkeley, UCLA, Washington, and Wisconsin) the average sa lary i n 1987/88 was 106.9% of our public peers' average salaries.
The actual 1986/87 average sa lary increases at the UM for continuing faculty according t o AAUP data were 6.6% for Professors, 7.9% for Associate Professors and 8.6% for Assistant Professors, making an overall average of ?.3% for a to ta l of 1120 continuing instructional faculty members . The average weighted 2ncrease for all full-time faculty members, a to ta l of 1557, was 5.6% .
l ~ h e numbers of continuing faculty members for the 1987-88 academic year a r e as follows: Professors, 645; Associate Professors, 230; and Assistant Professors, 245. These numbers exclude faculty from the Medical School.
he average increase for all full-time faculty members represents a comparison between the weighted average salaries (all ranks combined) for the 1986-87 and 1987-88 academic years. Numbers of full-time faculty members by rank for 1987-88 a r e as follows, and changes i n number re la t ive t o the previous year are enclosed within parenthesis: professors, 820 (-1 1); associate professors, 338 (-5); ass i s tan t professors, 99 (+14). This s l ight sh i f t i n numbers by rank a s well as the differences i n number between continuing faculty members (see footnote above) and all full-time faculty members help t o explain the difference i n average sa lary for the two groups.
NOTES TO TABLES
General: Tables a re for the Ann Arbor Campus.
Table 1
The salary program (% change) is a weighted average annual increase for Professors, Associate Professors, and Assistant Professors combined, continuing faculty members only. The salary index is shown in order to show the change in salaries relative to the Consumer Price Index.
The CPI is calculated for all urban consumers, academic year to academic year.
Tables 2 and 3
Sa la ry f i g u r e s f o r the Medical School f a c u l t y have been excluded t o a l low f o r comparisons ac ross i n s t i t u t i o n s .
Tables 4, 5, &>
In these tables it should be noted that a l l faculty in Architecture & Urban Planning ("ARCH URB") a r e on 80% appointments.
Table 7
Figures for 1986/87 and 1987/88 a re mean salar ies a s of September 30, 1986 and September 30, 1987 respectively and a re for 1 2 month salaries.
L.S.& A. Departmental Groupings
Humanities - Asian Languages and Literatures, Classical Studies, English Language and Literature, Germanic Languages and Literatures, History of Art, Near Eastern Studies, Philosophy, Romance Languages and Literatures, Slavic Languages and Literatures.
Interdisciplinary - Center for Afroamerican and African Studies, Residential College.
Mathematics and Physical Sciences - Astronomy, Biological Sciences, Chemistry, Geological Sciences. Mathematics. Physics, Statistics.
Social Sciences - Anthropology, Communication, Economics. English Language Institute, History, Linguistics. Political Science, Psychology, Sociology.

TABLE I
U.M. REAL SALARY PROGRAM CHANGES 1977/78 TO 1987/88
U.M. U.M. DETROIT DETROIT PRICE FACULTY SALARY CONSUMER CONSUMER ADJUSTED
SALARY PROGRAM' INDEX PRICE INDEX^ PRICE INDEX SALARY INDEX YEAR ( % change) ( 1970/71=100) (% chanqe) L_1-970/71=lOO) ( 1970/71=100) -
'"~nnual Report on the Economic Status of the Profession," Academe: Bulletin of the American Asso~iatio_n~o~f University Professgrs_,Years 1977/78 to 1983/84, July-August, Appendix I. Years 1984/85 to 1987/88: March-April, Appendix I. (Figures are for continuing faculty.)
*u.s. Department of Labor, Bureau of Labor Statistics, Monthly Labor Review, 1977 to 1987.

TABLE 2
INSTITUTION 78/79 79/80 80/81 81/82 82/83 83/84 84/85 85/86 86/87 87/88
MICHIGAN 162.1 174.3 191.7 207.3 221.9 238.0 252.3 271.7 292.4 309.6
Private Chicago 154.7 165.0 181.3 202.5 227.0 242.5 251.0 274.1 286.7 310.8 Columbia 155.3 178.6 181.3 201.7 225.0 234.7 260.5 267.5 307.4 321.4 Harvard 154/2 162.9 181.8 202.3 226.4 247.3 267.1 275.5 291.6 310.2 Northwestern 146.4 156.9 172.9 189.8 199.5 220.8 240.7 258.0 272.0 293.1 Princeton 157.1 166.6 182.2 204.7 229.2 252.7 272.9 297.4 315.3 334.2 Stanford 164.0 183.3 196.4 226.3 258.1 273.8 292.9 315.2 317.3 349.3 Yale 140.7 152.0 170.5 190.1 210.6 230.2 246.3 267.0 284.5 301.9
Public Illinois Indiana 150.8 161.4 180.1 195.8 212.0 224.4 235.6 252.4 275.4 290.8 Minnesota 162.1 178.0 189.4 192.7 224.0 237.7 260.3 276.4 289.1 301.1 N.Carolina 171.1 180.8 208.1 227.4 223.6 238.8 261.7 284.1 297.7 320.2 UC/Berkeley 189.3 219.8 247.1 265.3 275.0 283.5 321.8 347.5 382.1 392.2 Wisconsin 181.2 195.8 211.3 230.7 249.5 254.4 267.1 294.5 330.1 350.3 Washington 169.3 188.4 201.7 224.8 230.7 249.3 255.3 268.6 296.8 313.9
SOURCE: "The Annual Report on the Economic Status of the Profession." Academe: The Bulletin of the American Association of University Professors. Years 1975/76 to - 1983/84: July-August issue, Appendix I. Years 1984/85 to 1987/88: March-April issue, Appendix I.
'The index includes Professors. Associate Professors, and Assistant Professors, combf ned . '~ecause the 1970/71 base year figure for average compensation is available for only the university-wide system. the index figures are inflated.

TABLE 3
AVERAGE COMPENSATION BY RANK FOR MICHIGAN AND MAJOR COMPETING UNIVERSITIES (In thousands of dollars)
- -- - - -
PROFESSORS ASSOCIATE PROFESSORS ASSISTANT PROFESSORS
TOTAL BENE- COMPEN-
SCHOOL ---- N SALARY FITS SATI-ON-
TOTAL BENE- COMPEN- BENE-
N SALARY FITS ATION N SALARY FITS - - - - - - - - --- - -- -- -- - -- -
TOTAL COMPEN- SATION ----
MICHIGAN 1986/87 831 1987/88 820
Private Chicago 1986/87 438 1987/88 451
Columbia 1986/87 459 1987/88 483
Harvard 1986/87 530 1987/88 558
Northwestern 1986/87 413 1987/88 434
Princeton 1986/87 346 1987/88 352
Stanford 1986/87 512 1987/88 522
Yale 1986/87 386 1987/88 389

TABLE 3 (Continued)
PROFESSORS ASSOCIATE PROFESSORS ASSISTANT PROFESSORS
SCHOOL N SALARY Public --- Berkeley 1986/87 932 64.0 1987/881 936 64.2
Illinois 1986/87 980 54.0 1987/8g 979 53.8
Indiana 1986/87 599 48.7 1987/88 3596 51.7
Minnesota 1986/87 822 50.2 1987/88 4780 52.1
Wisconsin 1986/87 917 49.3 1987/88 900 52.1
UCLA 1986/87 853 62.3 1987/88 825
63.0 N. Carolina 1986/87 507 53.2 1987/88 514 55.8
UrnWashington 1986/87 786 47.9 1987/88 845 50.8
BENE- FITS ---- ---
12.5 12.4
6.4 5.4
12.0 12.8
11.8 12.2
11.4 12.6
12.3 12.2
8.8 10.1
9 . 5 9.9
TOTAL COMPEN- BENE- SATION N SALARY FITS - - --- --a- -------.-- p--- ---
TOTAL TOTAL COMPEN- BENE- COMPEN-
A_TLONPNNS_A_LhilLY F I TS-__s-ATI_OrJ__
----- -- SOURCE: "The Annual Report on the Economic Status of the Profession," Academe: Bul let in of the American A s ~ p c ~ ~ a t _ t ~ o n _ ~ ~ o f ~ U n ~ i ~ v e ~ ~ ~ i t y P ~ r o ~ ~ e s s o ~ . 1986/81: Appendix I , Ifarch-April, 1987. 1987/88: Appendix I, March-April, 1988. Urbana 2~loomington 3 ~ w i n Cities A Madison
5chapel Hill

TABLE 4
MEAN AND MEDIAN SALARIES OF REGULAR FULL-TIME AND PART-TIME INSTRUCTIONAL STAFF, PAID FROM ALL UNIVERSITY SOURCES
PROFESSORS
SCHOOL OR 1986/87 1987/88 COLLEGE YEAR N *MEAN($) **MEDIAN($) N *MEAN($) **MEDIAN($)
ARCH 61 URB PLANNING
ART
BUS AD
DENTISTRY
ENGINEERING
INFO AND LIB STUDIES
LAW
LSA, All
LSA , Wumani t i es
LSA, Interdis
Academic Fiscal
Academic Fiscal
Academic Fiscal
Academi c Fiscal
Academl c Fiscal
Academic Fiscal
Academi c Fiscal
Academic 33 85,188 Fiscal 1 70,000
Academic 371 51,790 Fiscal 20 77,067
Academic 106 48,688 Fiscal 2 67,584
Academic 2 50,016 Fiscal 0 --
LSA, Math 61 Academlc 139 5 3 , 2 0 8 50,750 141 57,196 56 ,500 Phys.Sci Fiscal 5 73,800 81,500 4 89,709 91,668
LSA, Social Academic 124 52,881 52,000 124 56 ,206 55 ,750 Sciences Fiscal 13 79,782 78,000 1 4 78 ,380 80,166

TABLE 4 (Continued)
SCHOOL OR 1986/87 1987/88 COLLEGE YEAR N *MEAN($) **MEDIAN($) N *MEAN($) **MEDIAN($)
MEDICINE Academic 0 -- -- 0 -- -- Fiscal 208 85,854 82,977 210 89,596 86,938
MUSIC Academic 44 48,688 47,800 40 51,408 50,250 Fiscal 0 -- -- 1 50,000 50,000
NATURAL Academic 12 46,769 44,773 30 48,582 48,483 RESOYRCES Fiscal 2 57,212 57,212 2 61,939 61,939
NURSING Academic Fiscal
PiiARMACY Academic Fiscal
PHYSICAL Academic EDUCATION Fiscal
PUBLIC Academic HEALTE Fiscal
SOCIAL WORK Academic Fiscal
*The "meanw or average is the sum of the individual values for each case divided by the number of cases.
**The '9ned3anr1 is the numerical value of the middle case or the case lying exactly on the 50th percentile, once a11 the cases have been rank ordered from highest to lowest.
Source: "An Analysis of Salaries Paid to the University of Michigan Instructional Staff 1986-87, 1981-88." Prepared by the Personnel Office.

TABLE 5
MEAN AND MEDIAN SALARIES OF REGULAR FULL-TIME AND PART-TIME INSTRUCTIONAL STAFF, PAID FROM ALL UNIVERSITY SOURCES
ASSOCIATE PROFESSORS
SCHOOL OR 1986/87 1987/88 COLLEGE YEAR N *MEAN($) **MEDIAN($) N *MEAN($) **MEDIAN($)
ARCH & URB PLANNING
Academic 12 Fiscal 0
ART Academic 4 Fiscal 0
BUS AD Academic 19 Fiscal 0
DENTISTRY Academic 4 Fiscal 25
EDUCATION Academic 12 Fiscal 3
ENGINEERING Ac.ademic 55 Fiscal 2
INFO AND LIB STUDIES
Academic 2 Fiscal 0
LAW Academic 1 Fiscal 0
LSA, All Academic 109 37,100 37,000 102 39,281 40,000 Fiscal 6 48,917 50,000 6 56,334 56,500
LSA, Academic 45 35,503 34,000 41 37,868 37,000 Hunrani ties Fiscal 1 40,000 40,000 1 46,000 46,000
LSA, Interdis Academic 1 38,000 38,000 1 42,000 42,000 Fiscal 0 -- -II -IIC -I
LSA, Math & Academic 30 37,193 37,000 29 39,903 40,000 Phys.Sci Fiscal 1 37,500 32,500 2 55,500 55,500
LSA, Social Academic 33 39,165 38,000 31 40,477 40,400 Sciences Fiscal 4 54,000 53,500 3 60,333 62,000

TABLE 5 (ContSnued)
SCHOOL OR 1986/87 1987/88 COLLEGE YEAR N *MEAN($) **MEDIAN($) N *MEAN($) **MEDIAN($)
MEDICINE Academic 3 33,601 31,351 5 42,605 35,423 Fiscal 130 69,606 66,428 135 72,063 69,175
MUSIC Academic 21 35,693 36,000 26 38,522 39,000 Fiscal 0 -- -- 1 47,730 47,730
NATURAL Academic 8 34,542 34,643 8 37,016 37,394 RESOURCES Fiscal 0 -- -- 0 -- --
NURSING Academic 18 38,723 38,197 15 41,696 41,810 Fiscal 2 49,093 49,093 3 51,513 52,990
PHARMACY Academic 0 -- -- 0 -- -- Fiscal 8 55,169 55,700 30 58,720 60,200
PHYSICAL Academic 4 39,076 35,539 3 37,414 37,734 EDUCATION Fiscal 1 46,277 46,277 2 56,574 56,574
PUBLIC HEALTH
Academic 23 42,616 42,000 26 46,253 45,250 Fiscal 0 -- -- 0 -- --
SOCIAL WORK Academic 18 37,875 36,048 16 41,122 40,266 Fiscal 0 -- -- 0 -- --
*The ''mean1' or average is the sum of the individual values for each case div ided by the number of cases,
**The "median" is the numerical value of the middle case or the case lying exactly on the 50th percentile, once all the cases have been rank ordered from highest to lowest.
Source: "An Analysis of Salaries Paid to the University of Michigan Instructional Staff 1986-87, 1987-88." Prepared by the Personnel Office.
TABLE 6
MEAN AND MEDIAN SALARIES OF REGULAR FULL-TIME AND PART-TIME INSTRUCTIONAL STAFF, PAID FROM ALL UNIVERSITY SOURCES
ASSISTANT PROFESSORS
SCHOOL OR 1986/87 1987/88 COLLEGE YEAR N *MEAN($) **MEDIAN($) N *MEAN($) **MEDIAN($)
ARCH & URB PLANNING
Academic Fiscal
ART Academic Fiscal
BUS AD Academic Fiscal
DENTISTRY
EDUCATION
ENGINEERING
Academic Fiscal
Academic Fiscal
Academic Fiscal
INFO AND LIB STUDIES
Academic Fiscal
Academic Fiscal
LAW
Academic Fiscal
LSA, Humanities
Academic Fiscal
LSA, Interdis Academic Fiscal
LSA, Math & Phys . Sci Academic
Fiscal
LSA, Soc Sci Academic Fiscal

TABLE 6 (Continued)
SCHOOL OR COLLEGE
1986/87 198?/88 YEAR N *MEAN($) **MEDIAN($) N *MEAN($) **MEDIAN($)
MEDICINE Academic 1 Fiscal 199
MUSIC Academic 20 Fiscal 1
NATURAL RESOURCES
Academic 6 Fiscal 0
NURSING Academic 30 Fiscal 3
PHARMACY Academic 0 Fiscal 10
PHYSICAL EDUCATION
Academic 3 Fiscal 0
PUBLIC HEALTH
Academic 28 Fiscal 1
SOCIAL WORK Academic 6 Fiscal 0
The "meant' or average is the sum of the individual values for each case divided by the number of cases.
**The is the numerical value of the middle case or the case lying exactly on the 50th percentile, once all the cases have been rank ordered from highest to lowest.
Source: "An Analysis of Salaries Paid to the University of Michigan Instructional Staff 1986-81. 1987-88.w Prepared by the Personnel Office.

TABLE 7
MEAN SALARIES OF PERSONS APPOINTED AS RESEARCHERS AND LIBRARIANS
1986/87 1987/88 NUMBER MEAN ( $ ) NUMBER MEAN ( S )
Research Scientist
Associate Research Scientist
Assistant Research Scientist:
Librarian 31 36,890 32 39,570
Senior Associate Librarian
Associate Librarian
NOTE: Salary means are based on full-time rates. Numbers include all those who hold such appointments, regardless of percent. Consequently, individuals who hold both professorial and Research Scientist appointments are represented in this table as well as in Table 4, 5, or 6.
SOURCE: Salaries by Position Title. Computer runs as of 9/30/86 and 11/30/87, by Appointing Job Title.
TABLE 8
MEAN SALARIES OF REGULAR FULL-TIME AND PART-TIME INSTRUCTIONAL STAFF, BY SEX AND RACE
CATEGORY 1986/87 1987/88
NUMBER MEAN ( S ) NUMBER MEAN ( S )
PROFESSORS All, Male
Fema 1 e Black, Male
Female Asian, Male
Female Native Am, Male Hispanic, Male Non-minority, Male
Female
ASSOCIATE PROFESSORS All, Male
Female Black, Male
Female Asian, Male
Female Native Am, Female Hispanic, Male Non-minority, Male
Female
ASSISTANT PROFESSORS All, Male
Female Black, Male
Female Asian, Male
Female Hispanic, Male
Female Non-minority, Male
Female
NOTE: Salary means are based on academic year rates (in the calculation of mean salaries, fiscal year salaries have been adjusted accordingly). The figures for 19861'87 were similarly adjusted,
SOURCE: Compiled from data furnished by UM Personnel Office. These data do not take into account differentials attributable to factors such as years of service, area of specialization, etc. Figures include new hires as well as continuing faculty.

TABLE 9
FRINGE BENEFITS INCLUDED IN DETERMINING COMPENSATION
BENEFIT ASSOCIATE ASSISTANT
YEAR PROFESSORS PROFESSORS PROFESSORS
Retirement
Social Security (F.I.C.A.)
Medical
Life Insurance
Long Term Disability
Workers ' Compensation
Unemployment Compensation
'~ata for 1987-88 excludes figures for faculty in Nursing, Law, Dentistry, and the Medical School. Data since 1975-76 have excluded figures only for the Medical School faculty. Hence, the comparison between the 1986-87 and 1987-88 figures is no doubt affected by this shift in methodology. &Similar data for 1987-88 are not available.) Dental of $144 (all ranks) is not included in the breakdown.
SOURCE: Maryse Eymonerie Associates: American Association of University Professors, 1986/87 and 1987/88 Faculty Surveys, Form MEA 22, November 1986 and 1987.