PEERING BEHIND THE TRENDS IN WOMEN’S LABOR FORCE PARTICIPATION IN MENA
20
RAGUI ASSAAD, UNIVERSITY OF MINNESOTA AND ERF PEERING BEHIND THE TRENDS IN WOMEN’S LABOR FORCE PARTICIPATION IN MENA ERF Conference on Gender Equality in the MENA Region October 24-25, 2015
-
Upload
economic-research-forum -
Category
Government & Nonprofit
-
view
901 -
download
2
Transcript of PEERING BEHIND THE TRENDS IN WOMEN’S LABOR FORCE PARTICIPATION IN MENA
R A G U I A S S A A D , U N I V E R S I T Y O F M I N N E S O T A A N D E R F
PEERING BEHIND THE TRENDS IN WOMEN’S LABOR FORCE
PARTICIPATION IN MENA
ERF Conference onGender Equality in the MENA Region
October 24-25, 2015
INTRODUCTION
• MENA’s very low levels of female LF participation are well established
• Out of the 20 countries with the lowest participation rates, 15 are MENA countries
REASONS FOR LOW FEMALE PARTICIPATION IN MENA
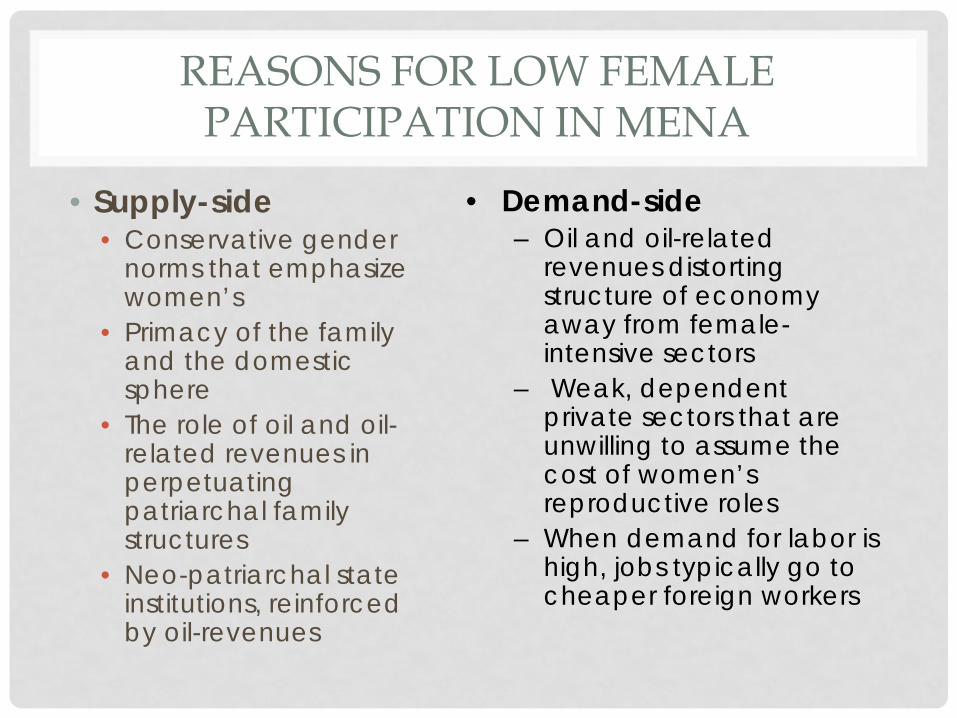
• Supply-side• Conservative gender
norms that emphasize women’s
• Primacy of the family and the domestic sphere
• The role of oil and oil-related revenues in perpetuating patriarchal family structures
• Neo-patriarchal state institutions, reinforced by oil-revenues
• Demand-side– Oil and oil-related
revenues distorting structure of economy away from female-intensive sectors
– Weak, dependent private sectors that are unwilling to assume the cost of women’s reproductive roles
– When demand for labor is high, jobs typically go to cheaper foreign workers
MAIN QUESTION
• Why are trends in female LF participation so flat, despite dramatic rise in education and falling gender gaps in education?• We know that historically, LF participation is positively and
strongly associated with educational attainment• Paradox: Why are rapidly rising rates of educational
attainment for women not translating into rapid increases in participation?
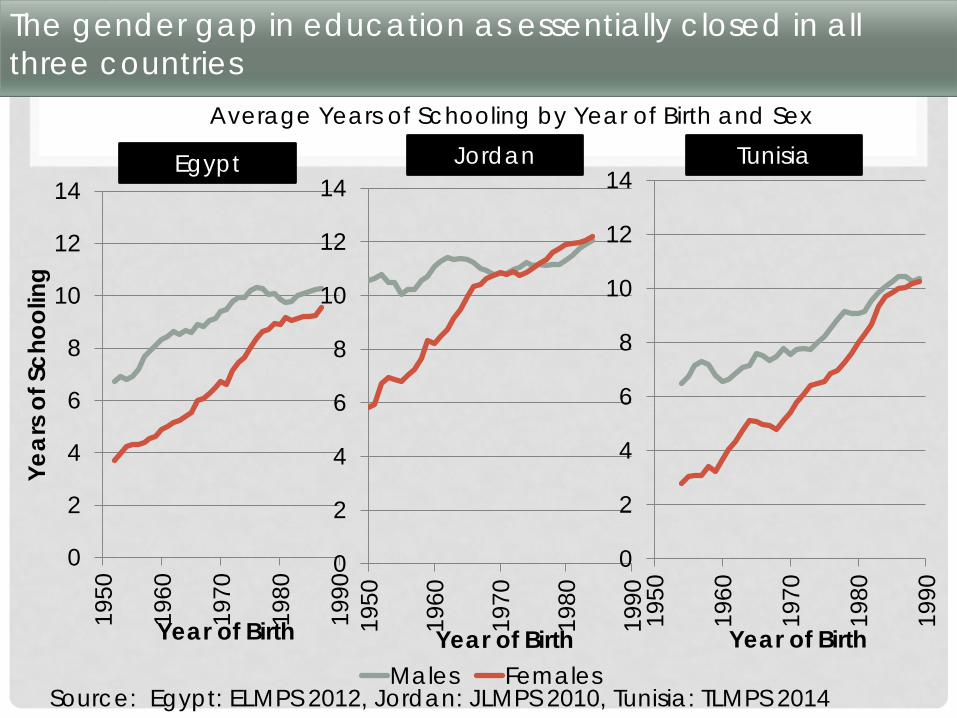
The gender gap in education as essentially closed in all three countries
0
2
4
6
8
10
12
14
1950
1960
1970
1980
1990
Year
s of
Sch
oolin
g
Year of Birth
0
2
4
6
8
10
12
14
1950
1960
1970
1980
1990
Year of BirthMales Females
0
2
4
6
8
10
12
14
1950
1960
1970
1980
1990
Year of Birth
Egypt TunisiaJordanAverage Years of Schooling by Year of Birth and Sex
Source: Egypt: ELMPS 2012, Jordan: JLMPS 2010, Tunisia: TLMPS 2014
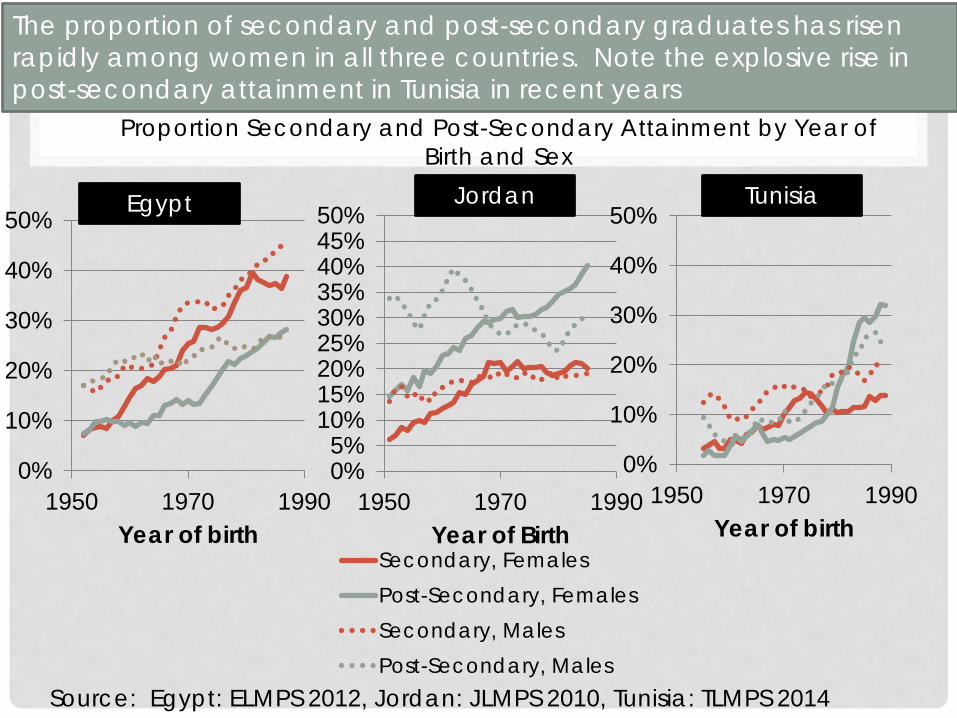
The proportion of secondary and post-secondary graduates has risen rapidly among women in all three countries. Note the explosive rise in post-secondary attainment in Tunisia in recent years
0%
10%
20%
30%
40%
50%
1950 1970 1990Year of birth
0%5%
10%15%20%25%30%35%40%45%50%
1950 1970 1990Year of Birth
Secondary, FemalesPost-Secondary, FemalesSecondary, MalesPost-Secondary, Males
0%
10%
20%
30%
40%
50%
1950 1970 1990Year of birth
Proportion Secondary and Post-Secondary Attainment by Year of Birth and Sex
Egypt TunisiaJordan
Source: Egypt: ELMPS 2012, Jordan: JLMPS 2010, Tunisia: TLMPS 2014
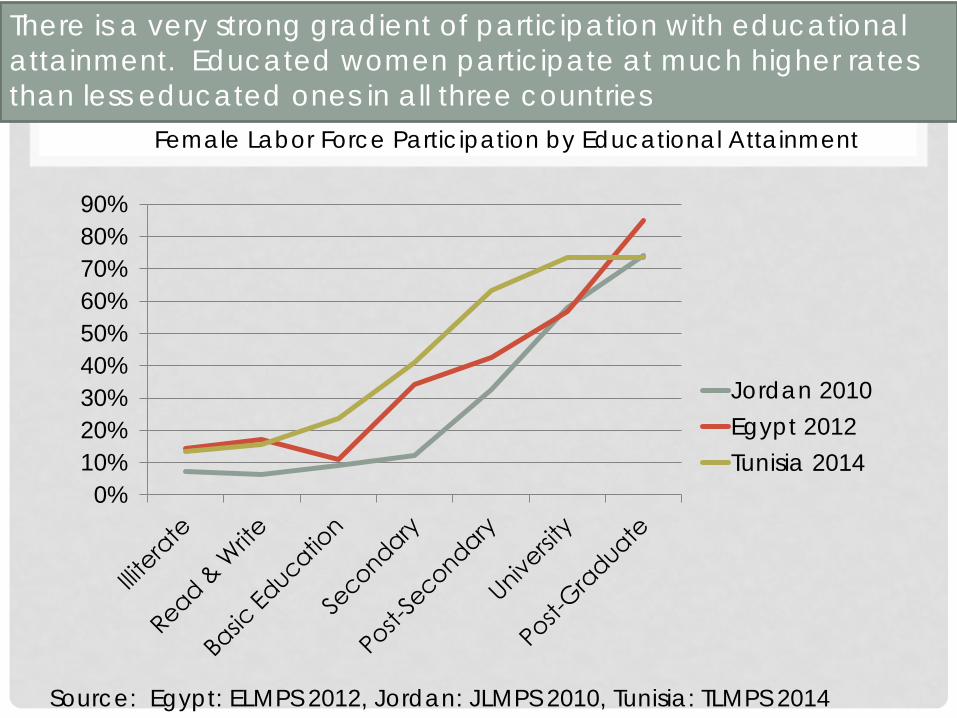
There is a very strong gradient of participation with educational attainment. Educated women participate at much higher rates than less educated ones in all three countries
0%10%20%30%40%50%60%70%80%90%
Jordan 2010Egypt 2012Tunisia 2014
Female Labor Force Participation by Educational Attainment
Source: Egypt: ELMPS 2012, Jordan: JLMPS 2010, Tunisia: TLMPS 2014
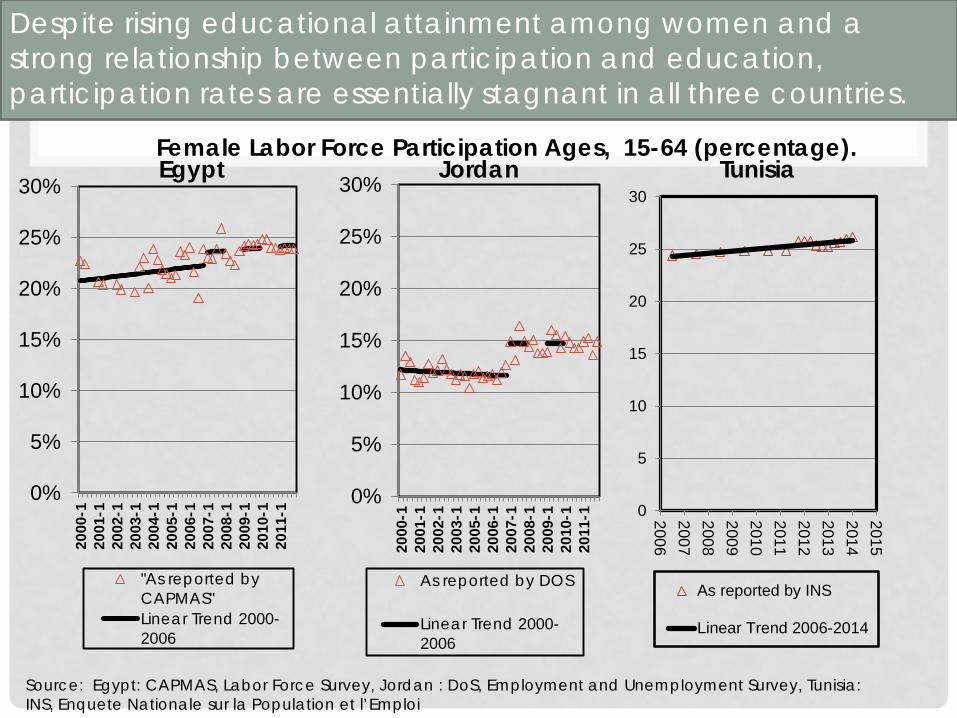
Despite rising educational attainment among women and a strong relationship between participation and education, participation rates are essentially stagnant in all three countries.
0%
5%
10%
15%
20%
25%
30%
2000
-120
01-1
2002
-120
03-1
2004
-120
05-1
2006
-120
07-1
2008
-120
09-1
2010
-120
11-1
"As reported byCAPMAS"Linear Trend 2000-2006
0%
5%
10%
15%
20%
25%
30%
2000
-120
01-1
2002
-120
03-1
2005
-120
06-1
2007
-120
08-1
2009
-120
10-1
2011
-1As reported by DOS
Linear Trend 2000-2006
Egypt JordanFemale Labor Force Participation Ages, 15-64 (percentage).
Source: Egypt: CAPMAS, Labor Force Survey, Jordan : DoS, Employment and Unemployment Survey, Tunisia: INS, Enquete Nationale sur la Population et l’Emploi
0
5
10
15
20
25
30
2006200720082009201020112012201320142015
As reported by INS
Linear Trend 2006-2014
Tunisia
SO WHAT EXPLAINS THIS PARADOX?
• Relationship between participation and educational attainment is weakening for women
• Educated women are facing a much more adverse labor market due to the decline in the probability of public sector employment
• Married women are more affected because of the inhospitable environment they face in the private sector
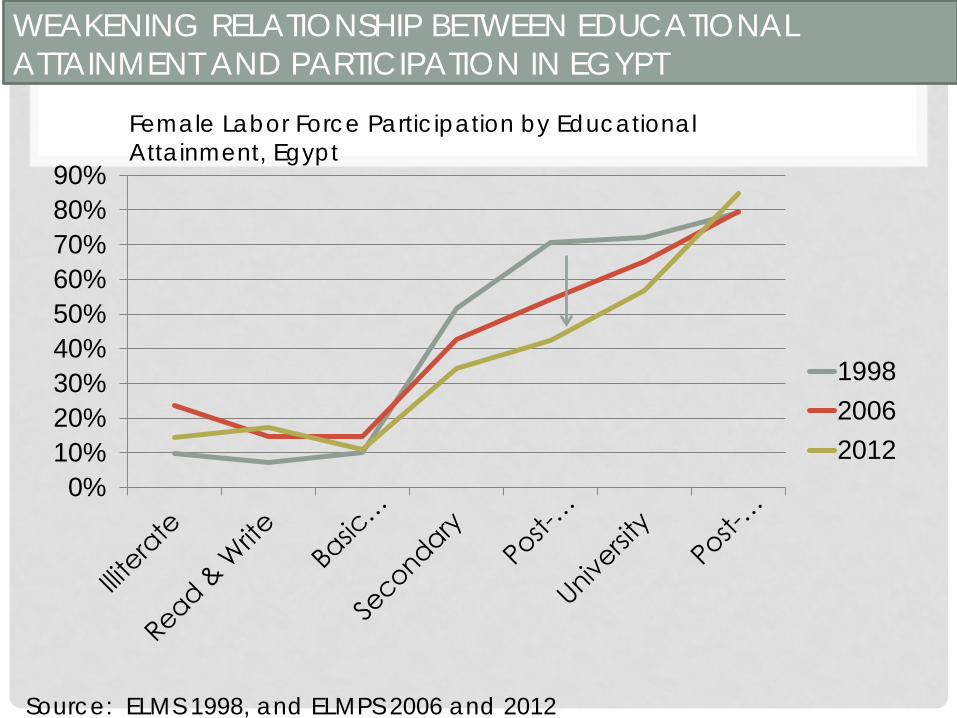
WEAKENING RELATIONSHIP BETWEEN EDUCATIONAL ATTAINMENT AND PARTICIPATION IN EGYPT
0%10%20%30%40%50%60%70%80%90%
199820062012
Female Labor Force Participation by Educational Attainment, Egypt
Source: ELMS 1998, and ELMPS 2006 and 2012
Source: Author’s calculations from ELMPS 2012, JLMPS 2010 and TLMPS 2014
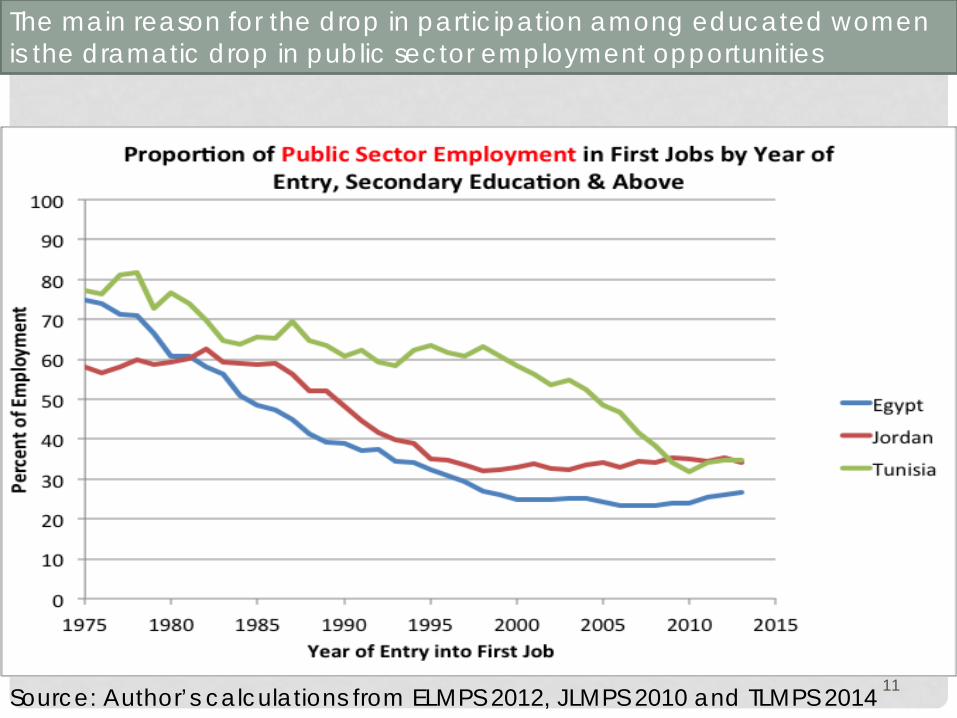
The main reason for the drop in participation among educated women is the dramatic drop in public sector employment opportunities
11
Source: Author’s calculations from ELMPS 2012, JLMPS 2010 and TLMPS 2014
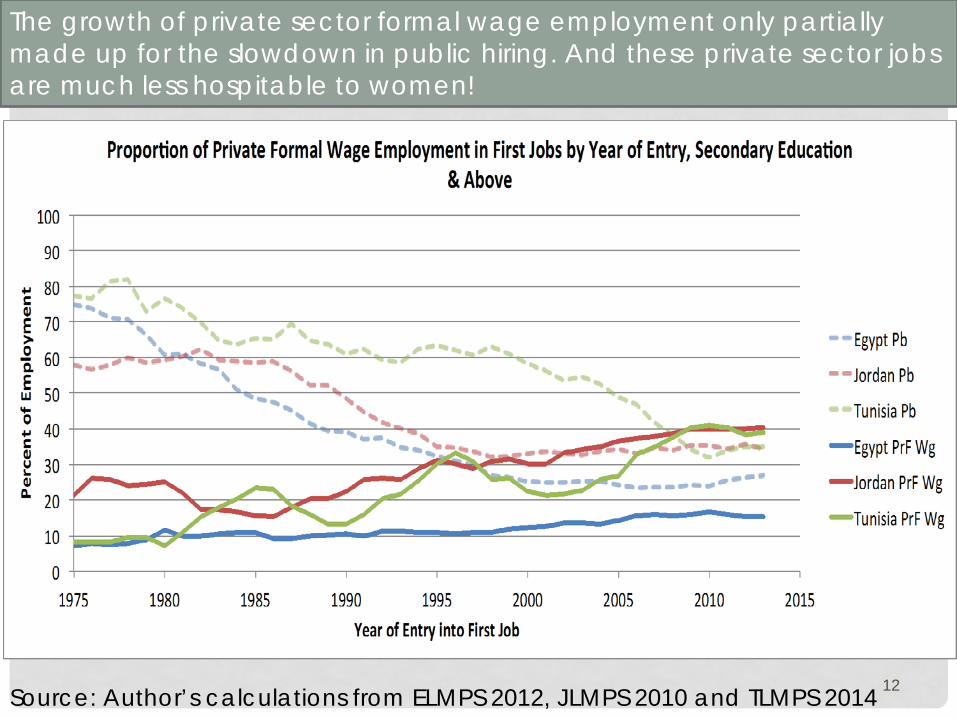
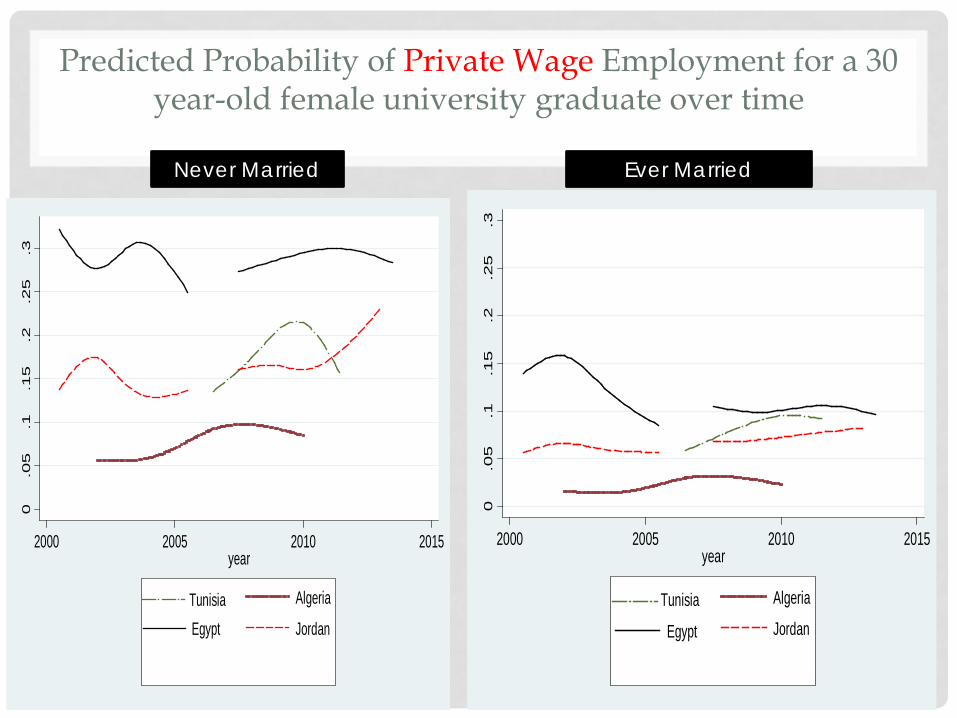
The growth of private sector formal wage employment only partially made up for the slowdown in public hiring. And these private sector jobs are much less hospitable to women!
12
Source: Author’s calculations from ELMPS 2012, JLMPS 2010 and TLMPS 2014
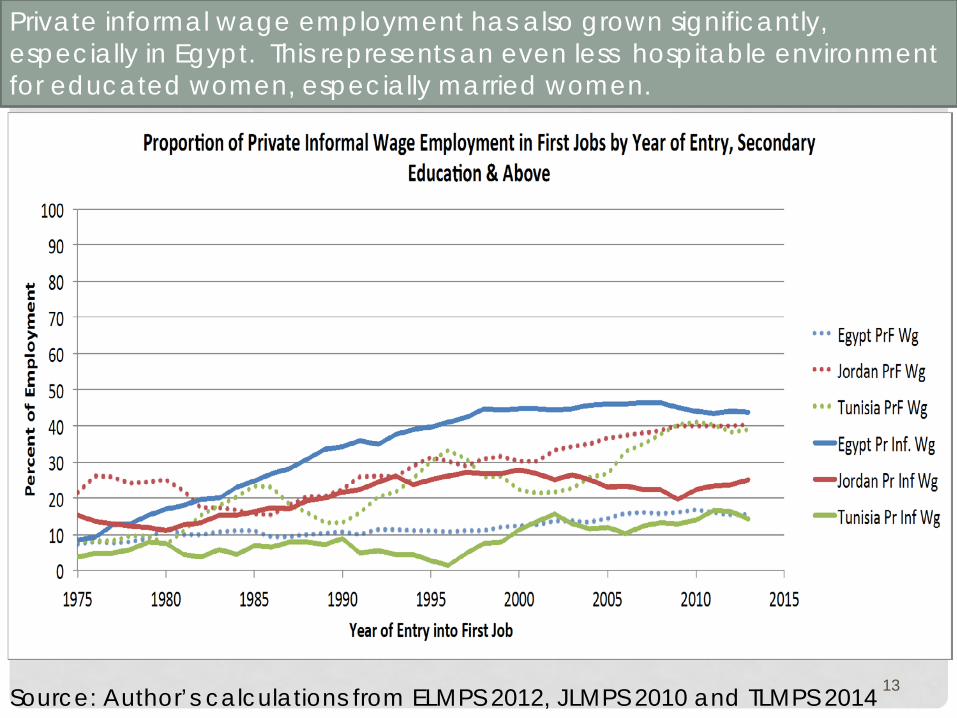
Private informal wage employment has also grown significantly, especially in Egypt. This represents an even less hospitable environment for educated women, especially married women.
13
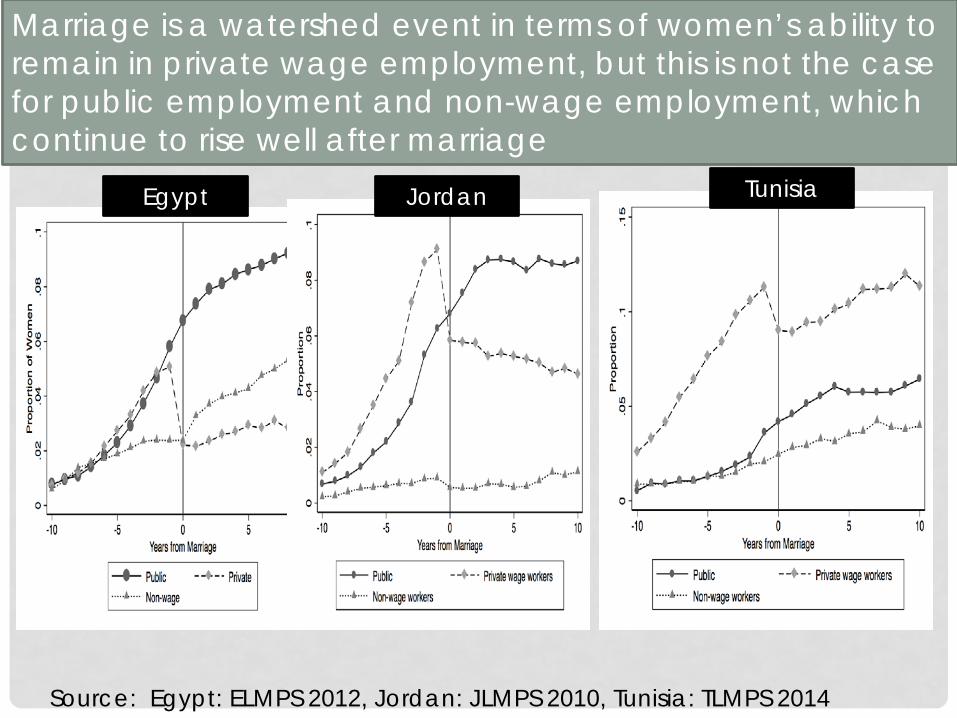
Marriage is a watershed event in terms of women’s ability to remain in private wage employment, but this is not the case for public employment and non-wage employment, which continue to rise well after marriage
Egypt TunisiaJordan
Source: Egypt: ELMPS 2012, Jordan: JLMPS 2010, Tunisia: TLMPS 2014
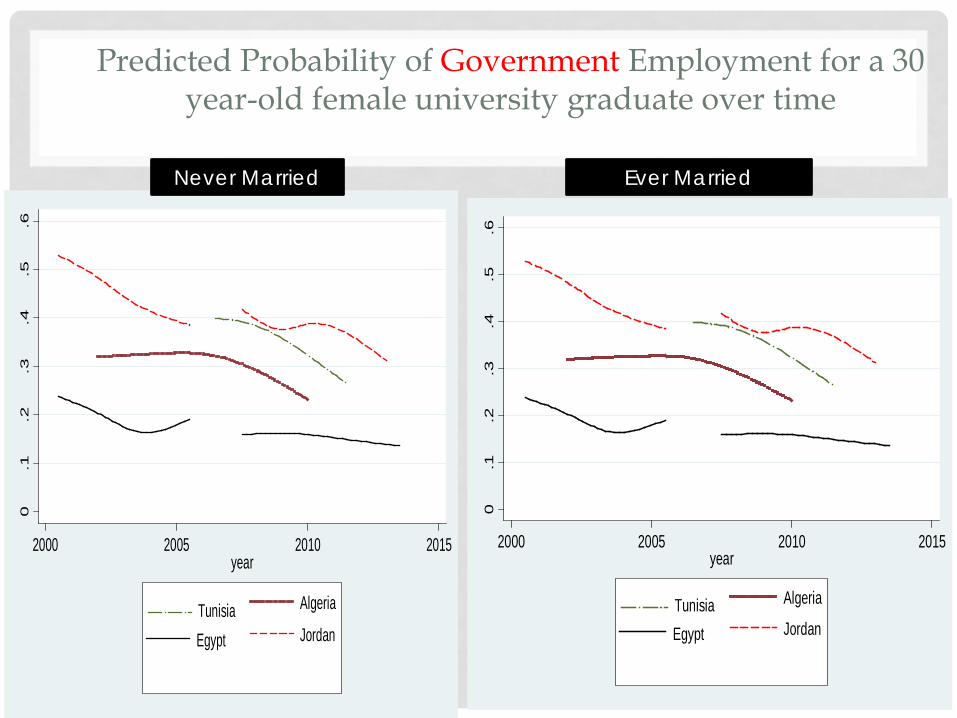
Predicted Probability of Government Employment for a 30 year-old female university graduate over time
0.1
.2.3
.4.5
.6
2000 2005 2010 2015year
AlgeriaTunisiaJordanEgypt
0.1
.2.3
.4.5
.6
2000 2005 2010 2015year
AlgeriaTunisiaJordanEgypt
Never Married Ever Married
0.0
5.1
.15
.2.2
5.3
2000 2005 2010 2015year
AlgeriaTunisiaJordanEgypt
0.0
5.1
.15
.2.2
5.3
2000 2005 2010 2015year
AlgeriaTunisiaJordanEgypt
Predicted Probability of Private Wage Employment for a 30 year-old female university graduate over time
Never Married Ever Married
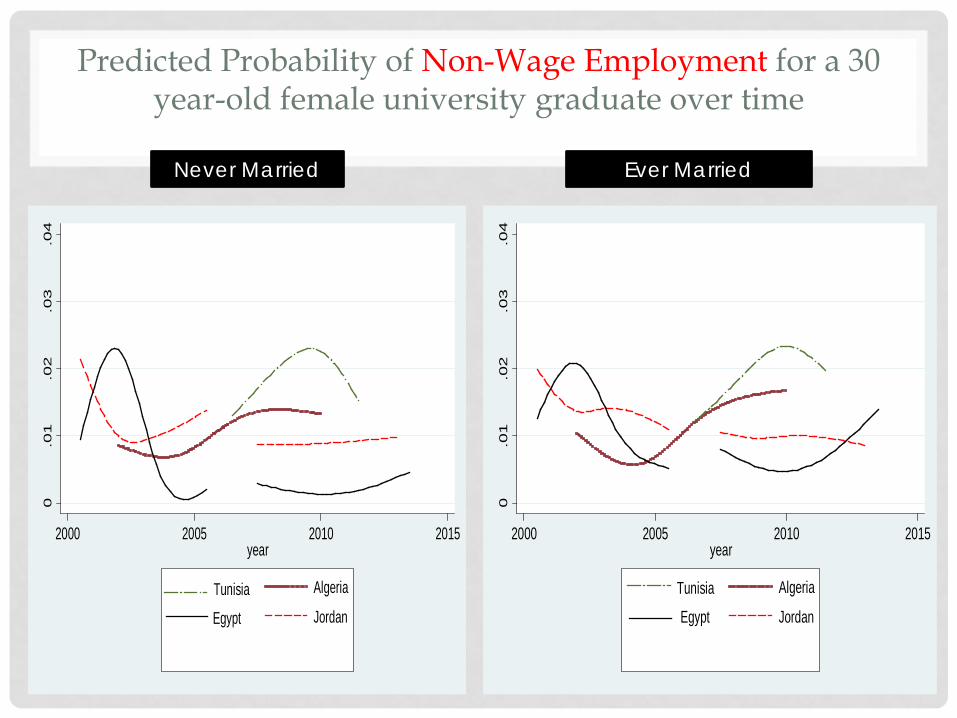
Predicted Probability of Non-Wage Employment for a 30 year-old female university graduate over time
Never Married Ever Married
0.0
1.0
2.0
3.0
4
2000 2005 2010 2015year
AlgeriaTunisiaJordanEgypt
0.0
1.0
2.0
3.0
4
2000 2005 2010 2015year
AlgeriaTunisiaJordanEgypt
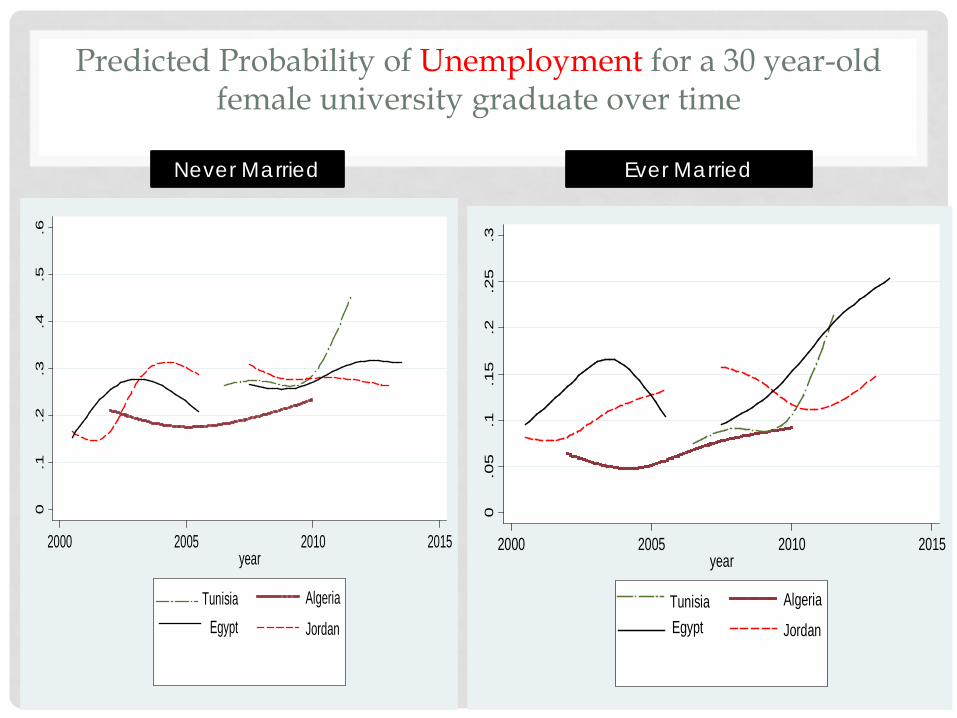
Predicted Probability of Unemployment for a 30 year-old female university graduate over time
Never Married Ever Married
0.1
.2.3
.4.5
.6
2000 2005 2010 2015year
AlgeriaTunisiaJordanEgypt
0.0
5.1
.15
.2.2
5.3
2000 2005 2010 2015year
AlgeriaTunisiaJordanEgypt
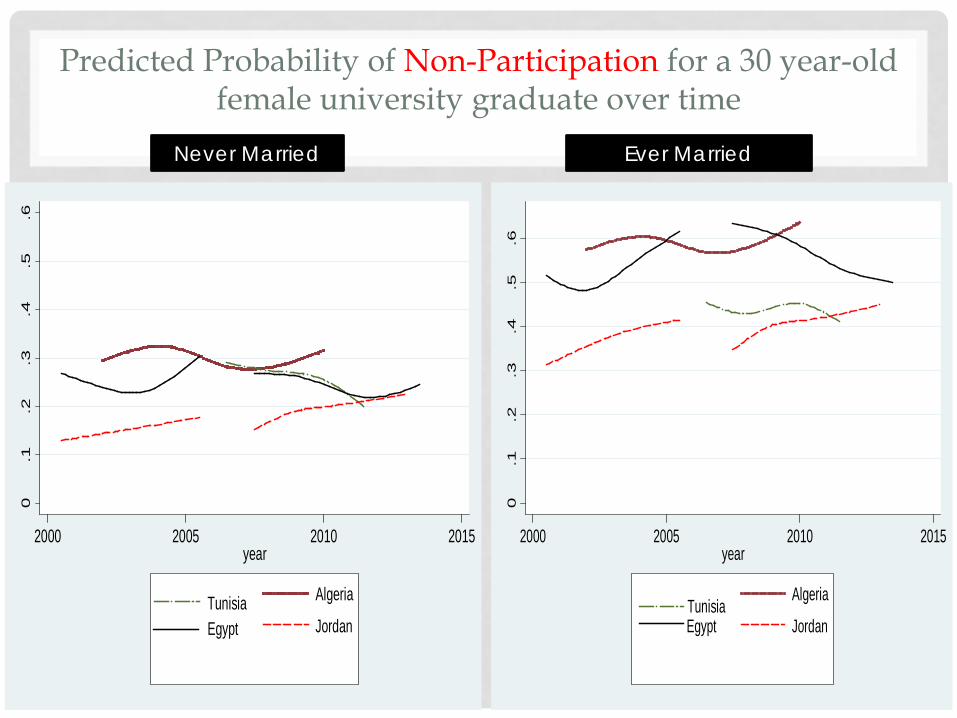
Predicted Probability of Non-Participation for a 30 year-old female university graduate over time
Never Married Ever Married
0.1
.2.3
.4.5
.6
2000 2005 2010 2015year
AlgeriaTunisiaJordanEgypt
0.1
.2.3
.4.5
.6
2000 2005 2010 2015year
AlgeriaTunisiaJordanEgypt
CONCLUSIONS
• Supply side factors are strongly favoring increased women’s participation in the labor force
• Women’s participation is stagnating in MENA due to demand-side factors that adversely affected opportunity structures for women
• Deterioration of job quality in MENA has affected both educated men and women, but women are increasingly unable to reconcile the worsening conditions with their reproductive
• Under current labor demand conditions, private sector employers are currently unwilling to make the necessary adjustments to create a more hospitable environment for women