PEER-REVIEWED ARTICLE bioresources · Junbo Shang,a,b aJian Lin,,b,* and Guangjie Zhao a Wood-based...
13
PEER-REVIEWED ARTICLE bioresources.com Shang et al. (2018). “Effects of chemical curing,” BioResources 13(4), 7175-7187. 7175 Effects of Chemical Curing on the Properties of Wood- based Precursors and Activated Carbon Microspheres Junbo Shang, a,b Jian Lin, a,b, * and Guangjie Zhao a Wood-based precursors and activated carbon microspheres were prepared through chemical curing and activation. The effects of the hydrochloric acid concentration on the thermal stability of the precursors and pore structures of the wood-based activated carbon microspheres were studied by thermo-gravimetric analysis, Fourier transform infrared spectroscopy, scanning electron microscopy, X-ray photoelectron spectroscopy, and analysis of the specific surface area and pore structure. The results showed that the reaction between the carbocations and benzene rings contributed to an increase in the methylene bonds, which reinforced the cross-linking degree and thermal stability of the wood-based cured microspheres. After activation, a typical microporous structure and part of an irregular mesoporous structure were formed in the wood-based activated carbon microspheres. The specific surface area, micropore volume, and mesopore volume increased, reaching maximum values of 1551 m 2 /g, 0.506 cm 3 /g, and 0.246 cm 3 /g at 4 mol/L hydrochloric acid, respectively, and then decreased as the hydrochloric acid concentration increased. The pore size distributions of the micropore and mesopore areas were in the range of 0.5 nm to 1.4 nm and 2 nm to 10 nm, respectively. Keywords: Chemical curing; Wood; Thermal stability; Pore structure; Activated carbon microspheres Contact information: a: Beijing Key Laboratory of Wood Science and Engineering, Beijing Forestry University, Beijing 100083, China; b: MOE Key Laboratory of Wooden Material Science and Application, Beijing Forestry University, Beijing 100083, China; *Corresponding author: [email protected] INTRODUCTION Activated carbon microspheres have been widely used in many areas, such as supercapacitors (Wang et al. 2014), gas adsorption (Wickramaratne and Jaroniec 2013), and biological medicine (Ye et al. 2008), because of advantages such as its smooth surface, high packing density, high mechanical strength, good uniformity, rolling property, and low flow resistance (Shen et al. 2008). Generally, most raw materials used for activated carbon microspheres are derived from fossil resources, such as pitch, coal, and phenolic resin. Environmental concerns have prompted researchers to seek alternative materials for the preparation of activated carbons from biomass materials, such as wood (Wang et al. 2015), bamboo (Ma et al. 2014), lignin (Lin and Zhao 2016), hemp (Geng et al. 2017), etc. Wood and wood wastes are a huge source of raw materials for the preparation of activated carbon materials. Based on the liquefaction of wood, precursors are prepared without complicated separation and purification processes, and wood-based carbon fibers can be successfully produced (Ma and Zhao 2011). The tensile strength of wood-based carbon fibers is almost the same as that of pitch-based carbon fibers (Li and Ma 2013). However, further research has demonstrated that liquefied wood is more suitable for preparing porous structural carbon materials by physical (Liu et al. 2015) or chemical
Transcript of PEER-REVIEWED ARTICLE bioresources · Junbo Shang,a,b aJian Lin,,b,* and Guangjie Zhao a Wood-based...
PEER-REVIEWED ARTICLE bioresources.com
Shang et al. (2018). “Effects of chemical curing,” BioResources 13(4), 7175-7187. 7175
Effects of Chemical Curing on the Properties of Wood-based Precursors and Activated Carbon Microspheres
Junbo Shang,a,b Jian Lin,a,b,* and Guangjie Zhao a
Wood-based precursors and activated carbon microspheres were prepared through chemical curing and activation. The effects of the hydrochloric acid concentration on the thermal stability of the precursors and pore structures of the wood-based activated carbon microspheres were studied by thermo-gravimetric analysis, Fourier transform infrared spectroscopy, scanning electron microscopy, X-ray photoelectron spectroscopy, and analysis of the specific surface area and pore structure. The results showed that the reaction between the carbocations and benzene rings contributed to an increase in the methylene bonds, which reinforced the cross-linking degree and thermal stability of the wood-based cured microspheres. After activation, a typical microporous structure and part of an irregular mesoporous structure were formed in the wood-based activated carbon microspheres. The specific surface area, micropore volume, and mesopore volume increased, reaching maximum values of 1551 m2/g, 0.506 cm3/g, and 0.246 cm3/g at 4 mol/L hydrochloric acid, respectively, and then decreased as the hydrochloric acid concentration increased. The pore size distributions of the micropore and mesopore areas were in the range of 0.5 nm to 1.4 nm and 2 nm to 10 nm, respectively.
Keywords: Chemical curing; Wood; Thermal stability; Pore structure; Activated carbon microspheres
Contact information: a: Beijing Key Laboratory of Wood Science and Engineering, Beijing Forestry
University, Beijing 100083, China; b: MOE Key Laboratory of Wooden Material Science and Application,
Beijing Forestry University, Beijing 100083, China; *Corresponding author: [email protected]
INTRODUCTION
Activated carbon microspheres have been widely used in many areas, such as
supercapacitors (Wang et al. 2014), gas adsorption (Wickramaratne and Jaroniec 2013),
and biological medicine (Ye et al. 2008), because of advantages such as its smooth surface,
high packing density, high mechanical strength, good uniformity, rolling property, and low
flow resistance (Shen et al. 2008). Generally, most raw materials used for activated carbon
microspheres are derived from fossil resources, such as pitch, coal, and phenolic resin.
Environmental concerns have prompted researchers to seek alternative materials for the
preparation of activated carbons from biomass materials, such as wood (Wang et al. 2015),
bamboo (Ma et al. 2014), lignin (Lin and Zhao 2016), hemp (Geng et al. 2017), etc. Wood
and wood wastes are a huge source of raw materials for the preparation of activated carbon
materials. Based on the liquefaction of wood, precursors are prepared without complicated
separation and purification processes, and wood-based carbon fibers can be successfully
produced (Ma and Zhao 2011). The tensile strength of wood-based carbon fibers is almost
the same as that of pitch-based carbon fibers (Li and Ma 2013).
However, further research has demonstrated that liquefied wood is more suitable
for preparing porous structural carbon materials by physical (Liu et al. 2015) or chemical

PEER-REVIEWED ARTICLE bioresources.com
Shang et al. (2018). “Effects of chemical curing,” BioResources 13(4), 7175-7187. 7176
activation (Huang and Zhao 2016). The preparation processes for wood-based activated
carbon fibers from liquefied wood include wood liquefaction, melt spinning, chemical
curing, carbonization, and activation. Before activation, the process of chemical curing is
a key step to improve the thermal stability of the precursors (Lin et al. 2013). In addition
to treatment with air or oxygen for the preparation of polyacrylonitrile-based (PAN-based)
carbon fibers, chemical curing requires a mixed solution of hydrochloric acid and
formaldehyde to stabilize the primary fibers. The process begins with immersing primary
fibers in a curing solution under the conditions of heating and incubation (Ma and Zhao
2008). During the chemical curing process, formaldehyde molecules in a solution, i.e.,
carbocations, react and form into methylene in the benzene rings of the primary fibers,
which results in a three-dimensional network structure between the molecular chains.
Therefore, the thermal-fusible primary fibers are transformed into thermal-setting
precursors to prevent melting during carbonization and activation (Lin et al. 2012).
In this study, wood-based activated carbon microspheres (WACMCs) were
successfully obtained from liquefied wood microspheres (LWMs) through the preparation
of microspheres, chemical curing, carbonization, and activation. The thermal
decomposition and chemical structure of the precursors prepared by chemical curing were
analyzed by thermo-gravimetric analysis (TGA) and Fourier transform infrared (FTIR)
spectroscopy. The morphologies were studied with scanning electron microscopy (SEM).
The surface chemical composition was examined using an X-ray photoelectron
spectrometer. The N2 adsorption/desorption isotherms and pore volumes were measured
with a specific surface area and porosity analyzer.
EXPERIMENTAL
Materials Chinese fir (Cunninghamia lanceolata) was obtained from Fujian province, China.
The chemicals, including phenol, phosphoric acid, hexamethylenetetramine (HTMA),
hydrochloric acid, and polyvinyl alcohol (PVA), were purchased from Beijing Lanyi
Chemical Products Corp. (Beijing, China). All of the chemicals were used directly without
further purification.
Methods Preparation of the precursors
A mixture of 25 g of dried Chinese fir powder (20 mesh to 80 mesh) and 100 g of
phenol was put into a bottle flask, and 8 g of phosphoric acid (8% based on the weight of
the phenol) were added. The flask was immersed in an oil bath, heated rapidly from room
temperature to 160 °C, and incubated for 2.5 h. The flask was then cooled to room
temperature with cool water, and the resultant mixture was filtered through a glass crucible
filter (G2, pore diameter of 10 μm to 15 μm) to separate the filtrate from the residue (Shang
et al. 2015). Subsequently, the filtered residue was put into a solution pre-heated to 65 °C
with 6% PVA (based on the weight of the liquefied wood) and stirred at 400 rpm for 2 h.
Then, the LWMs were obtained by washing the resultant mixture with distilled water and
drying them in a vacuum oven at 45 °C for 24 h. The wood-based cured microspheres
(LWCMs) were obtained by immersing the LWMs in a solution of hydrochloric acid
(molar concentrations of 1 mol/L, 2 mol/L, 3 mol/L, 4 mol/L, 5 mol/L, and 6 mol/L) and 5
g/L HTMA, which was incubated at 85 °C for 2 h. Then, the resultant mixture was washed

PEER-REVIEWED ARTICLE bioresources.com
Shang et al. (2018). “Effects of chemical curing,” BioResources 13(4), 7175-7187. 7177
with distilled water and dried in a vacuum oven (degree of vacuum = 0.1 MPa) at 45 °C.
The samples were marked as LWCM-x, where x is the molar concentration.
Preparation of the wood-based activated carbon microspheres
The LWCMs were carbonized at 600 °C at a heating rate of 4 °C/min under N2, and
were incubated for 1 h. Then, the temperature was increased from 600 °C to 800 °C at a
heating rate of 4 °C/min, and they were incubated for 1 h under N2 and water steam. The
WACMCs were obtained and marked as WACMC-x, where x is the molar concentration.
Characterization Thermo-gravimetric analysis
The weight loss behaviors and decomposition temperatures of the samples were
determined using a TGA device (TGA STA449F3, Netzscn Corp., Selb, Germany) from
room temperature to 600 °C at a heating rate of 10 °C/min in high-purity argon steam (flow
rate of 60 mL/min).
Fourier transform infrared spectroscopy
Fourier transform infrared spectroscopy of the samples was performed using a
FTIR spectrophotometer (Tensor 27, Bruker Corp., Karlsruhe, Germany). The survey
resolution was 4 cm-1 with 32 scans and a scanning range of 4000 cm-1 to 500 cm-1. The
samples were dried before they were mixed with water-removed KBr crystals, and then
were ground in an agate mortar at a weight ratio of 1:100 (sample to KBr crystals). A few
samples were put on a tablet press (FW-4A, Ruilaite Corp., Tianjing, China) to make a
transparent sheet for the measurements.
Scanning electron microscopy
The morphologies of the samples were observed with SEM (S-3400N, Hitachi,
Tokyo, Japan) after a gold-coated treatment (E-1010, Hitachi) at magnification factors of
1500x and 2000x and an accelerating voltage of 10 kV.
X-ray photoelectron spectroscopy
The X-ray photoelectron spectroscopy (XPS) measurements were performed on a
spectrophotometer (ESCALAB 250Xi, Thermo Fisher Scientific Inc., MA, USA) to
determine the quantity and type of functional groups present on the surface of the samples
with a monochromated Al Kα X-ray source (hv = 1486.6 eV). The survey scans were
collected from the binding energy range of 0 eV to 1350 eV. A nonlinear, least squares
regression analysis program (XPSPEAK software, Version 4.1, Informer Technologies,
Inc., Hong Kong, China) was used for the XPS spectral deconvolution.
Specific surface area and pore structure analysis
The samples were out-gassed at 300 °C for 3 h to remove any moisture or volatile
compounds within the pores of the samples. The N2 adsorption-desorption isotherms were
then measured at 77 K with a specific surface area and porosity analyzer (Autosorb-IQ,
Quantachrome Instruments Corp., Florida, USA). The Brunauer-Emmett-Teller (BET)
model was used to calculate the specific surface area (SBET) from the N2 adsorption
isotherms in the relative pressure (P/P0) range of 0.05 to 0.3 (Okada et al. 2003). The
adsorption total pore volumes at relative pressures of 0.1 and 0.995 are equal to the volume
of the micropores and total volume of the micropores and mesopores (Vtot), respectively

PEER-REVIEWED ARTICLE bioresources.com
Shang et al. (2018). “Effects of chemical curing,” BioResources 13(4), 7175-7187. 7178
(Azargohar and Dalai 2008). The micropore (Smicro) and mesopore (Smeso) areas were
calculated according to the t-plot and Barrett-Joyner-Halenda methods, respectively (De
Boer et al. 1966; Valente Nabais et al. 2004; Li and Ma 2013). The pore size distribution
was calculated using the quenched solid density functional theory method (Lastoskie et al.
1993; Neimarka et al. 2009).
RESULTS AND DISCUSSION
Thermal Stability of the LWM and LWCMs Figure 1 shows the thermo-gravimetric (TG) and differential thermo-gravimetric
(DTG) curves of the LWM and LWCMs prepared at different hydrochloric acid
concentrations.
(a)
(b)
Fig. 1. TG (a) and DTG (b) curves of the LWM and LWCMs prepared at various hydrochloric acid concentrations

PEER-REVIEWED ARTICLE bioresources.com
Shang et al. (2018). “Effects of chemical curing,” BioResources 13(4), 7175-7187. 7179
Figure 1a shows that the trends of the TG curves from room temperature to 100 °C
were similar, and the pyrolysis weight loss of all the samples was less than 5%, which was
mainly because of the removal of water. However, as the pyrolysis temperature increased,
the difference in the pyrolysis weight loss between the LWM and LWCMs increased. From
100 °C to 220 °C, the pyrolysis weight loss of the LWM appeared to decrease and the DTG
curve showed an obvious peak at approximately 120 °C, which is shown in Fig. 1b. In
contrast, there was a small decrease for the LWCMs because of the small quantity of small
molecules that escaped after chemical curing.
When the pyrolysis temperature was above 200 °C, there was a remarkable
variation in the TG curves. Thermal decomposition and combustion took place between
200 °C to 600 °C, and byproducts, such as small molecular weight substances like CH4,
CO, and CO2, were combusted or evaporated (Zhang and Shen 2009). Accompanied with
an increase in the hydrochloric acid concentration, the pyrolysis reaction rate decreased as
the DTG curves of the LWCMs became wider. Moreover, the peak temperature of the
maximum pyrolysis reaction rate increased. The highest pyrolysis peak temperature of the
LWCMs was 406 °C for the sample treated with 6 mol/L hydrochloric acid, which was 73
°C higher than that of the LWM (333 °C). These results indicated that the cross-linking
degree and thermal stability of the precursors were improved by chemical curing (Ma and
Zhao 2008).
During the chemical curing process, carbocations were generated from the reaction
of the hydrochloric acid and HTMA. The more hydrochloric acid was added, the more
carbocations were generated in the solution. When the LWCMs were immersed in the
curing solution, carbocations diffused into the interior of the LWCMs and promoted the
uniformity of the cross-linking degree of the LWCMs from the inside to the outside. When
the pyrolysis temperature increased to 600 °C, the pyrolysis residual ratio of the LWM was
below 40%. As the hydrochloric acid concentrations of the LWCMs were increased from
1 mol/L to 6 mol/L, the pyrolysis residual ratio first increased and then decreased. The
highest pyrolysis residual ratio of the LWCMs was 51.3%, which occurred in the solution
with a hydrochloric acid concentration of 4 mol/L, higher than that of 47.8% (the
hydrochloric acid concentration of 6 mol/L).
An increase in the hydrochloric acid concentration increased the amount of
carbocations in the solution and enhanced the cross-linking degree of the molecular chain
of the LWCMs. However, an excessive hydrochloric acid concentration made the reaction
occur too quickly, so that the surface layer of the precursors was cured immediately and
became denser as the reaction continued. Therefore, the carbocations were prevented from
penetrating into the precursors to fortify the cross-linking structures inside, which resulted
in a low cross-linking degree and thermal stability (Ma and Zhao 2010). In contrast, when
the hydrochloric acid concentration was too low, the deficient amount of carbocations was
unable to support enough curing reactions with the precursors, which resulted in a
vulnerable cross-linking structure and poor thermal stability.
The morphologies of the LWM and LWCM-4 are depicted in Fig. 2. Although there
was no difference in the sphericity between the two samples, the chemical curing process
formed a dense solidified layer on the surface of the LWCM-4 and the surface was denser
than that of the LWM (Zhang and Shen 2009). Beneath the surface layer, the porous
structures of the LWM and LWCM-4 were observed clearly. Therefore, the LWCM-4
acquired a dense surface layer outside and a rich porous structure inside, and further
processes, such as carbonization and activation, are necessary to open up the inner and
outer pore connection.

PEER-REVIEWED ARTICLE bioresources.com
Shang et al. (2018). “Effects of chemical curing,” BioResources 13(4), 7175-7187. 7180
Fig. 2. SEM images of the LWM (a) and LWCM-4 (b) at 500x magnification and the LWM (c) and LWCM-4 (d) at 1000x magnification
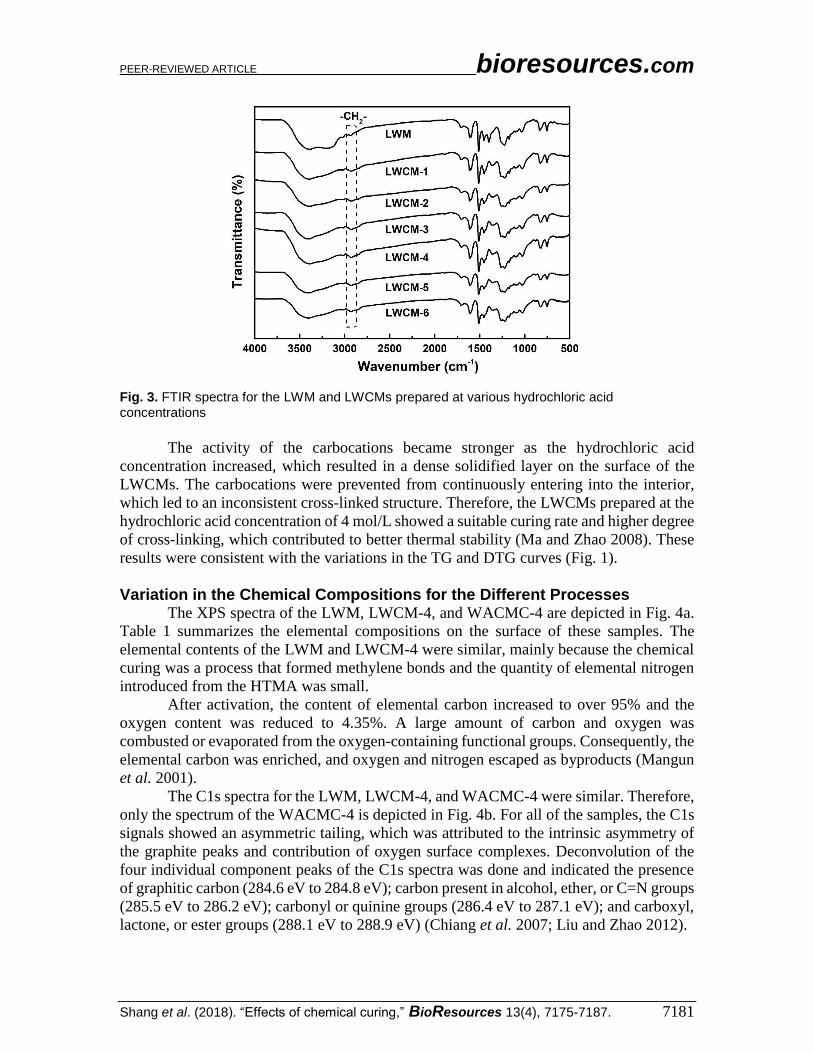
Cross-linking Reaction during Chemical Curing Figure 3 shows the FTIR spectra of the LWM and LWCMs prepared at different
hydrochloric acid concentrations. During the process of chemical curing, the reaction
between the carbocations and reactive carbon of the benzene rings in the precursors was
attributed to the generation of methylene groups, cross-linking of the molecular chains, and
formation of three dimensional structures (Shang et al. 2015). When the hydrochloric acid
concentration increased, the absorption peaks from 3430 cm-1 to 3400 cm-1 (stretching
vibration of hydroxyl groups), 1610 cm-1, and 1454 cm-1 (stretching vibration of C=C in
aromatic rings) weakened at first and then were enhanced, which indicated that dehydration
condensation reactions occurred between the phenolic hydroxyl groups and carbocations
from the curing solution.
Carbocations were generated from the HTMA under acidic conditions, and the
lignin structural units were connected in the form of methylene bonds to develop a cross-
linked structure, which fortified the thermal stability of the LWCMs. The intensity of the
absorption peak at 2932 cm-1 (stretching vibration of methylene groups) first increased and
then decreased, whereas the intensities of the absorption peaks at 1099 cm-1 (aromatic ether
bonds) and 1029 cm-1 (hydroxyl methyl groups) decreased at first and then increased. This
demonstrated that the aromatic ether bonds and hydroxyl methyl groups were converted
into methylene bonds and the cross-linked structure of the precursors was enhanced (Shang
et al. 2015). Meanwhile, the absorption peaks at 880 cm-1 and 823 cm-1 decreased at first
and then increased as the hydrochloric acid concentration increased, which indicated that
the dehydration condensation reactions between the carbocations and active atomic
hydrogen of the benzene rings also formed cross-linked structures during chemical curing.
PEER-REVIEWED ARTICLE bioresources.com
Shang et al. (2018). “Effects of chemical curing,” BioResources 13(4), 7175-7187. 7181
Fig. 3. FTIR spectra for the LWM and LWCMs prepared at various hydrochloric acid concentrations
The activity of the carbocations became stronger as the hydrochloric acid
concentration increased, which resulted in a dense solidified layer on the surface of the
LWCMs. The carbocations were prevented from continuously entering into the interior,
which led to an inconsistent cross-linked structure. Therefore, the LWCMs prepared at the
hydrochloric acid concentration of 4 mol/L showed a suitable curing rate and higher degree
of cross-linking, which contributed to better thermal stability (Ma and Zhao 2008). These
results were consistent with the variations in the TG and DTG curves (Fig. 1).
Variation in the Chemical Compositions for the Different Processes The XPS spectra of the LWM, LWCM-4, and WACMC-4 are depicted in Fig. 4a.
Table 1 summarizes the elemental compositions on the surface of these samples. The
elemental contents of the LWM and LWCM-4 were similar, mainly because the chemical
curing was a process that formed methylene bonds and the quantity of elemental nitrogen
introduced from the HTMA was small.
After activation, the content of elemental carbon increased to over 95% and the
oxygen content was reduced to 4.35%. A large amount of carbon and oxygen was
combusted or evaporated from the oxygen-containing functional groups. Consequently, the
elemental carbon was enriched, and oxygen and nitrogen escaped as byproducts (Mangun
et al. 2001).
The C1s spectra for the LWM, LWCM-4, and WACMC-4 were similar. Therefore,
only the spectrum of the WACMC-4 is depicted in Fig. 4b. For all of the samples, the C1s
signals showed an asymmetric tailing, which was attributed to the intrinsic asymmetry of
the graphite peaks and contribution of oxygen surface complexes. Deconvolution of the
four individual component peaks of the C1s spectra was done and indicated the presence
of graphitic carbon (284.6 eV to 284.8 eV); carbon present in alcohol, ether, or C=N groups
(285.5 eV to 286.2 eV); carbonyl or quinine groups (286.4 eV to 287.1 eV); and carboxyl,
lactone, or ester groups (288.1 eV to 288.9 eV) (Chiang et al. 2007; Liu and Zhao 2012).

PEER-REVIEWED ARTICLE bioresources.com
Shang et al. (2018). “Effects of chemical curing,” BioResources 13(4), 7175-7187. 7182
(a)
(b)
Fig. 4. XPS spectra of the LWM, LWCM-4, and WACMC-4 (a); and peak fitting of the XPS C1s peaks for WACMC-4 (b)
Table 1. Surface Elemental Composition of the LWM, LWCM-4, and WACMC-4
Sample C1s (%)
O1s (%)
N1s (%)
O/C (%)
LWM 77.34 21.35 1.31 27.61
LWCM-4 77.24 21.63 1.04 28.00
WACMC-4 95.13 4.35 0.67 0.045
Table 2 summarizes the percentages of the graphitic and functional carbon atoms
of the samples. The comparison of the spectra was done between LWM, LWCM-4, and
WACMC-4. After chemical curing, the oxygen functional groups decreased, except for the
carboxyl groups, which increased due to oxidation of the hydrochloric acid. After
activation, the amount of graphitic carbon increased, whereas the carbonyl and carboxyl

PEER-REVIEWED ARTICLE bioresources.com
Shang et al. (2018). “Effects of chemical curing,” BioResources 13(4), 7175-7187. 7183
groups were reduced, which was mainly because, under the conditions of high temperature
and water steam, more graphitic carbons were enriched and reacted with steam water
molecules to generate functional groups containing C-O (Lin and Zhao 2016). The
carbonyl and carboxyl groups combusted, which resulted in volatile byproducts, such as
CO2, CO, H2O, etc.
Table 2. Results of the Fits of the C1s Regions
Sample
C-C C-O C=O -COOH
BE (eV)
RC* (%)
BE (eV)
RC (%)
BE (eV)
RC (%)
BE (eV)
RC (%)
LWM 284.7 58.66 285.5 18.88 286.5 20.63 288.3 1.83
LWCM-4 284.7 60.19 285.6 15.16 286.5 14.63 288.3 10.02
WACMC-4 284.8 70.10 285.5 22.19 286.4 1.07 288.9 6.64
*RC values given in % represent the relative content
Pore Structure of the WACMCs The N2 adsorption-desorption isotherms of the WACMCs are shown in Fig. 5. The
amount of adsorption in the low-pressure zone increased rapidly, which indicated that the
samples had a typical microporous structure. The isotherms displayed hysteresis loops to
various degrees, which indicated that there was part of an irregular mesopore structure
inside of the samples (Jin and Huang 2015). As the hydrochloric acid concentration
increased, the isotherms showed a more pronounced knee shape, which indicated that a
mesoporous structure with a smaller pore size formed in the samples (Lee et al. 2003).
Furthermore, the N2 adsorption capacity of the WACMC-4 was the highest at 586 cm3/g.
Fig. 5. N2 adsorption-desorption isotherms of the WACMCs
Table 3 shows the nitrogen adsorption and pore structure parameters of the
WACMCs. As the hydrochloric acid concentration increased from 1 mol/L to 6 mol/L, the
specific surface area increased from 1290 m2/g to a maximum of 1551 m2/g at 4 mol/L,
and then decreased to 1239 m2/g.

PEER-REVIEWED ARTICLE bioresources.com
Shang et al. (2018). “Effects of chemical curing,” BioResources 13(4), 7175-7187. 7184
Table 3. Nitrogen Adsorption and Pore Structure Parameters of the WACMCs
Sample SBET
(m2/g) Smicro
(m2/g) Vmicro
(cm3/g) Smeso
(m2/g) Vmeso
(cm3/g) Vtotal
(cm3/g)
WACMC-6 1239 982 0.398 191 0.215 0.650
WACMC-5 1243 1061 0.427 138 0.172 0.624
WACMC-4 1511 1261 0.506 213 0.246 0.796
WACMC-3 1413 1155 0.465 195 0.211 0.723
WACMC-2 1386 1143 0.495 183 0.226 0.756
WACMC-1 1290 1054 0.421 176 0.204 0.660
(a)
(b)
Fig. 6. Pore size distributions of the micropore (a) and mesopore (b) areas of the WACMCs
The same was true for the micropore and mesopore volumes. When the
hydrochloric acid concentration was lower, the solidified layer on the surface was too weak
and the internal cross-linking degree was not strong enough to protect the LWCMs from

PEER-REVIEWED ARTICLE bioresources.com
Shang et al. (2018). “Effects of chemical curing,” BioResources 13(4), 7175-7187. 7185
the water steam, which meant that the pores were more likely to collapse during activation.
This accounted for the nitrogen adsorption and pore structure parameters. In contrast, when
the hydrochloric acid concentration was too high, a dense solidified layer formed quickly
on the surface of the LWCMs, which hindered the entry of carbocations and resulted in a
weak cross-linking degree inside of the precursors during the process of chemical curing.
Therefore, the inner structure was vulnerable to collapse during activation when the water
steam penetrated though the solidified layer into the cured microspheres.
Figure 6 shows the pore size distributions of the WACMCs. Figures 6a and 6b show
the micropore and mesopore areas (2 nm to 30 nm), respectively. The pore size distribution
of the micropore area was mainly concentrated to the range of 0.5 nm to 1.4 nm. In the
mesopore region, the pore size distribution of the mesopores was mainly concentrated
between 2 nm to 10 nm. The mesoporous structure with the smaller pore size distribution
of the WACMCs was prepared by chemical curing and activation. Therefore, chemical
curing contributed to the development of the specific surface area and pore volume of the
WACMCs, but had little effect on the pore size distribution.
CONCLUSIONS
1. After chemical curing, the pyrolysis residual ratio of the liquefied wood microspheres
(LWCMs) was improved obviously. As the hydrochloric acid concentrations increased,
the pyrolysis residual ratio first increased to the highest at 51.3% (the hydrochloric acid
concentration of 4 mol/L), then decreased. Moreover, the reaction between the
carbocations and benzene rings contributed to the reinforcement of the intensity of
methylene functional groups and cross-linking degree of the wood-based cured
microspheres either.
2. The WACMCs had a typical microporous structure and formed part of an irregular
mesoporous structure. The specific surface area, micropore volume, and mesopore
volume increased at first and then decreased as the hydrochloric acid concentration
increased from 1 mol/L to 6 mol/L. When the concentration was 4 mol/L, the specific
surface area, micropore volume, and mesopore volume were 1551 m2/g, 0.506 cm3/g,
and 0.246 cm3/g, respectively. The pore size distribution of the micropore area was
mainly concentrated to the range of 0.5 nm to 1.4 nm, and that of the mesopore area
was mainly concentrated between 2 nm to 10 nm.
ACKNOWLEDGMENTS
The authors are grateful for the support of “The Fundamental Research Funds for
the Central Universities” (Grant No. 2017PT11).
REFERENCES CITED
Azargohar, R., and Dalai, A. K. (2008). “Steam and KOH activation of biochar:
Experimental and modeling studies,” Micropor. Mesopor. Mat. 110(2-3), 413-421.
DOI: 10.1016/j.micromeso.2007.06.047

PEER-REVIEWED ARTICLE bioresources.com
Shang et al. (2018). “Effects of chemical curing,” BioResources 13(4), 7175-7187. 7186
Chiang, Y.-C., Lee, C.-C., and Lee, H.-C. (2007). “Characterization of microstructure
and surface properties of heat-treated PAN-and rayon-based activated carbon fibers,”
J. Porous Mat. 14(2), 227-237. DOI: 10.1007/s10934-006-9028-8
De Boer, J. H., Lippens B. C., Linsen B. G., Broekhoff J. C. P., Van den Heuvel A., and
Osinga T. J. (1966). “The T-curve of multimolecular N2-adsorption,” J. Colloid
Interf. Sci. 21(4), 405-414. DOI: 10.1016/0095-8522(66)90006-7
Geng, J., Li, L.-F., Wang, W.-L., Chang, J.-M., Xia, C.-L., Cai, L.-P., and Shi, S. Q.
(2017). “Fabrication of activated carbon using two-step co-pyrolysis of used rubber
and larch sawdust,” BioResources 12(4), 8641-8652. DOI:
10.15376/biores.12.4.8641-8652
Huang, Y., and Zhao, G. (2016). “A novel method for the production of mesoporous
activated carbon fibers from liquefied wood,” Mater. Lett. 178, 190-192. DOI:
10.1016/j.matlet.2016.03.064
Jin, Y. R., and Huang, Z. X. (2015). “Adsorption isotherms,” in: Adsorption and Pore
Size Distribution, 1st Ed., National Defense Industry Press, Beijing, China, pp. 87-
105.
Lastoskie, C., Gubbins, K. E., and Quirke, N. (1993). “Pore size distribution analysis of
microporous carbon: A density functional theory approach,” J. Phys. Chem. 97(18),
4786-4796. DOI: 10.1021/j100120a035
Lee, Y.-S., Basova, Y. V., Edie, D. D., Reid, L. K., Newcombe, S. R., and Ryu, S.-K.
(2003). “Preparation and characterization of trilobal activated carbon fibers,” Carbon
41(13), 2573-2584. DOI: 10.1016/S0008-6223(03)00376-2
Li, D., and Ma, X. (2013). “Preparation and characterization of activated carbon fibers
from liquefied wood,” Cellulose 20(4), 1649-1656. DOI: 10.1007/s10570-013-9981-8
Lin, J., and Zhao, G. (2016). “Preparation and characterization of high surface area
activated carbon fibers from lignin,” Polymers-Basel 8(10), 369-378. DOI:
10.3390/polym8100369
Lin, J., Kubo, S., Yamada, T., Koda, K., and Uraki, Y. (2012). “Chemical
thermostabilization for the preparation of carbon fibers from softwood lignin,”
BioResources 7(4), 5634-5646. DOI: 10.15376/biores.7.4.5634-5646
Lin, J., Shang, J.-B., and Zhao, G.-J. (2013). “The preparation and characterization of
liquefied wood based primary fibers,” Carbohyd. Polym. 91(1), 224-228. DOI:
10.1016/j.carbpol.2012.08.007
Liu, W., and Zhao, G. (2012). “Effect of temperature and time on microstructure and
surface functional groups of activated carbon fibers prepared from liquefied wood,”
BioResources 7(4), 5552-5567. DOI: 10.15376/biores.7.4.5552-5567
Liu, W., Zhang, Q., and Zhao, G. (2015). “Influence of activation time on the
microstructure and antibacterial activity of nanosilver-containing activated carbon
fibers prepared from liquefied wood,” Fiber. Polym. 16(3), 522-528. DOI:
10.1007/s12221-015-0522-y
Ma, X., and Zhao, G. (2008). “Structure and performance of fibers prepared from
liquefied wood in phenol,” Fiber. Polym. 9(4), 405-409. DOI: 10.1007/s12221-008-
0065-6
Ma, X., and Zhao, G. (2010). “Preparation of carbon fibers from liquefied wood,” Wood
Sci. Technol. 44(1), 3-11. DOI: 10.1007/s00226-009-0264-3
Ma, X., and Zhao, G. (2011). “Variations in the microstructure of carbon fibers prepared
from liquefied wood during carbonization,” J. Appl. Polym. Sci. 121(6), 3525-3530.
DOI: 10.1002/app.34142

PEER-REVIEWED ARTICLE bioresources.com
Shang et al. (2018). “Effects of chemical curing,” BioResources 13(4), 7175-7187. 7187
Ma, X. J., Yang, H. M., Yu, L. L., Chen, Y., and Li, Y. (2014). “Preparation, surface and
pore structure of high surface area activated carbon fibers from bamboo by steam
activation,” Materials 7(6), 4431-4441. DOI: 10.3390/ma7064431
Mangun, C. L., Benak, K. R., Economy, J., and Foster, K. L. (2001). “Surface chemistry,
pore sizes and adsorption properties of activated carbon fibers and precursors treated
with ammonia,” Carbon 39(12), 1809-1820. DOI: 10.1016/S0008-6223(00)00319-5
Neimarka, A. V., Lin, Y. Z., Ravikovitch, P. I., and Thommes, M. (2009). “Quenched
solid density functional theory and pore size analysis of micro-mesoporous carbons,”
Carbon 47(7), 1617-1628. DOI: 10.1016/j.carbon.2009.01.050
Okada, K., Yamamoto, N., Kameshima, Y., and Yasumori, A. (2003). “Porous properties
of activated carbons from waste newspaper prepared by chemical and physical
activation,” J. Colloid Interf. Sci. 262(1), 179-193. DOI: 10.1016/S0021-
9797(03)00107-3
Shang, J., Lin, J., Zhao, G., Zhang, J., Su, Z., and Guo, S. (2015). “Effects of time and
chemical curing temperature on the properties of liquefied wood-based precursors and
carbon fibers,” BioResources 10(4), 7477-7488. DOI: 10.15376/biores.10.4.7477-
7488
Shen, Z. M., Zhang, W. H., and Zhang, X. J. (2008). “Activated carbon microspheres” in:
Preparation and Application of Activated Carbon Materials, (1st ed.), Chemical
Industry Press, Beijing, China, pp. 127-131.
Valente Nabais, J. M., Carrott, P. J. M., Ribeiro Carrott, M. M. L., and Menéndez, J. A.
(2004). “Preparation and modification of activated carbon fibres by microwave
heating,” Carbon 42(7), 1315-1320. DOI: 10.1016/j.carbon.2004.01.033
Wang, H., Shi, L., Yan, T., Zhang, J., Zhong, Q., and Zhang, D. (2014). “Design of
graphene-coated hollow mesoporous carbon spheres as high performance electrodes
for capacitive deionization,” J. Mater. Chem. A 2(13), 4739-4750. DOI:
10.1039/C3TA15152B
Wang, Y., Yang, R., Li, M., and Zhao, Z. (2015). “Hydrothermal preparation of highly
porous carbon spheres from hemp (Cannabis sativa L.) stem hemicellulose for use in
energy-related applications,” Ind. Crop. Prod. 65, 216-226. DOI:
10.1016/j.indcrop.2014.12.008
Wickramaratne, N. P., and Jaroniec, M. (2013). “Importance of small micropores in CO2
capture by phenolic resin-based activated carbon spheres,” J. Mater. Chem. A 1(1),
112-116. DOI: 10.1039/C2TA00388K
Ye, C., Gong, Q.-M., Lu, F.-P., and Liang, J. (2008). “Preparation of carbon
nanotubes/phenolic-resin-derived activated carbon spheres for the removal of middle
molecular weight toxins,” Sep. Purif. Technol. 61(1), 9-14. DOI:
10.1016/j.seppur.2007.09.021
Zhang, T., and Shen, Q. (2009). “Preparation and characterization of carbon fiber derived
from lignin-phenol-formaldehyde resin,” Journal of Cellulose Science and
Technology 17(2), 6-11. DOI: 10.3969/j.issn.1004-8405.2009.02.002
Article submitted: May 4, 2018; Peer review completed: July 21, 2018; Revised version
received: July 25, 2018; Accepted: July 27, 2018; Published: August 1, 2018.
DOI: 10.15376/biores.13.4.7175-7187