Pediatric Quality Indicators: Software … Quality Indicators: Software Documentation, Version 3.0b...
42
AHRQ Quality Indicators Pediatric Quality Indicators: Software Documentation, Version 3.0b SAS Department of Health and Human Services Agency for Healthcare Research and Quality http://www.qualityindicators.ahrq.gov Version 3.0b (September 29, 2006)
Transcript of Pediatric Quality Indicators: Software … Quality Indicators: Software Documentation, Version 3.0b...
AHRQ Quality Indicators
Pediatric Quality Indicators: Software Documentation, Version 3.0b SAS
Department of Health and Human Services Agency for Healthcare Research and Quality http://www.qualityindicators.ahrq.gov
Version 3.0b (September 29, 2006)

AHRQ Quality Indicators Web Site: http://www.qualityindicators.ahrq.gov
Abstract The value of information on health care quality has never been so widely recognized; yet many organizations lack the resources and/or expertise to build a quality information program from the ground up. Recognizing this, the AHRQ Quality Indicators were developed specifically to meet the short-term needs for information on health care quality using standardized, user-friendly methods and existing sources of data.
This module of the AHRQ Quality Indicators was designed to capitalize on the availability of administrative data on inpatient stays to produce information for Pediatric Quality Indicators (PDIs). These indicators capture volume and mortality for selected procedures, potentially preventable complications and iatrogenic events for children treated in hospitals, and potentially preventable hospitalizations for ambulatory care sensitive conditions. They can be used as a screening tool for problems that patients experience as a result of exposure to the healthcare system and that are likely amenable to prevention by changes at the system or provider level.
This document is the software documentation for the Pediatric Quality Indicators software Version 3.0b, which is provided on the AHRQ Web site. The software was developed in SAS, for use on a personal computer. By making this tool available, we hope to assist others in producing information on health care quality more cost effectively.
Details on the development of the Pediatric Quality Indicators can be found in Measures of Pediatric Health Care Quality based on Hospital Administrative Data, available at http://www.qualityindicators.ahrq.gov/pdi_download.htm.
PDI SAS Software Documentation i Version 3.0b (September 29, 2006)

AHRQ Quality Indicators Web Site: http://www.qualityindicators.ahrq.gov
Acknowledgments
Support efforts, including refinement and enhancement of the AHRQ Quality Indicators and related products, are provided by the Support for Quality Indicators (SQI-II) contract team.
The following individuals from Battelle Memorial Institute, Stanford University, and University of California (UC) constitute the Support for Quality Indicators core team:
Sheryl Davies, M.A. Mark Gritz, Ph.D. Kathryn McDonald, M.M. Bruce Ellis, M.S. Theresa Schaaf, P.M.P Patrick Romano, M.D., M.P.H Jeffrey Geppert, J.D. Elaine Keller, M.Ed. Jeff Schoenborn, B.S.
The Agency for Healthcare Research and Quality Support for Quality Indicators team includes:
Marybeth Farquhar, Project Officer Mary B. Haines, Contract Officer Mamatha Pancholi, M.S., Project Officer
This product is based on the work of many individuals who contributed to its development and testing.
The following staff from the Stanford University performed the evidence review, facilitated clinician reviews, and completed the empirical evaluation for the new Pediatric Quality Indicators:
Project Team Kathryn McDonald, M.M. (Stanford)Patrick Romano, M.D., M.P.H. (UC-Davis)Sheryl M. Davies, M.A. (Stanford)Corinna Haberland, M.D. (Stanford)
Jeffrey Geppert, J.D. (Battelle) Amy Ku, M.H.S.A.. (Stanford) Kavita Choudhry, B.A. (Stanford)
We also wish to acknowledge the invaluable contribution of the clinical panelists and the peer reviewers of the evidence report; and the testers of the software products.
PDI SAS Software Documentation ii Version 3.0b (September 29, 2006)

AHRQ Quality Indicators Web Site: http://www.qualityindicators.ahrq.gov
Table of Contents
Abstract............................................................................................................................................................. i
Acknowledgments .......................................................................................................................................... ii
1.0 Introduction .......................................................................................................................................... 1
2.0 Components of the Pediatric Quality Indicators Module ................................................................ 2
3.0 Quick Reference .................................................................................................................................. 23.1 Processing Steps ............................................................................................................................ 23.2 Pediatric Quality Indicator Module Details ...................................................................................... 5
4.0 Background .......................................................................................................................................... 7
5.0 Data Elements and Coding Conventions .......................................................................................... 85.1 Input for the AHRQ Quality Indicators ............................................................................................ 85.2 Coding of Diagnoses, Procedures, DRGs and MDCs .................................................................... 95.3 Use of External Cause of Injury Codes......................................................................................... 105.4 Missing Values.............................................................................................................................. 145.5 Treatment of Missing Data............................................................................................................ 14
6.0 User Options ...................................................................................................................................... 15
7.0 Producing Pediatric Quality Indicator Rates: Processing Steps................................................. 167.1 Step 1. Identify outcomes in inpatient records............................................................................. 167.2 Step 2. Identify populations at risk............................................................................................... 167.3 Step 3. Calculate observed (raw) Pediatric Quality Indicator rates ............................................. 167.4 Step 4. Risk adjust the Pediatric Quality Indicator rates.............................................................. 177.5 Step 5. Create MSX smoothed rates ........................................................................................... 17
8.0 Program Descriptions ....................................................................................................................... 188.1 Program 1: Modify Statements in the CONTROL_PDI.SAS code .............................................. 188.2 Program 2: Run PDFMTS............................................................................................................ 198.3 Program 3: Run PDSAS1 ............................................................................................................ 198.4 Program 4: Run PDSASG2 ......................................................................................................... 20 8.5 Program 5: Run PDSASP2 .......................................................................................................... 228.6 Program 6: Run PDSASP3 .......................................................................................................... 268.7 Program 7: Run PDSASA2 .......................................................................................................... 288.8 Program 8: Run PDSASA3 .......................................................................................................... 30
9.0 Reviewing the Printed Output. ......................................................................................................... 329.1 PDSAS1 ........................................................................................................................................ 329.2 PDSASP2 ..................................................................................................................................... 329.3 PDSASP3 ..................................................................................................................................... 339.4 PDSASA2 ..................................................................................................................................... 359.5 PDSASA3 ..................................................................................................................................... 35
10.0 User Support and Information.......................................................................................................... 37
PDI SAS Software Documentation iii Version 3.0b (September 29, 2006)

AHRQ Quality Indicators Web Site: http://www.qualityindicators.ahrq.gov
List of Figures
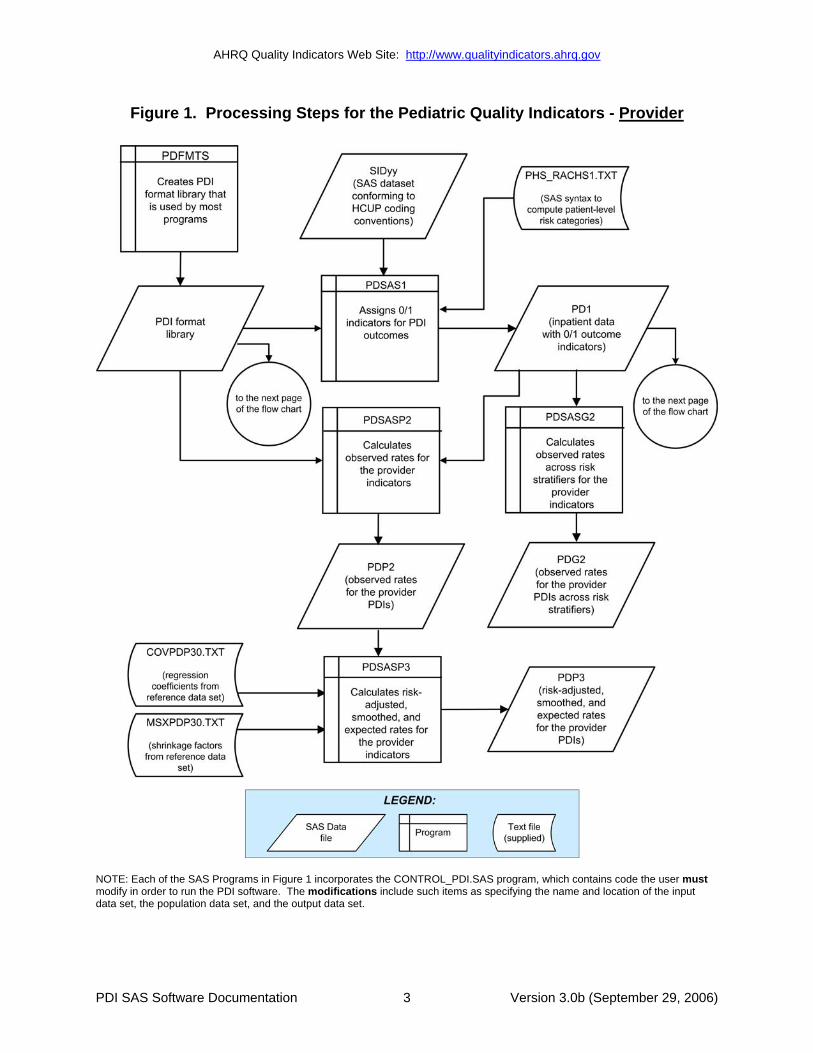
Figure 1. Processing Steps for the Pediatric Quality Indicators - Provider......................................... 3
Figure 2. Processing Steps for the Pediatric Quality Indicators - Area ............................................... 4
List of Tables
Table 1. Pediatric Quality Indicator (PDI) Variables ............................................................................... 5
Table 2. Prefixes for the Pediatric Quality Indicator (PDI) Variables .................................................... 6
Table 3. Pediatric Quality Module Contents ............................................................................................ 6
Table 4. Data Elements and Coding Conventions ................................................................................ 11
Table 5. Treatment of Missing Data Elements....................................................................................... 14
Table 6. PDSASP2 Aggregation Possibilities ....................................................................................... 23
Table 7. PDSASA2 Aggregation Possibilities ....................................................................................... 29
Table 8. Provider Level Printed Output.................................................................................................. 33
Table 9. Area Level Printed Output ........................................................................................................ 36
PDI SAS Software Documentation iv Version 3.0b (September 29, 2006)

AHRQ Quality Indicators Web Site: http://www.qualityindicators.ahrq.gov
AHRQ Quality Indicators, SAS Software Documentation, Version 3.0b: Pediatric Quality Indicators
1.0 Introduction This documentation describes the software for implementing the Pediatric Quality Indicator (PDI) module of the AHRQ Quality Indicators Version 3.0b and highlights features of the analytic approach of particular interest to new users. Detailed information about the PDIs is contained in the document Measures of Pediatric Health Care Quality based on Hospital Administrative Data, which includes information about the development of the indicators and their definitions. Detailed definitions, including all ICD-9-CM codes included in or excluded from the numerator and denominator for each indicator, are contained in a separate document Pediatric Quality Indicators Technical Specifications. Both documents are, available at http://www.qualityindicators.ahrq.gov/pdi_download.htm.
The software consists of a series of computer programs that perform the following functions:
• Assign and calculate PDIs from hospital discharge abstracts or UB (uniform billing) claims data.
• Print PDI results in SAS format or as an ASCII text file (comma delimited) that can be imported into word processing documents, spreadsheets, or graphics software, at the user's option.
This documentation includes:
• A discussion of the data elements necessary to produce the AHRQ PDIs and the uniform coding conventions recommended for those elements.
• Descriptions of the PDI processing steps in non-technical language.
• Detailed descriptions of the functions of each PDI SAS program.
Critical user information is highlighted with this symbol:
PDI SAS Software Documentation 1 Version 3.0b (September 29, 2006)

AHRQ Quality Indicators Web Site: http://www.qualityindicators.ahrq.gov
2.0 Components of the Pediatric Quality Indicators Module As shown in Table 3 on page 6, the Pediatric Quality Indicators module consists of eight SAS programs and six ASCII text files that contain auxiliary data. These programs and text files are described in the subsequent sections of this document. The programs were developed for use in Statistical Analysis System (SAS)1, version 6.12 or higher, on a Windows personal computer.
A note on the naming conventions for the PDI module programs. Most programs have names of the form PDSASi, PDSASAi, or PDSASPi. The first two characters “PD” of the program name indicate a Pediatric Quality Indicators program, to distinguish it from other modules that have been or will be released from AHRQ. The next three characters of the program name are “SAS” and are present to distinguish the program from SPSS versions of the software (the Pediatric Quality Indicator module is not available in SPSS). In the programs that are specific to either Area or Provider Indicators, the sixth character of the program name is either “A” or “P”. The sixth character is an “A” if it is for the production of Area indicator rates that use county or Office of Management and Budget (OMB) defined metropolitan or micropolitan area (Metro Area) populations as denominators. The sixth character is a “P” if it is a program that is for the production of Provider Indicator rates that use subsets of the hospital discharge population. The last character (i) of the variable name designates the number of the specific program. One additional SAS program, PDSASG2.SAS, is the stratification module.
3.0 Quick Reference The subsequent four pages are intended to serve as a quick reference to assist in reading this documentation and in reviewing the PDI module outputs. Processing steps are shown first (Figure 1 and Figure 2) followed by a listing of the module indicator variables (Table 1), variable prefixes (Table 2), and module contents (Table 3). One suggestion is to print these pages in duplex mode on two sheets of paper so that they can then be easily referred to as the need arises.
3.1 Processing Steps
Figure 1 shows processing steps for the Pediatric Quality Indicators - Provider, while Figure 2 shows steps for the Pediatric Quality Indicators - Area.
1 SAS is a statistical program distributed by the SAS Institute, Inc. (http://www.sas.com). The company may be contacted directly regarding the licensing of their products. The SAS Institute, Inc. does not have any affiliation with AHRQ nor involvement in the development of the AHRQ QIs.
PDI SAS Software Documentation 2 Version 3.0b (September 29, 2006)
AHRQ Quality Indicators Web Site: http://www.qualityindicators.ahrq.gov
Figure 1. Processing Steps for the Pediatric Quality Indicators - Provider
NOTE: Each of the SAS Programs in Figure 1 incorporates the CONTROL_PDI.SAS program, which contains code the user must modify in order to run the PDI software. The modifications include such items as specifying the name and location of the input data set, the population data set, and the output data set.
PDI SAS Software Documentation 3 Version 3.0b (September 29, 2006)

AHRQ Quality Indicators Web Site: http://www.qualityindicators.ahrq.gov
Figure 2. Processing Steps for the Pediatric Quality Indicators - Area
PDI SAS Software Documentation 4 Version 3.0b (September 29, 2006)

AHRQ Quality Indicators Web Site: http://www.qualityindicators.ahrq.gov
3.2 Pediatric Quality Indicator Module Details The following tables list the module indicator variables (Table 1), variable prefixes (Table 2), and module contents (Table 3).
Table 1. Pediatric Quality Indicator (PDI) Variables PDI Number Indicator
Pediatric Quality Provider Indicators 1 Accidental Puncture or Laceration 2 Decubitus Ulcer 3 Foreign Body Left During Procedure 4 Iatrogenic Pneumothorax in Neonates 5 Iatrogenic Pneumothorax 6 Pediatric Heart Surgery Mortality 7 Pediatric Heart Surgery Volume 8 Postoperative Hemorrhage or Hematoma 9 Postoperative Respiratory Failure 10 Postoperative Sepsis 11 Postoperative Wound Dehiscence 12 Selected Infections due to Medical Care 13 Transfusion Reaction
Pediatric Quality Area Indicators 14 Asthma Admission Rate 15 Diabetes Short-term Complications Admission Rate 16 Gastroenteritis Admission Rate 17 Perforated Appendix Admission Rate 18 Urinary Tract Infection Admission Rate
PDI SAS Software Documentation 5 Version 3.0b (September 29, 2006)

AHRQ Quality Indicators Web Site: http://www.qualityindicators.ahrq.gov
Table 2. Prefixes for the Pediatric Quality Indicator (PDI) Variables
Prefix Contents Examples Provider Indicator
# 8, Area Indicator Postoperative # 14, Hemorrhage or
Hematoma Asthma
T Inpatient numerator (top) TPPD08 TAPD14
P Population denominator (pop) PPPD08 PAPD14
O Observed rate OPPD08 OAPD14
E Expected rate EPPD08 EAPD26
R Risk-adjusted rate RPPD08 RAPD26
L Lower limit of confidence interval of risk-adjusted rate LPPD08 N/A
U Upper limit of confidence interval of risk-adjusted rate UPPD08 N/A
S Smoothed rate SPPD08 N/A
X Standard error of smoothed rate XPPD08 N/A
Table 3. Pediatric Quality Module Contents SAS programs (syntax files) ASCII text files (data) CONTROL_PDI.SAS POP95TO06.TXT PDFMTS.SAS COVPDA30.TXT PDSAS1.SAS COBPDP30.TXT PDSASA2.SAS MSXPDA30.TXT PDSASA3.SAS MSXPDP30.TXT PDSASG2.SAS PHS_RACHS1.TXT PDSASP2.SAS PDSASP2.SAS
† The ASCII text files are data files provided with the Pediatric Quality module and are necessary for the programs to run. There is no need to convert these files to SAS format for use with the software.
PDI SAS Software Documentation 6 Version 3.0b (September 29, 2006)

AHRQ Quality Indicators Web Site: http://www.qualityindicators.ahrq.gov
4.0 Background The PDI module contains 18 indicators that reflect the quality of care inside hospitals. These indicators serve as flags for potential quality problems rather than definitive measures of quality of care. The indicators include two groups of measures based on hospital stays.
1. There are 13 Provider-based Pediatric Quality Indicators for volume and in-hospital mortality for selected procedures and for medical conditions and surgical procedures that have been shown to have complication/adverse event rates that vary substantially across institutions and for which evidence suggests that high complication/adverse event rates may be associated with deficiencies in the quality of care. These indicators are measured as rates—outcome of interest / adverse events divided by the population at risk for the procedure or condition. The adverse event related Provider-based Indicators include only those cases where a secondary diagnosis code flags a potentially preventable complication.
Four of the adverse event related indicators are for surgical discharges and seven are for either medical or surgical discharges. Four of the Provider-based Pediatric Quality Indicators (PDIs 2, 8, 9, 11), incorporate information about when procedures were performed (relative to the admission date) if this information is available. Note, however, that if the day of procedure information is missing, the computed rates for these indicators will be slightly lower than if the information was available. Admission type is used by two of the PDIs, postoperative hemorrhage or hematoma and postoperative respiratory failure (PDI #8 and PDI #9), to identify elective surgeries.
2. There are five Area-based Pediatric Quality Indicators, where geographic areas can be defined at the user's option in one of four ways: • County level with U.S. Census FIPS2
• County level with modified FIPS • Metro Area with OMB 1999 definition • Metro Area with OMB 2003 definition.
The MALEVL parameter reflects the change in OMB definitions for areas. Refer to page 9 for information on these area definitions and MALEVL parameter settings.
The 18 indicators in the PDI module are listed in Table 1 on page 5. See also Pediatric Quality Indicators Technical Specifications (http://www.qualityindicators.ahrq.gov/pdi_download.htm) for the definition of each indicator.
The data required for measuring these indicators come from hospital discharge abstracts or billing claims (administrative data) which are readily available within hospitals or from many state data organizations. The residential population data for the five Area-based Indicators are from the U.S. Census Bureau.
For information about how these indicators were identified, see the Measures of Pediatric Health Care Quality based on Hospital Administrative Data available at http://www.qualityindicators.ahrq.gov/pdi_download.htm.
Federal Information Processing Standard, as defined by the U.S. Department of Commerce, National Institute of Standards and Technology (formerly National Bureau of Standards).
PDI SAS Software Documentation 7 Version 3.0b (September 29, 2006)
2

AHRQ Quality Indicators Web Site: http://www.qualityindicators.ahrq.gov
5.0 Data Elements and Coding Conventions
5.1 Input for the AHRQ Quality Indicators The PDI software was written to process data from discharge data abstracts that contain information about hospital stays. The specific data elements that are needed for the PDI software are listed in Table 4. The PDI module was tested on data from the AHRQ Healthcare Cost and Utilization Project (HCUP). HCUP is an ongoing Federal-State-private collaboration to build uniform databases from administrative hospital-based data collected by State data organizations and hospital associations. Additional information on HCUP is available at the website http://www.ahrq.gov/data/hcup.
The input data files for the Pediatric Quality Indicators software must be in SAS.
It is strongly recommend that users recode data elements in their input files to be consistent with the coding expected by the software. We do not recommend changing the Pediatric Quality Indicators software. For example, recoding the SEX data element in the input file to be consistent with the coding described in Table 4 (i.e., 1 for male and 2 for female) should be done rather than attempting to modifying all uses of the Sex data element in the PDI programs.
Not every value for every data element is referenced by the PDI software. For example, only two of the discharge disposition (DISP) data elements values are used in the software (DISP value “2” for short-term hospital and value “20” for died in the hospital). However, the complete set of standardized values is included, based on HCUP specifications, to assist users of the uniform HCUP data files.
Two of the indicators (PDI #8 and 9) use admission type (ATYPE) to identify elective surgeries. If admission type (ATYPE) is not available in the user’s data, the user may want to evaluate other data in the file to create a proxy to identify elective admission types.
To minimize internal changes to the software, all required elements should be present in the input data file. If a required element is not available, a dummy element should be provided. Failure to provide a dummy element will result in errors during the execution of the PDI programs.
The data elements listed in Table 4 are those required for the input files of all of the SAS QI modules. When a variable is not required for the PDI SAS program the notation “Not used by the QI program” will be present in the Comments column. Standardizing the variables and data values in the input data file will be helpful for users who have access to both statistical software packages as well as users working to standardize their input file specifications for use with any of the AHRQ QI software modules.
The name of the data element PSTCO emphasizes the importance of calculating the area PDIs by the location of the patient residence. If the user wants to calculate the area PDIs based on the population of the Metro Area or county associated with the patient residence, the values for this variable should be the FIPS state/county code associated with each individual patient’s place of residence. If the patient information is not available or the user wants to calculate the PDIs using the population associated with the hospital location as the denominator, the values for this variable should be the individual hospital FIPS state/county codes.
If the provider FIPS code is used in PSTCO, users should be aware that rates may be biased for hospitals which serve as regional referral centers. These hospitals are likely to treat patients from outside the Metro Area, county or even the state in which the facility is located.
Modified FIPS codes assignment for area denominators is an available option. In the modified FIPS codes certain independent cities (Baltimore City, Carson City and St. Louis City), and areas
PDI SAS Software Documentation 8 Version 3.0b (September 29, 2006)

AHRQ Quality Indicators Web Site: http://www.qualityindicators.ahrq.gov
within Hawaii and Virginia, are assigned to different area groupings in the Modified FIPS categories.
Using the patient FIPS state/county code for analysis may more accurately reflect the true population at risk. Using the provider FIPS state/county code for analysis should be done with caution, and at larger levels of geographic area (i.e. Metro Area) to minimize the bias with patients that come from a different county than the hospital location.
It is possible that some records in the input data file may be missing the patient FIPS code. Users should be aware that any records with missing values (in the PSTCO data field) are excluded from the calculations of observed, risk-adjusted and smoothed PDI area rates. They will be included in the output from the first program (PDSAS1.SAS).
The software will generate area PDI rates for each county included in the PSTCO data field. Users are encouraged to limit cases in their input file to those patients discharged from the geographic area of interest. For example, if you are using data from the state of Wisconsin and are interested in generating a rate for Wisconsin, you should remove the cases where the patient’s county of residence (FIPS code) is from another state. Otherwise the total or overall rate will include the population of the counties outside Wisconsin.
The software provides the user with the option of producing output by Metro Area or by county. When Metro Area is selected, urban areas are always defined by Metro Areas. When county is selected urban areas will be defined by county. Rural areas are always defined by county.
In the software programs, the MALEVL parameter should be set as follows: 0-County level with U.S. Census FIPS 1-County level with modified FIPS 2-Metro Area with OMB 1999 definition 3-Metro Area with OMB 2003 definition.
The metropolitan area definitions are from three different sources. 1) The “modified FIPS” definition is from the Area Resource File. The mapping is from county to modified FIPS county (e.g., Baltimore city to Baltimore county); 2) The “1999 OMB” definition is from the federal Office of Management and Budget (OMB) circular 99-04, (Last Revised May 6, 2002). The mapping is from county to Metropolitan Statistical Area (MSA), except in New England where counties are assigned to NECMAs (New England County Metropolitan Area). OMB defines NECMAs as a county-based alternative to the city- and town-based New England MSAs and CMSAs (Consolidated MSAs). For example, Hampden and Hampshire counties in Western Massachusetts are assigned to the Springfield MA NECMA, even though Holland town in Hampden County is part of the Boston MSA; and 3) the “2003 OMB” definition is from the federal Office of Management and Budget (OMB) circular 03-04, (Last Revised December 4, 2005). The mapping is from county to either Metropolitan Statistical Area or Micropolitan Statistical Area.
5.2 Coding of Diagnoses, Procedures, DRGs and MDCs
Diagnoses and procedures must be coded using the International Classification of Diseases, 9th Revision, Clinical Modification (ICD-9-CM)
Significant modifications to ICD-9-CM codes occurred in the early 1990s. PDI definitions only reflect codes valid after October 1, 1997, and therefore may not accurately analyze data collected before 1997.
• Diagnoses and procedure codes should be in character strings.
PDI SAS Software Documentation 9 Version 3.0b (September 29, 2006)
AHRQ Quality Indicators Web Site: http://www.qualityindicators.ahrq.gov
• Diagnosis and procedure codes should not contain any decimal points.
• Diagnosis and procedure codes should be left justified. Diagnosis codes with fewer than five digits should be padded with spaces (not zeros) on the right. Procedure codes with fewer than four digits should be padded with spaces (not zeros) on the right.
The PDI software programs assume accurate and specific coding of ICD codes. If an ICD code is specified using 5 digits, the software recognizes only 5-digit versions of that code and not truncated versions at 3 or 4 digits. Similarly, if an ICD code is specified using 4 digits, the software recognizes only 4-digit versions of that code and not truncated versions at 3 digits. For example, 4281 is the ICD-9-CM diagnosis code for left heart failure. If your data are coded less specifically (i.e., 428 is used to designate "heart failure"), these less specific codes are not recognized by the software and will result in undercounting cases.
• Diagnosis-Related Groups (DRGs) and Major Diagnostic Categories (MDCs) are those derived from the Centers for Medicare & Medicaid Services (previously Health Care Financing Administration) Medicare grouper. The software expects that you will be using the DRG and MDC effective on the discharge date. The software now refers to data elements DRG and MDC. Your data should be coded accordingly.
Version 3.0b of the software accounts for ICD-9-CM, DRG and MDC coding effective through FY 2006 (or through September 30, 2006).
5.3 Use of External Cause of Injury Codes
External cause of injury codes - E-codes – are used to classify environmental events, circumstances, and conditions as the cause of injury, poisoning, or other adverse events. The use of E-codes is not always required by a state uniform billing committee or a state data organization. Users should be knowledgeable of the E-code requirements and practices of hospitals represented in the input data file. Several of the indicators use E-codes in their numerator or denominator definitions. See the documents Measures of Pediatric Health Care Quality based on Hospital Administrative Data and Pediatric Quality Indicators Technical Specifications (http://www.qualityindicators.ahrq.gov/pdi_download.htm) for additional information.
PDI SAS Software Documentation 10 Version 3.0b (September 29, 2006)

AHRQ Quality Indicators Web Site: http://www.qualityindicators.ahrq.gov
Table 4. Data Elements and Coding Conventions Variable name Description Format Value description Comments
KEY Sequence Number. Unique case identifier. Numeric
User defined unique numeric identifier for each discharge record
Not used by the QI programs, but should be present to facilitate possible exploration; allows user to link the records from the PDSAS1.SAS program output file back to the original input data file.
AGE Age in Years at Admission Numeric Age in years If this data element is missing the discharge record will be excluded from the analysis.
AGEDAY Age in Days (coded only when the age in years is less than 1)
Numeric Age in days If this data element is missing alternative logic will sometimes apply..
RACE Race of Patient.
Numeric 1 2 3 4 5 6
White Black Hispanic Asian or Pacific Island Native American Other
The values 1through 5 are used directly in the QI software. All other ethnicity codes are mapped to an ‘other’ category.
SEX Sex of Patient Numeric
1 2
Male Female
If this data element is missing the discharge record will be excluded from the analysis.
PAY1 Expected Primary Payer
Numeric 1 2 3 4 5 6
Medicare Medicaid Private, incl. HMO Self-pay No charge Other
The values 1, 2, 3, and 4 are used directly in the QI software. All other payer codes are mapped to an ‘other’ category.
This data element is used to stratify only the Provider-level PDIs (01-13).
PSTCO
Location of Patient Residence or Hospital Location (FIPS State/County Code)
Numeric ssccc
Modified Federal Information Processing Standards State/county code3
If this data element is missing the discharge record will be excluded from rate calculations.
HOSPID Data Source Hospital Number Numeric Hospital identification
number
Used to facilitate data exploration and possible trouble shooting. May also be selected as a stratifier (see Table 6. PDSASP2 Aggregation Possibilities).
DISP Disposition of Patient
Numeric 1 2 3 4 5 6 7
20
Routine Short-term hospital Skilled nursing facility Intermediate care Another type of facility Home health care Against medical advice Died in the hospital
The values 2 and 20 are referenced by the QI code (to identify transfers to another short-term hospital and patients who died in the hospital).
Federal Information Processing Standard, as defined by the U.S. Department of Commerce, National Institute of Standards and Technology (formerly National Bureau of Standards). Note: Certain independent cities (Baltimore City, Carson City and St. Louis City), and areas within Hawaii and Virginia, are assigned to different area groupings in the Modified FIPS categories as compared to the U.S. Census Bureau groupings. The AHRQ QI software uses the Modified FIPS code assignment of these areas. Failure to use the Modified FIPS codes assignment will result in the use of incorrect denominator estimates for area indicators. A list is available at http://www.census.gov/popest/geographic/codes02.pdf
PDI SAS Software Documentation 11 Version 3.0b (September 29, 2006)
3

AHRQ Quality Indicators Web Site: http://www.qualityindicators.ahrq.gov
Variable name Description Format Value description Comments
ATYPE Admission Type
Numeric 1 2 3 4 5 6
Emergency Urgent Elective Newborn Trauma Center4
Other
The values 3 and 4 are referenced by the PDI code (to identify elective surgeries). PDIs 8 and 9 will be affected if ATYPE values are missing.
ASOURCE Admission Source
Numeric 1 2 3 4 5
ER Another hospital Another facility incl LTC Court/law enforcement Routine/birth/other
The values 2 and 3 are referenced by the PDI code (to identify transfers from another hospital or facility)
LOS Length of Stay Numeric Number of days from admission to discharge
APR_DRG APR_DRG Category Numeric APR-DRG from 3M software
Not used by the PDI program. If not present in the input data file it is not necessary to create a dummy variable.
SEVERTY APR_DRG Severity Score Numeric APR-DRG Severity Score from 3M software
Not used by the PDI program. If not present in the input data file it is not necessary to create a dummy variable.
RISKMORT APR_DRG Mortality Score Numeric APR-DRG Risk of Mortality Score from 3M software
Not used by the PDI program. If not present in the input data file it is not necessary to create a dummy variable.
DRG Diagnosis Related Group Numeric DRG from federal (CMS) Grouper
MDC Major Diagnostic Category Numeric MDC from federal (CMS) grouper
DX1 – DX30
ICD-9-CM Diagnosis Codes. DX1 is the principal diagnosis. DX2-DX30 are secondary diagnoses. Note: If e-codes are separated from secondary diagnoses in the input data file, the variable should be renamed and included as a secondary diagnosis variable (e.g., e-codes would be labeled as DX10 in a data file where the last secondary DX field is DX9).
String, 5 characters, left-justified (e.g. 020.2 -> 0202_ where _
indicates a space)
Diagnosis codes
Users must specify the number of diagnoses in the parameter &NDX in the CONTROL_PDI.SAS program to reflect the number of diagnoses.
NDX Count of the Number of Diagnoses (DX) on the Discharge Record.
Numeric Count of diagnoses (principal and all secondary diagnoses)
Not used by the SAS program. If not present in the input data file it is not necessary to create a dummy variable. Definition is: if the 1st discharge record has 5 Dx and the 2nd has 10, NDX would be 5 on the 1st and 10 on the 2nd .
The ATYPE value “5” was used to indicate delivery only in the 1988 to 1997 HCUP data files. The UB standards currently use “5” to indicate Trauma Center.
PDI SAS Software Documentation 12 Version 3.0b (September 29, 2006)
4

AHRQ Quality Indicators Web Site: http://www.qualityindicators.ahrq.gov
Variable name Description Format Value description Comments
PR1 – PR30
ICD-9-CM Procedure Codes. PR1 is the principal procedure, PR2-PR30 are secondary procedures.
String, 4 characters, left-justified
Procedure codes
Users with more or fewer secondary procedures should modify the parameter &NPR in CONTROL_PDI.SAS to reflect the number of procedures.
NPR Count of the Number of Procedures (PR) on the Discharge Record.
Numeric Count of procedures (principal and all secondary procedures)
Not used by the SAS program. If not present in the input data file it is not necessary to create a dummy variable. Definition is: if the 1st discharge record has 1 Pr and the 2nd has 2, NPR would be 1 for the 1st record and 2 for the 2nd . Necessary variables if the user sets the &PRDAY parameter in CONTROL_PDI.SAS to equal one. In this case, it is expected that the number of PRDAY
PRDAY1 – PRDAY30
Days from Admission to Procedure. PR1 is the principal procedure, PR2PR30 are secondary procedures.
Numeric Days from admission to procedure5
variables agrees with the number of Procedure codes present. (See note below for method of calculation).
These variables are not needed if the user sets the &PRDAY parameter in CONTROL_PDI.SAS to equal zero, indicating that there is no procedure day information available.
YEAR
Year of discharge. The patient’s year of discharge. For example, a patient discharged on July 7, 2004 would have a discharge year of ‘2004.’
Numeric
YYYY
Discharge year should be within the range of 1997 to 2006.
Quarter of discharge. The
DQTR
calendar quarter of the patient’s discharge. For example, a patient discharged on July 7, 2004 would have a discharge quarter of ‘3.’
Numeric
1 January-March 2 April-June 3 July-September 4 October-December
* See http://hcup-us.ahrq.gov/toolssoftware/comorbidity/comorbidity.jsp.
The data elements in the AHRQ QI are based on the coding specifications used in the State Inpatient Data (SID) in the Healthcare Cost and Utilization Project. The SID coding specifications are similar to the Uniform Bill (UB-92) but not identical. For data elements used in the AHRQ QI, crosswalks between the SID and UB-92 coding specifications are included in the SID documentation available at http://hcup-us.ahrq.gov/db/state/siddbdocumentation.jsp.
5 Variables PRDAY1 to PRDAY30 are defined as the number of days from date of admission to date of procedure for each procedure. For example, if the patient was admitted on June 15th and had two procedures - the principal procedure on June 15th
and a second procedure on June 18th – then the value of PRDAY1 would be zero (0) and the value of PRDAY2 would be three (3). For more information, consult the HCUP data documentation at http://www.hcup-us.ahrq.gov/db/vars/prdayn/nisnote.jsp.
PDI SAS Software Documentation 13 Version 3.0b (September 29, 2006)
AHRQ Quality Indicators Web Site: http://www.qualityindicators.ahrq.gov
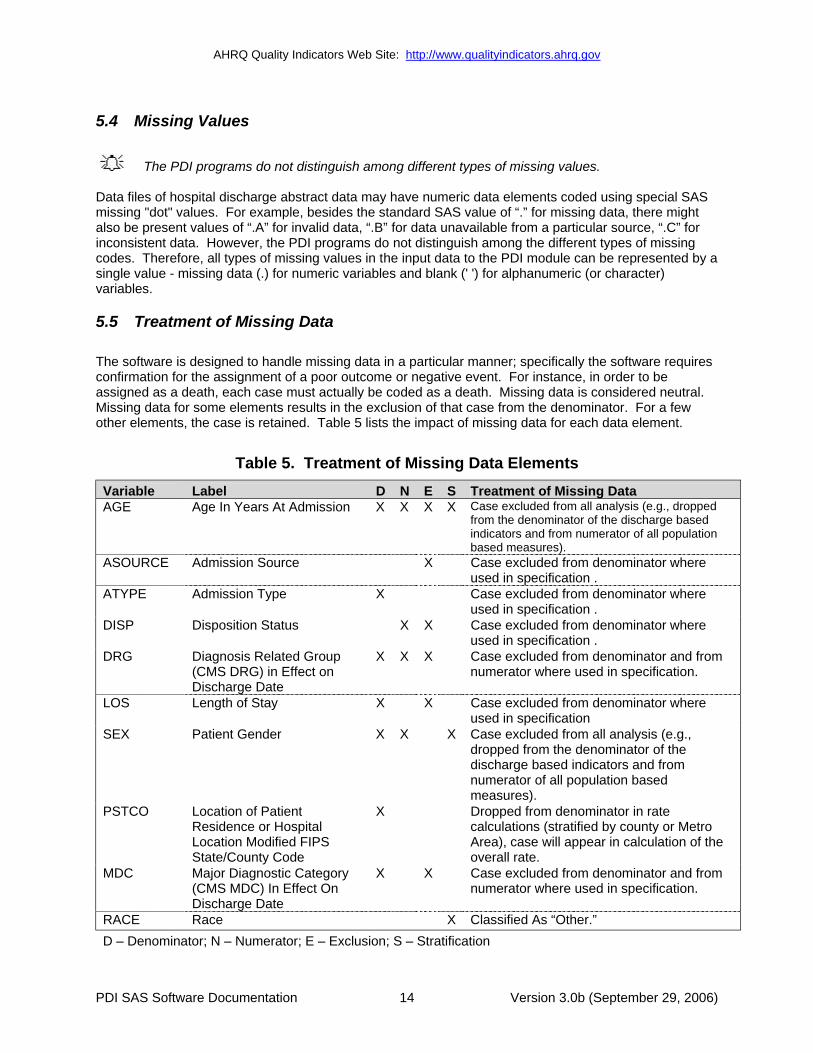
5.4 Missing Values
The PDI programs do not distinguish among different types of missing values.
Data files of hospital discharge abstract data may have numeric data elements coded using special SAS missing "dot" values. For example, besides the standard SAS value of “.” for missing data, there might also be present values of “.A” for invalid data, “.B” for data unavailable from a particular source, “.C” for inconsistent data. However, the PDI programs do not distinguish among the different types of missing codes. Therefore, all types of missing values in the input data to the PDI module can be represented by a single value - missing data (.) for numeric variables and blank (' ') for alphanumeric (or character) variables.
5.5 Treatment of Missing Data
The software is designed to handle missing data in a particular manner; specifically the software requires confirmation for the assignment of a poor outcome or negative event. For instance, in order to be assigned as a death, each case must actually be coded as a death. Missing data is considered neutral. Missing data for some elements results in the exclusion of that case from the denominator. For a few other elements, the case is retained. Table 5 lists the impact of missing data for each data element.
Table 5. Treatment of Missing Data Elements Variable Label D N E S AGE ion X X X X l l i
ASOURCE X
ATYPE X l
DISP X X
DRG X X X
LOS X X
SEX Patient Gender X X X luded from all analysi
measures). PSTCO Location of Patient
Location Modified FIPS
X
overall rate. MDC X X
RACE X i
Treatment of Missing Data Age In Years At Admiss Case exc uded from all ana ys s (e.g., dropped
from the denominator of the discharge based indicators and from numerator of all population based measures).
Admission Source Case excluded from denominator where used in specification .
Admission Type Case exc uded from denominator where used in specification .
Disposition Status Case excluded from denominator where used in specification .
Diagnosis Related Group (CMS DRG) in Effect on Discharge Date
Case excluded from denominator and from numerator where used in specification.
Length of Stay Case excluded from denominator where used in specification Case exc s (e.g., dropped from the denominator of the discharge based indicators and from numerator of all population based
Residence or Hospital
State/County Code
Dropped from denominator in rate calculations (stratified by county or Metro Area), case will appear in calculation of the
Major Diagnostic Category (CMS MDC) In Effect On Discharge Date
Case excluded from denominator and from numerator where used in specification.
Race Class fied As “Other.” D – Denominator; N – Numerator; E – Exclusion; S – Stratification
PDI SAS Software Documentation 14 Version 3.0b (September 29, 2006)

AHRQ Quality Indicators Web Site: http://www.qualityindicators.ahrq.gov
6.0 User Options The PDI software reflects the development and implementation of the software with discharge data available to AHRQ through the HCUP program. Our goal was to develop the tools, illustrate their use, and then encourage others to adopt and use the tools for their own applications. As a result, users are encouraged to consider how AHRQ may modify the PDI software to better serve their measurement needs and interests.
Modifications to the definitions of outcomes of interest (numerators) or populations at risk (denominators) are possible but not desirable. Maintaining consistent definitions is important. Once definitions are altered, the ability to make comparisons of PDIs based on original definitions is lost. Users are encouraged to identify ways to improve the PDI methodology and to share their suggestions with AHRQ for future updates.
AHRQ provides public access to HCUPnet - an interactive tool for identifying, tracking, analyzing, and comparing statistics on hospital care. HCUPnet queries generate statistics in a table format using data from the Nationwide Inpatient Sample (NIS) and State Inpatient Databases (SID) for those States that have agreed to participate. HCUPnet includes statistics based on the AHRQ Quality Indicators (QIs) which have been applied to the HCUP NIS. If users change definitions of the PDIs, it will not be possible to compare users’ results to the national estimates in HCUPnet. HCUPnet may be accessed through the HCUP web site at http://hcup.ahrq.gov/HCUPnet.asp.
PDI SAS Software Documentation 15 Version 3.0b (September 29, 2006)
AHRQ Quality Indicators Web Site: http://www.qualityindicators.ahrq.gov
7.0 Producing Pediatric Quality Indicator Rates: Processing Steps Each Pediatric Quality Indicator (PDI) expressed as a rate, is simply defined as:
Outcome of interest / Population at risk
[or]
Numerator / Denominator
Conceptually, three steps are necessary to produce the PDI rates. The following describes the steps and how the software performs them.
7.1 Step 1. Identify outcomes in inpatient records Inpatient records are marked to indicate whether they contain the outcome of interest (numerator or “top”) for each of the AHRQ PDI measures.
This is done by setting a series of flag variables, each of which corresponds to the numerator for a particular PDI. For example, if the inpatient record meets the conditions for inclusion in the outcome for PDI #1, then the outcome indicator for PDI #1 is set to 1.
This step requires one pass through the discharge-level data and outputs a discharge-level data file containing the flag indicator variables for the outcomes for each PDI. This output file also contains the original input variables, with the exception of the diagnosis and procedure variables which have been removed to reduce the size of the output file.
7.2 Step 2. Identify populations at risk For the Provider PDIs, the populations at risk (the denominators for calculating the PDI rates, or “pop”) are derived from the hospital discharge records.
For the Area PDIs, the populations at risk (the denominators for calculating the PDI rates) are derived from Census population figures.
7.3 Step 3. Calculate observed (raw) Pediatric Quality Indicator rates Using the output data from step 1 and either hospital discharge or Census population data from step 2, the PDI rates are calculated for user-specified combinations of stratifiers. These observed rates are stratified by risk group categories that are specific to each indicator for Provider PDIs, and areas (Metro areas/counties), age groups, race/ethnicity categories, and sex for the Area PDIs.
The programs calculate observed PDI rates regardless of the number of cases available. However, PDI rates based on only a few cases should be interpreted with caution.
In some performance measurement work, it is often recommended that rates be suppressed when there are fewer than 30 cases in the denominator. This exclusion rule serves two purposes:
• It eliminates unstable estimates based on too few cases.
• It helps protect the identities of hospitals and patients.
PDI SAS Software Documentation 16 Version 3.0b (September 29, 2006)

AHRQ Quality Indicators Web Site: http://www.qualityindicators.ahrq.gov
This step outputs the observed rates for user-specified categories, alone or in combination. For example, Provider PDI observed rates could be output at the hospital level, at the payer level, or at the hospital level by payer.
7.4 Step 4. Risk adjust the Pediatric Quality Indicator rates
Regression coefficients from a reference population database (reflecting a large proportion of the U.S. population) are applied to the observed rates in the risk-adjustment process. These reference population file regression coefficients are provided as part of the PDI module. The risk-adjusted rates will then reflect the age and sex distribution (and the APR-DRG distribution for the provider indicators) of data in the reference population file rather than the distribution for the hospitals or areas present in the users’ data. This will allow risk-adjusted rates produced by various users to be compared directly to one another. The regression coefficients were derived from HCUP’s Year 2003 State Inpatient Data (SID) for 38 states. The code to generate these reference population means and coefficients are not part of the PDI module.
The programs calculate risk-adjusted PDI rates regardless of the number of cases available. However, PDI rates based on only a few cases should be interpreted with caution.
7.5 Step 5. Create MSX smoothed rates
Shrinkage factors are applied to the risk-adjusted rates for each PDI in a process called multivariate signal extraction (MSX). These shrinkage factors were calculated from the HCUP Year 2003 SID of 38 states. For each PDI, the shrinkage estimate reflects a ‘reliability adjustment’ unique to each indicator. The less reliable the PDI over time and across hospitals or areas, the more the estimate ‘shrinks’ the PDI toward the overall area mean. The resulting rate will appear “smoother” than the raw rate, meaning the year-to-year fluctuations in performance are likely to be reduced. The shrinkage factors are provided as part of the PDI software and do not need to be calculated by users.
These five steps reflect the PDI module production in a nutshell. The next section of this document describes the specifics of each software component of the PDI module software.
PDI SAS Software Documentation 17 Version 3.0b (September 29, 2006)

AHRQ Quality Indicators Web Site: http://www.qualityindicators.ahrq.gov
8.0 Program Descriptions This section describes the eight SAS programs that assign, calculate, and print the Pediatric Quality Indicators.
For each program there is a description, a list of input and output files, and an explanation of changes to the program that may be required. The flow of data through the PDI module programs is shown in the flowcharts in Figure 1 and Figure 2 that begin on page 3.
If you desire to create and examine observed PDI rates, then the PDFMTS, CONTROL, and the PDSAS1 programs will need to be used, followed by PDSASP2 (for Provider observed rates) and/or PDSASA2 (for Area observed rates across stratifiers). The Pediatric module offers two alternatives for analyzing provider level rates, stratification and risk adjustment. If you wish to create stratified Provider PDIs, you will need to run PDSASG2. If you wish to create risk-adjusted and smoothed PDI rates, then you will also need to run the PDSASP3 and/or the PDSASA3.
8.1 Program 1: Modify Statements in the CONTROL_PDI.SAS code
The CONTROL_PDI.SAS code contains all of the SAS statements that you need to modify in order to run the remaining PDI module programs (with one exception noted below). This is where you specify, for example, the path names or locations of all your input and output data sets. There is also a TITLE line that the user can fill in. The items that need to be changed in order to run the PDSAS1, PDSASP2, PDSAP3, PDSASG2, PDSASA2. and PDSASA3 programs are described below under each program.
The CONTROL_PDI.SAS code is automatically inserted into the remaining programs when they are executed. You do not need to run CONTROL_PDI.SAS as a separate program.
All of the changes needed for the CONTROL_PDI.SAS code are listed in the following descriptions for programs 2 – 8. Each program description contains a section labeled “Changes:” that enumerates the modifications for CONTROL_PDI.SAS that are associated with that particular program.
Lines of code to be modified are identified by the phrase “<===USER MUST modify” which means the user must make the change or by “<===USER MAY modify” which means the modification is optional.
In all of the remaining programs included with the PDI module, there is one line of code near the beginning of each program that needs to be modified. This line of code starts with the phrase "FILENAME CONTROL". You must modify this line to point to the path name where you stored your modified copy of the CONTROL_PDI.SAS file.
The PHS_RACHS1.TXT text file includes the SAS syntax for implementing the Risk Adjustment for Congenital Heart Surgery, Version 1 (RACHS1) methodology. The SAS syntax is included in a separate text file only for ease of maintenance and updating. It is required syntax and the user must designate the appropriate directory containing this text file in CONTROL_PDI.SAS
CONTROL_PDI.SAS has a collection of parameters that allow you to read in data from and write out data to different locations or pathnames. For example, “LIBNAME1 IN1” points to the location of your input data set for program PDSAS1 and “LIBNAME OUT1” points to the location of the output data set created by the PDSAS1 program. The parameters allow these locations to be different from one another. However, if you wish to read in and write out all of the data to the same location, it is easiest to just make a global change in CONTROL_PDI.SAS changing “C:\pathname” to the single directory location that you wish to use.
PDI SAS Software Documentation 18 Version 3.0b (September 29, 2006)

AHRQ Quality Indicators Web Site: http://www.qualityindicators.ahrq.gov
There is a global PRINT parameter in CONTROL_PDI.SAS that allows you to print all of the output summary records at the end of the PDSASP2, PDSASP3, PDSASG2, PDSASA2, and PDSASA3 programs. These printouts may be quite large if you have a large database with a large number of hospitals and if you choose the results to be finely stratified. If you wish to turn these prints on, set PRINT to have a value of 1 in CONTROL_PDI.SAS.
The global MALEVL parameter in CONTROL.PDI.SAS by default instructs all programs to define geographic areas by county for all areas in the input datasets. Refer to Page 9 for a list of values for the MALEVL parameter.
8.2 Program 2: Run PDFMTS
The PDFMTS program defines a format library, which contains the diagnosis and procedure screens necessary for assigning the outcomes of interest. This format library is used by most of the succeeding programs.
The first few formats in this program are for the stratifiers (age, sex, race/ethnicity, payer). These are followed by formats that are used for the identification of outcomes of interest in the PDSAS1.SAS program, and by formats that map FIPS county codes to Metro Areas in the PDSAS1, PDSASA2, and PDSASA3 programs. .
The PDI module Version 3.0b contains formats that incorporate ICD-9-CM and DRG coding through September 30, 2006.
Input: None.
Output: Permanent SAS format library (FMTLIB).
Changes: 1. You must modify the “FILENAME CONTROL” statement at the beginning of the program to
change the path so that it points to your location of the CONTROL_PDI.SAS code.
2. In CONTROL_PDI.SAS, specify the location (path) of the format library in the “LIBNAME LIBRARY” statement.
8.3 Program 3: Run PDSAS1
The PDSAS1 program processes hospital discharge abstract data and flags inpatient records if they contain outcomes of interest. Outcome indicator names have prefix of “T” (Top). Stratifier variables are constructed at the beginning of the program.
This program assumes that the input data file (consisting of inpatient discharge abstract data) conforms to specific variable names, attributes, and coding conventions. See Table 4 on page 11 for variable names and attributes for the input data file.
Partial definitions of the Pediatric Quality Indicators are given in Table 1 on page 5. This table is presented to assist those individuals who desire to examine the software source code statements. Complete definitions of the indicators are given in the document Pediatric Quality Indicators Technical Specifications (http://www.qualityindicators.ahrq.gov/pdi_download.htm).
Input:
PDI SAS Software Documentation 19 Version 3.0b (September 29, 2006)

AHRQ Quality Indicators Web Site: http://www.qualityindicators.ahrq.gov
1. User supplied SAS inpatient data set consisting of administrative hospital discharge abstract data. This data set is a discharge level file with an array of diagnosis and procedure codes, among other data elements.
2. SAS format library (FMTLIB) created from the PDFMT program.
Output: 1. SAS dataset containing inpatient records with input variables, stratifiers, comorbidity
variables, and flag indicators (TPPDxx and TAPDxx) for the outcomes of interest that will later form the numerators for the PDI rates.
2. PROC MEANS (with N, NMISS, MIN, MAX, MEAN, and SUM) of all of the numeric variables in the output data file and a PROC CONTENTS of the output data file are output to hardcopy.
3. A PROC PRINT of the first 24 observations in the output data file is output to hardcopy.
Changes: 1. The “FILENAME CONTROL” statement at the beginning of the program must be changed to
reflect the location of the CONTROL_PDI.SAS code.
2. In CONTROL_PDI.SAS, specify the locations (paths) of the input and output files in the “LIBNAME IN1” and “LIBNAME OUT1” statements.
3. In CONTROL_PDI.SAS, specify the names of the input and output files in the “INFILE1” and “OUTFILE1” statements.
The PDI module assumes that your starting SAS data set contains 30 diagnoses and 30 procedures. If these numbers are different in your input inpatient data, then modify the NDX and NPR parameters in CONTROL_PDI.SAS.
If your variables are named differently from those used in the PDI software (see Table 4 on page 11), you MUST either rename those variables prior to running this program or modify PDSAS1 to include the renaming of your variables to match those expected by the software. Similarly, if your variables are not the same type, i.e., character or numeric, as those expected by the software (see Table 4), you MUST modify your variables prior to running this program.
8.4 Program 4: Run PDSASG2
The PDSASG2 program calculates the observed or raw rates for the Provider-level Pediatric Quality Indicators, using the data derived in a previous step (PDSAS1). These observed rates are stratified by risk group categories that are specific to each indicator. The program first sums the indicator flags created by the PDSAS1 program (numerator) and then divides this sum by the count of the hospital discharges (denominator) for each of the risk group stratifiers. The stratifiers are stored in variables with names that have a prefix of “G” (Group). The numerators are stored in variables with names that have a prefix of “T” (Top). The population denominators are stored in variables with names that have a prefix of “P” (Pop). The Observed rates are stored in variables that have a prefix of “O”.
Input: 1. The SAS dataset that was created in the PDSAS1. This is a discharge-level file that contains
inpatient records with input variables, stratifiers, and the 13 new flag indicators for the PDI Hospital outcomes of interest. Only 6 of these indicators have risk group stratifiers and are included as input into the G2 module (#1, #2, #8, #10, #11 and #12).
2. SAS format library (FMTLIB) created from the PDFMT program.
PDI SAS Software Documentation 20 Version 3.0b (September 29, 2006)
AHRQ Quality Indicators Web Site: http://www.qualityindicators.ahrq.gov
Output: 1. SAS dataset with summary records that contain observed rates (OPPDxx variables where xx
refers to the indicator number), the counts of outcomes that formed the numerators of the rates (TPPDxx variables), and the hospital discharge totals that formed the denominators of the observed rates (PPPDxx variables). The output file has records summarized to the indicator-specific pre-defined risk group stratifiers.
2. An optional ASCII (comma delimited) text file that the user can then import into a spreadsheet. This text file contains the same information as the SAS output dataset. The text file will contain the OPPDxx observed rates, the TPPDxx counts of outcomes that formed the numerators of the rates, and the PPPDxx counts of outcomes that formed the denominators of the rates. The different records/rows in the text file will correspond to the indicator-specific pre-defined risk group stratifiers
3. A PROC MEANS (with N, NMISS, MIN, MAX, MEAN, and SUM) of the hospital-level summary records that shows statistics for the OPPDxx observed rates, the TPPDxx counts of outcomes that formed the numerators of the rates, and the PPPDxx counts of outcomes that formed the denominators of the rates. These means are generated by the indicator-specific pre-defined risk group stratifiers.
4. A PROC CONTENTS of the output SAS summary dataset is output to hardcopy.
5. A PROC PRINT of the output summary dataset is provided at the end of the hardcopy printout. If the user does not wish to generate this printout, then the global “PRINT” parameter in CONTROL_PDI.SAS code should be set to zero.
Changes: 1. The “FILENAME CONTROL” statement at the beginning of the program must be changed to
reflect the location of the CONTROL_PDI.SAS code.
2. In CONTROL_PDI.SAS, specify the locations (paths) of the input and output SAS files in the “LIBNAME ING2” and “LIBNAME OUTG2” statements.
3. In CONTROL_PDI.SAS, specify the names of the input and output files in the “INFILEG2” and “OUTFILG2” statements. The name that you specify with INFILEG2 should be for the file that you created using the PDSAS1 program.
4. In CONTROL_PDI.SAS, if you wish to create an ASCII (comma delimited) text file that you can import into a spreadsheet, then set the TEXTG2 parameter to 1. Otherwise, the default value of zero for TEXTG2 will skip around the code that would generate this file.
5. In CONTROL_PDI.SAS, if you wish to create an ASCII (comma delimited) text file that you can import into a spreadsheet, then specify the path (including the file name) for this ASCII text file in the "FILENAME PDTEXTG2” statement.
PDI SAS Software Documentation 21 Version 3.0b (September 29, 2006)

AHRQ Quality Indicators Web Site: http://www.qualityindicators.ahrq.gov
8.5 Program 5: Run PDSASP2
The PDSASP2 program calculates the observed or raw rates for the Provider-level Pediatric Quality Indicators, using the data derived in a previous step (PDSAS1). These observed rates are stratified by combinations of hospitals, sex, age, race, and payer categories. The program first totals the indicator flags created by the PDSAS1 program and then for each of the desired stratifiers divides these totals by the hospital discharges in the universe for the indicator. The population denominators are stored in variables with names that have a prefix of “P” (Pop). The Observed rates are stored in variables that have a prefix of “O”.
Input: 1. The SAS dataset that was created in the PDSAS1. This is a discharge-level file that contains
inpatient records with input variables, stratifiers, and the 13 new flag indicators for the PDI Hospital outcomes of interest.
2. SAS format library (FMTLIB) created from the PDFMT program.
Output: 1. SAS dataset with summary records that contain observed rates (OPPDxx variables where xx
refers to the indicator number), the counts of outcomes that formed the numerators of the rates (TPPDxx variables), and the hospital discharge totals that formed the denominators of the observed rates (PPPDxx variables). The output file has records summarized to the various combinations of stratifiers specified in the TYPELVLP parameter that is described in item 4 in “Changes” below.
2. An optional ASCII (comma delimited) text file that the user can then import into a spreadsheet. This text file contains the same information as the SAS output dataset. The text file will contain the OPPDxx observed rates, the TPPDxx counts of outcomes that formed the numerators of the rates, and the PPPDxx counts of outcomes that formed the denominators of the rates. The different records/rows in the text file will correspond to the different TYPELVLP stratification combinations
3. A PROC MEANS (with N, NMISS, MIN, MAX, MEAN, and SUM) of the hospital-level summary records that shows statistics for the OPPDxx observed rates, the TPPDxx counts of outcomes that formed the numerators of the rates, and the PPPDxx counts of outcomes that formed the denominators of the rates. These means will only be generated if the user included a value of 64 for the TYPELVLP parameter discussed in item 4 in the “Changes” section below.
4. A PROC CONTENTS of the output SAS summary dataset is output to hardcopy.
5. A PROC PRINT of the output summary dataset is provided at the end of the hardcopy printout. This printout may be quite large depending on the number and the types of stratifications that the user requests with the TYPELVLP parameter discussed in item 4 in the “Changes” section below. If the user does not wish to generate this printout, then the global “PRINT” parameter in CONTROL_PDI.SAS code should be set to zero.
Changes: 1. The “FILENAME CONTROL” statement at the beginning of the program must be changed to
reflect the location of the CONTROL_PDI.SAS code.
2. In CONTROL_PDI.SAS, specify the locations (paths) of the input and output SAS files in the “LIBNAME INP2” and “LIBNAME OUTP2” statements.
PDI SAS Software Documentation 22 Version 3.0b (September 29, 2006)

AHRQ Quality Indicators Web Site: http://www.qualityindicators.ahrq.gov
PDI SAS Software Documentation 23 Version 3.0b (September 29, 2006)
3. In CONTROL_PDI.SAS, specify the names of the input and output files in the “INFILEP2” and “OUTFILP2” statements. The name that you specify with INFILEP2 should be for the file that you created using the PDSAS1 program.
4. In CONTROL_PDI.SAS, specify the levels of aggregation for the observed rates. This is
done by specifying numbers between 0 and 31 in the “%LET TYPELVLP =” statement. Each number from 0 to 31 corresponds to a different level or combination of levels as show in Table 6. The default values of 0 and 64 will provide an overall total and provider-level totals.
If TYPELVLP includes the value 0, then the first observation in the output summary
datafile will contain the overall totals and observed rates for the entire database created with the PDSAS1 program.
Table 6. PDSASP2 Aggregation Possibilities TYPELVLP Stratification
0 overall 1 race 2 payer 3 payer * race 4 sex 5 sex * race 6 sex * payer 7 sex * payer * race 8 age 9 age * race 10 age * payer 11 age * payer * race 12 age * sex 13 age * sex * race 14 age * sex * payer 15 age * sex * payer * race 16 ageday 17 ageday * race 18 ageday * payer 19 ageday * payer * race 20 ageday * sex 21 ageday * sex * race 22 ageday * sex * payer 23 ageday * sex * payer * race 24 ageday * age 25 ageday * age * race 26 ageday * age * payer 27 ageday * age * payer * race 28 ageday * age * sex 29 ageday * age * sex * race 30 ageday * age * sex * payer 31 ageday * age * sex * payer * race 32 bwht 33 bwht * race

AHRQ Quality Indicators Web Site: http://www.qualityindicators.ahrq.gov
PDI SAS Software Documentation 24 Version 3.0b (September 29, 2006)
TYPELVLP Stratification 34 bwht * payer 35 bwht * payer * race 36 bwht * sex 37 bwht * sex * race 38 bwht * sex * payer 39 bwht * sex * payer * race 40 bwht * age 41 bwht * age * race 42 bwht * age * payer 43 bwht * age * payer * race 44 bwht * age * sex 45 bwht * age * sex * race 46 bwht * age * sex * payer 47 bwht * age * sex * payer * race 48 bwht * ageday 49 bwht * ageday * race 50 bwht * ageday * payer 51 bwht * ageday * payer * race 52 bwht * ageday * sex 53 bwht * ageday * sex * race 54 bwht * ageday * sex * payer 55 bwht * ageday * sex * payer * race 56 bwht * ageday * age 57 bwht * ageday * age * race 58 bwht * ageday * age * payer 59 bwht * ageday * age * payer * race 60 bwht * ageday * age * sex 61 bwht * ageday * age * sex * race 62 bwht * ageday * age * sex * payer 63 bwht * ageday * age * sex * payer * race 64 provider 65 provider * race 66 provider * payer 67 provider * payer * race 68 provider * sex 69 provider * sex * race 70 provider * sex * payer 71 provider * sex * payer * race 72 provider * age 73 provider * age * race 74 provider * age * payer 75 provider * age * payer * race 76 provider * age * sex 77 provider * age * sex * race 78 provider * age * sex * payer 79 provider * age * sex * payer * race 80 provider * ageday

AHRQ Quality Indicators Web Site: http://www.qualityindicators.ahrq.gov
PDI SAS Software Documentation 25 Version 3.0b (September 29, 2006)
TYPELVLP Stratification 81 provider * ageday * race 82 provider * ageday * payer 83 provider * ageday * payer * race 84 provider * ageday * sex 85 provider * ageday * sex * race 86 provider * ageday * sex * payer 87 provider * ageday * sex * payer * race 88 provider * ageday * age 89 provider * ageday * age * race 90 provider * ageday * age * payer 91 provider * ageday * age * payer * race 92 provider * ageday * age * sex 93 provider * ageday * age * sex * race 94 provider * ageday * age * sex * payer 95 provider * ageday * age * sex * payer * race 96 provider * bwht 97 provider * bwht * race 98 provider * bwht * payer 99 provider * bwht * payer * race
100 provider * bwht * sex 101 provider * bwht * sex * race 102 provider * bwht * sex * payer 103 provider * bwht * sex * payer * race 104 provider * bwht * age 105 provider * bwht * age * race 106 provider * bwht * age * payer 107 provider * bwht * age * payer * race 108 provider * bwht * age * sex 109 provider * bwht * age * sex * race 110 provider * bwht * age * sex * payer 111 provider * bwht * age * sex * payer * race 112 provider * bwht * ageday 113 provider * bwht * ageday * race 114 provider * bwht * ageday * payer 115 provider * bwht * ageday * payer * race 116 provider * bwht * ageday * sex 117 provider * bwht * ageday * sex * race 118 provider * bwht * ageday * sex * payer 119 provider * bwht * ageday * sex * payer * race 120 provider * bwht * ageday * age 121 provider * bwht * ageday * age * race 122 provider * bwht * ageday * age * payer 123 provider * bwht * ageday * age * payer * race 124 provider * bwht * ageday * age * sex 125 provider * bwht * ageday * age * sex * race 126 provider * bwht * ageday * age * sex * payer 127 provider * bwht * ageday * age * sex * payer * race

AHRQ Quality Indicators Web Site: http://www.qualityindicators.ahrq.gov
0 and 64 TYPELVLP (overall and provider) are default values for the level of computation in the software.
For example, if you are using a state inpatient hospital database, you might specify the following TYPELVLP values:
0 – provides overall rates for your entire state 8 – provides overall rates for your state, broken down by age groups 64 – provides rates for providers within your state 72 – provides rates for age groups within these providers
5. In CONTROL_PDI.SAS, if you wish to create an ASCII (comma delimited) text file that you can import into a spreadsheet, then set the TEXTP2 parameter to 1. Otherwise, the default value of zero for TEXTP2 will skip around the code that would generate this file.
6. In CONTROL_PDI.SAS, if you wish to create an ASCII (comma delimited) text file that you can import into a spreadsheet, then specify the path (including the file name) for this ASCII text file in the "FILENAME PDTEXTP2” statement.
8.6 Program 6: Run PDSASP3
The PDSASP3 program calculates risk-adjusted rates by patient age, sex and APR-DRG, if available, for each PDI and then calculates smoothed and expected rates.
The programs calculate risk-adjusted PDI rates regardless of the number of cases available. However, PDI rates based on only a few cases should be interpreted with caution.
The output file has records summarized to the various combinations of stratifiers that were specified in the TYPELVLP parameter of the preceding PDSASP2 program. See Table 6 on page 23.
Input: 1. SAS format library (FMTLIB) created from the PDFMT program.
2. The discharge-level file that was created with the PDSAS1 program.
3. The SAS dataset with summary records that was created with the PDSASP2 program.
4. A text file (COVPDP30.TXT) containing regression coefficients from a regression that was run on a reference SID dataset. These coefficients will be used in the risk adjustment process. This file is provided to you as part of the PDI module. The text file does not need to be converted to a SAS file for use with the software.
5. A text file (MSXPDP30.TXT) containing three arrays for use in the smoothing process. The arrays contain noise estimates, signal estimates, and mean area rates for each PDI. This file is provided to you as part of the PDI module. The text file does not need to be converted to a SAS file for use with the software.
Output: 1. A SAS dataset with an overall summary record and with provider-level summary records that
contain the three types of indicator rates, along with the components of the initial raw rates. Specifically, the file contains the observed rates (OPPDxx variables), the risk-adjusted rates (RPPDxx variables), the smoothed rates (SPDQxx variables), the expected rates (EPPDxx variables), the counts of outcomes that formed the numerators of the observed rates (TPPDxx variables), and the hospital discharge totals that formed the denominators of the observed rates (PPPDxx variables).
PDI SAS Software Documentation 26 Version 3.0b (September 29, 2006)
AHRQ Quality Indicators Web Site: http://www.qualityindicators.ahrq.gov
2. An optional ASCII (comma delimited) text file that the user can then import into a spreadsheet. This text file contains the same information as the SAS output dataset. The text file will contain the OPPDxx observed rates and their TPPDxx and PPPDxx numerator and denominator components, the RPPDxx risk-adjusted rates, the SPPDxx smoothed rates, and the EPPDxx expected rates. Each record or row in the text file will correspond to a specification group.
3. A PROC MEANS (with N, NMISS, MIN, MAX, MEAN, and SUM) of the provider-level summary records that shows statistics for the observed, risk-adjusted and smoothed rates, and statistics for the counts of outcomes that formed the numerators and denominators of the observed rates. These means will only be generated if the user included a value of 16 for the TYPELVLP parameter of the preceding PDSASP2 program. See Table 6 on page 23.
4. A PROC CONTENTS of the output SAS summary dataset is output to hardcopy.
5. A PROC PRINT of the output summary dataset is provided at the end of the hardcopy printout. This printout may be quite large depending on the number and the types of stratifications that the user requested with the TYPELVLP parameter of the preceding PDSASP2 program. See Table 6 on page 23. If the user does not wish to generate this printout, then the global “PRINT” parameter in CONTROL_PDI.SAS code should be set to zero.
Changes: 1. The “FILENAME CONTROL” statement at the beginning of the program must be changed to
reflect the location of the CONTROL_PDI.SAS code.
2. In CONTROL_PDI.SAS, specify the locations (paths) of the input and output SAS files in the “LIBNAME INP3” and “LIBNAME OUTP3” statements.
3. In CONTROL_PDI.SAS, specify in the “INFILP3X” statement the name of the discharge-level file that you created with the PDSAS1 program.
4. In CONTROL_PDI.SAS, specify in the "FILENAME COVARP" statement the path (including the file name) for the ASCII text file that contains regression coefficients from a regression that was run on the reference SID dataset. This file is provided as part of the PDI module. The name of the file is COVPDP30.TXT.
5. In CONTROL_PDI.SAS, specify in the "FILENAME MSXP" statement the path (including the file name) for the ASCII text file that contains the estimates to smooth the indicator rates. This file is provided as part of the PDI module. The name of the file is MSXPDP30.TXT.
6. In CONTROL_PDI.SAS, specify in the “INFILP3Y” statement the name of the summary file that you created with the PDSASA2 program.
7. In CONTROL_PDI.SAS, specify in the “OUTFILP3” statement the name that you wish the output file to have.
8. In CONTROL_PDI.SAS, if you wish to create an ASCII (comma delimited) text file that you can import into a spreadsheet, then set the TEXTP3 parameter to 1. Otherwise, the default value of zero for TEXTA3 will skip around the code that would generate this file.
9. In CONTROL_PDI.SAS, if you wish to create an ASCII (comma delimited) text file that you can import into a spreadsheet, then specify the path (including the file name) for this ASCII text file in the "FILENAME PDTEXTP3” statement.
PDI SAS Software Documentation 27 Version 3.0b (September 29, 2006)

AHRQ Quality Indicators Web Site: http://www.qualityindicators.ahrq.gov
8.7 Program 7: Run PDSASA2
The PDSASA2 program calculates the observed or raw rates for the area-level Pediatric Quality Indicators, using the data derived in a previous step (PDSAS1). These observed rates are stratified by combinations of area, sex, age, and race categories. The program first totals the seven Area indicator flags created by the PDSAS1 program, and then for each of the desired stratifiers divides these totals by the pertinent residential population. The population denominators are stored in variables with names that have a prefix of “P” (Pop). The Observed rates are stored in variables that have a prefix of “O”.
Input: 1. The SAS dataset that was created in the PDSAS1. This is a discharge-level file that contains
inpatient records with input variables, stratifiers, and the six new flag indicators for the PDI Area outcomes of interest.
2. A text file with Census area residential populations stratified by area, age, sex, and ethnicity categories. The file POP95TO06.TXT is currently provided along with the PDI module software. The user should set POPYEAR to the year that best matches the user’s discharge data file.
Users do not need to convert the ASCII text file to a SAS dataset for use with the software.
3. SAS format library (FMTLIB) created from the PDFMT program.
Output: 1. SAS dataset with summary records that contain observed rates (OAPDxx variables where xx
refers to the indicator number), the counts of outcomes that formed the numerators of the rates (TAPDxx variables), and the residential population totals that formed the denominators of the observed rates (PAPDxx variables). The output file has records summarized to the various combinations of stratifiers specified in the TYPELVLA parameter that is described in item 5 in “Changes” below.
2. An optional ASCII (comma delimited) text file that the user can then import into a spreadsheet. This text file contains the same information as the SAS output dataset. The text file will contain the OAPDxx observed rates, the TAPDxx counts of outcomes that formed the numerators of the rates, and the PAPDxx residential population totals. The different records/rows in the text file will correspond to the different TYPELVLA stratification combinations.
3. A PROC MEANS (with N, NMISS, MIN, MAX, MEAN, and SUM) of the area-level summary records that shows statistics for the OAPDxx observed rates, the TAPDxx counts of outcomes that formed the numerators of the rates, and the PAPDxx residential populations totals. These means will only be generated if the user included a value of 8 for the TYPELVLA parameter discussed in item 5 in the “Changes” section below.
4. A PROC CONTENTS of the output SAS summary dataset is output to hardcopy.
5. A PROC PRINT of the output summary dataset is provided at the end of the hardcopy printout. This printout may be quite large depending on the number and the types of stratifications that the user requests with the TYPELVLA parameter discussed in item 5 in the “Changes” section below. If the user does not wish to generate this printout, then the global “PRINT” parameter in CONTROL_PDI.SAS code should be set to zero.
PDI SAS Software Documentation 28 Version 3.0b (September 29, 2006)

AHRQ Quality Indicators Web Site: http://www.qualityindicators.ahrq.gov
PDI SAS Software Documentation 29 Version 3.0b (September 29, 2006)
Changes: 1. The “FILENAME CONTROL” statement at the beginning of the program must be changed to
reflect the location of the CONTROL_PDI.SAS code. 2. In CONTROL_PDI.SAS, specify the locations (paths) of the input and output SAS files in the
“LIBNAME INA2” and “LIBNAME OUTA2” statements.
3. In CONTROL_PDI.SAS, specify the names of the input and output files in the “INFILEA2” and “OUTFILA2” statements. The name that you specify with INFILEA2 should be for the file that you created using the PDSAS1 program.
4. In CONTROL_PDI.SAS, specify the path (including the file name) for the ASCII population
text file in the "FILENAME POPFILA2" statement. The file POP95TO06.TXT is currently provided along with the PDI module software. The user should set POPYEAR to the year that best matches the user’s discharge data file.
5. In CONTROL_PDI.SAS, specify the levels of aggregation for the observed rates. This is
done by specifying numbers between 0 and 15 in the “%LET TYPELVLA =” statement. Each number from 0 to 15 corresponds to a different level or combination of levels as show inTable 7. The default values of 0 and 8 will provide an overall total and area-level totals.
If TYPELVLA includes the value 0, then the first observation in the output summary
datafile will contain the overall totals and observed rates for the entire database created with the PDSAS1 program.
Table 7. PDSASA2 Aggregation Possibilities TYPELVLA Stratification
0 Overall 1 Race 2 Sex 3 Sex ∗ Race 4 Age 5 Age ∗ Race 6 Age ∗ Sex 7 Age ∗ Sex ∗ Race 8 Area 9 Area ∗ Race 10 Area ∗ Sex 11 Area ∗ Sex ∗ Race 12 Area ∗ Age 13 Area ∗ Age ∗ Race 14 Area ∗ Age ∗ Sex 15 Area ∗ Age ∗ Sex ∗ Race
0 and 8 TYPELVLA (overall and area) are default values for the level of computation in the software. For example, if you are using a state inpatient hospital database, you might specify the following TYPELVLA values:
0 – provides overall rates for your entire state 4 – provides overall rates for your state, broken down by age groups 8 – provides rates for areas within your state 12 – provides rates for age groups within these areas

AHRQ Quality Indicators Web Site: http://www.qualityindicators.ahrq.gov
6. In CONTROL_PDI.SAS, if you wish to create an ASCII (comma delimited) text file that you can import into a spreadsheet, then set the TEXTA2 parameter to 1. Otherwise, the default value of zero for TEXTA2 will skip around the code that would generate this file.
7. In CONTROL_PDI.SAS, if you wish to create an ASCII (comma delimited) text file that you can import into a spreadsheet, then specify the path (including the file name) for this ASCII text file in the "FILENAME PDTEXTA2” statement.
8.8 Program 8: Run PDSASA3
The PDSASA3 program calculates age and sex risk-adjusted rates for each area-based PDI (overall rates and rates by area), and then calculates smoothed rates.
Input: 1. SAS format library (FMTLIB) created from the PDFMT program.
2. The discharge-level file that was created with the PDSAS1 program.
3. The SAS dataset with summary records that was created with the PDSASA2 program.
4. A text file with Census area residential populations, stratified by area, sex, and discrete age categories. One file is currently provided along with the PDI module software. The file is POP95TO06. The user should set POPYEAR to the year that best matches the user’s discharge data file. The text file does not need to be converted to a SAS file for use with the software.
5. A text file (COVPDA30.TXT) containing regression coefficients from a regression that was run on the reference SID dataset. These coefficients will be used in the risk adjustment process. This file is provided to you as part of the PDI module. The text file does not need to be converted to a SAS file for use with the software.
6. A text file (MSXPDA30.TXT) containing three arrays for use in the smoothing process. The arrays contain noise estimates, signal estimates, and mean area rates for each PDI. This file is provided to you as part of the PDI module. The text file does not need to be converted to a SAS file for use with the software.
Output: 1. A SAS dataset with an overall summary record and with area-level summary records that
contain the three types of indicator rates, along with the components of the initial raw rates. Specifically, the file contains the observed rates (OAPDxx variables), the risk-adjusted rates (RAPDxx variables), the smoothed rates (SAPDxx variables), the counts of outcomes that formed the numerators of the observed rates (TAPDxx variables), and the residential population totals that formed the denominators of the observed rates (PAPDxx variables).
2. An optional ASCII (comma delimited) text file that the user can then import into a spreadsheet. This text file contains the same information as the SAS output dataset. The text file will contain the OAPDxx observed rates and their TAPDxx and PAPDxx components, the RAPDxx risk-adjusted rates, and the SAPDxx smoothed rates. Each record or row in the text file will correspond to a different area.
3. Output to hardcopy are PROC MEANS (with N, NMISS, MIN, MAX, MEAN, and SUM) of risk-adjusted and smoothed rates in two intermediate work files and of all of the numeric variables in the final output data file. The printout also contains a PROC CONTENTS of the output
PDI SAS Software Documentation 30 Version 3.0b (September 29, 2006)

AHRQ Quality Indicators Web Site: http://www.qualityindicators.ahrq.gov
SAS dataset. A PROC PRINT of the output dataset is provided only if the “PRINT” parameter in CONTROL_PDI.SAS code is set to one.
6. A PROC MEANS (with N, NMISS, MIN, MAX, MEAN, and SUM) of the area-level summary records that shows statistics for the OAPDxx observed rates and their TAPDxx and PAPDxx components, the RAPDxx risk-adjusted rates, and the SAPDxx smoothed rates.
7. A PROC CONTENTS of the output SAS summary dataset is output to hardcopy.
8. A PROC PRINT of the output summary dataset is provided at the end of the hardcopy printout. If the user does not wish to generate this printout, then the global “PRINT” parameter in CONTROL_PDI.SAS code should be set to zero.
Changes: 1. The “FILENAME CONTROL” statement at the beginning of the program must be changed to
reflect the location of the CONTROL_PDI.SAS code.
2. In CONTROL_PDI.SAS, specify the locations (paths) of the input and output SAS files in the “LIBNAME INA3” and “LIBNAME OUTA3” statements.
3. In CONTROL_PDI.SAS, specify in the “INFILA3X” statement the name of the discharge-level file that you created with the PDSAS1 program.
4. In CONTROL_PDI.SAS, specify the path (including the file name) for the ASCII population text file in the "FILENAME POPFILE3" statement. The file name will is POP95TO96.. These files are provided along with the software. The file used should be the one that is closest to the year associated with your particular data. These files contain Census residential estimates by area, gender, and discrete age categories.
5. In CONTROL_PDI.SAS, specify in the "FILENAME COVARA" statement the path (including the file name) for the ASCII text file that contains regression coefficients from a regression that was run on reference SID dataset. The name of the file is COVPDA30.TXT.
6. In CONTROL_PDI.SAS, specify in the "FILENAME MSXA" statement the path (including the file name) for the ASCII text file that contains the estimates to smooth the indicator rates. The name of the file is MSXPDA30.TXT.
7. In CONTROL_PDI.SAS, specify in the “INFILA3Y” statement the name of the summary file that you created with the PDSASA2 program.
8. In CONTROL_PDI.SAS, specify in the “OUTFILA3” statement the name that you wish the output file to have.
9. In CONTROL_PDI.SAS, if you wish to create an ASCII (comma delimited) text file that you can import into a spreadsheet, then set the TEXTA3 parameter to 1. Otherwise, the default value of zero for TEXTA3 will skip around the code that would generate this file.
10. In CONTROL_PDI.SAS, if you wish to create an ASCII (comma delimited) text file that you can import into a spreadsheet, then specify the path (including the file name) for this ASCII text file in the "FILENAME PDTEXTA3” statement.
PDI SAS Software Documentation 31 Version 3.0b (September 29, 2006)

AHRQ Quality Indicators Web Site: http://www.qualityindicators.ahrq.gov
9.0 Reviewing the Printed Output. This section contains tips for reviewing some of the printed output from the PDI module. These tips are oriented toward explaining the interrelationships between printout items from different programs and hopefully will help to reveal the nature and structure of the module outputs. .
The final output of the PDI module is a PROC PRINT from PDSASP2 (for Provider-level Indicators) and PDSASA2 (for Area-level Indicators). All interim printouts are for checking and trouble-shooting. .
9.1 PDSAS1
The initial printout from the PDSAS1 program contains PROC MEANS output for all of the numeric variables (including the comorbidity indicators) in the output discharge-level dataset. It will contain information for the newly constructed TAPDxx and TPPDxx flag variables that will later form the numerators for the indicator rates. For each TAPDxx and TPPDxx flag variable:
• The SUM will contain the total number of observations in the dataset that were found to have the particular outcome of interest.
• For the five Area Indicators (TAPD21-TAPD27), the MEAN, MINIMUM and MAXIMUM will usually be one since the flag variables have either been set to missing (‘.’) or to a value of one. The Provider Indicators (TPPD01-TPPD20,) will have a value of one, zero, or missing (‘.’). For these indicators, a value of zero was assigned to the TPPDxx flag if a particular observation was part of the population at risk for a particular indicator but did not have the particular outcome of interest. For example, TPPD20 = 1 indicates a patient who had an obstetric trauma from a Cesarean section, while TPPD20 = 0 identifies a patient who had a C-section but no trauma complication.
• For the Provider Indicators, the MEANs will contain a close approximation of the eventual overall observed indicator rates. The values will change slightly after PDSASP2 has applied additional parts of the indicator definitions.
• N lists the number of observations in the dataset with non-missing values. For the seven Area Indicators, N for TAPDxx will be the same as the SUM. For the Provider Indicators, N will contain the denominator for the observed indicator rate.
The PDSAS1 printout also contains a PROC CONTENTS that lists all of the variables in the output dataset, including the character variables that are present, and a PROC PRINT of the first 24 observations in the output dataset.
9.2 PDSASP2
The purpose of this printout is to provide the observed rates for all Provider-level Indicators. The default printout shows results by provider, but other levels of output (as shown in Table 6) can be specified as well. Note that risk-adjusted and smoothed rates are shown in the output from the next program.
The printout from the PDSASP2 program contains PROC MEANS on the provider-level summary records for all of the numeric variables in the output summary dataset. It will contain information for the newly constructed OPPDxx rates, the PPPDxx denominators, and the TPPDxx numerators.
PDI SAS Software Documentation 32 Version 3.0b (September 29, 2006)

AHRQ Quality Indicators Web Site: http://www.qualityindicators.ahrq.gov
• The _TYPE_ variable described in the MEANS table identifies the stratification level for the records in the output data set. The _TYPE_ variable corresponds to the TYPELVLP parameter values that were specified (see item 5 in “Changes” under the PDSASP2 program on page 29). In this case, _TYPE_ always assumes the value of 64, since only the provider-level records are selected.
• The N statistic for _TYPE_ contains the number of records in the output summary data set. A TPPDxx numerator variable with a value for N that is lower than the N value for _TYPE_ indicates that there were no outcomes of interest for some of the providers. Similarly, a PPPDxx denominator variable with a lower value for N than _TYPE_ indicates that for some providers, there were no hospital discharges with the outcome of interest.
• The MINIMUM value for the TPPD01-TPPD13 numerators will be zero since values of zero were assigned for observations that were part of the population for the rate denominator but did not have the particular outcome of interest to be included in the rate numerator.
For the observed rates, the User should NOT report the MEANS displayed here, but instead should refer to the overall means in the output dataset that are also present in the subsequent PROC PRINT. The MEANS given here are means of hospital means; i.e., all hospitals are given equal weight, regardless of the number of discharges in the different hospitals.
• The SUMs for the counter variables TPPDxx and PPPDxx will contain overall file totals for these data elements. The SUMs for the observed rates have no intuitive meaning.
If the “PRINT” parameter in the CONTROL_PDI.SAS program is set to 1, the subsequent PROC PRINT output contains a complete dump of the output summary file. Listed for each record are the stratification values, the PPPDxx population denominators for the 13 indicators, the TPPDxx outcome numerators for the 13 indicators and the 13 OPPDxx observed rates.
9.3 PDSASP3
The PROC PRINT at the end of this program provides your final output. (This printout appears if the "PRINT" parameter in the CONTROL_PDI.SAS program is set to one.)
The following table lists the column headers shown on the printed output and describes each. Each indicator is reported in a separate section. Values of "xx" correspond to the two-digit PDI number.
Table 8. Provider Level Printed Output Column Heading Description Obs Observation 1 (with HOSPID = ".") is the overall average for the entire dataset
(TYPELVLP = 0). The remaining observations are individual providers, or hospitals (TYPELVLP = 16).
HOSPID Identifier for each provider in the dataset. AGECAT Age stratification category - See Table 6 for TYPELVLP settings. SEXCAT Gender stratification category - See Table 6 for TYPELVLP settings. PAYCAT Payer stratification category - See Table 6 for TYPELVLP settings. RACECAT Race stratification category - See Table 6 for TYPELVLP settings. TPPDxx Number of cases in the numerator. PPPDxx Number of cases in the denominator (population at risk). OPPDxx Observed (raw) rate - Numerator divided by Denominator. EPPDxx Expected rate - Rates the provider would have if it performed the same as the
reference population given the provider’s actual case-mix (e.g., age, gender, modified DRG and comorbidities)
PDI SAS Software Documentation 33 Version 3.0b (September 29, 2006)

AHRQ Quality Indicators Web Site: http://www.qualityindicators.ahrq.gov
Column Heading Description RPPDxx Risk-adjusted rate - Accounts for the difference between the case-mix of the
reference population and the provider’s case-mix. LPPDxx Lower limit of confidence interval of risk-adjusted rate. UPPDxx Upper limit of confidence interval of risk-adjusted rate. SPPDxx Smoothed rate - Rates with removal of fluxuation over time. XPPDxx Standard error of smoothed rate.
Observation 1 (with HOSPID = .) is the overall average for the entire dataset (TYPELVL = 0). The remaining observations are individual providers, or hospitals (TYPELVL = 16). Data will appear under the column headers, AGECAT, SEXCAT, PAYCAT, and RACECAT, if you specify these levels of aggregation (shown in Table 6).
You may wish to express the results in more understandable terms:
Multiply the rates by 100 to express them as a percentage (e.g., 0.0338 * 100 = 3.4% mortality for pediatric heart surgery).
The MEANS table is generated from the permanent provider-based output file and is provided for troubleshooting and understanding your data, but not for reporting. The means are provided just for the provider level summary records.
The N for all but the TPPDxx counter variables should contain the number of providers in the user's database.
The MEANS, MINIMUMs, and MAXIMUMs have their normal meaning and provide comparisons among the different hospitals or providers in your database.
For the (observed, risk-adjusted, or smoothed) rates, the User should NOT report the MEANS displayed here, but instead refer to the overall means in the output dataset in the PROC PRINT labeled "FINAL OUTPUT." The MEANS given here are means of hospital means; i.e., all hospitals are given equal weight, regardless of the number of discharges in the different hospitals.
If the “PRINT” parameter in the CONTROL_PDI.SAS program is set to one, at the end of the printout is a PROC PRINT on the final provider-based output file. Listed for each level of stratification are the stratifiers, the numerator and denominator totals for the observed rates, and the observed, risk-adjusted, and smoothed rates.
PDI SAS Software Documentation 34 Version 3.0b (September 29, 2006)

AHRQ Quality Indicators Web Site: http://www.qualityindicators.ahrq.gov
9.4 PDSASA2
The purpose of this printout is to provide the observed rates for all Area-level Indicators. The default printout shows overall results and results by area, but other levels of output (as shown in Table 7) can be specified as well.
• The printout from the PDSASA2 program contains PROC MEANS for all of the numeric variables in the output summary dataset. It will contain information for the newly constructed OAPDxx rates, the PAPDxx denominators, and the TAPDxx numerators.
• The _TYPE_ variable described in the first row of the MEANS table identifies the stratification level for the records in the output data set. The _TYPE_ variable corresponds to the TYPELVLA parameter values that were specified (see item 5 in “Changes” under the PDSASA2 program on page 29). In this case, _TYPE_ always assumes the value of 8 since only the area-level records are selected.
• The N statistic for _TYPE_ contains the number of areas in the output summary data set. A TAPDxx numerator variable with a lower value for N than _TYPE_ indicates that there were no outcomes of interest for some of the areas
• The MINIMUM value for the TAPDxx numerators will be one or higher.
For the observed rates, the user should NOT report the MEANS displayed here, but instead should refer to the overall means in the output dataset that are also present in the subsequent PROC PRINT. The MEANS given here are means of the area means; i.e., all areas are given equal weight, regardless of the population in the different areas.
• The SUMs for the counter variables TAPDxx and PAPDxx will contain overall file totals for these data elements. The SUMs for the observed rates have no intuitive meaning.
If the “PRINT” parameter in the CONTROL_PDI.SAS program is set to 1, the subsequent PROC PRINT output contains a complete dump of the output summary file. Listed for each record are the stratification values, the PAPDxx population denominators for the seven indicators, the TAPDxx outcome numerators for the seven indicators, and the seven OAPDxx observed rates.
9.5 PDSASA3
The PROC PRINT at the end of this program provides your final output. (This printout appears if the "PRINT" parameter in the CONTROL_PDI.SAS program is set to one.)
PDI SAS Software Documentation 35 Version 3.0b (September 29, 2006)

AHRQ Quality Indicators Web Site: http://www.qualityindicators.ahrq.gov
The following table lists the column headers shown on the printed output and describes each. Each indicator is reported in a separate section. Values of "xx" correspond to the two-digit PDI number.
Table 9. Area Level Printed Output Column Heading Description Obs Observation 1 is the overall average for the entire dataset (TYPELVLA = 0).
The remaining observations are individual areas (TYPELVLA = 8). Area Identifier in the dataset for area. TAPDxx Number of cases in the numerator. PAPDxx Number of cases in the denominator (population at risk). OAPDxx Observed (raw) rate - Numerator divided by Denominator. RPPDxx Risk-adjusted rate - Accounts for the difference between the case-mix of the
reference population and the area's case-mix. SPPDxx Smoothed rate - Rates with removal of fluxuation over time.
Observation 1 (with AREA = blank) is the overall average for the entire dataset (TYPELVL = 0). The remaining observations are individual areas (TYPELVL = 8).
You may wish to express the results in more understandable terms: Multiply the utilization rates by 100,000 to express them as a rate per 100,000 population (e.g., 0.000494 * 100,000 = 49.4 pediatric heart surgeries per 100,000 population).
The MEANS table is generated from the permanent area-based output file. The means are provided just for the area-level summary records.
The N for all but the TAPDxx counter variables should contain the number of different areas (Metro Areas and counties) in your database.
The MEANs, MINIMUMs, and MAXIMUMs have their normal meaning and provide comparisons among the different areas in your database. Note that the MAXIMUMs for the counter variables (the TAPDxx and PAPDxx variables) are associated with specific areas, and therefore these MAXIMUMs may not match those in the prior PDSAS2 printouts since that run typically will include a record for the entire database.
For the (observed, risk-adjusted, or smoothed) rates, the User should NOT report the MEANS displayed here, but instead refer to the overall means in the output dataset that are also present in the subsequent PROC PRINT. The MEANS given here are means of area means; i.e., all areas are given equal weight, regardless of the number of discharges in the different areas.
The SUMs of the counter variables (the TAPDxx and PAPDxx variables) yield the overall database totals.
PDI SAS Software Documentation 36 Version 3.0b (September 29, 2006)

AHRQ Quality Indicators Web Site: http://www.qualityindicators.ahrq.gov
10.0 User Support and Information Technical assistance is available, through an electronic user support system monitored by the QI support team, to support users in their application of the PDI software. The same e-mail address may be used to communicate to AHRQ any suggestions for PDI enhancements, general questions, and any QI related comments you have. AHRQ welcomes your feedback.
The Internet address for user support and feedback is: [email protected]
AHRQ also offer a listserv to keep you informed on the Quality Indicators (QIs). The listserv is used to announce any QI changes or updates, new tools and resources, and to distribute other QI related information. This is a free service. Simply follow the process described below to begin receiving important QI information. All you need is a computer, Internet access, and an E-mail address. It works just like other electronic distribution lists. Here’s how to register:
1. Send an E-mail message to: [email protected]. 2. On the subject line, type: Subscribe. For example:
Subscribe
3. In the body of the message type: sub Quality_Indicators-L and your full name. For example:
sub Quality_Indicators-L John Doe
4. You will receive a message confirming that you are signed up. If you have any questions, contact AHRQ QI Support at the e-mail noted above. You should receive an automatic response e-mail message confirming receipt of your e-mail. If you do not receive a confirmation message, call (888) 512-6090.
PDI SAS Software Documentation 37 Version 3.0b (September 29, 2006)