Pedestrian Safety Engineering and Intelligent ...
91
August 25, 2008 MiamiDade Pedestrian Safety Project: Phase II FINAL IMPLEMENTATION REPORT AND EXECUTIVE SUMMARY Pedestrian Safety Engineering and Intelligent Transportation System‐Based Countermeasures Program for Reduced Pedestrian Fatalities, Injuries, Conflicts and Other Surrogate Measures: Miami‐Dade Site Prepared for U.S. Department of Transportation Federal Highway Administration Cooperative Agreement DTFH6101X00018 Prepared by Department of Civil and Coastal Engineering University of Florida Gainesville, FL 326116588 Tel: (352) 3929537 In Cooperation With Florida Department of Transportation Department of Urban and Regional Planning, University of Florida MiamiDade County Public Works Department MiamiDade Metropolitan Planning Organization
Transcript of Pedestrian Safety Engineering and Intelligent ...

August 25, 2008
MiamiDade Pedestrian Safety Project: Phase II FINAL IMPLEMENTATION REPORT AND EXECUTIVE SUMMARY
Pedestrian Safety Engineering and Intelligent Transportation System‐Based Countermeasures Program for Reduced Pedestrian Fatalities,
Injuries, Conflicts and Other Surrogate Measures: Miami‐Dade Site
Prepared for
U.S. Department of Transportation Federal Highway Administration
Cooperative Agreement DTFH6101X00018
Prepared by
Department of Civil and Coastal Engineering University of Florida
Gainesville, FL 326116588 Tel: (352) 3929537
In Cooperation With
Florida Department of Transportation
Department of Urban and Regional Planning, University of Florida MiamiDade County Public Works Department MiamiDade Metropolitan Planning Organization
Miami‐Dade Pedestrian Safety Project Final Report and Executive Summary
ii
ACKNOWLEDGEMENTS
This project was funded by a Federal Highway Administration (FHWA) grant under Cooperative Agreement DTFH61‐01‐X‐00018, which is gratefully acknowledged. Additional funding was provided by the Florida DOT and the Miami‐Dade County Department of Public Works.
`
FHWA Project Guidance was provided by: Tamara Redmon, Office of Safety Dr. Gabriel Rousseau, Office of Safety Jocelyn Bauer and Kelley Pecheux, SAIC Leverson Boodlal, KLS Engineering The project was managed by the University of Florida, Department of Civil and Costal Engineering, and the Miami‐Dade County Department of Public Works, with the following project oversight and management staff:
University of Florida Department of Civil and Coastal Engineering (UF) Dr. Ralph Ellis, Overall Principal Investigator Dr. Ron Van Houten, Technical Principal Investigator MiamiDade Department of Public Works Mohamed Hussan, Chief of Traffic Eng Division David Henderson, Pedestrian Bicycle Coordinator Vishnu Rajkumar, Signal Design Administrator Bob Williams, Traffic Signal Engineer Private Consultants Charles V. Zegeer, P.E. Richard Blomberg, Dunlap and Associates Student Assistants: Jose Sanda, Graduate Student Jin Lee Kim, Graduate Student
Acknowledgement is also made of the contributions of Ed Rice, FHWA, formerly of the FDOT Safety Office, and Rory Santana, FDOT District 6 Office, who were responsible for many of the countermeasures in phase two

Miami‐Dade Pedestrian Safety Project Final Report and Executive Summary
iii
TABLE OF CONTENTS
Chapter 1 EXECUTIVE SUMMARY AND INTRODUCTION ........................................1
1.1 PURPOSE, GOALS, AND SCOPE ............................................................................1 1.2 MIAMI‐DADE SETTING .........................................................................................2
1.2.1 Crash Demographics in Miami‐Dade County ............................................2 1.3 PROJECT OVERVIEW AND SCHEDULE ................................................................5 1.4 COUNTERMEASURE OVERVIEW .........................................................................5
1.4.1 Comparison of Countermeasures: Cost ....................................................7 1.4.2 Comparison of Countermeasures Availability and Standard Use: ..........7 1.4.3 Comparison of Countermeasures: Installation Complexity ....................7
1.6 DEVICES NOT INSTALLED ...................................................................................9 1.6.1 ITS Midblock Signals with Animated Eyes ................................................9 1.6.2 ITS Midblock Pedestrian Signal with Animated Eyes ..............................9
1.8 SUMMARY OF EXPERIMENTAL RESULTS FOR PEDESTRIAN SAFETY COUNTERMEASURES ............................................................................................10
1.10 EDUCATION AND OUTREACH .........................................................................13 1.11 PHASE II CONCLUSIONS ...................................................................................13
1.11.1 Lessons Learned: Overall Project Success and Countermeasures ....13 1.11.2 Utility of Crash Typing Tools in Selecting Treatments ........................13
CHAPTER 2 COUNTERMEASURE IMPLEMENTATION ..................................................15
2.1 OVERVIEW OF INSTALLATION CHALLENGES .................................................15 2.2 COMPARISON OF COUNTERMEASURES: EASE OF IMPLEMENTATION ........16 2.3 COMPARISON OF COUNTERMEASURES: COSTS ..............................................16 2.4 COMPARISON OF COUNTERMEASURES: AVAILABILITY AND STANDARD USE ..........................................................................................................................18
CHAPTER 3 DEPLOYMENT OF INDIVIDUAL COUNTERMEASURES ............................20
3.1 PEDESTRIAN PUSH BUTTON THAT CONFIRMS PRESS ..................................20 3.2 DECREASE MINIMUM GREEN TIME ..................................................................22 3.3 VIDEO PEDESTRIAN DETECTION .....................................................................24 3.4 LEAD PEDESTRIAN PHASE ................................................................................25 3.5 “TURNING VEHICLES YIELD TO PEDESTRIANS” SYMBOL SIGN ....................27 3.6 ELECTRONIC “NO RIGHT TURN ON RED” (NRTOR) SIGN...............................29 3.7 PEDESTRIAN COUNTDOWN SIGNALS ..............................................................30 3.8 “IN‐STREET YIELD TO PEDESTRIANS SIGNS” ..................................................32 3.9 PEDESTRIANS ZONE SIGNS ...............................................................................34 3.10 SPEED TRAILERS ..............................................................................................36 3.11 RECTANGULAR LED RAPID FLASHING BEACONS .........................................38 3.12 DYNAMIC LIGHTING .........................................................................................40 3.13 NO PERMISIVE LEFT TURN .............................................................................42 3.14 OFFSET STOP LINES .........................................................................................43
Miami‐Dade Pedestrian Safety Project Final Report and Executive Summary
iv
3.15 ADVANCE YIELD MARKINGS ...........................................................................44
CHAPTER 4 DATA ANALYSIS FOR PARTICULAR INDIVIDUAL COUNTERMEASURES ................................................................................................47
4.1 INDIVIDUAL TREATMENT RESULTS ................................................................47 4.1.1 Push Button That Confirms Press ...........................................................48 4.1.2 The Effects of Varying Minimum Green Time ........................................50 4.1.3 Video Pedestrian Detection .....................................................................50 4.1.4 Leading Pedestrian Phase ........................................................................52 4.1.5 “TURNING VEHICLE YIELD TO PEDESTRIANS” Symbol Sign ...............55 4.1.6 Electronic “NO TURN ON RED” Sign ........................................................56 4.1.7 Countdown Pedestrian Signals ................................................................57 4.1.8 In‐Street Pedestrian Sign .........................................................................58 4.1.10 Speed Trailers .........................................................................................60 4.1.11 Rectangular LED Stutter Flash ..............................................................61 4.1.12 Dynamic Lighting ....................................................................................64 4.1.13 Remove Permissive Left Turn Phase ....................................................64
4.2 CRASH ANALYSIS All TREATED CORRIDORS ...................................................66 4.3 INDIVDUAL CORRIDOR CRASH DATA ..............................................................67
4.3.1 41ST Street (Alton Rd. to Pine Tree Dr.) ..................................................67 4.3.2 NE6TH St. (NE 141ST St. to NE 151ST St.) ..................................................67 4.3.4 Collins Ave (5TH St. to 24TH St.) ................................................................69 4.3.5 Collins Ave‐Indian Creek (28TH St. to 43RD St.) .......................................70
CHAPTER 5 OUTREACH AND EDUCATION ....................................................................75
CHAPTER 6 PHASE II CONCLUSIONS .............................................................................78
6.1 LESSONS LEARNED ............................................................................................78 6.1.1 Lessons Learned: Overall Project Success .............................................78 6.1.2 Crash Reductions ......................................................................................78 6.1.3 Lessons Learned from Experimentation ................................................79 6.1.4 Lessons Learned: Implementation ..........................................................79

Miami‐Dade Pedestrian Safety Project Final Report and Executive Summary
v
LIST OF FIGURES
Figure 1.1 Miami‐Dade High Pedestrian Crash Zones .....................................................4
Figure 1.2 South Beach High Pedestrian Crash Corridors ..............................................4
Figure 3.1 Picture of Pedestrian Push Button That Confirms Press ............................20
Figure 3.2 Picture of Midblock Crossing with Reduced Minimum Green Time ..........22
Figure 3.3 Picture of Device Used For Pedestrian Detection ........................................24
Figure 3.4 Picture of Leading Pedestrian Phase ............................................................26
Figure 3.5 Picture of “Turning Vehicles Yield to Pedestrians” Symbol Sign ...............27
Figure 3.6 Picture of Electronic No Turn on Red Sign ...................................................29
Figure 3.7 Picture of a Pedestrian Countdown Signal ...................................................31
Figure 3.8 Picture of In‐street “Yield to Pedestrians” Signs .........................................33
Figure 3.9 Picture of a Speed Trailer ..............................................................................37
Figure 3.10 Picture of Rectangular LED Rapid Flashing Beacons ................................39
Figure 3.11 Picture of Dynamic Lighting ........................................................................41
Figure 3.12 Picture of Offset Yield Lines ........................................................................43
Figure 3.13 Picture of Advance Yield Markings .............................................................45
Figure 4.1 Picture of Data Collectors ..............................................................................47
Figure 4.2 Crashes per Year for All Eight Crash Corridors from 1996‐2006 ..............66
Figure 4.3 Crashes per Year for 41st St.; Alton Rd. to Pine Tree Dr. 1996‐2006 .........67
Figure 4.4 Crashes per Year Along NE 6th St. (NE 141st St. to NE 151st St.) from 1996 to 2006 .............................................................................................................68
Figure 4.5 Crashes per Year NE 163rd St. (NE 2nd Ave to Biscayne Blvd.) from 1996 to 2006 .............................................................................................................69
Figure 4.6 Crashes per Year Collins Ave. (5th Street to 24th St.) from 1996 to 2006 ..70
Figure 4.7 Crashes per Year Collins Ave. (Indian Creek 28th St. to 43rd St.) from 1996 to 2006 .............................................................................................................71

Miami‐Dade Pedestrian Safety Project Final Report and Executive Summary
vi
Figure 4.8 Crashes per Year Collins Ave. and Harding Ave. (67th St. to 76th St.) from 1996 to 2006 ....................................................................................................72
Figure 4.9 Crashes per Year on Alton Rd. 5th St. to 17th St.) from 1996 to 2006 .........73
Figure 4.10 Crashes per Year on 5th St. Between Alton Rd. and Ocean Dr.) from 1996 to 2006 .............................................................................................................74

Miami‐Dade Pedestrian Safety Project Final Report and Executive Summary
vii
LIST OF TABLES
Table 1.1 Results Obtained for Each Countermeasure ..................................................10
Table 1‐2 Numbers of Crashes per Year at Treated Sites .............................................12
Table 2.1 Capital Cost and Labor/Engineering Costs for Each Countermeasure .......17
Table 3.1 Push the Button Confirming Press: Deployment Locations Listed by Corridor ......................................................................................................................21
Table 3.2 Decrease Minimum Green: Deployment Locations Listed by Corridor ......23
Table 3.3 Video Pedestrian Detection: Deployment Locations Listed by Corridor ....24
Table 3.4 Lead Pedestrian Phase: Deployment Locations Listed by Corridor ............26
Table 3.5 “Turning Vehicles Yield to Pedestrians” Symbols Sign: Deployment Locations Listed by Corridor ....................................................................................28
Table 3.6 Electronic “No Turn on Red” Sign: Deployment Locations Listed by Corridor ......................................................................................................................30
Table 3.7 Pedestrian Countdown Signals: Deployment Locations Listed by Corridor ......................................................................................................................32
Table 3.8 In‐street “Yield to Pedestrians” Signs: Deployment Locations Listed by Corridor ......................................................................................................................33
Table 3.9 Pedestrian Zone Signs: Deployment Locations Listed by Corridor .............35
Table 3.10 Speed Trailers: Deployment Locations Listed by Corridor ........................37
Table 3.11 Rectangular LED Rapid Flashing Beacons: Deployment Locations Listed by Corridor .....................................................................................................39
Table 3.12 Dynamic lighting: Deployment Locations Listed by Corridor ...................41
Table 3.13 Eliminate permissive Left Turn: Deployment Locations Listed by Corridor ......................................................................................................................42
Table 3.14 Offset Stop Lines: Deployment Locations Listed by Corridor ....................44
Table 3.15 Eliminate Permissive Left Turn: Deployment Locations Listed by Corridor ......................................................................................................................45
Table 4.1 Results of Push Button Intervention ..............................................................49
Table 4.2 Results of Varying Minimum Green Time Intervention ...............................51

Miami‐Dade Pedestrian Safety Project Final Report and Executive Summary
viii
Table 4.4 Results of Leading Pedestrian Phase Intervention .......................................54
Table 4.5 Results of “TURNING VEHICLE YIELD TO PEDESTRIANS” Intervention ....55
Table 4.6 Results of Electronic “NO TURN ON RED” Sign Intervention .......................57
Table 4.8 Results of In‐Street Pedestrian Sign Study ....................................................59
Table 4.9 Results of Pedestrian Zone Signs Study .........................................................60
Table 4.10 Results of Speed Trailers Study ....................................................................61
Table 4.11 Results of Rectangular LED Stutter Flash Study .........................................63
Table 4.12 Results of Dynamic Lighting Study ..............................................................64
Table 4.13 Results of Remove Permissive Left Turn Phase Study ...............................65
Miami‐Dade Pedestrian Safety Project Final Report and Executive Summary
1
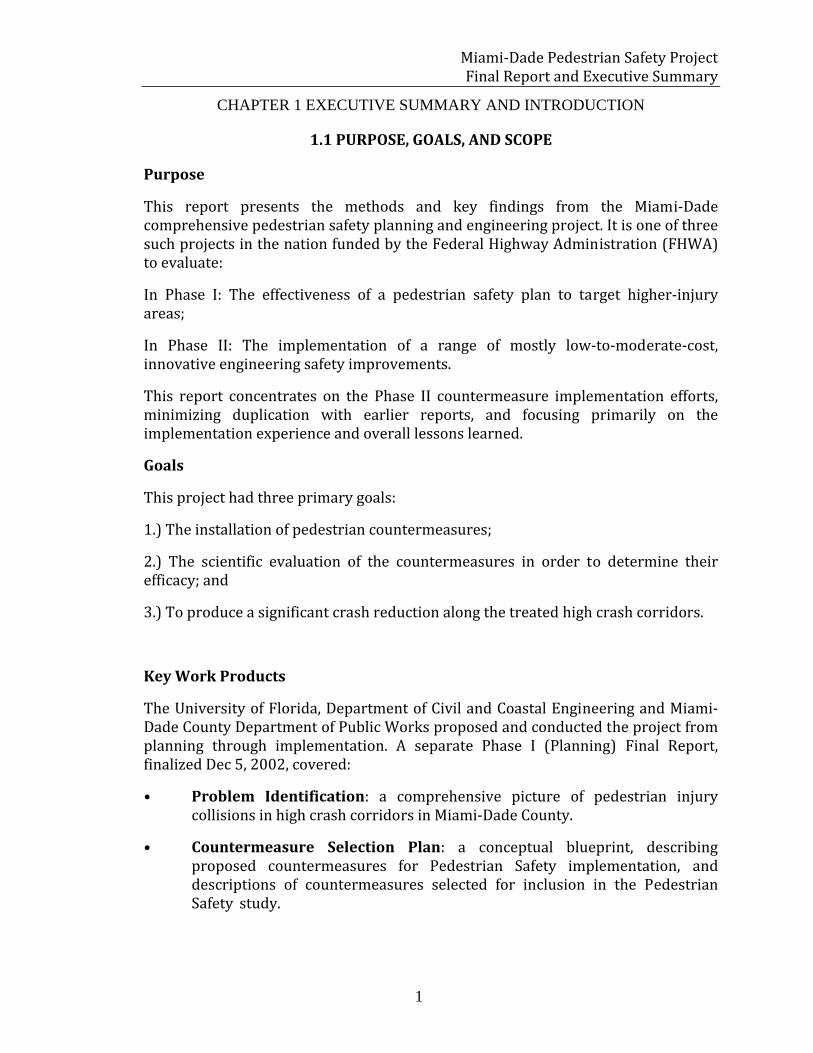
CHAPTER 1 EXECUTIVE SUMMARY AND INTRODUCTION
1.1 PURPOSE, GOALS, AND SCOPE
Purpose
This report presents the methods and key findings from the Miami‐Dade comprehensive pedestrian safety planning and engineering project. It is one of three such projects in the nation funded by the Federal Highway Administration (FHWA) to evaluate:
In Phase I: The effectiveness of a pedestrian safety plan to target higher‐injury areas;
In Phase II: The implementation of a range of mostly low‐to‐moderate‐cost, innovative engineering safety improvements.
This report concentrates on the Phase II countermeasure implementation efforts, minimizing duplication with earlier reports, and focusing primarily on the implementation experience and overall lessons learned.
Goals
This project had three primary goals:
1.) The installation of pedestrian countermeasures;
2.) The scientific evaluation of the countermeasures in order to determine their efficacy; and
3.) To produce a significant crash reduction along the treated high crash corridors.
Key Work Products
The University of Florida, Department of Civil and Coastal Engineering and Miami‐ Dade County Department of Public Works proposed and conducted the project from planning through implementation. A separate Phase I (Planning) Final Report, finalized Dec 5, 2002, covered:
• Problem Identification: a comprehensive picture of pedestrian injury collisions in high crash corridors in Miami‐Dade County.
• Countermeasure Selection Plan: a conceptual blueprint, describing proposed countermeasures for Pedestrian Safety implementation, and descriptions of countermeasures selected for inclusion in the Pedestrian Safety study.

Miami‐Dade Pedestrian Safety Project Final Report and Executive Summary
2
• Evaluation Plan: a conceptual plan for assessing the impacts of the countermeasures.
• Outreach and Awareness Plan: a conceptual plan for educating the public about countermeasures to be implemented, in addition to promoting safer driver and pedestrian behavior.
The June 25, 2004 Phase II Research Implementation Plan clarified the countermeasure plan, including cost estimates and, where appropriate, conceptual layout plans. It also presented refined outreach and data collection/evaluation plans. Due to engineering and institutional challenges, some of the proposed countermeasures could not be implemented while additional countermeasures were added. These challenges are described in this report.
1.2 MIAMIDADE SETTING
1.2.1 Crash Demographics in MiamiDade County
This section of the executive summary provides a brief overview of the presentation in the Phase 1 Report, which is not repeated in the main portion of this report. This section has been added to the executive summary to give the reader perspective on the nature of the crash problem in Miami‐Dade County, how treatment corridors were selected, and how countermeasures were selected and matched to each selected corridor. Miami‐Dade had a population of 2,253,362 in 2000, which is about 14 percent of Florida’s total population. The population is diverse and predominantly Hispanic (57.3 percent). The per capita pedestrian fatality and injury crash rates are very high. Among the 82 pedestrian deaths in 1999, nearly half involved pedestrians age 55 or older. Total injuries are greatest in number for ages 25 through 54. African Americans are over‐ represented in terms of population with a crash rate approximately 50 percent higher than their proportion of the population, and Hispanic Americans are under represented with a rate less than half their proportion of the population. Alcohol use in pedestrian fatalities is under‐represented in Miami‐Dade at only 16.8 percent, compared to 35 percent statewide.
A little more than half of the pedestrian crashes in Miami‐Dade County occurred on state or county roads, while 46 percent of the remaining crashes occurred on local roads. Because there are many more miles of local roads than state or county roads, the pedestrian crash rate per mile is much higher for this type of roadway. The number of pedestrian fatalities was approximately equal for local, state and county roads reflecting a much higher fatal crash rate per mile for state and county roads. In regard to lighting conditions, children and seniors are more likely to be struck in daylight than pedestrians of other ages, and pedestrians age 18 to 24 have the highest incidence of nighttime collisions.
The major pedestrian safety effort completed outside of the pedestrians safety project was a National Highway Traffic Safety Administration (NHTSA) project that

Miami‐Dade Pedestrian Safety Project Final Report and Executive Summary
3
focused on enforcement in Miami Beach and city wide public education aimed at drivers and pedestrians (Zegeer et. al, 2008). The NHTSA project was implemented between 2002 and 2004. The Engineering components of the FHWA project were installed in 2005 and 2006. This presence of the NHTSA effort provided an excellent opportunity to determine the effects of engineering treatments added to city and community wide outreach and education efforts.
The NHTSA effort included the following components:
• Pedestrian safety message mounted in bus and Metrorail train posters;
• Public awareness announcements about pedestrian safety broadcasted on city and county access channels in Spanish and English and on selected Spanish speaking radio stations;
• Walk Safely pedestrian brochures distributed to the Miami‐Dade School Board, hospital and medical department, public library, police departments and elected officials’ offices;
• Pedestrian safety workshops for older pedestrians.
• Walking Through the Years: Pedestrian Safety for Older Adults. Booklets were delivered to organizations such as the Miami‐Dade school Board, hospital and medical departments, retirement homes, public libraries (similar materials were distributed in Spanish);
• Pedestrian enforcement of driver yielding behavior during 2002. Police stopped 2006 drivers for failing to yield to pedestrians.
Miami‐Dade County has the highest incidence of pedestrian injuries and fatalities in the State of Florida, which ranked within the top two states in number of pedestrian crashes as well as per capita pedestrian crashes during the baseline period. In recent years the pedestrian crash rate had remained relatively steady prior to the implementation of the NHTSA and FHWA Pedestrian projects. During the nine years prior to the FHWA project there were a total of 15,472 pedestrian crashes in the DHSMV Miami‐Dade County, which included 670 fatal crashes (4.2 percent). Figure 1.1 shows the geographic distribution of pedestrian crashes during the baseline period as a crash density map. High crash zones are represented by darker colors. Figure 1.2 shows the Crash map for South Miami Beach. South Miami Beach has the highest crash density in Miami‐Dade County.

Miami‐Dade Pedestrian Safety Project Final Report and Executive Summary
4
Figure 1.1 Miami‐Dade High Pedestrian Crash Zones
Figure 1.2 South Beach High Pedestrian Crash Corridors

Miami‐Dade Pedestrian Safety Project Final Report and Executive Summary
5
1.3 PROJECT OVERVIEW AND SCHEDULE
The Phase 1 planning analysis and recommendations were developed in 2002 and the plan was revised in 2004. A zonal approach was employed to identify crash corridors with dense clustering of serious pedestrian crashes. Crash data over a five‐year period were first mapped using GIS software to determine high crash corridors that were associated with the majority of serious crashes. The following process was followed to identify these high crash corridors. First, pedestrian crash data were extracted from Florida DMV records. Second, these crashes were entered into a GIS database and plotted. Third, crashes were weighted for severity and a crash index assigned. Fourth, the Pedestrian and Bicycle Crash Analysis Tool (PBCAT) was applied to all crashes and these data were merged back onto the GIS database. Fifth, the research team including an FDOT and Miami‐Dade County representative visited each high crash corridor identified in steps one through four with a spreadsheet in hand documenting all pedestrian crash activity in that zone to examine local features contributing to crashes. Sixth, data were desegregated for specific aspects of the crash. Seventh, surrogate data were recorded or crash reports were studied where required to resolve ambiguities.
The outreach plan proposed integrating selected countermeasure and outreach and awareness into ongoing efforts, as well as working with agencies responsible for pedestrian safety (e.g., Police and Public Health departments) and working with grassroots community groups committed to pedestrian safety projects. For the most part, pedestrians did not need education about countermeasures because their meaning was intuitively clear (e.g., countdown signals and push buttons that confirm a button press). The media plan employed in Miami‐Dade County involved a continuation of the NHTSA campaign described above through the office of the Pedestrian Bicycle Coordinator.
A two‐day site visit in 2003 by FHWA staff and consultants included a detailed review of the initial countermeasure plan. In 2004 the project team fine tuned the work plan and proceeded into Phase II implementation. Extensive engineering efforts began in early in 2005 and continued into 2006. An Implementation Plan and Preliminary Engineering Report provided a detailed blueprint for conducting Phase II. The actual implementation was predominantly consistent with the Phase I report and the Phase II implementation plans, although some modifications were made in response to practical difficulties or changing exigencies.
1.4 COUNTERMEASURE OVERVIEW
A total of fifteen countermeasures (nine general engineering countermeasures and six intelligent transportation systems [ITS] countermeasures) were implemented by the University of Florida team during this Phase II investigation:

Miami‐Dade Pedestrian Safety Project Final Report and Executive Summary
6
GENERAL ENGINEERING COUNTERMEASURES
1. Reducing the minimum green time at mid‐block crosswalks controlled by a traffic signal.
2. Advance yield markings at crosswalks with an uncontrolled approach.
3. Recessed or offset stop lines for intersections with traffic signals.
4. Leading pedestrian intervals (LPI)
5. Pedestrian push buttons that confirm press
6. “Turning Vehicles Yield to Pedestrians” symbol signs for drivers
7. Eliminate permissive left turns at a signalized intersection.
8. In‐street pedestrian signs
9. Pedestrian zone signs
10. Midblock traffic signal
INTELLIGENT TRANSPORTATION SYSTEMS (ITS) COUNTERMEASURES
1. ITS video pedestrian detection
2. Rectangular LED rapid flash beacons for uncontrolled multilane
crosswalks
3. ITS smart lighting at crosswalks with nighttime crashes
4. ITS "No Right Turn on Red" (NRTOR) Signs
5. Pedestrian countdown timers
6. Speed trailers.
In addition, an outreach program was implemented by Miami‐Dade County through the office of the pedestrian bicycle coordinator. This outreach effort included distribution of a video public service announcement (PSA) to cable and small/ethnic local TV stations, and presentations at schools and senior centers. It was not possible to evaluate each of the outreach efforts separately.
Miami‐Dade Pedestrian Safety Project Final Report and Executive Summary
7
1.4.1 Comparison of Countermeasures: Cost
The overall cost of this project was slightly greater than $1,000,000 dollars, including $870,540 in federal funding, $140,000 in state funding, and $186,771 in county funding. The federal funding averaged roughly $ 217,635 per year.
The total costs of the nearly seven‐year‐long project included the following estimated cost breakdown:
PLANNING PHASE I: $125,000
IMPLEMENTATION PHASE II: $1,010,540
Including:
Design of Countermeasures: $133,933
Installation/Deployment Labor: $108,833
Materials and Equipment: $302,913
Data Collection & Evaluation: $282,172
Other Program Management $182,690
(Including planning and design of countermeasures not installed)
In general, the labor costs exceeded the equipment and materials costs. Overall, the engineering/administrative costs were quite substantial, largely due to the need for specialized training, mobilization, and approvals for new devices. These engineering/administrative costs often exceeded the material/equipment costs and the installation labor.
The least expensive countermeasures in total per‐unit costs were Pedestrian Warning Signs. The most expensive countermeasure was the Video Detection System.
1.4.2 Comparison of Countermeasures Availability and Standard Use:
All but two countermeasures were compliant with the Manual of Uniform Traffic Control Devices. The rectangular rapid flash beacon and the “turning vehicles yield to pedestrians” symbol signs were granted FHWA permission to experiment. Several of the treatments that were considered experimental when initially proposed by the University of Florida team were added to the MUTCD in the 2003 revision.
1.4.3 Comparison of Countermeasures: Installation Complexity
Countermeasures that required the least effort to install were:
Miami‐Dade Pedestrian Safety Project Final Report and Executive Summary
8
• Countdown Pedestrian Signals. The original incandescent signals were simply changed out.
• Pedestrian push buttons that confirmed the button press. These were easily swapped for the standard push button.
• Advance Stop/Yield Lines. These were easily installed along the corridor with new pavement. They were no more difficult to install than lines at the minimum distance. Moving stop lines involve greater cost because the old markings need to be removed by grinding.
• Reducing Minimum Green Time at midblock traffic signals. These only required timing changes in the traffic signals computer.
• Leading Pedestrian Interval. These only required timing changes in the traffic computer.
Countermeasures that required a moderate effort to install were:
• “Turning Vehicles Yield to Pedestrians” Symbol Signs. These signs needed to be mounted on the mast arm.
• In‐Street “Yield to Pedestrians” Signs. These signs needed to be installed in the roadway and had to be frequently replaced.
• Rectangular LED Rapid Flashing Beacons. These signs communicated by RF transmitters and were powered by a solar array. Therefore they required no wiring.
• ITS Smart Lighting. This treatment was part of the Rectangular LED Rapid Flashing Beacon treatment.
• Speed Trailer. The major issue with speed trailers is labor associated with attending to the trailer. Newer solar power speed signs that can be affixed to poles would be easier to install.
• ITS “No Right Turn on Red” Signals. These signs required installation on the mast arm.
Countermeasures that required the most effort to install were:
• Eliminate Permissive Left Turns at Signals. This treatment required replacing the traffic signal array.
• ITS Video Pedestrian Detection. This treatment required installation and adjustments to get it to work correctly.

Miami‐Dade Pedestrian Safety Project Final Report and Executive Summary
9
• Installation of a midblock signal. This is a relative high cost item including mast arm and wiring. Originally installed to evaluate midblock animated eyes display later converted to a short minimum green midblock installation.
1.6 DEVICES NOT INSTALLED
Several devices originally proposed in the Phase II work plan were not implemented for the reasons provided below.
1.6.1 ITS Midblock Signals with Animated Eyes
The animated eyes countdown signals were not installed as originally planned, because the vendor, Relume, lost interest in supporting experimentation with the device, apparently after assessing the market potential for the devices. Ordinary Countdown timers were installed in their place.
1.6.2 ITS Midblock Pedestrian Signal with Animated Eyes
The midblock crossing with animated eyes display showing the direction the pedestrian was crossing was not installed because research carried out under FHWA permission to experiment in St. Petersburg, Florida found the rectangular LED rapid flashing beacon to be more effective. The rectangular LED rapid flashing beacon was subsequently added to the implementation plan and the original midblock crossing proposed for installation of the animated eyes display was converted to a standard midblock traffic signal.
1.7 DATA COLLECTION AND ANALYSIS METHODS FOR PEDESTRIAN SAFETY COUNTERMEASURES
The most important measure was data on crashes because these best validated the safety value of the countermeasures installed. However, because multiple treatments were installed in all corridors it was impossible to attribute the crash reductions to any particular countermeasure. We originally planned on employing a mix of video recording and field observation to record surrogate measures. Unfortunately the video recording systems were destroyed by a major hurricane. This forced the team to substitute field observation for video recording to assess the effects of each treatment on surrogate measure at all of our sites. The shift from video to live data recording required the team to reduce the number of items scored from those originally proposed because field observation does not allow multiple viewing of events (a necessary condition to reliably score many aspects of a single event).
The pedestrian/driver observations employed a mixture of design features. Some experiments were simple before and after installation evaluations. In other cases, multiple baseline (staged introduction of the treatment at different sites to control for extraneous variables) and follow‐up observations were conducted to ascertain

Miami‐Dade Pedestrian Safety Project Final Report and Executive Summary
10
the effects of the passage of time and novelty fading. In a few cases treatments were introduced, removed and reintroduced using replication logic to rule out the effects of uncontrolled variables. Statistical tests were employed (generally z‐tests and t‐tests) to test for difference of proportions/means.
1.8 SUMMARY OF EXPERIMENTAL RESULTS FOR PEDESTRIAN SAFETY COUNTERMEASURES
Following is a summary of results obtained for each countermeasure. This table indicates the purpose for installing each countermeasure, highlighted results, and a ranking of relative cost. Results are only reported in this table if they are statistically significant (p<0.05).
Table 1.1 Results Obtained for Each Countermeasure
COUNTER-MEASURE
PURPOSE OBSERVATION HIGHLIGHTS RELATIVE
COST
Push buttons that
confirm press
To Confirm press so pedestrian waits for WALK
The percentage of cycles that a pedestrian pressed the button increased from 33.8% to 58.1% at the first site and from 40.3% to 54.3% at the second site. The percentage of pedestrians who pressed the button that waited for the “WALK” increased from 51.2% to 72.5% at the first site and from 72.3% to 86% at the second site.
Low Cost
Reduce Minimum
Green Time
To reduce pedestrian wait time to increase
pedestrian compliance
Reducing minimum green time reduced pedestrian wait time and significantly increased pedestrian compliance. At one site reducing minimum green time improved pedestrian compliance from 64% to 98%. Vehicle delay also increased
Low Cost
Video Pedestrian Detection
To place calls for pedestrian that
don't press the call button
The device was reliable but many pedestrians did not wait even when the device placed the call for them. This treatment needs to be used in conjunction with reduced minimum green time
High Cost
Lead Pedestrian
Phase
To provide a head start for
pedestrians. When RTOR is permitted,
the maximum effect is obtained with left turning
vehicles
This treatment produced an increased yielding by drivers of left turning vehicles
Low Cost

Miami‐Dade Pedestrian Safety Project Final Report and Executive Summary
11
“Turning Vehicle Yield
to Pedestrians" symbol sign
To increase yielding by drivers of turning vehicles
Mixed results. This sign was not superior to the text only sign
Moderate Cost
Electronic NRTOR sign
To restrict right turns on red during
the WALK and yellow phase
This sign statistically significantly reduced violations as compared to the static sign and produced a marked decrease in the percentage of drivers turning ROR who made no stop from 40% to coming to 13%.
Moderate Cost
Countdown Pedestrian
Signals
Provides information to
pedestrian on the time remaining to
cross
The installation of the countdown timers was associated with a statistically significant increase in the percentage of pedestrians that pressed the call button
Low Cost
In-Street "Yield to
Pedestrian Signs"
This sign marks crosswalks and
reminds drivers of their obligation to yield right-of-way to pedestrians in
crosswalks
These signs increased the percentage of drivers yielding right-of-way to pedestrians from 19% to 71% but they were easily damaged
Moderate Cost
Pedestrian Zone Signs
To warn drivers to expect pedestrians
in the roadway This sign had no effect on driver speed Low Cost
Speed Trailers
To alert drivers to slow down
The speed trailer increased braking for pedestrians but had no effect on speed which was already within the speed limit
Moderate Cost
Rectangular LED Rapid Flashing Beacons
Alerts drivers that a pedestrian is in
the crosswalk
This sign increased the percentage of drivers yielding to pedestrians from 0% to 65% at one site and from 1% to 92% at the second site. Both test sites were high-speed multilane roads.
Moderate Cost
Dynamic Lighting
Alerts driver that a pedestrian is crossing and makes the
pedestrian more visible
This device was used with the rectangular LED beacon. It was not effective but the level of illumination was not very great
Moderate Cost
Eliminate Permissive Left Turn
Reduces conflicts between left
turning vehicles and pedestrians
This treatment reduced conflicts between left turning vehicles and pedestrians
High Cost

Miami‐Dade Pedestrian Safety Project Final Report and Executive Summary
12
Advance Yield
Markings
This treatment can increase the visibility of
pedestrians in crosswalks
The wrong size sign was specified in the 2003 MUTCD
NOT EVALUATED IN THIS STUDY Low Cost
Offset Stop Lines
This treatment can increase the visibility of
pedestrians in crosswalks
NOT EVALUATED IN THIS STUDY Low Cost
1.9 CRASH DATA ANALYSIS
The introduction of the NHTSA project was associated with a modest reduction in crashes. Adding the engineering countermeasure produced a further reduction in crashes at all sites. Following is a summary table showing the mean number of crashes per year at each treated site and for all treated sites combined during each condition of the study.
Table 1‐2 Numbers of Crashes per Year at Treated Sites
SITE
BASELINE PERIOD
CRASHES PER YEAR
NHTSA STUDY PERIOD
CRASHES PER YEAR
FHWA STUDY PERIOD
CRASHES PER YEAR
All sites combined 101 87 51
Alton Road: (5th St. to 17th St.) 13.8 10 8.5
5 St: (Alton Rd. to Ocean Dr.) 6.5 4.6 4
Collins Ave: (5th St. to 24th St.) 18.8 20 13
41 St: (Alton Rd to Pine Tree Dr.) 7 5.3 2
Collins Ave & Harding Av 14.3 13 9.5
NE 6th Ave. (NE 141 St. to NE 151 St.)
7.7 8 3
NE 163 St. (NW Ave. to Biscayne Blvd)
25.8 20.7 8

Miami‐Dade Pedestrian Safety Project Final Report and Executive Summary
13
1.10 EDUCATION AND OUTREACH
All of the traffic control devices deployed in this study were intuitive in nature and required little outreach and awareness training. Countdown pedestrian signals, offset stop lines, push buttons that confirm the button press, automatic pedestrian detectors (passive in nature), a leading pedestrian phase, "Turning Vehicles Yield to Pedestrian" signs, in roadway signs, elimination of permissive left turns, dynamic NTOR signs, the rectangular LED rapid flashing beacon, dynamic lighting (passive in nature), pedestrian zone warning signs, shorter minimum green waiting times, and advance yield markings are familiar to motorists and pedestrians. Therefore outreach and awareness focused on continued enforcement along with a continuation of the educational countermeasures deployed as part of the National Highway Traffic Safety Administration (NHSTA) Miami‐Dade Contract that begun prior to the FHWA Cooperative Agreement.
1.11 PHASE II CONCLUSIONS
1.11.1 Lessons Learned: Overall Project Success and Countermeasures
In terms of the project goals the project was successful. Many treatments were implemented in the high crash areas. Miami‐Dade County was impressed with some of the countermeasures and is presently in the process of deploying more of them in other areas. Some examples are countdown pedestrian signals and rectangular LED rapid flashing beacons. We also were successful in learning a good deal about some of the countermeasures including how to use them most effectively. We have published four papers in Transportation Research Record on our findings to date. More papers will be submitted this year. We also obtained a statistically significant reduction in crashes at the treatment sites.
1.11.2 Utility of Crash Typing Tools in Selecting Treatments
The GIS crash mapping tools were particularly useful and were further enhanced by the MPO adding demographic information to the field, such as ages, PBCAT information, driver ages, time of day, weather conditions, etc. Sorting this information by site and printing it in booklet form made this information immediately available during site visits. However, there were times when only the crash reports could sort out the nature of a particular problem. The crash diagram was one of the most useful components of the crash report in determining the type of crash. On the other hand, the PBCAT tool that was available during baseline assessment had several limitations that reduced its utility. In order of usefulness, the enhanced GIS crash maps were the most useful tool, followed by site visits conducted with the booklet that sorted crashes by sites and listed all of the information added to the GIS database, followed by the crash reports. It is hoped

Miami‐Dade Pedestrian Safety Project Final Report and Executive Summary
14
that the most recent version of PBCAT will prove more useful to practitioners wishing to match countermeasures to crash sites.
1.11.3 Problems That Needed to be Overcome
There is a good deal of coordination required to make a large project successful. One problem we had not anticipated was extreme weather. Miami‐Dade County was struck by two major hurricanes while we were assessing the treatments we installed. The storms destroyed camera placement sites, requiring us to shift to field observers for some of our evaluations. Storm damage also required us to reinstall some treatment installations, and the extent of damage tied up contractors for long periods of time, resulting in delays in installing some of the equipment we needed to make evaluations. At other times other priorities, such as changing the signage for all school crossings in Miami‐Dade County, resulted in delays in implementing particular countermeasures.
Anther issue was the sheer scope of such a project. Agencies wishing to implement engineering countermeasures along high crash corridors might wish to prioritize the zones identified in their initial analysis and determine and implement treatments one zone at a time. This would allow better coordination and use of resources without overburdening administration and infrastructure. It would also allow the agency to assemble the contracting resources to implement the project more easily.
One positive feature was the excellent level of cooperation from Miami‐Dade County and the Florida Department of Transportation District Office. The professionals from these organizations provided constructive suggestions and did not present barriers to innovation. We also received excellent cooperation from the Miami‐Dade Metropolitan Planning Organization. The bicycle pedestrian coordinator and the signals design engineer were particularly helpful in assisting the team with its mandate.

Miami‐Dade Pedestrian Safety Project Final Report and Executive Summary
15
CHAPTER 2 COUNTERMEASURE IMPLEMENTATION
This chapter discusses the deployment of the countermeasures that includes an overview of each countermeasure along with any problems that needed to be addressed in the installation process. Also presented is a comparison of the countermeasures in terms of cost and device availability. A description of each individual countermeasure, its purpose, the setting for each Miami‐Dade installation, and approval status, and relative cost information, are presented in Chapter 3.
2.1 OVERVIEW OF INSTALLATION CHALLENGES
Phase II involved the installation and evaluation of a broad range of pedestrian safety measures, from nearly routine signal timing changes to customized video detection equipment. However, there were several common challenges that the Miami‐Dade team faced: • Selection and Confirmation of Countermeasures: The initial process of
selecting countermeasures and assigning them to specific locations was described in the Phase I Final Report and the Phase II Implementation Plan and Preliminary Engineering Report. This involved development of a comprehensive list of candidate countermeasures, which were then rated on several criteria, such as match to the crash type, cost, presumed efficacy, and ease of implementation. These were matched to each location by meticulous analysis of the type of crash, causal factors and the physical characteristics of the roadway. For example, if vehicles turning right on red injured a number of pedestrians at a particular location, a static NRTOR sign and an electronic NRTOR sign were considered. Because a “NO TURN ON RED WHEN PEDESTRIANS ARE PRESENT” sign was already present we decided to compare the standard “NO RIGHT TURN ON RED” sign with the electronic NRTOR sign. We also placed a premium on low cost items that could be installed in large numbers to increase the chance of producing a sufficiently large reduction in crashes to be detected.
• Scheduling of Countermeasures: We attempted to install countermeasures in
a staged manner (multiple baseline design) in order to control for extraneous variables. Although we were usually successful in following the dictates of the selected design protocol, there were times when treatments would not be introduced or removed according to our schedule because of conflicting priorities of the Contractor or Miami‐Dade staff. In these instances, we often needed to collect fresh baseline data to allow for a valid comparison. This problem arose often and contributed to the increased cost of the research component of this project.

Miami‐Dade Pedestrian Safety Project Final Report and Executive Summary
16
• Extreme Weather Events: Two major hurricanes struck Miami‐Dade during the critical period when countermeasures were being installed and evaluated. These storms destroyed the video recording systems, forcing the team to employ field observation. One implication of this change was the need to reduce the number of items recorded in order to ensure the collection of reliably data. The storms also destroyed some countermeasure, which had to be reinstalled. These storms added additional cost to the project.
2.2 COMPARISON OF COUNTERMEASURES: EASE OF IMPLEMENTATION
Three countermeasures proved more challenging to deploy: • The Electronic NRTOR sign; • The Video Pedestrian Detector; • In Street Yield to Pedestrian signs; and The first listed two devices involved procurement or deployment of electronic equipment that engineering staff and electricians were not highly familiar with. The remaining device was easily deployed but would not stay deployed due to frequent collisions with vehicles. The manufacturer installed the Rectangular LED Rapid Flashing Beacons greatly reducing the scope for installation problems with this relatively new technology.
2.3 COMPARISON OF COUNTERMEASURES: COSTS
The overall cost of this project was slightly greater than 1 million dollars, including $870,540 in federal funding, $140,000 in state funding, and $186,771 in county funding. The federal funding averaged roughly $ 217,635 per year.
The total costs of the nearly seven‐year‐long project included the following rough estimates:
PLANNING PHASE I: $125,000.
IMPLEMENTATION PHASE II: $1,010,540.
Including:
Design of Countermeasures: $133,933.
Installation/Deployment Labor: $108,833.

Miami‐Dade Pedestrian Safety Project Final Report and Executive Summary
17
Materials and Equipment: $302,913
Data Collection & Evaluation: $282,172
Other Program Management $182,690
(Including planning and design of countermeasures not installed)
In general, the labor costs far exceeded the equipment and materials costs. Overall, the engineering/administrative costs were quite substantial, largely due to the need for specialized training, mobilization, and approvals for new devices. These engineering/administrative costs often exceeded the material/equipment costs and the installation labor.
The least expensive countermeasures in total per‐unit costs were Pedestrian Warning Signs. The most expensive countermeasure was the Video Detection System.
If this project is replicated by a community with a strict focus on improving pedestrian safety with know treatments in a cost‐effective manner, the data collection/evaluation and other program management costs could be substantially lower than the costs of the present study. Cost estimates are provided for each item in Chapter 3. Table 2.1 shows an estimate of capital costs and labor plus engineering costs for each countermeasure. Table 2.1 Capital Cost and Labor/Engineering Costs for Each Countermeasure
COUNTERMEASURE Estimated Cost Per
Unit
Estimated Installation- Engineering Cost/Unit
Operations/Maintenance Needs and Other Notes
Push buttons that confirm press
$105 $535 Low level of maintenance
required
Video Pedestrian Detection
$14,250 $8,500 No information on long-term maintenance. Adjusted by
manufacturer
“Turning Vehicle Yield to Pedestrians" symbol
sign $25 $55
Low level of maintenance required
Electronic NRTOR sign $3000 $700 Seemed to work well. Use of this
sign is increasing
Countdown Pedestrian Signals
$435 $45 Easy to retrofit. Easy to
maintain. We had no issues with this device

Miami‐Dade Pedestrian Safety Project Final Report and Executive Summary
18
In-Street "Yield to Pedestrian Signs"
$225 $50 High level of damage if not on
raised island. We had no raised island locations
Pedestrian Zone Signs $25 $45 Low level of maintenance
required
Speed Trailers $25/day $55 Worked well in Miami because of
solar output
Rectangular LED Rapid Flashing Beacons
$9,000 Included in Equipment
Pricing
Installed by contractor. Required some changes to
battery box because of flooding. System redesigned. Handled by
warranty.
Dynamic Lighting $600 Included in Equipment
Pricing
Was not very bright. Difficulty aiming it where needed
Eliminate Permissive Left Turn
$2500 $1500 May require change in signal
head
Advance Yield Markings
$50 $150 Material has a long lifetime.
Offset Stop Lines $50 $150 Material has a long lifetime. No grinding needed when installed
on fresh pavement.
In general, the labor and engineering costs often exceeded the materials/equipment costs. As is often the case the engineering/administrative costs for products used for the first time, tend to be higher than for equipment that are routinely installed. As staff becomes more familiar with new technology there is a major savings in time and effort. Additionally, installation cost were high because only a few devices could be installed at a time, rather than installing all devices in one operation. 2.4 COMPARISON OF COUNTERMEASURES: AVAILABILITY AND STANDARD USE
All but two countermeasures were compliant with the Federal Manual on Uniform Traffic Control Devices (MUTCD). It was necessary to obtain special approval to experiment with the rectangular LED rapid flashing beacon and the “Turning Vehicles Yield to Pedestrians” symbol signs. Several countermeasures considered experimental when initially proposed by the Miami‐Dade team were added to the MUTCD in the 2003 revision. One other countermeasure requiring approval (in street pedestrian turning vehicle yield signs at signalized intersections) was

Miami‐Dade Pedestrian Safety Project Final Report and Executive Summary
19
removed after engineering studies revealed there was insufficient room to install these signs at the Miami Beach intersections originally selected for evaluation.

Miami‐Dade Pedestrian Safety Project Final Report and Executive Summary
20
CHAPTER 3 DEPLOYMENT OF INDIVIDUAL COUNTERMEASURES
This chapter discusses the full deployment of countermeasures. Because of the large number of countermeasures installed, data collection and evaluation were only conducted at selected locations.
3.1 PEDESTRIAN PUSH BUTTON THAT CONFIRMS PRESS
Purpose and Description
This treatment consists of a pedestrian stainless steel push button with a piezo driven solid state switch that provides two types of feedback when the push button is pressed. First, the button is illuminated with a 1200 mcd red light emitting diodes (LED) for 0.1 s (Momentary LED Model) and second, a 2.6 kHz tone is sounded simultaneously with the LED flash when the button was pressed and a 2.3kHz tone was sounded when the button was released. The device could also be modified so the light remained on until the onset of the “WALK” indication. These buttons were installed at 17 intersections, typically with 2 buttons per intersection.
Figure 3.1 Picture of Pedestrian Push Button That Confirms Press
Notes: It was difficult to see the LED light in bright Florida sunlight. It appeared that the auditory feedback was more critical to the efficacy of the device. In areas with less bright sunlight the pilot light might be more salient. These buttons might also be of useful to visually impaired pedestrians because they confirm the button press. However, accessible call buttons with a locator tone would be preferred when taking into account the needs of visually impaired pedestrians.

Miami‐Dade Pedestrian Safety Project Final Report and Executive Summary
21
Table 3.1 Push the Button Confirming Press: Deployment Locations Listed by Corridor
Location Installation Qty CorridorAlton Rd. & 15th St. East-West Crosswalks 4 1Alton Rd & 16th St. East-West Crosswalks 4 1Alton Rd & 17th St. East-West South leg only 2 1Alton Rd. & 6th St. East-West Crosswalks 4 1Alton Rd. & 8th St. East-West Crosswalks 4 15th St. & Collins Ave. North-South on East leg only 2 25th St. & Meridian Ave. North-South Crosswalks 4 241st. St & Chase Ave. North-South Crosswalks 4 741st. St. & Royal Palm Ave. North-South Crosswalks 4 741st. St. & Pine Tree Drive North-South Crosswalks 4 7NE 163rd St. & 8th Ave. North-South Crosswalks 4 10NE 163rd St. & 12th Ave. North-South Crosswalks 4 10900 N. Miami Beach Blvd 2 Midblock Crosswalks 4 10NE 163rd St. & 15th Ave. North-South Crosswalks 4 10NE 163rd St. & 19th Ave. North-South Crosswalks 4 10NE 6th Ave. & 167th St. East-West Crosswalks 4 11NE 6th Ave. & 149th St. East-West Crosswalks 4 11
64
Federal Approval Status (MUTCD)
This pedestrian safety measure had federal approval status according to the Manual on Uniform Traffic Control Devices (MUTCD) when they were purchased.
Cost
The cost for each pedestrian push button was $105.00. The installation cost was $40.00 per call button for a total cost of $145.00 per installed button.
Availability
This product can be purchased off the shelf.
How/Who Installed
This device was installed by changing out existing push buttons that did not provide feedback when pressed. The project contractor installed this countermeasure.
Utility/Environmental Issues
None
Installation Challenges

Miami‐Dade Pedestrian Safety Project Final Report and Executive Summary
22
This device was easy to install. There were no challenges.
Maintenance Needs
These devices seem reliable and durable and are associated with minimal maintenance needs. Because these push buttons provide feedback when they are pressed we observed fewer multiple presses, which could extend the life of the buttons, reducing maintenance costs over conventional buttons.
3.2 DECREASE MINIMUM GREEN TIME
Purpose and Description
This treatment was installed at mid‐block traffic signals. It required the signal to be operated in isolation mode (non synchronous timing). The minimum green time was reduced to decrease pedestrian wait time and increase compliance with the signal. Three of these treatments were installed as indicated in table nine. Prior to the start of the study both signals were run in synchronous mode, and the cycle length was 130 s between 8 am and 8 pm at the Alton Road crosswalk and varied from 90 s to 120 s at the crosswalk on SW 8th Street. Minimum green time was evaluated at 30 s, 1 minute and 2 minutes at both crosswalks. The speed limits at these locations were 35 mph on Alton Rd. and 30 mph on SW 8th St.
Figure 3.2 Picture of Midblock Crossing with Reduced Minimum Green Time

Miami‐Dade Pedestrian Safety Project Final Report and Executive Summary
23
Table 3.2 Decrease Minimum Green: Deployment Locations Listed by Corridor Location Installation Qty Corridor
Alton Midblock between 14th St. and 14th Court
Minimum green time was reduced to 1 minute. 1 1
Midblock at 1300 8thMinimum green time was reduced to 1 minute. 2
outside zones
Midblock Crosswalk at Barry College
Minimum green time was reduced to 30 s. 2
outside zones
NE 5th St. East of NE 1st Ave.*
North and South side of crosswalk 1
outside zones
6* Note that city installed midblock crosswalk at this site.
Notes: This treatment markedly improved pedestrian compliance, and greatly reduced pedestrian wait time; however, switching from synchronous to isolated mode with a short minimum green time increased motorist delay. Therefore this treatment would be most likely to be installed in communities that value pedestrian flow or at sites where the trade‐off between pedestrian delay and safety balanced the increase in vehicle delay.
Federal Approval Status (MUTCD)
The signal timing changes made to deploy this treatment were in compliance with the MUTCD.
Cost
There are no hard costs associated with the deployment of this countermeasure. However, the installation of this countermeasure at NE 5th St. East of NE 1st Ave. includes the cost of installing the midblock signal.
Availability
This only requires signal‐timing changes. It is relatively easier to deploy if it can be done on a central traffic signal computer rather than making the changes at the signal cabinet.
How/Who Installed
The Miami‐Dade signals engineer and his staff deployed this countermeasure.
Utility/Environmental Issues
None
Installation Challenges
This countermeasure was easy to deploy. There were no challenges.
Maintenance Needs

Miami‐Dade Pedestrian Safety Project Final Report and Executive Summary
24
There are no maintenance requirements associated with this countermeasure.
3.3 VIDEO PEDESTRIAN DETECTION
Purpose and Description
This device uses video detection technology to detect the pedestrian and put in a call for a mid‐block traffic signal. An Autoscope Solo Pro was used for pedestrian detection in this study. The processor was included in the camera. The camera sent compressed video via twisted pair. Two rectangular zones were set up on the sidewalk approaching the curb; the pedestrian had to cross both zones to trigger the device. The device could determine direction of movement by the order in which the zones were crossed. With this method the pedestrian only put in a call when entering the crosswalk. This system was installed at one midblock traffic signal on Alton Road.
Figure 3.3 Picture of Device Used For Pedestrian Detection
Table 3.3 Video Pedestrian Detection: Deployment Locations Listed by Corridor Location Installation Qty Corridor
Alton Midblock between 14th St. and 14th Court East Side 1 1Alton Midblock between 14th St. and 14th Court West Side 1 1
2
Notes: This device was reasonably reliable in detecting pedestrians but it did not detect joggers that ran into the intersection and cyclists that rode into the intersection. It did not put in false calls.
Federal Approval Status (MUTCD)

Miami‐Dade Pedestrian Safety Project Final Report and Executive Summary
25
This pedestrian safety measure does not require special approval.
Cost
The cost for the complete video detection system was $14,250. The installation cost was $6252. to install the complete system.
Availability
This product can be purchased off the shelf.
How/Who Installed
Our contractor mounted this device on the mast arm pole. The manufacture assisted us in defining the departure rectangles and ensuring that the device worked correctly.
Utility/Environmental Issues
None
Installation Challenges
It would have been more difficult to install the device without the assistance of the manufacturer.
Maintenance Needs
They are unknown; however, it is likely that these devices should prove as reliable at similar devices currently used to detect vehicles.
3.4 LEAD PEDESTRIAN PHASE
Purpose and Description
The purpose of this device was to give a head start for pedestrians over left and right turning vehicles at the start of the WALK. Pedestrians crossing the main line receive a 4 second exclusive pedestrian phase while all vehicle signals remained in the all red phase. These vehicles lost 4 seconds of green time in order to give the pedestrians a 4 second exclusive pedestrian phase. This treatment provides the best protection from vehicles turning left and provides less protection from vehicles turning right because they may still turn right on red.

Miami‐Dade Pedestrian Safety Project Final Report and Executive Summary
26
Figure 3.4 Picture of Leading Pedestrian Phase
Notes: This treatment was effective at increasing yielding by drivers turning left but was not effective at improving the behavior of drivers turning right. Prohibiting right turn on red at the start of the WALK when a pedestrian pushed the call button should greatly improve the efficacy of this countermeasure.
Table 3.4 Lead Pedestrian Phase: Deployment Locations Listed by Corridor
Location Installation Qty Corridor
Alton Rd. & 16th St.Applied to intersection phasing. North & South legs 1 1
Alton Rd. & 6th St.Applied to intersection phasing. North & South legs 1 1
Alton Rd. & 8th St.Applied to intersection phasing. North & South legs 1 1
Collins Ave. & 15th St.Applied to intersection phasing. North & South legs 1 5
Collins Ave. & Lincoln Rd.Applied to intersection phasing. North & South legs 1 5
5
Federal Approval Status (MUTCD)
The signal timing changes made to deploy this treatment were in compliance with the MUTCD.
Cost
There were no hard costs associated with the deployment of this countermeasure.
Miami‐Dade Pedestrian Safety Project Final Report and Executive Summary
27
Availability
This treatment only requires signal‐timing changes. It is relatively easier to deploy if it can be done on a central traffic signal computer rather than making the changes at the signal cabinet.
How/Who Installed
The Miami‐Dade signals engineer and his staff deployed this countermeasure.
Utility/Environmental Issues
None
Installation Challenges
This countermeasure was easy to deploy. There were no challenges.
Maintenance Needs
There are no maintenance requirements associated with this countermeasure.
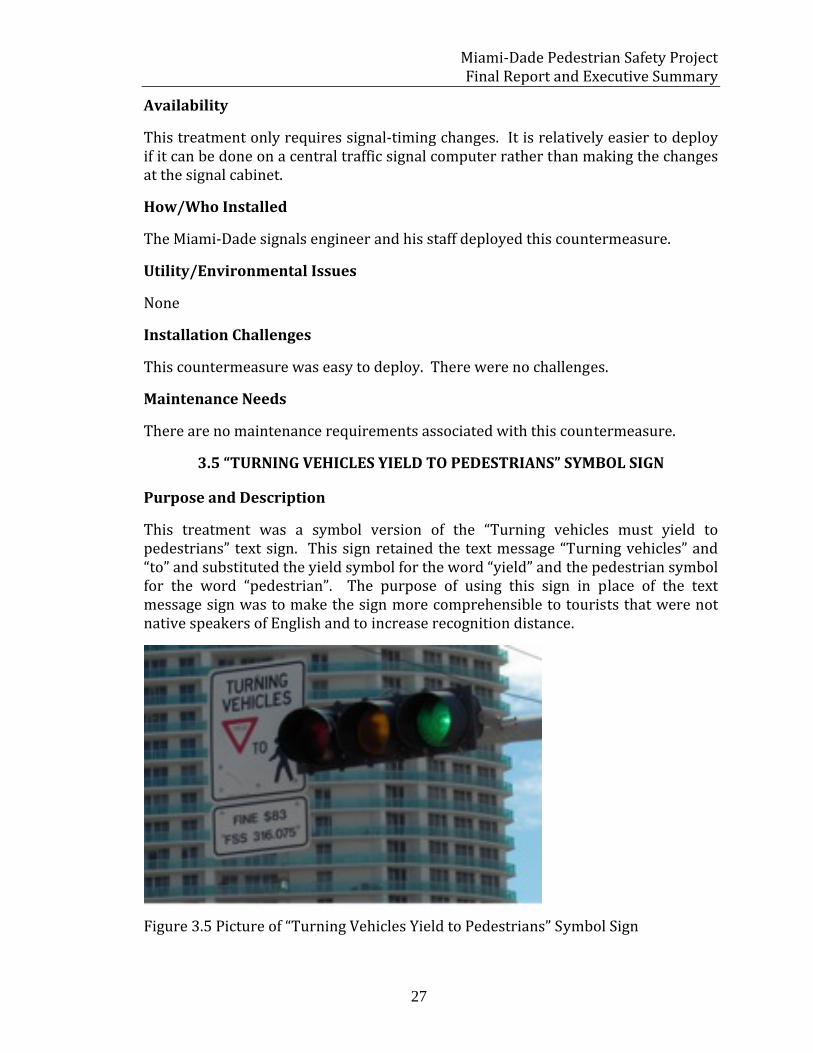
3.5 “TURNING VEHICLES YIELD TO PEDESTRIANS” SYMBOL SIGN
Purpose and Description
This treatment was a symbol version of the “Turning vehicles must yield to pedestrians” text sign. This sign retained the text message “Turning vehicles” and “to” and substituted the yield symbol for the word “yield” and the pedestrian symbol for the word “pedestrian”. The purpose of using this sign in place of the text message sign was to make the sign more comprehensible to tourists that were not native speakers of English and to increase recognition distance.
Figure 3.5 Picture of “Turning Vehicles Yield to Pedestrians” Symbol Sign

Miami‐Dade Pedestrian Safety Project Final Report and Executive Summary
28
Table 3.5 “Turning Vehicles Yield to Pedestrians” Symbols Sign: Deployment Locations Listed by Corridor
Location Installation Qty Corridor
Alton Rd. & 16th St.Facing minor street, E & W approaches 2 1
5th St. & Collins Ave. All approaches 4 2
5th St. & Jefferson Ave.Facing minor street, N & S approaches 2 2
5th St. & Meridian Ave. All approaches 4 2
5th St. & Michigan Ave.Facing minor street, N & S approaches 2 2
5th St. & Washington Ave. All approaches 4 2
Collins Ave. & 11th St.Facing minor street, E & W approaches 2 5
Collins Ave. & 14th St.Facing minor street, E & W approaches 2 5
Collins Ave. & 16th St. All approaches 3 5Collins Ave. & 17th St. W & N approaches only 2 5Collins Ave. & 21st St. All approaches 4 5Collins Ave. & 41st St W & N approaches only 2 6
Indian Creek & 41st St.Facing minor street, E & W approaches 2 6
Collins Ave. & 75th St. On N & W approaches 2 8Harding Ave. & 75th St. North-South on East leg only 2 8Indian Creek & 65th St. On E & S approaches 2 8Normandy Dr. & Bay Dr. On N & S approaches 2 8NE 163rd St. & 19th Ave. On S & W approaches 2 10NE 167th St, & NE 8th Ave. All approaches 4 10
49 Notes: This treatment was effective at increasing yielding at one site but ineffective at the other site.
Federal Approval Status (MUTCD)
This sign was tested under FHWA permission to experiment.
Cost
The cost for each sign was $25.00. The installation cost was $55.00 per sign for a total cost of $80.00 per installed sign.
Availability
Any sign shop can prepare this sign.
How/Who Installed
Our contractor mounted this device on the mast arm pole.
Utility/Environmental Issues

Miami‐Dade Pedestrian Safety Project Final Report and Executive Summary
29
None
Installation Challenges
There were no installation challenges involved in installing these signs. However deployment did require traffic control and the use of a truck with a mechanical arm to install the device on the mast arm.
Maintenance Needs
There are no maintenance requirements associated with this countermeasure.
3.6 ELECTRONIC “NO RIGHT TURN ON RED” (NRTOR) SIGN
Purpose and Description
This sign was illuminated when right turn on red was not permitted. The sign was installed on the mast arm in the same location that the static “No turn on red when pedestrians in crosswalk” sign and the “No turn on red” sign were installed. This allowed a direct comparison of all three signs.
Figure 3.6 Picture of Electronic No Turn on Red Sign
Notes: The electronic NRTOR sign reduced the percentage of motorists turning right‐on‐red when a pedestrian was present over that produced by the two static signs and reduced the percentage of conflicts between vehicles turning right on red and pedestrians crossing within the crosswalk over the other two signs. However there were many violators during all conditions. The electronic sign had an even larger effect on increasing the percentage of violators coming to a complete stop

Miami‐Dade Pedestrian Safety Project Final Report and Executive Summary
30
before turning right‐on‐red and almost eliminated free flow right‐on‐red turns that are most dangerous to pedestrians.
Table 3.6 Electronic “No Turn on Red” Sign: Deployment Locations Listed by Corridor
Location Installation Qty Corridor41st. St. & Pine Tree Dr. Facing North bound traffic 1 7
1
Cost
The cost for this sign was $3000.
Availability
These signs are available off the shelf. They need to be installed with a utility truck with an arm and bucket. These signs also have to be wired into the controller system.
How/Who Installed
Miami‐Dade County installed this sign on the mast arm pole.
Utility/Environmental Issues
None
Installation Challenges
There were no installation challenges involved in deploying this sign. However deployment did require traffic control and the use of a truck with a mechanical arm to install the device on the mast arm.
Maintenance Needs
There were no maintenance requirements associated with this countermeasure. However this sign will eventually need to be replaced or serviced after the service life of the lights has expired.
3.7 PEDESTRIAN COUNTDOWN SIGNALS
Purpose and Description
This treatment was a countdown pedestrian signal that displayed a walking person symbol during the "WALK" indication, counted down the seconds in the clearance phase along with the flashing hand display, and displayed the solid hand during The "DON’T WALK" indication which began during the all red phase. These signals were

Miami‐Dade Pedestrian Safety Project Final Report and Executive Summary
31
programmed to begin the countdown at the start of the pedestrian clearance (flashing hand) phase and counted down to 0 at the end of the yellow phase.
Figure 3.7 Picture of a Pedestrian Countdown Signal
Notes: The countdown displays decreased the percentage of pedestrian in the crosswalk during the all red phase and were associated with an increase in the percentage of pedestrians that pressed the call button as well as the percentage of pedestrians that pressed the call button that then waited for the WALK indication.
Federal Approval Status (MUTCD) This pedestrian safety measure has federal approval status according to the Manual on Uniform Traffic Control Devices (MUTCD). Cost The cost for each call button was $495.00. The installation cost was $45.00 per call button for a total cost of $540.00 per installed button. Availability This product can be purchased off the shelf. How/Who Installed This device was installed by changing out existing incandescent pedestrian signals that did not provide a countdown feature. The project contractor installed these devices. Utility/Environmental Issues None

Miami‐Dade Pedestrian Safety Project Final Report and Executive Summary
32
Table 3.7 Pedestrian Countdown Signals: Deployment Locations Listed by Corridor ` Installation Qty Corridor
Alton Rd. & 8th St. North & South legs 4 1Alton Rd. & 15th St. All legs 8 1Alton Rd. & Lincoln Rd. All legs 8 1Alton Rd. & 16th St. All legs 8 1Alton Rd. & 17th St. East, West & South legs 6 141st. St. & Alton Rd. All directions 8 741st. St. & Chase Ave. South, East & West legs 6 741st. St. & Royal Palm Ave. All directions 8 7163rd St. & 12th Ave. East & West legs 4 10163rd St. & 15th Ave. All legs 8 10163rd St & 18th Ave. all legs 8 10163rd St. & 19th Ave. East & West legs 4 10163rd St. & West Dixie Hwy East & West legs 4 10NE 167th St. & NE 2nd Ave. East & West legs 4 10NE 167th St. & NE 6th Ave. All legs 8 10NE 6th Ave & NE 145th St. North & South legs 4 11NE 6th Ave & NE 149th St. North & South legs 4 11
104 Installation Challenges These devices were easy to install. There were no challenges. Maintenance Needs These devices seem reliable and durable and are associated with minimal maintenance needs. They will eventually be replaced at the end of the LEDs lifetime.
3.8 “INSTREET YIELD TO PEDESTRIANS SIGNS”
Purpose and Description In‐Street Pedestrian Signs are intended for use at uncontrolled (not signalized) crosswalks to remind drivers of laws regarding pedestrians’ right‐of‐way. They are more noticeable than roadside signs and may also exert a minor traffic‐calming effect by effectively narrowing the inside lanes slightly. Dimensions and color: 12” x 44”, fluorescent yellow green diamond sheeting with 10” x 24” white high intensity sheeting inserts. Overall height is 47 inches. The signs can be installed with either a portable or fixed base.

Miami‐Dade Pedestrian Safety Project Final Report and Executive Summary
33
Figure 3.8 Picture of In‐street “Yield to Pedestrians” Signs
Notes: These signs were effective but had a very short lifespan. The streets were narrow and did not have a median island to protect the signs. We found that using three signs on each approach was no more effective than using one. Table 3.8 In‐street “Yield to Pedestrians” Signs: Deployment Locations Listed by Corridor
Location Installation Qty Corridor
Collins Ave. @ 6th St. These signs were placed facing North and South approaches 2 5
Collins Ave. @ 9th St.
These signs were be placed facing North and South approaches 2 5
Collins Ave. @ NE 13th St.
These signs were be placed facing North and South approaches 2 5
6
Federal Approval Status (MUTCD) This pedestrian safety measure has federal approval status according to the Manual on Uniform Traffic Control Devices (MUTCD) Section 2B.12, IN STREET PEDESTRIAN CROSSING SIGN (R1‐6, R16a). The legend “State Law” may be shown at the top of the sign if applicable. The legends “Stop For” or “Yield To” may be used in conjunction with the appropriate symbol. If a median island is available, the in‐street pedestrian crossing sign, if used, should be placed on the island.

Miami‐Dade Pedestrian Safety Project Final Report and Executive Summary
34
Cost The cost for each sign was $225.00. The installation cost was $50.00 per sign for a total cost of $275.00 per installed sign. Availability This product can be purchased off the shelf. How/Who Installed Our contractor installed these devices. Utility/Environmental Issues These signs were not durable enough to use on narrow roads with many large trucks making turning movements. Installation Challenges The primary challenge was maintaining the signs. Maintenance Needs The maintenance cost for these signs was excessive. The rectangular rapid flash beacon may be a more durable installation at these locations.
3.9 PEDESTRIANS ZONE SIGNS
Purpose and Description MUTCD R1‐6 signs may be used along with a plaque indicating the distance that pedestrians may be expected.

Miami‐Dade Pedestrian Safety Project Final Report and Executive Summary
35
Table 3.9 Pedestrian Zone Signs: Deployment Locations Listed by Corridor Location Installation Qty Corridor
Collins Ave. @ 75th St.
Pedestrian Crossing warning signs installed 30 ft North of Northernmost crosswalk facing Northbound traffic 1 8
Harding Ave. @ 75th St.
Pedestrian Crossing warning signs installed 30 ft South of Southernmost crosswalk facing Southbound traffic 1 8
NE 6th Ave. @ NE 141st St.
Pedestrian Crossing warning signs installed 30 ft North of Northernmost crosswalk facing Northbound traffic and 30 ft South of Southernmost crosswalk facing Southbound traffic 2 11
NE 6th Ave. @ NE 142nd Ave.
Pedestrian Crossing warning signs installed 30 ft North of Northernmost crosswalk facing Northbound traffic and 30 ft South of Southernmost crosswalk facing Southbound traffic 2 11
NE 6th Ave. @ NE 145th St.
Pedestrian Crossing warning signs installed 30 ft North of Northernmost crosswalk facing Northbound traffic and 30 ft South of Southernmost crosswalk facing Southbound traffic 2 11
NE 6th Ave. @ NE 149th St.
Pedestrian Crossing warning signs installed 30 ft South of crosswalk facing Southbound traffic 1 11
Collins Ave. & 16th St.
Pedestrian Crossing warning signs installed 30 ft South of crosswalk facing Southbound traffic 1 5
Collins Ave. & 14th St.
Pedestrian Crossing warning signs installed 30 ft South of Southernmost crosswalk facing Southbound traffic 1 5
11
Miami‐Dade Pedestrian Safety Project Final Report and Executive Summary
36
Notes: These signs had no effect on driver speed. It is unclear whether they contributed to the reduced level of crashes observed in this study. Federal Approval Status (MUTCD) This pedestrian safety measure has federal approval status according to the Manual on Uniform Traffic Control Devices (MUTCD). Cost The cost for each sign was $25. The installation cost was $45. per sign for a total cost of $70. per installed sign. Availability This product can be purchased off the shelf. How/Who Installed Our contractor installed these devices. Utility/Environmental Issues There were no issues. Installation Challenges There were no installation challenges. Maintenance Needs Signs are durable with a long lifetime unless struck by a vehicle.
3.10 SPEED TRAILERS
Purpose and Description Portable Changeable Message Speed Limit Signs, also known as “radar speed trailers,” are used to deter speeding. These devices can be installed along the side of the road; typically in parking areas, and display the speed of each approaching vehicle and can flash LEDs when the approaching vehicle is speeding. A speed limit sign is included on the trailer. Above a user‐selected maximum, the sign “blanks out” to avoid enticing drivers into exhibitions of speed. A computer within the device recorded speed data.

Miami‐Dade Pedestrian Safety Project Final Report and Executive Summary
37
Figure 3.9 Picture of a Speed Trailer
Notes: These signs reduced braking for pedestrians but had little effect on vehicle speed. One reason why the sign was ineffective in reducing vehicle speed was most vehicles were already driving within the speed limit.
Table 3.10 Speed Trailers: Deployment Locations Listed by Corridor
Location Installation Qty Corridor
Collins Ave. @ 32nd St.ITS Speed Trailer placed midblock before intersection 1 6
Collins Ave. @ 36th St.ITS Speed Trailer placed midblock before intersection 1 6
Collins Ave. @ 72nd St.ITS Speed Trailer placed midblock before intersection 1 8
3 Federal Approval Status (MUTCD) Changeable speed limit signs are approved in MUTCD Section 2B.13, Speed Limit Sign (R2‐1): “A changeable message sign that displays to approaching drivers the speed at which they are traveling may be installed in conjunction with a Speed Limit sign.” According to MUTCD guidelines “If a changeable message sign displaying approach speeds is installed, the legend YOUR SPEED XX km/h (MPH) or such similar legend should be shown. The color of the changeable message legend should be a yellow legend on a black background or the reverse of these colors.” For signs typically used on roadways with 45 MPH & greater speed limits the MUTCD specifies sign dimensions of 36 by 48 inch (18 inch high digits). For neighborhoods and school zones, the MUTCD specifies that the absolute minimum sign size allowed is 24 x 30 inches (12" high digits), and it provides for larger dimensions in increments of six inches "where speed, volume, or other

Miami‐Dade Pedestrian Safety Project Final Report and Executive Summary
38
factors result in conditions where increased emphasis, improved recognition, or increased legibility would be desirable" [2003 MUTCD 2B.03]. Cost The speed trailers were furnished by the City of Miami Beach. The estimated cost for each trailer was $25 per day. The estimated installation cost was $45 per trailer. Availability This product can be purchased off the shelf. How/Who Installed Speed trailers were loaned to the project by the City of Miami Beach. Utility/Environmental Issues No significant issues. Installation Challenges Speed trailers are common equipment items with municipal and law enforcement organizations. Maintenance Needs The primary maintenance issue was moving the signs. There is sufficient sunlight in Miami to ensure the signs remained charged.
3.11 RECTANGULAR LED RAPID FLASHING BEACONS
Purpose and Description This treatment was the standard pedestrian warning sign with two LED flashers attached (see Figure 1). The LED flashers were each 6 inches wide and 2.5 inches high placed 9 inches apart. Each unit was dual indicated (LED's on front and back). Each side of the LED beacon flashed in a wig‐wag flashing sequence (left, then right) the 2 large LED's in combination flashed 76 times in the wig‐wag flashing sequence during a 30 second cycle. Of the 2 large LED's, the Left LED, flashed 2 times (in a slower type of a rapid flash) each time it was energized followed by the Right LED, which flashed in a very fast rapid 3 flash volley when energized. The total number of flashes in this combination was 190 total flashes per 30 second cycle. Four signs along with beacons were installed at each crosswalk. The devices were linked by radio frequency transponders so a depression of any of the pedestrian call buttons immediately activated the flashers on all four signs. At the South Bayshore Drive crosswalk a sign was placed on the left side of each approach and on the right side of each approach at the median island. At the NW 67th Street site a sign along with beacons was placed on the left side of each approach and on the right side at a median just after the crosswalk on the northbound approach and before the
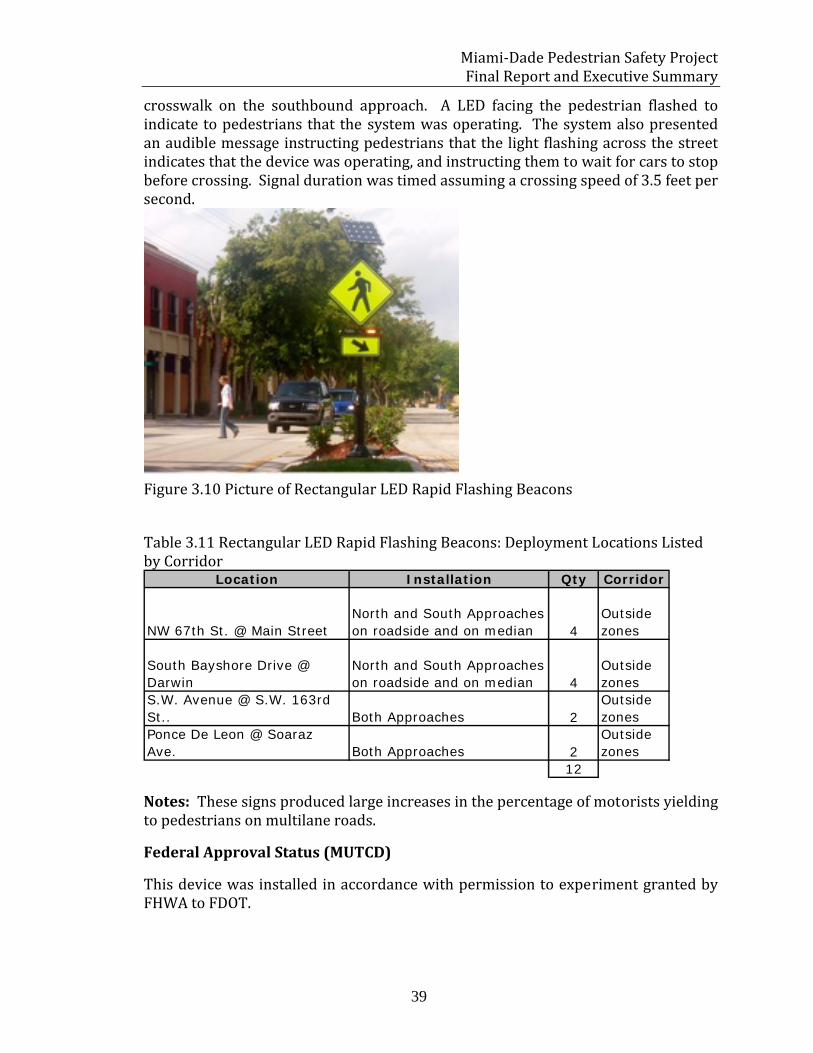
Miami‐Dade Pedestrian Safety Project Final Report and Executive Summary
39
crosswalk on the southbound approach. A LED facing the pedestrian flashed to indicate to pedestrians that the system was operating. The system also presented an audible message instructing pedestrians that the light flashing across the street indicates that the device was operating, and instructing them to wait for cars to stop before crossing. Signal duration was timed assuming a crossing speed of 3.5 feet per second.
Figure 3.10 Picture of Rectangular LED Rapid Flashing Beacons
Table 3.11 Rectangular LED Rapid Flashing Beacons: Deployment Locations Listed by Corridor
Location Installation Qty Corridor
NW 67th St. @ Main StreetNorth and South Approaches on roadside and on median 4
Outside zones
South Bayshore Drive @ Darwin
North and South Approaches on roadside and on median 4
Outside zones
S.W. Avenue @ S.W. 163rd St.. Both Approaches 2
Outside zones
Ponce De Leon @ Soaraz Ave. Both Approaches 2
Outside zones
12
Notes: These signs produced large increases in the percentage of motorists yielding to pedestrians on multilane roads.
Federal Approval Status (MUTCD)
This device was installed in accordance with permission to experiment granted by FHWA to FDOT.

Miami‐Dade Pedestrian Safety Project Final Report and Executive Summary
40
Cost
The cost for each sign installed sign unit was $15,000. The installation cost was included with the sign cost. The overall cost was $150,000.00 for these units. The cost was higher for the Miami‐Dade units because they required ornamental units that conformed with the surroundings.
Availability
This product can be purchased off the shelf.
How/Who Installed
The vendor installed these devices. Because the vendor installed these devices, there were no installation issues.
Utility/Environmental Issues
No significant issues.
Installation Challenges
Because the device relies upon radio frequency communication to link the devices, there is no need to install wiring under the roadway. Because the device is solar powered there is no need to connect power to the unit.
Maintenance Needs
These devices seem very reliable. The primary maintenance issue would be the repair or replacement of a unit if a vehicle strikes it.
3.12 DYNAMIC LIGHTING
Purpose and Description This treatment was used in conjunction with the rectangular LED rapid flashing beacons treatment described above. When a pedestrian pressed the call button to activate the beacon at night, the device was activated and LED white lighting illuminated the departure portion of the curb face and the first 4 feet of the crosswalk. This dynamic pad lighting consisted of four 2.5 by 1.25 inch housings each containing 3 LEDs.

Miami‐Dade Pedestrian Safety Project Final Report and Executive Summary
41
Figure 3.11 Picture of Dynamic Lighting
Table 3.12 Dynamic lighting: Deployment Locations Listed by Corridor Location Installation Qty Corridor
NW 67th St. @ Main StreetNorth and South Approaches on roadside and on median 4
Outside zones
South Bayshore Drive @ Darwin
North and South Approaches on roadside and on median 4
Outside zones
S.W. Avenue @ S.W. 163rd St.. Both Approaches 2
Outside zones
Ponce De Leon @ Soaraz Ave. Both Approaches 2
Outside zones
12 Notes: The LED lighting was not very bright compared with the rectangular rapid flashing beacon. There activation did not increase yielding above the level obtained with the beacons system alone.
Cost
The cost for the lighting feature was included in the price of the beacons. A switch was installed to allow researchers to turn the lighting feature on and off to evaluate its efficacy.
Availability
These signs are available off the shelf. However, they do require permission to experiment at this time.
How/Who Installed
The vendor installed this device.

Miami‐Dade Pedestrian Safety Project Final Report and Executive Summary
42
Utility/Environmental Issues
None were noted.
Installation Challenges
Because geometric features influence the location of the beacon system, in some cases the lighting did not fully illuminate the departure area of the crosswalk.
Maintenance Needs
There were no maintenance requirements associated with this countermeasure. However, the unit will eventually need to be replaced after the service life of the unit has expired.
3.13 NO PERMISIVE LEFT TURN
Purpose and Description
This treatment involved reconfiguring the signal heads to eliminate permissive left turns.
Notes: This treatment reduced conflicts between pedestrians and left turning vehicles. However many drivers violated the red immediately following the end of the protected left turn phase. It may be better to use a lagging left turn phase with this treatment.
Table 3.13 Eliminate permissive Left Turn: Deployment Locations Listed by Corridor
Location Installation Qty Corridor41st St. & Pine Tree East and West Direction 2 7
2 Cost
The cost for the signal change was $4,000.
Availability
The hardware needed to make this change is readily available.
How/Who Installed
Miami‐Dade County made the changes to the signal head and made the signal phase changes.
Utility/Environmental Issues
None
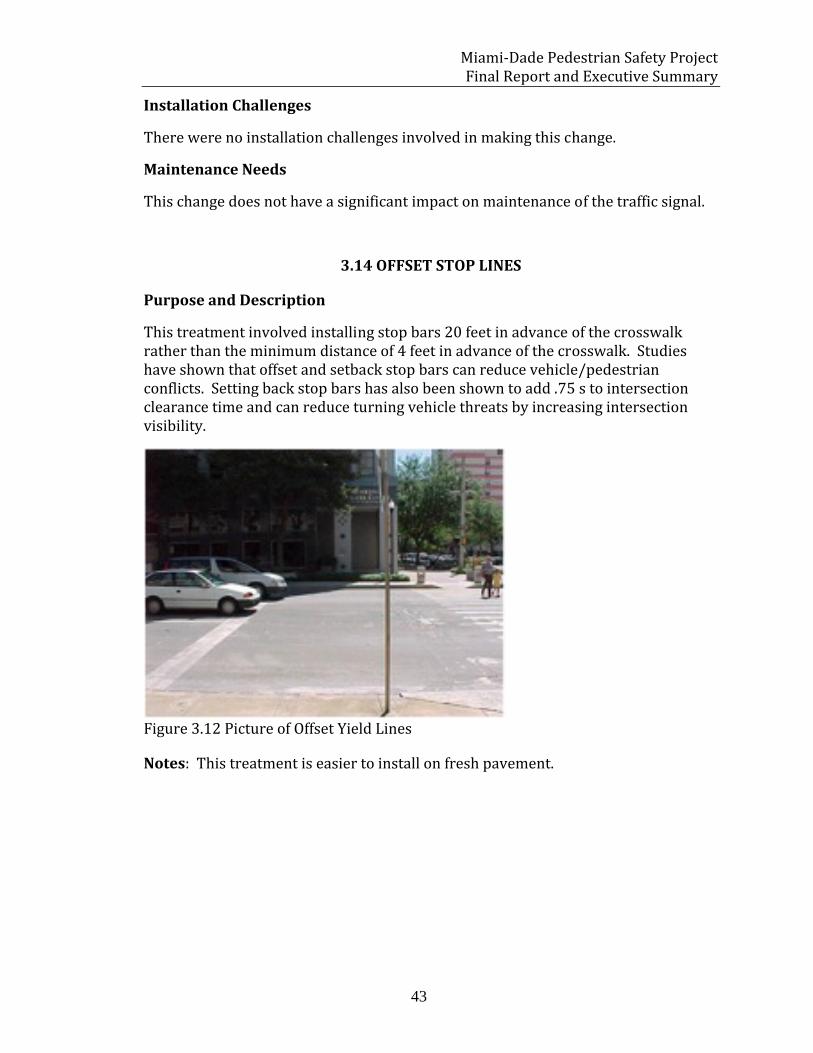
Miami‐Dade Pedestrian Safety Project Final Report and Executive Summary
43
Installation Challenges
There were no installation challenges involved in making this change.
Maintenance Needs
This change does not have a significant impact on maintenance of the traffic signal.
3.14 OFFSET STOP LINES
Purpose and Description
This treatment involved installing stop bars 20 feet in advance of the crosswalk rather than the minimum distance of 4 feet in advance of the crosswalk. Studies have shown that offset and setback stop bars can reduce vehicle/pedestrian conflicts. Setting back stop bars has also been shown to add .75 s to intersection clearance time and can reduce turning vehicle threats by increasing intersection visibility.
Figure 3.12 Picture of Offset Yield Lines
Notes: This treatment is easier to install on fresh pavement.

Miami‐Dade Pedestrian Safety Project Final Report and Executive Summary
44
Table 3.14 Offset Stop Lines: Deployment Locations Listed by Corridor Location Installation Qty Corridor
167th St. & 2nd Ave. All approaches to intersection 4 10168th St. & 6th Ave. All approaches to intersection 4 10169th St. & 8th Ave. All approaches to intersection 4 10170th St. & 12th Ave All approaches to intersection 4 10171st. St. & 15th Ave All approaches to intersection 4 10172nd St. & 16th Ave. All approaches to intersection 4 10173rd St. & 17th Ave All approaches to intersection 4 10174th St. & 19th Ave. All approaches to intersection 4 10175th St. & W. Dixie Highway All approaches to intersection 4 10
36
Cost
The cost to put down thermoplastic lines was $200.
Availability
This item is readily available.
How/Who Installed
Florida Department of Transportation installed the advance stop lines.
Utility/Environmental Issues
None
Installation Challenges
There were no installation challenges involved in deploying this counter measure.
Maintenance Needs
Moving the stop bar has do significant impact on maintenance of the markings.
3.15 ADVANCE YIELD MARKINGS
Purpose and Description
Advance yielding markings may be installed in advance of crosswalks at uncontrolled locations. Previous work has shown that advance yield markings placed 30 feet in advance of the crosswalk increases the distance that drivers yield in advance of the crosswalk. Advance yield markings were only installed at one site because the sign size specified in the 2003 manual was much smaller than the sign used in the research that supported the introduction of this marking into the manual.

Miami‐Dade Pedestrian Safety Project Final Report and Executive Summary
45
Figure 3.13 Picture of Advance Yield Markings
Notes: This treatment is designed to reduce multiple threat conflicts and therefore has been installed at the two multilane locations with the rectangular LED rapid flash beacon.
Table 3.15 Eliminate Permissive Left Turn: Deployment Locations Listed by Corridor
Location Installation Qty Corridor
Collins Ave @ 7th St.
These signs and markings were placed on he North and South Approaches 1 5
1
Cost
The cost for installing these markings was $200 each.
Availability
This item is available off the shelf.
How/Who Installed
Markings were installed by our Contractor on Collins @ 7th and by Miami‐Dade County at the Miami Lakes and Coconut Grove rectangular LED rapid flash beacon sites.
Utility/Environmental Issues
None
Installation Challenges

Miami‐Dade Pedestrian Safety Project Final Report and Executive Summary
46
It was not possible to get approval for the correct sign size. This issue will be resolved in the next version of the MUTCD.
Maintenance Needs
This marking does not have a significant impact on maintenance costs.

Miami‐Dade Pedestrian Safety Project Final Report and Executive Summary
47
CHAPTER 4 DATA ANALYSIS FOR PARTICULAR INDIVIDUAL COUNTERMEASURES
Figure 4.1 Picture of Data Collectors
4.1 INDIVIDUAL TREATMENT RESULTS
This chapter summarizes data collected for each countermeasure. Data were only collected at sample locations if a large number of a particular countermeasure was installed. When data were collected at multiple sites, care was taken to ensure that multiple treatments were not introduced at the same time. When new information was learned about a specific countermeasure, the study was submitted for publication. References are provided if the results of the study were published in a peer‐reviewed journal.
Although treatments were introduced along corridors, we decided to categorize treatments results by treatment rather than corridor because treatments were frequently implemented across corridors to better control for generalization across sites. For example, one installation of push buttons that confirmed the press would be installed in one corridor while another installation of push buttons that confirmed the press would be installed in a second corridor. This would require presenting the study twice or presenting half the data in the report for one zone’s report and presenting the other half of the data in the report on the second zone’s report. Instead we thought it best to keep the sites together for each experiment sorted by the type of application.
We also felt that crash data should parallel the zone headings because the focus of the collective treatments in each corridor was to reduce crashes in that corridor and because all countermeasures in each corridor work together to reduce crashes in

Miami‐Dade Pedestrian Safety Project Final Report and Executive Summary
48
that corridor. Therefore, we have treated crash data by corridor in the next section of this chapter.
4.1.1 Push Button That Confirms Press
Many pedestrian crashes involve pedestrians crossing during the "DON'T WALK" pedestrian signal. The purpose of this study was to evaluate the effects of push buttons that provide visual and audible feedback when pressed on: 1.) The proportion of cycles that a pedestrian pressed the call button; and 2.) the proportion of pedestrians pressing the call button that waited for the "WALK" sign. Data were collected at two busy intersections in Miami Beach with relatively high daily traffic flows. The installation of push buttons that provided visual and audible feedback when pressed was associated with a statistically significant increase in the percentage of cycles that pedestrians pressed the button, as well as a significant increase in the percentage of pedestrians pressing the button that waited for the "WALK" sign before crossing. Because behavior only changed when the new push buttons were installed and the push buttons were installed at a different point in time at each site, it was possible to rule out potential confounding variables such as weather, traffic flow and changes in the demographic characteristics of the pedestrian. The percentage of pedestrians crossing against the signal also decreased at both locations after the new push buttons were installed as did the percentage of pedestrians trapped in the middle of the road when crossing. Because push buttons that emit a visible and audible cue when they are pressed are relatively inexpensive, this treatment is a relatively cost effective way to increase the percentage of pedestrians who press the button and wait for the ‘Walk” sign before crossing. Accessible push buttons also acknowledge when they have been pressed. These data show that accessible buttons may benefit all pedestrians. The results of this intervention are summarized in Table 4.1. (These results were published in Transportation Research Record No. 1982 (Van Houten, Ellis, Sanda and Kim, 2006).

Miami‐Dade Pedestrian Safety Project Final Report and Executive Summary
49
Table 4.1 Results of Push Button Intervention
41st & Pine Tree Dr. Baseline Treatment Z score p-valueNumber of Cycles When a Pedestrian was present who could press the button 420 570% of cycles button pressed 33.8 58.1 7.673 0.01
% pedestrian that pressed button waited for WALK 51.2 72.5 4.91 0.01
% cycles pedestrian trapped 3.8 3.1 0.56 NS% cycles ped vehicle conflicts
Total of Pedestrians Crossing (includes those not pressing button 879 1044
% of all pedestrian violating signal 70.4 52.6 8.17 0.01
Alton & 16th St. Baseline Treatment Z score p-value
Number of Cycles When a Pedestrian was present who could press the button 600 810
% of cycles button pressed 41.83 54.2 4.633 0.01
% pedestrian that pressed button waited for WALK 82.09 85.93 1.937 0.05% cycles pedestrian trapped 4.7 2.4 2.293 0.025
% cycles ped vehicle conflicts
Total of Pedestrians Crossing (includes those not pressing button 1577 2490
% pedestrian violations 59.7 51.7 5.086 0.01
Very rare event
Very rare event

Miami‐Dade Pedestrian Safety Project Final Report and Executive Summary
50
4.1.2 The Effects of Varying Minimum Green Time
Pedestrians often do not wait for the "WALK" sign at signal‐controlled mid‐block crossings. Many factors may contribute to this phenomenon, but one variable could be wait time. It is likely that the major reason people try to cross against the signal at mid‐block signal‐controlled crosswalks, when there are gaps in traffic in the first half of the roadway, is the length of the average wait time for the WALK sign. It is common to have minimum green times of a minute or more on a main line at a signal‐controlled mid‐block crosswalk. If a pedestrian arrives early in the cycle they may become frustrated and attempt to cross a street in the presence of fast heavy traffic. The purpose of this study was to determine the effect of wait time on pedestrian signal compliance at two mid‐block crosswalks in Miami‐Dade County. One crosswalk traversed an arterial multilane road with two‐way traffic and the second crosswalk traversed a multilane road with one‐way traffic. At both crosswalks minimum green time was varied between 30 seconds and 120 seconds. The results indicated that pedestrian compliance decreased as minimum green time was increased and that compliance dropped more rapidly as minimum green time was increased at the location with the lower Average Daily Traffic counts (ADT) and one‐way traffic. Data also showed that the percent of pedestrians trapped at the centerline increased with increased minimum green time. The results of this intervention are summarized in Table 4.2. These results were published in Transportation Research Record No. 2002 (Van Houten, Ellis and Kim, 2007).
4.1.3 Video Pedestrian Detection
Pedestrians often consistently push the call button for the "WALK" sign at signal‐controlled mid‐block crossings. Many factors may contribute to this phenomenon, but one variable could be previous experience with long wait times. Another factor could be detection of a gap for the first half of the crosswalk after arrival at the crosswalk. This practice could lead to the pedestrians being trapped in the center of the roadway, and in the absence of a median a trapped pedestrian may select an inadequate gap for the second half of the crossing in their haste to get out of the roadway. If these pedestrians had pressed the call button, the signal may have changed while they were still trapped in the middle of the crossing, thereby affording some protection crossing the final half of the roadway. The purpose of this study was to determine whether video detection increases the percentage of pedestrian protected by the signal while crossing the second half of the crosswalk. The results indicated the treatment had a small but significant positive effect. The results of the Video Pedestrian Detection treatment are provided in Table 4.3.

Miami‐Dade Pedestrian Safety Project Final Report and Executive Summary
51
Table 4.2 Results of Varying Minimum Green Time Intervention
Mid Block Alton Rd. 30 sec 1 min 2 minNumber of Cycles When a Pedestrian was present who could press the button 150 600 840% pedestrian that pressed button waited for WALK 98 85 64
Z Score (p) Waited for WALK 7.78 (.01) 18.38 (.01)
% cycles ped vehicle conflicts
% cycles pedestrian trapped 0 19 23Z Score (p) Pedestrians Trapped 11.86 (.01) 15.84 (.01)
Pedestrian Delay in s 15 37 47Z Score (p) for Pedestrian Delay Z=6.25 (0.01) Z=12.287 (.01)N (Vehicle Delay in seconds) 641 (15) 2094 (7.525) 5960 (5.062)Z Score (p) value for Vehicle Delay 4.91 (0.01) 6.91 (0.01)
Mid Block 1300 SW 18th St. 30 sec 1 min 2 minNumber of Cycles When a Pedestrian was present who could press the button 270 90 840% pedestrian that pressed button waited for WALK 82% 65% 61%Z Score (p) Waited for WALK 4.49 (.01) 5.92 (.01)% cycles ped vehicle conflicts% cycles pedestrian trapped
Pedestrian Delay 13.7 18 30Z Score (p) for Pedestrian Delay Z-0.9333 (.05) Z-6.2148 (.01)N (Vehicle Delay in seconds)Z Score (p) value for Vehicle Delay
Data was not obtained
Data was not obtained
Not relevant (one-way traffic)
Very rare event
Very rare event

Miami‐Dade Pedestrian Safety Project Final Report and Executive Summary
52
Table 4.3 Results of Video Detection Intervention
MOEs Before After Statistic
Total Number of pedestrians crossing 752 485
% pedestrians pressing call button 42.89 36.36
two sample t test p = 0.3554
% pedestrian crossing during WALK 49.48 47.58
two sample t test p = 0.957
% of times video detector places a false call 0
% of times Video detector fails to a call when ped present 0
% of pedestrians completing crossing entire crosswalk during WALK 43.8 50.5
z test for proportions 1.625 not
sig
% of peds crossing 2nd half of crosswalk during WALK 51.3 61.6
two sample t test. p =0.625
% of peds crossing none of the crosswalk during WALK 48.7 38.4
two sample t test p = 0.1106
% of cycles with conflicts 0.94 0.25
ptest P = 0.456
% of cycles where a pedestrian is trapped 17 8
two sample t test p = .0453
Latency between button press and WALK not collected not collected not collectedThese findings are not significant because of the small sample size
4.1.4 Leading Pedestrian Phase
Motorists often fail to yield to pedestrians crossing in marked crosswalks at controlled locations. Several studies, have documented the benefits of providing a short exclusive pedestrian phase at the start of the "WALK" at four‐legged intersections. The purpose of this study was to examine the effect of a leading pedestrian signal phase (otherwise known as a lead pedestrian interval) at one four‐legged intersection and one three‐legged intersection in Miami Beach. The introduction of a brief leading pedestrian phase increased the percentage of drivers of left turning vehicles when a pedestrian was present yielding to the pedestrian

Miami‐Dade Pedestrian Safety Project Final Report and Executive Summary
53
starting to cross within four seconds of the start of the "WALK" which replicated previous work; however the study did not detect a change in the percentage drivers turning right yielding when a pedestrian was present. One reason for the absence of an effect for right turning vehicles was the high frequency of motorists making free flow right turns on red in Miami‐Dade County. Data also showed that button presses increased following the introduction of the Leading Pedestrian Interval (LPI) condition. It is possible that the increase in button pressing was related to the improvement in the percentage of left turning drivers yielding to pedestrians crossing within four seconds of the start of the "WALK" signal. The results of the Leading Pedestrian Phase Intervention are presented in Table 4.4.

Miami‐Dade Pedestrian Safety Project Final Report and Executive Summary
54
Table 4.4 Results of Leading Pedestrian Phase Intervention Alton and Lincoln Rd. Baseline Treatment Z score p-valueNumber of left turning vehicles 46 194Number of right turning vehicles 15 45% of left turning drivers yielding during WALK 40 58 3.933 0.01% of right turning drivers yielding during WALK 15 15 NA NANumber of cycles ped present who could have pressed button 169 431% of cycles someone pushed call button 69 76 1.91 0.05
% cycles ped vehicle conflictsTotal number of pedestrians that crossed 858 1121% of pedestrians crossing during first 4 s of WALK 45.3 76.5 14.72 0.01% of pedestrians in crosswalk at end of all red 2.1 2.4 0.45 >0.05
Collins & 16th St. Baseline Treatment Z score p-valueNumber of left turning vehicles 59 18Number of right turning vehicles% of left turning drivers yielding during WALK 22 31 1.952 0.05Number of cycles ped present who could have pressed button 781 185% of cycles someone pushed call button 36 51 2.866 0.01
% cycles ped vehicle conflictsTotal number of pedestrians that crossed 300 109% of pedestrians crossing during first 4 s of WALK 38 59 3.916 0.01
Very rare event
Very rare event

Miami‐Dade Pedestrian Safety Project Final Report and Executive Summary
55
4.1.5 “TURNING VEHICLE YIELD TO PEDESTRIANS” Symbol Sign
Motorists often fail to yield to pedestrians in marked crosswalks at controlled locations. Several studies have documented the benefits of text signs instructing drivers of turning vehicles to yield right‐of‐way to pedestrians. The purpose of the present study was to compare a symbol sign with the standard text sign currently in the Manual of Uniform Traffic Control Devices (MUTCD. After collecting baseline data on the percentage of drivers yielding right‐of‐way to pedestrians crossing legally in the crosswalk at two sites with the text sign present, the symbol sign was installed and additional data were collected. In order to control for possible confounding variables the signs were changed at a different point in time at each site. Data revealed a general decreasing trend in the percentage of drivers yielding to pedestrians over the course of the study. The introduction of the symbol sign produced an increase in the percentage of drivers turning right and left that yielded to pedestrians at the second site but did not alter the downward trend in the data. At the first site changing the sign at two of the four legs of the intersection produced no level change and the downward trend continued. One reason why the sign may have been less effective at the first site may be related to the fact that the sign only changed to the symbol sign on two rather than all four legs. These results, presented in Table 4.5, show the importance of monitoring data collection over time and using a staggered introduction of the treatment in order to control for possible confounding variables when studies only compare treatments at a small number of sites.
Table 4.5 Results of “TURNING VEHICLE YIELD TO PEDESTRIANS” Intervention
Collins Ave & 17th St. Baseline Treatment Z score p-valueNumber of crossing with turning veh present 330 570Number of Left Turning Vehicles 188 370% left turning vehicles yielding 59 51 neg 5.503 NSNumber of Right Turning Vehicles 217 432% right turning vehicles yielding 71 50 neg 6.573 NS% crossings with ped vehicle conflicts 3 2 0.409 NS% crossings with pedestrians trapped 2 3 0.979 NS

Miami‐Dade Pedestrian Safety Project Final Report and Executive Summary
56
Collins Ave & 21st St. Baseline Treatment Z score p-valueNumber of crossing with turning veh present 690 330Number of Left Turning Vehicles 487 207% left turning vehicles yielding 50 77 9.018 0.01Number of Right Turning Vehicles 371 132% right turning vehicles yielding 63 79 5.451 0.01% crossings with ped vehicle conflicts% crossings with pedestrians trapped 1 2 1.567 NS
No conflicts recorded
4.1.6 Electronic “NO TURN ON RED” Sign
Many drivers make right turns on red without stopping and some do so without even slowing more than they would if facing a green signal indication. This study compared the efficacy of a conditional "No Turn on Red When Pedestrians in Crosswalk" sign, the standard metal sign "No Turn on Red" (NTOR) sign and an electronic NTOR that is illuminated when a right turn on red is prohibited. The results of the experiment indicated 34 percent of drivers violated the NTOR prohibition with the conditional sign, and 41 percent violated it with the standard sign. The electronic sign reduced violations to 32 percent and they recovered to previous levels during a short return to the standard sign. Data also indicated that the percentage of violators making a full stop before violating NTOR increased from 29 percent and 31 percent for the conditional and standard NTOR sign during the baseline condition, to 78 percent with the electronic sign and to 65 percent during the short return to the standard NTOR sign condition. The results for violators making rolling stops or no stop at all show that the improvement in compliance was the result of equivalent large reductions in both types of violations. Data also indicated that the standard NTOR sign was associated with a decline in the percentage of violations when pedestrians were in the crosswalk, and that the electronic sign produced further declines in violations of pedestrian right‐of‐way. The results further documented a reduction of motor vehicle‐pedestrian conflicts with the electronic sign but not with the standard NTOR sign. Increasing compliance with the NTOR prohibition associated with the electronic NTOR sign was also associated with an increase in the percentage of drivers blocking the crosswalk and a smaller increase in the percentage of pedestrians that needed to walk around vehicles when the crosswalk was blocked. The results of the Electronic No Right Turn on Red Sign intervention are presented in Table 4.6.
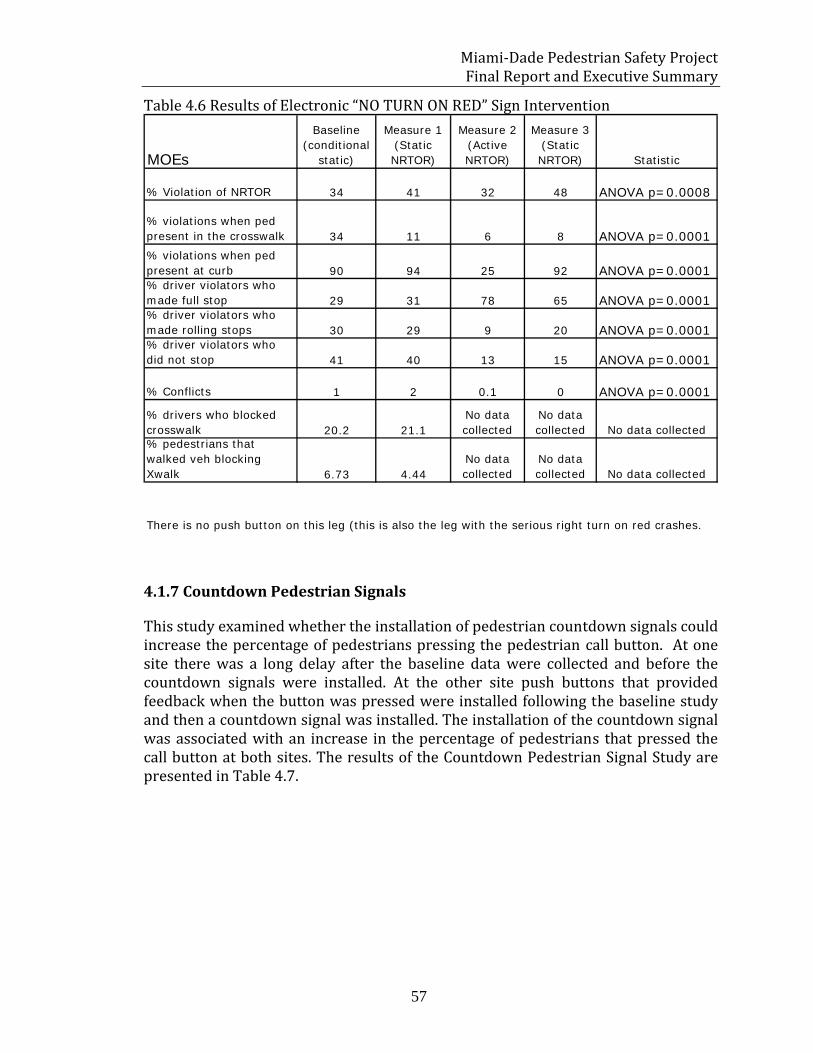
Miami‐Dade Pedestrian Safety Project Final Report and Executive Summary
57
Table 4.6 Results of Electronic “NO TURN ON RED” Sign Intervention
MOEs
Baseline (conditional
static)
Measure 1 (Static NRTOR)
Measure 2 (Active NRTOR)
Measure 3 (Static NRTOR) Statistic
% Violation of NRTOR 34 41 32 48 ANOVA p=0.0008
% violations when ped present in the crosswalk 34 11 6 8 ANOVA p=0.0001% violations when ped present at curb 90 94 25 92 ANOVA p=0.0001% driver violators who made full stop 29 31 78 65 ANOVA p=0.0001% driver violators who made rolling stops 30 29 9 20 ANOVA p=0.0001% driver violators who did not stop 41 40 13 15 ANOVA p=0.0001
% Conflicts 1 2 0.1 0 ANOVA p=0.0001
% drivers who blocked crosswalk 20.2 21.1
No data collected
No data collected No data collected
% pedestrians that walked veh blocking Xwalk 6.73 4.44
No data collected
No data collected No data collected
There is no push button on this leg (this is also the leg with the serious right turn on red crashes.
4.1.7 Countdown Pedestrian Signals
This study examined whether the installation of pedestrian countdown signals could increase the percentage of pedestrians pressing the pedestrian call button. At one site there was a long delay after the baseline data were collected and before the countdown signals were installed. At the other site push buttons that provided feedback when the button was pressed were installed following the baseline study and then a countdown signal was installed. The installation of the countdown signal was associated with an increase in the percentage of pedestrians that pressed the call button at both sites. The results of the Countdown Pedestrian Signal Study are presented in Table 4.7.

Miami‐Dade Pedestrian Safety Project Final Report and Executive Summary
58
Table 4.7 Results of Countdown Pedestrian Signals Study
MOEs
Alton and Lincoln Alton and 16th
Base
line
Cou
ntd
ow
n
Sta
tist
ic
Base
line
Butt
on
Aft
er
Sta
tist
ic
MOEsNumber of crossings 450 450 600 810 300
% Cycles the call button was pressed 35 95
31.13 (p=0.01) 40.3 62.7 79.7
19.5, p=0.01)
% peds in crosswalk at end of Flashing DON'T WALK 28 9
9.21 (p=0.01) 46.7 55 20.33
6.32 (p=0.01)
% Pedestrian violations 47.62 5.77
21.94 (p=0.01) 53.93 38.1 29.38
7.38 (p=0.01)
% conflicts 0.37 0.33 0.1 0.33 0 0.28.47
(p=0.01)
4.1.8 InStreet Pedestrian Sign
Motorists often fail to yield to pedestrians in marked crosswalks at uncontrolled locations. Several studies, including a recent NCHRP/TCRP study have demonstrated that the use of in‐roadway signs can significantly increase the percentage of motorists yielding to pedestrians at uncontrolled marked crosswalks. The 2003 Edition of the MUTCD includes two in‐street pedestrian signs that may be installed at uncontrolled locations but does not give precise directions as to where to place the sign in relation to the crosswalk. The purpose of the present FHWA study was to compare the effect of placing these signs at the crosswalk, 20 feet in advance of the crosswalk, 40 feet in advance of the crosswalk, and placing a sign at all three locations on driver yielding behavior. A counterbalanced multi element design was employed in this experiment. This design involves installing the sign at several different locations in advance of the crosswalk to determine if there is an optimum location to place the sign. After collecting baseline data at all three crosswalks on Collins Avenue in Miami Beach, Florida, the research team placed the sign at each of the three distances in advance of the crosswalk at each crosswalk location as well as at all three locations together in randomized blocks of trials to

Miami‐Dade Pedestrian Safety Project Final Report and Executive Summary
59
control for order effects. The data showed that the sign produced a marked increase in yielding behavior at all three crosswalks and that installing the signs at the crosswalk line was as effective as or more effective than installing it 20 or 40 feet in advance of the crosswalk. Data also indicated that placing the sign at all three locations at once was no more effective than placing the sign at the crosswalk line. These data suggest that the in‐roadway sign are likely effective because the in‐roadway placement is particularly salient to drivers. Because vehicles frequently struck the signs on Collins Avenue it is recommended that these signs be placed on median islands wherever possible to extend their useful life. The results of the In‐Roadway Yield to Pedestrians Signs are presented in Table 4.8. This study was published in Transportation Research Record No. 2002 (Ellis, Van Houten and Kim, 2007).
Table 4.8 Results of In‐Street Pedestrian Sign Study
Number of peds 400 440 240 240 240
% Yielding 32 78 75 70 79
Z score 12.93 10.18 8.65 11.52
P value 0.01 0.01 0.01 ,01
Number of peds 400 240 240 240 240
% Yielding 21 65 63 54 56
Z score 10.39 9.93 7.87 8.23
P value 0.01 0.01 0.01 0.01
Number of peds 1300 200 400 400 160
% Yielding 34 69 43 43 52
Z score 11.2 6.26 6.26 6.03
P value 0.01 0.01 0.01 0.01
Collins & 6th
Significant increase; 0 and 3 signs higher than 40
Collins & 9th
Significant increase
Collins & 13th
Significant increase; 0 and 3 signs higher than 20 & 40
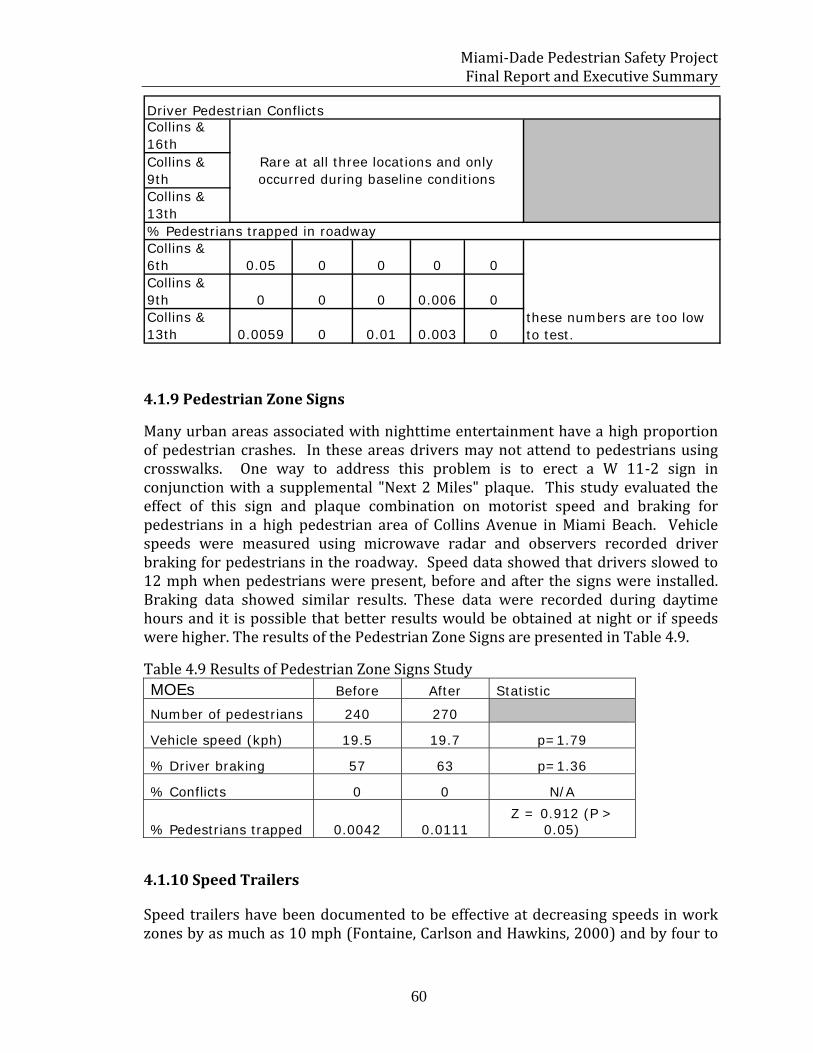
Miami‐Dade Pedestrian Safety Project Final Report and Executive Summary
60
Collins & 16thCollins & 9thCollins & 13th
Collins & 6th 0.05 0 0 0 0Collins & 9th 0 0 0 0.006 0Collins & 13th 0.0059 0 0.01 0.003 0
Driver Pedestrian Conflicts
Rare at all three locations and only occurred during baseline conditions
% Pedestrians trapped in roadway
these numbers are too low to test.
4.1.9 Pedestrian Zone Signs
Many urban areas associated with nighttime entertainment have a high proportion of pedestrian crashes. In these areas drivers may not attend to pedestrians using crosswalks. One way to address this problem is to erect a W 11‐2 sign in conjunction with a supplemental "Next 2 Miles" plaque. This study evaluated the effect of this sign and plaque combination on motorist speed and braking for pedestrians in a high pedestrian area of Collins Avenue in Miami Beach. Vehicle speeds were measured using microwave radar and observers recorded driver braking for pedestrians in the roadway. Speed data showed that drivers slowed to 12 mph when pedestrians were present, before and after the signs were installed. Braking data showed similar results. These data were recorded during daytime hours and it is possible that better results would be obtained at night or if speeds were higher. The results of the Pedestrian Zone Signs are presented in Table 4.9.
Table 4.9 Results of Pedestrian Zone Signs Study MOEs Before After Statistic
Number of pedestrians 240 270
Vehicle speed (kph) 19.5 19.7 p=1.79
% Driver braking 57 63 p=1.36
% Conflicts 0 0 N/A
% Pedestrians trapped 0.0042 0.0111 Z = 0.912 (P >
0.05)
4.1.10 Speed Trailers
Speed trailers have been documented to be effective at decreasing speeds in work zones by as much as 10 mph (Fontaine, Carlson and Hawkins, 2000) and by four to

Miami‐Dade Pedestrian Safety Project Final Report and Executive Summary
61
five mph in a second study (McCoy, Bonneson and Kollbaum, 1995). Studies have also documented that speed trailers are effective in reducing speeds on low‐speed urban roadways (Perillo, 1997), but the effects do not persist after the trailer is removed (Perillo, 1997) if there is no enforcement, but may persist if the trailer is associated with speed enforcement (Bloch, 1998). The purpose of this study was to examine whether speed trailers reduced speeds and increased braking when pedestrians were present. Participants were motorists driving on or pedestrians crossing Collins Avenue between 38th and 39th Streets. Although the speed trailer increased braking it failed to reduce speed. Because mean speed was 25 mph, which is below the posted limit, motorists may not have perceived a need to reduce their speed further. These data were recorded during daytime hours because at this time the number of pedestrians was highest although it is possible that better results would be obtained at night or at sites where speeds are higher. The results of the Speed Trailer study are presented in Table 4.10.
Table 4.10 Results of Speed Trailers Study MOEs Before After Statistic
Number of Peds 344 300
Number of Vehicles 644 549
Vehicle speed (mph) 26 26 Z=1.43
% Driver braking 44 53Z=2.288 (p=0.05)
% Conflicts 0 0 N/A
% Pedestrians trapped 0 0 N/A
4.1.11 Rectangular LED Stutter Flash
Motorists often fail to yield to pedestrians in marked multilane crosswalks at uncontrolled locations. Several studies have demonstrated that the use of advance yield markings along with a yield here to pedestrian sign can reduce the threat of multiple threat crashes but only have a small effect on overall driver yielding behavior. Several studies, including a recent NCHRP/TCRP study have demonstrated that the use of the HAWK signal can significantly increase the percentage of motorists yielding to pedestrians at uncontrolled marked crosswalks. This device has high compliance because it includes a red phase and a flashing red phase similar to the signals used at fire stations. Although this signal is highly effective its high cost limits its use to particularly risky crosswalks. A lower cost

Miami‐Dade Pedestrian Safety Project Final Report and Executive Summary
62
alternative to the HAWK signal is the use of rectangular LED rapid flash amber beacons with an irregular wig wag flash pattern installed on the pedestrian warning sign. We evaluated the rectangular LED rapid flash beacon at two multilane crosswalks in Miami Beach, Florida under FHWA permission to experiment as part of an FHWA Cooperative Agreement to evaluate ITS treatments to increase yielding behavior. A reversal design was employed in this experiment to demonstrate experimental control at each site. This design involves alternating sessions when the signals were activated with sessions when the device was not activated. The results showed that the rectangular LED rapid flash beacons produced a marked increase in yielding behavior at both crosswalks and that similar data were collected from staged pedestrians and local residents using the crosswalks. Data also indicated that the use of the device produced a reduction in evasive conflicts between drivers and pedestrians at both sites and a reduction in the percentage of pedestrians trapped in the center of the road at the crosswalk without a median island. This paper will appear in a future Transportation Research Record. 1
1 Shurbutt, J., Van Houten, R. & Turner, S. (in press). An Analysis of the Effects of Stutter Flash LED Beacons to Increase Yielding to Pedestrians Using Multilane Crosswalks. Transportation Research Record.

Miami‐Dade Pedestrian Safety Project Final Report and Executive Summary
63
Table 4.11 Results of Rectangular LED Stutter Flash Study Analysis of Variance comparing flasher and no flasher conditions on vehicle yielding to staged crossings at N.W. 67th & Main St. Source SS df F p Between Groups 30047.58 1 256.12 3.4057E-20*Within Groups 5279.39 45 Total 35326.97 46 Analysis of Variance comparing flasher and no flasher on vehicle yielding to local resident crossings at N.W. 67th & Main St. Source SS df F p Between Groups 29666.11 1 53.18 2.7388E-08*Within Groups 17849.71 32 Total 47515.82 33 Analysis of Variance comparing flasher and no flasher conditions on vehicles yielding to staged crossings at S. Bayshore Dr. & Darwin.Source SS df F p Between Groups 31518.61 1 467.9 2.51E-23*Within Groups 2627.11 39 Total 34145.72 40 Analysis of Variance comparing flasher and no flasher conditions on vehicle yielding to local residents on S. Bayshore Dr. & Darwin.Source SS df F p Between Groups 46885.34 1 148.85 3.6849E-13Within Groups 9449.52 30 Total 56334.87 31 Analysis of Variance comparing flasher and no flasher conditions on the percent of evasive conflicts at N.W. 67th & Main St.Source SS df F p Between Groups 159.02 1 6.63 0.01329Within Groups 1102.96 46 Total 1261.98 47 Analysis of Variance comparing flasher and no flasher conditions on the percent of evasive conflicts at S. Bayshore Dr. & Darwin.Source SS df F p Between Groups 105.14 1 13.85 0.0006Within Groups 280.75 37 Total 385.89 38 Analysis of Variance comparing flasher and no flasher conditions on pedestrians trapped between in the center of the road.Source SS df F p Between Groups 13222.24 1 82.47 1.8382E-11Within Groups 6734.10 42 Total 19956.34 43

Miami‐Dade Pedestrian Safety Project Final Report and Executive Summary
64
4.1.12 Dynamic Lighting
A second experiment evaluated the effects of illuminating the departure area with LED lighting when the rectangular LED rapid flasher beacon was activated at night. This treatment did not produce a further increase in yielding. It is likely that the salience of the LED stutter flash beacons overshadowed the effect of departure pad lighting. The results of the Dynamic Lighting study are presented in Table 4.12.
Table 4.12 Results of Dynamic Lighting Study
Source SS df F pBetween Groups 113.79 3 0.43 0.7335Within Groups 1762.83 20Total 1876.62 23
Analysis of Variance compariing total vehicle yielding and non-yielding during auxiliary pedestrian light on and off conditions at S. Bayshore Dr. at Darwin
4.1.13 Remove Permissive Left Turn Phase
Studies have consistently found higher crash rates for left turning movements at intersections over right turning movements. The use of a leading protected left turn phase reduces driver workload by eliminating the need to search for a gap in opposing traffic. Pedestrians are held during this condition to further improve safety. However, many pedestrians violate the pedestrian signal crossing during the protected left turn phase and drivers may not search for pedestrians assuming none will be crossing. If a permissive left turn phase follows the protected left turn phase pedestrians may fail to benefit from the introduction of a leading protected left turn phase. However, if permissive left turns are not permitted pedestrians should not encounter conflicts with turning vehicles unless drivers violate the signal. The purpose of this study is to compare pedestrian and vehicle violations and motor‐vehicle/pedestrian conflicts during a leading protected/permissive left turn condition vs. a leading protected without permissive left turn condition. Participants were pedestrians crossing the South leg of Pine Tree Drive at the intersection of 41st Street and West bound drivers on 41st. Street turning left onto Pine Tree Drive. Data were collected during daylight hours Monday through Saturday. The results of this study indicated changing from leading protected/permissive left turn phasing; to a leading protective/prohibited left turn phasing decreased motor vehicle/pedestrian conflicts. However, many pedestrians continued to cross when the cross traffic stopped at the start of the protected left turn phase in violation of the DON’T WALK signal even though there was a slight improvement in compliance. The improvement in compliance by pedestrians was more than offset by the high violation rate of drivers early during the prohibited left turn phase. These drivers were waiting in queue and attempted to squeeze through the beginning of the

Miami‐Dade Pedestrian Safety Project Final Report and Executive Summary
65
prohibited turn phase. A better way to increase the safety of pedestrians at busy intersections may be to use a lagging protected left turn phase rather than a leading protected phase. A lagging protected left turn phase would give pedestrians priority increasing pedestrian compliance. Furthermore, most pedestrians would clear the intersection before left turning vehicles are released. The results of the Remove Permissive Left Turn Phase study are presented in Table 4.13.
Table 4.13 Results of Remove Permissive Left Turn Phase Study
MOEs StatisticVeh
ProtectVeh Perm
Veh Protect
Veh Proh
Number of Left Turning Vehicles 3084 1560 1373 252
Number of Pedestrians Crossing 359 1807 105 684
Number of Conflicts 32 22 12 4
% of Conflictst=2.50
p=0.014 % pedestrians crossing
during WALKt=-6.31 p=0.00
% Pedestrians crossing during the protected LT
phase% vehicles turning left during permissive LT
phase NA% vehicles turning during protected LT
phaset=-20.22 p=0.00
% turning during prohibited LT phase NA15
16 13.3
34
66 85
Protected Permitted
Protected Prohibited
7.219 2
84 86.69
4.1.14 ADVANCE YIELD MARKINGS
This countermeasure was not evaluated.
4.1.15 OFFSET STOP LINES
This countermeasure was not evaluated.

Miami‐Dade Pedestrian Safety Project Final Report and Executive Summary
66
4.2 CRASH ANALYSIS All TREATED CORRIDORS
Data were collected for each corridor for 6 years prior to the introduction of the NHTSA project, for the 3 years that the NHTSA project was implemented, and for an additional 2 years that the FHWA project was implemented. This provides a total of 11 years of crash data along these high crash corridors. Figure 4.2.1 shows the crash rate for all eight treated corridors remained reasonably stable with a slight downward trend during the 6 years prior to the introduction of the NHTSA project. The introduction of the NHTSA project appeared to lead to a small decrease in pedestrian crashes form a mean of 101 during the baseline period to a mean of 87 (a decrease of 11.5%) during the three years that the NHTSA project was in effect. The installation of the engineering countermeasures on top of the NHTSA education and enforcement efforts lead to a further reduction to an average of 51 crashes per year. This represents a 50% reduction over the baseline level and a 41% reduction from the NHTSA project levels. It is interesting to note that during the 9 years prior to the FHWA project there were 15,472 pedestrian crashes in Miami‐Dade County. Of these 46% occurred on State and County Roads for a total of 7,117 crashes or 791 crashes per year. Around 100 per year or nearly 13% of these crashes occurred along the treated corridors.
Figure 4.2 Crashes per Year for All Eight Crash Corridors from 1996‐2006
96 97 98 99 00 01 02 03 04 05 06

Miami‐Dade Pedestrian Safety Project Final Report and Executive Summary
67
4.3 INDIVDUAL CORRIDOR CRASH DATA
4.3.1 41ST Street (Alton Rd. to Pine Tree Dr.)
It is interesting to note that crashes declined in each of the eight crash corridors. Data from each corridor is presented below. One corridor that was not particularly responsive to the NHTSA treatment but very responsive to the FHWA engineering treatments was 41st Street; Alton Road to Pine Tree Drive. This corridor had the highest percentage of daytime pedestrian crashes of all eight corridors (81%). The results for this location are presented in Figure 4.2.2. Crashes averaged 7 per year during baseline, 5.3 per year during the NHTSA program, and 2 per year during the FHWA program. This corridor received a large number of countdown timers, push buttons that confirmed the press, the no right turn on red electronic sign, and the prohibited permissive left turn treatment. Data for this corridor are presented in Figure 4.3.
Figure 4.3 Crashes per Year for 41st St.; Alton Rd. to Pine Tree Dr. 1996‐2006
4.3.2 NE6TH St. (NE 141ST St. to NE 151ST St.)
Another corridor that responded well to the engineering treatments was NE 6th St. (NE 141st St. to NE 151st St.). Many of the pedestrians struck in this corridor were children who were hit in crosswalks near the school. This corridor
96 97 98 99 00 01 02 03 04 05 06

Miami‐Dade Pedestrian Safety Project Final Report and Executive Summary
68
had the highest percentage of crashes involving children and youth (34%) and the highest percentage of crashes involving African American pedestrians (73%). During baseline crashes averaged 7.7 per year at this site and maintained at 8.0 during the three years of the NHTSA project. The FHWA project was associated with at reduction in crashes to 3 per year. This site also received countdown timers and push buttons that confirmed the press at high crash intersections and a large number of pedestrian zone signs. Data from this site are presented in Figure 4.4.
Figure 4.4 Crashes per Year Along NE 6th St. (NE 141st St. to NE 151st St.) from 1996 to 2006
4.3.3 NE 163RD St. (NW 2ND Ave. to Biscayne Blvd)
The corridor that showed the largest improvement also had the highest number of crashes per year during baseline, the second highest percentage of African American pedestrians struck during baseline (41%), and the second highest percentage of senior pedestrians struck during baseline (28%). Baseline data show a downward trend during the baseline period. This corridor had the second highest percentage of pedestrian crashes involving turning vehicles (60%). This large corridor along NE 163rd St. had 25.8 crashes per year during baseline, crashes declined to 20.7 crashes per year during the NHTSA project and declined further to 8 per year during the FHWA project. This corridor also received the largest number of countermeasures. This corridor had a large number of countdown pedestrian signals and push buttons that confirmed the press installed. This site also received ‘Turning Vehicles Yield To
96 97 98 99 00 01 02 03 04 05 06

Miami‐Dade Pedestrian Safety Project Final Report and Executive Summary
69
Pedestrians” symbol signs, and a large number of offset stop lines. Data for this corridor are presented in Figure 4.5.
Figure 4.5 Crashes per Year NE 163rd St. (NE 2nd Ave to Biscayne Blvd.) from 1996 to 2006
4.3.4 Collins Ave (5TH St. to 24TH St.)
This corridor on Collins Ave. between 5th St. and 24th St. was in the middle of the South Beach recreational area. Therefore it is not surprising that this corridor had the highest percentage of nighttime crashes of all eight corridors (55%). During baseline there were 18.8 pedestrian crashes per year along this corridor. During the NHTSA project there were 20 crashes per year. The introduction of the FHWA project was associated with a decline in crashes to 13 per year. One of the treatments that was effective along this corridor was the in street pedestrian signs. Unfortunately these signs did not stand the test of time and were only in effect for a relatively short period of time. This corridor also received a couple of lead pedestrian intervals, a large number of “Turning vehicles yield to pedestrians” symbol signs, some pedestrian zone signs, and one advance yield marking. Crash data are presented in Figure 4.6.
96 97 98 99 00 01 02 03 04 05 06

Miami‐Dade Pedestrian Safety Project Final Report and Executive Summary
70
Figure 4.6 Crashes per Year Collins Ave. (5th Street to 24th St.) from 1996 to 2006
4.3.5 Collins AveIndian Creek (28TH St. to 43RD St.)
This corridor is immediately adjacent to the Collins Ave (5th to 24th St.) corridor. Treatments installed along this corridor included “TURNING VEHICLES YIELD TO PEDESTRIANS” symbol signs, and the use of the speed trailer, Crashes averaged 7 per year during the baseline period along this corridor, 5.3 per year during the NHTSA project and 3 per year during the FHWA project. The graph of the yearly crash data is shown in Figure 4.6. Although the average number of crashes is lower during the FHWA study there are too few crashes and too much overlap to conclude much about the efficacy of the treatment at this location.
96 97 98 99 00 01 02 03 04 05 06

Miami‐Dade Pedestrian Safety Project Final Report and Executive Summary
71
Figure 4.7 Crashes per Year Collins Ave. (Indian Creek 28th St. to 43rd St.) from 1996 to 2006
4.3.6 Collins Ave & Harding Ave. (65TH St. to 75TH St.)
This crash corridor had the highest percentage of crashes involving turning vehicles during baseline of all of the selected corridors averaging 80% and the highest percentage of pedestrians struck over the age of 65 years (49%). Treatments installed along this corridor included “Turning vehicles yield to pedestrians” symbol signs, pedestrian zone signs, and the speed trailer. During the baseline condition the number of crashes per year averaged 14.3, during the NHTSA project crashes averaged 13 per year and during the FHWA project they averaged 9.5 per year. Overall it appeared the treatments were only moderately effective at this site. A graph of the yearly crash data is shown in Figure 4.8.
96 97 98 99 00 01 02 03 04 05 06
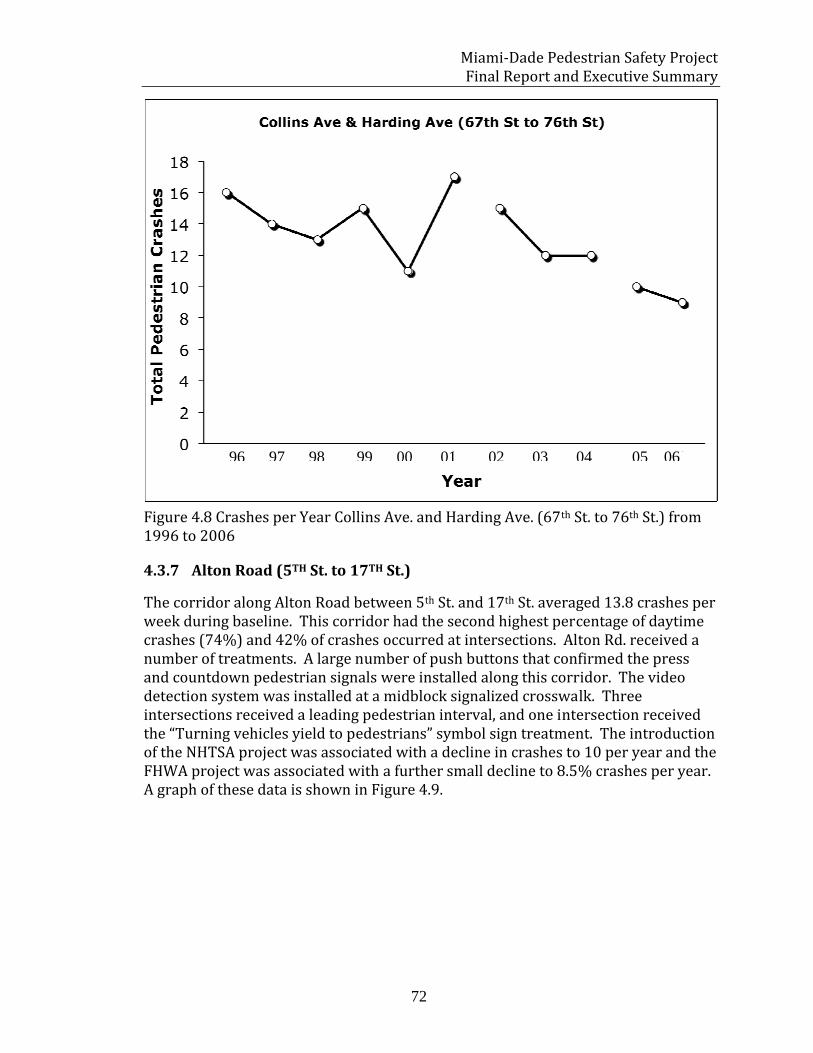
Miami‐Dade Pedestrian Safety Project Final Report and Executive Summary
72
Figure 4.8 Crashes per Year Collins Ave. and Harding Ave. (67th St. to 76th St.) from 1996 to 2006
4.3.7 Alton Road (5TH St. to 17TH St.)
The corridor along Alton Road between 5th St. and 17th St. averaged 13.8 crashes per week during baseline. This corridor had the second highest percentage of daytime crashes (74%) and 42% of crashes occurred at intersections. Alton Rd. received a number of treatments. A large number of push buttons that confirmed the press and countdown pedestrian signals were installed along this corridor. The video detection system was installed at a midblock signalized crosswalk. Three intersections received a leading pedestrian interval, and one intersection received the “Turning vehicles yield to pedestrians” symbol sign treatment. The introduction of the NHTSA project was associated with a decline in crashes to 10 per year and the FHWA project was associated with a further small decline to 8.5% crashes per year. A graph of these data is shown in Figure 4.9.
96 97 98 99 00 01 02 03 04 05 06

Miami‐Dade Pedestrian Safety Project Final Report and Executive Summary
73
Figure 4.9 Crashes per Year on Alton Rd. 5th St. to 17th St.) from 1996 to 2006
4.3.8 5TH St. (Alton Rd. to Ocean Dr.)
The final graph shows the number of crashes occurring on 5th St. between Alton Rd. and Ocean Drive. More than half the crashes along this corridor occurred at night and only 23% involved turning vehicles. Treatments installed along this corridor included push buttons that confirmed the button press, and “Turning vehicles yield to pedestrians” symbol signs. During the baseline condition pedestrian crashes averaged 6.5 per year. After the NHTSA program was introduced these crashes declined to 4.7 per year and following the introduction of the FHWA project crashes declined to 4 per year. Figure 4.10 shows crashes at this site. Overall there were not a large number of crashes along this corridor and it is difficult to determine whether the treatments had an effect.
96 97 98 99 00 01 02 03 04 05 06
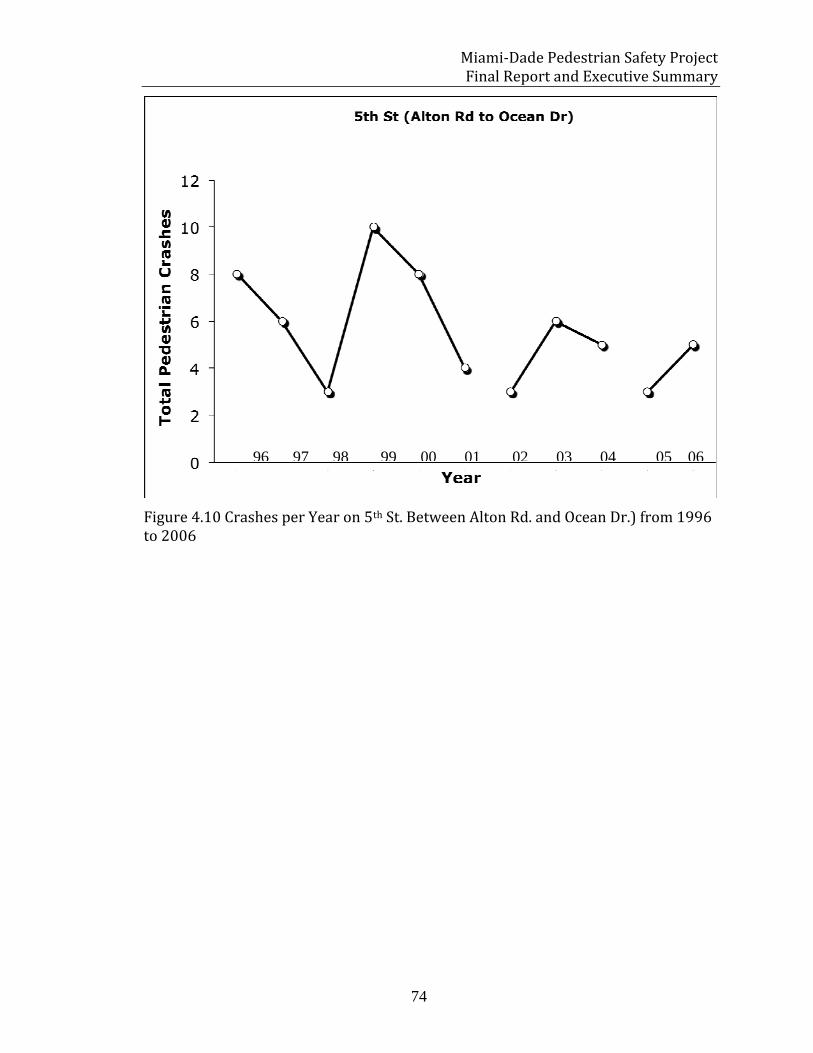
Miami‐Dade Pedestrian Safety Project Final Report and Executive Summary
74
Figure 4.10 Crashes per Year on 5th St. Between Alton Rd. and Ocean Dr.) from 1996 to 2006
96 97 98 99 00 01 02 03 04 05 06

Miami‐Dade Pedestrian Safety Project Final Report and Executive Summary
75
CHAPTER 5 OUTREACH AND EDUCATION
All of the traffic control devices deployed in this study were intuitive or passive in nature and therefore required little outreach and awareness training. Countdown pedestrian signals, offset stop lines, push buttons that confirm the button press, automatic pedestrian detectors (passive in nature), a leading pedestrian phase, "Turning vehicles yield to pedestrians" signs, in roadway signs, elimination of permissive left turns, dynamic NTOR signs, the rectangular LED stutter flash, dynamic lighting (passive in nature), pedestrian zone warning signs, shorter minimum green waiting times, and advance yield markings are familiar to motorists and pedestrians. Therefore outreach and awareness focused on continued enforcement along with a continuation of the general educational countermeasures deployed as part of the NHSTA Miami Dade Contract that begun prior to the FHWA Cooperative Agreement. On of the team members on the Cooperative Agreement (David Henderson of the Miami‐Dade MPO) coordinated these efforts. These ongoing outreach and awareness measures are summarized below:
1. Pedestrian safety message posters mounted in bus and Metrorail trains. These included six different messages aimed at increasing pedestrian safety practices and were written in English, and Spanish.
2. WalkSafe Program and Ryder Trauma Center Classroom Education—program aimed at reducing the incidence of children struck by vehicles by educating elementary school‐aged children, teachers, parents and their communities about traffic safety. The program used an educational training intervention, appropriate engineering countermeasures, and an enforcement component to help achieve its goal. An evaluation of the program can be found in Hotz and colleagues (2004).
3. Walk to School Day Sponsored by SAFE KIDS Walk This Way—Thousands of students from 8 schools participated in Walk to School Day. The National SAFE KIDS Campaign provided banners, signs, pedestrian safety pamphlets, and safe walking surveys.
4. Pedestrian Education by the Community Affairs Bureau of the Miami‐Dade Police Department—The Pedestrian Safety Section of the Miami‐Dade Police Department’s Community Affairs Bureau made numerous traffic safety presentations in schools, distributed several safety booklets and materials, and helped establish the WalkSafe Miami program.
5. Haitian Creole Elementary School and Older Pedestrian Safety Education Programs—the elementary school program consisted of four 45‐minute workshops conducted at three elementary schools, reaching 389 children. Both programs were supported by radio advertisements, Haitian web sites, a brochure in Haitian Creole, and Haitian Creole trading cards.

Miami‐Dade Pedestrian Safety Project Final Report and Executive Summary
76
6. Brochure: Safety Tips for Pedestrians in Haitian Creole—pamphlet that provides pedestrian safety advice to adults.
7. Heroes of Haitian Independence Trading Cards—four cards that each depict a hero of Haitian independence on one side and provide pedestrian safety tips on the other.
8. Walk Safely Brochures in English and Spanish were delivered to the Miami‐Dade school board, hospitals, public libraries, and police departments.
9. Workshops provided by the Miami‐Dade MPO pedestrian‐bicycle coordinator to older pedestrian groups on pedestrian safety.
10. More than 400 posters on nighttime conspicuity were delivered to organizations to display in public buildings.
11. Public Service Announcements (PSAs)—PSAs about pedestrian safety were distributed and broadcasted on city and county access channels in Spanish and English and on selected Spanish speaking radio stations.
12. Brochure: Pedestrian, Walk Safely—brochure providing families with the pedestrian safety advice in both English and Spanish. Brochures were delivered to organizations such as the Miami‐Dade School Board, hospital, public library, police departments, and elected officials’ offices.
13. Walking Through the Years: Pedestrian Safety for the Older Adult—booklet prepared for older (65+) adults and implementers of programs for older adults. Brochures were delivered to organizations such as the Miami‐Dade School Board, hospital and medical departments, retirement homes, public library, police departments, elder affairs, and elected officials’ offices.
14. Caminando a Traves de los Anos: Seguridad para Peatones de Tercera Edad (65+)—booklet in Spanish prepared for implementers of pedestrian programs for the older (65+) adult. Brochures were delivered to organizations such as the Miami‐Dade School Board, police departments and elected officials’ offices.
15. Enforcement of Driver Yielding Behavior Study, Two Police Pedestrian Safety Training Programs, and Enforcement—Van Houten and Malenfant (2003) conducted a study of driver yielding behavior at four crosswalks in each of two—an east and west—high crash corridors in the City of Miami Beach. In one year, police stopped 2,006 motorists for failing to yield to pedestrians, with 1,218 of these stopped during the first two weeks of the program. Three hundred thirty nine citations were issued, of which 188 were given during the first two weeks of the program. For enforcement results, review Van Houten and Malenfant (2003). Additionally, police officers in Miami Beach and Miami Springs received training on pedestrian safety and enforcement activities that have been used to address a variety of violations

Miami‐Dade Pedestrian Safety Project Final Report and Executive Summary
77
and behaviors that often lead to collisions between pedestrians and motor vehicles.
16. Walking Through the Years: Pedestrian Safety for Your Child brochures (in English and Spanish) were distributed to the Miami‐Dade School Board, hospital and medical departments, public libraries, and police departments. These brochures provided safety guidelines to parents and caregivers to help protect children from pedestrian crashes.

Miami‐Dade Pedestrian Safety Project Final Report and Executive Summary
78
CHAPTER 6 PHASE II CONCLUSIONS
6.1 LESSONS LEARNED
6.1.1 Lessons Learned: Overall Project Success
The project was successful in demonstrating the ability of a local government/university team to develop a data based plan to improve pedestrian safety, focusing on higher‐injury areas, and then to implement and evaluate this plan. The positive aspect of the program was the focus on low cost innovative engineering improvements to address pedestrian crashes in each corridor. It also provided an opportunity for the Miami‐Dade team to take a cooperative approach with FHWA and the other two teams to identify best practices in pedestrian safety.
Because Miami‐Dade had the previous experience with the NHTSA project that emphasized education and engineering countermeasures, the Miami‐Dade team was well positioned to continue these extensive measures and to build on them to implement a complete multifaceted triple E program with heavy emphasis on Engineering, Education and Enforcement.
The focus on low cost engineering provides a model of what is possible in the absence of a large corridor wide engineering project. The Florida Department of Transportation often implements corridor wide safety projects that involve large scale improvements. These projects typically produce large benefits for all road users. In this project rather meager resources were utilized to produce large changes in 8 corridors that lead to significant crash reductions.
The federal funding was extremely helpful and appreciated as was the enhancements provided by FDOT and Miami‐Dade County that assisted us in demonstrating the effectiveness of targeted low cost improvements.
6.1.2 Crash Reductions
The most important lesson learned was that inexpensive pedestrian safety engineering measures could produce a very significant reduction in crashes when introduced on top of an existing public education and enforcement program focusing on pedestrian safety. The installation of the engineering countermeasures on top of the NHTSA education and enforcement efforts lead to a reduction of 51 crashes per year for all sites. This represents a 50% reduction over the baseline condition and a 41% reduction from the NHTSA project levels. Because we selected high crash corridors and the crash reduction was so large, the overall reduction in our 8 corridors represented a 6.5% reduction in all crashes on State and County roads in Miami‐Dade County.

Miami‐Dade Pedestrian Safety Project Final Report and Executive Summary
79
6.1.3 Lessons Learned from Experimentation
A number of lessons were learned from the experimentation conducted as part of this study and the results have been published in four papers in Transportation Research Record. Additional papers will be submitted for publication this year.
Highlights of Research Results
• That the probability of a pedestrian violation at midblock signals is a joint function of perceived risk and wait time. Reducing wait time leads to very high levels of compliance.
• That the in street pedestrian sign is best placed close to the crosswalk, and that no advantage is gained by installing multiple signs.
• That pedestrian push buttons that confirm the press lead to more pedestrians pressing the button and more pedestrians that press the button waiting for the WALK indication.
• That the rectangular LED rapid flash beacon is associated with high levels of yielding on multilane high volume roads during the day and night.
• That the electronic NRTOR signs lead to fewer pedestrian conflicts with vehicles turning right‐on‐red and that more drivers who violated first came to a full stop, while many during baseline initiated free flow right turns on red.
• That eliminating permissive left turns reduces conflicts between pedestrians and left turning vehicles. It was also learned that many pedestrians attempt to cross during the vehicle protected phase before and after the no permissive left turn treatment was introduced and some drivers violate the no left turn signal just after the end of the protected left turn phase. It is recommended that a lagging protected left turn condition be considered instead of leading protected left turn condition.
• That the “Turning vehicles yield to pedestrians “ symbol sign appeared no more effective than the conventional test message sign.
6.1.4 Lessons Learned: Implementation
• Coordinating improvements with other agencies, especially FDOT was of critical importance to the success of this project. We were fortunate to have the full involvement of FDOT District 6 and Miami‐Dade County senior staff.
• Developing and implementing a comprehensive pedestrian safety plan requires a long time frame. This project took over six years, including almost two years for planning, two years for design/procurement/approvals, and

Miami‐Dade Pedestrian Safety Project Final Report and Executive Summary
80
two years for implementation and evaluation. However, this time frame was partly the result of several hurricanes that damaged equipment and lead to a long‐term backlog in installation schedules because of the extent of the damage to the traffic infrastructure that needed to be repaired. We were also delayed getting as‐built plans because of new Homeland Security requirements.
• It was critical having a dedicated and highly competent pedestrian bicycle coordinator who had good relationships with all members of the team and was able to serve as a catalyst in getting things done. This project would have been difficult to achieve without his support.
• There are a wide range of pedestrian safety countermeasures available that can be tailored to specific location characteristics. A package of such measures can reduce vehicle/pedestrian conflicts, increase driver yielding, and bring about other changes in driver and pedestrian behavior that were associated with crash reductions.
• Particularly cost‐effective countermeasures appear to be: countdown pedestrian signals; push buttons that confirm the press; rectangular LED rapid flashing beacons; reducing minimum green time; advance stop lines; and the use of a lead pedestrian phase.
• Low‐cost but effective measures have the advantages of quick implementation and the potential to draw support and funding for further improvements.

Miami‐Dade Pedestrian Safety Project Final Report and Executive Summary
81
REFERENCES
This section will be completed and included in the Final Report. Abdulsattar, H. N. , M.S. Tarawneh, P.T. McCoy, and S.D. Kachman. Effect on Vehicle-Pedestrian Conflicts of “Turning Traffic Must Yield to Pedestrians” Sign. In Transportation Research Record 1553, TRB, National Research Council, Washington, D.C., 1996, pp.38-45. Bechtel, A.K., K.E. MacLeod, and D.R. Ragland. Pedestrian Scramble Signal in Chinatown Neighborhood of Oakland, California, An Evaluation. In Transportation Research Record: Journal of the Transportation Research Board, No. 1878, TRB, National Research Council, Washington, D.C., 2004, pp. 19-26. Bloch, S.A. A Comparitive Study of the Speed Reduction Effects of Photo-Radar and Speed Display Boards. Presented at the 78th Annual Meeting of the Transportation Research Board, Washington, D.C. January 1998. Braun, R. and M. Roddin. NCHRP Report 189: Quantifying the Benefits of Separating Pedestrians and Vehicles. TRB, National Research Council, Washington, D.C., 1978. Ellis, R., Van Houten, R. and Kim, J.L. (2007). In‐Roadway “Yield to Pedestrians Signs”: Placement Distance and Motorist Yielding. Transportation Research Record. No. 2002, 84‐89.
Michael D. Fontaine, Paul J. Carlson, and H. Gene Hawkins, Jr. Evaluation of Traffic Control Devices for Rural High-Speed Maintenance work zones, second year activities and final recommendations. October 2000. Huang, H., and Zegeer, C. Effects of Innovative Pedestrian Signs at Unsignalized Locations. Transportation Research Record 1705. pp. 43-52, 2000. Hubbard, S.M.L., D.M. Wetervelt, D.B. Bryant, and D.M. Bullock, Expected Right Turn Traffic Characteristics Associated with Leading Pedestrian Phases. Paper presented at the 85th Annual Meeting of the Transportation Research Board, Washington, D.C., 2006. Hyden, C. The Landås project - A before project regarding environmental and safety issues in a residential area in the city of Bergen, Norway. Statens Vegvesen, Distriktskontoret i Bergen, 2003 King, M.R., Calming New York City Intersections. Presented at the Urban Street Symposuim, Dallas, Texas, 1999.
Miami‐Dade Pedestrian Safety Project Final Report and Executive Summary
82
McCoy, P.T., J.A. Bonneson, J.A. Kollbaum. Speed Reduction Effects of Speed Monitoring Displays with Radar in Work Zones on Interstate Highways. Maintenance Management and Safety, 1995, no 1509, pp. 65-72. Perillo, K.V. Effectiveness of Speed Trailers on Low-Speed Urban Roadways. Master’s Thesis, Texas A & M University, 1997. Turner, S., Fitzpatrick, K., Brewer, M., and Park, E.S. Motorist Yielding to Pedestrians at Unsignalized Intersections: Findings form a National Study on Improving Pedestrian Safety. Paper presented at the 85th Annual meeting of the Transportation Research Board, Jan 2006, Washington, D.C. U.S. Department of Transportation Federal Highway Administration Cooperative Agreement DTFH61-01-X-00018, Pedestrian Safety Engineering and Intelligent Transportation System-Based Countermeasures Program for Reduced Pedestrian Fatalities, Injuries, Conflicts and Other Surrogate Measures: Miami-Dade Site, Phase 1 Final Report, 2002. Van Houten, R., R. Ellis, J. Sanda, & J. Kim. Pedestrian Push Button Confirmation Increases Call Button Usage and Compliance. In press Transportation Research Record. Van Houten, R., R.A. Retting, C.M. Farmer, and J. Van Houten. Field Evaluation of a Leading Pedestrian Interval Signal Phase at Three Urban Intersections. In Transportation Research Record,: Journal of the Transportation Research Board, No. 1734, TRB, National Research Council, Washington, D.C., 2000, pp 86-92. Van Houten, R., Nau, P.A., and Merrigan, M. Reducing elevator energy use: A comparison of posted feedback and reduced elevator convenience. Journal of Applied Behavior Analysis, 1981, 14, 377-387. Van Houten, R., Ellis, Sanda, J. & Kim, J.L (2006). Pedestrian push button confirmation increases call button usage and compliance. Transportation Research Record. No. 1982, 99-103.
Van Houten, R., Ellis, R. and Kim, J.L. (2007). The Effects of Varying Minimum Green on the Percentage of Pedestrians Waiting to Cross with the WALK Signal at Midblock Crosswalks. Transportation Research Record. No. 2002, 78‐83.
Virkler, M.R. Pedestrian Compliance Effects on Signal Delay. Transportation Research Record, 1636, p. 88-91, 1998. Zegeer, C.V. Synthesis of Pedestrian Safety Research. Report SA-91-034. FHWA, U.S. Department of Transportation, 1991. Zegeer, C.V., K.S./ Opiela, and M.J. Cynecki. Effects of Pedestrian Signals and Signal Timing on Pedestrian Accidents. IN Transportation Research Record: Journal of the

Miami‐Dade Pedestrian Safety Project Final Report and Executive Summary
83
Transportation Research Board, No. 874, TRB, National Research Council, Washington, D.C., 1982, pp 62-72