PECAN ROUNDTABLE - nutfruitcongress.org · US Kernel Exports Summary (Crop Year Basis: October to...
32
PECAN ROUNDTABLE
Transcript of PECAN ROUNDTABLE - nutfruitcongress.org · US Kernel Exports Summary (Crop Year Basis: October to...
PECAN ROUNDTABLE
IBERIA FLIGHT CHICAGO - MADRID
2
Olives and Nuts served…where are thepecans?
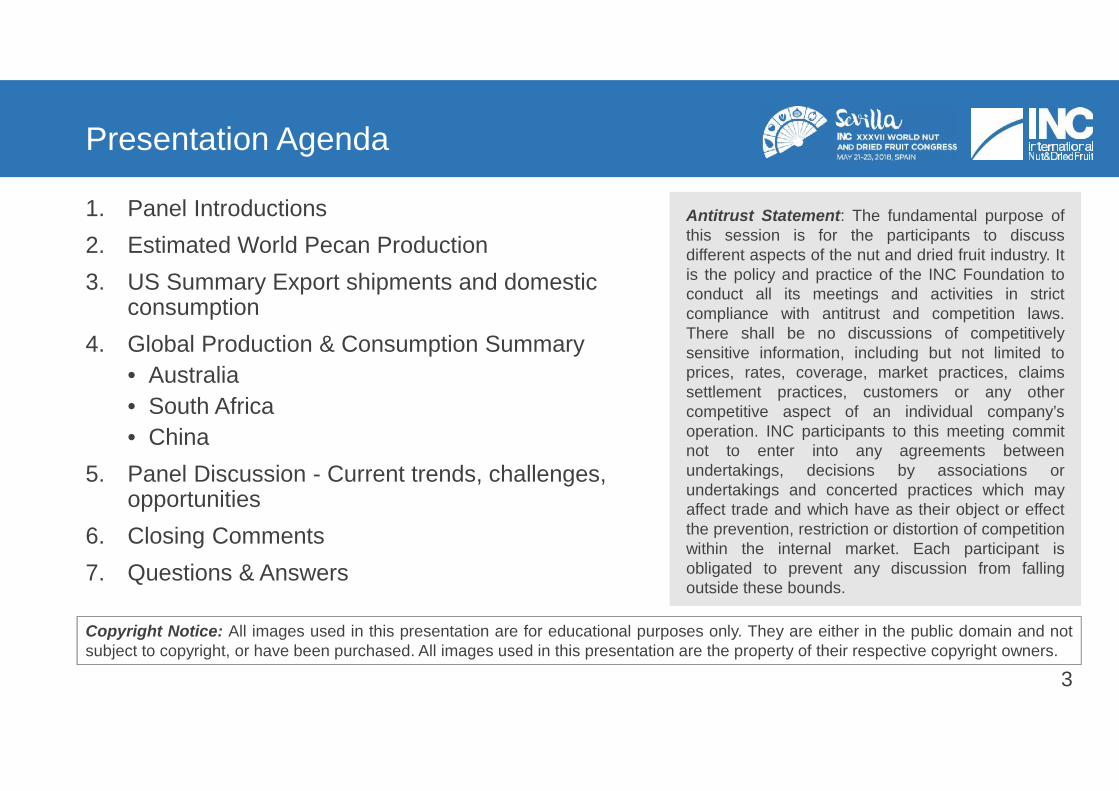
Presentation Agenda
1. Panel Introductions2. Estimated World Pecan Production3. US Summary Export shipments and domestic
consumption4. Global Production & Consumption Summary
• Australia• South Africa• China
5. Panel Discussion - Current trends, challenges,opportunities
6. Closing Comments7. Questions & Answers
3
Antitrust Statement: The fundamental purpose ofthis session is for the participants to discussdifferent aspects of the nut and dried fruit industry. Itis the policy and practice of the INC Foundation toconduct all its meetings and activities in strictcompliance with antitrust and competition laws.There shall be no discussions of competitivelysensitive information, including but not limited toprices, rates, coverage, market practices, claimssettlement practices, customers or any othercompetitive aspect of an individual company’soperation. INC participants to this meeting commitnot to enter into any agreements betweenundertakings, decisions by associations orundertakings and concerted practices which mayaffect trade and which have as their object or effectthe prevention, restriction or distortion of competitionwithin the internal market. Each participant isobligated to prevent any discussion from fallingoutside these bounds.
Copyright Notice: All images used in this presentation are for educational purposes only. They are either in the public domain and notsubject to copyright, or have been purchased. All images used in this presentation are the property of their respective copyright owners.
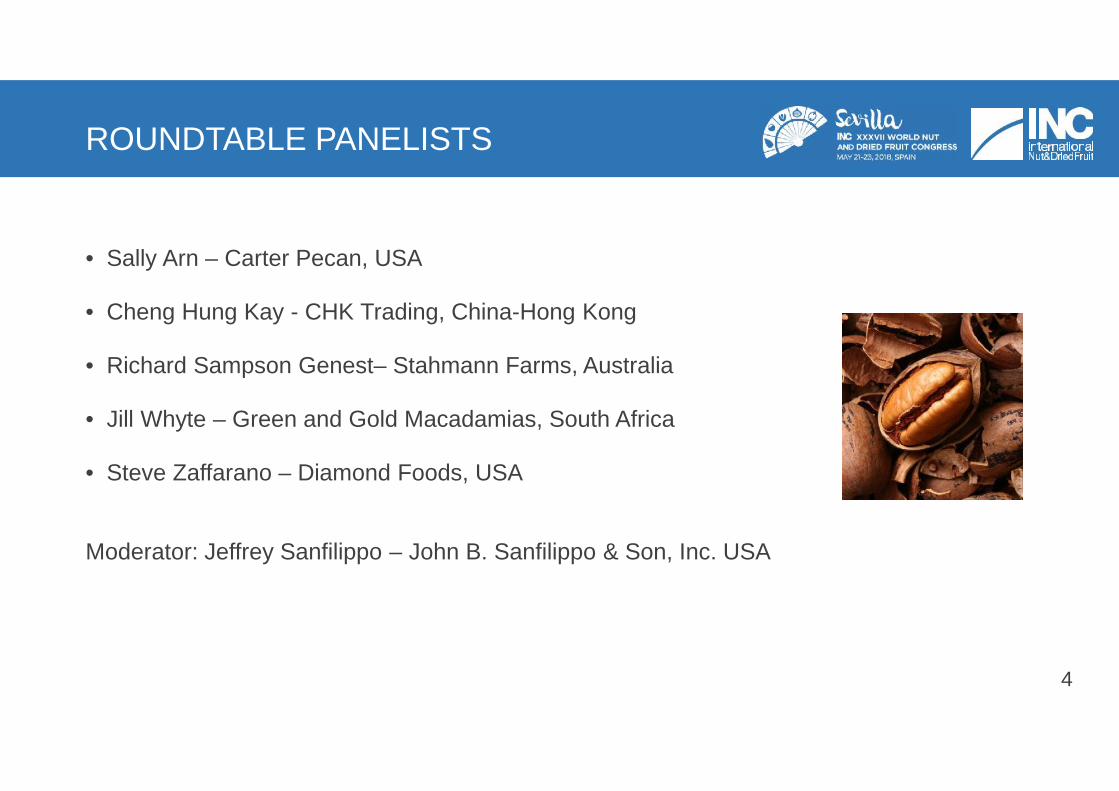
ROUNDTABLE PANELISTS
• Sally Arn – Carter Pecan, USA
• Cheng Hung Kay - CHK Trading, China-Hong Kong
• Richard Sampson Genest– Stahmann Farms, Australia
• Jill Whyte – Green and Gold Macadamias, South Africa
• Steve Zaffarano – Diamond Foods, USA
Moderator: Jeffrey Sanfilippo – John B. Sanfilippo & Son, Inc. USA
4
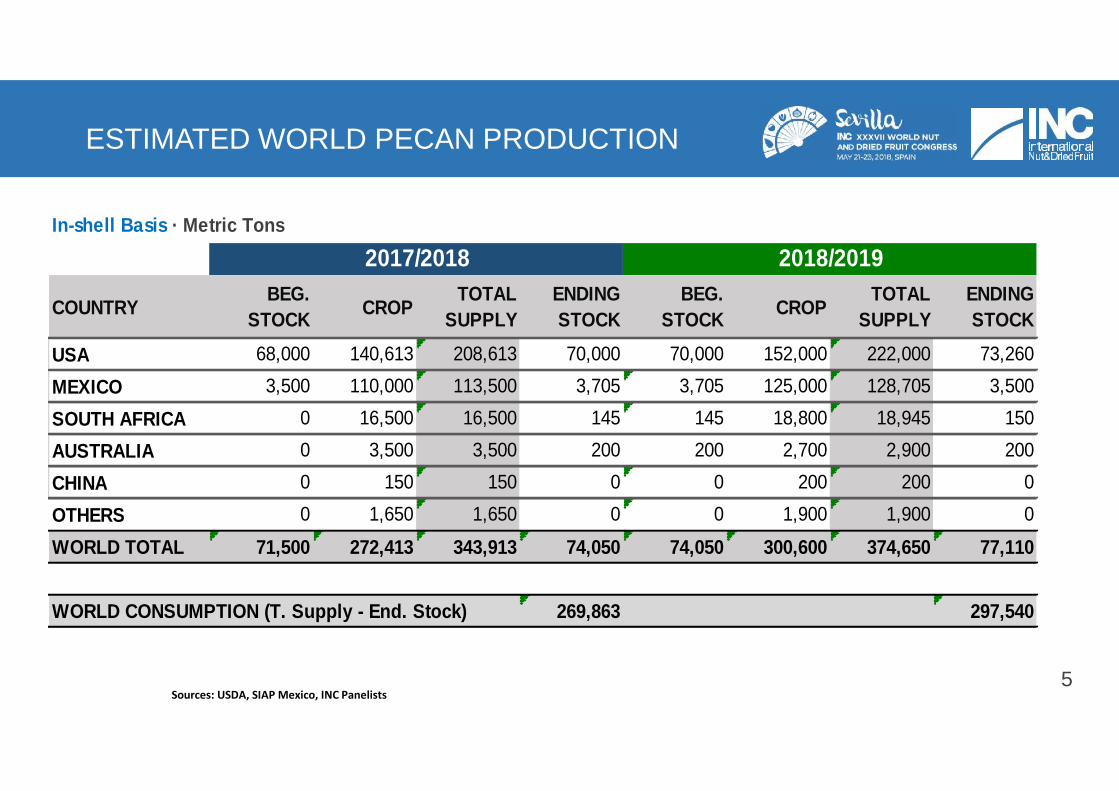
ESTIMATED WORLD PECAN PRODUCTION
5Sources: USDA, SIAP Mexico, INC Panelists
In-shell Basis · Metric Tons
COUNTRY BEG.STOCK CROP TOTAL
SUPPLYENDINGSTOCK
BEG.STOCK CROP TOTAL
SUPPLYENDINGSTOCK
USA 68,000 140,613 208,613 70,000 70,000 152,000 222,000 73,260
MEXICO 3,500 110,000 113,500 3,705 3,705 125,000 128,705 3,500
SOUTH AFRICA 0 16,500 16,500 145 145 18,800 18,945 150
AUSTRALIA 0 3,500 3,500 200 200 2,700 2,900 200
CHINA 0 150 150 0 0 200 200 0
OTHERS 0 1,650 1,650 0 0 1,900 1,900 0
WORLD TOTAL 71,500 272,413 343,913 74,050 74,050 300,600 374,650 77,110
WORLD CONSUMPTION (T. Supply - End. Stock) 269,863 297,540
2017/2018 2018/2019
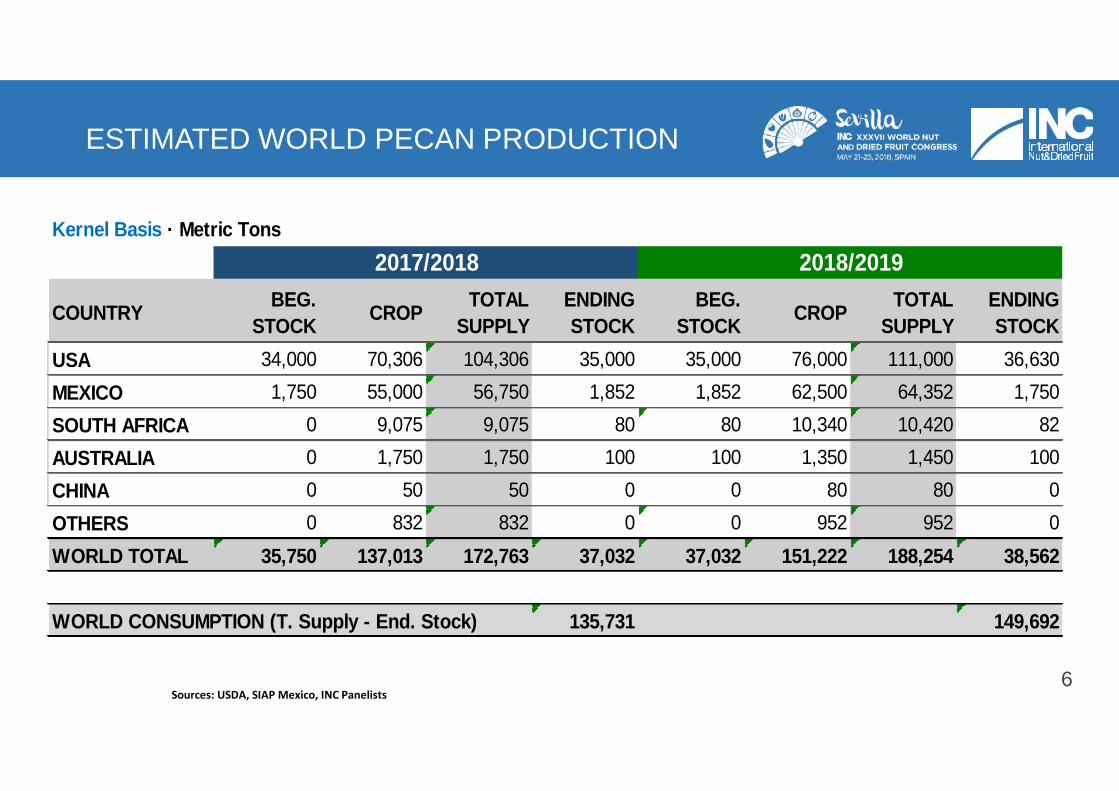
ESTIMATED WORLD PECAN PRODUCTION
6Sources: USDA, SIAP Mexico, INC Panelists
Kernel Basis · Metric Tons
COUNTRY BEG.STOCK CROP TOTAL
SUPPLYENDINGSTOCK
BEG.STOCK CROP TOTAL
SUPPLYENDINGSTOCK
USA 34,000 70,306 104,306 35,000 35,000 76,000 111,000 36,630MEXICO 1,750 55,000 56,750 1,852 1,852 62,500 64,352 1,750SOUTH AFRICA 0 9,075 9,075 80 80 10,340 10,420 82AUSTRALIA 0 1,750 1,750 100 100 1,350 1,450 100CHINA 0 50 50 0 0 80 80 0OTHERS 0 832 832 0 0 952 952 0WORLD TOTAL 35,750 137,013 172,763 37,032 37,032 151,222 188,254 38,562
WORLD CONSUMPTION (T. Supply - End. Stock) 135,731 149,692
2017/2018 2018/2019
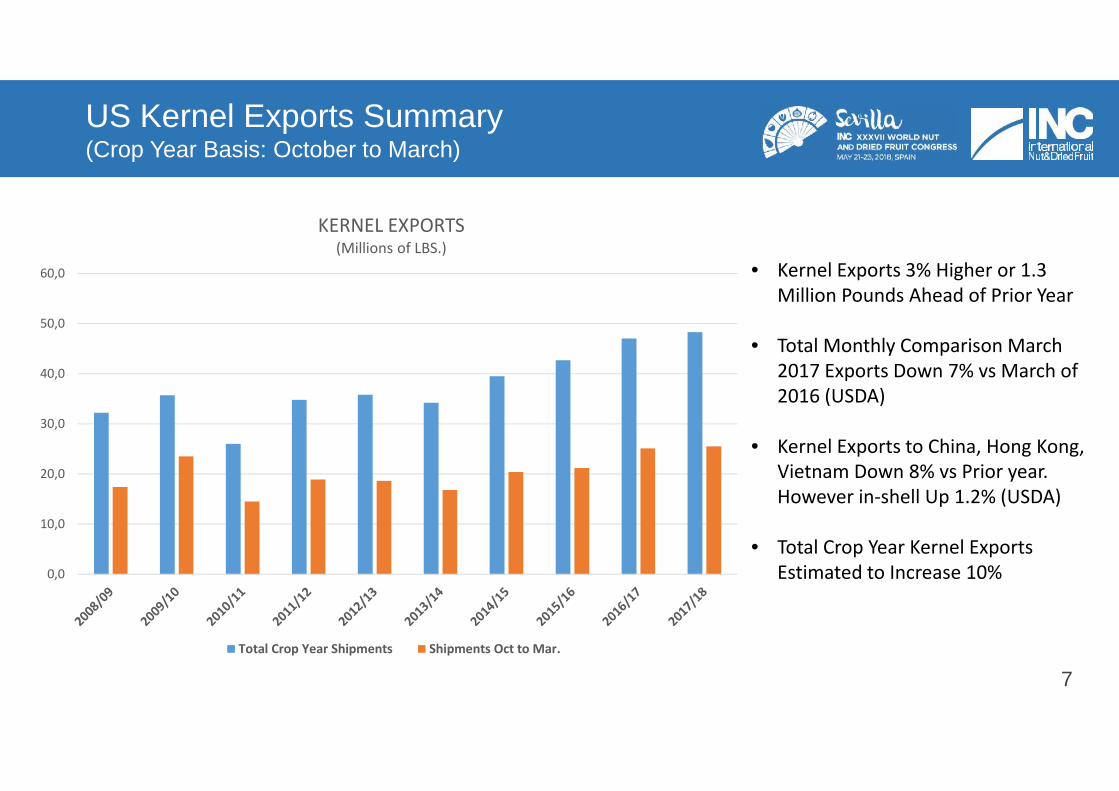
US Kernel Exports Summary(Crop Year Basis: October to March)
7
• Kernel Exports 3% Higher or 1.3Million Pounds Ahead of Prior Year
• Total Monthly Comparison March2017 Exports Down 7% vs March of2016 (USDA)
• Kernel Exports to China, Hong Kong,Vietnam Down 8% vs Prior year.However in-shell Up 1.2% (USDA)
• Total Crop Year Kernel ExportsEstimated to Increase 10%0,0
10,0
20,0
30,0
40,0
50,0
60,0
KERNEL EXPORTS(Millions of LBS.)
Total Crop Year Shipments Shipments Oct to Mar.
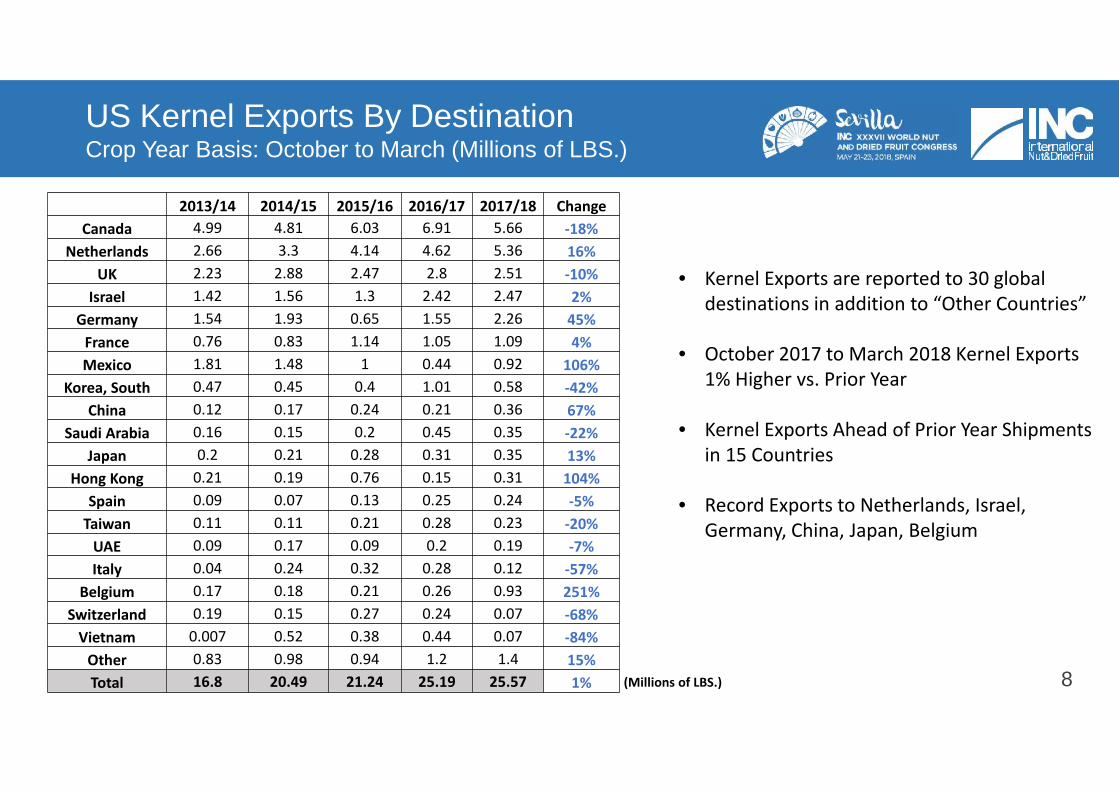
US Kernel Exports By DestinationCrop Year Basis: October to March (Millions of LBS.)
8
• Kernel Exports are reported to 30 globaldestinations in addition to “Other Countries”
• October 2017 to March 2018 Kernel Exports1% Higher vs. Prior Year
• Kernel Exports Ahead of Prior Year Shipmentsin 15 Countries
• Record Exports to Netherlands, Israel,Germany, China, Japan, Belgium
(Millions of LBS.)
2013/14 2014/15 2015/16 2016/17 2017/18 ChangeCanada 4.99 4.81 6.03 6.91 5.66 -18%
Netherlands 2.66 3.3 4.14 4.62 5.36 16%UK 2.23 2.88 2.47 2.8 2.51 -10%
Israel 1.42 1.56 1.3 2.42 2.47 2%Germany 1.54 1.93 0.65 1.55 2.26 45%
France 0.76 0.83 1.14 1.05 1.09 4%Mexico 1.81 1.48 1 0.44 0.92 106%
Korea, South 0.47 0.45 0.4 1.01 0.58 -42%China 0.12 0.17 0.24 0.21 0.36 67%
Saudi Arabia 0.16 0.15 0.2 0.45 0.35 -22%Japan 0.2 0.21 0.28 0.31 0.35 13%
Hong Kong 0.21 0.19 0.76 0.15 0.31 104%Spain 0.09 0.07 0.13 0.25 0.24 -5%
Taiwan 0.11 0.11 0.21 0.28 0.23 -20%UAE 0.09 0.17 0.09 0.2 0.19 -7%Italy 0.04 0.24 0.32 0.28 0.12 -57%
Belgium 0.17 0.18 0.21 0.26 0.93 251%Switzerland 0.19 0.15 0.27 0.24 0.07 -68%
Vietnam 0.007 0.52 0.38 0.44 0.07 -84%Other 0.83 0.98 0.94 1.2 1.4 15%Total 16.8 20.49 21.24 25.19 25.57 1%
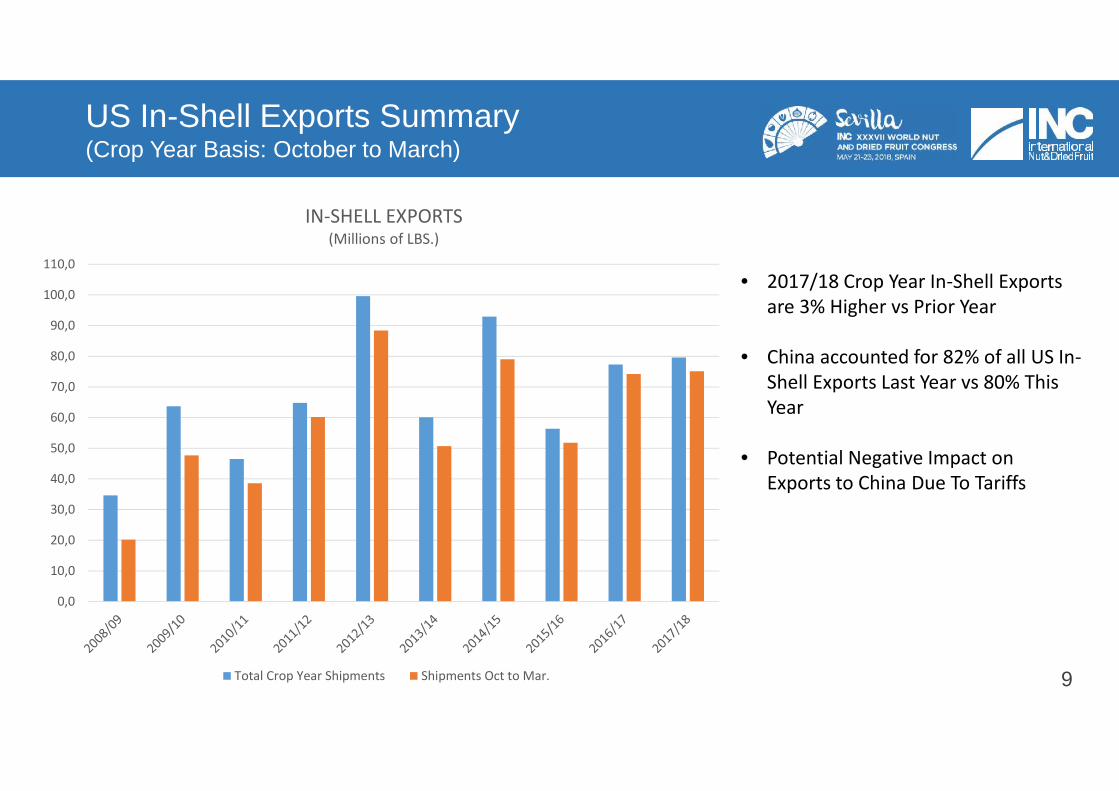
US In-Shell Exports Summary(Crop Year Basis: October to March)
9
• 2017/18 Crop Year In-Shell Exportsare 3% Higher vs Prior Year
• China accounted for 82% of all US In-Shell Exports Last Year vs 80% ThisYear
• Potential Negative Impact onExports to China Due To Tariffs
0,0
10,0
20,0
30,0
40,0
50,0
60,0
70,0
80,0
90,0
100,0
110,0
IN-SHELL EXPORTS(Millions of LBS.)
Total Crop Year Shipments Shipments Oct to Mar.
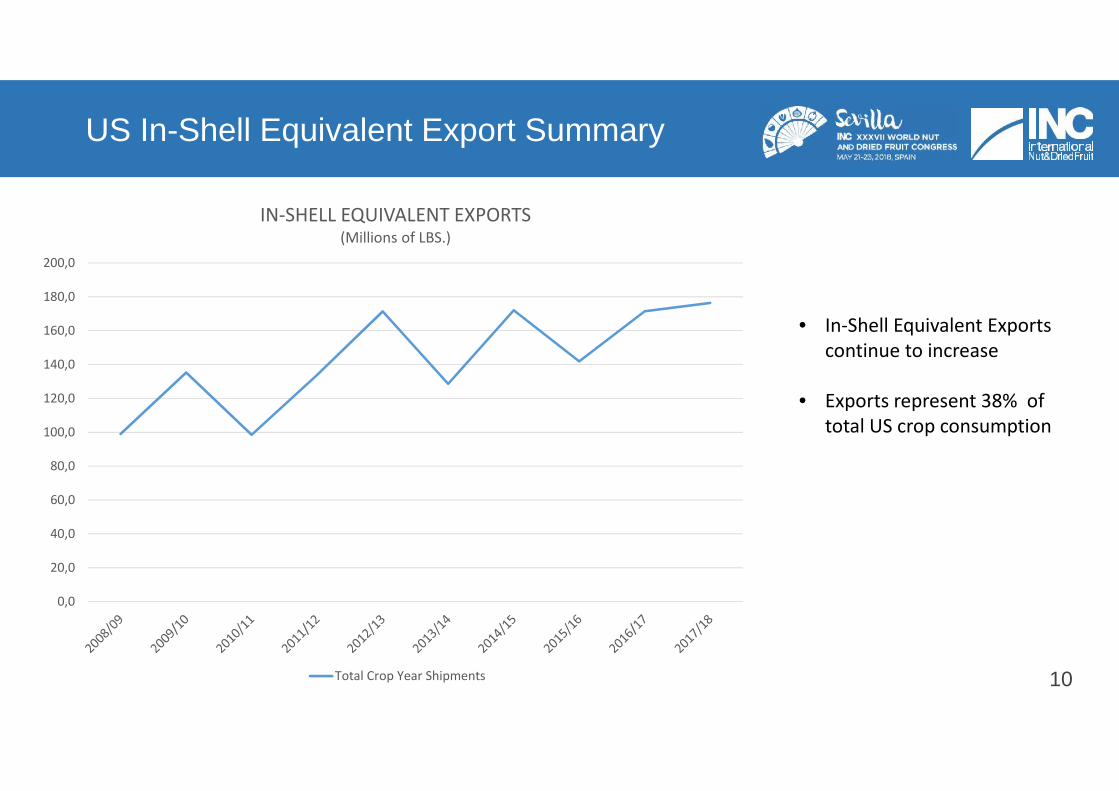
US In-Shell Equivalent Export Summary
10
• In-Shell Equivalent Exportscontinue to increase
• Exports represent 38% oftotal US crop consumption
0,0
20,0
40,0
60,0
80,0
100,0
120,0
140,0
160,0
180,0
200,0
IN-SHELL EQUIVALENT EXPORTS(Millions of LBS.)
Total Crop Year Shipments
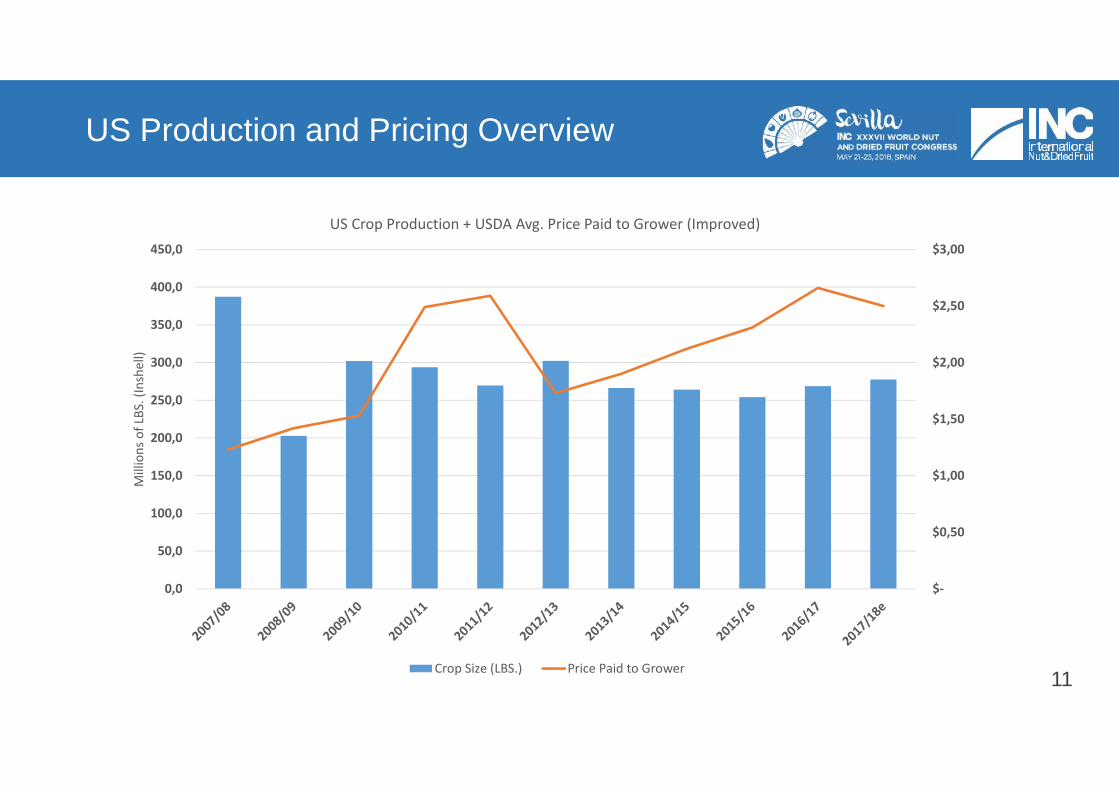
US Production and Pricing Overview
11
$-
$0,50
$1,00
$1,50
$2,00
$2,50
$3,00
0,0
50,0
100,0
150,0
200,0
250,0
300,0
350,0
400,0
450,0
Mill
ions
of L
BS. (
Insh
ell)
US Crop Production + USDA Avg. Price Paid to Grower (Improved)
Crop Size (LBS.) Price Paid to Grower
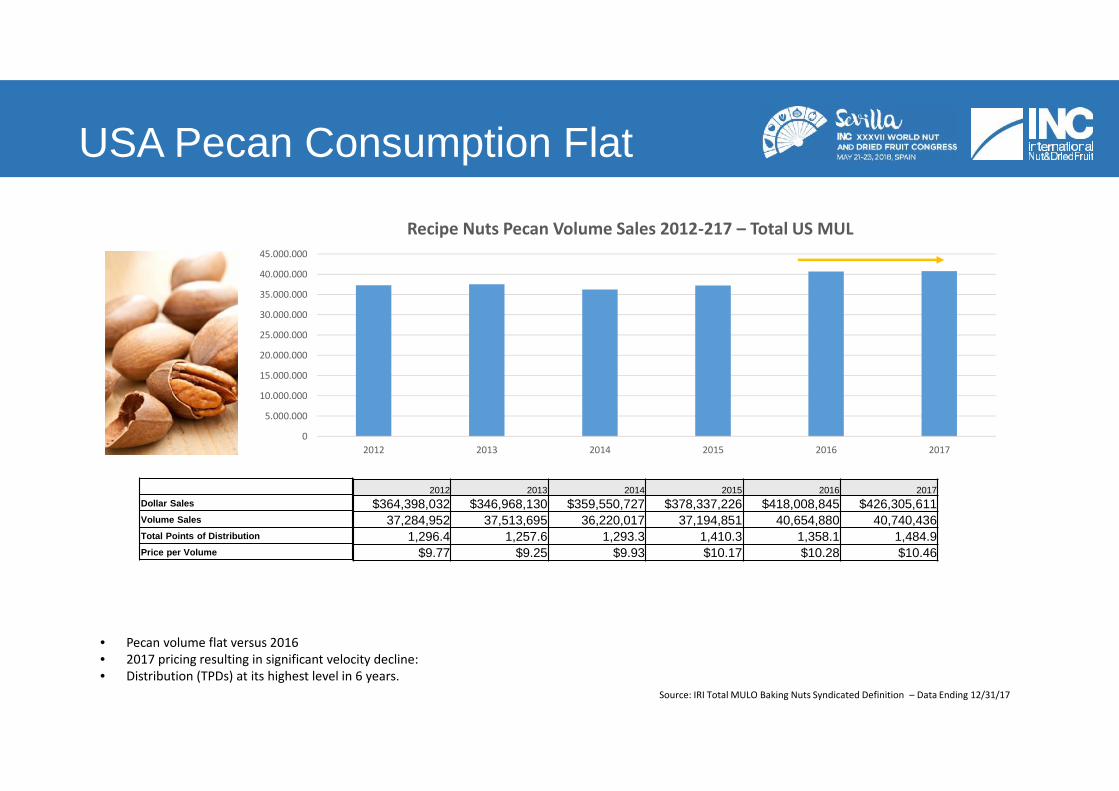
USA Pecan Consumption Flat
Source: IRI Total MULO Baking Nuts Syndicated Definition – Data Ending 12/31/17
• Pecan volume flat versus 2016• 2017 pricing resulting in significant velocity decline:• Distribution (TPDs) at its highest level in 6 years.
Dollar Sales
Volume Sales
Total Points of Distribution
Price per Volume
0
5.000.000
10.000.000
15.000.000
20.000.000
25.000.000
30.000.000
35.000.000
40.000.000
45.000.000
2012 2013 2014 2015 2016 2017
Recipe Nuts Pecan Volume Sales 2012-217 – Total US MUL
2012 2013 2014 2015 2016 2017$364,398,032 $346,968,130 $359,550,727 $378,337,226 $418,008,845 $426,305,611
37,284,952 37,513,695 36,220,017 37,194,851 40,654,880 40,740,4361,296.4 1,257.6 1,293.3 1,410.3 1,358.1 1,484.9
$9.77 $9.25 $9.93 $10.17 $10.28 $10.46
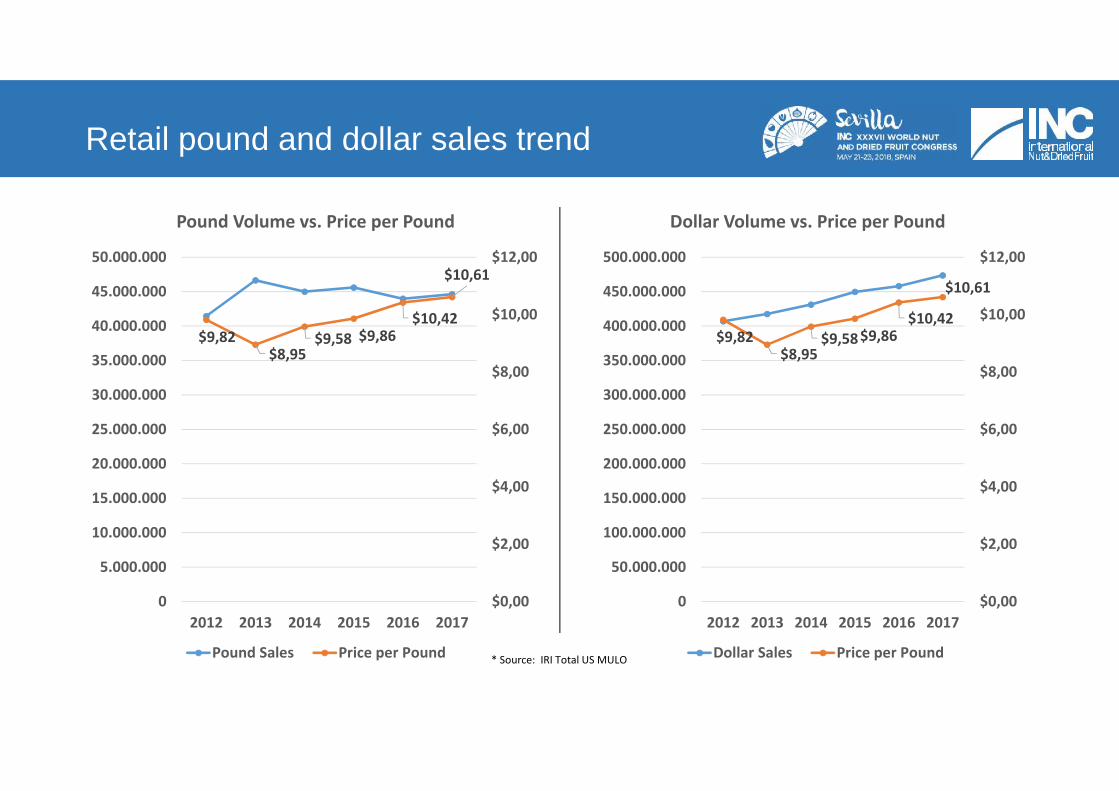
Retail pound and dollar sales trend
$9,82$8,95
$9,58 $9,86$10,42
$10,61
$0,00
$2,00
$4,00
$6,00
$8,00
$10,00
$12,00
0
5.000.000
10.000.000
15.000.000
20.000.000
25.000.000
30.000.000
35.000.000
40.000.000
45.000.000
50.000.000
2012 2013 2014 2015 2016 2017
Pound Volume vs. Price per Pound
Pound Sales Price per Pound * Source: IRI Total US MULO
$9,82$8,95
$9,58 $9,86$10,42
$10,61
$0,00
$2,00
$4,00
$6,00
$8,00
$10,00
$12,00
0
50.000.000
100.000.000
150.000.000
200.000.000
250.000.000
300.000.000
350.000.000
400.000.000
450.000.000
500.000.000
2012 2013 2014 2015 2016 2017
Dollar Volume vs. Price per Pound
Dollar Sales Price per Pound
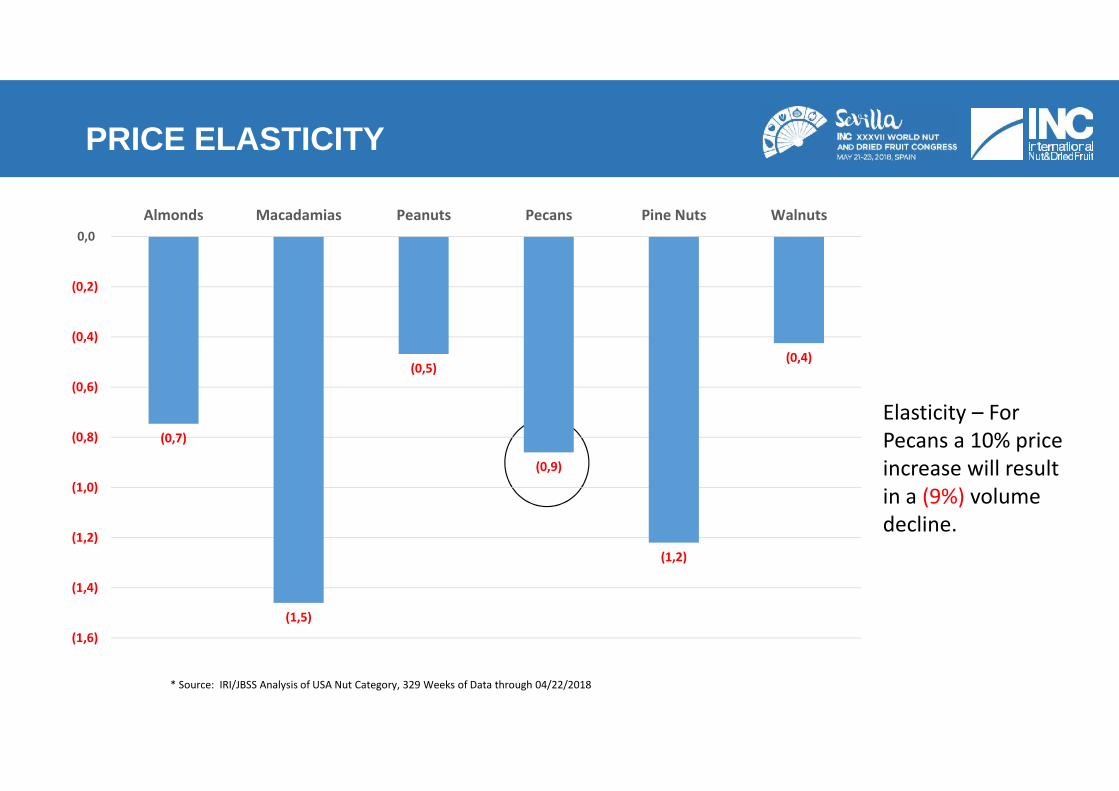
PRICE ELASTICITY
(0,7)
(1,5)
(0,5)
(0,9)
(1,2)
(0,4)
(1,6)
(1,4)
(1,2)
(1,0)
(0,8)
(0,6)
(0,4)
(0,2)
0,0Almonds Macadamias Peanuts Pecans Pine Nuts Walnuts
* Source: IRI/JBSS Analysis of USA Nut Category, 329 Weeks of Data through 04/22/2018
Elasticity – ForPecans a 10% priceincrease will resultin a (9%) volumedecline.
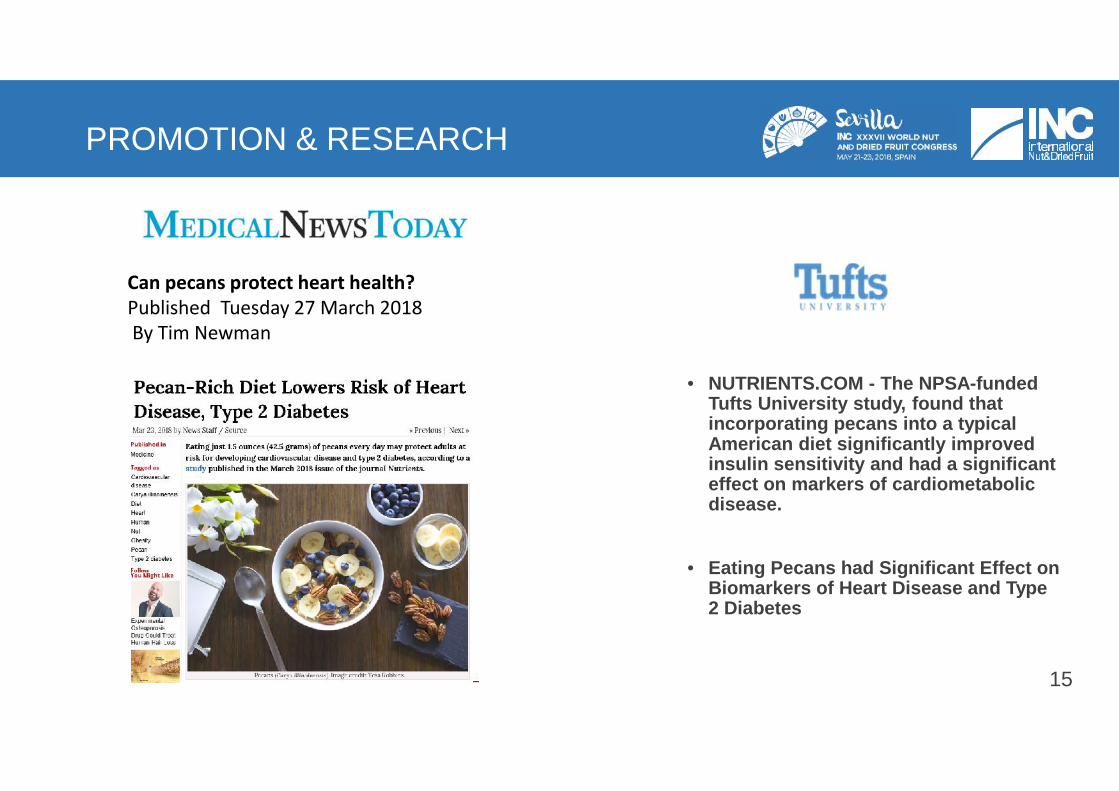
PROMOTION & RESEARCH
• NUTRIENTS.COM - The NPSA-fundedTufts University study, found thatincorporating pecans into a typicalAmerican diet significantly improvedinsulin sensitivity and had a significanteffect on markers of cardiometabolicdisease.
• Eating Pecans had Significant Effect onBiomarkers of Heart Disease and Type2 Diabetes
15
Can pecans protect heart health?Published Tuesday 27 March 2018By Tim Newman
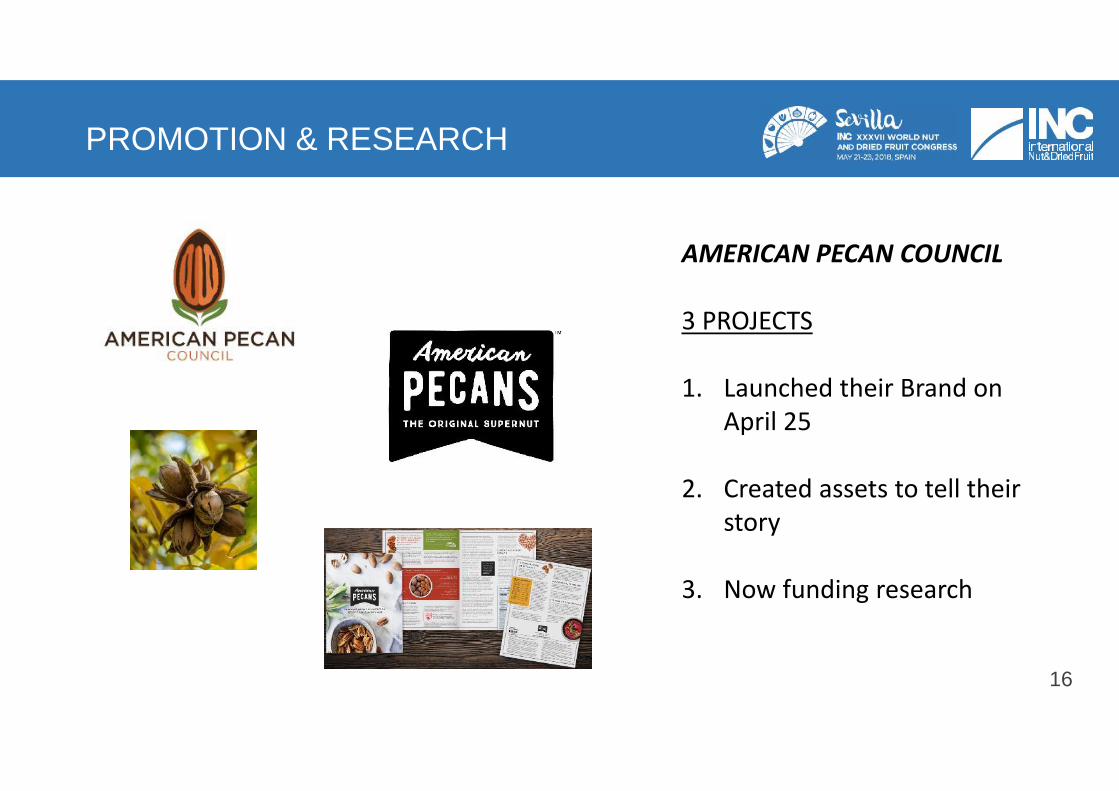
PROMOTION & RESEARCH
16
AMERICAN PECAN COUNCIL
3 PROJECTS
1. Launched their Brand onApril 25
2. Created assets to tell theirstory
3. Now funding research
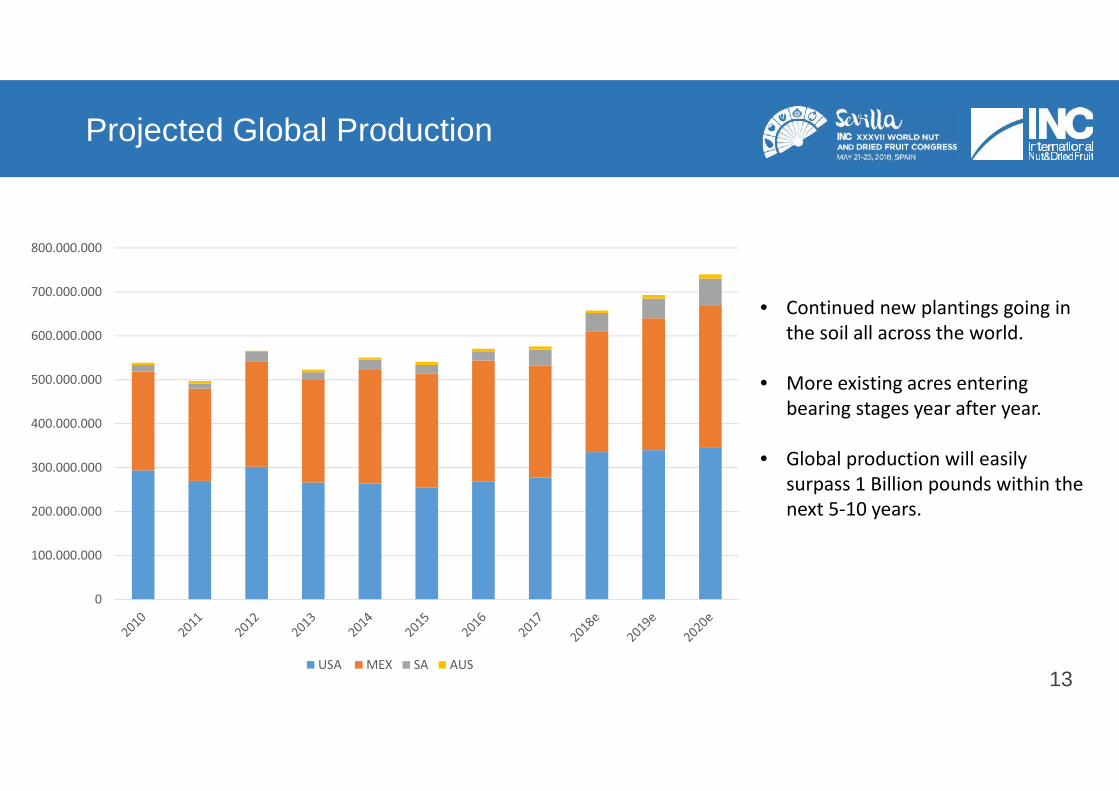
Projected Global Production
13
0
100.000.000
200.000.000
300.000.000
400.000.000
500.000.000
600.000.000
700.000.000
800.000.000
USA MEX SA AUS
• Continued new plantings going inthe soil all across the world.
• More existing acres enteringbearing stages year after year.
• Global production will easilysurpass 1 Billion pounds within thenext 5-10 years.
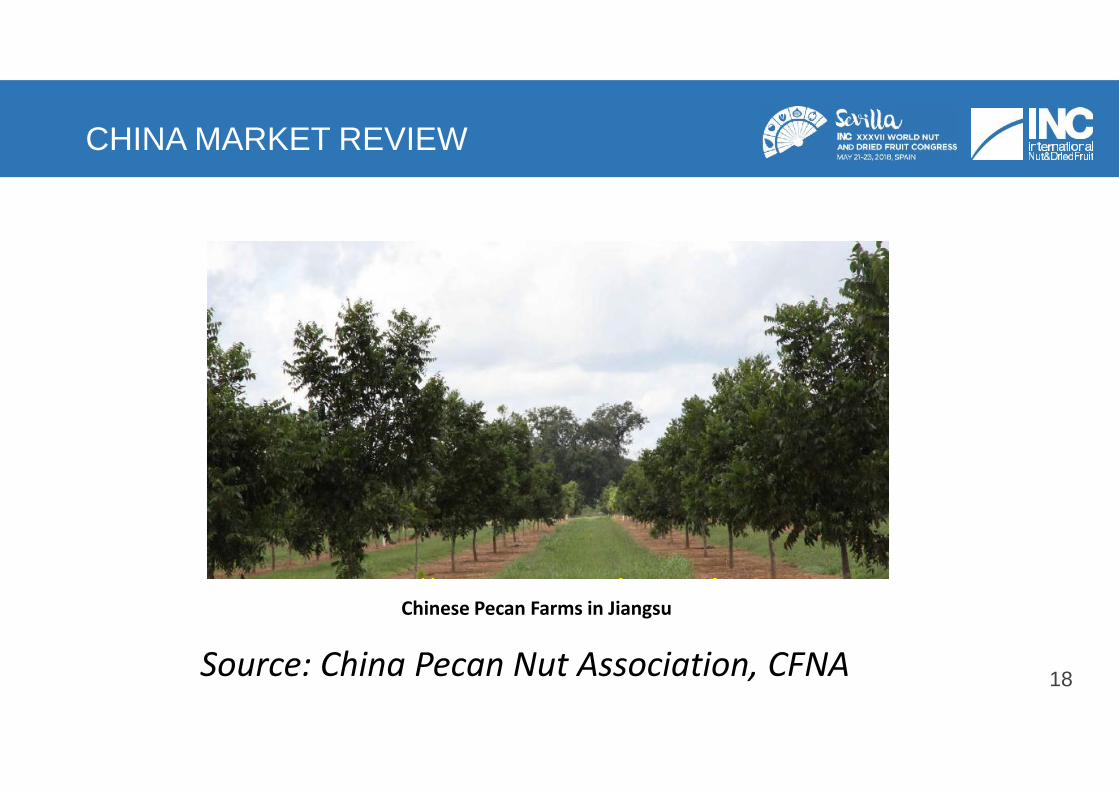
CHINA MARKET REVIEW
18Source: China Pecan Nut Association, CFNA
Chinese Pecan Farms in Jiangsu
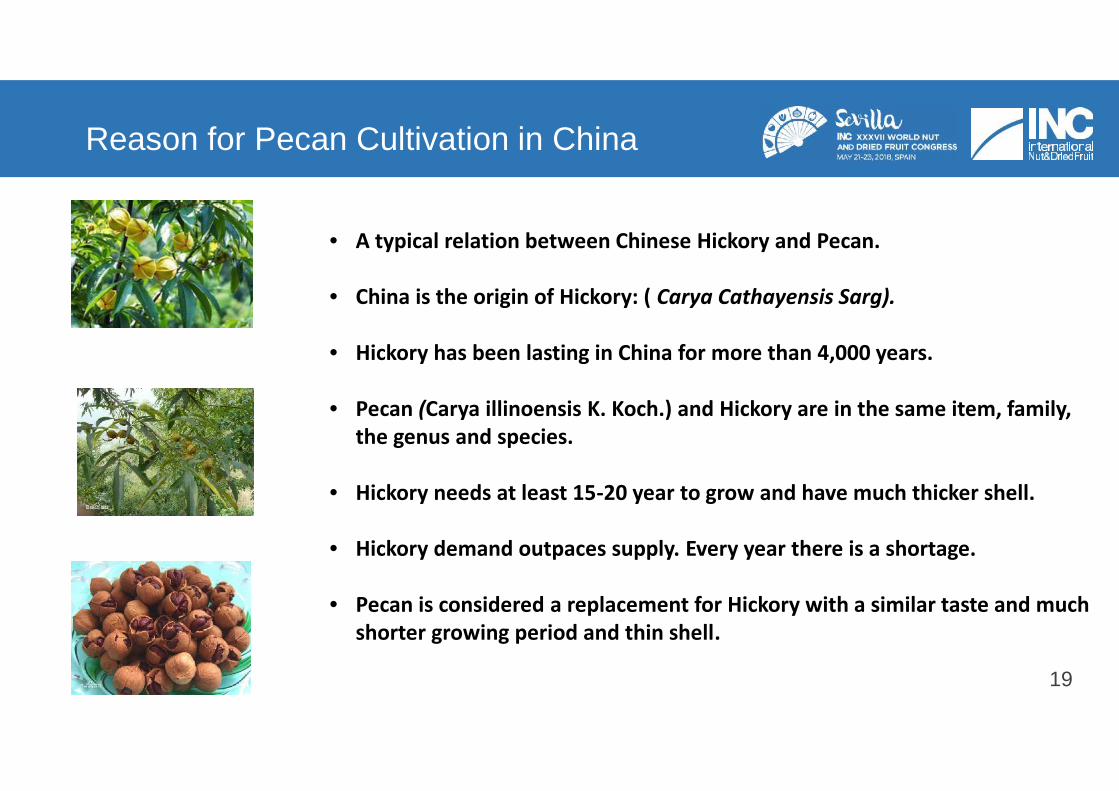
Reason for Pecan Cultivation in China
19
• A typical relation between Chinese Hickory and Pecan.
• China is the origin of Hickory: ( Carya Cathayensis Sarg).
• Hickory has been lasting in China for more than 4,000 years.
• Pecan (Carya illinoensis K. Koch.) and Hickory are in the same item, family,the genus and species.
• Hickory needs at least 15-20 year to grow and have much thicker shell.
• Hickory demand outpaces supply. Every year there is a shortage.
• Pecan is considered a replacement for Hickory with a similar taste and muchshorter growing period and thin shell.
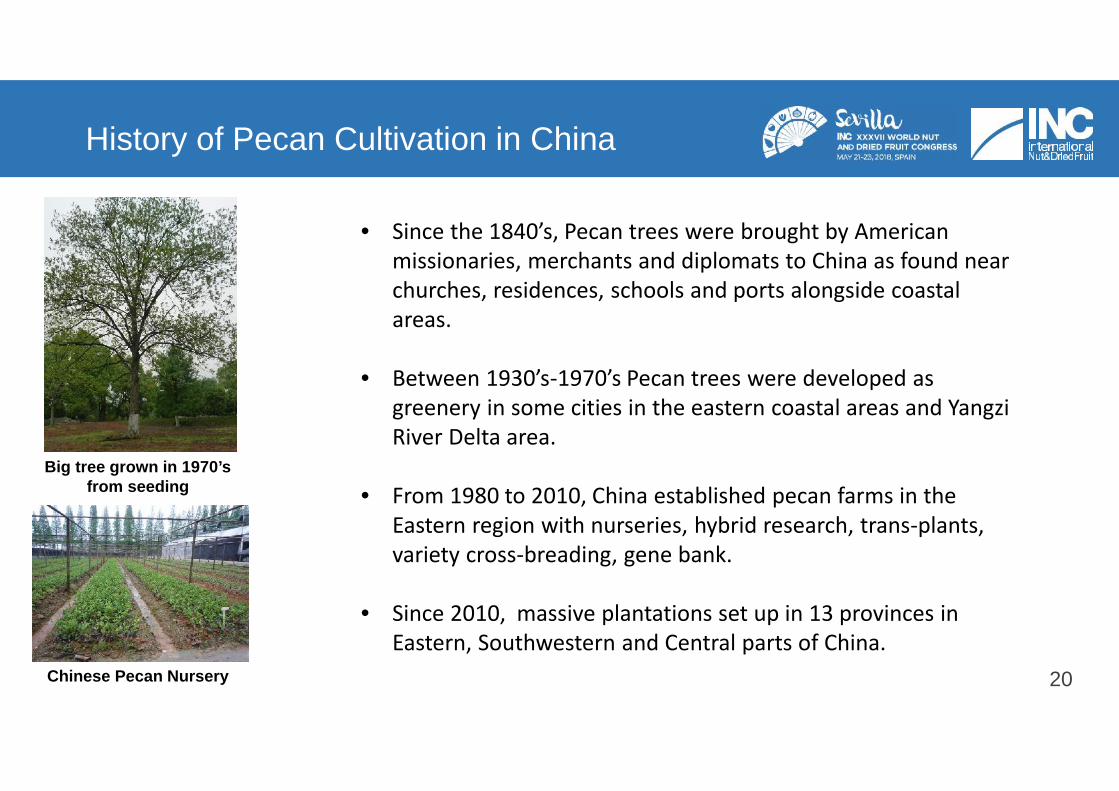
History of Pecan Cultivation in China
20
Big tree grown in 1970’sfrom seeding
Chinese Pecan Nursery
• Since the 1840’s, Pecan trees were brought by Americanmissionaries, merchants and diplomats to China as found nearchurches, residences, schools and ports alongside coastalareas.
• Between 1930’s-1970’s Pecan trees were developed asgreenery in some cities in the eastern coastal areas and YangziRiver Delta area.
• From 1980 to 2010, China established pecan farms in theEastern region with nurseries, hybrid research, trans-plants,variety cross-breading, gene bank.
• Since 2010, massive plantations set up in 13 provinces inEastern, Southwestern and Central parts of China.
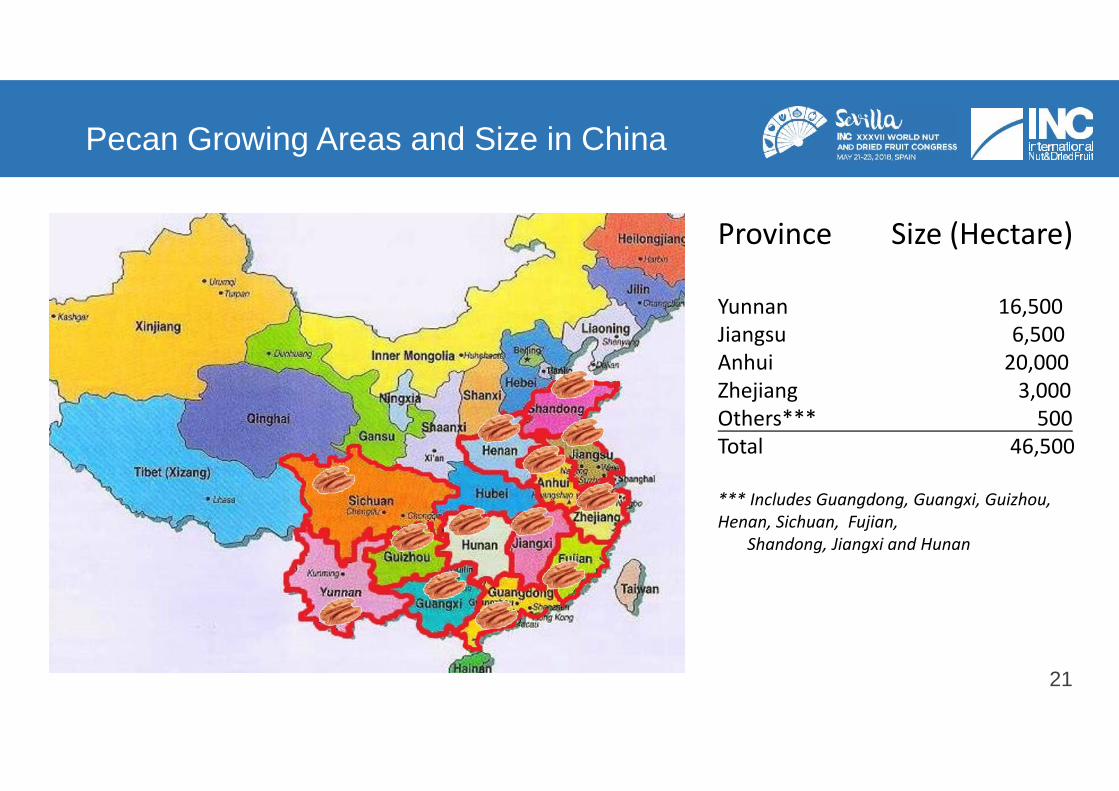
Pecan Growing Areas and Size in China
21
Province Size (Hectare)
Yunnan 16,500Jiangsu 6,500Anhui 20,000Zhejiang 3,000Others*** 500Total 46,500
*** Includes Guangdong, Guangxi, Guizhou,Henan, Sichuan, Fujian,
Shandong, Jiangxi and Hunan
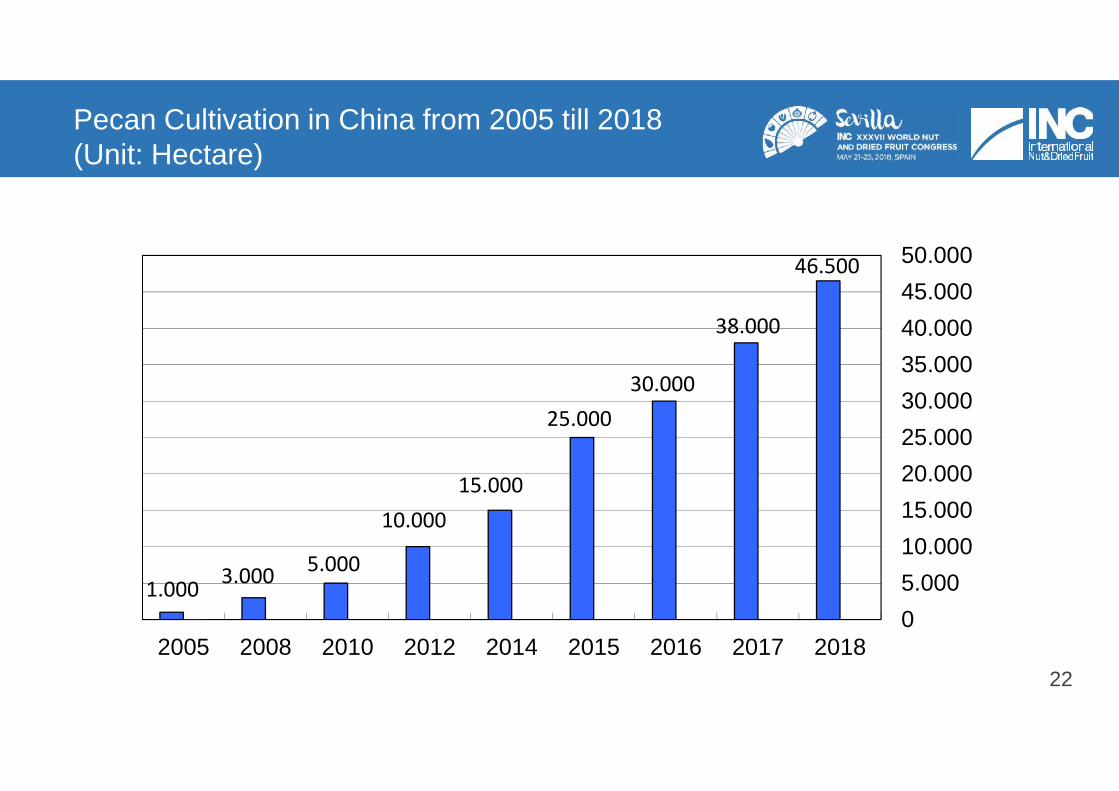
Pecan Cultivation in China from 2005 till 2018(Unit: Hectare)
22
1.000 3.000 5.000
10.00015.000
25.00030.000
38.000
46.500
05.00010.00015.00020.00025.00030.00035.00040.00045.00050.000
2005 2008 2010 2012 2014 2015 2016 2017 2018
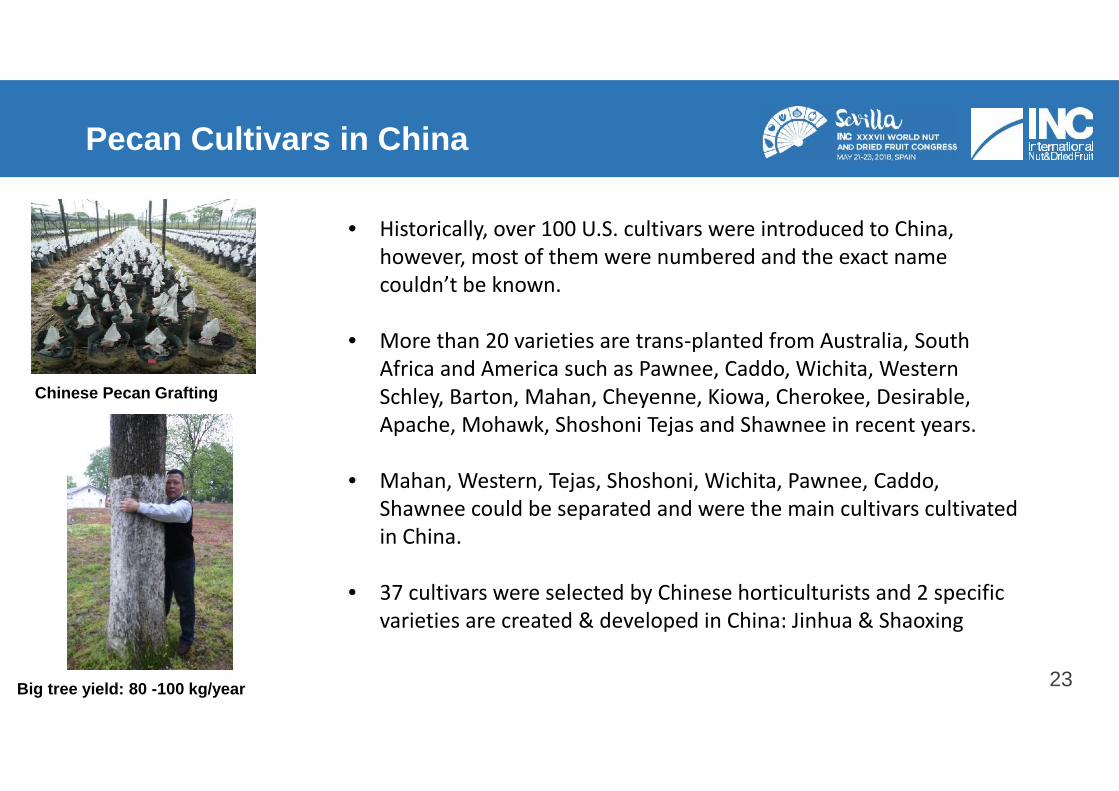
Pecan Cultivars in China
23
Chinese Pecan Grafting
Big tree yield: 80 -100 kg/year
• Historically, over 100 U.S. cultivars were introduced to China,however, most of them were numbered and the exact namecouldn’t be known.
• More than 20 varieties are trans-planted from Australia, SouthAfrica and America such as Pawnee, Caddo, Wichita, WesternSchley, Barton, Mahan, Cheyenne, Kiowa, Cherokee, Desirable,Apache, Mohawk, Shoshoni Tejas and Shawnee in recent years.
• Mahan, Western, Tejas, Shoshoni, Wichita, Pawnee, Caddo,Shawnee could be separated and were the main cultivars cultivatedin China.
• 37 cultivars were selected by Chinese horticulturists and 2 specificvarieties are created & developed in China: Jinhua & Shaoxing
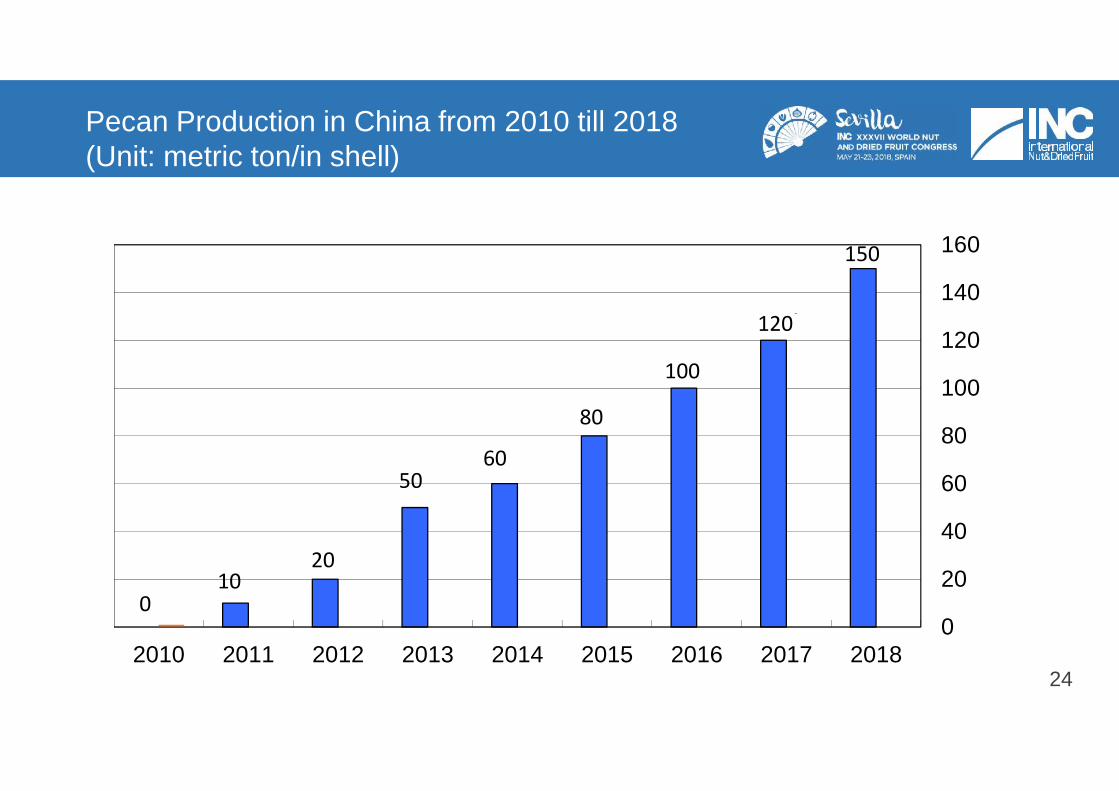
Pecan Production in China from 2010 till 2018(Unit: metric ton/in shell)
24
010
20
5060
80
100
120
150
0
20
40
60
80
100
120
140
160
2010 2011 2012 2013 2014 2015 2016 2017 2018
.
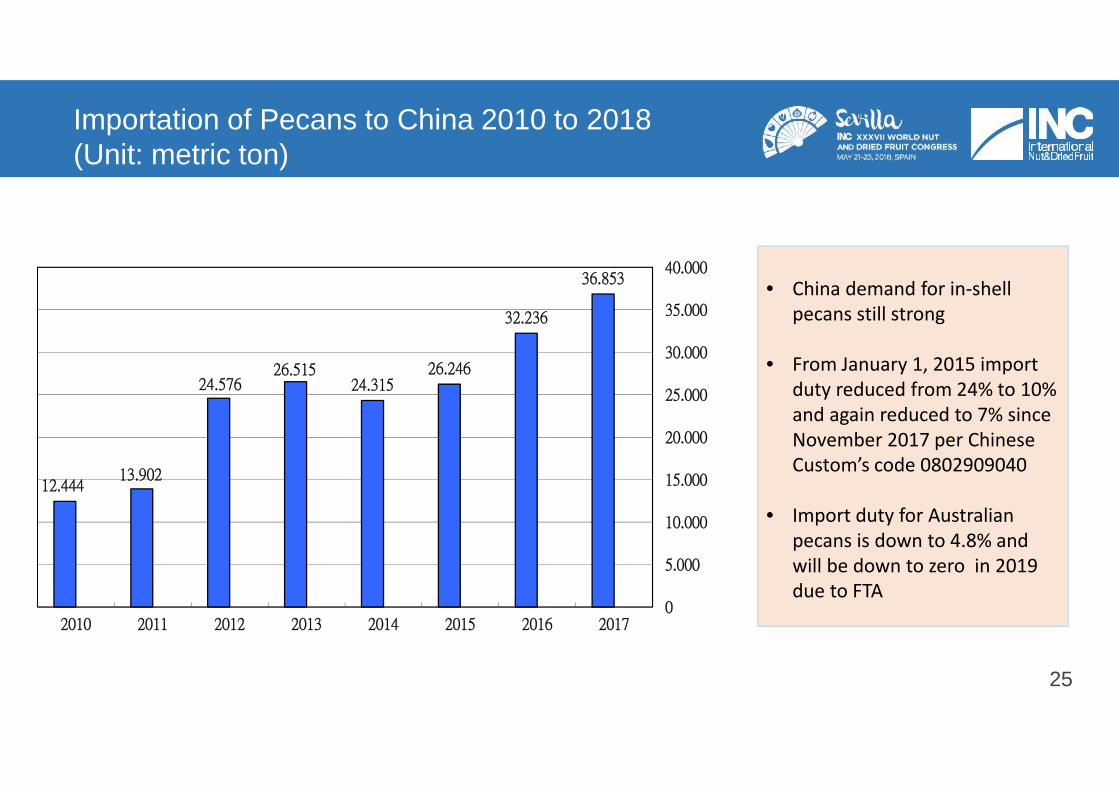
Importation of Pecans to China 2010 to 2018(Unit: metric ton)
25
12.44413.902
24.57626.515
24.31526.246
32.236
36.853
0
5.000
10.000
15.000
20.000
25.000
30.000
35.000
40.000
2010 2011 2012 2013 2014 2015 2016 2017
• China demand for in-shellpecans still strong
• From January 1, 2015 importduty reduced from 24% to 10%and again reduced to 7% sinceNovember 2017 per ChineseCustom’s code 0802909040
• Import duty for Australianpecans is down to 4.8% andwill be down to zero in 2019due to FTA
• China demand for in-shellpecans still strong
• From January 1, 2015 importduty reduced from 24% to 10%and again reduced to 7% sinceNovember 2017 per ChineseCustom’s code 0802909040
• Import duty for Australianpecans is down to 4.8% andwill be down to zero in 2019due to FTA
Closing Comments Key Highlights This Year
• Global production continues to grow
• Increase funding available and efforts have begun to invest in expandedpecan research, promotion and public awareness efforts
• Prices paid to US growers declined after four consecutive years ofincreases
• Potential trade tariffs could impact export markets
26
Panel Discussion Topics
14
• What are the crop sizes in Argentina and Peru and what new acreage is being planted?(Sally)
• What are the prospects for the South Africa crop in the coming years? (Jill)• What are the prospects for the Australia crop in the coming years? (Richard)• What are the prospects for the China crop and what do we know about the current
situation with tariffs on pecans and the potential impact? (Cheng)• How can the APC improve timing and accuracy of crop reporting? Is there a way to get
accurate crop information as it comes in, as opposed to all data coming in after the cropseason is already over? (Steve)
• The NPSA is currently working on a shelf life study to help improve industry standards.Are there any other studies you think would be beneficial to the industry? (All)
• What can be done to help promote the propagation of native pecan trees? As theproduction of this variety continues to decline, smaller pecan sizes and grades willbecome more limited. (All)
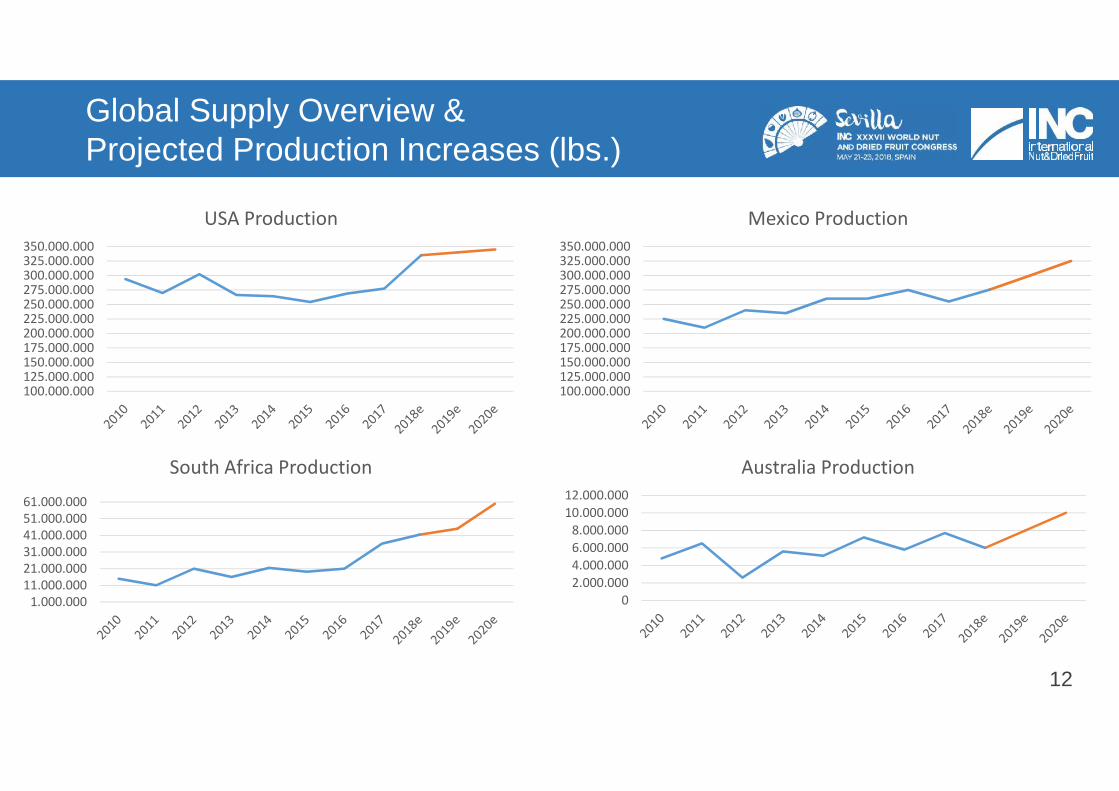
Global Supply Overview &Projected Production Increases (lbs.)
12
100.000.000125.000.000150.000.000175.000.000200.000.000225.000.000250.000.000275.000.000300.000.000325.000.000350.000.000
USA Production
100.000.000125.000.000150.000.000175.000.000200.000.000225.000.000250.000.000275.000.000300.000.000325.000.000350.000.000
Mexico Production
1.000.00011.000.00021.000.00031.000.00041.000.00051.000.00061.000.000
South Africa Production
02.000.0004.000.0006.000.0008.000.000
10.000.00012.000.000
Australia Production
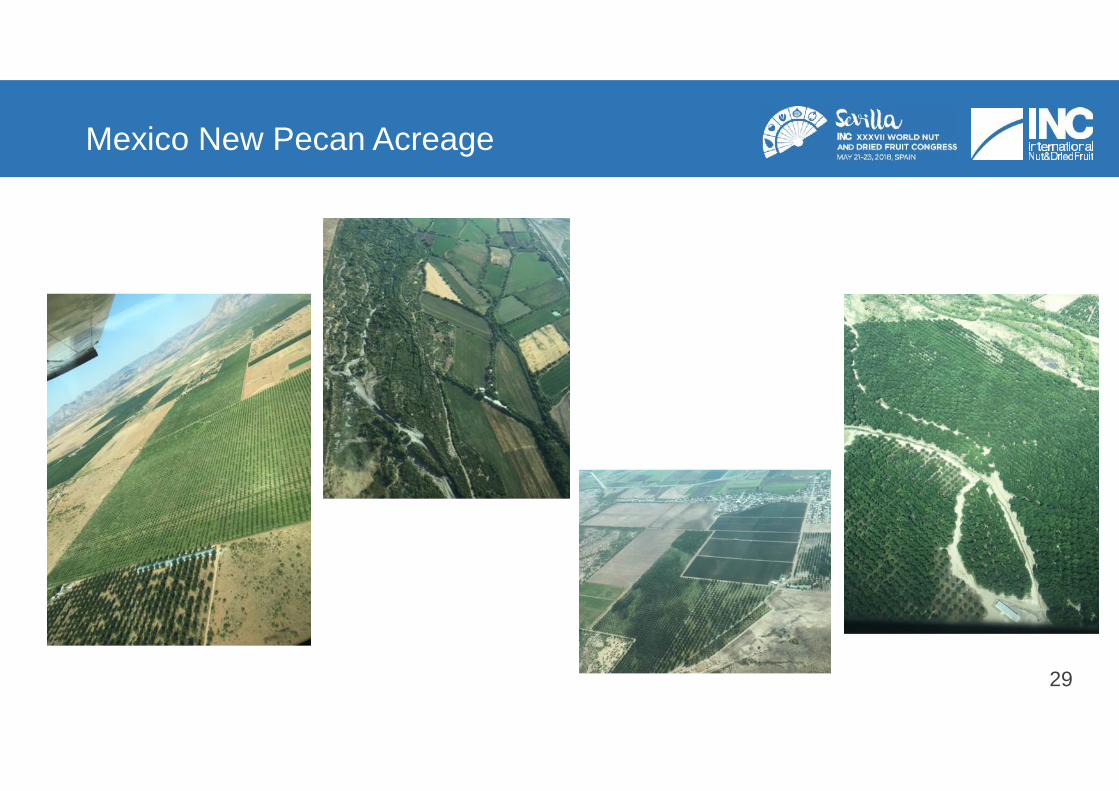
Mexico New Pecan Acreage
29
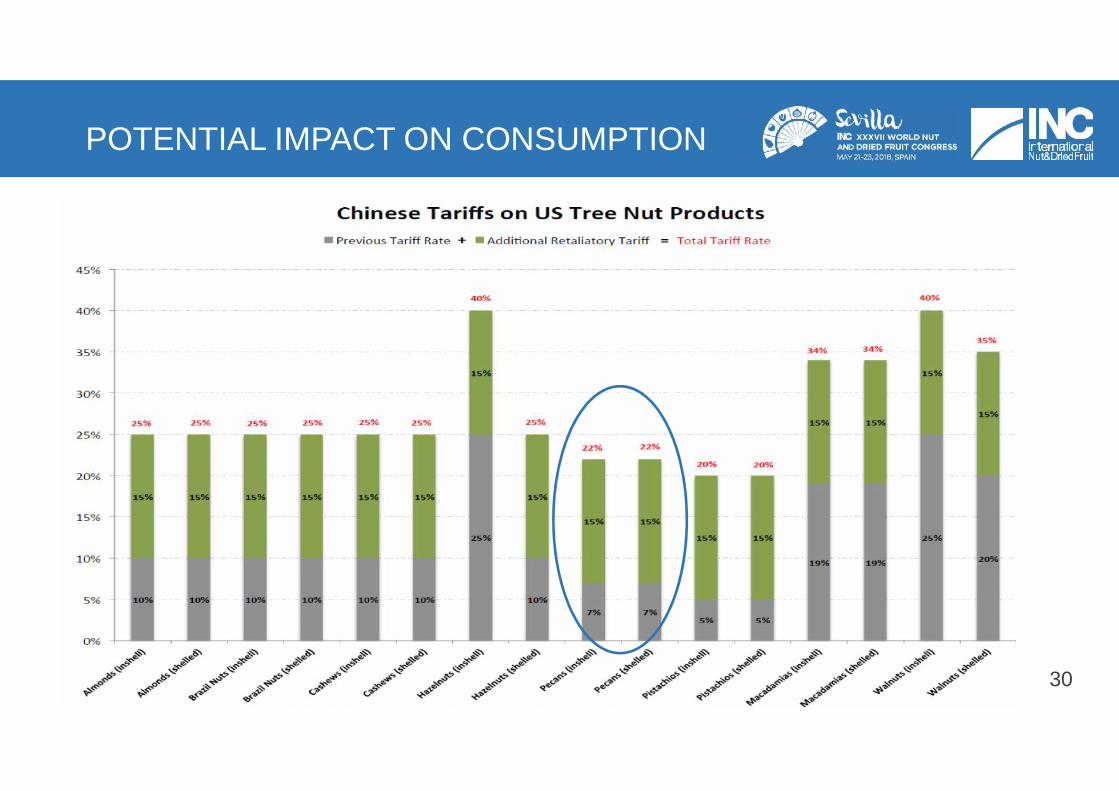
POTENTIAL IMPACT ON CONSUMPTION
30
QUESTIONS AND CLOSING COMMENTS
INC Discussion Questions From the Audience
31
PECAN ROUNDTABLE
32
Thank YouGraciasDankie谢谢