Peatland management impacts on flood regulation management impacts on flood regulation water@leeds...
25
Peatland management impacts on flood regulation water@leeds School of Geography University of Leeds Joseph Holden water@leeds
Transcript of Peatland management impacts on flood regulation management impacts on flood regulation water@leeds...

Peatland management
impacts on flood regulation
water@leeds
School of Geography
University of Leeds
Joseph Holden
water@leeds

Key points are:
• Impact of management on flood regulation from peatlands depends on: – Type of peat
– Its topographic and catchment location
– The intensity and configuration of management
– The location of management with respect to river channels – the same management on the same type of peat can have a very impact depending on where you are in the catchment and flood wave synchronicity
– There is more than just ‘a type of management’ to think about – I push for us to think about the surface condition of the peat (degradation etc) - to which management may contribute - as this may impact velocities of overland flow.

• There are many ways in which a flood
could be impacted by peatlands: for
example, the peak could be
reduced/increased, the timing could be
delayed/sped up or the volume changed.

The type of peat and its location
matters
• Valley peats, lowland fens, raised bogs, blanket
peat (lowland and upland) etc.
• Upland blanket peat is generally a source of
flooding.
• Lowland fen could be a sink for flooding (and
attenuate floods), but this really does depend on
management and topographic setting.
• Valley mires may act as buffers for floods (or
not, depending on season, and location).

• Flood storage service in some lowland
peatlands (e.g. Somerset Levels and Moors)
• North Drain catchment Somerset Levels - water
table levels pumped to 1-2 m below mean field
level during the winter. Should all land owners
raise water levels the 3.6 million m3 of flood
storage would not be available.

• Bullock and Acreman (2003) found that most,
but not all, studies (23 of 28) show that
floodplain wetlands reduce or delay floods, with
examples from all regions of the world.
• For headwaters, around half of the studies (11 of
20 for flood event volumes and 8 of 13 for wet
period flows) show that headwater wetlands
increase the immediate response of rivers to
rainfall, generating higher volumes of flood flow,
even if the peak flow is not increased

Upland blanket peat (87 % of peat in UK) is
source of quickflow
• High water tables (typically within 40 cm of the surface for 80 % of the time)
• Saturation-excess (‘overland flow’)
• Low hydraulic conductivity at depth

•Different vegetation types are also associated with different velocities of
flow over the peat surface
•Velocity of overland flow in 1024 plots for different slopes and cover types
and water depths
•Empirical data used to produce a model for peatland flow
0.001
0.01
0.1
1
0.001 0.01 0.1
depth, m
velo
cit
y, m
. s
-1
Unvegetated
Eriophorum
Sphagnum
Holden et al (2008) Water Resources Research
•A first order estimate of Darcy-Weisbach roughness and mean velocity can be
based on a single parameter for each peat surface cover.
Example shown here is a
modelled relationship between
mean flow depth and velocity on
a 10 % gradient.

The simulated hydrographs generated using for each vegetation re-
establishment and management scenario in the Hollinsclough catchment
1 is complete Sphagnum
cover and 2 is bare peat
= there are large
differences in flood peaks

Is there really a signal of vegetation change within the
hydrograph at the catchment scale?

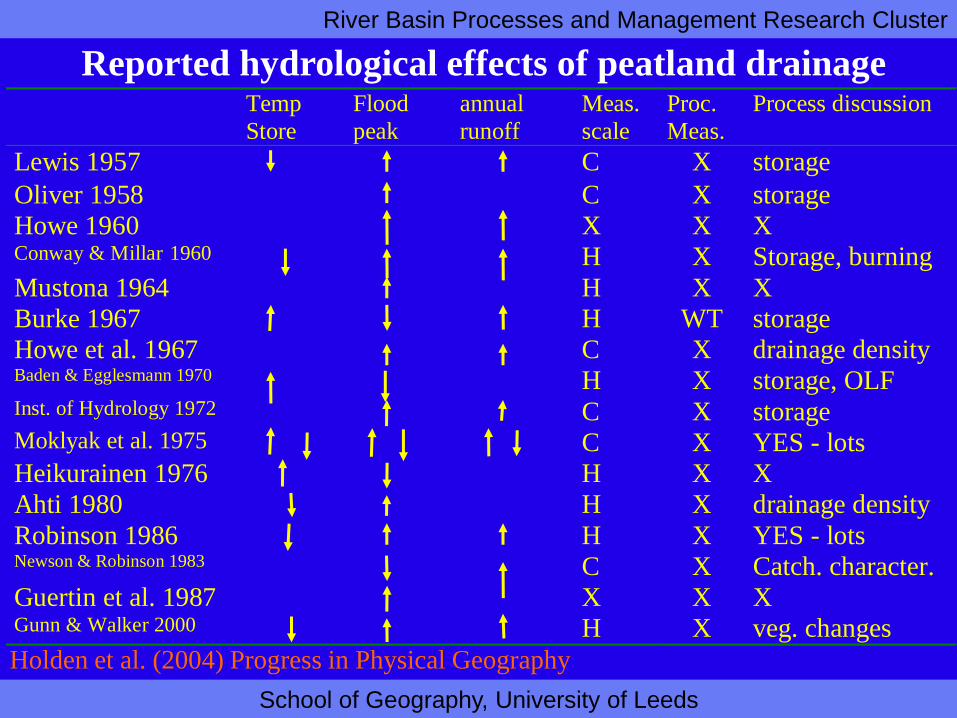
Temp
Store
Flood
peak
annual
runoff
Meas.
scale
Proc.
Meas.
Process discussion
Lewis 1957 C X storage
Oliver 1958 C X storage
Howe 1960 X X X Conway & Millar 1960 H X Storage, burning
Mustona 1964 H X X
Burke 1967 H WT storage
Howe et al. 1967 C X drainage density Baden & Egglesmann 1970 H X storage, OLF Inst. of Hydrology 1972 C X storage Moklyak et al. 1975 C X YES - lots
Heikurainen 1976 H X X
Ahti 1980 H X drainage density
Robinson 1986 H X YES - lots Newson & Robinson 1983 C X Catch. character.
Guertin et al. 1987 X X X Gunn & Walker 2000 H X veg. changes
Reported hydrological effects of peatland drainage
Holden et al. (2004) Progress in Physical Geography
River Basin Processes and Management Research Cluster
School of Geography, University of Leeds
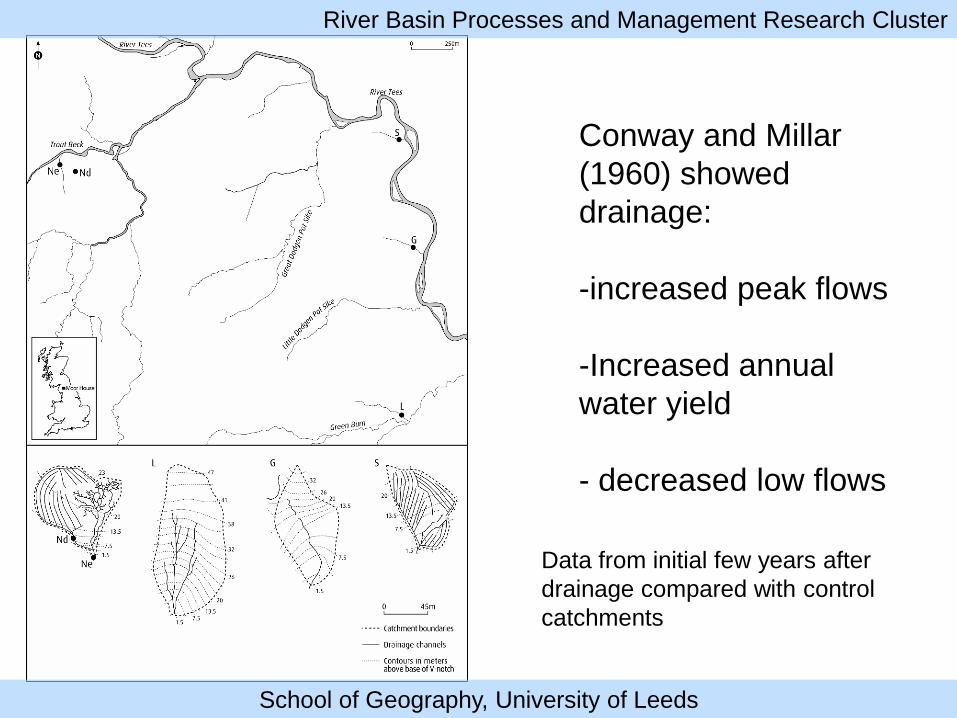
Conway and Millar
(1960) showed
drainage:
-increased peak flows
-Increased annual
water yield
- decreased low flows
River Basin Processes and Management Research Cluster
School of Geography, University of Leeds
Data from initial few years after
drainage compared with control
catchments

Long-term river flow change? • For exactly the same catchments as Conway and Miller:
• Compared data from 1950s with 2002-2004
• No change for undrained catchments in water yield or storm hydrograph characteristics
• Drained catchments had changed:
– Significantly increased yield (15 %)
– Lower peak flows
– Longer recession limbs
• Short-term studies immediately after drainage do not capture full nature of hydrological response and caution needed if predicting long-term change
Holden et al (2006) J. Environmental Quality
River Basin Processes and Management Research Cluster
School of Geography, University of Leeds
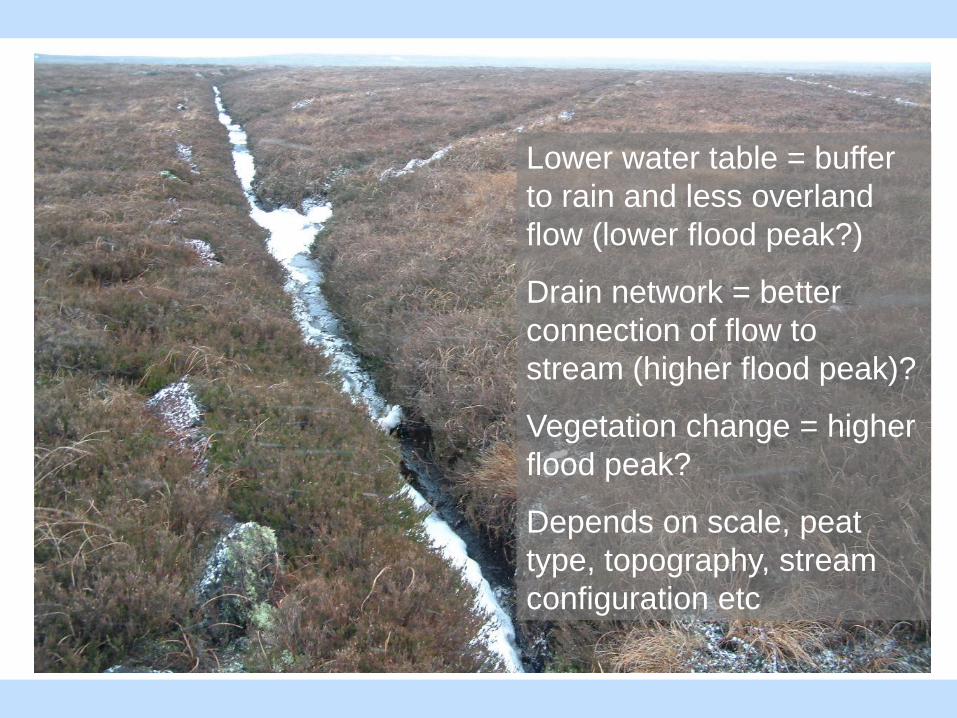
Lower water table = buffer
to rain and less overland
flow (lower flood peak?)
Drain network = better
connection of flow to
stream (higher flood peak)?
Vegetation change = higher
flood peak?
Depends on scale, peat
type, topography, stream
configuration etc

Geography of the catchment - flood-routing
River Basin Processes and Management Research Cluster
School of Geography, University of Leeds
Flood wave synchronicity is
crucial
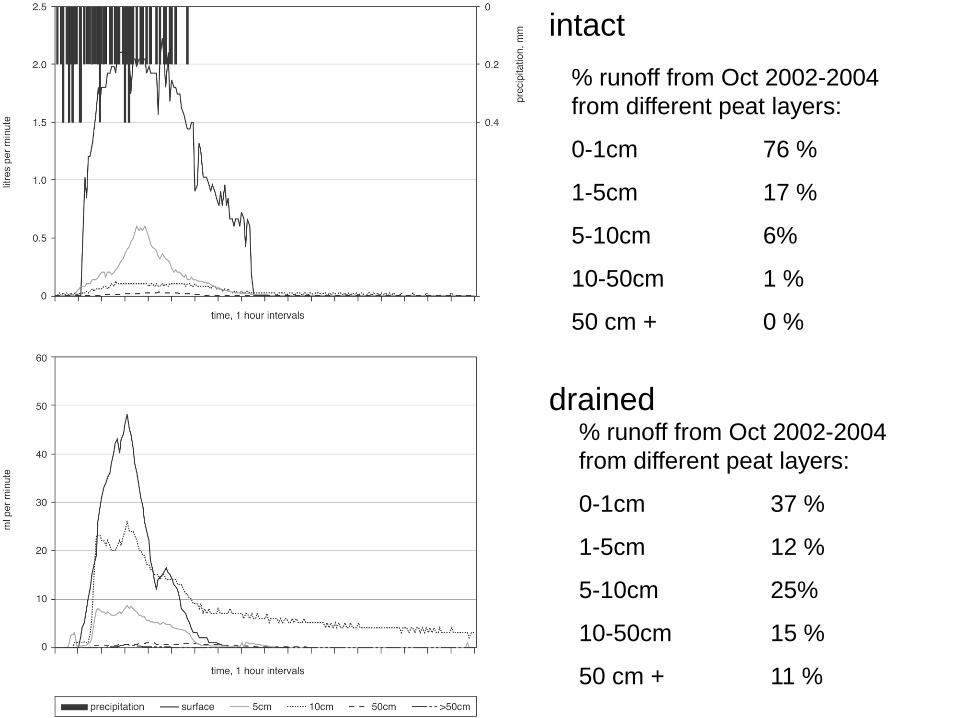
intact
drained
% runoff from Oct 2002-2004
from different peat layers:
0-1cm 76 %
1-5cm 17 %
5-10cm 6%
10-50cm 1 %
50 cm + 0 %
% runoff from Oct 2002-2004
from different peat layers:
0-1cm 37 %
1-5cm 12 %
5-10cm 25%
10-50cm 15 %
50 cm + 11 %
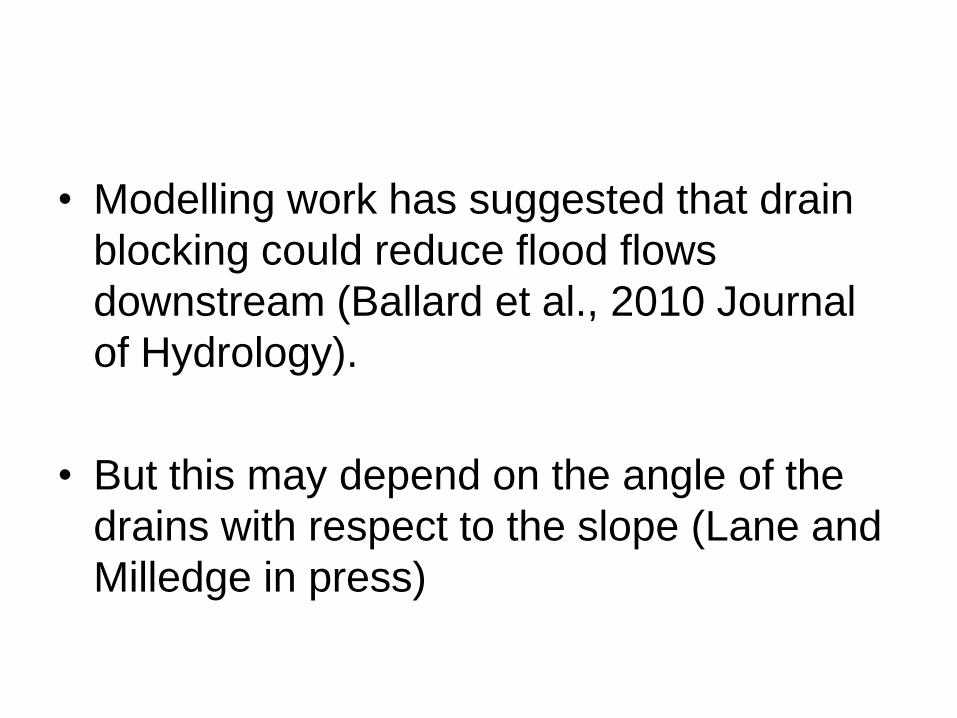
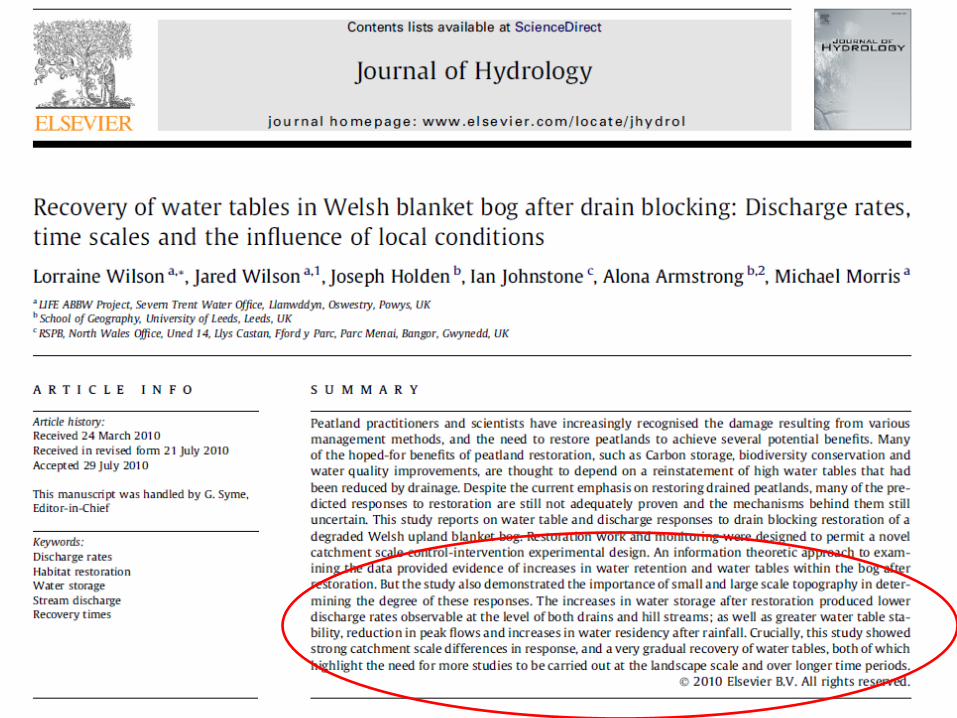
• Modelling work has suggested that drain
blocking could reduce flood flows
downstream (Ballard et al., 2010 Journal
of Hydrology).
• But this may depend on the angle of the
drains with respect to the slope (Lane and
Milledge in press)
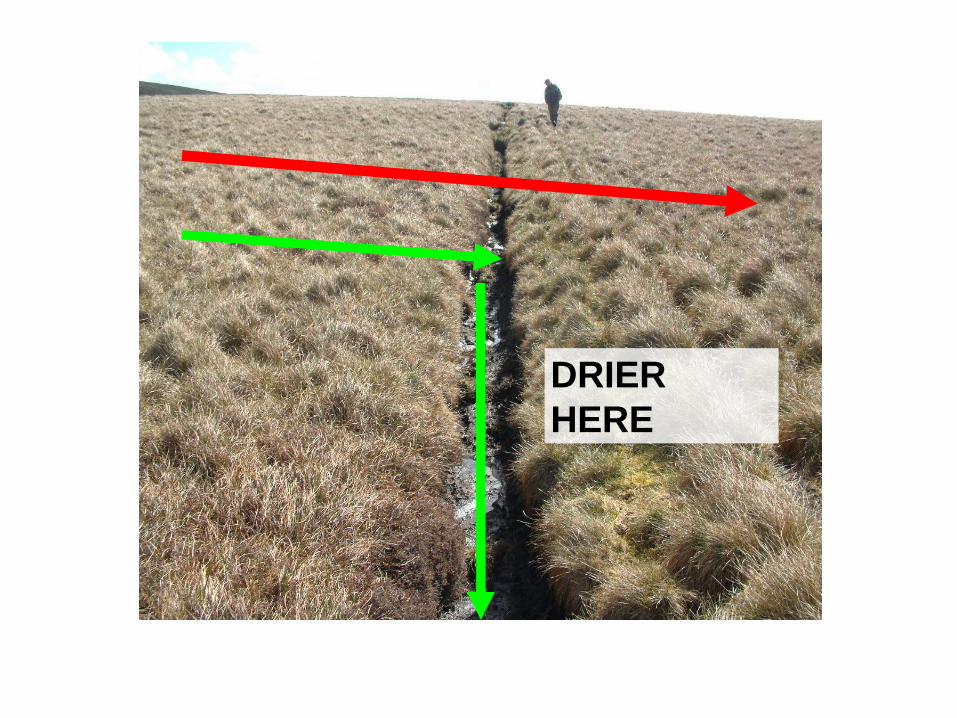
DRIER
HERE

Holden and Burt, 2003 J. Ecology

Area of catchment with topographic index affected by drains
Lane, Brookes, Holden and Kirkby (2004) Hydrological Processes


Interquartile range patterns in water
table for each month
water@leeds
0
2
4
6
8
10
12
14
16
18
20
Jan-
05
Feb-
05
Mar-
05
Apr-
05
May-
05
Jun-
05
Jul-
05
Aug-
05
Sep-
05
Oct-
05
Nov-
05
Dec-
05
Jan-
06
Feb-
06
Mar-
06
Apr-
06
May-
06
Jun-
06
d75-d
25,
cm
I1 I2
I3 I4
I5 I6
I7 I9
0
2
4
6
8
10
12
14
16
18
20
Jan-
05
Feb-
05
Mar-
05
Apr-
05
May-
05
Jun-
05
Jul-
05
Aug-
05
Sep-
05
Oct-
05
Nov-
05
Dec-
05
Jan-
06
Feb-
06
Mar-
06
Apr-
06
May-
06
Jun-
06
d75-d
25,
cm
D1 D2
D3 D4
D5 D6
D7 D8
D9
24.7
0
2
4
6
8
10
12
14
16
18
20
Jan-
05
Feb-
05
Mar-
05
Apr-
05
May-
05
Jun-
05
Jul-
05
Aug-
05
Sep-
05
Oct-
05
Nov-
05
Dec-
05
Jan-
06
Feb-
06
Mar-
06
Apr-
06
May-
06
Jun-
06
d75-d
25,
cm
B1 B2
B3 B4
B5 B6
B7 B8
B9

From Acreman and Holden in prep
(and diagram is not quite finalised)