Peak water limits to freshwater withdrawal and use - Proceedings of
8
Peak water limits to freshwater withdrawal and use Peter H. Gleick 1 and Meena Palaniappan Pacific Institute, 654 13th Street, Oakland, CA 94612 This contribution is part of the special series of Inaugural Articles by members of the National Academy of Sciences elected in 2006. Contributed by Peter H. Gleick, April 8, 2010 (sent for review February 22, 2010) Freshwater resources are fundamental for maintaining human health, agricultural production, economic activity as well as critical ecosystem functions. As populations and economies grow, new constraints on water resources are appearing, raising questions about limits to water availability. Such resource questions are not new. The specter of “peak oil”—a peaking and then decline in oil production—has long been predicted and debated. We pre- sent here a detailed assessment and definition of three concepts of “peak water”: peak renewable water, peak nonrenewable water, and peak ecological water. These concepts can help hydrologists, water managers, policy makers, and the public understand and manage different water systems more effectively and sustainably. Peak renewable water applies where flow constraints limit total water availability over time. Peak nonrenewable water is observa- ble in groundwater systems where production rates substantially exceed natural recharge rates and where overpumping or conta- mination leads to a peak of production followed by a decline, similar to more traditional peak-oil curves. Peak “ecological” water is defined as the point beyond which the total costs of ecological disruptions and damages exceed the total value provided by human use of that water. Despite uncertainties in quantifying many of these costs and benefits in consistent ways, more and more watersheds appear to have already passed the point of peak water. Applying these concepts can help shift the way freshwater resources are managed toward more productive, equitable, effi- cient, and sustainable use. surface water ∣ water use ∣ sustainable water management T he Earth has substantial water resources, in numerous forms and qualities, in various stocks and flows in the hydrologic cycle. Overall, the planet has a stock of approximately 1.4 billion cubic kilometers of water, the vast majority of which (nearly 97%) is salt water in the oceans. The world’s more limited freshwater stocks are estimated at around 35 million cubic kilometers. Most fresh water, however, is locked up in glaciers in Antarctica and Greenland, in permanent snow cover in mountains or high latitudes, or in deep groundwater inaccessible to humans for practical reasons. Only small fractions are readily available to humans in river flows, accessible surface lakes and groundwater, soil moisture, or rainfall (1). Table 1 shows the distribution of the main components of the world’s water. Serious water challenges face humanity, including the failure to meet basic human needs for safe water and sanitation for billions, growing contamination of water with human and indus- trial wastes, the consequences of extreme events such as floods and droughts, ecological disruption in aquatic ecosystems, in- creasing concerns about water shortages and scarcity, and the growing risks from climatic changes that will affect regional hydrology and water management. Considering the total volume of water on Earth, however, the concept of “running out” of water at the global scale is of little practical utility. There are huge volumes of water—many thousands of times the volumes that hu- mans appropriate for all purposes. In the early 2000s, total global withdrawals of water were approximately 3;700 km 3 per year, a tiny fraction of the estimated stocks of fresh water (2). A more accurate way to evaluate human uses of water, how- ever, would look at regional stocks and flows of water and the impact of human appropriations at various scales through the use of rainfall, surface and groundwater stocks, and soil moisture. An early effort to evaluate these uses estimated that substantially more water in the form of rain and soil moisture—perhaps 11;300 km 3 ∕yr—is appropriated for human-dominated land uses such as cultivated land, landscaping, and to provide forage for grazing animals. Overall, that assessment concluded that humans already appropriate over 50% of all renewable and “accessible” freshwater flows, including a fairly large fraction of water that is used in-stream for dilution of human and industrial wastes (3). It is important to note, however, that these uses are of the “renew- able” flows of water, which we explain below. In theory, the use of renewable flows can continue indefinitely without any effect on future availability. Still, although many flows of water are renew- able, some uses of water will degrade the quality to a point that constrains the kinds of use possible. In the past few years, various resource crises around water, energy, and food have led to new debates over definitions and concepts about sustainable resource management and use. Some energy experts have proposed that the world is approaching, or has even passed, the point of maximum production of petroleum, or peak oil (4–7). More recently, there has been a growing dis- cussion of whether we are also approaching a comparable point for water resources, where natural limits will constrain growing populations and economic expansion. In this article, we define the concept of peak water and we evaluate the similarities and differences between water and oil, how relevant this idea is to actual hydrologic and water-management challenges, and the implications of limits on freshwater availability for human and ecosystem wellbeing. Regional water scarcity is a significant and growing problem. Many possible indicators have been developed to measure water scarcity, including both single-factor and weighted water mea- sures (8). The United Nations has offered a definition of water stress as regions where water consumption exceeds 10% of renewable freshwater resources. Other definitions set per-capita availability standards for defining scarcity (9–12). These kinds of indicators inform decision making and offer insights into progress on addressing water problems, but no single measure can com- pletely describe the characteristics of water scarcity. Despite the lack of clear and specific measures of scarcity, it is increas- ingly apparent that some regions are experiencing limits to growth in water use due to natural, ecological, political, or economic constraints. Concept of Peak Resource Production The theory of peak resource production originated in the 1950s with the work of geologist M. King Hubbert and colleagues who suggested that the rate of oil production would likely be characterized by several phases that follow a bell-shaped curve (13). The first phase is the discovery and rapid increase in growth in the rate of exploitation of oil as demand rises, production Author contributions: P.H.G. designed research; P.H.G. and M.P. performed research; P.H.G. and M.P. contributed new reagents/analytic tools; P.H.G. and M.P. analyzed data; and P.H.G. and M.P. wrote the paper. The authors declare no conflict of interest. 1 To whom correspondence should be addressed. E-mail: [email protected]. www.pnas.org/cgi/doi/10.1073/pnas.1004812107 PNAS ∣ June 22, 2010 ∣ vol. 107 ∣ no. 25 ∣ 11155–11162 SUSTAINABILITY SCIENCE INAUGURAL ARTICLE
Transcript of Peak water limits to freshwater withdrawal and use - Proceedings of

Peak water limits to freshwater withdrawal and usePeter H. Gleick1 and Meena Palaniappan
Pacific Institute, 654 13th Street, Oakland, CA 94612
This contribution is part of the special series of Inaugural Articles by members of the National Academy of Sciences elected in 2006.
Contributed by Peter H. Gleick, April 8, 2010 (sent for review February 22, 2010)
Freshwater resources are fundamental for maintaining humanhealth, agricultural production, economic activity as well as criticalecosystem functions. As populations and economies grow, newconstraints on water resources are appearing, raising questionsabout limits to water availability. Such resource questions arenot new. The specter of “peak oil”—a peaking and then declinein oil production—has long been predicted and debated. We pre-sent here a detailed assessment and definition of three concepts of“peak water”: peak renewable water, peak nonrenewable water,and peak ecological water. These concepts can help hydrologists,water managers, policy makers, and the public understand andmanage different water systems more effectively and sustainably.Peak renewable water applies where flow constraints limit totalwater availability over time. Peak nonrenewable water is observa-ble in groundwater systems where production rates substantiallyexceed natural recharge rates and where overpumping or conta-mination leads to a peak of production followed by a decline,similar to more traditional peak-oil curves. Peak “ecological”wateris defined as the point beyond which the total costs of ecologicaldisruptions and damages exceed the total value provided byhuman use of that water. Despite uncertainties in quantifyingmany of these costs and benefits in consistent ways, more andmore watersheds appear to have already passed the point of peakwater. Applying these concepts can help shift the way freshwaterresources are managed toward more productive, equitable, effi-cient, and sustainable use.
surface water ∣ water use ∣ sustainable water management
The Earth has substantial water resources, in numerous formsand qualities, in various stocks and flows in the hydrologic
cycle. Overall, the planet has a stock of approximately 1.4 billioncubic kilometers of water, the vast majority of which (nearly 97%)is salt water in the oceans. The world’s more limited freshwaterstocks are estimated at around 35 million cubic kilometers. Mostfresh water, however, is locked up in glaciers in Antarctica andGreenland, in permanent snow cover in mountains or highlatitudes, or in deep groundwater inaccessible to humans forpractical reasons. Only small fractions are readily available tohumans in river flows, accessible surface lakes and groundwater,soil moisture, or rainfall (1). Table 1 shows the distribution of themain components of the world’s water.
Serious water challenges face humanity, including the failureto meet basic human needs for safe water and sanitation forbillions, growing contamination of water with human and indus-trial wastes, the consequences of extreme events such as floodsand droughts, ecological disruption in aquatic ecosystems, in-creasing concerns about water shortages and scarcity, and thegrowing risks from climatic changes that will affect regionalhydrology and water management. Considering the total volumeof water on Earth, however, the concept of “running out” ofwater at the global scale is of little practical utility. There are hugevolumes of water—many thousands of times the volumes that hu-mans appropriate for all purposes. In the early 2000s, total globalwithdrawals of water were approximately 3;700 km3 per year, atiny fraction of the estimated stocks of fresh water (2).
A more accurate way to evaluate human uses of water, how-ever, would look at regional stocks and flows of water and the
impact of human appropriations at various scales through theuse of rainfall, surface and groundwater stocks, and soil moisture.An early effort to evaluate these uses estimated that substantiallymore water in the form of rain and soil moisture—perhaps11;300 km3∕yr—is appropriated for human-dominated land usessuch as cultivated land, landscaping, and to provide forage forgrazing animals. Overall, that assessment concluded that humansalready appropriate over 50% of all renewable and “accessible”freshwater flows, including a fairly large fraction of water that isused in-stream for dilution of human and industrial wastes (3). Itis important to note, however, that these uses are of the “renew-able” flows of water, which we explain below. In theory, the use ofrenewable flows can continue indefinitely without any effect onfuture availability. Still, although many flows of water are renew-able, some uses of water will degrade the quality to a point thatconstrains the kinds of use possible.
In the past few years, various resource crises around water,energy, and food have led to new debates over definitions andconcepts about sustainable resource management and use. Someenergy experts have proposed that the world is approaching, orhas even passed, the point of maximum production of petroleum,or peak oil (4–7). More recently, there has been a growing dis-cussion of whether we are also approaching a comparable pointfor water resources, where natural limits will constrain growingpopulations and economic expansion. In this article, we definethe concept of peak water and we evaluate the similarities anddifferences between water and oil, how relevant this idea is toactual hydrologic and water-management challenges, and theimplications of limits on freshwater availability for human andecosystem wellbeing.
Regional water scarcity is a significant and growing problem.Many possible indicators have been developed to measure waterscarcity, including both single-factor and weighted water mea-sures (8). The United Nations has offered a definition of waterstress as regions where water consumption exceeds 10% ofrenewable freshwater resources. Other definitions set per-capitaavailability standards for defining scarcity (9–12). These kinds ofindicators inform decision making and offer insights into progresson addressing water problems, but no single measure can com-pletely describe the characteristics of water scarcity. Despitethe lack of clear and specific measures of scarcity, it is increas-ingly apparent that some regions are experiencing limits togrowth in water use due to natural, ecological, political, oreconomic constraints.
Concept of Peak Resource ProductionThe theory of peak resource production originated in the 1950swith the work of geologist M. King Hubbert and colleagues whosuggested that the rate of oil production would likely becharacterized by several phases that follow a bell-shaped curve(13). The first phase is the discovery and rapid increase in growthin the rate of exploitation of oil as demand rises, production
Author contributions: P.H.G. designed research; P.H.G. and M.P. performed research;P.H.G. and M.P. contributed new reagents/analytic tools; P.H.G. and M.P. analyzed data;and P.H.G. and M.P. wrote the paper.
The authors declare no conflict of interest.1To whom correspondence should be addressed. E-mail: [email protected].
www.pnas.org/cgi/doi/10.1073/pnas.1004812107 PNAS ∣ June 22, 2010 ∣ vol. 107 ∣ no. 25 ∣ 11155–11162
SUSTAINABILITY
SCIENCE
INAUGURA
LART
ICLE

becomes more efficient, and costs fall. Second, as stocks of oil areconsumed and the resource becomes increasingly depleted, costsrise and production levels off and peaks at a point now known aspeak oil. Finally, increasing scarcity and costs lead to a decline inthe rate of production more quickly than new supplies can befound or produced. This last phase would also be typically accom-panied by the substitution of alternatives. The phrase peak oilrefers to the point at which approximately half of the existingstock of petroleum has been depleted and the rate of productionpeaks (see Fig. 1). In a now-classic paper, Hubbert (1956)predicted that oil production in the United States would peakbetween 1965 and 1970 (13). In 1970, oil production in theUnited States reached a maximum and began to decline (Fig. 2).The concept of a roughly bell-shaped oil production curve hasbeen proven for a well, an oil field, a region, and is thought tohold true worldwide.
In recent years, the concept of peak oil has received renewedattention because of growing concern that the world as a whole isapproaching the point of declining petroleum production. No oneknows when global oil production will actually peak, and forecastsof the date range from early in the 21st century to after 2025. Oneof many recent estimates suggests that oil production may peak asearly as 2012 at 100 million barrels of oil per day (15). The actual
peak of production will only be identified in hindsight, and itstiming depends on the demand and cost of oil, the economicsof technologies for extracting oil, the rate of discovery of new re-serves compared to the rate of extraction, the cost of alternativeenergy sources, and political factors.
Comparison of Peak Production in Oil and WaterDoes production or use of water follow a similar bell-shapedcurve? In the growing concern about global and local watershortages and scarcity, is the concept of peak water valid and use-ful to hydrologists, water planners, managers, and users? In thefollowing sections, we consider the differences and similaritiesbetween oil and water to evaluate whether a peak in the produc-tion of water is possible, and in what contexts it may be relevant.
Key Characteristics of Renewable and Nonrenewable Resources. Inany comparison among resources, it is vital to distinguish betweenrenewable and nonrenewable resources. The key difference be-tween these is that renewable resources are flow or rate limited;nonrenewable resources are stock limited (16). Stock-limitedresources, especially fossil fuels, can be depleted without beingreplenished on a timescale of practical interest. Stocks of oil, forexample, accumulated over millions of years; the volume of oilstocks is thus effectively independent of any natural rates of re-plenishment because such rates are so slow. Conversely, renew-able resources, such as solar energy, are virtually inexhaustibleover time, because their use does not diminish the productionof the next unit. Such resources are, however, limited by the flowrate, i.e., the amount available per unit time. Our use of solar
Table 1. Major stocks of water on Earth (34)
Distribution area,103 km2
Volume,103 km3
Percent of totalwater, %
Percent offresh water, %
Total water 510,000 1.386 million 100 —Total freshwater 149,000 35,000 2.53 100World oceans 361,300 1.340 million 96.5 —Saline groundwater — 13,000 1 —Fresh groundwater — 10,500 0.76 30Antarctic glaciers 13,980 21,600 1.56 61.7Greenland glaciers 1,800 2,340 0.17 6.7Arctic islands 226 84 0.006 0.24Mountain glaciers 224 40.6 0.003 0.12Ground ice/permafrost 21,000 300 0.022 0.86Saline lakes 822 85.4 0.006 —Freshwater lakes 1,240 91 0.007 0.26Wetlands 2,680 11.5 0.0008 0.03Rivers (as flows on average) — 2.12 0.0002 0.006In biological matter — 1.12 0.0001 0.0003In the atmosphere (on average) — 12.9 0.0001 0.04
Ann
ual P
rodu
ctio
n of
Oil
Time
Half of oil produced – Peak inoil production
Fig. 1. There is no reason actual peak resource curves have to followsymmetrical bell curves.
0
2000
4000
6000
8000
10000
12000
1900
1905
1910
1915
1920
1925
1930
1935
1940
1945
1950
1955
1960
1965
1970
1975
1980
1985
1990
1995
2000
2005
Tho
usan
d ba
rrel
s pe
r da
y (a
vera
ge)
Fig. 2. Total annual US production of crude oil, 1900–2007. US productionpeaked in 1970 (14, 33).
11156 ∣ www.pnas.org/cgi/doi/10.1073/pnas.1004812107 Gleick and Palaniappan

energy has no effect on the next amount produced by the sun, butour ability to capture solar energy is limited to the rate at which itis delivered.
Water demonstrates characteristics of both renewable andnonrenewable resources. This dual characteristic of water has im-plications for the applicability of the term peak water. Water islargely a renewable resource with rapid flows from one stockand form to another, and the human use of water typically hasno effect on natural recharge rates. But there are also fixed orisolated stocks of local water resources that are being consumedat rates far faster than natural rates of renewal. Most of thesenonrenewable resources are groundwater aquifers—often called“fossil” aquifers because of their slow-recharge rates. Tiwari et al.(17) recently calculated that a substantial fraction of water usedin India comes from nonrenewable groundwater withdrawals, andthat water ends up in the oceans, incrementally raising sea levels,but substantially depleting groundwater stocks. Syed et al. (18)found similar transfers of nonrenewable groundwater for a widevariety of groundwater basins using new data from the GRACEsatellite. Some surface water storage in the form of lakes or gla-ciers can also be used in a nonrenewable way where consumptionrates exceed natural renewal, a problem that may be worsened byclimate change, as noted below.
Consumptive vs. Nonconsumptive Uses. Another key factor inevaluating the utility of the concept of a resource peak is whetherresource use is “consumptive” or “nonconsumptive.” Practicallyevery use of petroleum is consumptive; once the energy is ex-tracted and used, it is degraded in quality.* Almost every year,the amount of oil consumed matches the amount of oil produced,and sometimes we consume more than is produced that year.Thus a production curve for oil is solely dependent on accessto new oil.
Not all uses of water are consumptive and even water that hasbeen “consumed” is not lost to the hydrologic cycle or to futureuse—it is recycled by natural systems. Consumptive use of watertypically refers to uses that make that water unavailable forimmediate or short-term reuse within the same watershed. Suchconsumptive uses include water that has been evaporated, tran-spired, incorporated into products or crops, heavily conta-minated, or consumed by humans or animals. As discussed inthe section on the renewability of water resources, some stocksof water can be consumed locally, making them, effectively, non-renewable resources. When withdrawals are not replaced on atimescale of interest to society, eventually that stock becomesdepleted. The water itself remains in the hydrologic cycle, inanother stock or flow, but it is no longer available for use inthe region originally found. There are also many nonconsumptiveuses of water, including water used for cooling in industrial andenergy production, and water used for washing, flushing, or otherresidential uses if that water can be collected, treated, and reused.This water recycles into the overall hydrological cycle and has noeffect on subsequent water availability in a region.
Substitutability. Another important characteristic of peak re-source discussions is the potential to substitute alternatives fornonrenewable sources. As oil production declines and prices in-crease, substitutes that offer the same benefits become increas-ingly attractive. Oil serves particular functions in industrialsociety that can be satisfied by other means or resources (solar,natural gas, biofuels, etc.). In this sense, any depletable resourcesuch as fossil fuels must be considered a transition option, usefulonly as long as its availability falls within economic and environ-mental limits. Like energy, water is used for a wide variety of pur-
poses. And like energy, the efficiency of water use can be greatlyimproved by changes in technologies and processes. Unlike oil,however, fresh water is the only substance capable of meetingcertain needs. Thus, although other energy sources can substitutefor oil, water has no substitutes for most uses.
When limits to water availability in a given region are reached,there are a few possible options to meet additional needs: redu-cing demand, substituting one use of water for another that hashigher economic or social value, physically moving the demandfor water to a region where additional water is available; or in-vesting in a higher priced source of supply, including bulk importsor transfers of water. In this case, the cost of new supply, inclu-ding the cost of transporting water, is a limiting factor.
A relevant concept to both peak water and peak oil, therefore,is the introduction of a “backstop” technology when the price ofthe resource rises, a concept given prominence by Nordhaus (19).As oil production peaks and then declines, the price of oil will risein the classic “supply/demand” economic response. Prices willcontinue to rise until the point when a substitute, or backstop,for oil becomes economically competitive, at which point priceswill stabilize at the new backstop price. Nordhaus (19) noted thata backstop alternative is one capable of meeting the demand andthat has a virtually infinite resource base.
Similarly, for water, as cheaper sources of water are depletedor allocated, more and more expensive sources must be foundand brought to the user, either from new supplies or reallocationof water among existing users. Fig. 3 graphs a potential water-production scenario in a watershed, where incremental supplyincreases through supply side projects, e.g., groundwater harvest-ing, in-stream flow allocation, and reservoir construction arelayered upon each other until the maximum cost-effective extrac-tion of surface and groundwater is reached.
Ultimately, the backstop price for water will also be reached.Unlike oil, however, which must be backstopped by a different,renewable energy source, the ultimate water backstop is stillwater, from an essentially unlimited source—for example,desalination of ocean water. The amount of water in the oceansthat humans can use is limited only by how much we are willing topay to remove salts and transport it to the point of use, and by theenvironmental constraints of using it. In some regions, desali-nation is already an economically competitive alternative, parti-cularly where water is scarce compared to demand, such ascertain islands in the Caribbean and parts of the PersianGulf (20, 21).
Incremental increases in supply from various sources Maximum cost-
effective extraction of surface and ground water reached
Shift to higher cost sources of water (e.g., desalination, water transfers) to meet increased water needs
Time
Pro
duct
ion
of W
ater
fro
m V
ario
us S
ourc
es
Fig. 3. A potential water-production (supply) scenario in a watershed orregion. As demand increases, incremental supply projects (new dams, reser-voirs, pumping) increase water availability. Once the maximum cost-effectiveextraction of surface and groundwater is reached, there is a final shift to ahigher cost backstop supply of water such as desalination or water transfers.
*Due to the law of conservation of energy, energy is never consumed—simply convertedto another form. But in this case, the use of oil converts concentrated, high-qualityenergy into low-quality, unusable waste heat, effectively “consuming” the oil.
Gleick and Palaniappan PNAS ∣ June 22, 2010 ∣ vol. 107 ∣ no. 25 ∣ 11157
SUSTAINABILITY
SCIENCE
INAUGURA
LART
ICLE
Transportability. The concept of running out of water at the globalscale is of little practical use. Huge volumes of water over andabove the volumes used by humans for all purposes are distri-buted around the world in various stocks. Because the Earth willnever “run out” of fresh water, concerns about water scarcitymust, therefore, be the result of something other than a fear thatwe are literally consuming a limited resource. And, of course,they are: Water challenges are the result of the tremendously un-even geographic distribution of water (due to both natural andhuman factors), the economic and physical constraints on tappingsome of the largest volumes of freshwater (such as deep ground-water and ice in Antarctica and Greenland), human contamina-tion of some readily available stocks, and the high costs of movingwater from one place to another.
This last point—the “transportability” of water—is particularlyrelevant to the concept of peakwater.Oil is transported around theworld because it has a high economic value compared to the cost oftransportation. For example, one of today’s supertankers carries asmuch as 3.6 million barrels of oil. At a price of $70 per barrel, thatoil is worth over $250million dollars and the cost of transportationis minor. As a result, regional limits on oil availability can be over-come by moving oil from any point of production to any point ofuse. In contrast, water is very expensive tomove any large distance,compared to its value. That same supertanker filled with fresh-water would have an economic value of only around $500,000†—
far too little to support long-distance shipping and regionalconstraints become a legitimate and serious concern.
As a result, media attention to the concept of peak water hasfocused on local water scarcity and challenges, for good reason.But there has been little or no academic research or analysis on thisconcept. In regions where water is scarce, the apparent nature ofwater constraints—and hence, some of the real implications of a“peak” in availability—are already apparent. Because the costsof transporting bulk water from one place to another are so high,once a region’s water use exceeds its renewable supply, it will begintapping into nonrenewable resources, such as slow-rechargeaquifers. Once extraction of water exceeds natural rates of reple-nishment, the only long-term options are to reduce demand to sus-tainable levels, move the demand to an area where water is avail-able, or to shift to increasingly expensive sources, such asdesalinationor importsofgoodsproduced inregionswithadequatewater supplies, the transfer of so-called virtual water (22).
There are very few exceptions to the economic limits on trans-porting water. Bottled water is sometimes consumed vastdistances from where it was produced only because it commandsa premium far above normal costs. Growth in bottled water con-sumption may expand in some markets, but overall, bulk water isnot currently a significant export in commercial markets because
of the economic limits to transport and total volumes moved anysignificant distance are a tiny fraction of total urban or agricul-tural demands.
Three Peak Water ConceptsTable 2 summarizes the characteristics of oil and water discussedabove. Given the physical and economic characteristics ofresources reviewed above, how relevant or useful is the conceptof a peak in the production of water? We offer here three defini-tions where the concept of a peak is useful in the context of waterresources and we introduce a term that is useful when thinkingabout maximizing the multiple services that water provides: “peakecological water.” These peak water concepts should help driveimportant paradigm shifts in how water is used and managed.
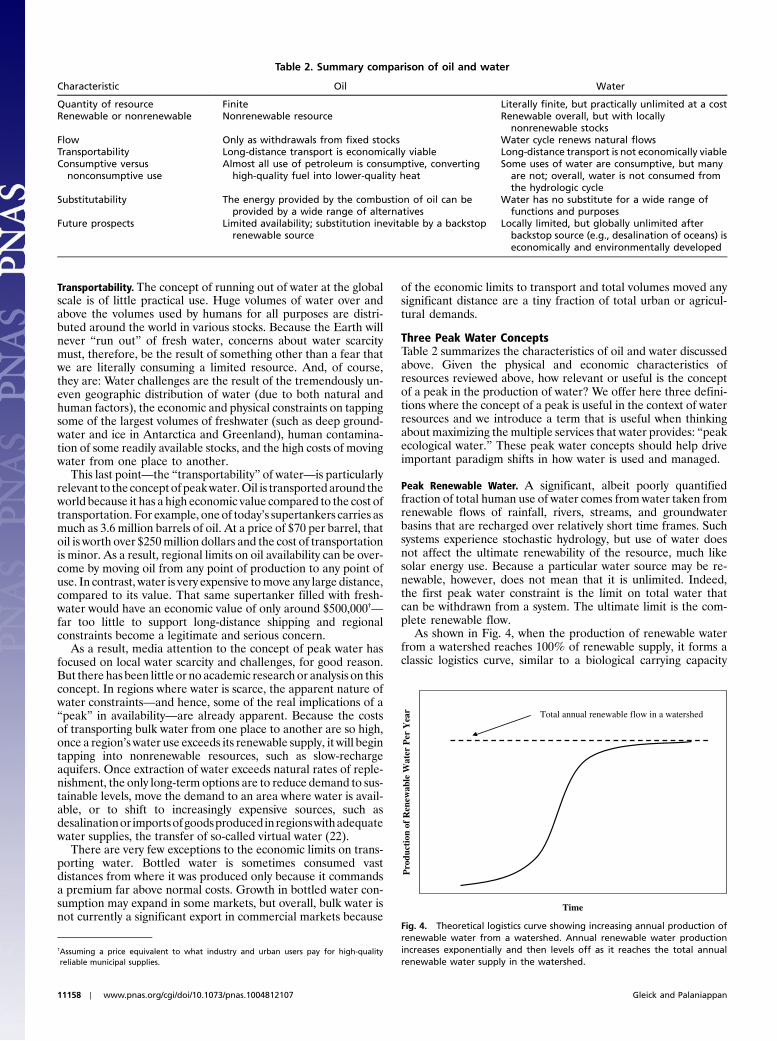
Peak Renewable Water. A significant, albeit poorly quantifiedfraction of total human use of water comes from water taken fromrenewable flows of rainfall, rivers, streams, and groundwaterbasins that are recharged over relatively short time frames. Suchsystems experience stochastic hydrology, but use of water doesnot affect the ultimate renewability of the resource, much likesolar energy use. Because a particular water source may be re-newable, however, does not mean that it is unlimited. Indeed,the first peak water constraint is the limit on total water thatcan be withdrawn from a system. The ultimate limit is the com-plete renewable flow.
As shown in Fig. 4, when the production of renewable waterfrom a watershed reaches 100% of renewable supply, it forms aclassic logistics curve, similar to a biological carrying capacity
Table 2. Summary comparison of oil and water
Characteristic Oil Water
Quantity of resource Finite Literally finite, but practically unlimited at a costRenewable or nonrenewable Nonrenewable resource Renewable overall, but with locally
nonrenewable stocksFlow Only as withdrawals from fixed stocks Water cycle renews natural flowsTransportability Long-distance transport is economically viable Long-distance transport is not economically viableConsumptive versus
nonconsumptive useAlmost all use of petroleum is consumptive, converting
high-quality fuel into lower-quality heatSome uses of water are consumptive, but many
are not; overall, water is not consumed fromthe hydrologic cycle
Substitutability The energy provided by the combustion of oil can beprovided by a wide range of alternatives
Water has no substitute for a wide range offunctions and purposes
Future prospects Limited availability; substitution inevitable by a backstoprenewable source
Locally limited, but globally unlimited afterbackstop source (e.g., desalination of oceans) iseconomically and environmentally developed
Total annual renewable flow in a watershed
Time
Pro
duct
ion
of R
enew
able
Wat
er P
er Y
ear
Fig. 4. Theoretical logistics curve showing increasing annual production ofrenewable water from a watershed. Annual renewable water productionincreases exponentially and then levels off as it reaches the total annualrenewable water supply in the watershed.
†Assuming a price equivalent to what industry and urban users pay for high-qualityreliable municipal supplies.
11158 ∣ www.pnas.org/cgi/doi/10.1073/pnas.1004812107 Gleick and Palaniappan

model. Each watershed only has a certain amount of renewablewater supply that is replenished every year. If the annual produc-tion of renewable water from a watershed began to increase ex-ponentially, it approaches the natural limit of the total annualrenewable supply of water (shown as a dashed line). This limitvaries, of course, with natural variation in hydrology, but it isthe ultimate limit in terms of appropriation of renewable watersupply. The appropriate practical limit may be substantially lessthan this, as discussed below under Peak Ecological Water.Increasing annual renewable water use to the theoreticalrenewable limit has been shown to result in tremendous ecologi-cal, environmental, and human damage.
For a number of major river basins, peak renewable waterlimits have already been reached as human demand consumesclose to the entire annual supply. The Colorado River in the Uni-ted States, for example, is shared by seven US states and Mexico,and in an average year little or no water reaches the delta (seeFig. 5). For this watershed, the limit of peak renewable water is anaverage of around 18 billion cubic meters annually—the totalaverage annual flow. Other rivers are increasingly reaching theirpeak limits as well, including the Huang He (Yellow River) inChina, the Nile in Northern Africa, and the Jordan in the MiddleEast, where formerly perennial river flows now often fall to zero.Under other circumstances, as noted below, peak renewablewater systems can sometimes be turned into nonrenewablesystems through physical or chemical processes.
Peak Nonrenewable Water. In some watersheds, a substantialamount of current water use comes from stocks of water thatare effectively nonrenewable, such as groundwater aquifers withvery slow-recharge rates or groundwater systems that lose theirability to be recharged when overpumped due to compactionor other physical changes in the basin. When the use of waterfrom a groundwater aquifer far exceeds the natural recharge rate,this stock of groundwater will be quickly depleted. Or whengroundwater aquifers become contaminated with pollutants thatmake the water unusable, a renewable aquifer can become non-renewable.
In these particular situations, the groundwater aquifer is clo-sely analogous to an oil field or oil-producing region. Continuedproduction of water beyond natural recharge rates will becomeincreasingly difficult and expensive as groundwater levels
drop, leading to a peak of production, followed by diminishingwithdrawals and use. This kind of unsustainable groundwateruse can be found in the Ogallala Aquifer in the Great Plainsof the United States, the North China plains, California’s CentralValley, and numerous basins in India (23). Tiwari et al. (24)estimate that nonrenewable use of water in India averaged 54�9 km3 per year between 2002 and 2008 or around 8% of India’stotal water withdrawals.
As shown in Fig. 6, even when the rate of withdrawals from agroundwater aquifer passes the natural recharge rate for theaquifer (shown as a dashed line), the production of water fromthe aquifer can continue to increase until a significant portion ofthe groundwater has been harvested. After this point, deeperboreholes and increased pumping will be required to harvestthe remaining amount of water, potentially reducing the rateof production of water.
It is also possible that the production of water from the aquiferwill continue to increase until all the economically affordablegroundwater is harvested, after which the production of waterdrops quickly. In both these cases, the important point is that ex-traction will not fall to zero, but to the renewable recharge ratewhereeconomically andphysically sustainablepumping ispossible.
In some places, climate change will affect the nature andmagnitude of peak water. Where local communities are currentlydependent on river runoff from glacier melt, the loss of glaciers incoming years will lead to a “peak nonrenewable water” effect: thediminishment of water supply over time. Communities dependenton groundwater recharge that suffer a decrease in recharge ratewill also experience an effect akin to peak water. In this case, theconcept of peak water is slightly different: It is not affected by themagnitude of human use, but by physical or climatic factors thatdiminish the rate of, or potential for, replenishment. Similar topeak oil, however, when the stock is gone, alternative sources willhave to be found.
Peak Ecological Water. For many watersheds, a more immediateand serious concern than running out of water is exceeding apoint of water use that causes serious or irreversible ecologicaldamage. Water provides many services: Not only does it sustainhuman life and commercial and industrial activity, but it is alsofundamental for the sustenance for animals, plants, habitats, andenvironmentally dependent livelihoods (25, 26, 27).
Each new incremental supply project that captures water forhuman use and consumption decreases the availability of thatsource to support ecosystems and diminishes the capacity to pro-vide services. The water that has been temporarily appropriated
Fig. 5. Annual flows (in million cubic meters) of the Colorado River into thedelta from 1905 to 2005 at the Southern International Border station. Notethat, in most years after 1960, flows to the delta fell to zero as totalwithdrawals equaled total (or peak) renewable supply. The exceptions areextremely high-flow years when runoff exceeded demands and the abilityto store additional water (International Boundary Waters Commission dataon Colorado River flows at the Southern International Border. Water datafrom http://www.ibwc.state.gov/wad/DDQSIBCO.htm).
Natural Groundwater Recharge Rate
Pro
duct
ion
of W
ater
fro
m G
roun
dwat
er A
quif
er
Time
Peak in production of fossil groundwaterfrom aquifer
Fig. 6. This theoretical curve shows the progression of unsustainablewater extraction from a groundwater aquifer, hypothesizing a peak-typeproduction curve for water after the production rates surpass the naturalgroundwater recharge rate and production costs rise. Long-term sustainablewithdrawals cannot exceed natural recharge rates.
Gleick and Palaniappan PNAS ∣ June 22, 2010 ∣ vol. 107 ∣ no. 25 ∣ 11159
SUSTAINABILITY
SCIENCE
INAUGURA
LART
ICLE

or moved was once sustaining habitats and terrestrial, avian, andaquatic plants and animals. By some estimates, humans alreadyappropriate almost 50% of all renewable and accessible fresh-water flows (28), leading to significant ecological disruptions.Since 1900, half of the world’s wetlands have disappeared(29). The number of freshwater species has decreased by 50%since 1970, faster than the decline of species on land or in thesea. River deltas are increasingly deprived of flows due toupstream diversions, or receive water heavily contaminated withhuman and industrial wastes.
Fig. 7 is a simplified graph of the value that humans obtainfrom water produced through incremental increases in supply(e.g., drinking water and irrigation), plotted against the decliningvalue of the ecological services (e.g., water for plants and ani-mals) that were being satisfied with this water. The graph assumesthat ecological services decrease as water is appropriated fromwatersheds (though in nature such declines may be nonlinear).The pace or severity of ecological disruptions increases as in-creasing amounts of water are appropriated. Because ecologicalservices are not easily valued in dollar terms, the y axis shouldbe considered the overall (economic and noneconomic) “valueprovided by water.”
At a certain point, the value of ecological services provided bywater is equivalent to the value of human services satisfied by thatsame use of water. After this point, increasing appropriation ofwater leads to ecological disruptions beyond the value that thisincreased water provides to humans (the slope of the declinein ecological services is greater than the slope of the increasein value to humans). We define this point to be peak ecologicalwater—where society will maximize the total ecological andhuman benefits provided by water. As shown in Fig. 8, the overallvalue of water, combining ecological and social benefits, thendeclines as human appropriation increases. Economists and re-source analysts have long noted the difficulty of quantifying thispoint because of problems in assigning appropriate valuations toeach unit of water or each unit of ecosystem benefit in anywatershed (30). But the mistaken assumption that such valuesare zero has led to them being highly discounted, underappre-ciated, or ignored in 20th century water policy decisions.
Peak Water in the United StatesData on total water use is sparse. Few countries or regions collectsuch data because of the physical or political difficulties of
accurately measuring water withdrawals from countless diversesources to meet agricultural, industrial, commercial, and domes-tic needs. As a result, identifying peak water limits will be diffi-cult. Nevertheless, there is some strong evidence that the UnitedStates may have already passed the point of peak water, includingpeak renewable, nonrenewable, and ecological water. Fig. 9shows US gross domestic product (in 2005 dollars) plotted withtotal water withdrawals in the United States, for all purposes,from 1900 to 2005, based on data from state and federal wateragencies, compiled largely by the US Geological Survey’s wateruse assessments (31). These two curves grew exponentially, inlockstep, through the first three-quarters of the 20th century.After the late 1970s, however, the two curves split apart, and totalwater withdrawals in the United States are now below theirmaximum level. Per-capita water withdrawals have fallen evenmore, as population has also continued to grow. Some of thereasons for this dramatic change include improving efficiencyof water use, changes in the structure of the US economy, theimplementation of the Clean Water Act, which led to reductionsin industrial water use and discharges, and physical, economic,and environmental constraints on access to new supplies. Someof the reasons for this change are explored in more detail else-where (32). But the graph suggests that the United States maywell be past the point of peak water.
Whether this change is permanent or temporary is unknown.In theory, US production of oil could increase again and evenexceed, for a while, the previous peak, although resource, eco-nomic, and environmental constraints make this unlikely. Simi-larly, total water withdrawals could certainly begin to increaseagain, but many factors suggest this is unlikely in the long run.Significant expansion of irrigated agriculture, which dominatesUS water use, seems improbable, especially in the western USwhere almost all major rivers and aquifers are already tappedout—at the limits of their renewable and nonrenewable supplies.Another major driver of US freshwater use is power plantcooling, and a significant expansion of cooling demand also seemsunlikely because of constraints on water withdrawals, even inrelatively well-watered regions, and because efforts to move fromcentral water-intensive thermal plants to less-water-intensiverenewable systems are gaining traction. Certainly, some regionshave passed the point of peak ecological water and efforts arenow focused on how to restore some water for the environment,
Water Appropriation by Humans
Value of ecological services provided by water
“Peak ecological water”
Value of “human services” provided by water
Val
ue P
rovi
ded
by W
ater
Fig. 7. This graph charts the value of water provided by increasing supplyfrom various sources in a watershed against the loss in value of ecologicalservices provided by that water. As water withdrawals for human needsincrease (solid line), the ecological services provided by same water are indecline (dashed line). At a certain point, the value of water provided throughnew supply projects is equal to the value of the ecological services. Beyondthis point, ecological disruptions exceed the benefits of increased waterextraction. We call this point peak ecological water (see Fig. 8).
Tot
al S
ocia
l and
Eco
logi
cal V
alue
of
Wat
er
Water Appropriations by Humans
Point of “Peak Ecological Water” –Maximized combined benefits tohuman society and ecosystems
Fig. 8. This graph charts the overall value of water, a combination of social,economic, and ecological value, as water appropriation by humans increases.The value increases to a peak, where benefits to society and ecosystems ismaximized, but then declines as increased appropriations lead to excessiveecosystem and social costs. Nonmonetary costs and benefits are hard toquantify, but must be included to avoid exceeding the point of peak eco-logical water.
11160 ∣ www.pnas.org/cgi/doi/10.1073/pnas.1004812107 Gleick and Palaniappan

not how to take more out. In short, we think it possible that theUnited States is past the point of peak water and the focus offuture water use efforts will be on improving efficiency of currentuses and reallocating water from one existing user to another.
Conclusions: Implications of Peak WaterAs the world anticipates a resource-constrained future, thespecter of peak oil—a peaking in the production of oil—has beenpredicted. Real limits on water are far more worrisome, and farmore difficult to evaluate, than limits on traditional nonrenew-able resources such as petroleum. Water is fundamental for eco-system health and for economic productivity, and for many uses ithas no substitutes. This paper offers three separate definitions ofpeak water, for renewable and nonrenewable water systems andalso introduces the concept of peak ecological water. We alsoraise the possibility that the United States has already passedthe point of peak water.
The concept of peak water does not mean we will run out ofwater. Water is a renewable resource and is not consumed in theglobal sense: Hence, water uses within renewable peak limits cancontinue indefinitely. But not all water use is renewable; indeedsome water uses are nonrenewable and unsustainable. Ground-water use beyond normal recharge rates follows a peak-oil typecurve with a peak and then decline in water production. Suchpeak nonrenewable water problems are increasingly evident inmajor groundwater basins with critical levels of overdraft, suchas the Ogallala and California’s Central Valley in the UnitedStates, the North China Plains, and in numerous states in India,such as Andhra Pradesh, Rajasthan, and Tamil Nadu. Peak eco-logical water refers to the point after which the cost of disruptionsthat occur in the ecological services that water provides exceeds
the value provided by additional increments of water use by hu-mans for economic purposes. Defined this way, many regions ofthe world have already surpassed peak ecological water—humansuse more water than the ecosystem can sustain without significantdeterioration and degradation.
The concepts around peak water are also important in drivingsome paradigm shifts in the use and management of water. Thereare growing efforts to quantify peak ecological limits and todevelop policies to restore water for ecosystem services in basinswhere serious ecological disruptions have already been reco-gnized. Improvements in the ability to identify groundwaterbasins suffering from nonrenewable withdrawals are increasingthe pressure on water managers to reduce withdrawals to moresustainable levels, or to better integrate surface and groundwatermanagement. And the realization that there are limits to peakrenewable water use are forcing new discussions about improvingwater-use efficiency and developing innovative technologies forwater treatment and reuse as alternatives to expanding tradi-tional supply projects to further mine overtapped renewablewater sources. The bad news is that we are increasingly reachingpeak water limits. The good news is that recognizing and under-standing these limits can stimulate innovations and behaviors thatcan reduce water use and increase the productivity of water,shifting water policy toward a more sustainable water future.
ACKNOWLEDGMENTS. Thanks to our colleagues at the Pacific Institute, includ-ing Heather Cooley and Nancy Ross, for comments and feedback as we werepreparing this analysis. Thanks also to Professors Robert Glennon and RobertWilkinson for reviewing the manuscript and offering thoughtful and helpfulsuggestions for improving it.
1. Shiklomanov IA (2000) Appraisal and assessment of world water resources. Water Int
25(1):11–32.
2. Gleick PH (2006) The World’s Water 2006–2007 (Island Press, Washington, DC), Data
Table 2, pp 228–236.
3. Postel SL, Daily GC, Ehrlich PR (1996) Human appropriation of renewable fresh water.
Science 271:785–788.
4. Bentley RW (2002) Global oil and gas depletion: An overview. Energ Policy 30
(3):189–205.
Fig. 9. US gross domestic product (GDP) in 2005 dollars from 1900 to 2005 (left axis) plotted with total water withdrawals for all purposes in cubic kilometersper year (right axis). Data on GDP come from the US Bureau of Economic Analysis; data on water use comes from the US Geological Survey (31).
Gleick and Palaniappan PNAS ∣ June 22, 2010 ∣ vol. 107 ∣ no. 25 ∣ 11161
SUSTAINABILITY
SCIENCE
INAUGURA
LART
ICLE

5. Duncan RC (2003) Three world oil forecasts predict peak oil production. Oil Gas J 101(21):18–20.
6. Kerr RA (2007) The looming oil crisis could arrive uncomfortably soon. Science 316:351.7. Bardi U (2009) Peak oil: The four stages of a new idea. Energy 34(3):323–326.8. Gleick PH (2002) Soft water paths. Nature 418:373.9. Falkenmark M, Lundqvist J, Widstrand C (1989) Macro-scale water scarcity requires
micro-scale approaches: Aspects of vulnerability in semi-arid development.Nat ResourForum 13(4):258–267.
10. Lundqvist J, Gleick P (1997) Comprehensive Assessment of the Freshwater Resources ofthe World. Sustaining Our Waters into the 21st Century (United Nations Educational,Scientific, and Cultural Organization, New York), pp 1–51.
11. United Nations World Water Assessment Program (2003) World Water DevelopmentReport: Water for People, Water for Life (United Nations World Water AssessmentProgram and Berghahn Books, Barcelona), pp 1–575.
12. United Nations Environment Programme (2007) Global Environmental Outlook 4:Environment for Development (United Nations Environment Programme, Malta),pp 1–540.
13. Hubbert MK (1956) Nuclear Energy and the Fossil Fuels (Shell Development Co.,Houston), pp 1–44.
14. United States Energy Information Agency (2008) International Petroleum Monthlyhttp://www.eia.doe.gov/ipm/.
15. Gold R, Davis A ( 10, 2007) Oil Officials See Limit Looming on Production. Wall StreetJournal p A-1.
16. Ehrlich P, Ehrlich A, Holdren JP (1977) Ecoscience: Population, Resources, Environment(Freeman, San Francisco).
17. Tiwari VM, Wahr J, Swenson S (2009) Dwindling groundwater resources in northernIndia, from satellite gravity observations. Geophys Res Lett 36:L18401 doi: 10.1029/2009GL039401.
18. Syed TH, Famiglietti J, Chambers DP (2009) GRACE-based estimates of terrestrial fresh-water discharge from basin to continental scales. J Hydrometeorol 10(1):22–40.
19. Nordhaus WD (1973) The allocation of energy resources. Brookings Pap Eco Ac 1973(3):529–570.
20. Cooley H, Gleick PH, Wolff G (2006) Desalination: With a Grain of Salt A CaliforniaPerspective (Pacific Inst, Oakland, CA).
21. National Research Council (2008) Desalination: A National Perspective (NationalAcademy Press, Washington, DC).
22. Allan JA (1999) Water in International Systems: A Risk Society Analysis of RegionalProblemsheds and Global Hydrologies. SOAS Occasional Paper 22 (School of Orientaland African Studies, University of London, London).
23. Chatterjee R, Purohit RR (2009) Estimation of replenishable groundwater resources ofIndia and their status of utilization. Curr Sci India 96(12):1581–1591.
24. Tiwari VM, Wahr J, Swenson S (2009) Dwindling groundwater resources in northernIndia, from satellite gravity observations. Geophys Res Lett 36:L18401 doi: 10.1029/2009GL039401.
25. Daily GC, et al. (1997) Iss Ecol 1:1–18.26. Daily GC, et al. (2000) The value of nature and the nature of value. Science
289:395–396.27. Gleick PH (1998)Water in crisis: Paths to sustainable water use. Ecol Appl 8(3):571–579.28. Postel SL, Daily GC, Ehrlich PR (1996) Human appropriation of renewable fresh water.
Science 271:785–788.29. Katz D (2006) The World’s Water 2006–2007, ed PH Gleick (Island Press, Washington,
DC), pp 29–39.30. Daily GC, et al. (2000) The value of nature and the nature of value. Science
289:395–396.31. Kenny JF, et al. (2009) Estimated Use of Water in the United States in 2005 (United
States Geological Survey, Reston, VA) Circular 1344 (see also the entire series for earlieryears).
32. Gleick PH (2003) Water use. Annu Rev Env Resour 28:275–314.33. United States Energy Information Agency (2009) US Field Production of Crude Oil,
Independent Statistics and Analysis. (United States Energy Information Agency,Washington, DC).
34. Shiklomanov IA (1993) World Fresh Water Resources. Water in Crisis, ed PH Gleick(Oxford Univ Press, Oxford), pp 13–24.
11162 ∣ www.pnas.org/cgi/doi/10.1073/pnas.1004812107 Gleick and Palaniappan