Peak Load Forecasting - AERTC
22
Peak Load Forecasting Eugene Feinberg Stony Brook University Advanced Energy 2009 Hauppauge, New York, November 18
Transcript of Peak Load Forecasting - AERTC
Peak Load Forecasting
Eugene Feinberg
Stony Brook University
Advanced Energy 2009
Hauppauge, New York, November 18

Importance of Peak Load Forecasting
n Annual peak load forecasts are important for planning and, in particular, for securing adequate generation, transmission, and distribution capacities.
n More accurate peak forecasts improve decision making capabilities in capital expenditures and improve reliability of the system.
n Future peak load is not deterministic and it depends on several uncertain factors including weather conditions.

n Annual peak load, X, is a random variable and can be characterized by a Cumulative Distribution Function
F(x) = P{X<x}
Characterization of Annual Peak Load
n In this talk we will discuss modeling of annual peak load and the software that implements this modeling for local areas (load pockets).
00 . 1
0 . 20 . 3
0 . 4
0 . 5
0 . 6
0 . 70 . 8
0 . 91
0 3 0 0 6 0 0 9 0 0 1 2 0 0 1 5 0 0
x
F(x)

Traditional Approach
n Also known as Normal Weather, Design Day, or 50/50 approach
n It is difficult to use the past peak load values to predict future peaks because load characteristics change over time (weather and economic condition, population growth, …).
n A widely used approach is to estimate the level that the peak load will not exceed with the 50% probability.

n Consider historical peak days for the last n (typically n=30) years, and estimate the average peak weather conditions W N.
n Present the load as a function
Load = F (W , P ),
W : weather parameters such as temperature, humidity, THI, etcP : other parameters
n Compute: W eather Norm alized Peak Load = F (WN , PE ),
W N : normal weather
PE : estimation of parameters
Normal Weather Approach (Cont.)
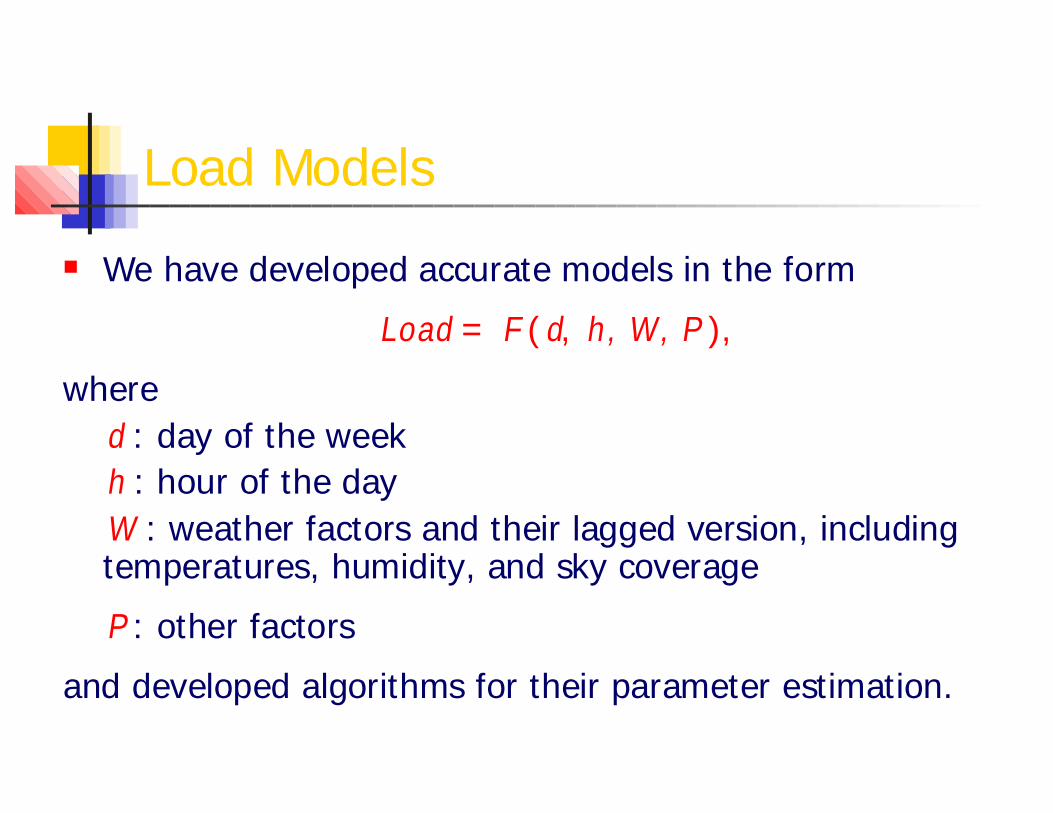
Load Models
n We have developed accurate models in the form
Load = F ( d, h, W , P ),
where
d : day of the week
h : hour of the day
W : weather factors and their lagged version, including temperatures, humidity, and sky coverage
P : other factors
and developed algorithms for their parameter estimation.
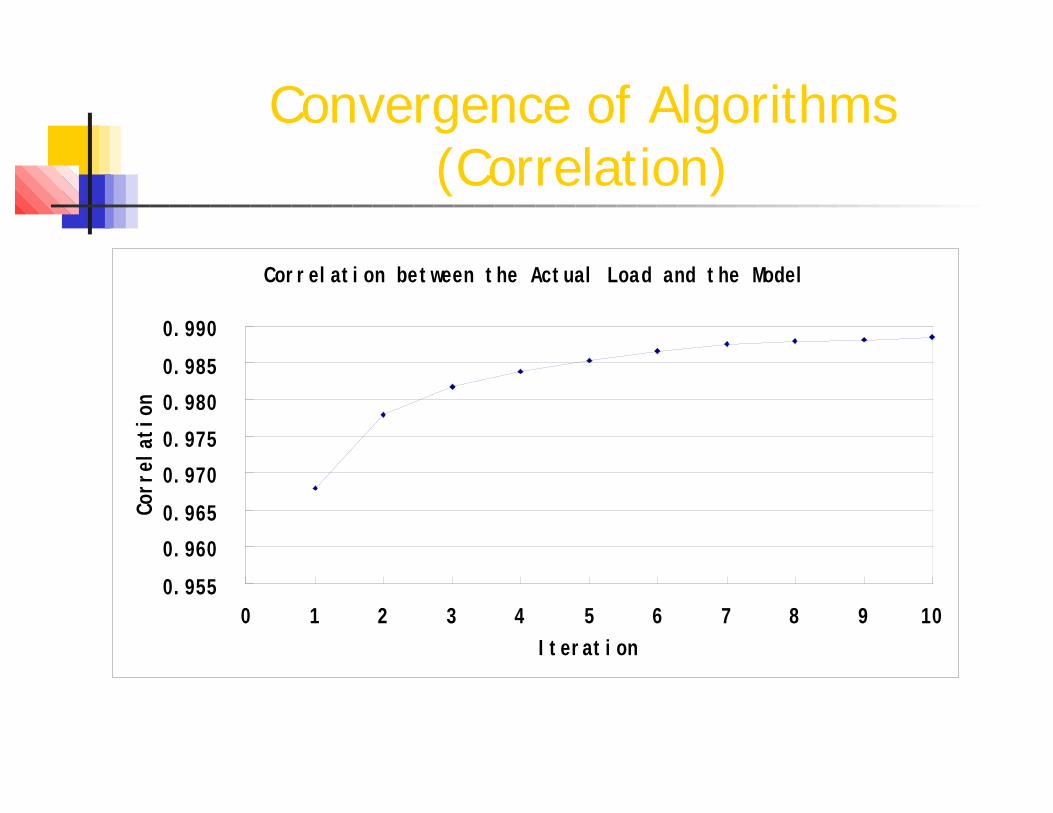
Convergence of Algorithms (Correlation)
Corr elation be tween the Actual Loa d and the Model
0.955
0.960
0.965
0.970
0.975
0.980
0.985
0.990
0 1 2 3 4 5 6 7 8 9 10
Iterat ion
Corr
elat
ion

Convergence of Algorithms (R-Squared)
R e g r e s i o n O u t p u t : R2
( d e f i n e d a s t h e p r o p o r t i o n o f v a r i a n c e o f t h e r e s p o n s e t h a t i sp r e d i c t a b l e f r o m t h e r e g r e s s i o n v a r i a b l e s )
00 . 10 . 20 . 30 . 40 . 50 . 60 . 70 . 80 . 9
1
0 1 2 3 4 5 6 7 8 9 1 0
I t e r a t i o n
R2

Our Approach
n Run the model through various weather scenarios and select peak values: L1, L2, …, Ln
n The scenarios are actual weather data for previous years (usually last 30 years).
n Use peak values L1, L2, …, Ln to estimate the load distribution.

Application to Short-Term Load Forecasting (remark)
n The developed models can also be used for short-term forecasting. The so-called ensemble approach improves the accuracy of load forecasts. This approach is to use models corresponding to different parameters and compute load forecasts as weighted averages of the outputs of these models.

Load Pocket Peak Forecasting Software
n For local areas (load pockets), the software deals with two types of load peaks:
(i) Peak load for the area
(ii) Load for the area on the system peak date
n The software analyzes defined load pockets and has a load pocket editor that can define new load pockets and edit existing load pockets.
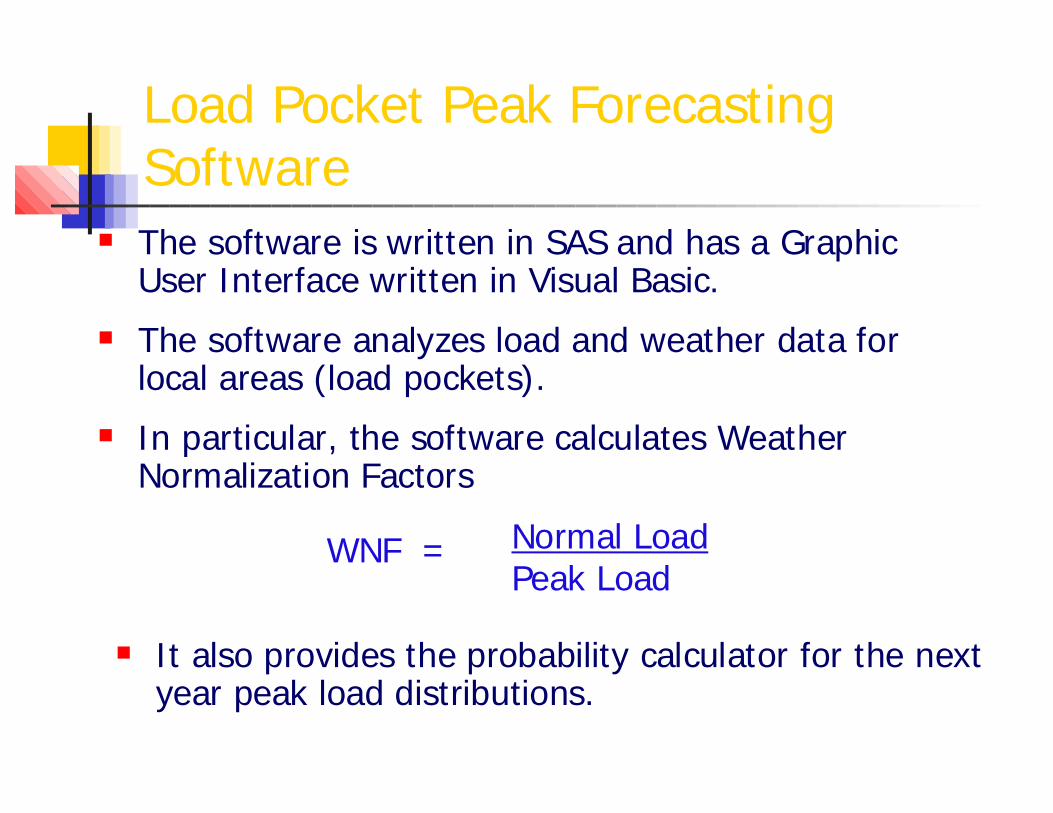
n The software is written in SAS and has a Graphic User Interface written in Visual Basic.
n The software analyzes load and weather data for local areas (load pockets).
n In particular, the software calculates Weather Normalization Factors
Load Pocket Peak Forecasting Software
Normal LoadPeak Load
WNF =
n It also provides the probability calculator for the next year peak load distributions.

Outputs of Load Pocket Peak Forecasting Software
n Actual Load Shape by day of week and hourn Weather Normalized Load Shape by day of
week and hourn Actual Load vs Model Load scatter plotn Calculates Weather Normalization Factors
(WNFs) n Calculates Normalized Weather Parametersn Calculates System and Pocket Peak Load
Distributions

Actual Load Profiles
Ac tu a l L o a d P ro file s
0
50
100
150
200
250
300
350
400
1 2 3 4 5 6 7 8 9 10 11 12 13 14 15 16 17 18 19 20 21 22 23 24
H o u r s
MW
Sun Mon Tue Wed Thu Fri Sat
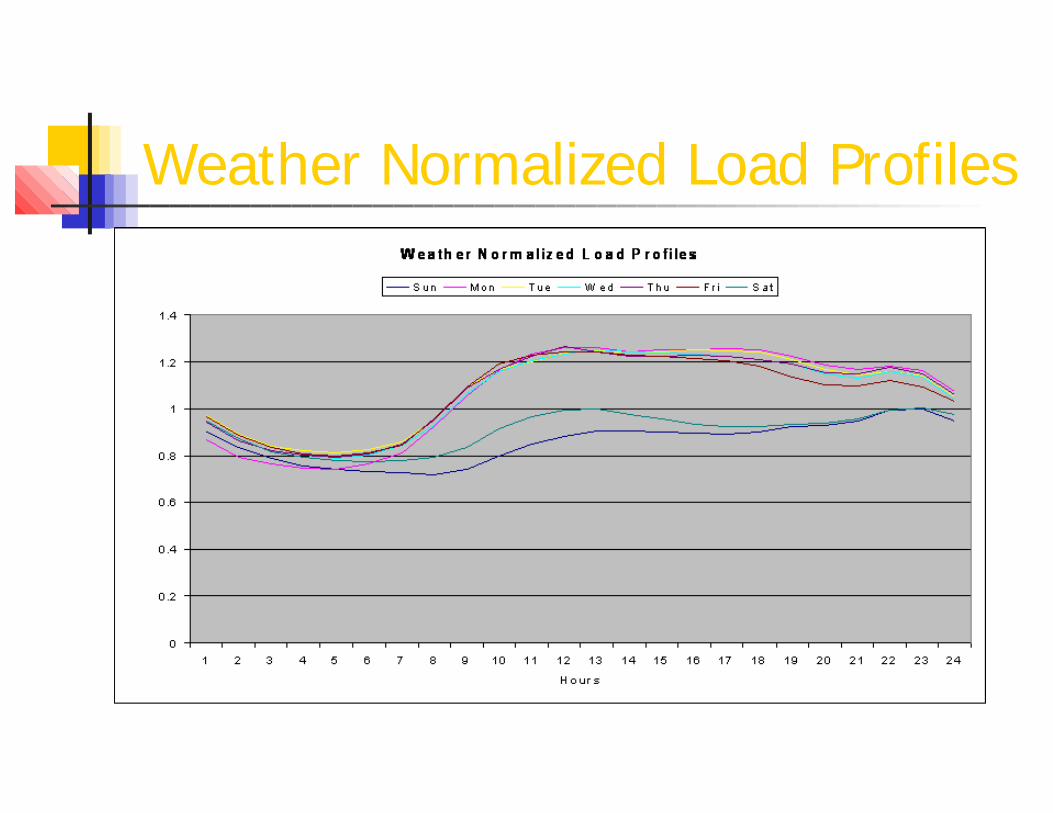
Weather Normalized Load Profiles
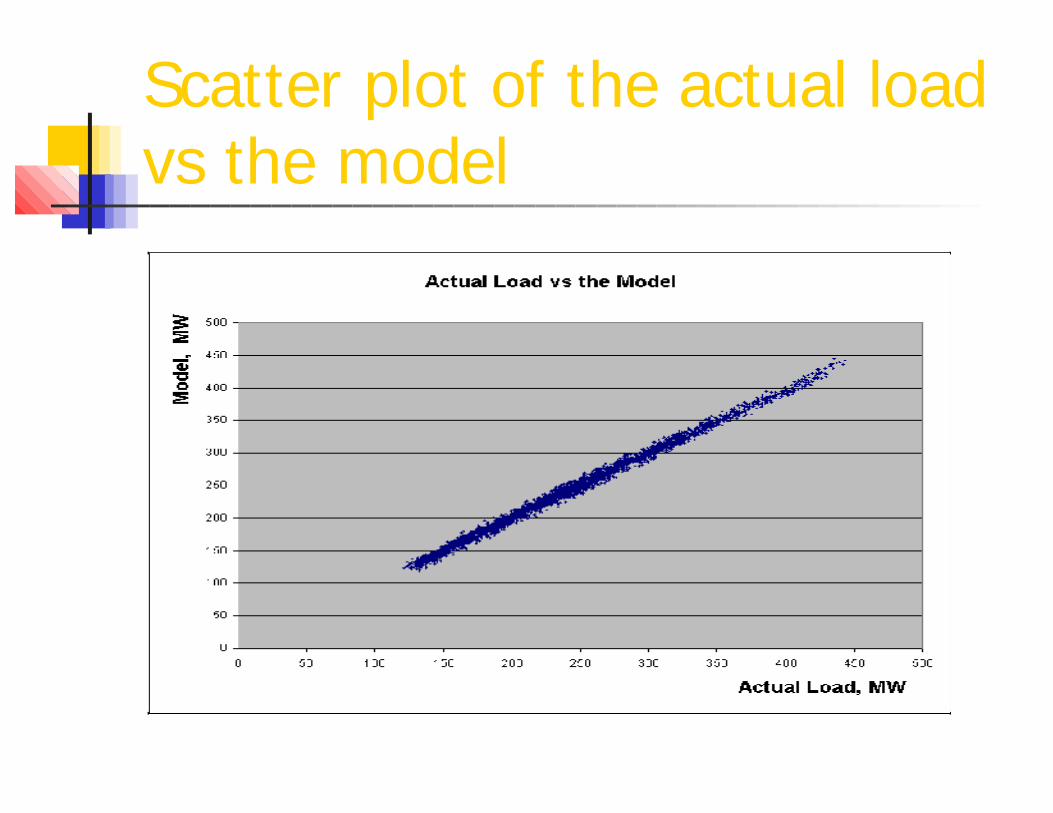
Scatter plot of the actual loadvs the model

System Peak Dates

Pocket Peak Dates

Weather Normalization FactorsPocket WNFs
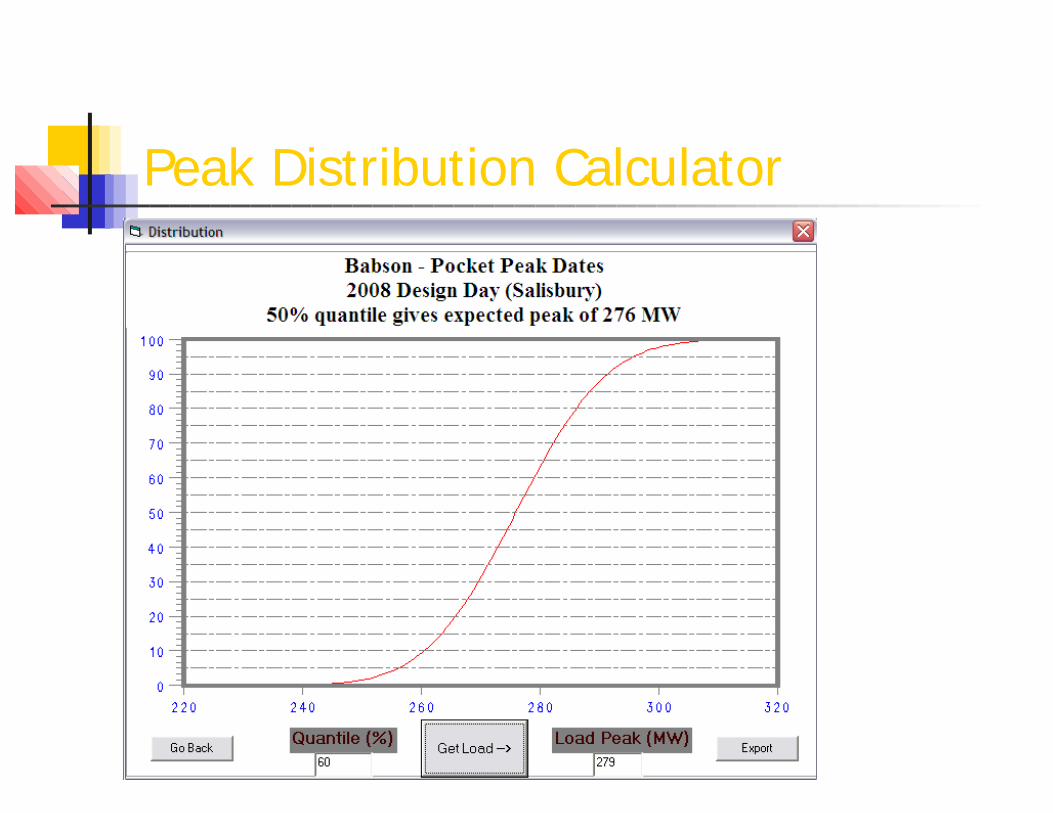
Peak Distribution Calculator

Peak Distribution Calculator (Cont.)

Conclusions
n We presented the methodology and software for estimating peak loads for arbitrary percentiles (not only 50/50 scenarios) and for computing Weather Normalized Factors (WNFs) based on local weather conditions.