PE & VC Fundraising Report - theleadleft.com · PE fund closing times (months) Source: PitchBook...
12
PITCHBOOK 2017 ANNUAL PE & VC FUNDRAISING REPORT PE & VC Fundraising Report 2017 Annual
Transcript of PE & VC Fundraising Report - theleadleft.com · PE fund closing times (months) Source: PitchBook...
PITCHBOOK 2017 ANNUAL PE & VC FUNDRAISING REPORT
PE & VC Fundraising Report2017 Annual

PITCHBOOK 2017 ANNUAL PE & VC FUNDRAISING REPORT
ContentsKey takeaways 2
PE fundraising overview 3
Good times keep rolling for fundraisers 3
Mega-funds dominate capital game 4
Spotlight: Funds-of-funds 5
PE capital overhang 6
VC fundraising overview 7
Aggregate capital raised remains high despite sliding fund count 7
Spotlight: Impact investing 9
VC overhang 11
• North American and European PE
firms raised more capital in 2017 than in
any year since 2007, with $325.9 billion
closed across 372 funds. 76% of follow-
on funds were larger than the previous
fund, the median time between funds
dropped to 3.2 years, and the median
time taken to close dropped to just 11.2
months.
• Apollo Global Management garnered
significant attention by closing the
largest PE fund ever with $24.7 billion
in capital commitments. CVC Capital
Partners, Silver Lake Management,
KKR, Vista Equity Partners and Clayton
Dubilier & Rice all raised funds of $10
billion or more.
• Venture funds secured $42 billion in
commitments in 2017, a 19% decline
from the previous year, but still the
fourth consecutive year to see more
than $40 billion in capital raised by
North American and European funds.
Fund count saw a more significant
decrease, sliding to 294—the lowest
total since 2011.
•Using the rolling three-year average
of fund contribution data, current
dry powder could sustain 4.2 and 3.8
years of investment for PE and VC,
respectively.
Credits & Contact
PitchBook Data, Inc.
John Gabbert Founder, CEOAdley Bowden Vice President, Market Development & Analysis
Content
Cameron Stanfill AnalystJoelle Sostheim AnalystNico Cordeiro AnalystDarren Klees Data Analyst
Design
Caroline Suttie Production Assistant Eric Maloney Graphic Designer
Contact PitchBook
pitchbook.com
Research [email protected]
Click here for PitchBook’s report methodologies. Cover image: signing of a limited partner agreement (LPA).
Key takeaways from the analysts
$325.9B 74% $42Bclosed across 372
PE fundsof follow-on VC funds were larger than the
previous fund
total capital raised by VC funds
19% YoY
2 PITCHBOOK 2017 ANNUAL PE & VC FUNDRAISING REPORT

PITCHBOOK 2017 ANNUAL PE & VC FUNDRAISING REPORT
Good times keep rolling for fundraisers
3
North American and European PE
firms raised more capital in 2017 than
in any year since 2007, with $325.9
billion closed across 372 funds. While
2007 still holds the record for capital
commitments, 2017 marks the fifth
consecutive year that capital raised
exceeded $250 billion and the second
straight year in which allocators
committed over $300 billion to PE.
Needless to say, it is a good time to
be a GP, as the fundraising market
remains very active with no clear end
in sight: 76% of follow-on funds were
larger than the previous fund, the
median time between funds dropped
to 3.2 years, and the median time to
close dropped to just 11.2 months.
Another 53 PE funds launched in 2017
remain open and on the fundraising
trail as of February 12, 2017.
Buyout funds remain the vehicle
of choice amongst PE strategies,
accounting for 69% of all funds
closed—the highest annual proportion
in the PitchBook dataset. Despite
anecdotal commentary surrounding
the growing prominence of growth
strategies, the number of growth funds
to close has been relatively flat since
2013, with just 51 growth funds closed
in 2017; however, the amount of capital
raised by growth funds has been
trending upward, with 2017 setting a
new all-time high of $26.5 billion.
2017 sees most raised since 2007
PE fundraising activity$2
90.8
$376
.5
$261
.2
$181
.6
$105
.9
$150
.2
$158
.2
$284
.8
$281
.1
$255
.4
$311
.9
$325
.9
490530
450
294
288
329 338
431 459410 411
372
2006 2007 2008 2009 2010 2011 2012 2013 2014 2015 2016 2017
Capital Raised ($B) # of Funds Closed
Source: PitchBook
PE Fundraising Overview
$287.4
$306.5
$773.9
$902.8
$0
$100
$200
$300
$400
$500
$600
$700
$800
$900
$1,000
2006 2007 2008 2009 2010 2011 2012 2013 2014 2015 2016 2017
Median ($M) Average ($M)
Source: PitchBook
Average & median PE fund size ($M)
PITCHBOOK 2017 ANNUAL PE & VC FUNDRAISING REPORT
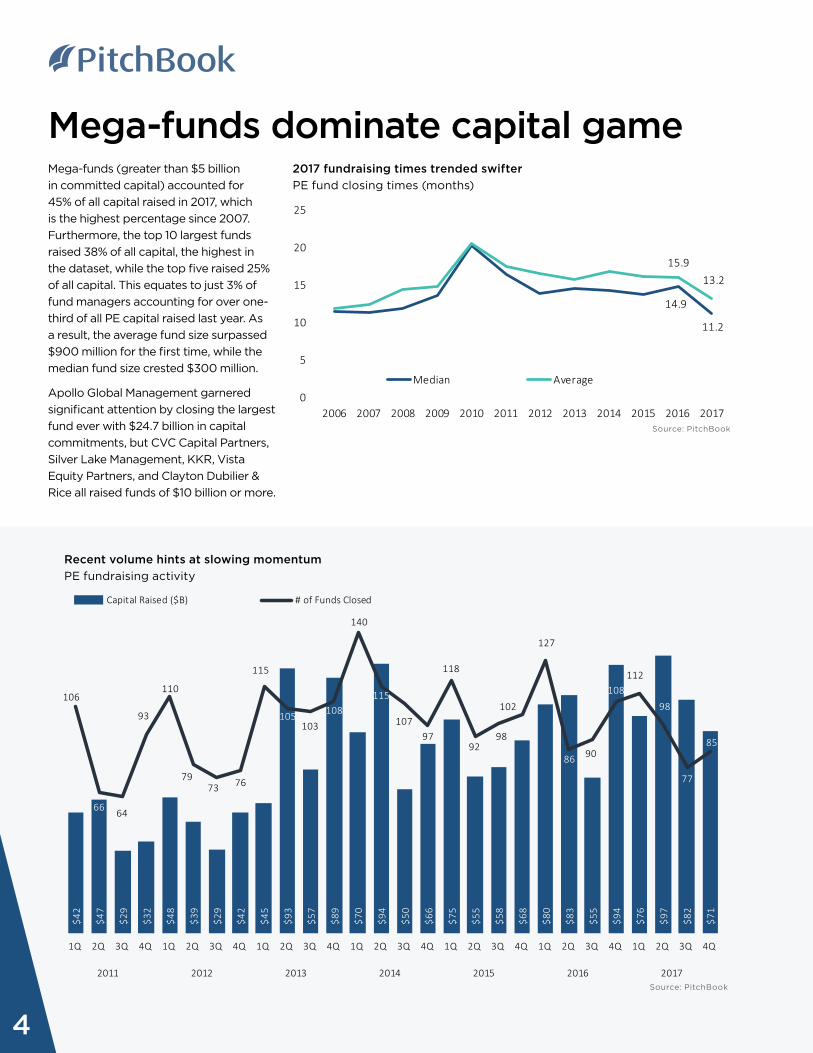
Recent volume hints at slowing momentum
PE fundraising activity
$42
$47
$29
$32
$48
$39
$29
$42
$45
$93
$57
$89
$70
$94
$50
$66
$75
$55
$58
$68
$80
$83
$55
$94
$76
$97
$82
$71
106
66 64
93
110
7973 76
115
105103
108
140
115
10797
118
9298
102
127
86 90
108112
98
77
85
1Q 2Q 3Q 4Q 1Q 2Q 3Q 4Q 1Q 2Q 3Q 4Q 1Q 2Q 3Q 4Q 1Q 2Q 3Q 4Q 1Q 2Q 3Q 4Q 1Q 2Q 3Q 4Q
2011 2012 2013 2014 2015 2016 2017
Capital Raised ($B) # of Funds Closed
Mega-funds (greater than $5 billion
in committed capital) accounted for
45% of all capital raised in 2017, which
is the highest percentage since 2007.
Furthermore, the top 10 largest funds
raised 38% of all capital, the highest in
the dataset, while the top five raised 25%
of all capital. This equates to just 3% of
fund managers accounting for over one-
third of all PE capital raised last year. As
a result, the average fund size surpassed
$900 million for the first time, while the
median fund size crested $300 million.
Apollo Global Management garnered
significant attention by closing the largest
fund ever with $24.7 billion in capital
commitments, but CVC Capital Partners,
Silver Lake Management, KKR, Vista
Equity Partners, and Clayton Dubilier &
Rice all raised funds of $10 billion or more.
4
Mega-funds dominate capital game
14.9
11.2
15.9 13.2
0
5
10
15
20
25
2006 2007 2008 2009 2010 2011 2012 2013 2014 2015 2016 2017
Median Average
2017 fundraising times trended swifter
PE fund closing times (months)
Source: PitchBook
Source: PitchBook
PITCHBOOK 2017 ANNUAL PE & VC FUNDRAISING REPORT
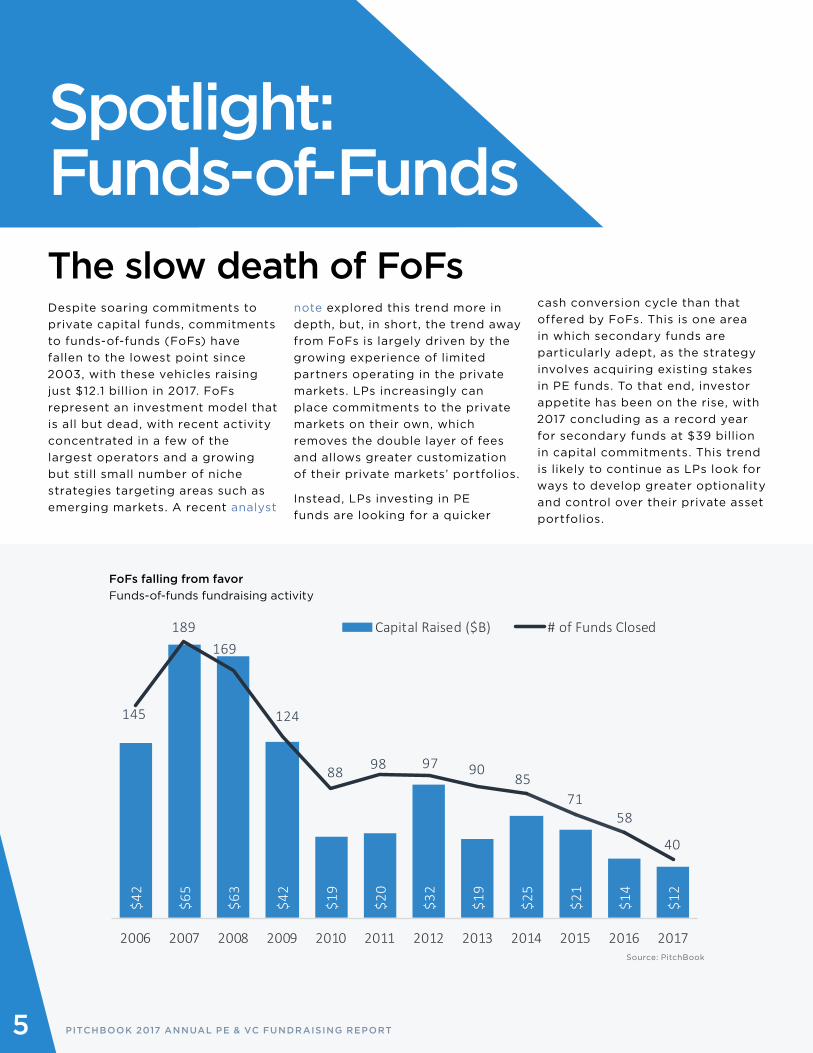
Spotlight:Funds-of-FundsThe slow death of FoFsDespite soaring commitments to
private capital funds, commitments
to funds-of-funds (FoFs) have
fallen to the lowest point since
2003, with these vehicles raising
just $12.1 billion in 2017. FoFs
represent an investment model that
is all but dead, with recent activity
concentrated in a few of the
largest operators and a growing
but still small number of niche
strategies targeting areas such as
emerging markets. A recent analyst
5
$42
$65
$63
$42
$19
$20
$32
$19
$25
$21
$14
$12
145
189169
124
88 98 97 9085
7158
40
2006 2007 2008 2009 2010 2011 2012 2013 2014 2015 2016 2017
Capital Raised ($B) # of Funds Closed
FoFs falling from favor
Funds-of-funds fundraising activity
Source: PitchBook
note explored this trend more in
depth, but, in short, the trend away
from FoFs is largely driven by the
growing experience of limited
partners operating in the private
markets. LPs increasingly can
place commitments to the private
markets on their own, which
removes the double layer of fees
and allows greater customization
of their private markets’ portfolios.
Instead, LPs investing in PE
funds are looking for a quicker
cash conversion cycle than that
offered by FoFs. This is one area
in which secondary funds are
particularly adept, as the strategy
involves acquiring existing stakes
in PE funds. To that end, investor
appetite has been on the rise, with
2017 concluding as a record year
for secondary funds at $39 billion
in capital commitments. This trend
is likely to continue as LPs look for
ways to develop greater optionality
and control over their private asset
portfolios.
PITCHBOOK 2017 ANNUAL PE & VC FUNDRAISING REPORT
PITCHBOOK 2017 ANNUAL PE & VC FUNDRAISING REPORT
PE Capital Overhang
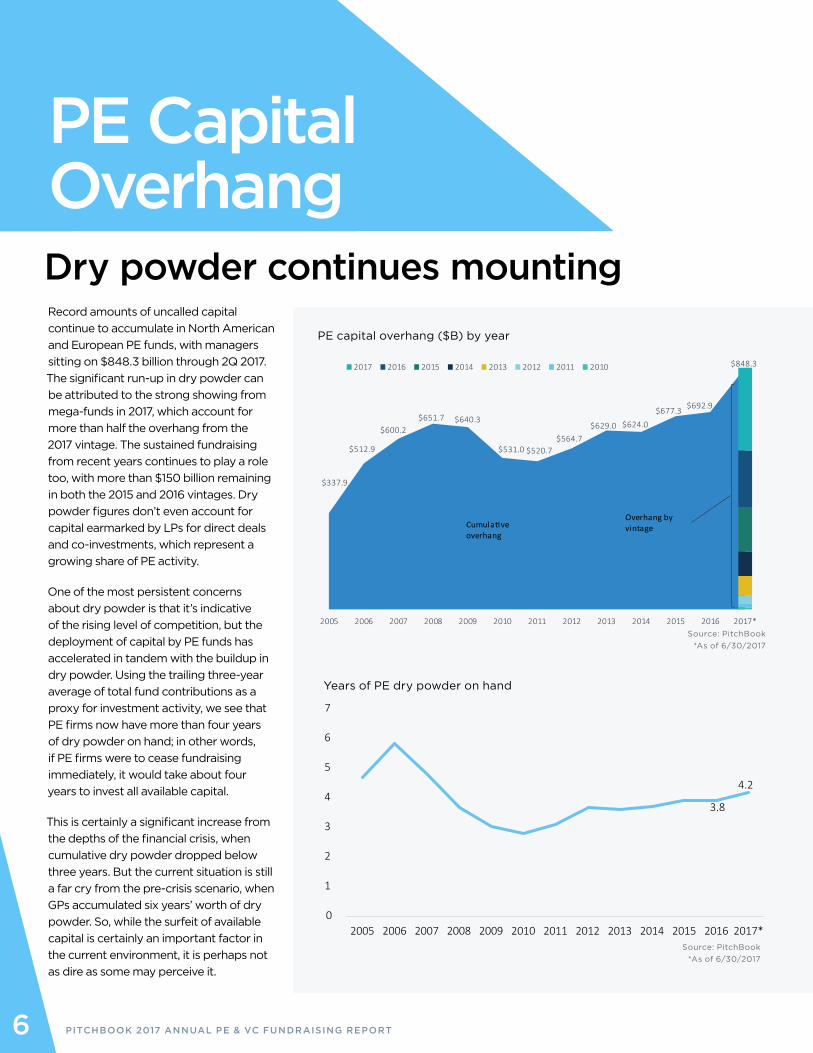
Record amounts of uncalled capital
continue to accumulate in North American
and European PE funds, with managers
sitting on $848.3 billion through 2Q 2017.
The significant run-up in dry powder can
be attributed to the strong showing from
mega-funds in 2017, which account for
more than half the overhang from the
2017 vintage. The sustained fundraising
from recent years continues to play a role
too, with more than $150 billion remaining
in both the 2015 and 2016 vintages. Dry
powder figures don’t even account for
capital earmarked by LPs for direct deals
and co-investments, which represent a
growing share of PE activity.
One of the most persistent concerns
about dry powder is that it’s indicative
of the rising level of competition, but the
deployment of capital by PE funds has
accelerated in tandem with the buildup in
dry powder. Using the trailing three-year
average of total fund contributions as a
proxy for investment activity, we see that
PE firms now have more than four years
of dry powder on hand; in other words,
if PE firms were to cease fundraising
immediately, it would take about four
years to invest all available capital.
This is certainly a significant increase from
the depths of the financial crisis, when
cumulative dry powder dropped below
three years. But the current situation is still
a far cry from the pre-crisis scenario, when
GPs accumulated six years’ worth of dry
powder. So, while the surfeit of available
capital is certainly an important factor in
the current environment, it is perhaps not
as dire as some may perceive it.
PE capital overhang ($B) by year
Dry powder continues mounting
6
$337.9
$512.9
$600.2$651.7 $640.3
$531.0 $520.7$564.7
$629.0 $624.0
$677.3 $692.9
$848.3
2005 2006 2007 2008 2009 2010 2011 2012 2013 2014 2015 2016 2017*
2017 2016 2015 2014 2013 2012 2011 2010
Cumula�ve overhang
Overhang by vintage
Years of PE dry powder on hand
0
1
2
3
4
5
6
7
2005 2006 2007 2008 2009 2010 2011 2012 2013 2014 2015 2016 2017*
3.8
4.2
Source: PitchBook
*As of 6/30/2017
Source: PitchBook
*As of 6/30/2017
PITCHBOOK 2017 ANNUAL PE & VC FUNDRAISING REPORT
VC Fundraising Overview
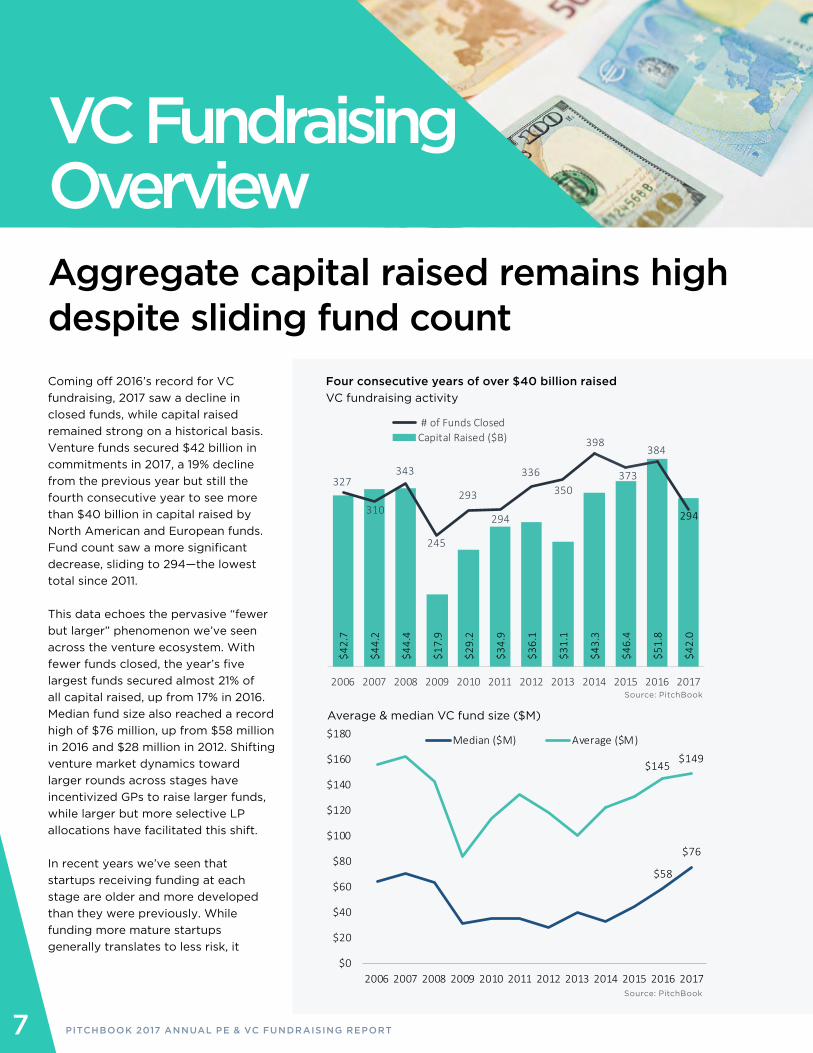
Four consecutive years of over $40 billion raised
VC fundraising activity
Coming off 2016’s record for VC
fundraising, 2017 saw a decline in
closed funds, while capital raised
remained strong on a historical basis.
Venture funds secured $42 billion in
commitments in 2017, a 19% decline
from the previous year but still the
fourth consecutive year to see more
than $40 billion in capital raised by
North American and European funds.
Fund count saw a more significant
decrease, sliding to 294—the lowest
total since 2011.
This data echoes the pervasive “fewer
but larger” phenomenon we’ve seen
across the venture ecosystem. With
fewer funds closed, the year’s five
largest funds secured almost 21% of
all capital raised, up from 17% in 2016.
Median fund size also reached a record
high of $76 million, up from $58 million
in 2016 and $28 million in 2012. Shifting
venture market dynamics toward
larger rounds across stages have
incentivized GPs to raise larger funds,
while larger but more selective LP
allocations have facilitated this shift.
In recent years we’ve seen that
startups receiving funding at each
stage are older and more developed
than they were previously. While
funding more mature startups
generally translates to less risk, it
$42.
7
$44.
2
$44.
4
$17.
9
$29.
2
$34.
9
$36.
1
$31.
1
$43.
3
$46.
4
$51.
8
$42.
0
327
310
343
245
293
294
336
350
398
373
384
294
2006 2007 2008 2009 2010 2011 2012 2013 2014 2015 2016 2017
Capital Raised ($B)# of Funds Closed
Aggregate capital raised remains high despite sliding fund count
7
Source: PitchBook
Source: PitchBook
$58
$76
$145$149
$0
$20
$40
$60
$80
$100
$120
$140
$160
$180
2006 2007 2008 2009 2010 2011 2012 2013 2014 2015 2016 2017
Median ($M) Average ($M)
Average & median VC fund size ($M)
PITCHBOOK 2017 ANNUAL PE & VC FUNDRAISING REPORT8
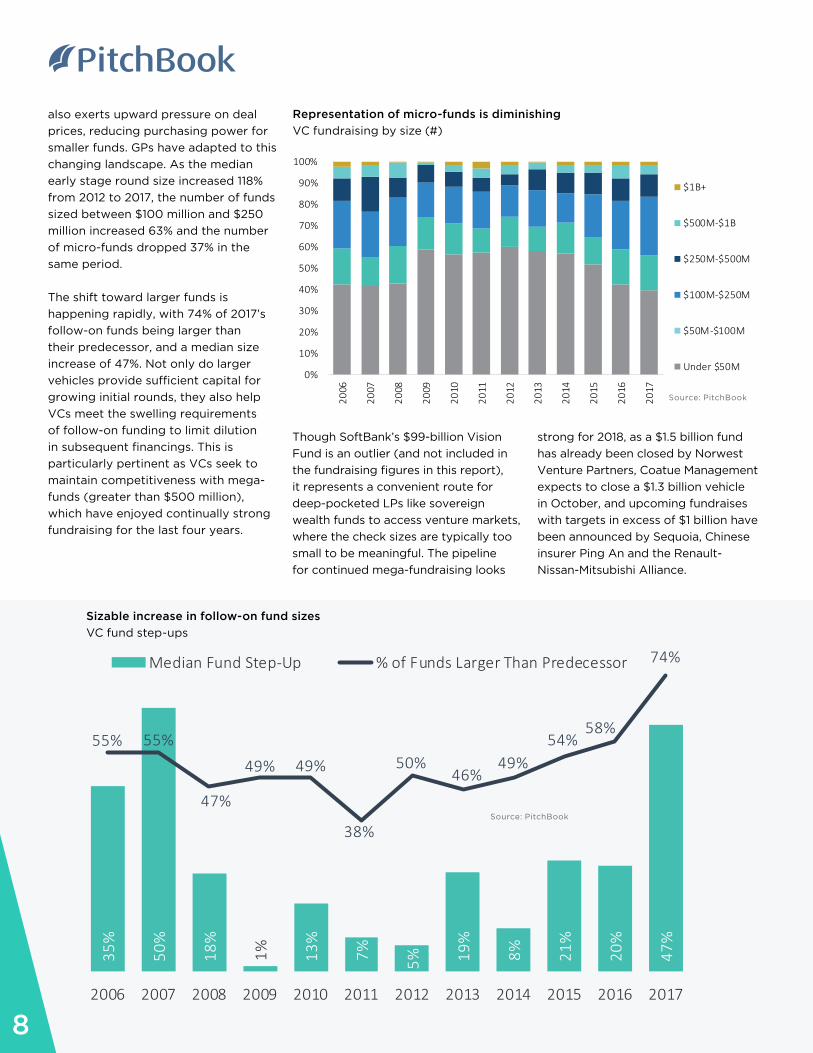
also exerts upward pressure on deal
prices, reducing purchasing power for
smaller funds. GPs have adapted to this
changing landscape. As the median
early stage round size increased 118%
from 2012 to 2017, the number of funds
sized between $100 million and $250
million increased 63% and the number
of micro-funds dropped 37% in the
same period.
The shift toward larger funds is
happening rapidly, with 74% of 2017’s
follow-on funds being larger than
their predecessor, and a median size
increase of 47%. Not only do larger
vehicles provide sufficient capital for
growing initial rounds, they also help
VCs meet the swelling requirements
of follow-on funding to limit dilution
in subsequent financings. This is
particularly pertinent as VCs seek to
maintain competitiveness with mega-
funds (greater than $500 million),
which have enjoyed continually strong
fundraising for the last four years.
Though SoftBank’s $99-billion Vision
Fund is an outlier (and not included in
the fundraising figures in this report),
it represents a convenient route for
deep-pocketed LPs like sovereign
wealth funds to access venture markets,
where the check sizes are typically too
small to be meaningful. The pipeline
for continued mega-fundraising looks
strong for 2018, as a $1.5 billion fund
has already been closed by Norwest
Venture Partners, Coatue Management
expects to close a $1.3 billion vehicle
in October, and upcoming fundraises
with targets in excess of $1 billion have
been announced by Sequoia, Chinese
insurer Ping An and the Renault-
Nissan-Mitsubishi Alliance.
35%
50%
18%
1% 13%
7% 5% 19%
8% 21%
20%
47%
55% 55%
47%
49% 49%
38%
50%46%
49%54%
58%
74%
2006 2007 2008 2009 2010 2011 2012 2013 2014 2015 2016 2017
Median Fund Step-Up % of Funds Larger Than Predecessor
Sizable increase in follow-on fund sizes
VC fund step-ups
Source: PitchBook
0%
10%
20%
30%
40%
50%
60%
70%
80%
90%
100%
2006
2007
2008
2009
2010
2011
2012
2013
2014
2015
2016
2017
$1B+
$500M-$1B
$250M-$500M
$100M-$250M
$50M-$100M
Under $50M
Representation of micro-funds is diminishing
VC fundraising by size (#)
Source: PitchBook
PITCHBOOK 2017 ANNUAL PE & VC FUNDRAISING REPORT
Spotlight: Impact InvestingImpact investing enters the mainstreamImpact investing is a strategy of
making for-profit investments that
achieve both financial returns and
measurable social or environmental
impact. Impact investments are
most commonly made through
the familiar investment structure
of closed-end private investment
funds. The strategy has been
utilized by government entities,
foundations and endowments for
years, but has recently gained
9
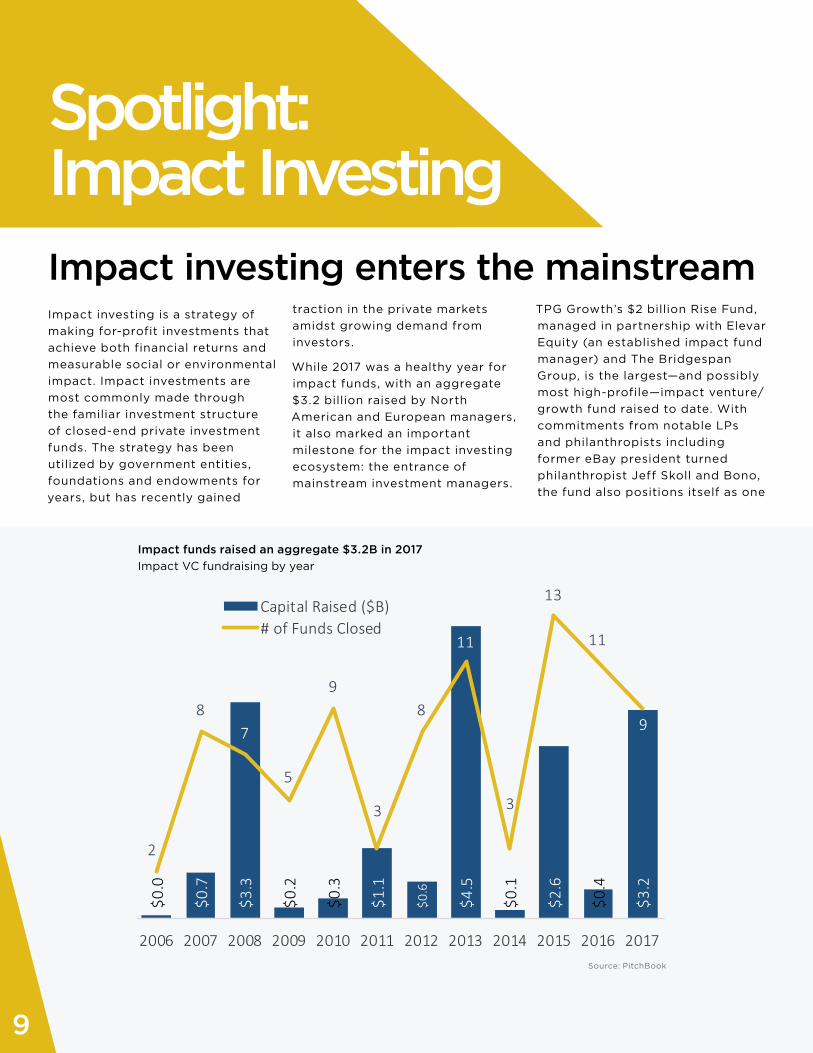
Impact funds raised an aggregate $3.2B in 2017
Impact VC fundraising by year
$0.0
$0.7
$3.3
$0.2
$0.3
$1.1
$0.6
$4.5
$0.1
$2.6
$0.4
$3.2
2
87
5
9
3
8
11
3
13
11
9
2006 2007 2008 2009 2010 2011 2012 2013 2014 2015 2016 2017
Capital Raised ($B)# of Funds Closed
Source: PitchBook
traction in the private markets
amidst growing demand from
investors.
While 2017 was a healthy year for
impact funds, with an aggregate
$3.2 billion raised by North
American and European managers,
it also marked an important
milestone for the impact investing
ecosystem: the entrance of
mainstream investment managers.
TPG Growth’s $2 billion Rise Fund,
managed in partnership with Elevar
Equity (an established impact fund
manager) and The Bridgespan
Group, is the largest—and possibly
most high-profile—impact venture/
growth fund raised to date. With
commitments from notable LPs
and philanthropists including
former eBay president turned
philanthropist Jeff Skoll and Bono,
the fund also positions itself as one
PITCHBOOK 2017 ANNUAL PE & VC FUNDRAISING REPORT10
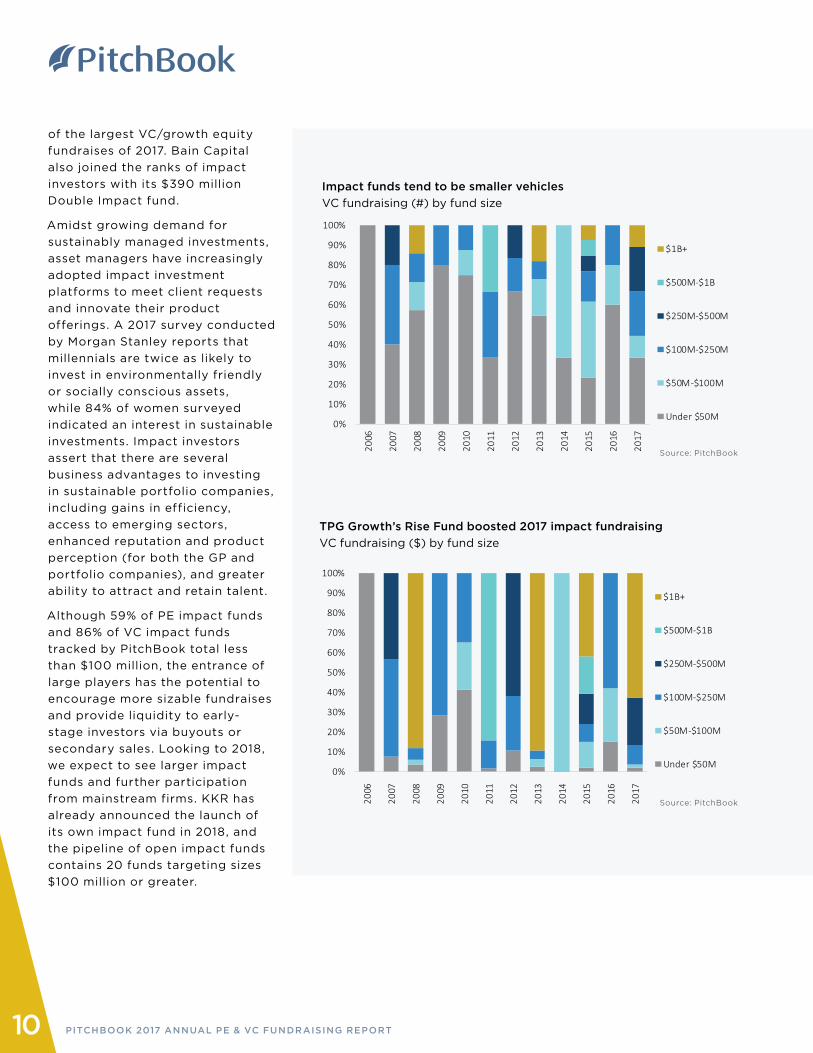
Impact funds tend to be smaller vehicles
VC fundraising (#) by fund size
TPG Growth’s Rise Fund boosted 2017 impact fundraising
VC fundraising ($) by fund size
0%
10%
20%
30%
40%
50%
60%
70%
80%
90%
100%
2006
2007
2008
2009
2010
2011
2012
2013
2014
2015
2016
2017
$1B+
$500M-$1B
$250M-$500M
$100M-$250M
$50M-$100M
Under $50M
0%
10%
20%
30%
40%
50%
60%
70%
80%
90%
100%
2006
2007
2008
2009
2010
2011
2012
2013
2014
2015
2016
2017
$1B+
$500M-$1B
$250M-$500M
$100M-$250M
$50M-$100M
Under $50M
Source: PitchBook
Source: PitchBook
of the largest VC/growth equity
fundraises of 2017. Bain Capital
also joined the ranks of impact
investors with its $390 million
Double Impact fund.
Amidst growing demand for
sustainably managed investments,
asset managers have increasingly
adopted impact investment
platforms to meet client requests
and innovate their product
offerings. A 2017 survey conducted
by Morgan Stanley reports that
millennials are twice as likely to
invest in environmentally friendly
or socially conscious assets,
while 84% of women surveyed
indicated an interest in sustainable
investments. Impact investors
assert that there are several
business advantages to investing
in sustainable portfolio companies,
including gains in efficiency,
access to emerging sectors,
enhanced reputation and product
perception (for both the GP and
portfolio companies), and greater
ability to attract and retain talent.
Although 59% of PE impact funds
and 86% of VC impact funds
tracked by PitchBook total less
than $100 million, the entrance of
large players has the potential to
encourage more sizable fundraises
and provide liquidity to early-
stage investors via buyouts or
secondary sales. Looking to 2018,
we expect to see larger impact
funds and further participation
from mainstream firms. KKR has
already announced the launch of
its own impact fund in 2018, and
the pipeline of open impact funds
contains 20 funds targeting sizes
$100 million or greater.
PITCHBOOK 2017 ANNUAL PE & VC FUNDRAISING REPORT
VC Overhang
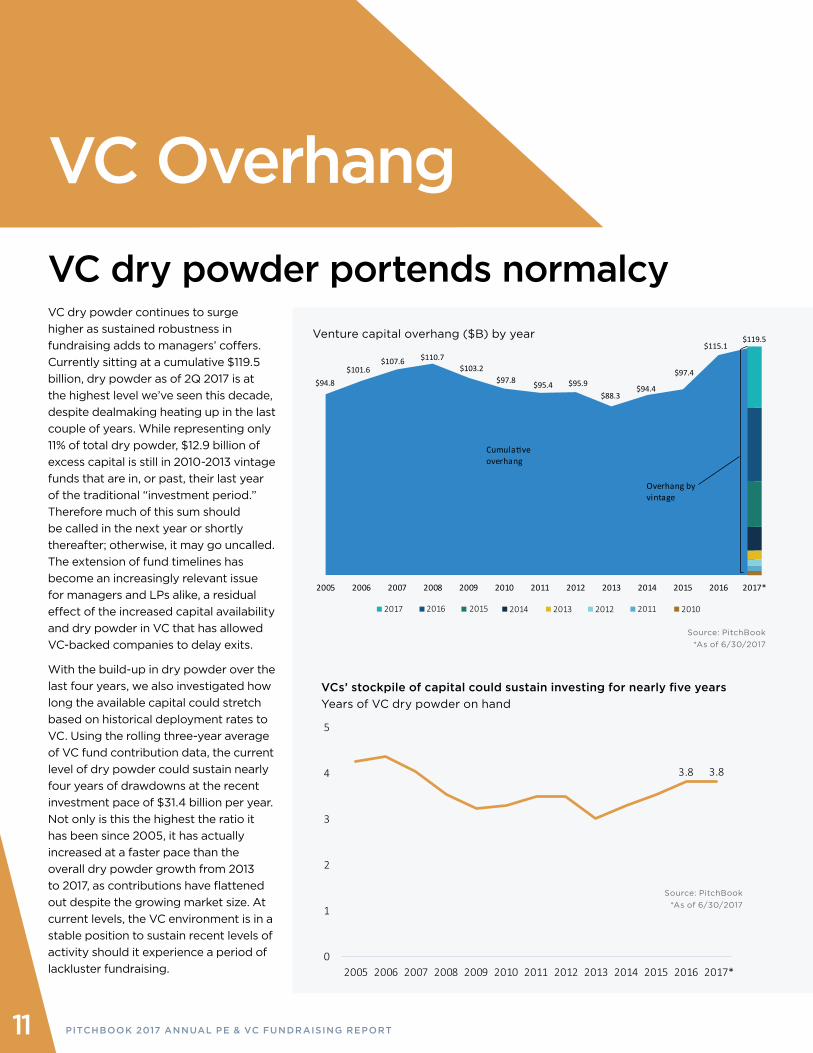
VC dry powder continues to surge
higher as sustained robustness in
fundraising adds to managers’ coffers.
Currently sitting at a cumulative $119.5
billion, dry powder as of 2Q 2017 is at
the highest level we’ve seen this decade,
despite dealmaking heating up in the last
couple of years. While representing only
11% of total dry powder, $12.9 billion of
excess capital is still in 2010-2013 vintage
funds that are in, or past, their last year
of the traditional “investment period.”
Therefore much of this sum should
be called in the next year or shortly
thereafter; otherwise, it may go uncalled.
The extension of fund timelines has
become an increasingly relevant issue
for managers and LPs alike, a residual
effect of the increased capital availability
and dry powder in VC that has allowed
VC-backed companies to delay exits.
With the build-up in dry powder over the
last four years, we also investigated how
long the available capital could stretch
based on historical deployment rates to
VC. Using the rolling three-year average
of VC fund contribution data, the current
level of dry powder could sustain nearly
four years of drawdowns at the recent
investment pace of $31.4 billion per year.
Not only is this the highest the ratio it
has been since 2005, it has actually
increased at a faster pace than the
overall dry powder growth from 2013
to 2017, as contributions have flattened
out despite the growing market size. At
current levels, the VC environment is in a
stable position to sustain recent levels of
activity should it experience a period of
lackluster fundraising.
Venture capital overhang ($B) by year
$94.8 $101.6
$107.6 $110.7 $103.2
$97.8 $95.4 $95.9 $88.3
$94.4
$97.4
$115.1 $119.5
2005 2006 2007 2008 2009 2010 2011 2012 2013 2014 2015 2016 2017*
Cumula�ve overhang
Overhang by vintage
2017 2016 2015 2014 2013 2012 2011 2010
VC dry powder portends normalcy
3.8 3.8
0
1
2
3
4
5
2005 2006 2007 2008 2009 2010 2011 2012 2013 2014 2015 2016 2017*
VCs’ stockpile of capital could sustain investing for nearly five years
Years of VC dry powder on hand
11
Source: PitchBook
*As of 6/30/2017
Source: PitchBook
*As of 6/30/2017
We do
The PitchBook Platform is the leading
web-based data software for limited partners
and other private market professionals.
custom fund benchmarks, cash flows,dry powder,valuations,GP co-investments.
You drive stronger portfolio returns.