Who bene ts from funds of hedge funds? A critique of ... paper provides a critique of alternative...
41
Who benefits from funds of hedge funds? A critique of alternative organizational structures in the hedge fund industry Preliminary Manuscript * Yang Cao † Joseph P. Ogden ‡ Cristian I. Tiu § March 18, 2010 * We thank Lenore Peterutti and Jeffrey Tarrant for comments. † 222 Jacobs Management Hall, Department of Finance and Managerial Economics, University at Buffalo, Buffalo, NY 14260. Email: [email protected] ‡ 354 Jacobs Management Hall, Department of Finance and Managerial Economics, University at Buffalo, Buffalo, NY 14260. Email: [email protected] § 366 Jacobs Management Hall, Department of Finance and Managerial Economics, University at Buffalo, Buffalo, NY 14260. Email: [email protected]
-
Upload
trinhnguyet -
Category
Documents
-
view
215 -
download
1
Transcript of Who bene ts from funds of hedge funds? A critique of ... paper provides a critique of alternative...

Who benefits from funds of hedge funds?
A critique of alternative organizational structures in
the hedge fund industry
Preliminary Manuscript∗
Yang Cao† Joseph P. Ogden‡ Cristian I. Tiu§
March 18, 2010
∗We thank Lenore Peterutti and Jeffrey Tarrant for comments.†222 Jacobs Management Hall, Department of Finance and Managerial Economics, University at
Buffalo, Buffalo, NY 14260. Email: [email protected]‡354 Jacobs Management Hall, Department of Finance and Managerial Economics, University at
Buffalo, Buffalo, NY 14260. Email: [email protected]§366 Jacobs Management Hall, Department of Finance and Managerial Economics, University at
Buffalo, Buffalo, NY 14260. Email: [email protected]

Who benefits from funds of hedge funds?
A critique of alternative organizational structures in
the hedge fund industryPreliminary Manuscript
Abstract
This paper provides a critique of alternative organizational structures in the hedge fund industry.Our critique is facilitated by several stylized models describing alternative industry structures.The models include: (1) An inside-only hedge fund model; (2) A straddling hedge fund model;(3) A straddling ’feeder’ fund of funds (FOF) hedge fund model; (4) A stand-alone outside hedgefund; and (5) An outside ’feeder’ FOF hedge fund model. Our discussion of these models, whichcenters on benefits vs. fundamental problems related to illiquidity, information asymmetry, andconflicts of interest, leads to several hypotheses about the differential characteristics and returnperformance of both individual hedge funds and FOFs. We test as many of these hypothesesas data availability allows, and evidence is consistent with these hypotheses. Regarding char-acteristics, we predict that some hedge funds and FOFs will have greater leverage and/or morerestrictive withdrawal policies than others, and evidence is consistent with these predictions.Regarding return performance, we predict that certain hedge funds, and FOFs in general, willhave relatively poor return performance, and evidence is consistent.
Keywords: Hedge funds; Funds of funds; illiquidity; information asymmetry; conflicts of interest;adjacency risk; contagion; return performanceJEL Classification Codes: D02, G2

Contents
1 Introduction 1
2 Literature Review 2
2.1 Information Asymmetry (or Opacity) . . . . . . . . . . . . . . . . . . . . . . . . . 3
2.2 Illiquidity . . . . . . . . . . . . . . . . . . . . . . . . . . . . . . . . . . . . . . . . 4
2.3 Leverage . . . . . . . . . . . . . . . . . . . . . . . . . . . . . . . . . . . . . . . . . 6
2.4 Performance . . . . . . . . . . . . . . . . . . . . . . . . . . . . . . . . . . . . . . . 6
3 Fundamental problems with hedge funds and critiques of alternative organi-zational structures 8
3.1 A review fundamental problems associated with hedge funds . . . . . . . . . . . . 8
3.1.1 Problem Cluster #1: Opacity . . . . . . . . . . . . . . . . . . . . . . . . . 8
3.1.2 Problem Cluster #2: Operational risks . . . . . . . . . . . . . . . . . . . . 9
3.1.3 Problem Cluster #3: Alpha dilution risks . . . . . . . . . . . . . . . . . . 10
3.2 Critiques of alternative hedge fund organizational structures . . . . . . . . . . . . 10
3.2.1 The traditional investment bank model . . . . . . . . . . . . . . . . . . . 11
3.2.2 The inside-only hedge fund model . . . . . . . . . . . . . . . . . . . . . . 11
3.2.3 The straddling hedge fund model . . . . . . . . . . . . . . . . . . . . . . . 12
3.2.4 The straddling ’feeder’ fund of funds model . . . . . . . . . . . . . . . . . 13
3.2.5 The stand-alone outside hedge fund model . . . . . . . . . . . . . . . . . . 14
3.2.6 The outside ’feeder’ fund of funds model . . . . . . . . . . . . . . . . . . . 14
4 Data and preliminary evidence 15
4.1 Data sources . . . . . . . . . . . . . . . . . . . . . . . . . . . . . . . . . . . . . . 15
4.2 How important are funds of hedge funds? . . . . . . . . . . . . . . . . . . . . . . 16
5 Funds of hedge funds and their investors 17
5.1 The relative performance of funds of hedge funds . . . . . . . . . . . . . . . . . . 17
5.2 The relative liquidity of funds of funds . . . . . . . . . . . . . . . . . . . . . . . . 19
6 Fund of funds and the hedge funds industry 20
6.1 Funds of funds and hedge funds’ prime brokers . . . . . . . . . . . . . . . . . . . 20
6.2 Funds of funds and hedge funds flows . . . . . . . . . . . . . . . . . . . . . . . . 20
6.3 Funds of funds and hedge funds performance . . . . . . . . . . . . . . . . . . . . 21
6.4 Funds of funds flows and industry performance . . . . . . . . . . . . . . . . . . . 22
7 Conclusions 23
1 Introduction
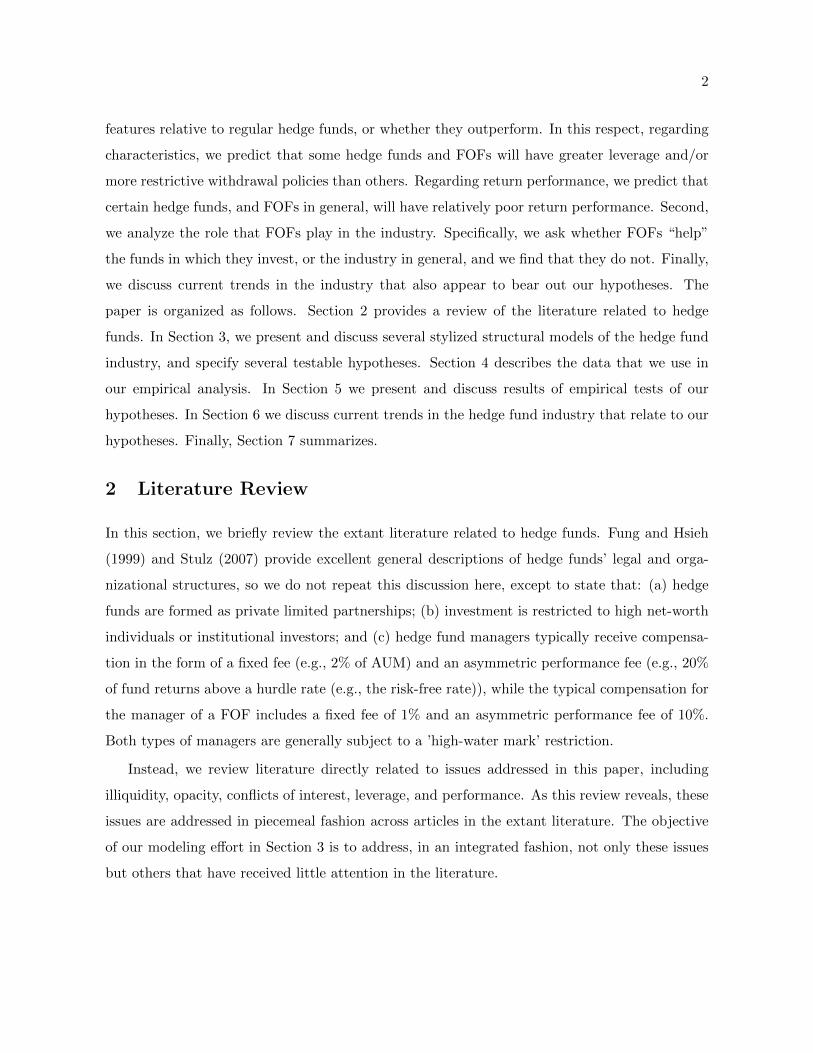
Over the past 20 years, the hedge fund industry has experienced a tremendous boom-and-bust
cycle. Regarding the boom, Stulz (2007) reports that: “In 1990, less than $50 billion was
invested in hedge funds; in 2006, more than $1 trillion was invested in hedge funds.” (p. 176).
Citi (2010) reports that from 2000-2003, assets under management (AUM) increased 67.1%,
from $490.6 billion to $820.0 billion, and increased an additional 135% to $1.93 trillion in the
second quarter of 2008, when AUM peaked. Thereafter, however, the financial crisis took a
heavy toll on AUM, as the industry experienced outflows of $151.7 billion and $103.3 billion
in the fourth quarter of 2008 and first quarter of 2009, respectively. Over time, one particular
class of funds, namely funds of hedge funds (FOFs), steadily represented about a third of the
industry.
Citi argues that the hedge fund industry grew after 2000 largely because of institutional in-
vestors’ disillusionment following the busting of the ’dot-com’ bubble: “As the technology boom
of the late 1990s faded and market turmoil set in during the early 2000s, institutional investors’
allocations to long-only equities and bonds failed to generate the returns many sought. As their
liability gaps increased, institutional investors began to broaden their investment horizon and
look increasingly at alternatives.” (p. 12) Specifically, hedge funds held out the promise of pos-
itive performance regardless of market returns. However, if hedge funds can fulfill this promise,
the trillion dollar question is: Why did the industry experience outflows rather than inflows
during the turmoil of the latest financial crisis?
In this paper, we attempt to address this question through a critique of structures that have
evolved in the hedge fund industry, particularly post-2000, and specifically, Funds of Funds.
Our critique is facilitated by several stylized models describing alternative structures in the
industry. The models are: (1) An inside-only hedge fund model; (2) A straddling hedge fund
model; (3) A straddling ’feeder’ fund of funds (FOF) hedge fund model; (4) A stand-alone
hedge fund model; and (5) An outside ’feeder’ FOF hedge fund model. Our discussion of these
models, which centers on advantages versus fundamental problems, leads to several hypotheses
about the organizational structure, operational structure, risk, and return performance of both
individual hedge funds and FOFs. We test as many of these hypotheses as data availability
allows, and evidence is generally consistent with these hypotheses. We discuss FOFs from two
distinct perspectives. First, an investor’s perspective includes whether FOFs offer attractive
2
features relative to regular hedge funds, or whether they outperform. In this respect, regarding
characteristics, we predict that some hedge funds and FOFs will have greater leverage and/or
more restrictive withdrawal policies than others. Regarding return performance, we predict that
certain hedge funds, and FOFs in general, will have relatively poor return performance. Second,
we analyze the role that FOFs play in the industry. Specifically, we ask whether FOFs “help”
the funds in which they invest, or the industry in general, and we find that they do not. Finally,
we discuss current trends in the industry that also appear to bear out our hypotheses. The
paper is organized as follows. Section 2 provides a review of the literature related to hedge
funds. In Section 3, we present and discuss several stylized structural models of the hedge fund
industry, and specify several testable hypotheses. Section 4 describes the data that we use in
our empirical analysis. In Section 5 we present and discuss results of empirical tests of our
hypotheses. In Section 6 we discuss current trends in the hedge fund industry that relate to our
hypotheses. Finally, Section 7 summarizes.
2 Literature Review
In this section, we briefly review the extant literature related to hedge funds. Fung and Hsieh
(1999) and Stulz (2007) provide excellent general descriptions of hedge funds’ legal and orga-
nizational structures, so we do not repeat this discussion here, except to state that: (a) hedge
funds are formed as private limited partnerships; (b) investment is restricted to high net-worth
individuals or institutional investors; and (c) hedge fund managers typically receive compensa-
tion in the form of a fixed fee (e.g., 2% of AUM) and an asymmetric performance fee (e.g., 20%
of fund returns above a hurdle rate (e.g., the risk-free rate)), while the typical compensation for
the manager of a FOF includes a fixed fee of 1% and an asymmetric performance fee of 10%.
Both types of managers are generally subject to a ’high-water mark’ restriction.
Instead, we review literature directly related to issues addressed in this paper, including
illiquidity, opacity, conflicts of interest, leverage, and performance. As this review reveals, these
issues are addressed in piecemeal fashion across articles in the extant literature. The objective
of our modeling effort in Section 3 is to address, in an integrated fashion, not only these issues
but others that have received little attention in the literature.

3
2.1 Information Asymmetry (or Opacity)
The information asymmetry or opacity problem may be the most serious problem that besets
the hedge fund industry. Hedge funds lack transparency because each hedge fund’s investment
strategy is proprietary, so managers are loathe to reveal details about their strategy and op-
erations to anyone, including current and prospective investors. They are private, rather than
public, in order to avoid SEC requirements for filing audited financial statements (though some
hedge funds do so). Hedge funds’ reporting is essentially limited to a broad statement about
investment strategy and periodic reports of fund returns. As a result, the entire hedge fund
industry is potentially subject to the lemons problem associated with information asymmetry
as in Akerlof (1970). Consequences of this problem have received considerable attention in the
literature, though analyses focus more on implications of the problem and less on mechanisms
to mitigate the problem.
Bollen and Pool (2009b) use statistical analysis to determine whether hedge fund managers
fully report gains but delay reporting losses in order to reduce the risk of capital flight. They
suggest that their conditional serial correlation measure is a leading indicator of fraud. Bollen
and Pool (2009a) find “. . . a significant discontinuity in the pooled distribution of monthly hedge
fund returns: the number of small gains far exceeds the number of small losses. The discontinuity
is present in live and defunct funds, and funds of all ages, suggesting it is not caused by database
biases. The discontinuity is absent in the three months culminating in an audit, suggesting it is
not attributable to skillful loss avoidance. The discontinuity disappears when using bimonthly
returns, indicating a reversal in fund performance following small gains. This result suggests the
discontinuity is caused at least in part by temporarily overstated returns.” (Abstract) Brown,
Goetzmann, Liang, and Schwarz (2008) examine SEC filings by hedge funds during a temporary
period (February 2006) when SEC mandated filings (via Form ADV) were made (i.e., before a
court overturned the mandate). Among other findings, they document: “. . . evidence that the
information in the form has the potential to add value to the investor decision-making process.
Hedge funds operated by managers filing Form ADV in 2006 had better past performance and
had more assets than those operated by managers who did not file either because they were
technically exempt from the filing requirement, or because they simply chose not to file. This
result suggests that filing alone may be a potential signal of quality. In addition, we find a
strong positive association between potential conflicts identified in the Form ADV filing and
4
past legal and regulatory problems. Finally, through a canonical correlation analysis, we are
able to establish a link between potential conflicts identified in Form ADV filings and operational
risk characteristics in the Lipper TASS, Inc. (TASS) database.” (p. 2787) Brown, Goetzmann,
Liang, and Schwarz (2010) summarize the results of their analysis of hedge fund due diligence
(DD) reports as follows: “In this paper we study a sample of 444 due diligence (DD) reports from
a major hedge fund DD firm, many of which indicate a lack of transparency about past legal
and regulatory problems, failure to use a major auditing firm and the use of internal pricing . . .
This study uses evidence of inadequate or failed internal processes to derive a simple and direct
measure of operational risk . . . Exposure to this risk increases the likelihood of subsequent poor
performance. Since these DD reports are performed after positive performance it is important
to control for potential bias due to this and other conditioning factors. Although our sample
is not sufficiently large to determine whether this is a priced source of risk, it does not appear
that exposure to operational risk influences in any way the tendency of hedge fund investors to
invest on the basis of past high returns. Our study emphasizes the importance of information
verification in the context of financial intermediation.” (Abstract)
Finally, Stulz (2007) suggests that the relative growth of FOFs over time may be due to their
role in mitigating opacity problems, among other roles: “A fund-of-funds is a hedge fund that
invests in individual hedge funds and monitors these investments, thereby providing investors
a diversified portfolio of hedge funds, risk management services, and a way to share the due
diligence costs with other investors.” (p. 180) So again, FOFs seem to hold promise as a
positive development in the industry. In Section 3, we suggest an alternative motive for the
development of some FOFs, particularly those developed by investment banks for their own
funds. We also suggest a dark side to other FOFs: They may steer investors toward hedge funds
that are relative lemons. We find support for this hypothesis.
2.2 Illiquidity
A hedge fund is created to exploit the talents of its managers to identify arbitrage opportunities
that arise in a given security market due to temporary mispricing. Finance theory suggests that
such opportunities are more likely to emerge, and to be larger, in securities that are relatively
illiquid (e.g., small-firm stocks). As a general consequence, though, a considerable amount of
time is required for these arbitrage strategies to yield profits. Thus, investment in a hedge fund

5
itself is necessarily relatively illiquid. Getmansky, Lo, and Makarov (2004) and others document
that hedge fund returns exhibit considerable ‘exposure’ to illiquidity.
To deal with illiquidity exposure, hedge funds generally impose two types of exit restrictions
on its investors. First, a new investor is subject to an initial lock-up period during which the
investor cannot withdraw their investment. Second, a seasoned investor must give redemption
notice before they can withdraw their funds, and the filing of such a notice is often available
only during certain time windows throughout the year. Exit restrictions vary considerably across
hedge funds. Aragon (2007) documents evidence that average returns are higher for hedge funds
that are more withdrawal restricted, suggesting that hedge fund returns in effect contain an ‘illiq-
uidity’ premium. Similarly, Sadka (2010) finds that “liquidity risk as measured by the covariation
of fund returns with unexpected changes in aggregate liquidity is an important determinant in
the cross-section of hedge-fund returns. The results show that funds that significantly load on
liquidity risk subsequently outperform low-loading funds by about 6% annually, on average, over
the period 1994-2008, while negative performance is observed during liquidity crises.” (p. 54)
Also, Khandani and Lo (2009) find that the hedge fund returns are correlated with returns on
illiquid assets. (See also Longstaff (2001); Kahl, Liu, and Longstaff (2003); Lerner and Schoar
(2004)). Of course, the flip side of this discussion is that hedge funds improve the liquidity of the
markets in which they invest. Brophy, Ouimet, and Sialm (2009) document evidence consistent
with this argument. (See also Ben-David, Franzoni, and Moussawi (2010))
Finally, it is conceivable that funds of hedge funds (FOFs) could serve to ease the illiquidity
problem in the hedge fund industry. Specifically, a FOF could (a) spread investor redemptions
across the numerous hedge funds in which it invests, or (b) identify specific hedge funds within
its portfolio that are more amenable to redemptions at a given point in time. Indeed, such a
redemptions distributing service could be a major reason for the existence of FOFs. Instead,
researchers have focused on other reasons for the existence of FOFs, as we discuss below. Thus,
we test the redemptions distributing hypothesis by comparing the redemption-restriction terms
of FOFs with those of stand-alone hedge funds. If the argument has merit, FOFs should be ob-
served offering better redemption terms than stand-alone hedge funds. However, our modeling
discussion in Section 3 leads us to be skeptical about the realization of this redemptions dis-
tributing service, at least for some FOFs. Indeed, we shall document that in the recent period,
the FOFs do not offer better share redemptions than individual hedge funds.
6
2.3 Leverage
An under-investigated research question is why many hedge funds employ substantial leverage.
The importance of the leverage question is underscored by the spectacular failures of hedge funds
Long-Term Capital Management (LTCM) and Amaranth, both of which were highly levered. In
a recent paper, Titman (2010) addresses the issue of hedge fund leverage:
“ . . . the leverage of investment funds, such as hedge funds, is not well understood. Manyof the issues that relate to the leverage of hedge funds and the leverage of corporations aresimilar. In particular, in the event of a negative shock, the overly levered hedge fund, likean overly levered corporation, may be forced to close out illiquid positions at unfavorablecosts. These costs received substantial attention in the popular press, both around theLTCM crisis in 1998 and during the more recent episode in 2008. However, the advantagesof leverage for hedge funds are much less understood. Indeed, there are no tax advantages.Although issues of hedge fund leverage have attracted considerable attention from regulatorsand the popular press, academics have not seriously examined why hedge funds tend tobe so highly levered. Despite the obvious disadvantages of leverage, hedge funds are oftensubstantially more levered than typical corporations. Indeed, according to the Lipper TASSdata base there are a number of convertible arbitrage funds that have leverage ratios thatexceed five to one. And while the measurement of hedge fund leverage is itself a challenge,given the alternative avenues available to hedge funds for levering their investments, e.g.,debt and derivatives, there seems to be substantial cross-sectional and time series variationin the use of leverage by hedge funds. The question that I will raise in this note is whetherthere is a fundamental (i.e., fully rational) explanation of the substantial use of leverage byhedge funds. Or do hedge funds simply use leverage to inflate returns in good times to foolor in other ways exploit nave clients?” (pp. 2-3)
Although Titman arrives at no definitive conclusions on the issue, he suggests several po-
tential market imperfections that may explain hedge funds’ use of leverage. For instance, hedge
funds may use leverage on a contingent ’line-of-credit’ basis to inject capital that offsets redemp-
tions following poor performance. Alternatively, leverage “can arise from the convexity of the
direct compensation of hedge funds as well as the indirect incentives that come from the hedge
funds’ inflows and outflows. Convex payoffs generate an incentive to increase leverage and in
other ways increase risk.” (p. 7) We discuss hedge funds’ use of leverage within our modeling
analysis in Section 3. We arrive at a hypothesis that is actually close to Titman’s early quip
that hedge funds may use leverage to “inflate returns in good times to fool or in other ways
exploit nave clients,” although our hypothesis predicts that only a subset of lemon hedge funds
use leverage for this purpose. Later, we test this hypothesis and find support for it.
2.4 Performance
The price performance of hedge funds is easily the most widely researched issue. Overall,
the evidence regarding whether hedge funds provide superior return performance is mixed. In

7
attempting to assess performance, researchers have had to deal with two major problems, (a)
developing an appropriate benchmark for judging performance; and (b) dealing with survivorship
bias in the data. (See Fung and Hsieh (1997a); Lo (2005))
Ackermann, McEnally, and Ravenscraft (1999) conducted one of the earliest empirical anal-
yses of hedge fund performance. They summarize their results as follows: “Using a large sample
of hedge fund data from 1988-1995, we find that hedge funds consistently outperform mutual
funds, but not standard market indices. Hedge funds, however, are more volatile than both
mutual funds and market indices. Incentive fees explain some of the higher performance, but
not the increased total risk. The impact of six data-conditioning biases is explored. We find ev-
idence that positive and negative survival-related biases offset each other.” (p. 833) In contrast,
Grecu, Malkiel, and Saha (2007) find that managers of poorly performing funds more likely to
fail to report results. Liang (2000) also questions the findings of Ackermann, McEnally, and
Ravenscraft (1999) after finding survivorship bias of over 2% per year. (See also Amin and Kat
(2003)) Liang (2001) corrects for survivorship bias and finds that HFs have a higher Sharpe ratio
than the S& P 500, 0.41 to 0.27, based on data for the years 1990-1999. Both Xiong, Idzorek,
Chen, and Ibbotson (2009) and Fung, Hsieh, Naik, and Ramadorai (2008) find that hedge funds
generate positive abnormal returns. Edwards and Caglayan (2010) also find evidence of hedge
fund outperformance, as well as performance persistence for up to two years. (See also Agarwal
and Naik (2000); Kosowski, Naik, and Teo (2007))
In contrast, several studies document evidence that hedge funds are unable to generate
superior returns. Asness, Krail, and Liew (2001) find that, after accounting for stale pricing in
illiquid securities, hedge funds do not provide superior returns. Fung, Xu, and Yau (2004) find
that global hedge fund managers are unable to provide superior performance after adjusting
for illiquidity effects, nonlinearity, and survivorship bias. Malkiel and Saha’s (2005) analysis
suggests that much of the reported superior performance of hedge funds is due to survivorship
bias which, they estimate, adds up to 4.5% per year to hedge fund returns.
Finally, several researchers have analyzed the performance of FOFs. Ang, Rhodes-Kropf,
and Zhao (2008) argue that because they offer diversification that investors cannot achieve on
their own, FOFs are uniquely desirable investments. Agarwal and Kale (2007) argue that FOFs
and multi-strategy hedge funds are similarly diversified, yet the multi-strategy hedge funds
outperform FOFs even on a gross-of-fees basis. Fung, Hsieh, Naik, and Ramadorai (2008) find
that FOFs deliver abnormal returns only for a brief period, and that mostly they underperform.

8
3 Fundamental problems with hedge funds and critiques of al-
ternative organizational structures
To investors, the advantage of the hedge fund structure over mutual funds is that hedge funds
have greater flexibility in seeking abnormal returns, or alpha. A hedge fund can take positions in
the market that mutual funds cannot, including short positions, levered positions, and positions
in derivatives. Moreover, hedge fund managers’ contracts provide them with a strong incentive
to create alpha, while mutual funds’ contracts are more restrictive.
Against these and other advantages, however, there are many fundamental problems with
hedge funds. In this section, we initially discuss these fundamental problems. We then describe
several alternative organizational structures in the hedge fund industry to determine the extent
to which each is subject to these fundamental problems.
3.1 A review fundamental problems associated with hedge funds
Here we briefly discuss several fundamental problems associated with at least some hedge funds.
Though all of these problems may be interrelated, some problems are more obviously related to
each other, so we group the problems into three clusters.
3.1.1 Problem Cluster #1: Opacity
As discussed in Section 2, the opacity of hedge funds gives rise to two fundamental problems: (a)
the lemons problem; and (b) the potential for fraud. Regarding the lemons problem, if investors
lack the information necessary to distinguish hedge funds with genuine ability to generate alpha,
then the industry will tend to include bogus or ’lemon’ hedge funds whose managers claim that
their strategy produces alpha when in fact they do not. Such managers are simply attempting to
reap private benefits from assets under management (AUM) for as long as possible. To extend
their operations over time, they will resort to biased reporting of returns by using internal
pricing, realizing gains while delaying losses, etc.
The literature reviewed in Section 2 alludes to two mechanisms to mitigate these opacity
problems. First, investors will make transparency demands, such as an external audit. However,
a hedge fund then may resort to hiring a lax auditor, to bribing the auditor, etc. Alternatively,
a monitoring mechanism could be employed. For instance, Stulz (2007) suggests that FOFs
could serve as monitors of stand-alone hedge funds. However, this argument presumes that the
9
manager of the FOFs is not a benefitting participant in, or indeed the chief perpetrator of, a
fraud.
3.1.2 Problem Cluster #2: Operational risks
Hedge funds face numerous risks that are inherent to their operations. First and foremost,
hedge funds generally face liquidity risk, as they take positions in relatively illiquid securities,
or positions in liquid securities that must be maintained for a considerable length of time. In
turn, liquidity risk leads to funding risks. A hedge fund is financed by equity investors who
may add to or withdraw their investments over time. Hedge funds respond to the liquidity risk
posed by its equity investors by restricting investment and withdrawals, both initially and over
time (i.e., in terms of lock-up period, redemption notice period, and redemption frequency). As
we discuss later, the restrictions that a given hedge fund must impose depends critically on its
investor clientele. A hedge fund’s prime broker, as its lender, can also expose the fund to funding
risk, because the prime broker may later withdraw or modify their lines of credit, margin terms
or short-sale terms. In turn, funding risk engenders adjacency risk. Because investors’ assets
are co-mingled in a hedge fund, the decisions of some investors, particularly to either add or
withdraw funds, may adversely affect the overall performance of the fund, especially if these
actions disrupt the fund’s trading strategy, causing either overinvestment or costly premature
liquidations.
Of course, hedge funds’ use of leverage poses its own risks, especially the potential need
for costly distressed liquidations. Leverage can be used on a contingent ’line-of-credit’ basis to
inject capital that offsets redemptions by equity investors following poor performance. On the
other hand, as Titman (2010) argues, hedge fund managers may have an incentive, due to the
convexity of their contracts, to use leverage even if it is not in the investors’ interest.
Finally, we have concentration risk. If a hedge fund invests in only a few investments, or
in only a few asset classes, sectors, or geographical areas, the fund will be more risky than if
it was more diversified. FOFs and multi-strategy funds can alleviate this problem, the former
by investing in stand-alone hedge funds that collectively are diversified, the latter by directly
pursuing diversified strategies.

10
3.1.3 Problem Cluster #3: Alpha dilution risks
There are at least three ways in which a given hedge fund, pursuing a given strategy to generate
alpha, can see their efforts thwarted. First, we have the issue of size. If the size of a hedge fund’s
AUM becomes large relative to the size of the market in which it is operating, its own trades
can move prices and destroy alpha at the margin. Alternatively, if multiple hedge funds are,
even unwittingly, pursuing the same source of alpha, as their collective AUM grows the same
result will occur. Second, and related, is the risk of mimicking. New mimicking hedge funds may
develop based on the success of a given hedge fund’s strategy, especially if the initial hedge fund
loses key personnel who then become competition for the same alpha. Third, because a hedge
fund must use one or more prime brokers to execute trades, the executing broker may engage in
front running of the hedge fund’s trades, which can substantially dilute the hedge fund’s ability
to generate alpha.
3.2 Critiques of alternative hedge fund organizational structures
Next, we describe and critique several alternative organizational structures in the hedge fund
industry in light of the fundamental problems discussed above. We facilitate our discussion
by developing several stylized models of the organizational structures that have evolved in the
industry in recent years. (We admit that these models are simplifications of the hedge fund world,
and are limited in scope to essential elements upon which we focus.) The alternative structures
vary in terms of the extent to which a given hedge fund is (a) tethered to a given investment bank
and its ’inside’ investor clients, at one extreme, versus (b) funded by ’outside’ investors and/or
a fund of funds, at the other extreme. Our discussion of these models highlights advantages and
disadvantages of the alternative structures. In particular, we argue that opacity and conflict of
interest problems vary substantially across these alternative structures, to the extent that some
structures may be fundamentally flawed. Our critique leads to several hypotheses about cross-
sectional variation in stand-alone hedge fund characteristics (redemption restrictions, leverage,
the use of 1 vs. multiple prime brokers, etc.) and performance, as well as a hypothesis about
the boom-and-bust cycle that the industry exhibited during the decade of the 2000s.

11
3.2.1 The traditional investment bank model
The alternative hedge fund organizational structures that we will discuss are illustrated in Fig-
ure 1, Panels B through F. However, we initially discuss a model of the traditional investment
bank, illustrated in Panel A. The traditional model is important for perspective, as ’inside’
hedge funds, defined later, directly supplant the traditional model. In the traditional model, the
investment bank (the ’House’) employs investment managers who make trades for the individual
accounts of ’inside’ or ’client’ investors, as well as proprietary trades for the House account. The
investment bank executes these trades in its role as the sole prime broker, receiving commissions
directly from individual clients. Individual client investors also pay the House full fees (as dis-
tinguished from the reduced fees they pay in a hedge fund structure). Finally, the investment
bank pays salaries and bonuses to investment managers.
From the perspective of our analysis, the primary advantage of the traditional structure is
the relatively stable bond that exists among (a) the House/prime broker, (b) the investment
managers (i.e., trading talent), and (c) the individual investor clientele. In particular, the House
serves as an effective monitor of investment managers on behalf of its clients because (a) it has
inside information on the investment managers’ trading strategies and performance, and (b) it
has an incentive to protect its reputational capital. The primary disadvantages of the traditional
structure include: (a) Individual investment managers are constrained in their trading strategies;
(b) Investment managers’ incentives are curbed if bonuses are based on pooled performance; and
(c) The House incurs substantial back office costs associated with the numerous individual trades
with individual clients. These disadvantages, among others, may have spurred the development
of ’inside’ hedge funds, to which we now turn.
3.2.2 The inside-only hedge fund model
Our initial hedge fund model is illustrated in Panel B of Figure 1. We label the depicted structure
as ’inside-only’ because the focal hedge fund is open only to a given investment bank and its
investor clientele. The inside-only hedge fund has the simplest hedge fund structure among
those we discuss, and it is also the oldest (i.e., in the modern hedge fund era). Comparing the
inside-only hedge fund model with the traditional investment bank model, we see that: (a) the
general managers of the hedge fund(s) replace the cadre of investment managers; (b) clients, as
well as the House, invest in the hedge fund(s) rather than in individual securities; and (c) the
12
House, via its role as prime broker, collects commissions from the hedge fund rather than from
individual clients. Moreover, the hedge fund’s general partners are paid directly from the hedge
fund for their investment management services, so client investors pay only reduced fees to the
House (rather than full fees in the traditional model, which include a component to pay salary
and bonuses to investment managers). Finally, the House provides the hedge fund with a credit
facility and risk management services.
The advantages of the inside-only hedge fund structure are primarily that they mitigate
disadvantages of the traditional structure noted earlier. First, the investment constraints faced
by investment managers in the traditional structure are alleviated; the hedge fund’s general
partners are relatively free to pursue specific investment strategies that may involve specific
securities, short-selling, the use of leverage, etc. Second, the hedge fund’s general partners have
a stronger incentive to perform than is the case for traditional investment managers because their
pay is directly tied to the performance of the hedge fund that they control. Third, the House’s
back office costs are substantially reduced because individual clients invest in the hedge fund
rather than numerous individual securities. The inside-only hedge fund structure should be able
to capture these advantages without substantial loss of the ’trust’ advantage of the traditional
structure. After all, the House can (a) control the amount of client (and House) capital that
is invested in each of its inside hedge funds, and (b) effectively monitor the trading strategies
and performance of its inside hedge funds. Moreover, the House has two strong incentives to
monitor the performance of its inside hedge funds: (a) It still collects (albeit reduced) fees from
its investor clientele; and (b) It stands to benefit from its own (i.e., proprietary) investment
in the hedge funds. The inside hedge fund model also avoids all of the fundamental problems
discussed earlier. Overall, we conclude that the inside-only hedge fund structure dominates the
traditional investment bank structure. As we will see below, the inside-only hedge fund structure
also appears to dominate other hedge fund structures.
3.2.3 The straddling hedge fund model
The second hedge fund structure is illustrated in Panel C of Figure 1. We call this the ’straddling’
hedge fund model because, while the hedge fund remains strongly tethered to a single investment
bank (especially its prime brokerage and investor clientele), it is also open to outside investors.
A potential advantage of this structure over the ’inside-only’ structure is that each hedge fund
has the opportunity to be larger, and thus better able to capture economies of scale, than if its

13
size is restricted to include only the ’inside’ capital (i.e., clientele and House capital) allocated
by the House. The hedge fund’s general partners would be particularly keen to pursue this
opportunity because both their base fee and profit share increase with fund size.
However, several fundamental problems attend the straddling hedge fund structure do not
exist within inside-only hedge fund structure. These include transparency demands, funding
risk, adjacency risk, and size. Regarding size, we stated above that increasing the size of a
hedge fund can be an advantage due to economies of scale and increased incentive compensation
for investment managers. However, if the fund grows too large for the market being exploited,
alpha will be diluted. Of course, hedge fund can close to new investors to avoid this threat to
its strategic mandate. Nevertheless, the adjacency problem emerges with new outside investors
because, unlike the investment bank’s inside investor clientele, outside investors have no bond of
trust with the investment bank or its hedge funds. Thus, if outside investors withdraw substantial
funds, other investors, including and especially the investment bank’s inside investor clientele,
stand to lose, which would compromise the bond of trust with the investment bank. A straddling
hedge fund can reduce the expected costs of un-orderly liquidations by having a longer lock-up
period and more restrictive redemption terms, but these would also be imposed on inside clients,
which was unnecessary in the ’inside-only’ hedge fund structure. Allowing outside investors into
a hedge fund also engenders a transparency demands problem. Outside investors will demand
information about the fund’s investment strategy. Indeed, many institutional investors are
barred from making investments where due diligence is inadequate. This may pose a dilemma
because a hedge fund’s investment strategy is proprietary, and its revelation in any detail would
jeopardize its value. This problem may not be severe in the case of a straddling hedge fund
because it can lean on its tether to the House’s reputation; hence the term ’brand hedge fund’
in industry lexicon. However, as we discuss later the transparency dilemma may be a serious
problem for ’outside’ hedge funds.
3.2.4 The straddling ’feeder’ fund of funds model
One means by which an investment bank can manage both investments into and withdrawals
from its ’opened’ hedge funds by outside investors is to create a straddling ’feeder’ fund of funds
as depicted in Panel D of Figure 1. Outside investors invest in and withdraw from the FOF,
and the FOF’s general partners, working in conjunction with the House, allocate new outside
capital to hedge funds that can profitably invest it, and allocate withdrawals to hedge funds

14
that are most amenable to withdrawals. This investment-and-withdrawal allocation motive
for developing a FOF complements the motives suggested by Stulz (2007) and noted earlier:
monitoring, diversification, risk management, and due diligence efficacy.
The investment bank can make further use of its FOF to reduce adjacency risk for its client
investors by allocating some of the outside capital to additional ’outside’ hedge funds. These
additional ’relief valve’ hedge funds can be employed to mitigate adverse effects of either excess
capital inflows or withdrawals by outsiders on the inside hedge funds in which clients are directly
invested. Of course, the outside hedge funds may be inferior to inside hedge funds, in which
case the performance of the FOF will be inferior to the performance of the investment bank’s
inside hedge funds, even before the FOFs general partners take their cut. Thus, our straddling
’feeder’ FOF model suggests one reason why evidence (Agarwal and Kale (2007); Fung, Hsieh,
Naik, and Ramadorai (2008)) has shown that FOFs underperform stand-alone hedge funds even
on a gross-of-fees basis: ’Relief-valve’ hedge funds may be lemons.
3.2.5 The stand-alone outside hedge fund model
Panel E of Figure 1 depicts a model for a simple stand-alone outside hedge fund. The outside
hedge fund exhibits all of the fundamental problems that we have discussed. An outside hedge
fund is likely to exhibit a greater lemons problem than the inside hedge funds discussed earlier
because they are not formally tethered to an investment bank and its reputational capital.
Thus, potential investors will make more transparency demands. Funding and adjacency risks
are also likely to be high for an outside hedge fund. Size issues and mimicking may be a greater
problem for outside hedge funds, as well. Finally, outside hedge funds are exposed to greater
front running risk. In the figure, we depict the outside hedge fund as having two prime brokers,
as this may be necessary to limit front running.
3.2.6 The outside ’feeder’ fund of funds model
The final hedge fund organizational structure that we discuss, which we call the outside ’feeder’
fund of funds model, is depicted in the Panel F of Figure 1. Investors invest in the FOF, which
in turn invests in a variety of ’tethered’ outside hedge funds. This arrangement has two potential
advantages over the stand-alone outside hedge fund model. First, the outside FOF managers
can efficiently screen ’winner’ outside hedge funds, and monitor those selected, on behalf of
15
investors. Second, the arrangement may serve to stabilize the flow of funds into and out of
each hedge fund, thus alleviating both funding and adjacency risks for each of the outside hedge
funds relative to what they would face on a stand-alone basis. This structure provides additional
advantages in terms of reducing concentration risk and capturing economies of scale in terms of
due diligence, risk management, and back office duties.
However, the outside ’feeder’ FOF structure is also replete with problems. First, adjacency
risk may be substantial despite the moderating effect of a FOF because the investor base does
not include a cadre of stable ’inside’ investors. For this reason, we predict that an outside
FOF may actually be forced to offer relatively poor liquidity for outside investors (i.e., in terms
of lock-up period, redemption notice period, and redemption frequency). Second, the general
managers of both the outside FOF and the outside hedge funds in which it invests may have
relatively small amount of reputational capital at stake, which can lead to a situation in which
many of the outside hedge funds in the structure may be lemons. Third and finally, the bond
between each hedge fund and the prime broker(s) it uses is much weaker than for ’inside’ hedge
funds. Consequently, the stand-alone hedge funds in this structure may still need to employ
multiple prime brokers to mitigate front running risk.
4 Data and preliminary evidence
In this section, we first detail our data sources and then provide evidence on the importance of
the funds of hedge funds in the hedge fund industry.
4.1 Data sources
For funds performance and characteristics, we obtain data from Lipper TASS (henceforth TASS).
Our data spans the period from January 1994 to December 2008, but since funds may report late
(Titman and Tiu (2010)), we use records as of April 2009. The TASS database has been used
extensively by hedge funds researchers with some (e.g. Liang (1999)) suggesting that it should
be the preferred database for academic research. There are a total of 12,678 funds reporting in
the TASS database, of which 6,749 are still in existence. Of all the funds reporting, roughly a
third (3,689) are funds of hedge funds.

16
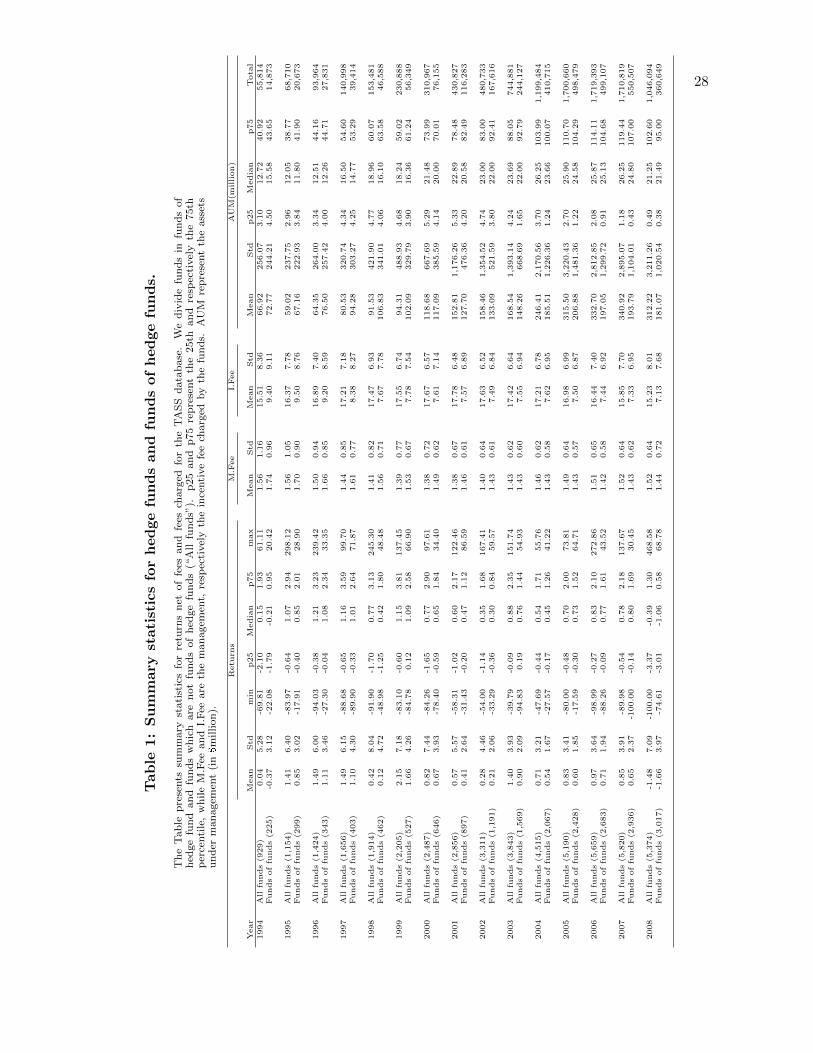
Table 1 presents summary statistics of the funds in the TASS database. The AUM tracked
by TASS exploded from a little over $50 billion in 1994 to over $1.7 trillion in 2006,1 to decrease
to around $1 trillion until December 2008 as the industry traversed the world financial crisis.
While TASS provides data on a variety of fund characteristics, such as leverage or style, it does
not track whether stand-alone funds have a fund of hedge funds among their investors. Funds
of hedge funds, in turn, do not disclose their portfolios.
In order to obtain information on whether a fund has a FOF among its investors, we collect
data from Morningstar. In addition to tracking hedge funds, the Morningstar database reports
a specific variable that is equal to one if an stand-alone hedge fund had at least one FOF among
its investors. The Morningstar database has been previously used by de Roon, Guo, and ter
Horst (2010) to argue that the stand-alone funds having funds of hedge funds investors are not
selected randomly from all the funds available. The Morningstar database tracks 6,976 funds as
of December 2008; unfortunately, statistics such as leverage, or data such as the day a fund joins
a database are not reported in Morningstar and thus we needed to merge the the two databases.
We performed the merger using fund names. Such matching procedures are used in the hedge
funds literature, for example recently by Agarwal, Jiang, and Fos (2010). In the merger, we
identify a total of 7,283 common funds. Of these, 2,085 have at least one FOF investor, while
the remainder of 5,198 were never associated with a FOF.
4.2 How important are funds of hedge funds?
We continue by analyzing how important funds of hedge funds are in the industry.
First, from Table 1, we observe that the average FOF is more than 50% larger in terms
of AUM than the average hedge fund. Anecdotal evidence suggests that institutional investors
prefer hedge funds that are larger, over $200 million in AUM, so it appears that funds of funds
are more likely to fall onto the radar screen of institutions.
In order to analyze the relative importance of the FOFs in the industry, in Figure 2 we plot
the number of funds of hedge funds as well as their AUM relative to the entire industry excluding
the funds of funds themselves. Figure 2 tells an interesting story: The size of AUM for FOFs
increased slightly over time relative to the size of the industry. FOFs manage roughly a third
of the assets in the hedge fund industry. At the same time the relative number of FOFs also
1These are funds other than funds of hedge funds. We assume that including the funds of hedge funds in thetotal AUM means double counting.
17
increased relative to the number of funds in the industry. These results suggest that funds of
hedge funds are an important part of the hedge fund industry and that their importance did not
diminish in time. Funds of funds survived not only crises but also academic research questioning
their fees-on-fees (e.g. Brown, Goetzmann, and Liang (2004)) or their underperformance relative
to similarly diversified organizations such as multi-strategy funds (Agarwal and Kale (2007)).
Moreover, FOFs see their role in the industry increasing even when the entire industry (including
funds of funds themselves) experienced outflows in 2008. If funds of funds indeed are important
for the hedge fund industry, the goal of our study is to elucidate the role they fulfill.
We continue by exploring the role funds of hedge funds play for their investors.
5 Funds of hedge funds and their investors
In this section we study funds of hedge funds performance and liquidity from the perspective of
their investors. In the previous section we documented an increase in the relative importance of
funds of hedge funds in the industry. One possible explanation is that investors prefer to invest
in funds of hedge funds rather than investing directly, and such preferences may be motivated
by the performance of funds of funds and by the liquidity they offer to their investors. In this
section, we explore whether, relative to the funds they invest in, funds of hedge funds deliver
performance and liquidity to their investors.
5.1 The relative performance of funds of hedge funds
In this subsection we examine the relative performance of funds of hedge funds. In order to
do so, we perform a set of tests whose results are presented in Table 2. In order to estimate
the performance of funds of funds relative to the funds they may invest in, we start with the
investment opportunity set for funds of hedge funds managers. We initially examine all hedge
funds with at least one fund of funds investor and that have at least 5 years of history (from
January 2004 to December 2008). In Panel A of Table 2, we consider all possible hedge funds
with a fund of funds investor, while in Panel B we restrict attention to only the funds which are
currently open for investment.
As a first test, we extract principal components from the returns of all hedge funds, as this
is representative of the investment opportunity set of funds of hedge funds. We retain the first
10 principal components, which explain 78.20% of the variance of returns, and regress excess

18
returns of funds of funds on excess returns of the 10 principal components. We then record
the distribution of fund of funds alphas. From Table 2 we observe that the alphas of funds
of funds are negative and significantly different from zero. A negative alpha suggests that the
performance of funds of funds investment strategies are insufficient to cover the extra layer of
fees the funds of funds charge.
For robustness considerations we perform several additional tests. First, we impose the
restriction that a hedge fund cannot be shorted. Therefore, a negative alpha from an OLS
model may be misleading when the regressors are hedge fund portfolios and some of the betas
are negative. From this perspective, in addition to OLS we have also performed Sharpe (1992)
style regressions. The results of these tests are stronger. For example, while the average alpha
with respect to principal components is -1.02% annually when we regress fund of funds returns
on the principal components extracted from the returns of funds open to investment, the average
alpha becomes -2.12% per year when Sharpe style regressions are used. In some of the models,
more than 75% of the funds of funds have negative alphas.
Although principal components represent the most direct way to calculate the relative perfor-
mance of funds of hedge funds, these portfolios may not necessarily be investible. We therefore
perform an alternative test in which we replace the principal components with strategy indices
from Hedge Funds Research. Our result, that the average hedge funds alpha is negative, con-
tinues to hold. Finally, funds of funds may exhibit relative underperformance when compared
to the average hedge fund, but as long as they exhibit positive risk adjusted performance, they
may still be a desirable investment. To check if this is the case we regressed the performance
of funds on hedge funds on the Fung and Hsieh (2004) factors. The result remains that the
average FOF underperforms. These results are consistent with the work of Agarwal and Kale
(2007) who argue that funds of funds underperformed one particular class of hedge fund, namely
multi-strategy funds, both on a net as well as gross basis.
These results suggests that from a performance perspective, funds of funds are a less-than-
perfect alternative to investing in hedge funds directly. In the next subsection we investigate
how investing in funds of funds compares to direct investment in hedge funds from a liquidity
perspective.
19
5.2 The relative liquidity of funds of funds
Funds of hedge funds are in principle diversified; thus, they should offer their investors better
liquidity terms than investors would obtain by investing directly in stand-alone hedge funds. In
this subsection we investigate this issue.
In order to compare the liquidity offered by funds of funds with that offered by the funds
in which they invest, we analyze three fund characteristics determining the liquidity offered by
funds to their investors. The first is the lockup period. This is the time period a new investor in
a hedge fund is precluded from taking their capital out. Hedge funds may engage in strategies
which attempt to earn a premium for holding illiquid assets. In order for the funds to execute
these strategies, investors need to keep their capital in the funds. Lockup periods accomplish
exactly this task. Consistent with this idea, Aragon (2007) finds that funds with longer lockup
periods do indeed exhibit higher alphas. The other two liquidity measures we analyze represent
the “immediate” liquidity offered by hedge funds. They are, respectively, redemption frequency,
which expresses how often investors are allowed to withdraw money from the fund, and the
redemption notice period, which is waiting time for an investor to receive the proceeds of their
withdrawn investment.
Although funds of funds are a diversified portfolio of funds and thus in theory can offer
better liquidity terms than the average hedge fund in their portfolio, we should not expect all
the liquidity measures enumerated above to be better for funds of hedge funds. For example,
despite diversification, unless it holds cash a fund of funds still needs to have a longer redemption
notice period than each of the stand-alone funds in its portfolio. Panel A of Figure 3 presents
asset weighted redemption notice periods for funds of funds as well as for the funds owned
at least partially by a fund of funds. Consistent with our expectation, funds of funds require
advanced withdrawal notifications of around 10 days. Furthermore, this spread has doubled in
the last 5 years of our sample.
While we cannot expect funds of hedge funds to exhibit better (i.e., shorter) redemption
notice periods than the funds they hold, we would expect, due to diversification, that fund of
funds offer better (i.e. shorter) lockup periods as well as more generous (i.e., more frequent)
redemption frequencies than the funds in which they invest. Panels B and C or Figure 3 present
the asset weighted redemption frequencies and respectively lockup periods for funds of funds
and for the funds in which they are invested. In the early half of our sample funds of funds did
20
offer better liquidity terms. However, we observe a reversal of those terms in the second half of
the sample. As apparent from the Figure, the liquidity terms offered by funds of hedge funds
to their investors are, in the most recent period of our sample, worse than what the investors
could have obtained by investing directly in hedge funds.
We thus conclude that funds of hedge funds do not generate outperformance nor offer better
liquidity terms than what investors could obtain, were they able to directly invest in the same
hedge funds that are held by funds of hedge funds. In the next section we investigate the role
played by funds of funds for the hedge funds industry.
6 Fund of funds and the hedge funds industry
In the previous section we have documented that funds of hedge funds do not seem to create more
favorable liquidity or performance terms for their investors, than if the investors can themselves
obtain, would they directly invest in stand-alone hedge funds. In this section we examine the
role played by funds of funds for stand-alone hedge funds.
6.1 Funds of funds and hedge funds’ prime brokers
In this subsection we study the number of prime brokers employed by an stand-alone hedge
fund which is owned by a fund of funds. Our premise is that having a FOF among investors will
facilitate a hedge fund’s access to capital, thus, increase the number of trading programmes as
well as access to more brokers.
From Table 3, we observe that generally, funds having at least one fund of funds investor
indeed have more prime brokers. The particular strategies where this is not the case are the
statistical arbitrage and the emerging markets categories; for these cases the differences are not
statistically significant.
We thus conclude that having a FOF among its investors does not appear to reduce front-
running risk, nor provide significantly better access to more trading programs.
6.2 Funds of funds and hedge funds flows
In this subsection we investigate whether hedge funds with fund of funds investors receive more
flows than other hedge funds.
21
To do so, in Table 4 we report time series averages of quarterly flows for hedge funds with
at least a fund of funds investor as well as for funds without one. Since past performance may
affect flows, we reports break the funds into nine past performance bins. Finally, we have broken
the reporting into two subperiods: Panel A includes the time period from 1996 to 2000 while
Panel B reports from 2004 to 2008.
We observe that in the early period, having a fund of funds among investors aided good
performers to receive flows. For example, the funds in the best performing bin received 3.33%
more inflows per quarter, on average, than the funds without a fund of fund investor. In contrast,
the funds in the worst performing decile experience a 0.01% more outflow per quarter when they
have a fund of funds among their investors.
For the most recent time period this ceases to be the case, as apparent from Panel B of
Table 4. Having a fund of funds among its investors only increases the flows into a hedge fund,
regardless of performance. However, the increase in flows associated with having a fund of funds
among your investors appears to have decreased in magnitude in the recent period.
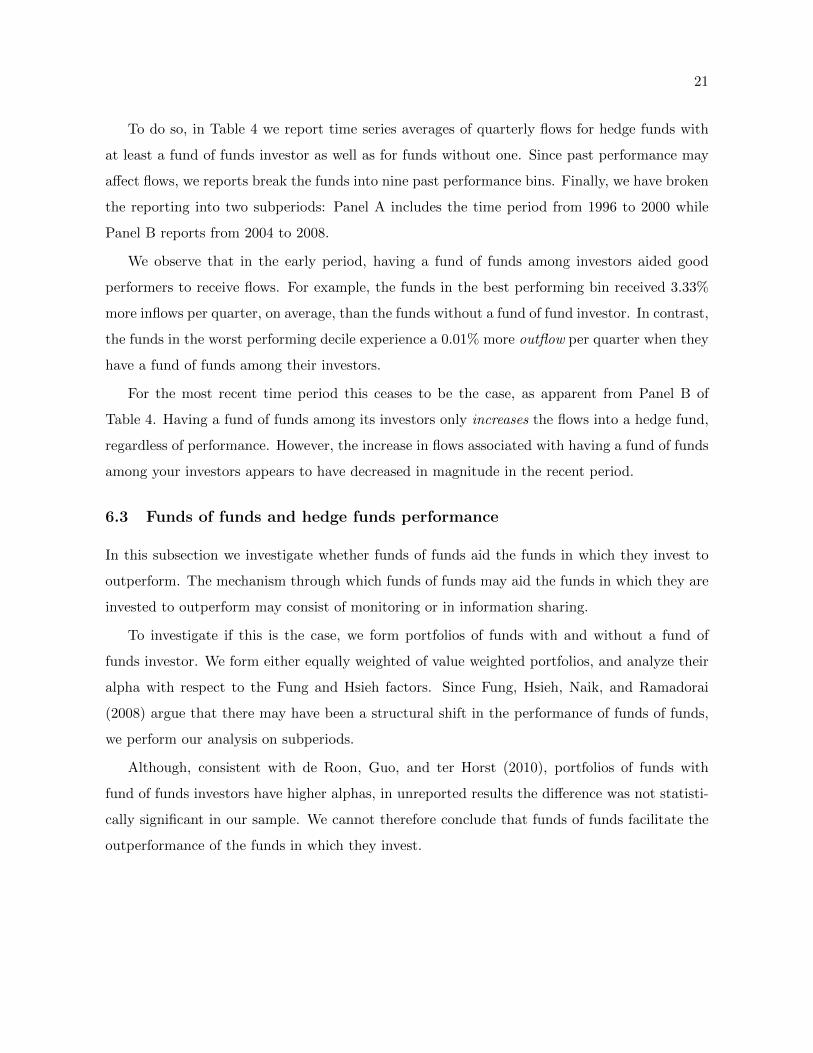
6.3 Funds of funds and hedge funds performance
In this subsection we investigate whether funds of funds aid the funds in which they invest to
outperform. The mechanism through which funds of funds may aid the funds in which they are
invested to outperform may consist of monitoring or in information sharing.
To investigate if this is the case, we form portfolios of funds with and without a fund of
funds investor. We form either equally weighted of value weighted portfolios, and analyze their
alpha with respect to the Fung and Hsieh factors. Since Fung, Hsieh, Naik, and Ramadorai
(2008) argue that there may have been a structural shift in the performance of funds of funds,
we perform our analysis on subperiods.
Although, consistent with de Roon, Guo, and ter Horst (2010), portfolios of funds with
fund of funds investors have higher alphas, in unreported results the difference was not statisti-
cally significant in our sample. We cannot therefore conclude that funds of funds facilitate the
outperformance of the funds in which they invest.

22
6.4 Funds of funds flows and industry performance
In this section we analyze the effect that funds of funds flows have on the hedge fund industry.
There are two channels through which we expect the FOF flows to influence the hedge funds
alphas. First, as in Berk and Green (2004), flows into hedge funds in general depress alpha,
and this effect has been documented in several studies, among which most recent is that of Teo
(2010). The question is whether funds of funds do so to a greater extent than stand-alone hedge
funds. This may happen, for example, because the FOF managers are less able to estimate
hedge fund strategies’ capacities than the hedge fund managers themselves.
In order to analyze if this is the case, we calculate 24-month rolling flows into FOFs and
stand-alone hedge funds separately. We also calculate concomitant 24-month rolling alphas
with respect to the Fung-Hsieh factors for stand-alone hedge funds, and then analyze how the
distribution of hedge fund alphas changes as capital flow into or out of fund of funds. In order
to quantify the importance of flows on alphas, we have regressed the first four moments of the
distribution of alpha (mean, standard deviation, skewness and kurtosis) on concomitant hedge
fund and FOF flows. The results are presented in Table 5. From the Table, we observe that
both stand-alone as well as FOF flows are associated with a smaller mean of the hedge fund
alphas. However, FOF flows contribute to a greater degree to this decrease. In fact, as apparent
from the Table, flows into FOF depress the average alpha more than twice as much as the flows
into hedge funds directly.
We next analyze the effect of flows on the cross-sectional dispersion of alphas. While flows
into stand-alone hedge funds increase the dispersion of alphas (suggesting that managers with
viable ideas were the ones experiencing inflows) flows into FOFs decrease the alpha dispersion.
This suggests that when FOF receive inflows, they dispense of the capital in a manner which
makes the identification of outperforming managers more difficult.
The relationship between flows and skewness is similar in spirit to the relationship between
flows and the cross-sectional dispersion of alpha. While the relationship between hedge fund
flows and alpha skewness is insignificant, flows into FOFs are associated with more negative
skewness in alphas.
For kurtosis, both hedge funds and FOF flows are associated with a decrease in kurtosis.
Given that FOF flows are associated more negative skewness, we conclude that the effect of
23
FOF flows on the tails of the distribution of hedge funds alphas is that the right tails of this
distribution are curtailed above and beyond the effect on the left tails.
Therefore, we conclude that FOF flows negatively impact the hedge fund industry above
and beyond the impact expected from stand-alone hedge funds flows. Having argues that, we go
one step forward and analyze whether flows into FOFs trigger the appearance of “lemon funds”.
To do so, for each month t we construct the flows into hedge funds and FOF universe during
month t. We also construct value weighted and equally weighted portfolios of funds that are,
respectively, less than one year old, between one and two, between two and three, and finally
more than three years old. We also separate these portfolios by whether the funds have a FOF
investor or not. For each of these portfolios, we calculate alphas on the subsequent year, from
month t + 1 to month t + 12. We then regress the alphas on the flows, also controlling for the
magnitudes of both the hedge funds’ and the FOFs’ AUM.
The results are presented in Table 6. From the Table, flows into FOFs are associated with
lower subsequent alphas for all the funds, while the effect is generally stronger for the the younger
hedge funds, albeit statistically insignificant. Although Aggarwal and Jorion (2010) document
that emerging managers outperform, we document that their performance is reduced when FOFs
receive flows.
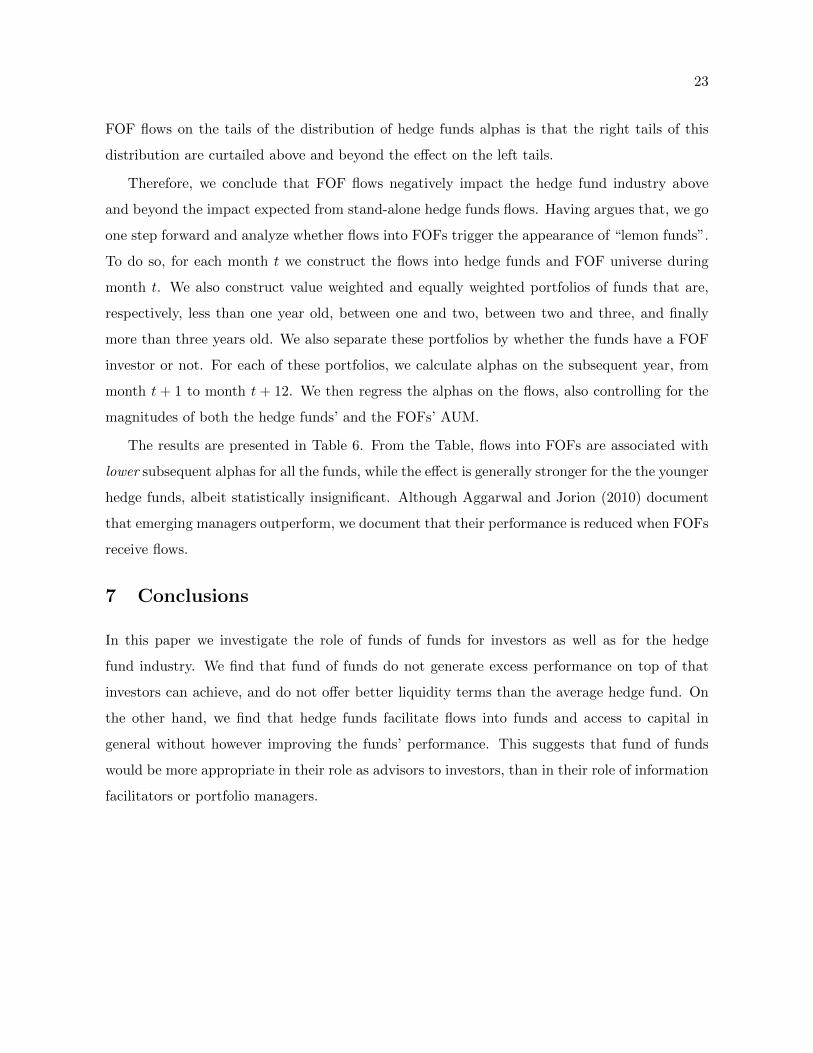
7 Conclusions
In this paper we investigate the role of funds of funds for investors as well as for the hedge
fund industry. We find that fund of funds do not generate excess performance on top of that
investors can achieve, and do not offer better liquidity terms than the average hedge fund. On
the other hand, we find that hedge funds facilitate flows into funds and access to capital in
general without however improving the funds’ performance. This suggests that fund of funds
would be more appropriate in their role as advisors to investors, than in their role of information
facilitators or portfolio managers.
24
References
Ackermann, C., R. McEnally, and D. Ravenscraft, 1999, The performance of hedge funds: Risk,return, and incentives, Journal of Finance 54, 833–874.
Agarwal, V., W. Jiang, and V. Fos, 2010, Inferring reporting biases in hedge fund databasesfrom hedge fund equity holdings, .
Agarwal, V., and J. R. Kale, 2007, On the relative performance of multi-strategy and funds ofhedge funds, Journal of Investment Management 5, 41–63.
Agarwal, V., and N. Y. Naik, 2000, On taking the alternative route: risks, rewards, and perfor-mance persistence of hedge funds, Journal of Alternative Investments 2, 6–23.
Aggarwal, R.K., and P. Jorion, 2010, The performance of emerging hedge funds and managers,Journal of Financial Economics 96, 238–256.
Akerlof, G.A., 1970, The market for ’lemons’: Quality uncertainty and the market mechanism,Quarterly Journal of Economics 84, 488–500.
Amin, G., and H. Kat, 2003, Welcome to the dark side: Hedge fund attrition and survivorshipbias over the period 1994-2001, Journal of Alternative Investments 6, 57–73.
Ang, A., M. Rhodes-Kropf, and R. Zhao, 2008, Do funds of funds deserves their fees on fees?,Journal of Investment Management 6, 34–58.
Aragon, G., 2007, Share restrictions and asset pricing: evidence from the hedge fund industry,Journal of Financial Economics 83, 33–58.
Asness, C, R. Krail, and J. Liew, 2001, Do hedge funds hedge?, Journal of Portfolio Management28, 6–19.
Ben-David, I., F. Franzoni, and R. Moussawi, 2010, The behavior of hedge funds during liquiditycrises, .
Berk, J., and R. Green, 2004, Mutual fund flows and performance in rational markets, Journalof Political Economy 112, 1269–1295.
Bollen, N.P.B., and V.K. Pool, 2009a, Do hedge fund managers misreport returns? evidencefrom the pooled distribution, Journal of Finance.
Bollen, N., and V. K. Pool, 2009b, Do hedge fund managers misreport returns? evidence fromthe pooled distribution, Journal of Finance 64, 2257–2288.
Brophy, D.J., P.P. Ouimet, and C. Sialm, 2009, Hedge funds as investors of last resort?, Reviewof Financial Studies 22, 541–574.
Brown, S.J., W.N. Goetzmann, B. Liang, and C. Schwarz, 2008, Mandatory disclosure andoperational risk: Evidence from hedge fund registration, Journal of Finance 63, 2785–2815.
, 2010, Trust and delegation, .
Brown, S. J., W. Goetzmann, and B. Liang, 2004, Fees on fees in funds of funds, Journal ofInvestment Management 2, 39–56.

25
Citi, 2010, The liquidity crisis and its impact on the hedge fund industry, Citi Perspectives.
de Roon, F. A., J. Guo, and J. R. ter Horst, 2010, A random walk by fund of funds managers?,.
Edwards, F. R., and M. O. Caglayan, 2010, Hedge fund performance and manager skill, Journalof Futures Markets.
Fung, W., and D. Hsieh, 1997a, Empirical characteristics of dynamic trading strategies: the caseof hedge funds, Review of Financial Studies 10, 275–302.
, 1999, A primer on hedge funds, Journal of Empirical Finance 6, 309–31.
, 2004, Hedge fund benchmarks: a risk based approach, Financial Analyst Journal 60,65–80.
, N. Y. Naik, and T. Ramadorai, 2008, Hedge funds: performance, risk and capitalformation, Journal of Finance 63, 1777–1803.
Getmansky, M., A. W. Lo, and I. Makarov, 2004, An econometric model of serial correlationand illiquidity in hedge fund returns, Journal of Financial Economics 74, 529–610.
Grecu, A., B.G. Malkiel, and A. Saha, 2007, Why do hedge funds stop reporting performance?,Journal of Portfolio Management 34, 119–126.
Kahl, M., J. Liu, and F. Longstaff, 2003, Paper millionaires: how valuable is stock to a stock-holder who is restricted from selling it?, Journal of Financial Economics 67, 385–410.
Khandani, A.E., and A.W. Lo, 2009, Illiquidity premia in asset returns: An empirical analysisof hedge funds, mutual funds, and u.s. equity portfolios, .
Kosowski, R., N. Y. Naik, and M. Teo, 2007, Do hedge funds deliver alpha? a bayesian andbootstrap approach, Journal of Financial Economics 84, 229–264.
Lerner, J., and A. Schoar, 2004, The illiquidity puzzle: theory and evidence from private equity,Journal of Financial Economics 72, 3–40.
Liang, B., 1999, On the performance of hedge funds, Financial Analsysts Journal 55, 72–85.
, 2000, Hedge funds: the living and the dead, Journal of Financial and QuantitativeAnalysis 35, 309–326.
, 2001, Hedge fund performance: 1990 — 1999, Financial Analysts Journal 57, 11–18.
Lo, A., 2005, The dynamics of the hedge fund industry, Charlottesville, VA: The ResearchFoundation of CFA Institute pp. 1–121.
Longstaff, F., 2001, Optimal portfolio choice and the valuation of illiquid securities, Review ofFinancial Studies 14, 407–431.
Sadka, R., 2010, Liquidity risk and the cross section of hedge fund returns, Journal of FinancialEconomics.
Sharpe, W., 1992, Asset allocation: management style and performance measurement, Journalof Portfolio Management 18, 7–19.

26
Stulz, R. M., 2007, Hedge funds: Past, present, and future, Journal of Economic Perspectives21, 175–194.
Teo, M., 2010, The liquidity risk of liquid hedge funds, Journal of Financial Economics.
Titman, S., 2010, The leverage of hedge funds, Finance Research Letters 7, 2–7.
, and C. I. Tiu, 2010, Do the best hedge funds hedge?, Review of Financial Studies.
Xiong, J., T. M. Idzorek, P. Chen, and R. Ibbotson, 2009, Impact of size and flows on perfor-mance for funds of hedge funds, Journal of Portfolio Management 35, 118–130.

Tables and Figures
28
Tab
le1:
Su
mm
ary
stati
stic
sfo
rh
ed
ge
fun
ds
an
dfu
nd
sof
hed
ge
fun
ds.
Th
eT
ab
lep
rese
nts
sum
mary
stati
stic
sfo
rre
turn
sn
etof
fees
an
dfe
esch
arg
edfo
rth
eT
AS
Sd
ata
base
.W
ed
ivid
efu
nd
sin
fun
ds
of
hed
ge
fun
dan
dfu
nd
sw
hic
hare
not
fun
ds
of
hed
ge
fun
ds
(“A
llfu
nd
s”).
p25
an
dp
75
rep
rese
nt
the
25th
an
dre
spec
tivel
yth
e75th
per
centi
le,
wh
ile
M.F
eean
dI.
Fee
are
the
man
agem
ent,
resp
ecti
vel
yth
ein
centi
ve
fee
charg
edby
the
fun
ds.
AU
Mre
pre
sent
the
ass
ets
un
der
man
agem
ent
(in$m
illion
).
Retu
rns
M.F
ee
I.Fee
AUM
(million)
Year
Mean
Std
min
p25
Median
p75
max
Mean
Std
Mean
Std
Mean
Std
p25
Median
p75
Tota
l1994
All
funds(9
29)
0.04
5.28
-69.81
-2.10
0.15
1.93
61.11
1.56
1.16
15.51
8.36
66.92
256.07
3.10
12.72
40.92
55,814
Fundsoffu
nds(2
25)
-0.37
3.12
-22.08
-1.79
-0.21
0.95
20.42
1.74
0.96
9.40
9.11
72.77
244.21
4.50
15.58
43.65
14,873
1995
All
funds(1
,154)
1.41
6.40
-83.97
-0.64
1.07
2.94
298.12
1.56
1.05
16.37
7.78
59.02
237.75
2.96
12.05
38.77
68,710
Fundsoffu
nds(2
99)
0.85
3.02
-17.91
-0.40
0.85
2.01
28.90
1.70
0.90
9.50
8.76
67.16
222.93
3.84
11.80
41.90
20,673
1996
All
funds(1
,424)
1.49
6.00
-94.03
-0.38
1.21
3.23
239.42
1.50
0.94
16.89
7.40
64.35
264.00
3.34
12.51
44.16
93,964
Fundsoffu
nds(3
43)
1.11
3.46
-27.30
-0.04
1.08
2.34
33.35
1.66
0.85
9.20
8.59
76.50
257.42
4.00
12.26
44.71
27,831
1997
All
funds(1
,656)
1.49
6.15
-88.68
-0.65
1.16
3.59
99.70
1.44
0.85
17.21
7.18
80.53
320.74
4.34
16.50
54.60
140,998
Fundsoffu
nds(4
03)
1.10
4.30
-89.90
-0.33
1.01
2.64
71.87
1.61
0.77
8.38
8.27
94.28
303.27
4.25
14.77
53.29
39,414
1998
All
funds(1
,914)
0.42
8.04
-91.90
-1.70
0.77
3.13
245.30
1.41
0.82
17.47
6.93
91.53
421.90
4.77
18.96
60.07
153,481
Fundsoffu
nds(4
62)
0.12
4.72
-48.98
-1.25
0.42
1.80
48.48
1.56
0.71
7.67
7.78
106.83
341.01
4.06
16.10
63.58
46,588
1999
All
funds(2
,205)
2.15
7.18
-83.10
-0.60
1.15
3.81
137.45
1.39
0.77
17.55
6.74
94.31
488.93
4.68
18.24
59.02
230,888
Fundsoffu
nds(5
27)
1.66
4.26
-84.78
0.12
1.09
2.58
66.90
1.53
0.67
7.78
7.54
102.09
329.79
3.90
16.36
61.24
56,349
2000
All
funds(2
,487)
0.82
7.44
-84.26
-1.65
0.77
2.90
97.61
1.38
0.72
17.67
6.57
118.68
667.69
5.29
21.48
73.99
310,967
Fundsoffu
nds(6
46)
0.67
3.93
-78.40
-0.59
0.65
1.84
34.40
1.49
0.62
7.61
7.14
117.09
385.59
4.14
20.00
70.01
76,155
2001
All
funds(2
,856)
0.57
5.57
-58.31
-1.02
0.60
2.17
122.46
1.38
0.67
17.78
6.48
152.81
1,176.26
5.33
22.89
78.48
430,827
Fundsoffu
nds(8
97)
0.41
2.64
-31.43
-0.20
0.47
1.12
86.59
1.46
0.61
7.57
6.89
127.70
476.36
4.20
20.58
82.49
116,283
2002
All
funds(3
,311)
0.28
4.46
-54.00
-1.14
0.35
1.68
167.41
1.40
0.64
17.63
6.52
158.46
1,354.52
4.74
23.00
83.00
480,733
Fundsoffu
nds(1
,191)
0.21
2.06
-33.29
-0.36
0.30
0.84
59.57
1.43
0.61
7.49
6.84
133.09
521.59
3.80
22.00
92.41
167,616
2003
All
funds(3
,843)
1.40
3.93
-39.79
-0.09
0.88
2.35
151.74
1.43
0.62
17.42
6.64
168.54
1,393.14
4.24
23.69
88.05
744,881
Fundsoffu
nds(1
,569)
0.90
2.09
-94.83
0.19
0.76
1.44
54.93
1.43
0.60
7.55
6.94
148.26
668.69
1.65
22.00
92.79
244,127
2004
All
funds(4
,515)
0.71
3.21
-47.69
-0.44
0.54
1.71
55.76
1.46
0.62
17.21
6.78
246.41
2,170.56
3.70
26.25
103.99
1,199,484
Fundsoffu
nds(2
,067)
0.54
1.67
-27.57
-0.17
0.45
1.26
41.22
1.43
0.58
7.62
6.95
185.51
1,226.36
1.24
23.66
100.07
410,715
2005
All
funds(5
,190)
0.83
3.41
-80.00
-0.48
0.70
2.00
73.81
1.49
0.64
16.98
6.99
315.50
3,220.43
2.70
25.90
110.70
1,700,660
Fundsoffu
nds(2
,428)
0.60
1.85
-17.59
-0.30
0.73
1.52
64.71
1.43
0.57
7.50
6.87
206.88
1,481.36
1.22
24.58
104.29
498,479
2006
All
funds(5
,659)
0.97
3.64
-98.99
-0.27
0.83
2.10
272.86
1.51
0.65
16.44
7.40
332.70
2,812.85
2.08
25.87
114.11
1,719,393
Fundsoffu
nds(2
,683)
0.71
1.94
-88.26
-0.09
0.77
1.61
43.52
1.42
0.58
7.44
6.92
197.05
1,299.72
0.91
25.13
104.68
499,107
2007
All
funds(5
,820)
0.85
3.91
-89.98
-0.54
0.78
2.18
137.67
1.52
0.64
15.85
7.70
340.92
2,895.07
1.18
26.25
119.44
1,710,819
Fundsoffu
nds(2
,936)
0.65
2.37
-100.00
-0.14
0.80
1.69
30.45
1.43
0.62
7.33
6.95
193.79
1,104.01
0.43
24.80
107.00
550,507
2008
All
funds(5
,374)
-1.48
7.09
-100.00
-3.37
-0.39
1.30
468.58
1.52
0.64
15.23
8.01
312.22
3,211.26
0.49
21.25
102.60
1,046,094
Fundsoffu
nds(3
,017)
-1.66
3.97
-74.61
-3.01
-1.06
0.58
68.78
1.44
0.72
7.13
7.68
181.07
1,020.54
0.38
21.49
95.00
360,649
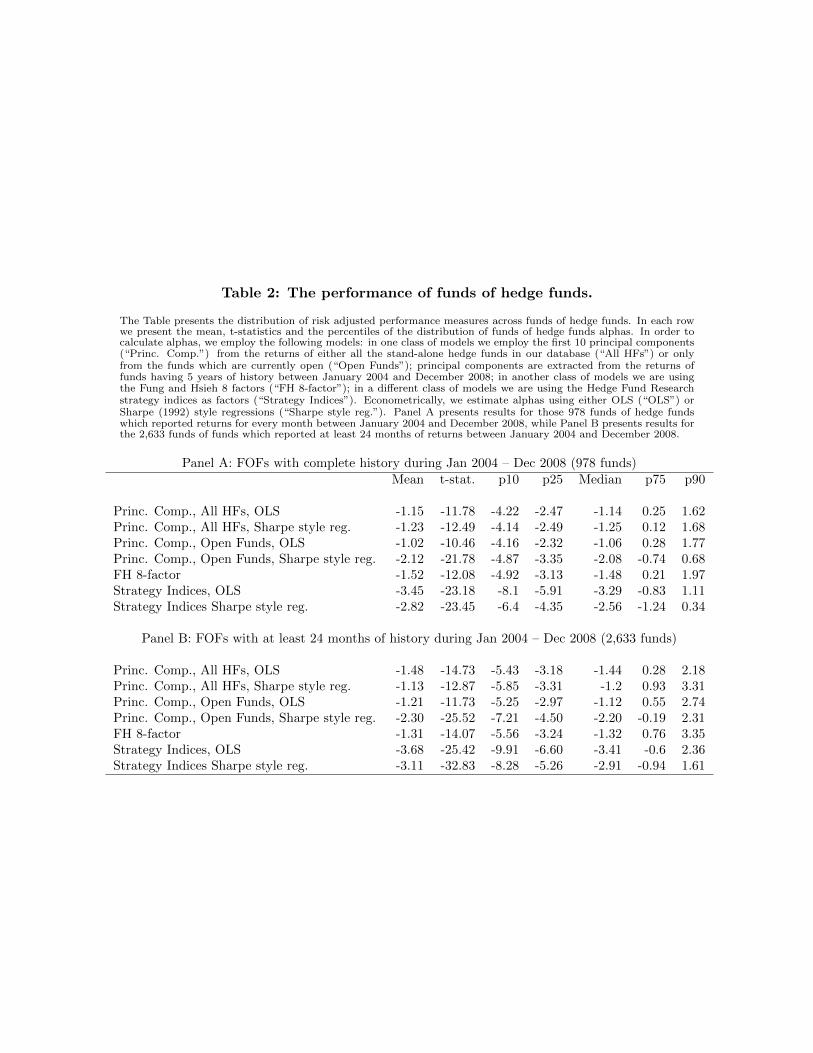
Table 2: The performance of funds of hedge funds.
The Table presents the distribution of risk adjusted performance measures across funds of hedge funds. In each rowwe present the mean, t-statistics and the percentiles of the distribution of funds of hedge funds alphas. In order tocalculate alphas, we employ the following models: in one class of models we employ the first 10 principal components(“Princ. Comp.”) from the returns of either all the stand-alone hedge funds in our database (“All HFs”) or onlyfrom the funds which are currently open (“Open Funds”); principal components are extracted from the returns offunds having 5 years of history between January 2004 and December 2008; in another class of models we are usingthe Fung and Hsieh 8 factors (“FH 8-factor”); in a different class of models we are using the Hedge Fund Researchstrategy indices as factors (“Strategy Indices”). Econometrically, we estimate alphas using either OLS (“OLS”) orSharpe (1992) style regressions (“Sharpe style reg.”). Panel A presents results for those 978 funds of hedge fundswhich reported returns for every month between January 2004 and December 2008, while Panel B presents results forthe 2,633 funds of funds which reported at least 24 months of returns between January 2004 and December 2008.
Panel A: FOFs with complete history during Jan 2004 – Dec 2008 (978 funds)Mean t-stat. p10 p25 Median p75 p90
Princ. Comp., All HFs, OLS -1.15 -11.78 -4.22 -2.47 -1.14 0.25 1.62Princ. Comp., All HFs, Sharpe style reg. -1.23 -12.49 -4.14 -2.49 -1.25 0.12 1.68Princ. Comp., Open Funds, OLS -1.02 -10.46 -4.16 -2.32 -1.06 0.28 1.77Princ. Comp., Open Funds, Sharpe style reg. -2.12 -21.78 -4.87 -3.35 -2.08 -0.74 0.68FH 8-factor -1.52 -12.08 -4.92 -3.13 -1.48 0.21 1.97Strategy Indices, OLS -3.45 -23.18 -8.1 -5.91 -3.29 -0.83 1.11Strategy Indices Sharpe style reg. -2.82 -23.45 -6.4 -4.35 -2.56 -1.24 0.34
Panel B: FOFs with at least 24 months of history during Jan 2004 – Dec 2008 (2,633 funds)
Princ. Comp., All HFs, OLS -1.48 -14.73 -5.43 -3.18 -1.44 0.28 2.18Princ. Comp., All HFs, Sharpe style reg. -1.13 -12.87 -5.85 -3.31 -1.2 0.93 3.31Princ. Comp., Open Funds, OLS -1.21 -11.73 -5.25 -2.97 -1.12 0.55 2.74Princ. Comp., Open Funds, Sharpe style reg. -2.30 -25.52 -7.21 -4.50 -2.20 -0.19 2.31FH 8-factor -1.31 -14.07 -5.56 -3.24 -1.32 0.76 3.35Strategy Indices, OLS -3.68 -25.42 -9.91 -6.60 -3.41 -0.6 2.36Strategy Indices Sharpe style reg. -3.11 -32.83 -8.28 -5.26 -2.91 -0.94 1.61

Table 3: Funds of funds and prime brokers.
The Table presents the number of prime brokers of hedge funds with at least a fund of funds investor, and the hedgefunds without fund of funds investors. The number of fund in each category are in brackets and categories with lessthan 10 observations are excluded.
Strategy type FOF-owned HFs Non-FOF-owned HFs Difference p-value
Managed Futures 1.24 1.05 0.19 0.00[102] [146]
Equity market-neutral 1.04 1.06 -0.02 0.53[57] [153]
Multistrategy 1.14 2.05 0.09 0.07[98] [201]
Fixed income arbitrage 1.00 1.05 -0.05 0.11[49] [79]
Dedicated short 1.00 1.00 0.00 1.00[6] [10]
Global Macro 1.13 1.09 0.04 0.51[62] [93]
Convertible arbitrage 1.14 1.21 -0.07 0.56[50] [58]
Event driven 1.15 1.10 0.05 0.36[91] [190]
Emerging markets 1.04 1.06 -0.02 0.63[76] [121]
Equity long-short 1.08 1.03 0.05 0.00[504] [909]

Table 4: Funds of funds and fund flows.
The Table presents quarterly flows into hedge funds with at least a fund of funds investor, and into hedge fundswithout fund of funds investors.
QuarterlyPerformance Average quarterly flow
Quartile FOF-owned HFs non-FOF-owned HFs Difference
Panel A: January 1996 to December 2000
1 3.99% 4.00% -0.01%2 4.61% 5.79% -1.18%3 6.04% 5.26% 0.78%4 6.17% 5.17% 1.00%5 6.45% 6.57% -0.13%6 8.72% 7.25% 1.47%7 5.41% 6.23% -0.81%8 6.40% 5.16% 1.23%9 9.50% 6.16% 3.33%
Panel B: January 2004 to December 2008
1 2.38% 2.31% 0.06%2 1.78% 1.50% 0.28%3 2.59% 2.19% 0.40%4 1.22% 1.78% -0.56%5 1.99% 1.73% 0.26%6 2.33% 2.32% 0.01%7 2.16% 3.06% -0.90%8 4.80% 3.81% 0.99%9 5.42% 4.32% 1.10%

Table 5: Funds of funds flows and the distribution of hedge fund alphas.
The Table presents regressions of moments of the cross-sectional distribution of stand-alone funds’ alphas on flowsinto FOF as well as into stand-alone hedge funds. Four moments are included: the alpha mean, standard deviation,skewness and kurtosis. To estimate each regression, we calculate 24 months rolling alphas, as well as the first fourmoments of their cross-sectional distribution, and concomitant total flows into both stand-alone hedge funds as well asfunds of funds. We then regress each alpha moment onto both FOF and stand-alone funds flow. Differences betweenthe coefficient of FOF flow and stand-alone funds’ flow is also reported. Data span the time interval from January1997 to December 2008.
Average α Std. of α Skewness of α Kurtosis of α
Intercept 0.0043 0.0112 0.6396 18.2520(t-stat) 11.5142 29.9502 7.2922 19.4404
Flow into HFs (βHF) 0.0556 0.1055 8.2782 -137.9136(t-stat) 2.6348 5.0282 1.6872 -2.6261
Flow into FOF (βFOF) -0.1272 -0.1033 -12.9834 -265.0520(t-stat) -5.1184 -4.1850 -2.2486 -4.2888
Adj. R2 19.21% 23.75% 4.31% 16.39%
βFOF − βHF -0.1828 -0.2087 -21.2616 -127.1384(t-stat) -5.6065 -6.4451 -2.8060 -1.5677

33
Table 6: FOF flows and the subsequent performance of stand-alone hedge fund, byage.
The Table present the coefficient b of FOF flow in the regression αt+1:t+12 = a + bFOFflowt + cHFflowt +dlog(FOFAUMt−1)+elog(HFAUMt−1)+errort+1, where α is the monthly alpha of portfolios of stand-alone hedgefunds of various ages. Data spans the time interval from January 1997 to December 2007.
Equally Weighted Value Weighted
All HF FOF-owned HF All HF FOF-owned HF
Less than 1 year -0.0310 -0.0385 -0.0258 -0.0392t-stat -2.5041 -2.1462 -0.9191 -2.3631
1-2 years -0.0307 -0.0382 -0.0313 -0.0389t-stat -2.4279 -2.0355 -2.4784 -2.2371
2-3 years -0.0297 -0.0500 -0.0294 -0.0502t-stat -1.8995 -2.6692 -1.9022 -2.7550
More than 3 years -0.0271 -0.0265 -0.0287 -0.0318t-stat -2.2758 -1.9493 -2.2771 -2.2404
Older minus Younger 0.0039 0.0120 -0.0028 0.0073t-stat 0.5515 0.9309 -0.1031 0.6009

Figure 1: Alternative hedge fund operating structures vs. the traditional invest-ment bank model.
Panel A. Traditional investment bank model
Panel B. Inside-only hedge fund model

35
Panel C. Straddling hedge fund model
Panel D. Straddling ’feeder’ fund of funds model

36
Panel E. Outside hedge fund model
Panel F. Outside ’feeder’ fund of funds model
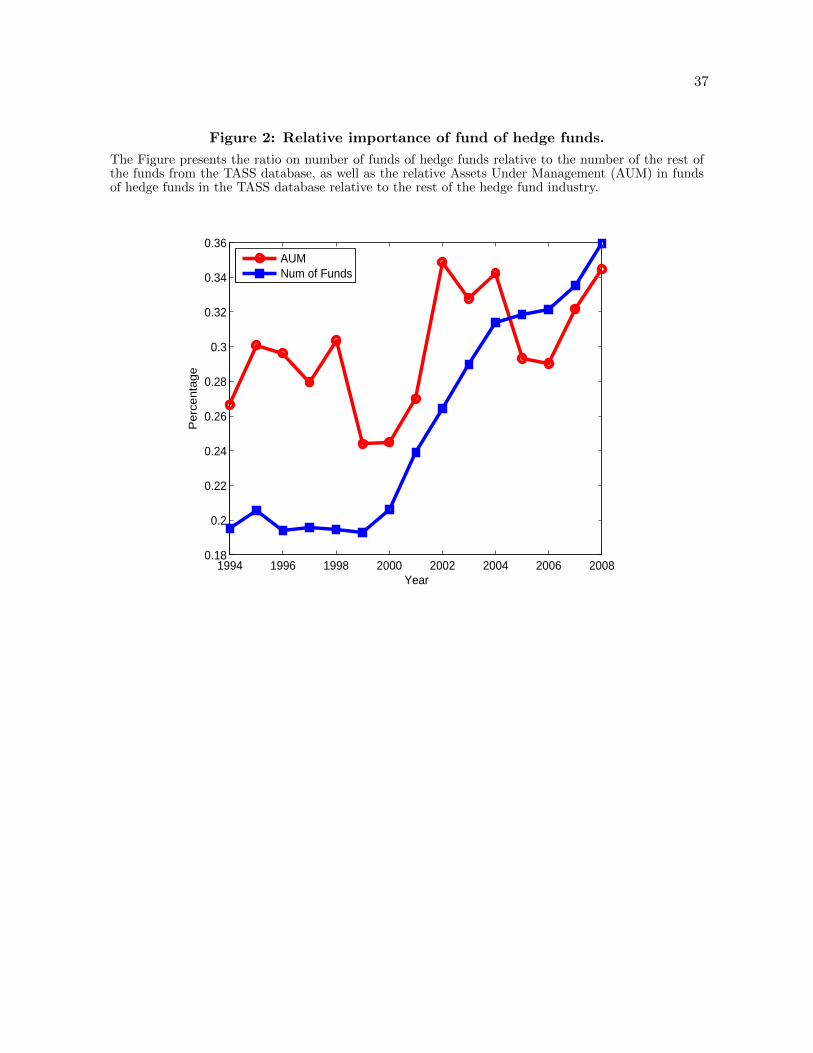
37
Figure 2: Relative importance of fund of hedge funds.
The Figure presents the ratio on number of funds of hedge funds relative to the number of the rest ofthe funds from the TASS database, as well as the relative Assets Under Management (AUM) in fundsof hedge funds in the TASS database relative to the rest of the hedge fund industry.
1994 1996 1998 2000 2002 2004 2006 20080.18
0.2
0.22
0.24
0.26
0.28
0.3
0.32
0.34
0.36
Year
Perc
enta
ge
AUMNum of Funds

Figure 3: Liquidity of funds of hedge funds and of the funds they invest in.
The Figure presents the asset-weighted liquidity of funds of hedge funds and of the funds owned by at leastone fund of hedge funds. Panel A presents the redemption notice periods, Panel B presents redemptionfrequencies and Panel C presents lockup periods.
1994 1996 1998 2000 2002 2004 2006 200820
25
30
35
40
45
AU
M w
eig
hte
d R
edem
ptio
n N
otic
e P
eriod (
days
)
Panel A: Redemption notice period
HFs owned by FOFsFOFs
1994 1996 1998 2000 2002 2004 2006 200840
45
50
55
60
65
70
75
80
85
AU
M w
eig
hte
d R
edem
ptio
n F
requency
(days
)
Panel B: Redemption frequency
HFs owned by FOFsFOFs
1994 1996 1998 2000 2002 2004 2006 20080
0.5
1
1.5
2
2.5
AU
M w
eig
hte
d L
ock
Up P
eriod (
month
s)
Panel C: Lockup period
HFs owned by FOFsFOFs