pdf.usaid.govpdf.usaid.gov/pdf_docs/PNRAA225.pdfI . AGENCY FOR INTERNATIONAL DEVEI.OPMENT . FOR AID...
45
I AGENCY FOR INTERNATIONAL DEVEI.OPMENT FOR AID USE ONLY WASHINGTON. D. C. 20523 BIBLIOGRAPHIC INPUT SHEET SA. PRIMARY '.SUBJECT Agriculture A2-0000 FCASSI- B. SECONDARY FICTIO ISoil fertility,fertilizersand plant nutrition 2. TITLE AND SUBTITLE Agronomic evaluation of fertilizersprinciples & practices 3. AUTHOFS) Terman,G.L.; Engelstado.p. S NUM B E R O F PA ES 4. DOCUMENT DATE ARC NUMBER I . -- a G 1971 44p. ARC: > 7. REFERENCE ORGANIZATION NAME AND ADDRESS TVA 8. SUPPLEMENTARY NOTES (Sponsoring Organization, Publishers, Availability) (In NFDC bul.Y-21) 9. ABSTRACT , - 10. CONTROL NUMBER 11. PRICE OF DOCUMENT PN-RAA- 225 12. DESCRIPTORS 13. PROJECT NUMBER Evaluation Field tests 14. CONTRACT NUMBER PASA RA (QA) 5-69 Res. 15. TYPE OF DOCUMENT AID 590-1 (4-74)
Transcript of pdf.usaid.govpdf.usaid.gov/pdf_docs/PNRAA225.pdfI . AGENCY FOR INTERNATIONAL DEVEI.OPMENT . FOR AID...

I AGENCY FOR INTERNATIONAL DEVEIOPMENT FOR AID USE ONLYWASHINGTON D C 20523BIBLIOGRAPHIC INPUT SHEET
SA PRIMARY
SUBJECT Agriculture A2-0000
FCASSI- B SECONDARY FICTIOISoil fertilityfertilizersand plant nutrition
2 TITLE AND SUBTITLE
Agronomic evaluation of fertilizersprinciples amp practices
3 AUTHOFS) TermanGL Engelstadop
S N U M B E R O F P A E S4 DOCUMENT DATE A R C N U M B E RI -- a G
1971 44p ARC gt
7 REFERENCE ORGANIZATION NAME AND ADDRESS
TVA
8 SUPPLEMENTARY NOTES (Sponsoring Organization Publishers Availability) (In NFDC bulY-21)
9 ABSTRACT
-
10 CONTROL NUMBER 11 PRICE OF DOCUMENT
PN-RAA- 225
12 DESCRIPTORS 13 PROJECT NUMBER
EvaluationField tests 14 CONTRACT NUMBERPASA RA (QA) 5-69 Res
15 TYPE OF DOCUMENT
AID 590-1 (4-74)
C00)LW
AGRONOMIC EVALUATION
OF FERTILIZERS I
ashy
TABLE OF CONTENTS INTRODUCTION FERTILIZER CHARACTERISTICS IMPORTANT INEyALUATION -
2 3
Nitrogen and Potassium 5Y Phosphorus 6
Granule Size-Water Solubility Effects 66Placement 7Secondary and Micronutrients 8
NEED FOR FIELD EVALUATION OF FERTILIZERS 9Demonstrations vs Replicated Experiments 10
BASIC PRINCIPLES OF FERTILIZER EVALUATION1 Comparative Value of Each Plant Nutrient in Fertilizers 1
Standard Nutrient Sources 12
11 Multiple Rates of Application 1Adequate Yield Response 12Low Experimental Error 12Reduction of Other Growth-Limiting Factors 42 12
13Product Evaluation
14MEASUREMENTS USED FOR EVALUATING FERTiLIZERS Crop Yields 14The Nature of Yield Response to Applied Nutrients 14
Effects of Yield Variability 17Magnitude of Response to the Nutrient Under Test -18
Nutrient Uptake by the Crop 20Uptake of Labeled Nutrients 22
MATHEMATICAL MODELS USED TO EVALUATE NUTRIENT SOURCES 23 Reiative Yields and Yield Increase bull 23 Linear Regression Models 25 Cunilinear Regression Models 26
Nutrient Equivalents 26Mitscherlich Models 26
Other Models 27 28ECONOMIC INTEPRETATIONS
Economic Effectiveness of Nutrient Sources 2828Economically Optimum Rate of Nutrient 29
SPECIAL PROBLEMS IN NUTRIENT SOURCE EVALUATION 31 Seedling Toxicity 31Leaching and Volatilization Losses of N 31 Flooded Ric Culture - 32
Nitrogen 32 Phos)horus
REFERENCES 34 APPENDIX
U
tAGRONOMIC =EVALUATION 1OF FERTILIZERS
G L Terman and 0 PEngelstad
rn INTRODUCTION
Z The present emphasis on world food production requires high Sefficiency of all agronomic inputs Because of the great
_ importance of fertilizers as one of these inputs it is essential that sound principles be used in fertilizer evaluation
TVA chemists and chemical engineers have carried out research and development on new fertilizers and fertilizer production technology for 35 years Much of the resulting information has been published in technical journals fertilizer trade magazines and books During this same period TVA and other agronomists and soil chemists have carried out numerous studies on the principles and methods for evaluating the nutrients in these fertilizers Much of this continuing research has also been published These results together with those of other investigators are summarized here
The chief objective of this manual is to describe the principles underlying sound evaluation of fertilizers especially in field experiments In general the same principles apply to fertilizer evaluation and soil fertility research under field greenhouse growth chamber or laboratory conditions Techshyniques and principles for evaluating fertilizers in greenhouse pot experiments have been described in another manual published by TVA (1966) Principles for various types of biological evaluation of nutrients in fertilizers have also been summarized (1962) Designs and techniques for carrying out various types of fertilizer and other experiments are covered more adequately in several textbooks on experimental design (see References)
Agronomists Soils and Fertilizer Research Brarch Div of Agncultural Development
2
FERTILIZER CHARACTERISTICS IMPORTANT IN EVALUATION
Chemical compounds present in the more common commercial fertilizers are listed in table 1 The various compounds undergo many tyros of chemical reactions with soils and soil solutions
The nature of products formed from these reactions and their availability to plants depend on both the kind of fertilizer and
Table 1Compounds Present in NP K NP NK or PK Commercial and Experimental Fertilizers
Water Solubility
Representative of N P Major Grades or K Compounds
Fertilizer Material N-P2Os-K Oa () Present N Sources N
Anhydrous ammonia 82-0-0 100 NH3 Ammonium chloride 26-0-0 100 NH 4 CI AmmoniumPrtratc 335-00 100 NH4 NO3 Ammonium sulfate 205-0-0 100 (NH4 )2SO4 Ammonium nitrate-lime 2050-0 100 NH4 NO3 CaCO 3 Ca(N0 3) 2 Calcium cyanamide 22-0-0 100 CaCN2 Calcium nitrate 155-0-0 100 Ca(N0 3 )2 Sodium nitrate 16-0-0 100 NaNO3 Urea 45-0-0 100 CO(NH 2 )2
S-coated urea 35-0-0 Variable CO(NH 2 )2 elemental S
PSources P Phosphoric acid
Wet-process 0-55-0 100 H3PO4 Furnace grade 0-55-0 100 H3PO4 Super acid 0-79-0 100 H3 PO4 polyphosphoric
acids Superphosphate
Ordinary (H2 SO4 ) 0-20-0 85 Ca(H 2PO4 )2H20 b CaSO4 -2H20
Triple (WP H3 PO4) b 0-45-0 87 Ca(H 2PO4 )2 H20 Conc (Fum H3P0 4 ) 0-480 90 Ca(H 2PO4) 2H20 High-anal (Super acid) 0-54-0 90 Ca(H 2 PO4 )2
Dicalcium phosphate HCI process 0-40-0 4 CalIPO4 2H20 CaHPO4 Electric furnace H3 PO4 0-48-0 3 CaHPO4 CaHPO42H 2 0
Calcium metaphosphate 0-62-0 5 Vitreous Ca polyphosphate Ca 2P20 7
Fused tricalcium phosphate 0-28-0 lt2 Alpha and Beta Ca3(PO4 )2 Rhenania phosphate 0-33-0 lt 2 Ca silico-phosphates
3
Table t(continued) Water
Solubility Representative of N P Major
Grades or K Compounds Fertilizer Material N-P2 05 -K20a (M) Present
Serpentine phoiphate glass 0-22-0 lt2 Ca Mg silico-phosphates Basic slag 0-9-0 lt2 Ca silico-carnotite Colloidal clay phosphate 0-22-0 lt 1 Apatite At phosphates Florida phosphate ore 0-32-0 lt 1 Carbonato apatite K NK andPKSources K
Muriate of potash 0-0-60 100 KCI Sulfate of potash 00-48 100 K2SO4 K Mg sulfate (Sulpomag) 0-0-23 100 K2SO4 2MgSO 4 Nitrate of potash 13-0-44 100 KNO3 Potassium polyphosphate 0-59-39 5 K polyphosphates
NP Sources P Ammoniated ordinary 4-14-0 35 NH 4 H2 PO4 CaHP0 4
superphosphate reprecipitated apatite
CaSO 4 2H2 0 C
Ammoniated concen- 5-47-0 50) NH 4H2 PO4 CaHPO4 trated superphoqphate 9-48-0 50) (NH4 )2 IP0 4 reprecipitated
apatitec Ammonium phosphate 30-10-0 100 NH4 H2PO4 NH 4NO 3
nitrate (NH 4 )2 HPO4 25-25-0 100 (NH 4 )2HP0 4 NH4 NO3 28-14-0 100 NH 4 H2 PO4
Ammonium phosphate 11-48-0 gt90 sulfate 13-39-0 gt90 NH 4 H2PO4 (NH 4 ) 2SO4
16-20-0 gt90 16-48-0 90 NH 4 H2 PO4 (NH 4 )2 HP0 4
(NH 4 )2 SO4 Diammonium phosphate 21-53-0 100 (NH 4 )2 HP0 4
18-46-0 gt 95 (NH 4 )2 HP04 Ammonium 15-60-0 100 NH 4H2PO4 (NH 4 ) 3HP 20 7
polyphosphate longer chain polyphosphates
Urea ammonium 34-17-0 100)
phosphate 29-29-0 100) CO(NH 2 )2 (NH4) 2 HPO4 25-35-0 100)
Urea ammonium 36-18-0 100) polyphosphate 30-30-0 100) CO(NH 2)2 (NH 4 )3 HP2 07
22-44-0 100) NH 4 H2PO4 Nitric phosphate 20-20-0 40 CaHPO4 NH4H2 PO4
Ca(NO 3 )2reprecipitated apatited
aConvcrt N-P205 -K 20 to N-P K by multiplying by 10-044-083 bfriple (TSP) and concentrated supcrphosphates (CSP) are used interchangeably CAndo J and J R Lehr Agr FoodChein 15741-50 1967 dAndo Jand JR LehrJ Agr Food Chem 16391-98 1968
4
soil properties Fertilizer placement time of application level of soil productivity and many other factors affect crop response to nutrients in fertilizers
Nitrogen and Potassium
Most N fertilizers are completely water-soluble Ammonium N (NH 4
+ ) is initially adsorbed by soil organic natter and clay particles possessing cation exchange capacity Under soil conditions suitable for good plant growth however NH 4 + is rapidly convertud by nitrifying bacteria to the nitrate form (NO3)
As nitrate is not adsorbed strongly by soil particles it moves freely in soil water Consequently oven when N is applied in the ammonium form in bands it soon becomes free to move throughout the root zone because of nitrification
High mobility is also important in relation to time of N application For maximum utilization of N fertilizer plants must be in a vigorous growth stage soon after it is applied Otherwise the nitrate may move below the root zone especially in humid areas or areas under irrigation This loss togeth_ with competition from microorganisms and weeds often reduces crop recovery of N fertilizer as the interval increases between time of application and crop use
Granule size and band placement of water-soluble N sources have little effect on crop use of N Most soluble N sources are essentially equal in effectiveness for crops if incorporated with well-drained soils and if applied separately from the seed or plants so as to avoid seedling toxicity problems
Special problems concerned with volatilization losses of N from surface-applied fertilizers application of anhydrous ammonia and slow-release N sources will be discussed in a later section (Special Problems Affecting Nutrient Source Evaluation)
All of the common potash fertilizers such as chloride (muriate KCl) or sulfate (K 2S0 4 ) also are water-soluble Like ammonium N most of the K is adsorbed near the application point by cation exchange minerals and organic matter It thus becomes exchangeable K
However unlike ammonium N which nitrifies to the mobile nitrate form K continues to be held by the soil and is relatively immobile It like other adsorbed nutrient ions enters the root
5
after passing to the soil solution following an exchange with another ion such as hydrogen (H+) Leaching of applied K usually is not considered a problem except in very sandy or gravelly soils
The exchangeable fraction of soil K is readily available to crops Another fraction of soil K is adsorbed strongly on soil particles and is slowly available to crops Only the K fraction which becomes a component of the crystal lattice or which is trapped between layers of soil minerals may be considered fixed or unavailable to crops
Only in K-deficient high K-fixing soils is crop recovery of applied K appreciably poorer from broadcast than from band applications Likewise only with such soils is there any agronomic advantage of granular over fine-textured forms
The value of common K sources tends to be similar except for certain crops whose quality is adversely affected by too much chloride With tobacco potatoes and sugar beets the sulfate source nitrate (KNO 3 ) or metaphosphate (KPO 3 ) may be preferred
Phosphorus
In contrast to N and K P compounds in fertilizers vary widely in solubility Phosphate rock is essentially insoluble in water Various sources vary widely in dissolution in the ammonium citrate (AOAC method) solution used by chemists to determine available phosphate in fertilizers At the other extreme of the water-solubility scale are ammonium phosshyphates which are entirely water-soluble
Granule Size-Water Solubility Effects-Research has shown that the effectiveness of phosphate fertilizers of varying solubility is closely related to size of ferilizer granules In acid soils percent recovery by plants of water-soluble phosphates usually inreases with increase in granule size (increase in amount of P per granule) up to about 5 mm in diameter
The advantage of water-soluble phosphates for early growth response seems to result from rather high concentrations of P near young seedlings For example P concentrations as high as 100000 ppm in soil may be present in a band of soluble phosshyphate In contrast soils normally have less than 2 ppm in solution
In the case of water-soluble phosphates effect of granule size depends on differences in reaction products and on the volume
6
of soil into which the fertilizer P moves Phosphate granules react with only a small volume of adjacent soil particles A normal field application of granular water-soluble fertilizer applied broadcast affects less than 2 of the total soil volume Obviously the amount of soil affected is much less when either fine or granular fertilizer is applied in bands In fact the least amount of soil is affected when granular water-insoluble phosphates are banded
Since dissolution of a granule depends upon transport of water to it a large granule will take longer to dissolve than a small one Consequently soil immediately adjacent to a large granule will have a concentrated P solution for a longer period than soil next to a small granule The final result of these conditions is that more fertilizer P will react with a unit quantity of soil adjacent to large granules than with the same quantity of soil adjacent to a larger number of small granules or solution Hence reaction products adjacent to large granules may be higher in P and of more value to plants than those adjacent to small granules
Crop response to water-insoluble phosphates such as dicalshycium phosphate generally increases as the granule size is reduced The granule surface area per unit of applied P increases sharply as the granule size decreases Figure 1 summarizes the relationships between granule size and water solubility of P fertilizers in acid to neutral soils
Banding of water-insoluble phosphates commonly results in poorer crop response than does mixing into the soil Fertilizer P broadcast and mixed into the soil comes in contact with a much larger volume of soil than when it is banded and therefore tends to dissolve (and become fixed) more rapidly Growth response of young plants to water-insoluble phosphates is usually low because such sources do not provide high enough concentrashytions of soluble P for immediate crop uptake
Most of the differences among phosphate fertilizers as sources of P for crop growth can be explained by granide size and solubility relationships Content of iron and aluminum oxides pH and texture are important soil properties
Placement-As evidenced by widespread use of bandshyapplied starter fertilizers many farmers want rapid early crop growth Whether this early growth response will affect final crop yield depends on additional factors of soil climate crop and length of season Rapid early growth helps to reduce
7
4
IWATEP 801 ULE~
7lj 7lt
- ~ VWATERINSOLUBLE
0 I 2 3 4 5 6 7 INCREASE IN FINENESS
Figure 1Relative Response in Greenhouse Pots to Water-Soluble and Water-Insoluble Phosphates
Granules From -9+14 to -50 Mesh Were Compared (fineness = reciprocal of radii of granules mm)
competition from weeds diseases and insects and provides a larger leaf surface area as a photosynthetic base for subsequent growth Where most of the fertilizer is bulk-spread and plowed under good renults also have been obtained with small amounts of soluble fertilizers placed with the seed Water-soluble P is essential for this early growth response especially in cold soils in early spring Fertilizers having less than about 40 of the P in water-soluble form are not very satisfactory for this use Similar agronomic response may be expected from similarly placed fluid and solid fertilizers of equal solubility
Presence of N or K salts in granules containing watershyinsoluble phosphate tends to increase the surface area per unit of fertilizer P and thus increases P availability Ammonium salts in soluble phosphate granules or bands also tend to increase P uptake by plants this phenomenon has been attributed to stimulation of root growth increased metabolic activity aind lower pH in the rhizosphere
Secondary- and Micronutrients
Inconsistent results from field experiments comparing sources and carriers of secondary- and micronutrients are of
frequent occurrence Lack of adequate and consistent response to the nutrient under test is usually the primary problem This is often compounded by the problem of measuring rather small differences in yield at high yield levels where micronutrient deficiencies are most likely to occur
Multiple variables in the fertilizers under test and lack of experimental precision have no doubt been contributing factors The results obtained would indicate that much of the informashytion on source comparisons and principles affecting the use of nutrients by crops will continue to be obtained throughlaboratory and greenhouse research
Oxidized forms of B and S and cations such as Ca Mg and Mn are similar in mobility to K and less mobile -than nitrateN A third class such as Cu Fe and Zn have low mobility and resemble P in their availability relationships
NEED FOR FIELD EVALUATION OF FERTILIZERS
In the United States TVA the U S Department of Agriculture state universities and fertilizer companies have carried out a tremendous amount of research on fertilizers The same is true of various groups in a number of other countries As a result much information is available on the forms of nutrients in fertilizers and their agronomic value
Results of solubility tests petrographic observations and greenhouse pot growth tests should be fully utilized before deciding whether the more costly and time-consuming field experiments are necessary for evaluating new fertilizers
Many new fertilizers are recombinations of compounds that have already been studied extensively As a result of this accumulated information on fertilizer and soil properties the agronomic behavior or such new fertilizers can be predicted rather accurately in most cases This can be inferred from data on compounds present solubility granule size characteristics and response in pot experiments Extensive field evaluation of such fertilizers is largely unnecessary except as a means of demonstrating to fertilizer industry representatives extension specialists and farmers that the fertilizer is satisfactory if used properly under practical farm conditions (Tropical soil areas may be an exception to this generalization)
For example urea ammonium phosphate (UAP) grades
consist largely of various mixtures of urea and diammonium
phosphate (DAP) Laboratory and greenhouse results indicate
that UAP exhibits the properties of both urea and DAP as
might be expected Results from field experiments have
It thus appears that field evaluation on mostconfirmed this soils of nutrients in products having well-known properties may
be of value only in relation to method and timing of application
for certain specific crops and cropping situations If fertilizers are different formulations of well-known comshy
pounds a critical examination should be made of each new field evaluation isfertilizer to determine if any agronomic
actually needed However when new compounds or new factors
are introduced specific problems will continue to occur which
will require research under laboratory greenhouse and field
conditions Slow-release N fertilizers are an example of this need
Demonstrations vs Replicated Experiments
Perhaps the basic requirement for successful fertilizer or soil a specificfertility demonstrations or experiments is to have
premise in mind in order to rule out haphazardhypothesis or atreatment comparisons A set of comparisons may be called
or a trial but thedemorLstration an experiment a test the results will be meaningful inimporta it point is whether
terms of the hypothesis or the problem to be solved If conshytreatment comparisons experimental design and growth
not used from which valid results can be obtainedditions are the initial hypothesis is not important or even relevant
For example the hypothesis may be adopted that water
solubility of P fertilizer is essential for a certain soil-cropshy
climate situation Experimental fertilizers covering a wide range
of solubility would then be selected to test the hypothesis Soils
would be selected on which adequate yield response to applied
P can be expected and other variables would be eliminated insofar as possible
Basic principles of the experimental method include (a) the
need for replication of each treatment to provide a valid
estimate of experimental error from which the significance of
treatment differences can be determined and (b) location of
treatments at random within an experimental area to reduce bias
10
A third requirement in fertilizer trials over a range of soils andclimate is that incomplete treatment comparisons at each site be avoided That is all treatments should be compared at each siteOtherwise because of interactions with soil climate and othergrowth factors recommendations based on average results maybe seriously in error
An experimental approach that is frequently adopted is thatof conducting rather simple trials on numerous locations andpooling the results Invariably statistical analyses of such resultswill show significant site-treatment interactions which cannot be explained because of the multitude of variables that affectyield response to fertilizers On the other hand this is the situation that confronts farmers
Additional requirements for valid results in fertilizer evaluashytion experiments are described in the following sections
BASIC PRINCIPLES OF FERTILIZER EVALUATION
Comparative Value of Each Plant Nutrient in Fertilizers
Since fertilizers are usually applied to provide specificnutrients for crops the primary concern in fertilizer evaluationshould be to determine the comparative effectiveness ofindividual nutrients in each fertilizer Most of the discussion inthis manual will be concerned with this aspect of fertilizer evaluation Black and Scott (1956) described certain aspects ofthe application of biological assay principles to evaluation ofnutrients in fertilizers The following requirements usually need to be met for such evaluations to be meaningful
Standard Nutrient Sources-A commonly used fertilizer must serve as the standard Concentrated superphosphate (CSP)has been commonly used as the standard for phosphorus (P)source comparisons KC1 or K2 S04 for potassium (K) sourcesNH 4 NO3 for nitrogen (N) sources etc
Standard commercial fertilizers may have appreciableamounts of contaminants which must be considered in expershyments with secondary- and micronutrients For example bothordinary (16-20) superphosphate and (NH 4 )2SQ 4 containlarge amounts of sulfur (S) most commercial superphosphatescontain S and zinc (Zn) in appreciable amounts and possibly
11
other nutrients in trace amounts Particular attention must be given to impurities in fertilizers used in micronutrient experishyments Otherwise a micronutrient deficiency might not be detected because of the micronutrient being adequately supshyplied in other fertilers being applied
Multiple Rates of Application-Sufficient amounts or rates of the test nutrient should be applied to define a response curve for each ource being compared As has been pointed out in previous papers (1960a 1961 1962 1967c) evaluations of nutrient source placement or time of application based on a single rate of application are usually not meaningful chiefly because it usually is not possible to determine where the comparisons would fall on a complete response curve
Adequate Yield Response-Sufficient yield response to the nutrient under test should be obtained to make source comparisons meaningful (see section on Crop Yields)
Low Experimental Erroi-Experimental error should be kept to a minimum by use of a suitable experimental design and good experimental techniques
Techniques for conducting experiments with low experishymental errors will not be discussed here since they are adequately covered in the various books on experimental design and in many published articles
Reduction of Other Growth-Liniting Factors--Other growth-limiting factors should be reduced to a minimum or eliminated Balancing of nutrients other than the one under test and methods for conducting soil-plant-fertilizer experishyments under greenhouse conditions are described in another manual (1966)
A common type of ex-erimental design used to determine crop needs for two or three nutrients is the 3 x 3 or 3 x 3 x 3 factorial in which one nutrient is compared at each level of the other(s) This design is usually unsatisfactory for evaluation of the effectiveness of a nutrient from different fertilizer sources since most of the evaluation of one nutrient is at limiting levels of other nutrients A much better design is that of comparing each nutrient source separately at several application rates with all other nutrients and growth factors at as near optimum levels as is possible to determine This type of design is also satisfactory as a basis for economic analyses of the results In contrast the zero and one or two nonzero rate factorial designs usually have very limited use in economic analyses since the complete respcnse range is not adequately covered
12
In summary yield variability and response to the nutrientbeing evaluated are probably the two most important aspects offertilizer evaluation These will be discussed more fully in the next section (Crop Yields) Most of the results were obtainedwith P rates and sources but the principles apply equally to other nutrients
Product Evaluation
A simpler type of fertilizer source comparison may be termedproduct evaluation This is commonly the comparison of cropresponse to two or mork fertilizer products possibly withoutregard to nutrient content Bag-for-bag comparisons are anexample Only visual observations may be made or yields maybe measured Disadvantages of this type of evaluation include(a) poorly defined fertilizers are usually compared which contain different amounts and forms of N P K and other nutrients (b) the check treatment is usually no appliedfertilizer since balancing of nutrients among products may notbe possible (c) treatments in such trials and demonstrations may not be replicated and the plot areas may be too large for accurate yield comparisons
Product evaluation may be useful to introduce a newfertilizer product or brand of fertilizer to farmers and extension workers However the possibility of obtaining useful informashytion from such trials is quite limited (see also the section onDemonstrations vs Replicated Experiments) This is particushylarly true if the trials are poorly conducted and if thecomparisons are on a large strip or field basis As a resultproduct evaluation per se has little or no place in a research program even if replicated small-plot trials are conducted Poorly conducted trials can and frequently do lead to erroneous conclusions
More precise and carefully conducted experiments are sometimes carried out to compare multinutrient fertilizers butwithout equalizing nutrients other than the one under test Forexample two NPK fertilizer may be compared at several rates of application However it is usually not possible to determinewhether a yield response was due to N P K or other nutrient andthe results may have little value for modern agriculture To thewriters knowledge no satisfactory statistical techniques havebeen developed to properly interpret multinutrient responses
13
Other more general types of evaluation such as physical condition and drillability as related to granulation costs end acceptance by farmers are also important in overall fertilizer use Fertilizer cost in relation to expected returns is a primary basis for fertilizer use Here low-cost fcrmulation to reduce manufacturing costs and high analysis to reduce transportation and application costs become the primary considerations Some possible agronomic disadvantages may be tolerated to reduce overall crop production costs Also liquid or suspension fertilizers might be preferred to reduce labor needs
MEASUREMENTS USED FOR EVALUATING FERTILIZERS
Crop Yields
Yields of the crop in terms of forage grain fiber or sugar are commonly used for evaluation of fertilizers in field experishyments If it is not possible to make yield measurements then it is desirable that the yield attribute chosen be well correlated with the crop yield
Some investigators still fail to recognize that in order for yield comparisons to be meaningful among nutrient sources it is essential that an appreciable yield response to the applied nutrient be obtained Thus fertilizer treatment compamsons should always include a check treatment or no applied nutrient unless the yield level without applied nutrient is known with certainty This is seldom known for agricultural soils because of variation in climatic and other yield-limiting factors
The Nature of Yield Response to Applied Nutrients-Figure 2 shows a typical early growth response curve by maize in greenhouse pots to soluble and less-soluble N sources on a soil low in available N Response to soluble AN is definitely curvilinear with increasing amounts of applied N while response to granular oxamide is essentially linear Response to the latter would undoubtedly become curvilinear at higher rates of applied N
Figure 3 shows early growth response by maize to CSP and a less-soluble calcium ammonium pyrophosphate (Pyro-P) source on a soil extremely low in available P Response to CSP is
14
essentially linear over the range of 60-240 mg of applied P but is curvilinear over the 0- to 60-mg range More typical responses to CSP are shown in figures 4 and 7 Response to the Pyro-P source is linear over the entire 0- to 240-mg range
It is obvious that limiting yields of maize are not reached with the range of rates compared These response curves are characteristic of such crops as maize forage harvested after a
4 YIELD O0- N UPTAKE
I- - shy3 _450shy
20 30C
10 AN 15
SO0XAMIDE AN 0 XOXAMIDE
0100200 400 01 I II00200 400 800 100 200 4C0 600
N APPLIED OPM N APPLIED MOPOT
Figure 2Yields of Dry Maize Forage and Uptake of N From -14+20 Mesh Ammonium Nitrate (AN) and Oxamide
S YIELD PUPTAKE
0 3 -- 0 PYRO-P 0 PYRO-P
0 60 120 240 0 240 P APLID MVO 60 120 240 P APPLIEDMOPOTP APPLIED MGPOT
Figure 3 Yields of Dry Maize Forage and Uptake of PFrom -6+14 Mesh Concentrated Superphosphate (CSP) and
Ca(NH4)2P207 H20 (Pyro-P)
15
few weeks of growth The limiting yields would of course be much higher if growth were allowed to continue
In figure 4 yields of oat forage harvested at the early heading stage of growth on a soil very low in available P rise rapidly with the lower rates of P applied as monocalcium phosphate (MCP) and then level off at 180-360 mg of P Yields with the less-soluble dicalcium phosphate (DCP) rise less rapidly at lower rates of P but approach the same limiting yield as for MCP at the higher rates This figure illustrates the need for basing the evaluation of the two sources on results obtained on the near-linear steeply ascending part of the response curves The definite limiting yield of oats approaching maturity is in contrast to the indefinite limiting yields of maize at early growth stages The definite limiting yield of oats depends on growth factors other than quality of the test nutrient The limiting yield may be increased by better management practices involved in supplying the growth-limiting factorq involved However with very high nutrient applications yields may actually decrease because of toxicity lodging or other nutrient imbalance effects
Figure 5 shows results from a ladinio clover experiment in which the limiting yield with Florida fine phosphate rock a P source largely insoluble in water but 15-20 soluble in ammonium citrate solutions is considerably lower than that obtained with CSP Apparently the phosphate rock as the sole
YIELDO UPTAKE
~I5 ~1i45 IIL
d 0CPCP
0cDCP - I I I I I I _-J
4 90 1I0 360 45 90 IGO 360 P APPLIED M01POT P APPLIED iPOT
Figure 4Yields of Dry Oat Forage and Uptake of PFrom Fine Monocalcium Phosphate (MCP) and Dicalcium Phosphate (DCP)
on Heavily Limed Hartsells Fine Sandy Loam
16
Figure5Mean Yields of Dry Ladino Clover Forage 20 with Increasing Rates of P
Applied as Superphosphateand Phosphate Rock on 15
SUPERPHOSHATZd
Soils in aGreenhouse Pot 3 Experiment (Ensminger
et al 1967) 0
IPHOSPHATKEROCK
0 9 18 bull 36 72 P APPLIED PPM
source of P does not supply enough P to support high yieldlevels of this crop Various sources of phosphate rockshowever havb been found to differ quite widely in citratesolubility and availability of the P for crops
Effects of Yield Variability-Acommonly used formula forcalculating the number of replicates necessary to measure agiven difference among fertilizers is
N = 8 CVD in percent [1]In this formular (Patterson 1939) N = number of replicatesCV (coefficient of variability) = standard errormean x 100and D = yield difference among fertilizers which isoneattempting to measure From this formula it is necessary with 4replicates to have a CV of 5 or less to measure a difference of10 With a CV of 10 8 replicates would be required etc
Results from analyses of variance of 433 field tests conshyducted in the southeastern United States on P-deficient soils tocompare P sources and rates were summarized (1957a) Only2 of the tests had a CV of 5 or less In these tests withvarious crops 17-32 of the tests had CV in the range of5-10 Thus in only a rather small proportion of the tests inwhich the treatments were replicated 3-6 times was it possibleto measure small differences among fertilizers However there is some question whether additional replication to measuresmaller differences would have been worthwhile
17
Standard errors in such experiments may increase with yield level or may not be correlated with yield level CV however usually decreased (figure 6) with yield level (1961) to a minimum of 5 in the case of experiments with maize at yield levels of about 75 bushelsacre or higher (4620 kg of grainha) CV also decreases with increase in yields of other crops
Magnitude of Response to the Nutrient Under Test-Response to the nutrient under test is equally important or sometimes more important than is variability in the experishymental results
The Mitscherlich response function was used to study responses in 174 tests in the southeastern United States involving rates of applied P (1960a) In a typical expeilment with wheat forage the following yields as percentages of the limiting yield were obtained No P(Yo)-30 10 kg P-78 20 kg P-92 30 kg P-98 and 40 kg P-100 or A As illustrated in figure 7 the difference between the yield (Y) of the standard at the rate (R) used for other sources (assuming only one rate-10 kg) and A determines whether it is possible to distinguish a source which is better than the standard Similarly the difference between the yield (Y) of the standard and the
25
20
UIO I -i t
20 30 40W 6070 8090 100110 120 130 MEAN YIELD- OU PER ACRE
Figure 6 Relationship Setweer Yield of Maize Grain and CV in S 42 Field Experiments in Iowa 59 in North Carolina
and 57 inTennessee
18
Figure 7 Responses of Wheat Forage to Rates of Applied P in aMississippi Field Experiment
A
v2- - - - - - - -
A-100
(1960) Yl ro I I 3000
SI ] I I2b 1 I I II
30 I I
Ro Ra IRI R4
0 I0 to 30 40 P APPLIED KgHo
yield without P (Yo) determines whether it is possible to distinguish a source which is poorer than the standard but better than no P These differences are evaluated in comparison with the standard error least significant difference (LSD) or other statistic as determined by analyses of variance
Average response curves were determined for 31 field tests with cotton 41 with corn 35 with wheat grain and 23 with annual forage conducted in the southeastern United States (1960a) Most (80 or more) of the P deficiencies were corrected by the first 10 kg of P Wheat forage was much more responsive to applied P than were the other crops It was possible in only a few of the experiments to distinguish a source which might be better than CSP and in some it was not possible because of low response to distinguish one which might be poorer than CSP
A similar study was made of 124 P rate and source experiments conducted in northern and western states (1961)Results from a majority of the experiments were not meaningshyful because of low response to applied P Most response was obtained with vegetable crops
Other than for the purpose of determining the magnitude of the experimental error and relating it to yield differences among treatments the writers have found analyses of variance of limited use in fertilizer evaluation experiments Regressionmethods based on results from multirate experiments are much more useful
19
The suggestion is frequently made that nutrient source studies should be made on the same plots over a period of several years Phosphorus sources however react with the soil and the reaction products become more similar in availability with time Little or no difference in response among sources can usually be measured after one or two crops
Much direct and circumstantial evidence indicates that considerable amounts of nutrients must be taken up from both the soil and currently applied fertilizers for maximum yields Under such high yield conditions phosphate applications are largely to maintain high P levels in the soil Any phosphate fertilizer which reacts with the soil seems to be satisfactory for this purpose
Nutrient Uptake by the Crop
Nutrient uptake is usually linear over wider ranges of application rates than is crop yield In figure 2 tbe uptake of N by maize is linear with 0-800 mg of applied N Tise results are typical also of uptake of other nutrients such as K and S Uptake of less mobile nutrients such as P may be linear at low application rates but frequently is curvilinear as shown in figures 3 and 4 A linear model is thus appropriate for interpreting the N uptake results in figure 2 but a curvilinear model should be used for the P uptake results in figures 3 and 4
Essentially the same differences in relative effectiveness between the soluble and less-soluble N and P sources in figures 2 3 and 4 would result from use of either yield or nutrient uptake if (a) the proper model is selected and (b) the efficiency of the nutrient absorbed by the crop for producing dry matter is the same for both sources (within experimental error) This may be determined by plotting dry matter yields against the corresponding nutrient uptake values If the results fall on a single smooth curve as shown in figure 8 it may be concluded that the nutrient efficiency cf the two sources is the same If the efficiencies of the two sources are different (figure 9) because of different time of absorption or other factor then interpretations based on dry matter yield and nutrient uptake tend to be different
In cropping situations where there is insufficient yield response to the applied nutrient to use this measurement for evaluation there may be considerable increase in nutrient
20
Figure 8 Plot of Dry Matter 40
Yield vs Uptake of N by Maize Showing the Same
Internal Efficiencies of the N inAN (Ammonium Nitrate)
and in Oxamide
eAN
0 100 200 300 400 S00 600 CROP UPTAKEOF N MOPOT
Figure 9 Yields of Dry 5
Maize Forage vs Uptake f P 40oas Affected byPlacement of CSP ND
0IMIXED
020-7
LaI I
I0 20 30 40 so
CROP UPTAKE OF It MGPOT
uptake with amount applied In these and other situations it may be desirable to use nutrient uptake as the basis for evaluation since the objective may be to determine how effective various nutrient sources are for supplying nutrient to the crop Numerous growth-limiting factors may prevent a yield response to the absorbed nutrient thus limiting the use of yield as a valid basis for evaluation
21
Uptake of Labeled Nutrient by the Crop
Certain radicisotopes such as 32p 3sS and 65Zn may be used to label the same nonradioactive nutrients during manufacshyture of fertilizers Plants are grown in the usual manner with the labeled nutrients At harvest the amounts of nutrient from the labeled source and from the soil are determined by appropriate methods
Use of certain radioactive isotopes of nutrients such as N and K for crop growth experiments is not feasible because of the very short half-life of radioisotopes of these nutrients The natural stable I SN isotope of N is used for labeling in N fertilizer experiients
A common method for evaluating the effectiveness of the labeled nutrient sources is through the calculation of A values by the method of Fried and Dean (1952) or Larsen (1952a) The formula
A= R(I-Y) [21 Y
may be used where A is the amount of available nutrient in the soil in terms of the labeled nutrient source R is the amount of nutrient applied and Y is the percentage of the nutrient in the plant derived from the fertilizer Relative effectiveness is then calculated s the inverse ratio of the A value for the test nutrient source to the A value for the standard source This method of determining uptake of nutrient from labeled fertilizer nutrients has been termed the direct method of evaluation as compared to the indirect methods using nonshylabeled nutrient sources
A single rate of each labeled source has been commonly used for the evaluation (Fried and Broeshart 1967a) However results from a recent study (1968b) indicate increases in A values with application rate of labeled nutrient under many growth situations This may cause relative effectiveness values among nutrient sources to be different depending on the rate selected and especially if different rates are used for different sources Crop recovery of the applied labeled nutrient was found to be a better basis than A values for nutrient source evaluation in a later study (1969a) In this study crop recovery of labeled nutrient was linear over a rather wide range of application of 1
2p while A values were rather erratic with rate
22
especially at high soil P levels At high soil P levels uptake of labeled P was the only suitable measurement made for P source evaluation At a low P level however yield of dry matter total uptake of P and uptake of labeled P were equally suitable for evaluating P sources
Thus if evaluation experiments are carried out on soils deficient in the nutrient under test there may be little or no advantage for labeling the nutrient sources over multiple rates of unlabeled sources If soils are used on which little or no increase in growth or total nutrient uptake is obtained anyevaluation of nutrient sources must involve labeling For evaluation of a natural source of P such as phosphate rock or of processed fertilizers difficult to label the method of soil nutrient labeling has been used This involves calculation of A values for the soil alone and for the soil plus the test sources The difference is then assumed to be the A value for the test source Soil labeling with carrier-free 32 p was found less satisfactory than fertilizer labeling for evaluation of P sources for flooded rice (1970a)
MATHEMATICAL MODELS USED TO EVALUATE NUTRIENT SOURCES
Relative Yields and Yield Increases
Before the use of regression methods illustrated beow for determining availability coefficients a single rate of appliednutrient was commonly used to evaluate different fertilizer sources of a nutrient Relative effectiveness values were calculated from actual crop yields or yield increases over no applied nutrient
Relative yield (RY) - yield with test fertilizeryield with the standard x 100 [3]
Relative yield _ yield increase for test fertilizer increase (RYI) yield increase for the standard x 100 [4)
Both of these expressions assume that the yield response would be linear with increasing amounts of applied nutrient However yield response is invariably curvilinear over much of the response range although a linear response may be obtained at low application rates
23
Figure 10 (Terman 1967c) shows the same curvilinear response of wheat forage to increasing amounts of P as superphosphate in a field experiment on a P-deficient soil as was shown in figure 7 The limiting yield (100) was obtained with 40 units of P
In test A (figure 10) a less-soluble P source was compared with superphosphate at a single rate of 10 units of P on the steeply ascending portion of the complete response curve Although the interpretation of poorer response can be made on the basis of either a linear or a curvilinear model the effectiveness of the poorer source is over-estimated by the linear model
In test B however the comparison was made at a single rate of 30 units of P At this or higher rates of applied P the conclusion based on any model would be that no difference in effectiveness exists between the two P sources Thus if a single rate of applied P is used to evaluate several sources of this nutrient all may supply adequate P if the yields fall on the flat portion of the complete response curve This may be true even though the sources are shown to be quite different in availability with a more satisfactory evaluation procedure such as using multiple rates of application of each source It may then be concluded that both the model and the rate of application are important in comparing yields resulting from a nutrient in a test fertilizer with that in a standard fertilizer
100100- 96
Figure 10 Response of 6
W Wheat
P-Deficient Forage on a
Soil to 4Increasing Amounts of
Pas Superphosphate (the 0 Standard) and Two Singleshy
_____0___ Rate Comparisons with a
UNITS Of PAPPLIEO Test Source
24
Figure 11 Comparative Effectivehess of Nutrient 0
Sources A and B in Terms z of Linear Uptake of Applied
Nutrient by the Crop The z2 -Regression Equations are 0
=YA 10 +025X q YB= 10+050X o- ----------------------
SLOPE OFA - 1 Oz U SLOPE OFB 20 050
0 0 to 30 40 UNITS OF NUTRIENTAPPLIEO(X
Linear Regression Models To compare the effectiveness of different nutrient sourcesbased on multiple rate comparisons for each source availabilitycoefficient indexes (ACI) are calculated This is true for both
linear and curvilinear responsesIf the responses are linear with several amounts of appliednutrient as is more often the case with uptake of applied N orK the calculations are rather simple The equation is
Y = a + bx [5]in which Y is the yield or uptake ais the Y-intercept with noapplied nutrient b is the slope and x is the rate of appliednutrient
Slopes (b) of the linear uptake based on the least squares fitfor each source are used as the ACI values The relativeeffectiveness of each source under test is then the ratio of itsslope to that of the standard as illustrated in figure 11 In thismethod the calculated Y-intercepts for no applied nutrient maybe slightly different for each source The following model(Engelstad 1968) provides for a common intercept
Y=a+b x+b2x 2 + +bnxn [61 Standard multiple regression programs can be used formaking the least squares calculations by computers Values
useful in making statistical comparisons among slopes for thedifferent nutrient sources are usually provided on the printoutThe common intercept and slope calculations may also be made on desk calculators (White et al 1956b) If neither is availablethe slopes can be estimated as shown in figure 11
-25
Curvilinear Regression Models
Yield responses to increasing amount of applied nutrient are usually curvilinear and suitable models must be used for estimation of the coefficients
Nutrient Equivalents A simple method of evaluation advoshycated by Cooke (1956a) and others is that of comparisons among nutrient sources based on standard fertilizer equivalents
The most effective use of this method is for experiments in which multiple rates of the standard source are compared to define the shape of the response curve with only a single rate of other sources This method illustrated in figure 12 gives comparative values similar to those obtained by more complex models and calculations by computer methods described below
Mitscherlich Models A modified form of the Mitscherlich response function may be used in which
c =log -Q [71 x A-V
c represents the effect factor x = the rate of applied nutrient A = the limiting yield with increasing ampmountsof applied nutrient
=Yo = the yield without applied nutrient and Y crop yield at each rate of applied nutrient The limiting value (A) may be estimated rather simply as the best linear fit of a plot of A-Y against x on semilog paper Computers may be used for more precise values Calculation of relative effectiveness base-d on c values for the standard and test nutrient sources is illustrated in figure 13
STANDARD
B 00 DFOPSTANDARD b40 OF STANDD Figure 12 Estimation of
A400 50 O ST oD Nutrient Source Effectiveshy0 ness in Terms of Nutrient
Equivalents of the Standard (Units of the
Experimental Source Which Give the Same 20 3240 so8 Yield as R Units of theZ 160
UNITS OF NUTRIENT APPuD Standard Source)
26
-- ---------
Figure 13 Calculation of 200 LIMITINGYIELD IA C (Equation 7) or Avail
ability Coefficient Indexes (ACi) Using a Mitscherlich 15o ROOJCT
Model ACI =fog
100 The Ratio of the ACI CdValues Gives th Relative_ -
Effectiveness of the 50 Nutrient Sources ---
0 25 50 I00
RATE OF NUTRIENT APPLIEO)KGHA
This simple type of Mitscherlich model as is the case with simple linear analysis may result in different Y-intercepts for each nutrient source A concurrent form of the Mitscherlich model (Engelstad and Khasawneh 1969) as follows provides a common intercept
ln(l) a +cix 1c 2x 2 ++Cnxn [8]
The limiting yield (A) can be estimated on semilog paper as for the simpler model or it can be calculated as a part of the computer program This program also calculates values useful in statistical tests to determine which coefficients are significantly different
Other Models
Pesek (1964) has applied the following quadratic polynomial model to curvilinear yield responses for evaluation of N sources Y=a+blxl +bIx2 +b2 x2 +b 22 x + +bixi + biix [9]
-where Y represents yield and a the intercept bi and bii the required coefficients for each of the various nutrient sources compared This model provides a common intercept but not a common limiting yield
Since comparison of slopes per se can be quite misleading in the absence of a common limiting yield Pesek suggests that the comparison be based on responses (A~Y) at a common rate of x The calculation would be performed as follows
200
27
ACI 1 = AYi 101AC12 = AY2
where AY and 6Y2 represent the response above the check to addet nutrient The common rate of x as Pesek suggests can be the economically optimum rate For this latter calculation see the section on Economically Optimum Rate of Nutrient
ECONOMIC INTERPRFTATIONS
where the cost of nutrient in one fertilizerIn situations source is different from the cost in another source an economic interpretation of effectiveness is desirable
Since source comparisons involving multiple rates of applicashytion are essential for meaningful evaluation of a nutrient in different fertilizer sources the yield results obtained may also be useful for determining the economically optimum rate of application for the crop
Economic Effectiveness of Nutrient Sources
The relative agronomic effectiveness of two nutrient sources is given by the ratio of the respective availability coefficient index values AC 1 AC12 The relative economic effectiveness (REE) can be obtained by multiplying this ratio by the inverse ratio of the respective costs (C) per unit of nutrient in the two fertilizers
REE = ACI-I C ACI 2 C
For example suppose that N in fertilizer 1 has a relative agronomic effectiveness of 10 and costs $200unit while these values for fertilizer 2 are 15 and $24010 240 240
=REE of fertilizer 1 - x2--4 x 100= 2--= 80 that of30015 200fertilizer 2
This result indicates that fertilizer 2 is the more economic source for the set of crop-soil-fertilizer conditions under which the experimen was conducted From additional results over a given area a more generalized relationship might be derived
28
Such calculations can be based on either the linear or thecurvilinear case For the latter slopes can be used only when all curves approach the same limiting yield However wherelimiting yield is not constant for all sources the calculation ofREE can be more safely based on a ratio of yield increases asproposed by Pesek (1964) as described in the section entitledOther Models The computation would be as follows
REE= -t x L x 100 [12]AY C12
where AY and AY2 represent yield increases for each sourceThese yield increases can best be computed at a common rate ofx this might well be the economically optimum rate aspreviously suggested The procedure is given below
Economically Optimum Rate of Nutrient
With appreciable yield response to the applied nutrient inmultiple rate experiments it is frequently desirable to calculatethe economically optimum rate of application Without appreshyciable response however the errors involved tend to be toogreat for meaningful estimation of thq optimum rate
Such calculations may be particularly important in countrieswhere fertilizer is high priced relative to that of the product In many developed countries however fertilizer costs are lowrelative to price of the product In this case difference betweenthe rates for optimum yield and maximum yield may be quitesmall
The determination of the optimum rate of application isbased on the concept of equating marginal costs to marginalreturns That is the cost of the last unit of nutrient should bejust equal to the value of the yield increase from that unit Topermit such a calculation several (greater than 2) rates ofnutrient must be used and the complete range of responseshould be obtained to the point where the slope decreases to essentially zero
If a mathematical function has been fitted to the yieldrebponse curve the calculation of the optimum rate is madefairly quickly While several common models have been fitted toyield response curves the quadratic will be used to illustrate the procedure
y =a+bx+cx2 [13]
-29
where y and x represents units of yield and nutrient
respectively and a the intercept The calculation of the
optimum rate is performed by equating the first derivative of y
with respect to x in the abovc model to the inverse price ratio
as follows
dy= b + 2cx [141dx
Px = b + 2cx 1151Vy
where Px and Py represent the price per unit of nutrient and
product respectively Solving for x in the latter relationship
provides the economically optimum rate for the particular set
of conditions under which the response curve was obtained rate can also beThis determination of the optimum
performed graphically The essential features are plots of the
yield curve (expressed as value per unit land area) and the
accumulative cost of fertilizer as a function of rate (variable
cost) as provided in figure 14 The optimum rate for this
example is that point on the abscissa where ahypothetical tangent to the yield curve is parallel to the variable cost line
The optimum rate is indicated in this example by the vertical
dotted line
VARIABLE COST fFigure 14 The Graphical
- I Solution to Determining the
Optimum Rate of NutrientNUTRIENT ADDED gJIIo
030
CSPECIAL PROBLEMS IN NUTRIENT SOURCE EVALUATION
Seedling Toxicity
Two types of plant toxicity may be involved in the evaluation of new fertilizer compounds One is posonaltoxicity due to concentrations of salt or ammonia with or near developing roots Soluble N K and micronutrient fertilizers tend to cause more positional toxicity problems than do phosphate fertilizers Boron in particular has a rather narrow range between deficiency and toxicity Such toxicity may be reduced or eliminated by use of a more suitable applicationtime rate or placement A second type of damage is that due to the initial compounds or decomposition products which maybe toxic even though not concentrated near developing rootsExamples include various thiocyanates sulfites and phosphitesbut these are not present in fertilizers except as possiblecontaminants Many organic combinations of N and S are highly toxic
A satisfactory evaluation of different fertilizers as sources of nutrients cannot usually be made if seedling toxicity is involved The latter becomes the limiting growth factor rather than the nutrient under test Thus if little known about ais new fertilizer compound a preliminary seedling toxicity test may be desirable
In most nutrient source evaluation experiments care must betaken to avoid appreciable concentrations of N fertilizers with crop seeds Urea and anhydrous ammonia are particularly toxic to seedling growth Caution must also be used with other ammonium fertilizers Seedling toxicity tends to be more severe in coarse-textured soils and when moisture is in limited supplyThus soil texture in relation to rainfall and irrigation practiceand soil pH are the two more important soil properties which affect crop use of N from various sources Time of application is also important
Leaching and Volatilization Losses of N
If attention is given to the best-known application methodsall common N sources tend to result in similar crop response on well-drained upland soils
31
4The~iimain concern with most N fertilizers is to reduce losses by leaching and by volatilization from surface application and to avoid seedling toxicity Ammonia may be lost by volatilizashytion from surface-applied urea on both acid and alkaline soils Severe losses as ammonia from surface-applied ammonium fertilizers usually occur only on alkaline or heavily limed acid soils Thus for N topdressing experiments urea or other N fertilizers subject to excessive loss by volatilization are poor standard sources The volatile nature of anhydrous ammonia or ammonia solutions requires that they be injected into the soil to avoid volatilization losses as NH 3
In addition to possible losses of N to the atmosphere tie-up of ammonium ii by organic matter and clay also may confuse the interpretation of yield results In the case of slow-release N sources it is difficult to separate possible volatilization loss from the N which does not become available for the crop
Losses of N by leaching can be eliminated in greenhouse pot studies by use of the weighing method of adding water to avoid waterlogging and the use of pots without drains In field studies the elimination of leaching of NO 3-N is possible only if the amount of water is regulated so that only the root zone is wetted In humid areas this is frequently not possible and leaching may occur at some or all seasons of the year
Measurement of residual N from an added fertilizer is difficult because the amount added is usually very small in relation to the total amount of N already present in the soil Labeling the fertilizer with 15N isotope is at least a partial solution to the sampling and analytical problems involved
Flooded Rice Culture
Nitrogen-Ina flooded rice paddy the floodwater and a thin layer of surface soil (figure 15) remain in a partially oxidized condition Soon after flooding however a reduced soil zone develops below the soil surface If N0 3-N is present in the soil this N is lost from the reduced soil layer following flooding as follows NO 3 DenitrificationgtN
2 or N 2 0 t
If NH 4 -N is formed from soil organic matter or is placed below the soil surface and flooded before nitrification occurs the NH 4 -N is stable and remains there for crop use
32
Figure 15 A Section Through a Typical A11 Flooded Paddy Soil Showing Oxidized
and Reduced Soil Layers In Soils Where (XTED the Pan of Low Permeability isAbsent OXIDIZED SURFACESOIL
Movement of Water and Nutrients Beyond the Root Zone May Be Excessive
HEOUCED SOIL
COMPACTEDSOIL (PAN)
PARTIALLY OXIDIZED SOIL
As the rice crop develops a mat of roots forms ht or near thesoil surface After this occurs and the crop is absorbing Nrapidly applying either NH 4 -N or NO 3 -N as a topdressing to the floodwater may give satisfactory results
In a rice soil in which a compact zone is not present leachingof NO 3 -N not already lost by denitrification may occur Alsounhydrolyzed urea may be leached beyond the root zone since urea is only weakly held by the soil
Thus placement of N time of application and nature of thesoil can all be important in determining the effectiveness of various N sources for paddy rice
Phosphorus-As a result of the reducing conditions which develop after flooding a soil availability of the soil P for riceusually increases (Patrick and Mahapatra 1968a) As a resultsoils which may exhibit a marked response by maize and otherupland crops to applied P may show a much smaller response or even no response at all to applied P by rice after flooding ThusTerman et al (1970) showed that different P sources could beevaluated satisfactorily for rice only on a soil testing very low inacid-soluble P Rice grown on many alluvial and other soilsthroughout the world shows little or no yield response to applied P fertilizers On such soils any water-soluble orcitrate-soluble P source may be satisfactory to maintain anadequate soil P level for paddy rice
33
REFERENCES
Paterson D D 1939 Statistical Technique in Agricultural Research McGraw-Hill Book Co New York
Fried M and L A i an 1952 AConcept Concerning the Measurement of Available Soil Nutrients SoilSci 73263-71
Larsen S 1952a The Use of p32 in Studies on the Uptake of Phosphorus by Plants PlantandSoil 41-10
Heady E 0 and J Pesek 1954 A Fertilizer Production Surface with Specification of Economic Optima for Corn Grown on Calcareous Ida Silt Loam J FarmEcon 36466-82
Black C A and C 0 Scott 1956 Fertilizer Evaluation I Fundamental Principles Soil Sci Soc Amer Proc 20176-79
Cooke G W 1956a Field Experiments on Phosphate Fertilizers A Joint Investigation JAgri Sci 4874-103
White R F 0 Kempthorne C A Black and J R Webb 1956b Evaluation 1I Estimation of Availability Coefficients Soil Sci Soc Amer Proc 2017986
Cochran WG and G M Cox 1957 ExperimentalDesigns 2nd Ed John Wiley and Sons New York
Terman G L 1957a Variability in Phosphorus Rate and Source Experiments in Relation to Crop and Yield Levels Agron J 49271-76
Bouldin D R J D DeMent and E C Sample 1960 Interaction between Dicalcium and Monoammonium Phosphates Granulated Together J Agr Food Chem 8470-74
Terman G L 1960a Yield Response in Experiments with Phosphorus Fertilizers in Relation to 1 Meaningful Differences Among Sources on Acid Soils of the Southeastern States Soil Sci Soc Amer Proc 2435660 II 1961 Variability and Differences Among Sources on Soils of Northern and Western States Soil Sci Soc Amer Proc 2549-52
Engelstad 0 P and E C Doll 1961 a Corn Yield Response to Applied Phosphorus As Affected by Rainfall and Temperature Variables Agron J 53389-92
Ternan G L D R Bouldin and J R Webb 1962 Evaluation of Fertilizers by Biological Methods Advances in Agron 14265-319 Academic Press New York
Pesek J T 1964 Comparing Efficiency of Nitrogen Fertilizers IN
Fertilizer Nitrogen-Its Chemistry and Technology V Sauchelli Ed pp 365-91
Terman G L W M Hoffman and B C Wright 1964a Crop Response to Fertilizers in Relation to Content of Available Phosphorus
34
AWdvances in Agron 1659100 Academic Press New York)Terman G L S E Allen and L B Clements 1966 Greenhouse
Techniques for Soil-Plant-Fertilizer Research Tennessee ValleyAuthority Must e Shoals Ala Report No T66-4SFEnsminger L E R WPearson and W H Armiger 1967 Effectiveness of Rock Phosphate as a Source of Phosphorus for Plants U S Dept of Agr ARS 41-125
Fried M and H Broeshart 1967a The Soil-PlantSystem in Relation toInorganicNutritionAcademic Press New York
Snedecor G Wand W G Cochran 1967b StatisticalMethods 6th Ed Iowa State University Press Ames Iowa
Terman G L 1967c Commonly Occurring Errors in Interpretations ofYield Results from Single-Rate Nutrient Comparisons Agron J 59285-86
Engelstad 0 P 1968 Use of Multiple Regression in Fertilizer Evaluation Agron J 6032729
Patrick W H Jr and I C Mahapatra 1968a Transformations and Availability to Rice of Nitrogen and Phosphorus in Waterlogged SoilsAdvances in Agron 20323-59 Academic Press- New Yoik
Terman G L and F EKhasawneh 1968b Crop Uptake of Fertilizer andSoil Phosphorus in Relation to Calculated A Values Soil Sci 10534654
Engelstad 0 P and F E Khasawneh 1969 Use of a Concurrent Mitscherlich Model in Fertilizer Evaluation Agron J 61473-74
Terman G L and S E Allen 1969a Fertilizer and Soil P Uptake byMaize as Affected by Soil P Level Granule Size and Solubility ofPhosphate Sources J Agr Sci 73417-24
Terinan G L S E Allen and 0 P Engelstad 1970 Response by PaddyRice to Rates and Sources of Applied Phosphorus Agron J6239094 Terman G L dnd S E Allen 1970a Fertilizer and Soil P Uptake byPaddy Rice as Affected by Soil P Level Source and Date of Application J Agr Sci 75547-52
APPENDIX
Design and Sample Calculations For Specific Types of Field Experiments
The following general procedure is suggested for experiments to be conducted 1 Write a proposal for the experiment including title
background objectives and detailed procedure 2 Prepare an experimental outline showing the proposed list of
treatments and plot layout Both randomization and replication of each treatment are essential
3 Draw up a work plan with each step outlined in detail This is especially necessary if several technicians are involved in various phases of the experiment
4 Prepare weight sheets for all experimental and other fertilizers to be applied per plot
5 Make calculations and write directions for preparation of any specal fertilizers soil treatment crop handling etc
6 Select a soil area for the experiment which is as uniform as possible and which is expected to result in a yield response by the crop to the nutrient under test This should be established in a preliminary test if possible
Some additional factors to be considered include 1 Plot size This can vary with crop site and the nature of
cultural operations In the following examples plots 3 x 6 2 m giving 18 m or 00018 ha were used for the calshy
culations 2 Nutrient rates Rate of nutrients per hectare should fit the
local crop response patterns At least two nonzero rates of nutrient from each source as well as a zero treatment for the nutrient under test should be included The nutrient increments might be increased arithmetically ie 0 50 100 and 150 kgha or geometrically ie 0 50 100 and 200 kgha The actual rates selected should cover the expected yield response range This is particularly important for estimation of the economically optimum application rate
3 Experimental design A randomized complete block design with 4 replicates is usually adequate A randomized split-plot design can be used if the objective is to compare one factor
36
(eg nutrient source) more precisely than a second factor(eg rate of nutrient) Partially confounded incompleteblock designs are not recommended for nutrient source evaluation
4 Statistical analyses Analysis of variance should beperformed as a first step to determine whether statisticaldifferences among rates and sources exist If such differences are found regression analyses as described by Engelstad(1968) or Engelstad and Khasawneh (1969) should be carried out
The following examples of experiments and the necessary calculations of amounts of fertilizers to apply varyfrom simple to more complex to illustrate certain nutrient balancing problems which may arise
Example 1
Title Effectiveness of P in phosphate rocks varying in citiate solubility
This example illustrates a simple type of experiment with nospecial problems The objective is to evaluate the P in thefollowing sources for a crop
P source Concentrated superphosphate (CSP)
Granular (-6+9 mesh)Phosphate rock (PR-I)
Total P
497
347
Total P 217
151
AOAC-available P of Total
98
1 -200 mesh
Phosphate rock (PR-2) 327 143 16 -200 mesh
Phosphate rock (PR-3) -200 mesh
299 130 26
(4 Psources x 3 P rates + no P) x 4 replcates= 52 plots (39 with 3replicates)
If an additional objective is to measure residual effects during asecond crop then 4 additional no-P plotsshould be included on which to make a fresh application of CSP as the standard forthe second crop yields
The phosphate treatments are given in table A-1 Uniformapplication of lime N K S and micronutrients over the plot
37
area should be made as needed to provide adequate levels of these nutrients for high crop yields
Table A-1 Treatments and Rates of Pto Apply (Example 1) Fertilizer
P source and Treatment P applied P applied weight total P content nos Kgha gplot gplot CSP 217 1 20 36 166
2 40 72 332 3 80 108 498
PR-i 151 4 20 36 238 5 40 72 476
PR-13 6 80 108 714 7T 20 36 252 8 40 72 504 9 -80 108 73
PR-3130 1 36 27710 20 11 40 72 55412 80 108 831
Check (noP) -13 0 0 0
Example 2
Title Effectiveness of P in P and NP sources The -6+9 mesh granular fertilizers to be compared as sources
of P are as follows -
Total Total Total Water-soluble P P source N P2 05 P oftotal
Concentrated superphosphate(CSP 0-49-0)
- 497 217 188
Monoammonium phosphate 122 616 269 100 (MAP 12-61-0)
Urea ammonium phosphate 299 29A 128 100 (UAP 29-29-0) -
Nitric phosphate 200 213 93 54 (NP 20-20-0)
To have a valid comparison of the effectiveness of the P in these fertilizers it is necessary to supplement the CSP and MAP with N to equalize the N applied among the four sources The N can be supplied as ammonium nitrate ec for upland crops but ammonium sulfate or urea would be prqferred for paddy rice
38
Fertilizer treatments and rates of N as urea and of P toapply are shown in table A-2
Another complicating factor in relation to evaluation of these P sources for paddy rice is that about half of the N in NP (20-20-0) is in the NO3 -N form and half as NH4 -N If this fertilizer is incorporated into the soil before or after flooding most or all of the NO 3 -N will be lost to the air throughdenitrification In this case the NP should probably be supplemented with additional N as urea to compensate for this loss
If ammonium sulfate (205 N and 234 S) is used for equalization of the N among P sources then a variable amount of S as the sulfate is also applied This could possibly affect the P evaluation icsults especially on a soil low in S The amount of S could be then equalized with finely ground gypsum (CaS 4 2H 2 0 186 S) Equalization of the S with gypsum would cause a variable amount of Ca to be applied which is also true among the P sources However this would be of little importance in an adequately limed soil
Example 3
Title Effectiveness of N in N and NP fertilizers The -6+9 nesh granular fertilizers to be compared as sources
of N are as follows
Total Total Total N source N P2OS P
Monoammonium phosphate 122 616 269 (MAP 12-61-0)
Urea ammonium phosphate Y- 299 294 128 (UAP 29-29-0)
Ammonium sulfate 205 -(AS 205-0-0-234 S)
Sulfur-coated urea 350 (SCU 35-00-210S)
For a valid comparison of the effectiveness of N in these fertilizers it is necessary to supplement the UAP AS and SCU with P to equalize the P applied among the four N sources Fertilizer treatments and rates of P as CSP and of N to apply are shown in table A-3 CSP (or triple superphosphate) is selected for equalization of the P because it is largely water soluble (as is the P in MAP and UAP) and is low in S
39
The N treatments also supply a variable amount of S which may also interfere with a valid evaluation of the fertilizers as N sources This may be at least partially corrected by additions of finely ground gypsum as shown in table A-3 However it is not possible to estimate the rate of oxidation of the S in SCU to the sulfate This has been found to be rather slow especially in flooded soils
As in Example 2 variable amounts of Ca are supplied by tne CSP and gypsum additions Again these would not b2 expected to interfere with the N source evaluation in adequately limed soils
40
- Table A-2 Treatments and Rates of P and N to Apply (Example 2) N applied for
- Fertilizer N applied equalizationa Psourct and -Treatment -P applied P applied weight with P N As 46
total Pcontent no Kgha gplot glplot Iplot glplot urcagplotCSP 217 1 10 18 83 0 168 365
2- 20 36 166 0 168 365 3 40 72 332 0 168 365
MAP269 4 10 - 18 67 8 160 348 5 20 36 134 16 152 330
1-6 - 40 72 268 33 135 gt 293 UAP 128 7 10 18 141 42 126 274shy
- 8 20 36 282 84 84 233 9- 40 72- 563 -168 0
NP93( 10 10 i8 194- 39 129 280 -11 - 20 36 - 387 78 90 196
12 - 40 - 72 774 - 155 13 -28 Check(noP) -13 - 0 - 0- 0 - -0 -168 - 365-- shyaEqualization to 93 Kg oof Nha tthe amountt suppliedby the highest rate of UAP
Table A-3 Treatments and Rates of N P a-d S to Apply (Example 3) applied for S applied for
-N source and - - -P
Fertilizer P applied ualizationa S applied equalizationb
total N content Treatment N applied N applied weight with N P As CSP with N S Gypsum - - nos Kgha gplot glplot gfplot gplot glplot glplot gplot gplot
MAP 122 - 1 30 54 443 119 238 1097 0 185 995 - - 2 60 -- 108 885 238 119 548 0 1F5 995
--3 90 -162 1328 357 0 0 0 185 995 -UAP299 4 30 54 181 23 334 1539 0 185 995
5- 60 1108 361 46- 311 1433 0 185 995 6 90 -62 542 69 288 1327- 0 185 995
-AS205 7 - 30 -54 -263 0 - - 357 1645 - 62 123 661 - 8 - 60- 108 527 0 -357 1645 123 62 333
9 90 162 790 0- 357 1645 185 0 0 SCu3509 10 30 54 154 0 357 1645 32 153 822
11 60 108 309 0 -357 16451 _ 65 120 645 S12 90 162 463 0-- -357 1645 97-- 88 473
Check (no N) 13- 0 0 0 0- 357 1645 0 -185 995aEqalion to 198 Kg of Pha thc amount supplied by the highest rate of MAP - Equalization to 103 Kg of Sha the amount supplied by the highest rate of AS
Bulletin Y-21 TENNESSEE VALLEY AUTHORITY March 1971 NATIONAL FERTILIZER DEVELOPMENT CENTER 0 MUSCLE SHOALS ALABAMA 35660
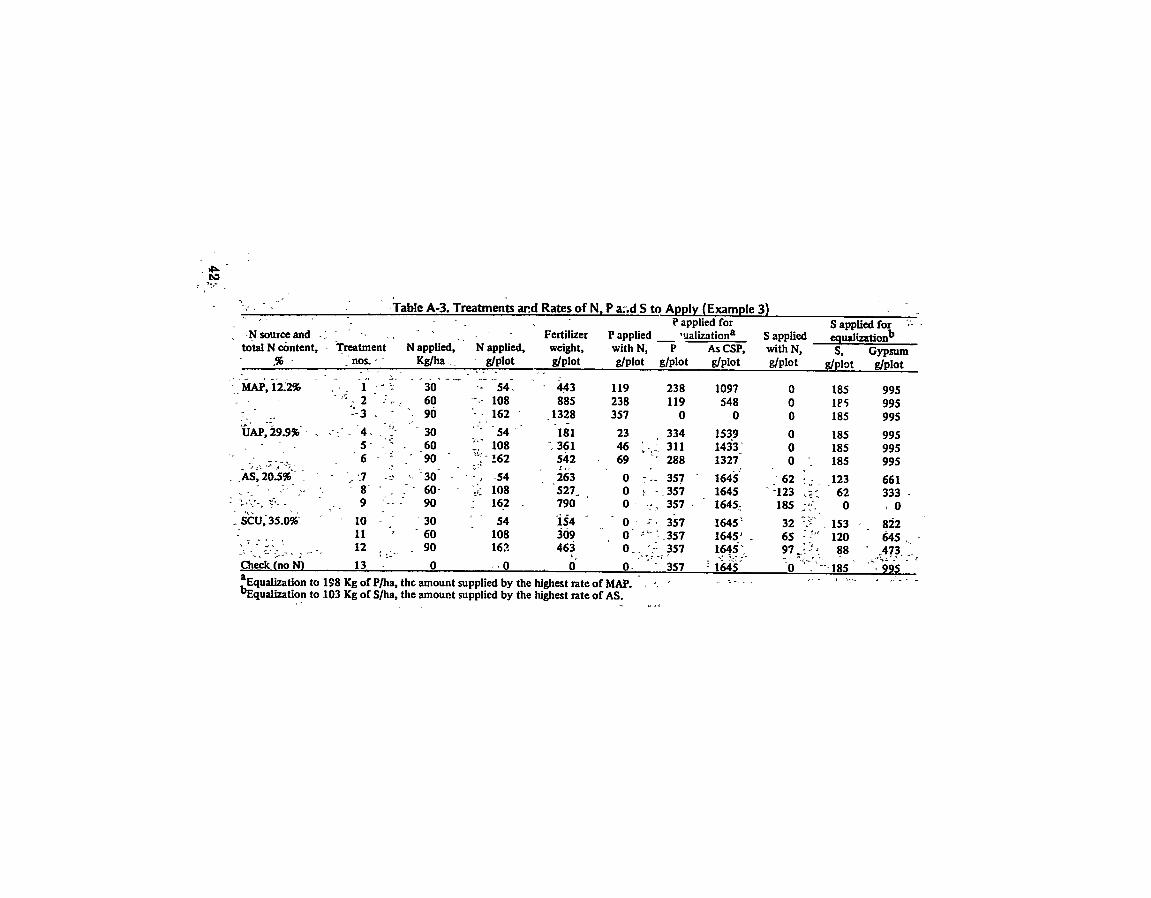

Bulletin Y-21 TENNESSEE VALLEY AUTHORITY March 1971 NATIONAL FERTILIZER DEVELOPMENT CENTER 0 MUSCLE SHOALS ALABAMA 35660