The Crude Oil Pricing System: Features & Prospects Crude Oil Pricing System: Features & Prospects...
36
The Crude Oil Pricing System: Features & Prospects Dr Bassam Fattouh Oxford Institute for Energy Studies 29 March 2011 Presented at the Surrey Energy Economics Centre
Transcript of The Crude Oil Pricing System: Features & Prospects Crude Oil Pricing System: Features & Prospects...
The Crude Oil Pricing System:
Features & Prospects
Dr Bassam FattouhOxford Institute for Energy Studies
29 March 2011Presented at the Surrey Energy Economics Centre

Speculation Versus Fundamentals Debate
• Behaviour of oil prices in 2008-2009 polarised views about key drivers of oil prices– Fundamentals – Speculation
• Empirical evidence so far failed to settle the dispute– Data limitations, methodological problems, inter-related determinants, endogeneity
issues
• Dichotomy still dominates debate, but is it useful?
– Assumes a clear dividing line between commercials and non-commercials
– Financial players don‟t operate in isolation of physical parameters of the oil market
– Oil price be sliced into various components reflecting fundamental and non-fundamental factors theoretically weak and empirically can‟t be implemented
– Assumes that speculators form a homogenous group• Financial players are quite diverse
– Financialisation of crude oil
– Two layers of price discovery: paper and physical• What are the links between the two?
Wide Range of Financial Players
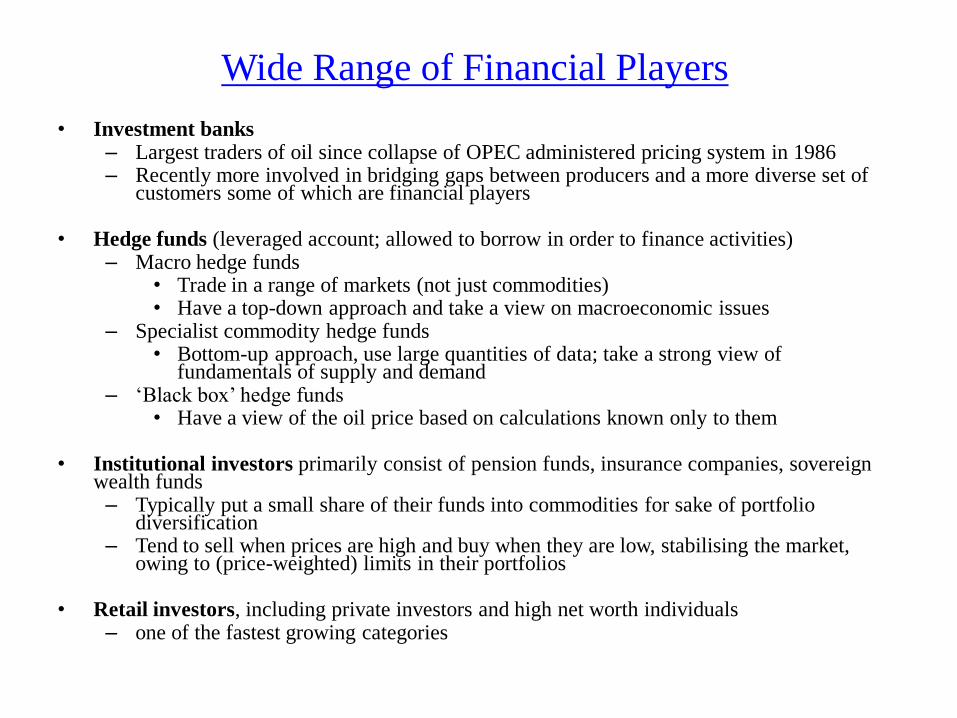
• Investment banks– Largest traders of oil since collapse of OPEC administered pricing system in 1986– Recently more involved in bridging gaps between producers and a more diverse set of
customers some of which are financial players
• Hedge funds (leveraged account; allowed to borrow in order to finance activities)– Macro hedge funds
• Trade in a range of markets (not just commodities) • Have a top-down approach and take a view on macroeconomic issues
– Specialist commodity hedge funds • Bottom-up approach, use large quantities of data; take a strong view of
fundamentals of supply and demand– „Black box‟ hedge funds
• Have a view of the oil price based on calculations known only to them
• Institutional investors primarily consist of pension funds, insurance companies, sovereign wealth funds – Typically put a small share of their funds into commodities for sake of portfolio
diversification– Tend to sell when prices are high and buy when they are low, stabilising the market,
owing to (price-weighted) limits in their portfolios
• Retail investors, including private investors and high net worth individuals – one of the fastest growing categories
Diverse Strategies
• Many financial investors with very diverse strategies
– Active vs passive
– Physical interest vs paper interest
– Fundamental analysis vs trade on trends
– Irrational momentum players vs entirely rational momentum players
(many physical players)
• Aware of unsustainable herd effect but rationally decide to ride
momentum for a period of time before getting out in time
Is Crude Oil a Financial Asset?• View that crude oil acquired characteristics of financial assets such as stocks or bonds become
popular
• Nature of financialisation and its implications not yet clear– Most studies focus on outcomes: correlations between returns and levels of oil prices, financial indexes and exchange
rates
• Full understanding of degree of interaction between oil and finance requires, in addition, an analysis of processes– Investment and trading strategies of distinct types of financial participants
– Financing mechanisms & degree of leverage supporting those strategies
– Mechanisms that link the financial and physical layers of the oil market
• Unlike a pure financial asset crude oil market has also a “physical” dimension – Crude oil consumed, stored & widely traded with millions of barrels being bought and sold every day
at prices agreed by transacting parties
• Prices in the futures market through the process of arbitrage should eventually converge to so-called “spot” prices in physical markets reflecting current market fundamentals
• Story more complex– Current market fundamentals never known with certainty
– Important to understand process of convergence plus what “spot” price, in the context of oil market really means

The International Oil Pricing System • Collapse of OPEC administered pricing system in 1986 ushered in a new era in oil
pricing– Power to set oil prices shifted from multinational oil companies in 1950s and 1960s and OPEC
from 1973 to 1986 to the so called „market‟
• Development of a complex structure of interlinked layers which consist of spot and also physical forwards, futures, options and other derivative markets referred to as paper markets
• Most complex structures emerged in the North Sea around Brent, in US around the West Texas Intermediate (WTI), in the Gulf around Dubai– International benchmarks of pricing system
• Price of key oil benchmark crudes at heart of pricing system– Used by oil companies and traders to price cargoes under long-term contracts
– Used in spot market transactions
– By futures exchanges for settlement of their financial contracts
– By banks and companies for settlement of derivative instruments such as swap contracts
– By governments for taxation purposes

Physical Benchmarks• Physical delivery of crude oil
– Spot market
– Long-term contracts negotiated bilaterally between parties for delivery series of shipments
• Formula pricing used in calculating price of an oil shipment
• Link price of different varieties of crudes to specific benchmark
– Formula pricing: Px = PR ± D • where Px = price of crude x;
• PR = benchmark crude price;
• D = value of price differential
• Agreed for price to be set at time or around of time of loading
• Value of price differential could be set by oil exporting countries or assessed by PRAs
• Countries use different benchmarks depending on export destination
• Pricing may be based on assessed prices such as Dated Brent or on financial layers surrounding physical benchmarks such as Brent Weighted Average (BWAVE)
– an index calculated on the basis of prices obtained in the Brent futures market
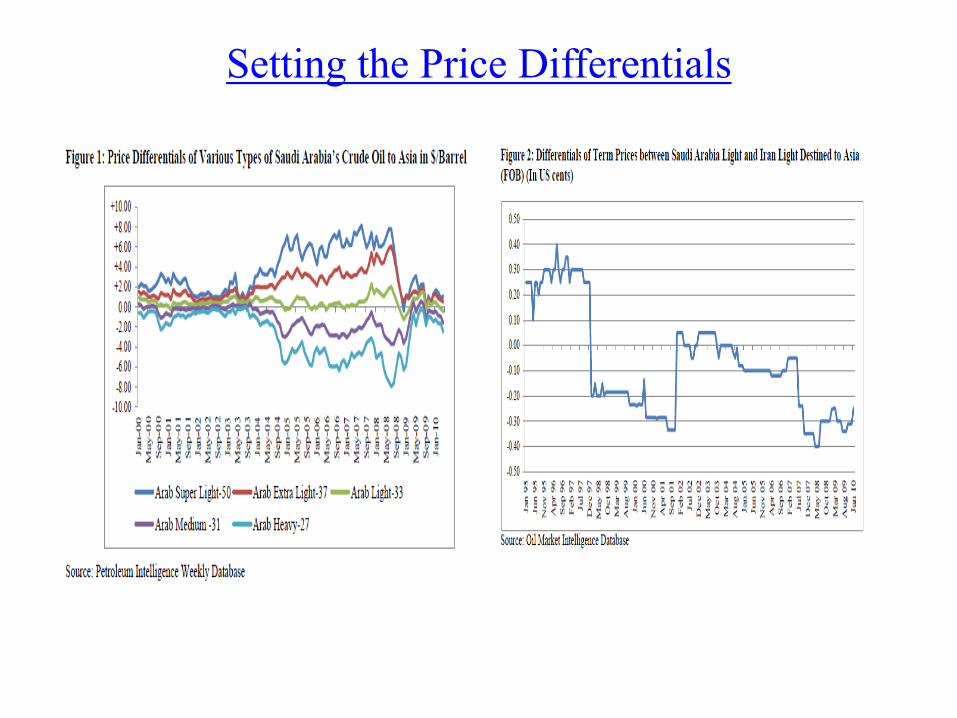
Setting the Price Differentials

Benchmarks
Table 1: Main Benchmarks Used in Formula Pricing
Asia Europe US
Saudi Arabia Oman and Dubai BWAVE from Jul.'00, Dated Brent
Until Jun.'00
ASCI from
Jan.2010, WTI
until Dec.'09
Iran Oman and Dubai BWAVE from Jan.'01, Dated
Brent Until Dec.'00
Kuwait Oman and Dubai BWAVE from Jul.'00, Dated Brent
Until Jun.'00 WTI
Iraq (Basrah
Blend) Oman and Dubai Dated Brent
WTI Second
Month
Nigeria
Dated Brent Brent
Mexico (Maya
Blend)
Dated Brent x0.527
+ 3.5%HSFO x0.467
- 1%FO x.25
+ 3.5%FO x0.25"
WTS x0.4
+ 3%HSFO x0.4
+ LLS x0.1
+ Dtd.Brent x0.1
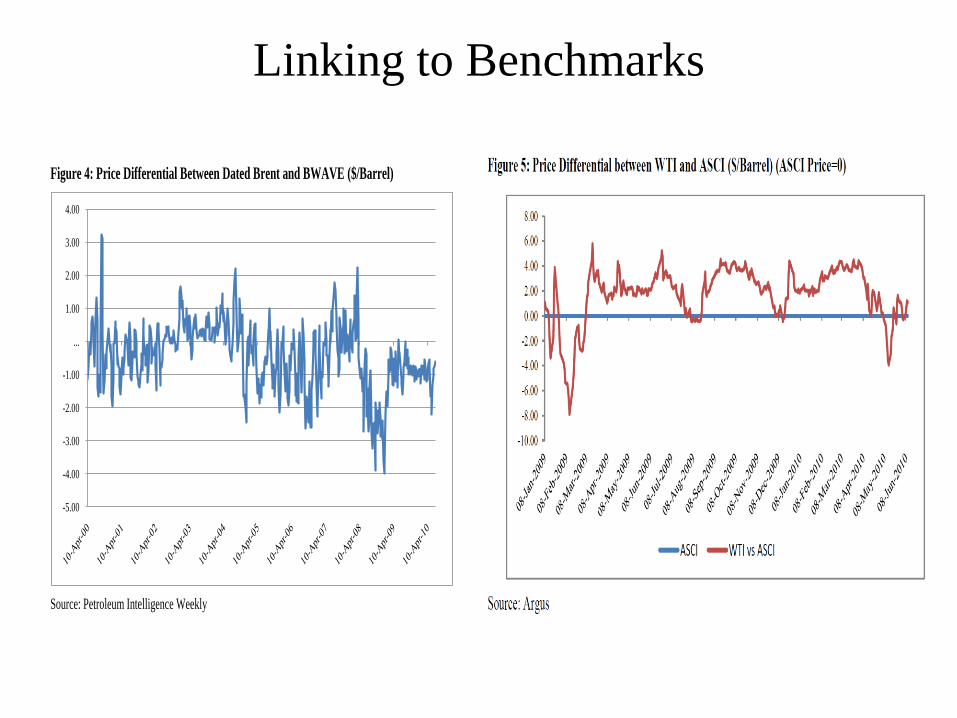
Linking to Benchmarks
Figure 4: Price Differential Between Dated Brent and BWAVE ($/Barrel)
Source: Petroleum Intelligence Weekly
-5.00
-4.00
-3.00
-2.00
-1.00
...
1.00
2.00
3.00
4.00

Features of Benchmarks:
Physical Liquidity of Benchmarks• Markets with relatively low physical liquidity set the price for markets with much
higher volume of production
• Low physical liquidity and squeezes– As markets become thinner and thinner, squeezes and distortions become more widespread
– Prices and spreads become less informative and more volatile
• Nature of these benchmarks tends to evolve over time but not without problems– Widen the benchmark for assessment purposes
– Assessment of traditional Brent benchmark now includes North Sea streams Forties, Osebergand Ekofisk (BFOE)
– Dubai price includes Oman and Upper Zakum
• Short-term solutions of adding additional streams successful in alleviating problem of squeezes but should not distract observers from raising key questions – What are necessary conditions for the emergence of successful benchmarks in the most liquid
market in terms of production?
– Would a shift to price assessment in markets with high physical liquidity improve the price discovery process?

Comingling Benchmarks
Figure 17: Dubai and Oman Crude Production Estimates (thousand barrels per day)
Source: Leaver, T. (2010), DME-Oman: Transparent Pricing and Effective Risk Management in a New Era,
Presentation at the Asia Oil and Gas Conference, Kuala Lumpur, June.
0
100
200
300
400
500
600
700
800
900
1000
1990-1995 1999 2004 2005 2009
Dubai Oman
Feature of Benchmarks:
Assessed Prices• Prices of physical benchmarks „identified‟ or „assessed‟ by PRAs
– Platts, Argus
• Assessments needed in opaque markets where physical transactions
concluded between parties cannot be directly observed by market
participants outside the deal
• Assessments needed in some illiquid markets where not enough
representative deals can be observed or where no transactions take place
• PRAs assess prices based on information on
– Concluded deals
– Bids and offers
– On market talk, other private and public information gathered by reporters
(intelligent assessment)
– Information from financial layers

Oil Price Reporting Agencies
• Only act a „a mirror to the trade‟ and provide „transparency‟?
• In attempt to identify oil price PRAs enter into decision-making territory that can influence market structure – Platts decides on when to stamp the oil price, width of Platt‟s window used to
make price assessment, size of parcel to be traded, process of delivery, time of delivery of contract, method that information should be delivered
• New markets and contracts emerge to hedge risks arising from some of decisions that PRAs make
• Even when price assessments based on observed deals and simple mathematical formula still an important element of decision-making involved
• PRAs assessment process is not neutral to the market
PRAs: Three inter-related dimensions
• Accuracy of price assessments– Market participants under no legal or regulatory obligation to report deals
– Whether participants decide to provide information to RPAs depend on willingness, reporting policies, & interest in doing so
• Companies may have reporting policies that bind them to report deals that take place at a certain time of day, or in certain regional markets
• In some market such as US, confidentiality agreements dictate that some PRAs do not publish name of counterparties to a deal
– In a liquid market• Reporters could observe concluded deals and confirm obtained information from both
parties & look at regular flow of information coming from futures and OTC markets
– In illiquid markets where few deals concluded small number of reported deals heavily influence assessed prices
• Rely on variety of sources including information on bids & offers and on market talk to make “intelligent assessments”
• Accuracy of assessed price will depend among other things on skill of reporter
• Internal procedures – To safeguard price assessment process and improve transparency PRAs self-
impose and self-enforce their own rules and compliance procedures • Not subject to any external regulation but in theory strong incentive to self-regulate
Methodologies
• Methodology used in identifying oil price
– Fundamental difference in methodology and in philosophy underlying price assessment
• Example: Weighted average vs Window or MOC
• MOC: Structured system for gathering information on the basis of which Platts assesses the daily price of key physical benchmarks
• Similar to a futures exchange where traders make bids and offers, but with two major differences
– Parties behind bids and offers known
– Platts decides on information to be considered in the assessment
– Different methodologies produce different prices for same benchmark

Different Methodologies, Different Prices
• Criticisms of weighted average approach– “an averaging system for price
determination could result in assessments that lag actual market levels as deals done early in an assessment period at a level that is not repeatable, could mathematically drag prices down or up” (Platts, 2010, p.7)
• Criticism of window (Argus)– Often lacks sufficient liquidity
and dominated by few players which may hamper price discovery process
Table 2: Spot Market Traded Volumes in May 2007 (May traded during May Trade Month)
Window Entire Day (Argus) Window % of Total
LLS 0 446,920 0%
WTI Diff to CMA 26,425 378,445 7%
Mars 5,418 185,252 3%
WTS 1,000 154,706 1%
WTI Midland 3,000 138,470 2%
HLS 1,000 100,032 1%
WTI P-Plus 1,000 88,802 1%
Eugene Island 0 40,044 0%
Poseidon 0 73,857 0%
SGC 0 22,100 0%
Bonito 0 9,140 0%
37,843 1,637,768 2.31%
Source: Argus Media Ltd

Dubai Partials

Feature of Physical Benchmarks:
Financial Layers and the Spot Price• Many financial layers (paper markets) emerged around physical
benchmarks
• Financial layers highly interlinked with benchmarks through process of arbitrage and development of products that link layers together
• Idea that one can isolate physical from financial layers in current oil pricing system is simplistic
• Information derived from financial layers plays an important role in identifying the price level of the benchmark
• Brent market: Price of Dated Brent assessed using information from many layers including CFDs, forward markets, EFPs and futures markets
• WTI complex: prices of the various physical benchmarks strongly interlinked with the futures markets
• Price of Dubai often derived using information from the very active OTC Dubai/Brent swaps market and the inter-Dubai swap market

Spot Price Identification Process
• Process starts by identifying the price of Forward Brent
– Movements on ICE futures Brent market, spread values, and EFPS factored into the assessment.
• Contract that links the futures Brent and the forward Brent is the Exchange for Physicals (EFPs)
– Priced as differential to the futures price
– Forward Brent (July) = Futures Price (July) + EFP (July)
• Price of Dated Brent needs to be identified with the help of another layer: the OTC market of Contract for
Differences (CFDs)
– Forward Dated Brent = CFD plus Second Month Forward
• Given that CFDs traded and reported for eight weeks ahead Forward Dated Brent can be derived for 8
weeks into future which give us the „Forward Date Brent Curve‟
• Based on derived Forward Dated Brent Curve, possible to calculate average of the Forward Dated Brent
from day 10 to day 21
– Platts uses the term „North Sea Dated Strip‟ or the „Forward Dated Brent‟
• Since BFOE is comprised of four different crudes, these blends individual crudes often trade as differentials
to the 10-21 average of the Forward Dated Brent or North Sea Dated Strip
• Based on an assessment of these differentials, it is possible to calculate the price of Dated Brent/BFOE or
Dated North Sea Light (Platts)
• Price of Dated Brent will settle on the most competitive crude among the BFOE combination (Forties)
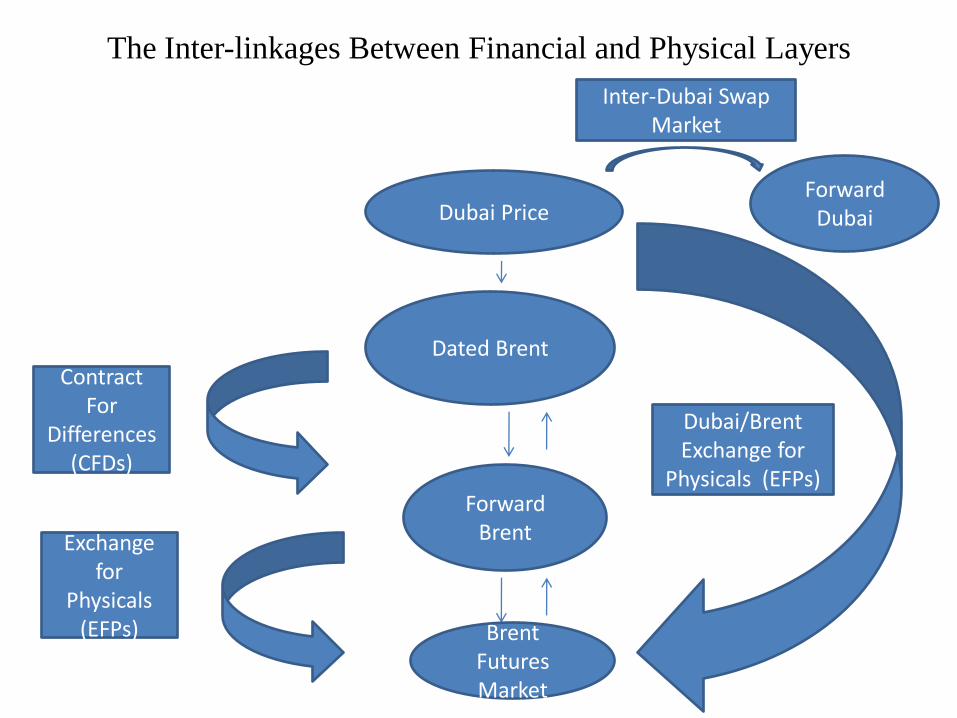
The Inter-linkages Between Financial and Physical Layers
Dubai Price
Dubai/Brent Exchange for
Physicals (EFPs)
Inter-Dubai Swap Market
Dated Brent
Forward Brent
Contract For
Differences(CFDs)
Brent Futures Market
Exchange for
Physicals (EFPs)
Forward Dubai

How Reflective are Existing Benchmarks of
Global Oil Market Conditions?
• Dislocations of benchmarks: What are
some implications of such dislocations
on oil market dynamics? Which
benchmark is more representative of
global market conditions? None?
• Dubai: Appropriate benchmark for
crude oil destined to Asia despite
decline in physical production? Does
the rise in Asian consumer as the
marginal buyer require the search for
alternative benchmarks that reflect
better market conditions in Asia?

Nature of Players
• Futures markets attracted wide range of financial players (pension funds, hedge funds, index investors, technical traders, & retail investors)
• Concerns that these financial players & their trading strategies could move the oil price away from the „true‟ underlying fundamentals
• Participants in many of the OTC markets such as Brent forward market, Dated Brent and CFDs mainly „physical‟ – Refineries, oil companies, downstream consumers, physical traders,
and market makers
– Financial players limited presence in some of these markets
• Any analysis limited to non-commercial participants in futures market and their role in oil price behaviour both incomplete and inaccurate
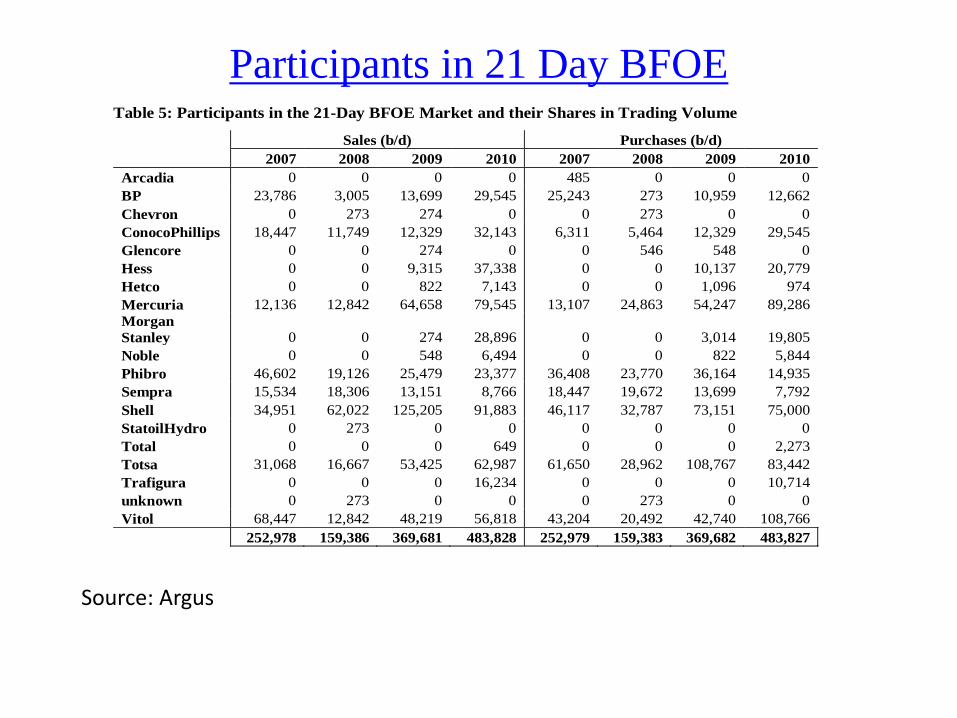
Participants in 21 Day BFOETable 5: Participants in the 21-Day BFOE Market and their Shares in Trading Volume
Sales (b/d) Purchases (b/d)
2007 2008 2009 2010 2007 2008 2009 2010
Arcadia 0 0 0 0 485 0 0 0
BP 23,786 3,005 13,699 29,545 25,243 273 10,959 12,662
Chevron 0 273 274 0 0 273 0 0
ConocoPhillips 18,447 11,749 12,329 32,143 6,311 5,464 12,329 29,545
Glencore 0 0 274 0 0 546 548 0
Hess 0 0 9,315 37,338 0 0 10,137 20,779
Hetco 0 0 822 7,143 0 0 1,096 974
Mercuria 12,136 12,842 64,658 79,545 13,107 24,863 54,247 89,286
Morgan
Stanley 0 0 274 28,896 0 0 3,014 19,805
Noble 0 0 548 6,494 0 0 822 5,844
Phibro 46,602 19,126 25,479 23,377 36,408 23,770 36,164 14,935
Sempra 15,534 18,306 13,151 8,766 18,447 19,672 13,699 7,792
Shell 34,951 62,022 125,205 91,883 46,117 32,787 73,151 75,000
StatoilHydro 0 273 0 0 0 0 0 0
Total 0 0 0 649 0 0 0 2,273
Totsa 31,068 16,667 53,425 62,987 61,650 28,962 108,767 83,442
Trafigura 0 0 0 16,234 0 0 0 10,714
unknown 0 273 0 0 0 273 0 0
Vitol 68,447 12,842 48,219 56,818 43,204 20,492 42,740 108,766
252,978 159,386 369,681 483,828 252,979 159,383 369,682 483,827
Source: Argus
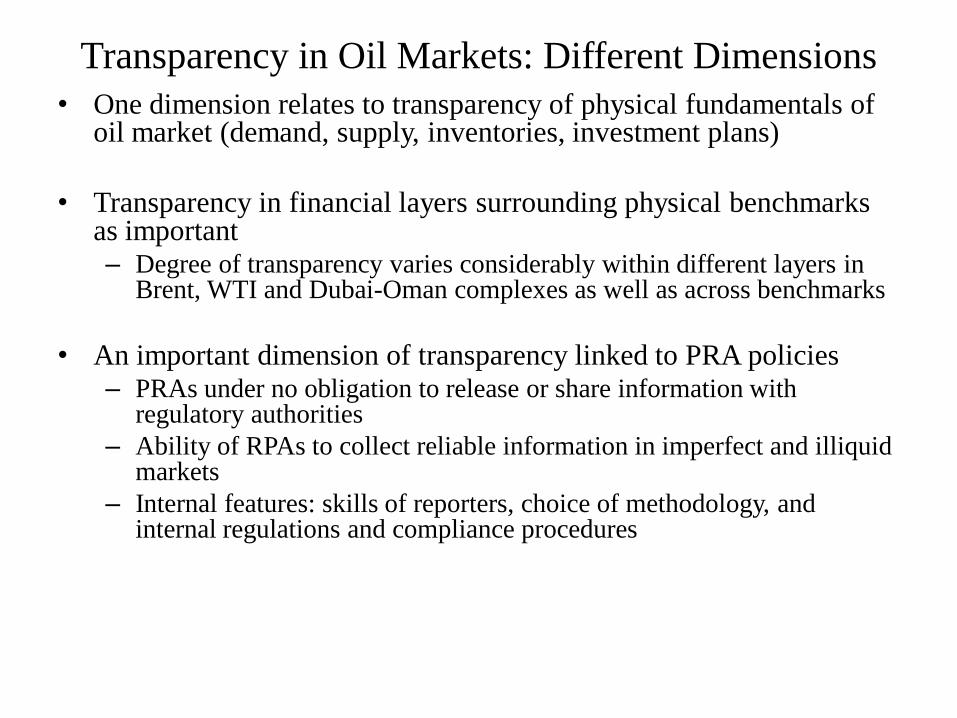
Transparency in Oil Markets: Different Dimensions
• One dimension relates to transparency of physical fundamentals of oil market (demand, supply, inventories, investment plans)
• Transparency in financial layers surrounding physical benchmarks as important– Degree of transparency varies considerably within different layers in
Brent, WTI and Dubai-Oman complexes as well as across benchmarks
• An important dimension of transparency linked to PRA policies– PRAs under no obligation to release or share information with
regulatory authorities
– Ability of RPAs to collect reliable information in imperfect and illiquid markets
– Internal features: skills of reporters, choice of methodology, and internal regulations and compliance procedures
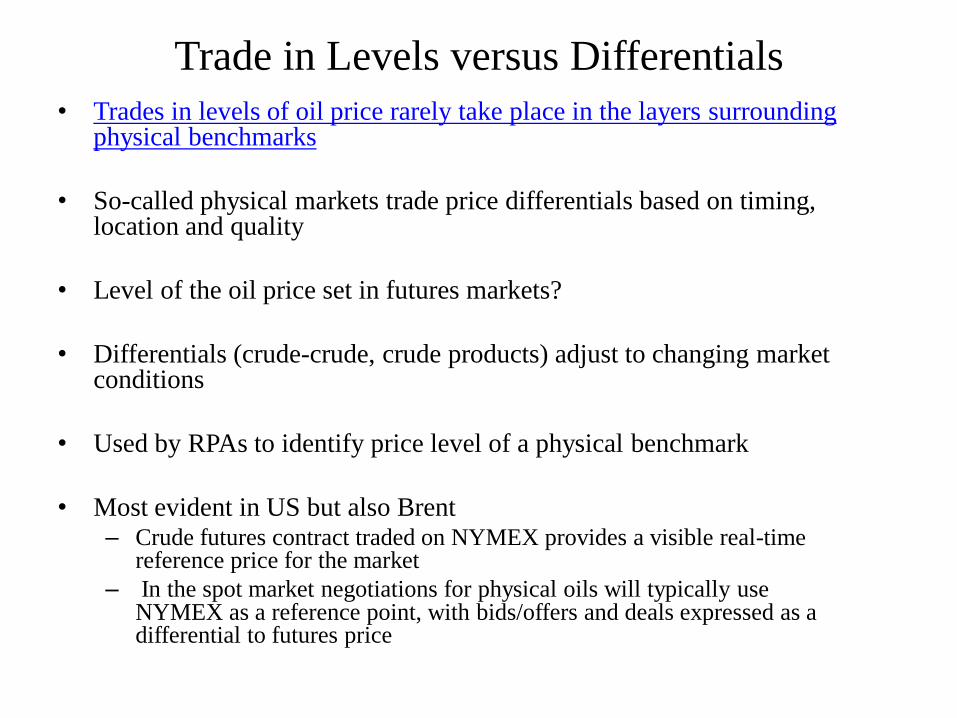
Trade in Levels versus Differentials
• Trades in levels of oil price rarely take place in the layers surrounding physical benchmarks
• So-called physical markets trade price differentials based on timing, location and quality
• Level of the oil price set in futures markets?
• Differentials (crude-crude, crude products) adjust to changing market conditions
• Used by RPAs to identify price level of a physical benchmark
• Most evident in US but also Brent– Crude futures contract traded on NYMEX provides a visible real-time
reference price for the market
– In the spot market negotiations for physical oils will typically use NYMEX as a reference point, with bids/offers and deals expressed as a differential to futures price
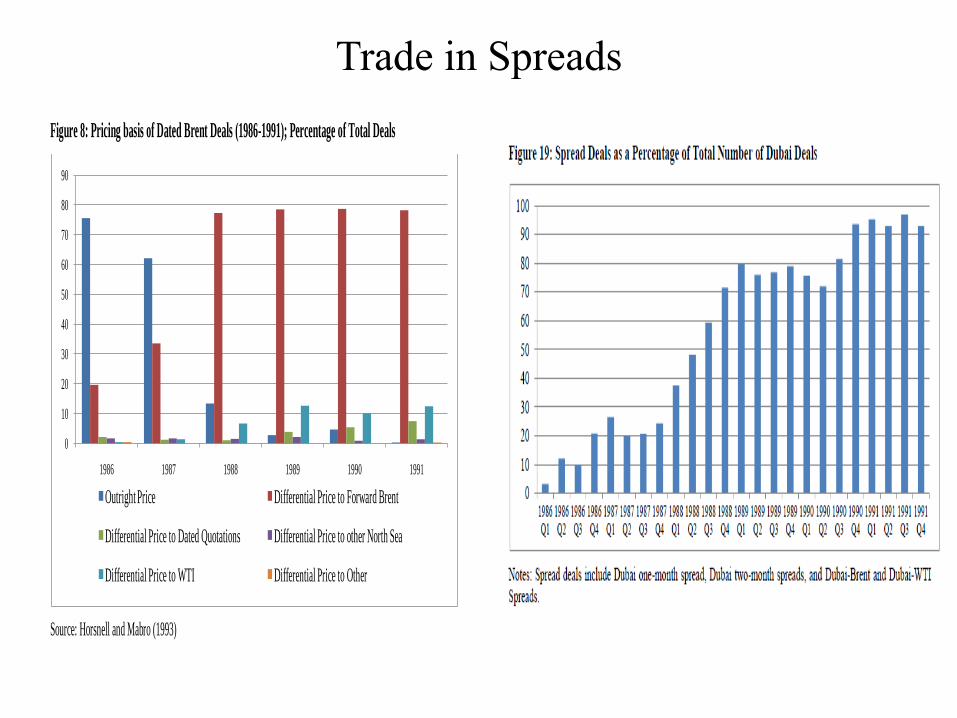
Trade in Spreads
Figure 8: Pricing basis of Dated Brent Deals (1986-1991); Percentage of Total Deals
Source: Horsnell and Mabro (1993)
0
10
20
30
40
50
60
70
80
90
1986 1987 1988 1989 1990 1991
Outright Price Differential Price to Forward Brent
Differential Price to Dated Quotations Differential Price to other North Sea
Differential Price to WTI Differential Price to Other
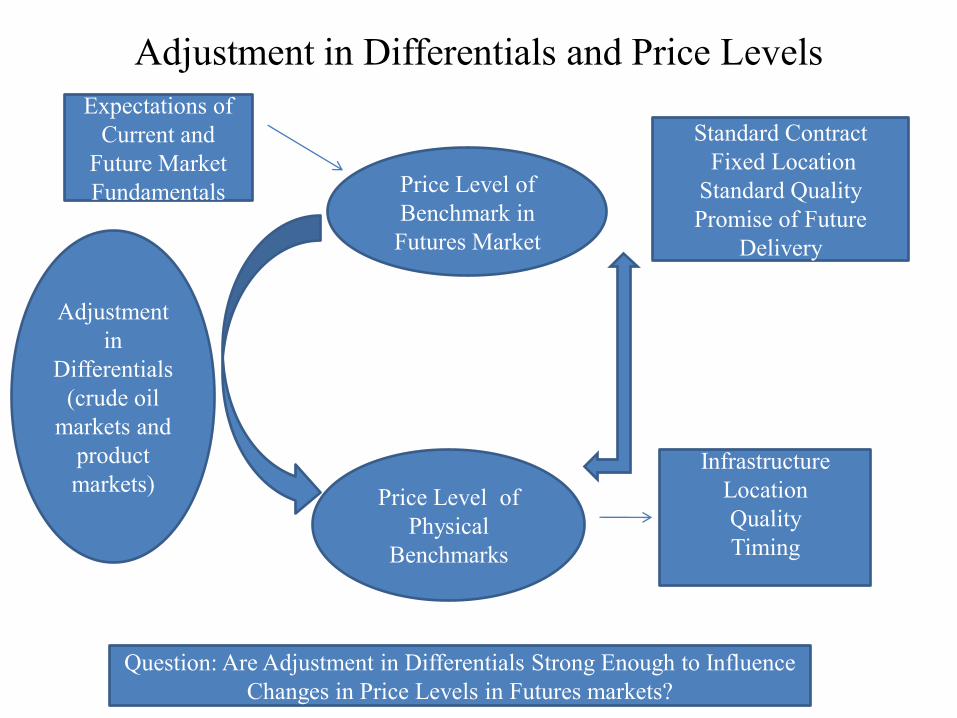
Adjustment in Differentials and Price Levels
Price Level of
Benchmark in
Futures Market
Standard Contract
Fixed Location
Standard Quality
Promise of Future
Delivery
Price Level of
Physical
Benchmarks
Adjustment
in
Differentials
(crude oil
markets and
product
markets)Infrastructure
Location
Quality
Timing
Expectations of
Current and
Future Market
Fundamentals
Question: Are Adjustment in Differentials Strong Enough to Influence
Changes in Price Levels in Futures markets?

But What Determines the Oil Price Level?
• The oil price can clear within a wide range– Very low cost floor for crude oil production in OPEC and a very high
price ceiling set by production in non-OPEC and substitutes & futures market participants‟ expectations
– Within this range feedbacks from both supply and demand side in response to oil price changes are uncertain but perceived to be limited
• Pricing system reflects structure of oil market and how it functions
• Thought current oil pricing system can generate a spot price and that reflects „true‟ current fundamentals flawed
• Possible to have situations in which there is a fundamental change in underlying physical fundamentals but the oil price level does not change
– Most of the adjustment will take place through differentials if market expects these changes to be temporary
• Possible to have change in expectations which will be reflected in physical benchmark without change in underlying fundamentals
• Changes in benchmark price reflect hedging pressures, expectations, and arbitrage between very efficient markets
• In turn influenced by how flow of information and public signals affect these expectations, and coordination games among market participants
Figure: The North Sea Dated differential to Ice Brent during the French Strike
Source: Argus Medial Ltd.
-1.8
-1.6
-1.4
-1.2
-1.0
-0.8
-0.6
-0.4
-0.2
0.0
0.2
01 Sep 11 Sep 21 Sep 01 Oct 11 Oct 21 Oct
$/b
l
French refinery
Strike officially
Ice Brent=0

Dislocation of Forward Curve in 2008
35.00
40.00
45.00
50.00
55.00
60.00
65.00
70.00
75.00
80.00
M1
M5
M9
M1
3
M1
7
M2
1
M2
5
M2
9
M3
3
M3
7
M4
1
M4
5
M4
9
M5
3
M5
7
M6
1
M6
5
M6
9
WTI Term Price Structure (December 2008, Monthly Average)
Price Movements in 2009
• 2009 represents a remarkable year in at least two respects
– Witnessed sharpest increase in spot oil prices in decades
• Recovery phase : WTI spot price rise from a very low base of $30.28 on 23 December 2008 to $79.39 on 31 December 2009, an increase of more than 160%
– In second half of 2009 it exhibited a high degree of relative stability despite a very uncertain and volatile global economic environment
• Stabilisation phase : Oil price oscillated within a relatively narrow price band between $60 and $70 between the months of July and September and then between $70 and $80 between the months of October and December

Current Fundamentals, Expectations and The Oil Price
• Underplay the weight of current oil market fundamentals, inventories, size of spare capacity and increase importance of future fundamentals
• Problem: Future fundamentals highly uncertain
– many unknown variables that can play an important role in shaping anticipations of these future fundamentals, many of which originate from outside the oil market
• But at what level should the price be set?
– There is a wide range of prices at which the market can clear
• The issue then is how does the market converge to one price and not another

Some signals more visible than others
Market players can coordinate on choosing a box without communicating with each
other
There is nothing special about the red box other than the fact that it helps players
coordinate their decisions
Such an equilibrium is known as the focal point

Convergence of Expectations
• Convergence of expectations provided a focal point– Consumers/producers/ industry/analysts: Too high or too low oil
prices can be damaging for industry– “Everyone is happy with the price”
• Provided a focal point in the market– Classic case of coordination
• Can market participants can converge on another price range– Higher or lower?– Depends on the underlying story
The Battle of the Stories
• “But what if stories themselves move markets? What if these stories of over-explanation have real effects? What if themselves are a real part of how the economy functions?...The stories no longer merely explain the facts; they are the facts”
Akerlof and Shiller; Animal Spirit, p.54
• Discourses of oil debate dominated by one view– Tight future market fundamentals, “likely return to oil
shortages”, energy crisis, etc... – Elements of the story
• Limited non-OPEC supply growth (peak oil, over-ground constraints)
• Limited investment and weak supply growth in OPEC countries (willingness, capability, geopolitical)
• Rapid growth in global oil demand fuelled by non-OECD countries
• Is there a strong alternative story?
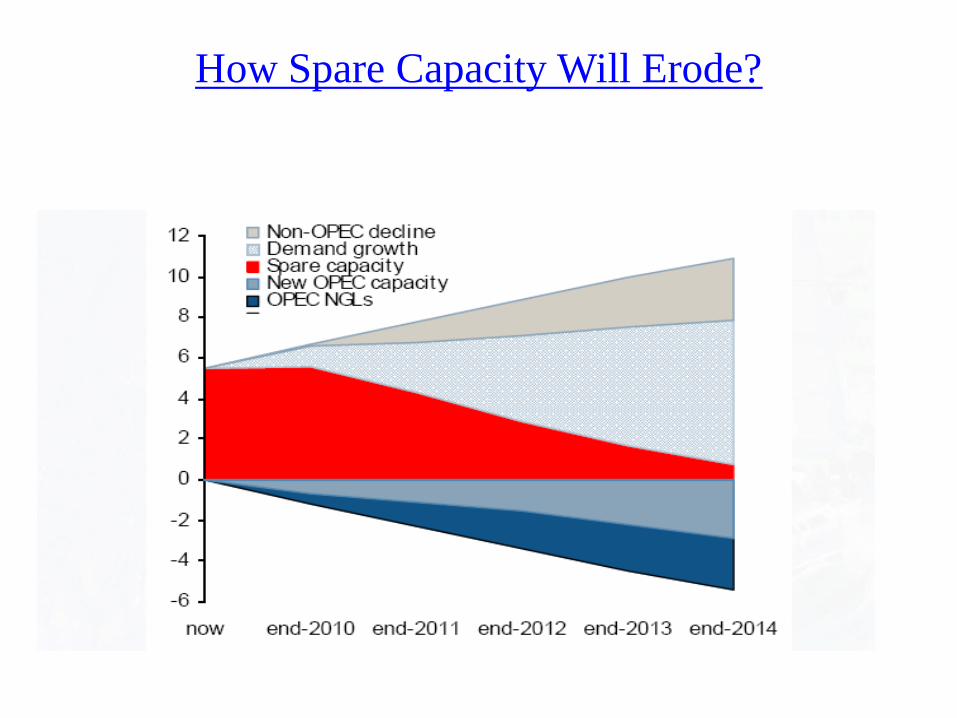
How Spare Capacity Will Erode?