
TESTS OF THE LAPCAT II SMALL SCALE FLIGHT …old.esaconferencebureau.com/Custom/15A01/Papers/Room...
8
TESTS OF THE LAPCAT II SMALL SCALE FLIGHT EXPERIMENT MODEL IN THE ONERA F4 WIND TUNNEL Viguier, P. (1) , Garraud, J. (1) , Soutade, J. (1) , Defoort, S. (2) , Ferrier, M. (2) , Steelant, J. (3) (1) ONERA Fauga-Mauzac centre, 31410 Mauzac France, Email: [email protected] (2) ONERA Palaiseau centre, ch. de la Hunière 91761 Palaiseau France, Email: [email protected] (3) ESA-ESTEC, Keplerlaan 1, 2200 AG Noordwijk, The Netherlands, Email: [email protected] ABSTRACT In the framework of the EU co-founded project LAPCAT II, a scramjet powered small scale flight experiment (SSFE) configuration was designed. Free jet ground testing of the complete integrated combustion flow path (intake, combustor and nozzle) of the SSFE engine was carried out in the F4 arc heated wind tunnel under Mach 8 flight conditions. Comparisons with fuel off and helium injection runs helped to characterize the combustion process. Different model angles of attack and sideslip angles were tested to analyse their effects on combustion. For each model set up, operating limits regarding the level of pressure required for ignition and the unstart conditions of the intake could be observed during the timeframe of a single run. 1. INTRODUCTION The European research project LAPCAT II investigated the technological foundations for high-speed cruise flight [1]. Scramjet propulsion is one of the best candidates to ensure an efficient cruise at hypersonic flight regime but research and development are needed to improve the understanding of such powered vehicles. The LAPCAT II Partners have studied different Mach 8 vehicles and selected one of them to derive a scaled design of an integrated forebody-intake, combustor and nozzle configuration [2][3][4]. This small scale configuration aimed at demonstrating a positive aero-propulsive balance of a scramjet powered vehicle in horizontal or semi-ballistic flight during a future follow-on project. As a first step, to prepare the flight experiment, free jet ground tests of a SSFE Model were performed in the Onera F4 and DLR HEG high enthalpy facilities. The wind tunnel model was scaled using the hypersonic similarity rules to match the wind tunnel test conditions. Intake, combustor and nozzle were re-designed according to the model size. The hydrogen injection system was optimized to ensure efficient mixing and combustion. Finally, nose-to-tail simulations were performed to verify that the model design led to a positive aero-propulsive balance. This paper describes the F4 wind tunnel test of the SSFE model. 2. F4 WIND TUNNEL F4 is the Onera hypersonic high enthalpy wind tunnel commissioned in the early 1990s for the ESA Hermes program and extensively used to test various re-entry vehicles, up to the last European demonstrator IXV, for both terrestrial and Martian atmosphere. Recently the range of operating conditions has been extended to the domain of scramjet powered vehicles at Mach 8 flight conditions and above [5], [6]. Fig. 1 presents a schematic and picture of the F4 wind tunnel. High enthalpy flows are obtained by heating the test gas with an intense electric arc in a chamber initially pressurized at ambient temperature. The energy is delivered by an impulse generator at a power of up to 150 MW for several tens of milliseconds. Initial filling pressure of the chamber, arc power and arc duration are adjusted to obtain the requested stagnation conditions. Pressure can be as high as 1000 bar and enthalpy as high as 18 MJ/kg at the end of the heating process. After the arc chamber conditions reach the desired levels, the arc is stopped and the pyrotechnic plug, providing the pneumatic separation between the arc chamber and the aerodynamic circuit, is ignited to initiate the nozzle flow. The flow being the result of the arc chamber expansion in the nozzle, the reservoir conditions decrease with time. When they fall below level of interest, the blown down is interrupted by firing a pyrotechnic valve in the arc chamber, quickly evacuating the remaining gas into a dump tank. During the test in F4 wind tunnel, test conditions and flow parameters are determined using both experimental and numerical tools. Results of computation to determine the non-measured parameters always rely on permanently measured data. The reservoir pressure, Pi, is directly measured in the arc chamber whereas the reservoir enthalpy, Hi, is deduced from test section reference probes measurements of stagnation heat flux and stagnation pressure using Vérant-Sagnier formula. Use of two pairs of reference probes gives an indication of core flow symmetry and allows measurement redundancy. The nozzle is instrumented with 19 pressure sensors and 16 thermocouples spread along the wall. Together with reference probes, this nozzle wall instrumentation is used for crosschecking with flow rebuilding on the basis of PNS (Parabolized Navier-Stokes) ONERA code
-
Upload
duongquynh -
Category
Documents
-
view
215 -
download
2
Transcript of TESTS OF THE LAPCAT II SMALL SCALE FLIGHT …old.esaconferencebureau.com/Custom/15A01/Papers/Room...
TESTS OF THE LAPCAT II SMALL SCALE FLIGHT EXPERIMENT MODEL IN THE ONERA F4 WIND TUNNEL
Viguier, P. (1), Garraud, J. (1), Soutade, J. (1), Defoort, S. (2), Ferrier, M. (2), Steelant, J. (3)
(1) ONERA Fauga-Mauzac centre, 31410 Mauzac France, Email: [email protected] (2) ONERA Palaiseau centre, ch. de la Hunière 91761 Palaiseau France, Email: [email protected]
(3) ESA-ESTEC, Keplerlaan 1, 2200 AG Noordwijk, The Netherlands, Email: [email protected]
ABSTRACT
In the framework of the EU co-founded project LAPCAT II, a scramjet powered small scale flight experiment (SSFE) configuration was designed. Free jet ground testing of the complete integrated combustion flow path (intake, combustor and nozzle) of the SSFE engine was carried out in the F4 arc heated wind tunnel under Mach 8 flight conditions. Comparisons with fuel off and helium injection runs helped to characterize the combustion process. Different model angles of attack and sideslip angles were tested to analyse their effects on combustion. For each model set up, operating limits regarding the level of pressure required for ignition and the unstart conditions of the intake could be observed during the timeframe of a single run. 1. INTRODUCTION
The European research project LAPCAT II investigated the technological foundations for high-speed cruise flight [1]. Scramjet propulsion is one of the best candidates to ensure an efficient cruise at hypersonic flight regime but research and development are needed to improve the understanding of such powered vehicles. The LAPCAT II Partners have studied different Mach 8 vehicles and selected one of them to derive a scaled design of an integrated forebody-intake, combustor and nozzle configuration [2][3][4]. This small scale configuration aimed at demonstrating a positive aero-propulsive balance of a scramjet powered vehicle in horizontal or semi-ballistic flight during a future follow-on project. As a first step, to prepare the flight experiment, free jet ground tests of a SSFE Model were performed in the Onera F4 and DLR HEG high enthalpy facilities. The wind tunnel model was scaled using the hypersonic similarity rules to match the wind tunnel test conditions. Intake, combustor and nozzle were re-designed according to the model size. The hydrogen injection system was optimized to ensure efficient mixing and combustion. Finally, nose-to-tail simulations were performed to verify that the model design led to a positive aero-propulsive balance. This paper describes the F4 wind tunnel test of the SSFE model.
2. F4 WIND TUNNEL
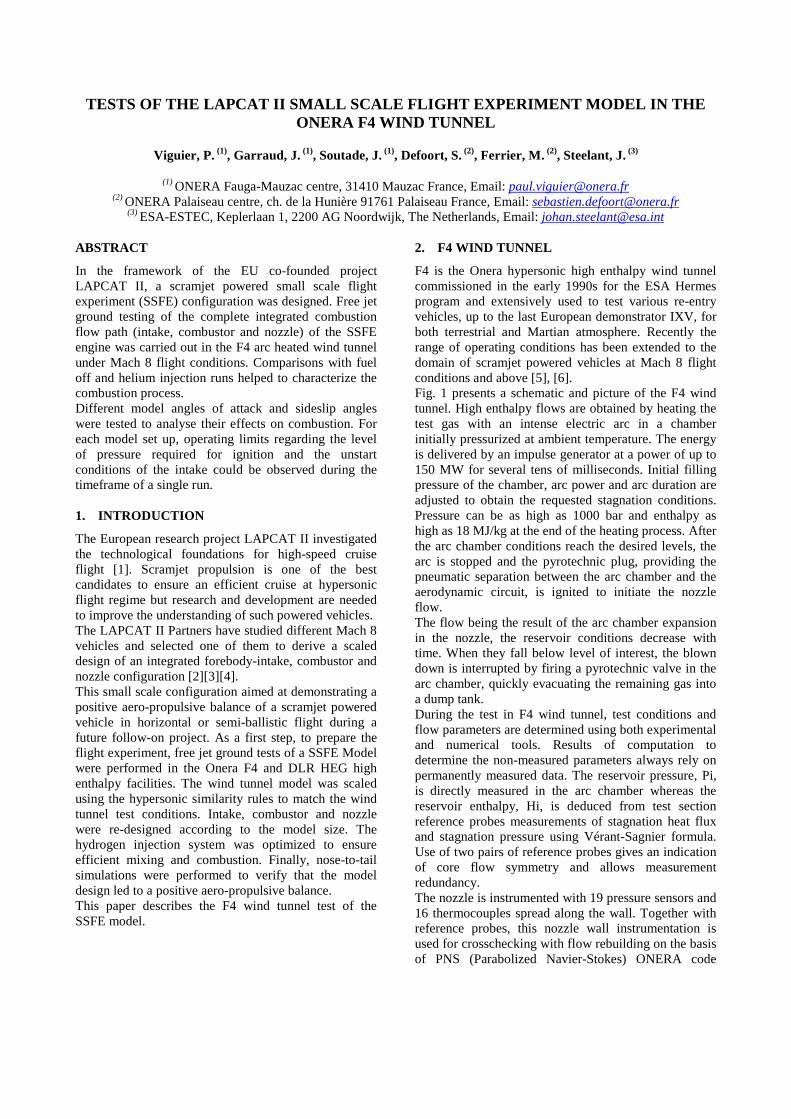
F4 is the Onera hypersonic high enthalpy wind tunnel commissioned in the early 1990s for the ESA Hermes program and extensively used to test various re-entry vehicles, up to the last European demonstrator IXV, for both terrestrial and Martian atmosphere. Recently the range of operating conditions has been extended to the domain of scramjet powered vehicles at Mach 8 flight conditions and above [5], [6]. Fig. 1 presents a schematic and picture of the F4 wind tunnel. High enthalpy flows are obtained by heating the test gas with an intense electric arc in a chamber initially pressurized at ambient temperature. The energy is delivered by an impulse generator at a power of up to 150 MW for several tens of milliseconds. Initial filling pressure of the chamber, arc power and arc duration are adjusted to obtain the requested stagnation conditions. Pressure can be as high as 1000 bar and enthalpy as high as 18 MJ/kg at the end of the heating process. After the arc chamber conditions reach the desired levels, the arc is stopped and the pyrotechnic plug, providing the pneumatic separation between the arc chamber and the aerodynamic circuit, is ignited to initiate the nozzle flow. The flow being the result of the arc chamber expansion in the nozzle, the reservoir conditions decrease with time. When they fall below level of interest, the blown down is interrupted by firing a pyrotechnic valve in the arc chamber, quickly evacuating the remaining gas into a dump tank. During the test in F4 wind tunnel, test conditions and flow parameters are determined using both experimental and numerical tools. Results of computation to determine the non-measured parameters always rely on permanently measured data. The reservoir pressure, Pi, is directly measured in the arc chamber whereas the reservoir enthalpy, Hi, is deduced from test section reference probes measurements of stagnation heat flux and stagnation pressure using Vérant-Sagnier formula. Use of two pairs of reference probes gives an indication of core flow symmetry and allows measurement redundancy. The nozzle is instrumented with 19 pressure sensors and 16 thermocouples spread along the wall. Together with reference probes, this nozzle wall instrumentation is used for crosschecking with flow rebuilding on the basis of PNS (Parabolized Navier-Stokes) ONERA code
PANASCE. These numerical simulations of the nozzle flow use a model of five species mixture of O2, N2, NO, N, O at thermo-chemical equilibrium. Laminar, transitional, or turbulent boundary layer hypothesis along the nozzle can be used.
Figure 1. F4 Wind Tunnel.
For the scramjet tests, the main part of the F4 contoured nozzle 2 is used together with a specific throat designed to obtain Mach 8 flow at moderate enthalpy. The core flow diameter of more than 400 mm gives the possibility to test reasonable size models. A fuel supply system has been recently implemented [5]. A main fuel storage located outside the facility feeds an intermediate storage box near the test section which includes independent accumulators to adjust the initial hydrogen volume used for the run. This volume and the initial filling pressure will be used to drive the evolution of the fuel mass flow during the run. Depending on the choice of the initial conditions, the fuel mass flow could be monitored to follow or not the decrease of the reservoir conditions during the run. This offers the possibility to choose different strategies for the equivalence ratio evolution, constant or different growth rates. 3. SSFE WIND TUNNEL MODEL
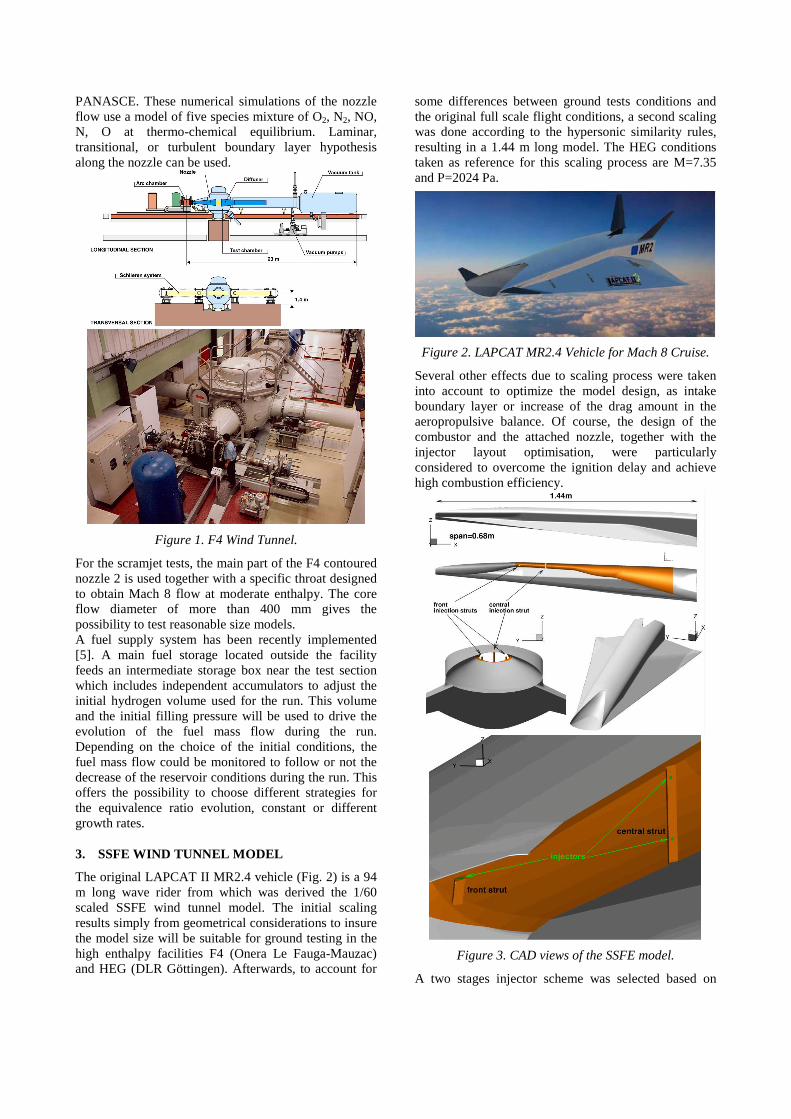
The original LAPCAT II MR2.4 vehicle (Fig. 2) is a 94 m long wave rider from which was derived the 1/60 scaled SSFE wind tunnel model. The initial scaling results simply from geometrical considerations to insure the model size will be suitable for ground testing in the high enthalpy facilities F4 (Onera Le Fauga-Mauzac) and HEG (DLR Göttingen). Afterwards, to account for
some differences between ground tests conditions and the original full scale flight conditions, a second scaling was done according to the hypersonic similarity rules, resulting in a 1.44 m long model. The HEG conditions taken as reference for this scaling process are M=7.35 and P=2024 Pa.
Figure 2. LAPCAT MR2.4 Vehicle for Mach 8 Cruise.
Several other effects due to scaling process were taken into account to optimize the model design, as intake boundary layer or increase of the drag amount in the aeropropulsive balance. Of course, the design of the combustor and the attached nozzle, together with the injector layout optimisation, were particularly considered to overcome the ignition delay and achieve high combustion efficiency.
Figure 3. CAD views of the SSFE model.
A two stages injector scheme was selected based on
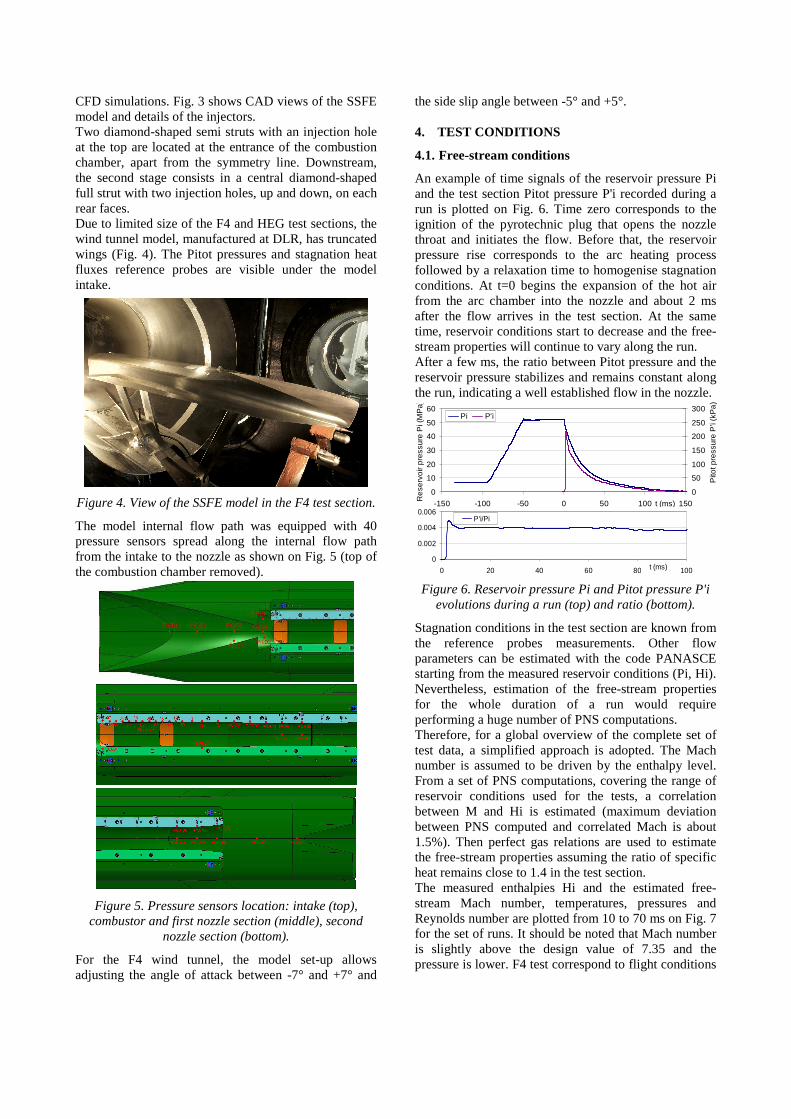
CFD simulations. Fig. 3 shows CAD views of the SSFE model and details of the injectors. Two diamond-shaped semi struts with an injection hole at the top are located at the entrance of the combustion chamber, apart from the symmetry line. Downstream, the second stage consists in a central diamond-shaped full strut with two injection holes, up and down, on each rear faces. Due to limited size of the F4 and HEG test sections, the wind tunnel model, manufactured at DLR, has truncated wings (Fig. 4). The Pitot pressures and stagnation heat fluxes reference probes are visible under the model intake.
Figure 4. View of the SSFE model in the F4 test section.
The model internal flow path was equipped with 40 pressure sensors spread along the internal flow path from the intake to the nozzle as shown on Fig. 5 (top of the combustion chamber removed).
Figure 5. Pressure sensors location: intake (top), combustor and first nozzle section (middle), second
nozzle section (bottom).
For the F4 wind tunnel, the model set-up allows adjusting the angle of attack between -7° and +7° and
the side slip angle between -5° and +5°. 4. TEST CONDITIONS
4.1. Free-stream conditions
An example of time signals of the reservoir pressure Pi and the test section Pitot pressure P'i recorded during a run is plotted on Fig. 6. Time zero corresponds to the ignition of the pyrotechnic plug that opens the nozzle throat and initiates the flow. Before that, the reservoir pressure rise corresponds to the arc heating process followed by a relaxation time to homogenise stagnation conditions. At t=0 begins the expansion of the hot air from the arc chamber into the nozzle and about 2 ms after the flow arrives in the test section. At the same time, reservoir conditions start to decrease and the free-stream properties will continue to vary along the run. After a few ms, the ratio between Pitot pressure and the reservoir pressure stabilizes and remains constant along the run, indicating a well established flow in the nozzle.
0
10
20
30
40
50
60
-150 -100 -50 0 50 100 150t (ms)
0
50
100
150
200
250
300
Pito
t pre
ssur
e P
'i (k
Pa
)
Pi P'iR
ese
rvo
ir pr
essu
re P
i (M
Pa
)
0
0.002
0.004
0.006
0 20 40 60 80 100t (ms)
P'i/Pi
Figure 6. Reservoir pressure Pi and Pitot pressure P'i evolutions during a run (top) and ratio (bottom).
Stagnation conditions in the test section are known from the reference probes measurements. Other flow parameters can be estimated with the code PANASCE starting from the measured reservoir conditions (Pi, Hi). Nevertheless, estimation of the free-stream properties for the whole duration of a run would require performing a huge number of PNS computations. Therefore, for a global overview of the complete set of test data, a simplified approach is adopted. The Mach number is assumed to be driven by the enthalpy level. From a set of PNS computations, covering the range of reservoir conditions used for the tests, a correlation between M and Hi is estimated (maximum deviation between PNS computed and correlated Mach is about 1.5%). Then perfect gas relations are used to estimate the free-stream properties assuming the ratio of specific heat remains close to 1.4 in the test section. The measured enthalpies Hi and the estimated free-stream Mach number, temperatures, pressures and Reynolds number are plotted from 10 to 70 ms on Fig. 7 for the set of runs. It should be noted that Mach number is slightly above the design value of 7.35 and the pressure is lower. F4 test correspond to flight conditions
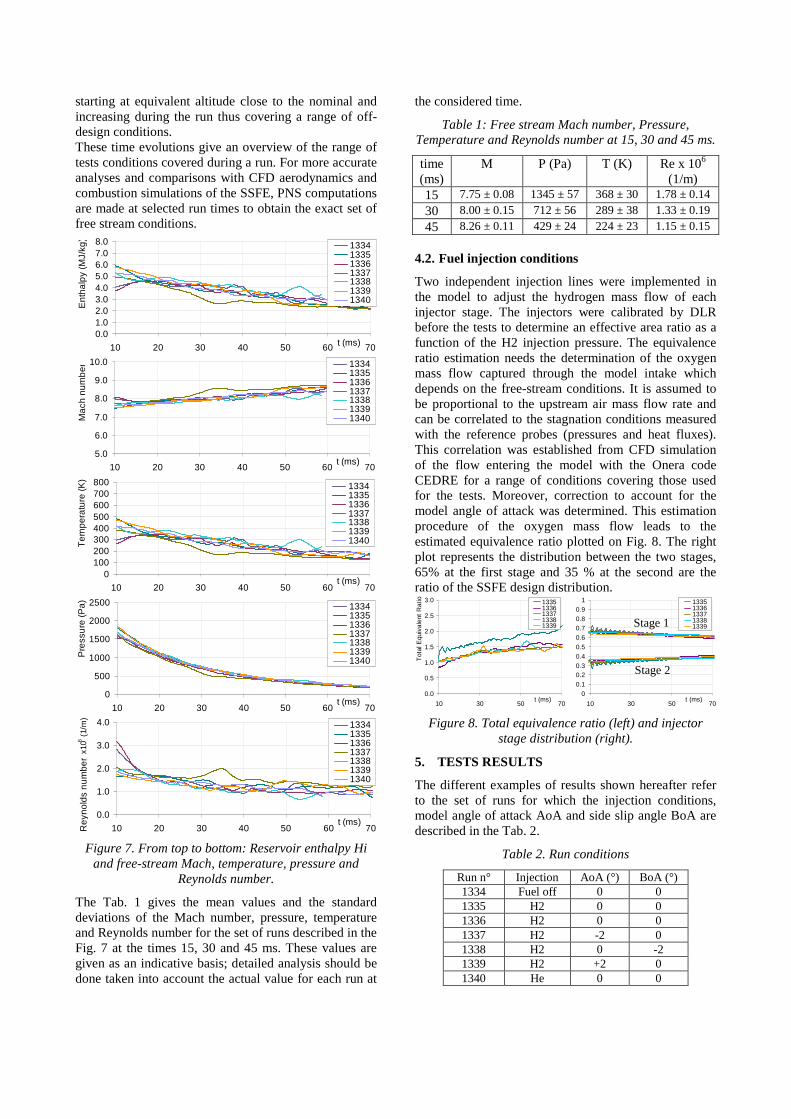
starting at equivalent altitude close to the nominal and increasing during the run thus covering a range of off-design conditions. These time evolutions give an overview of the range of tests conditions covered during a run. For more accurate analyses and comparisons with CFD aerodynamics and combustion simulations of the SSFE, PNS computations are made at selected run times to obtain the exact set of free stream conditions.
0
500
1000
1500
2000
2500
10 20 30 40 50 60 70t (ms)
Pre
ssu
re (P
a) 1334133513361337133813391340
0100200300400500600700800
10 20 30 40 50 60 70t (ms)
Tem
pera
ture
(K)
1334133513361337133813391340
0.01.02.03.04.05.06.07.08.0
10 20 30 40 50 60 70t (ms)
Ent
halp
y (M
J/kg
)
1334133513361337133813391340
0.0
1.0
2.0
3.0
4.0
10 20 30 40 50 60 70t (ms)
Rey
nold
s n
umbe
r
1334133513361337133813391340
x106 (
1/m
)
5.0
6.0
7.0
8.0
9.0
10.0
10 20 30 40 50 60 70t (ms)
Mac
h nu
mb
er 1334133513361337133813391340
Figure 7. From top to bottom: Reservoir enthalpy Hi and free-stream Mach, temperature, pressure and
Reynolds number.
The Tab. 1 gives the mean values and the standard deviations of the Mach number, pressure, temperature and Reynolds number for the set of runs described in the Fig. 7 at the times 15, 30 and 45 ms. These values are given as an indicative basis; detailed analysis should be done taken into account the actual value for each run at
the considered time.
Table 1: Free stream Mach number, Pressure, Temperature and Reynolds number at 15, 30 and 45 ms.
time (ms)
M P (Pa) T (K) Re x 106 (1/m)
15 7.75 ± 0.08 1345 ± 57 368 ± 30 1.78 ± 0.14
30 8.00 ± 0.15 712 ± 56 289 ± 38 1.33 ± 0.19
45 8.26 ± 0.11 429 ± 24 224 ± 23 1.15 ± 0.15
4.2. Fuel injection conditions
Two independent injection lines were implemented in the model to adjust the hydrogen mass flow of each injector stage. The injectors were calibrated by DLR before the tests to determine an effective area ratio as a function of the H2 injection pressure. The equivalence ratio estimation needs the determination of the oxygen mass flow captured through the model intake which depends on the free-stream conditions. It is assumed to be proportional to the upstream air mass flow rate and can be correlated to the stagnation conditions measured with the reference probes (pressures and heat fluxes). This correlation was established from CFD simulation of the flow entering the model with the Onera code CEDRE for a range of conditions covering those used for the tests. Moreover, correction to account for the model angle of attack was determined. This estimation procedure of the oxygen mass flow leads to the estimated equivalence ratio plotted on Fig. 8. The right plot represents the distribution between the two stages, 65% at the first stage and 35 % at the second are the ratio of the SSFE design distribution.
0.0
0.5
1.0
1.5
2.0
2.5
3.0
10 30 50 70t (ms)
Tot
al E
quiv
alen
t R
atio 1335
1336133713381339
00.10.20.30.40.50.60.70.80.9
1
10 30 50 70t (ms)
13351336133713381339
Figure 8. Total equivalence ratio (left) and injector stage distribution (right).
5. TESTS RESULTS
The different examples of results shown hereafter refer to the set of runs for which the injection conditions, model angle of attack AoA and side slip angle BoA are described in the Tab. 2.
Table 2. Run conditions
Run n° Injection AoA (°) BoA (°) 1334 Fuel off 0 0 1335 H2 0 0 1336 H2 0 0 1337 H2 -2 0 1338 H2 0 -2 1339 H2 +2 0 1340 He 0 0
Stage 1
Stage 2

5.1. Intake
The intake capacity to capture the free-stream air flow is the first condition to obtain a positive aero-propulsive balance for a scramjet powered vehicle. Moreover, optimisation process of cruise conditions should guarantees the robustness versus the off-design conditions. During all the runs, the intake started flawless as shown in Fig. 9 which presents time evolutions of intake pressures, normalized by the free-stream Pitot pressure, and associated Schlieren visualizations. PIC01 is the first pressure in the intake and PIC04 the fourth one just upstream the entrance of the combustion chamber (Fig. 5). The red dots on the 1335 pressure curves show the four instants that correspond to the Schlieren pictures.
0.00
0.05
0.10
0.15
0.20
0.25
0.30
0.35
10 30 50 70 90t (ms)
P/P
'i 1335 AoA=0° BoA=0°1336 AoA=0° BoA=0°1337 AoA=-2° BoA=0°1338 AoA=0° BoA=-2°1339 AoA=+2° BoA=0°
PIC04
PIC01
19.5 ms 45.5 ms
49.8 ms 60.6 ms
Leading edge shock Crotch shock
Bottom intake shock
Figure 9. Time signals of pressures PIC01 and PIC04 (top) and Schlieren pictures from run 1335 at 19.5,
45.5, 49.8 and 60.6 ms (bottom).
During the first part of a run, the normalized pressures stay nearly constant or vary slowly. Meanwhile, the shock pattern shown on the Schlieren pictures (19.5 and 45.5 ms) didn't change; the leading edge and the crotch shocks are well established and quite stable. Then suddenly, just before 50 ms for the run 1335, the PIC04 pressure raises rapidly, followed some milliseconds later by the PIC01 pressure. At the same time, the crotch
shock vanishes (49.8 ms) and moves upstream in the form of a train of diffuse waves. Finally, a new shock coming from the intake bottom appears, that curves the one coming from the leading edge. This shock, located upstream PIC01, stabilizes when the PIC01 pressure stops rising (61.6 ms). Pressure rise and crotch shock disappearance are most probably linked to a boundary layer separation leading to intake unstart as anticipated by CFD simulations once the Re number dropped well below the design value. The same phenomenon appears during all the runs. The time signals of the PIC04 pressure indicate some unsteadiness making it difficult to identify precisely the instant when the pressure rise starts and therefore the related free-stream conditions. Nevertheless, from pressure measurements and Schlieren visualizations, the intake was started for all conditions and remained started well beyond its design point. For all the runs with AoA ≥ 0°, the intake unstart initiates when the free-stream pressure level dropped to about 400±50 Pa, while M had increased to around 8.4±0.2. This corresponds to Re-numbers which have dropped around 1E+06 which are well below the design value. For AoA = -2° (run 1337), the compression induced from the leading edge increases locally the boundary layer edge values, and as such the local Re-number. This postpones the unstart till the free stream pressure level has lowered to 180 Pa with a corresponding M=9. Anyhow, all these cases indicate unstart flight conditions far away from the SSFE design conditions. The normalized pressure distribution along the started intake is shown on Fig. 10 for t=25 ms. The repeatability for the runs at AoA and BoA=0° is good and the effect of the AoA looks very consistent. The run 1338, done at -2° sideslip angle, shows only some flow asymmetry at the last pressure sensor.
0.00
0.05
0.10
0.15
0.20
0.25
0.30
0 100 200 300 400 500X (mm)
P/P
'i 1334 AoA=0° BoA=0°
1335 AoA=0° BoA=0°
1336 AoA=0° BoA=0°
1337 AoA=-2° BoA=0°
1338 AoA=0° BoA=-2°
1339 AoA=+2° BoA=0°
1340 AoA=0° BoA=0°
Figure 10. Intake normalized pressures at t = 25 ms.
5.2. Fuel off, fuel on, helium injection effects
The combustion chamber and the nozzle are equipped with pressure transducers to characterise the combustion process and provide experimental data for CFD codes validation. In addition to the combustion effect, the pressure level in the internal flow path depends on the geometry and the additional mass flow rate from the injected fuel. Three kinds of runs were done to
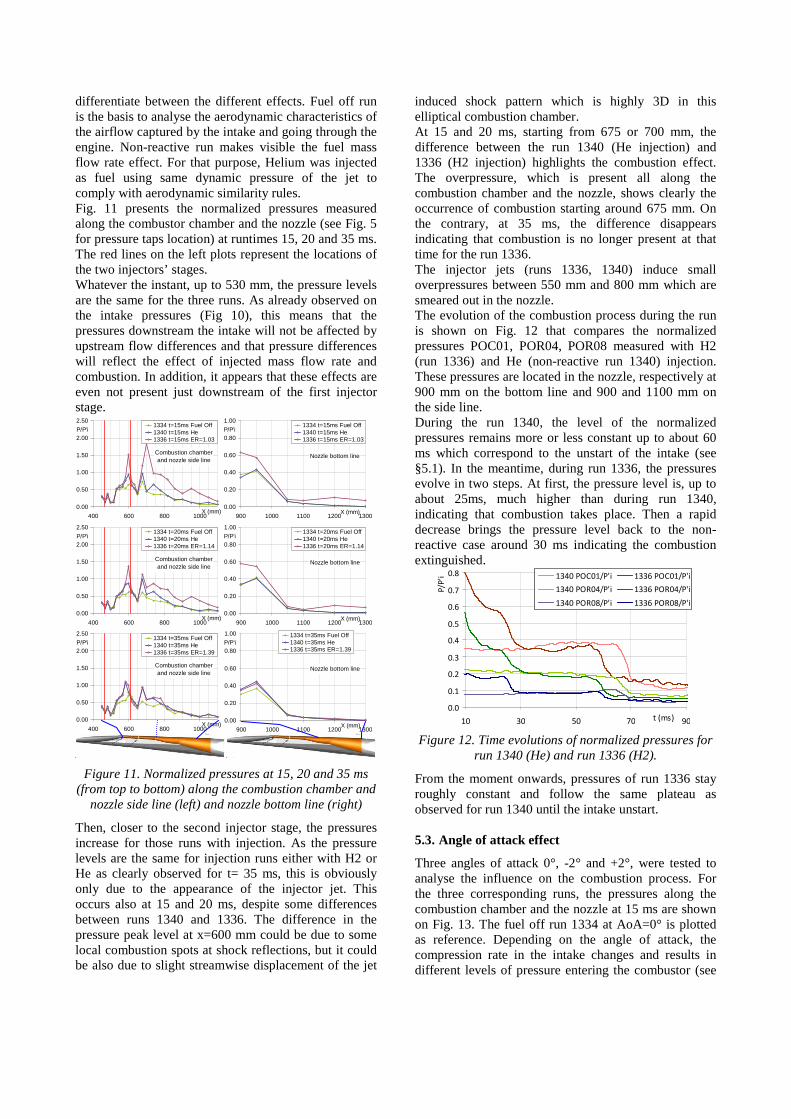
differentiate between the different effects. Fuel off run is the basis to analyse the aerodynamic characteristics of the airflow captured by the intake and going through the engine. Non-reactive run makes visible the fuel mass flow rate effect. For that purpose, Helium was injected as fuel using same dynamic pressure of the jet to comply with aerodynamic similarity rules. Fig. 11 presents the normalized pressures measured along the combustor chamber and the nozzle (see Fig. 5 for pressure taps location) at runtimes 15, 20 and 35 ms. The red lines on the left plots represent the locations of the two injectors’ stages. Whatever the instant, up to 530 mm, the pressure levels are the same for the three runs. As already observed on the intake pressures (Fig 10), this means that the pressures downstream the intake will not be affected by upstream flow differences and that pressure differences will reflect the effect of injected mass flow rate and combustion. In addition, it appears that these effects are even not present just downstream of the first injector stage.
Combustion chamberand nozzle side line
0.00
0.50
1.00
1.50
2.00
2.50
400 600 800 1000X (mm)
P/P'i1334 t=15ms Fuel Off1340 t=15ms He1336 t=15ms ER=1.03
Combustion chamberand nozzle side line
0.00
0.50
1.00
1.50
2.00
2.50
400 600 800 1000X (mm)
P/P'i1334 t=20ms Fuel Off1340 t=20ms He1336 t=20ms ER=1.14
Combustion chamberand nozzle side line
0.00
0.50
1.00
1.50
2.00
2.50
400 600 800 1000X (mm)
P/P'i1334 t=35ms Fuel Off1340 t=35ms He1336 t=35ms ER=1.39
Nozzle bottom line
0.00
0.20
0.40
0.60
0.80
1.00
900 1000 1100 1200 1300X (mm)
P/P'i1334 t=15ms Fuel Off1340 t=15ms He1336 t=15ms ER=1.03
Nozzle bottom line
0.00
0.20
0.40
0.60
0.80
1.00
900 1000 1100 1200 1300X (mm)
P/P'i1334 t=20ms Fuel Off1340 t=20ms He1336 t=20ms ER=1.14
Nozzle bottom line
0.00
0.20
0.40
0.60
0.80
1.00
900 1000 1100 1200 1300X (mm)
P/P'i1334 t=35ms Fuel Off1340 t=35ms He1336 t=35ms ER=1.39
Figure 11. Normalized pressures at 15, 20 and 35 ms (from top to bottom) along the combustion chamber and
nozzle side line (left) and nozzle bottom line (right)
Then, closer to the second injector stage, the pressures increase for those runs with injection. As the pressure levels are the same for injection runs either with H2 or He as clearly observed for t= 35 ms, this is obviously only due to the appearance of the injector jet. This occurs also at 15 and 20 ms, despite some differences between runs 1340 and 1336. The difference in the pressure peak level at x=600 mm could be due to some local combustion spots at shock reflections, but it could be also due to slight streamwise displacement of the jet
induced shock pattern which is highly 3D in this elliptical combustion chamber. At 15 and 20 ms, starting from 675 or 700 mm, the difference between the run 1340 (He injection) and 1336 (H2 injection) highlights the combustion effect. The overpressure, which is present all along the combustion chamber and the nozzle, shows clearly the occurrence of combustion starting around 675 mm. On the contrary, at 35 ms, the difference disappears indicating that combustion is no longer present at that time for the run 1336. The injector jets (runs 1336, 1340) induce small overpressures between 550 mm and 800 mm which are smeared out in the nozzle. The evolution of the combustion process during the run is shown on Fig. 12 that compares the normalized pressures POC01, POR04, POR08 measured with H2 (run 1336) and He (non-reactive run 1340) injection. These pressures are located in the nozzle, respectively at 900 mm on the bottom line and 900 and 1100 mm on the side line. During the run 1340, the level of the normalized pressures remains more or less constant up to about 60 ms which correspond to the unstart of the intake (see §5.1). In the meantime, during run 1336, the pressures evolve in two steps. At first, the pressure level is, up to about 25ms, much higher than during run 1340, indicating that combustion takes place. Then a rapid decrease brings the pressure level back to the non-reactive case around 30 ms indicating the combustion extinguished.
0.0
0.1
0.2
0.3
0.4
0.5
0.6
0.7
0.8
10 30 50 70 90t (ms)
P/P
'i 1340 POC01/P'i 1336 POC01/P'i
1340 POR04/P'i 1336 POR04/P'i
1340 POR08/P'i 1336 POR08/P'i
Figure 12. Time evolutions of normalized pressures for run 1340 (He) and run 1336 (H2).
From the moment onwards, pressures of run 1336 stay roughly constant and follow the same plateau as observed for run 1340 until the intake unstart. 5.3. Angle of attack effect
Three angles of attack 0°, -2° and +2°, were tested to analyse the influence on the combustion process. For the three corresponding runs, the pressures along the combustion chamber and the nozzle at 15 ms are shown on Fig. 13. The fuel off run 1334 at AoA=0° is plotted as reference. Depending on the angle of attack, the compression rate in the intake changes and results in different levels of pressure entering the combustor (see
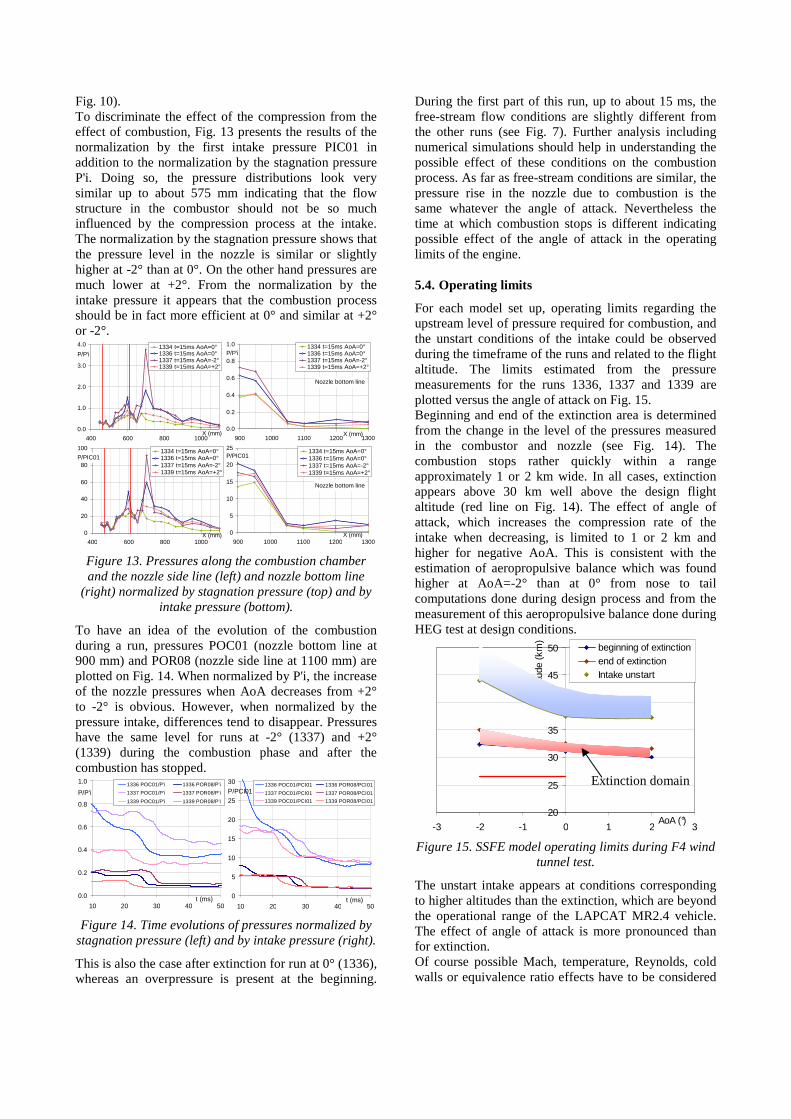
Fig. 10). To discriminate the effect of the compression from the effect of combustion, Fig. 13 presents the results of the normalization by the first intake pressure PIC01 in addition to the normalization by the stagnation pressure P'i. Doing so, the pressure distributions look very similar up to about 575 mm indicating that the flow structure in the combustor should not be so much influenced by the compression process at the intake. The normalization by the stagnation pressure shows that the pressure level in the nozzle is similar or slightly higher at -2° than at 0°. On the other hand pressures are much lower at +2°. From the normalization by the intake pressure it appears that the combustion process should be in fact more efficient at 0° and similar at +2° or -2°.
0.0
1.0
2.0
3.0
4.0
400 600 800 1000X (mm)
P/P'i1334 t=15ms AoA=0°1336 t=15ms AoA=0°1337 t=15ms AoA=-2°1339 t=15ms AoA=+2°
Nozzle bottom line
0.0
0.2
0.4
0.6
0.8
1.0
900 1000 1100 1200 1300X (mm)
P/P'i1334 t=15ms AoA=0°1336 t=15ms AoA=0°1337 t=15ms AoA=-2°1339 t=15ms AoA=+2°
0
20
40
60
80
100
400 600 800 1000X (mm)
P/PIC011334 t=15ms AoA=0°1336 t=15ms AoA=0°1337 t=15ms AoA=-2°1339 t=15ms AoA=+2°
Nozzle bottom line
0
5
10
15
20
25
900 1000 1100 1200 1300X (mm)
P/PIC011334 t=15ms AoA=0°1336 t=15ms AoA=0°1337 t=15ms AoA=-2°1339 t=15ms AoA=+2°
Figure 13. Pressures along the combustion chamber and the nozzle side line (left) and nozzle bottom line
(right) normalized by stagnation pressure (top) and by intake pressure (bottom).
To have an idea of the evolution of the combustion during a run, pressures POC01 (nozzle bottom line at 900 mm) and POR08 (nozzle side line at 1100 mm) are plotted on Fig. 14. When normalized by P'i, the increase of the nozzle pressures when AoA decreases from +2° to -2° is obvious. However, when normalized by the pressure intake, differences tend to disappear. Pressures have the same level for runs at -2° (1337) and +2° (1339) during the combustion phase and after the combustion has stopped.
0.0
0.2
0.4
0.6
0.8
1.0
10 20 30 40 50t (ms)
P/P'i1336 POC01/P'i 1336 POR08/P'i
1337 POC01/P'i 1337 POR08/P'i
1339 POC01/P'i 1339 POR08/P'i
0
5
10
15
20
25
30
10 20 30 40 50t (ms)
P/PCI011336 POC01/PCI01 1336 POR08/PCI01
1337 POC01/PCI01 1337 POR08/PCI01
1339 POC01/PCI01 1339 POR08/PCI01
Figure 14. Time evolutions of pressures normalized by stagnation pressure (left) and by intake pressure (right).
This is also the case after extinction for run at 0° (1336), whereas an overpressure is present at the beginning.
During the first part of this run, up to about 15 ms, the free-stream flow conditions are slightly different from the other runs (see Fig. 7). Further analysis including numerical simulations should help in understanding the possible effect of these conditions on the combustion process. As far as free-stream conditions are similar, the pressure rise in the nozzle due to combustion is the same whatever the angle of attack. Nevertheless the time at which combustion stops is different indicating possible effect of the angle of attack in the operating limits of the engine. 5.4. Operating limits
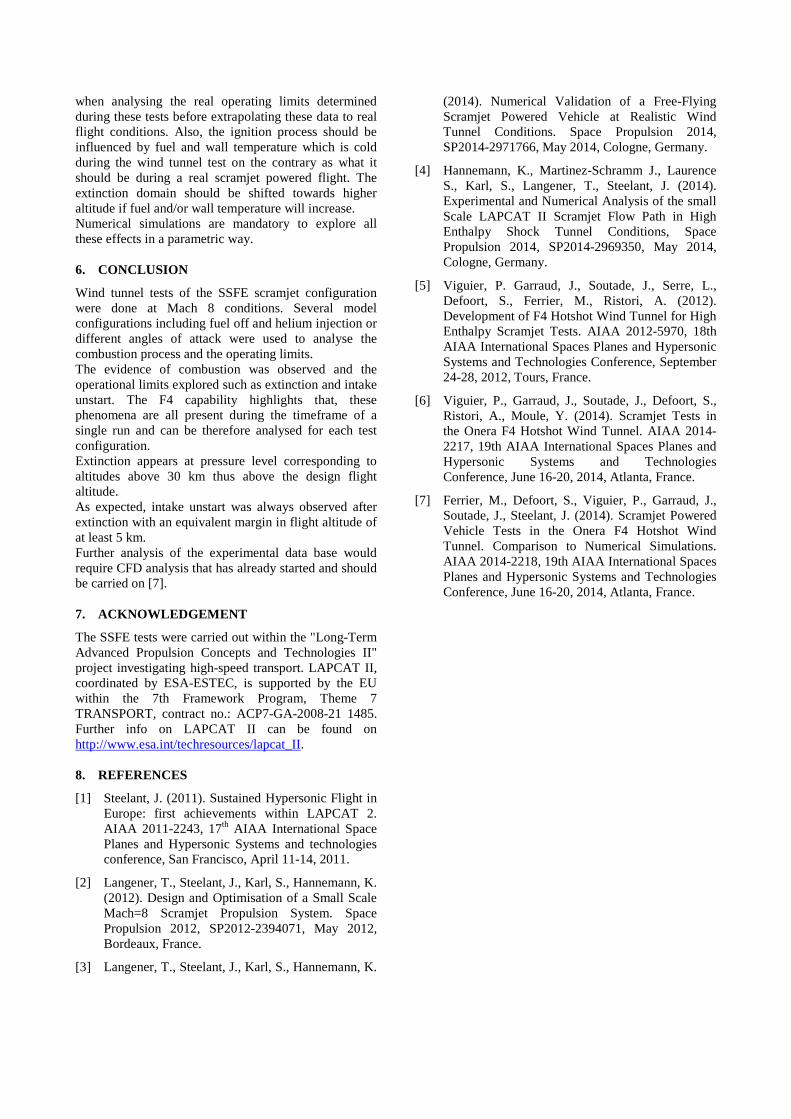
For each model set up, operating limits regarding the upstream level of pressure required for combustion, and the unstart conditions of the intake could be observed during the timeframe of the runs and related to the flight altitude. The limits estimated from the pressure measurements for the runs 1336, 1337 and 1339 are plotted versus the angle of attack on Fig. 15. Beginning and end of the extinction area is determined from the change in the level of the pressures measured in the combustor and nozzle (see Fig. 14). The combustion stops rather quickly within a range approximately 1 or 2 km wide. In all cases, extinction appears above 30 km well above the design flight altitude (red line on Fig. 14). The effect of angle of attack, which increases the compression rate of the intake when decreasing, is limited to 1 or 2 km and higher for negative AoA. This is consistent with the estimation of aeropropulsive balance which was found higher at AoA=-2° than at 0° from nose to tail computations done during design process and from the measurement of this aeropropulsive balance done during HEG test at design conditions.
20
25
30
35
40
45
50
-3 -2 -1 0 1 2 3AoA (°)
Alti
tude
(km
)
beginning of extinctionend of extinctionIntake unstart
Figure 15. SSFE model operating limits during F4 wind tunnel test.
The unstart intake appears at conditions corresponding to higher altitudes than the extinction, which are beyond the operational range of the LAPCAT MR2.4 vehicle. The effect of angle of attack is more pronounced than for extinction. Of course possible Mach, temperature, Reynolds, cold walls or equivalence ratio effects have to be considered
Extinction domain
when analysing the real operating limits determined during these tests before extrapolating these data to real flight conditions. Also, the ignition process should be influenced by fuel and wall temperature which is cold during the wind tunnel test on the contrary as what it should be during a real scramjet powered flight. The extinction domain should be shifted towards higher altitude if fuel and/or wall temperature will increase. Numerical simulations are mandatory to explore all these effects in a parametric way. 6. CONCLUSION
Wind tunnel tests of the SSFE scramjet configuration were done at Mach 8 conditions. Several model configurations including fuel off and helium injection or different angles of attack were used to analyse the combustion process and the operating limits. The evidence of combustion was observed and the operational limits explored such as extinction and intake unstart. The F4 capability highlights that, these phenomena are all present during the timeframe of a single run and can be therefore analysed for each test configuration. Extinction appears at pressure level corresponding to altitudes above 30 km thus above the design flight altitude. As expected, intake unstart was always observed after extinction with an equivalent margin in flight altitude of at least 5 km. Further analysis of the experimental data base would require CFD analysis that has already started and should be carried on [7]. 7. ACKNOWLEDGEMENT
The SSFE tests were carried out within the "Long-Term Advanced Propulsion Concepts and Technologies II" project investigating high-speed transport. LAPCAT II, coordinated by ESA-ESTEC, is supported by the EU within the 7th Framework Program, Theme 7 TRANSPORT, contract no.: ACP7-GA-2008-21 1485. Further info on LAPCAT II can be found on http://www.esa.int/techresources/lapcat_II. 8. REFERENCES
[1] Steelant, J. (2011). Sustained Hypersonic Flight in Europe: first achievements within LAPCAT 2. AIAA 2011-2243, 17th AIAA International Space Planes and Hypersonic Systems and technologies conference, San Francisco, April 11-14, 2011.
[2] Langener, T., Steelant, J., Karl, S., Hannemann, K. (2012). Design and Optimisation of a Small Scale Mach=8 Scramjet Propulsion System. Space Propulsion 2012, SP2012-2394071, May 2012, Bordeaux, France.
[3] Langener, T., Steelant, J., Karl, S., Hannemann, K.
(2014). Numerical Validation of a Free-Flying Scramjet Powered Vehicle at Realistic Wind Tunnel Conditions. Space Propulsion 2014, SP2014-2971766, May 2014, Cologne, Germany.
[4] Hannemann, K., Martinez-Schramm J., Laurence S., Karl, S., Langener, T., Steelant, J. (2014). Experimental and Numerical Analysis of the small Scale LAPCAT II Scramjet Flow Path in High Enthalpy Shock Tunnel Conditions, Space Propulsion 2014, SP2014-2969350, May 2014, Cologne, Germany.
[5] Viguier, P. Garraud, J., Soutade, J., Serre, L., Defoort, S., Ferrier, M., Ristori, A. (2012). Development of F4 Hotshot Wind Tunnel for High Enthalpy Scramjet Tests. AIAA 2012-5970, 18th AIAA International Spaces Planes and Hypersonic Systems and Technologies Conference, September 24-28, 2012, Tours, France.
[6] Viguier, P., Garraud, J., Soutade, J., Defoort, S., Ristori, A., Moule, Y. (2014). Scramjet Tests in the Onera F4 Hotshot Wind Tunnel. AIAA 2014-2217, 19th AIAA International Spaces Planes and Hypersonic Systems and Technologies Conference, June 16-20, 2014, Atlanta, France.
[7] Ferrier, M., Defoort, S., Viguier, P., Garraud, J., Soutade, J., Steelant, J. (2014). Scramjet Powered Vehicle Tests in the Onera F4 Hotshot Wind Tunnel. Comparison to Numerical Simulations. AIAA 2014-2218, 19th AIAA International Spaces Planes and Hypersonic Systems and Technologies Conference, June 16-20, 2014, Atlanta, France.