Support RAND For More Information Childhood Interventions Proven Results, Future Promise Lynn A....
201
This document and trademark(s) contained herein are protected by law as indicated in a notice appearing later in this work. This electronic representation of RAND intellectual property is provided for non- commercial use only. Permission is required from RAND to reproduce, or reuse in another form, any of our research documents. Limited Electronic Distribution Rights Visit RAND at www.rand.org Explore RAND Labor and Population View document details For More Information This PDF document was made available from www.rand.org as a public service of the RAND Corporation. 6 Jump down to document THE ARTS CHILD POLICY CIVIL JUSTICE EDUCATION ENERGY AND ENVIRONMENT HEALTH AND HEALTH CARE INTERNATIONAL AFFAIRS NATIONAL SECURITY POPULATION AND AGING PUBLIC SAFETY SCIENCE AND TECHNOLOGY SUBSTANCE ABUSE TERRORISM AND HOMELAND SECURITY TRANSPORTATION AND INFRASTRUCTURE WORKFORCE AND WORKPLACE The RAND Corporation is a nonprofit research organization providing objective analysis and effective solutions that address the challenges facing the public and private sectors around the world. Purchase this document Browse Books & Publications Make a charitable contribution Support RAND
Transcript of Support RAND For More Information Childhood Interventions Proven Results, Future Promise Lynn A....

This document and trademark(s) contained herein are protected by law as indicated in a notice appearing later in this work. This electronic representation of RAND intellectual property is provided for non-commercial use only. Permission is required from RAND to reproduce, or reuse in another form, any of our research documents.
Limited Electronic Distribution Rights
Visit RAND at www.rand.org
Explore RAND Labor and Population
View document details
For More Information
This PDF document was made available
from www.rand.org as a public service of
the RAND Corporation.
6Jump down to document
THE ARTS
CHILD POLICY
CIVIL JUSTICE
EDUCATION
ENERGY AND ENVIRONMENT
HEALTH AND HEALTH CARE
INTERNATIONAL AFFAIRS
NATIONAL SECURITY
POPULATION AND AGING
PUBLIC SAFETY
SCIENCE AND TECHNOLOGY
SUBSTANCE ABUSE
TERRORISM AND HOMELAND SECURITY
TRANSPORTATION ANDINFRASTRUCTURE
WORKFORCE AND WORKPLACE
The RAND Corporation is a nonprofit research organization providing objective analysis and effective solutions that address the challenges facing the public and private sectors around the world.
Purchase this document
Browse Books & Publications
Make a charitable contribution
Support RAND

This product is part of the RAND Corporation monograph series.
RAND monographs present major research findings that address the
challenges facing the public and private sectors. All RAND mono-
graphs undergo rigorous peer review to ensure high standards for
research quality and objectivity.

Early Childhood Interventions
Proven Results, Future Promise
Lynn A. Karoly
M. Rebecca Kilburn, Jill S. Cannon
Prepared forThe PNC Financial Services Group, Inc.

The RAND Corporation is a nonprofit research organization providing objective analysis and effective solutions that address the challenges facing the public and private sectors around the world. RAND’s publications do not necessarily reflect the opinions of its research clients and sponsors.
R® is a registered trademark.
© Copyright 2005 RAND Corporation
All rights reserved. No part of this book may be reproduced in any form by any electronic or mechanical means (including photocopying, recording, or information storage and retrieval) without permission in writing from RAND.
Published 2005 by the RAND Corporation1776 Main Street, P.O. Box 2138, Santa Monica, CA 90407-2138
1200 South Hayes Street, Arlington, VA 22202-5050201 North Craig Street, Suite 202, Pittsburgh, PA 15213-1516
RAND URL: http://www.rand.org/To order RAND documents or to obtain additional information, contact
Distribution Services: Telephone: (310) 451-7002; Fax: (310) 451-6915; Email: [email protected]
Library of Congress Cataloging-in-Publication Data
Karoly, Lynn A., 1961– Early childhood interventions : proven results, future promise / Lynn A. Karoly, M. Rebecca Kilburn, Jill S. Cannon. p. cm. “MG-341.” Includes bibliographical references. ISBN 0-8330-3836-2 (pbk. : alk. paper) 1. Children with social disabilities—Services for—United States. 2. Children with social disabilities—Services for—United States—Evaluation. 3. Child welfare—United States—Evaluation. 4. Early childhood education—United States. 5. Child care services—United States. 6. Public welfare—United States. I. Kilburn, M. Rebecca. II. Cannon, Jill S. III. Title.
HV741.K34 2005 362.7'0973—dc22
2005021586
Cover design by Stephen Bloodsworth
The research described in the report was conducted for The PNC Financial Services Group, Inc. by RAND Labor and Population, a division of the RAND Corporation.
iii
Preface
In September 2003, The PNC Financial Services Group, Inc.launched PNC Grow Up Great, a ten-year, $100-million program toimprove school readiness for children from birth to age 5. As part ofthis initiative, PNC asked the RAND Corporation to prepare a thor-ough, objective review and synthesis of current research that addressesthe potential for interventions of various forms in early childhood toimprove outcomes for participating children and their families. Inparticular, we consider
• the potential consequences of not investing additional resourcesin the lives of children—particularly disadvantaged children—prior to school entry
• the range of early intervention programs, focusing on those thathave been rigorously evaluated
• the demonstrated benefits of interventions with high-qualityevaluations and the features associated with successful programs
• the returns to society associated with investing early in the livesof disadvantaged children.
This study was conducted by RAND Labor and Population,building on prior RAND research examining the costs and benefits ofearly childhood programs. Funding for the project was provided byThe PNC Financial Services Group, Inc. The study should be of in-terest to decisionmakers throughout the United States in the private

iv Early Childhood Interventions: Proven Results, Future Promise
and public sectors who are considering investing resources in earlychildhood programs. The findings may also interest practitioners andadvocates in the early childhood field.
v
Contents
Preface ...................................................................... iiiFigures ...................................................................... ixTables.......................................................................xiSummary...................................................................xiiiAcknowledgments ........................................................xxixAbbreviations .............................................................xxxi
CHAPTER ONE
Introduction .................................................................1Disparities in Early Childhood and the Associated Consequences ..........6The Promise of Early Childhood Interventions ........................... 14
CHAPTER TWO
Strategies for Intervention ................................................ 19Theoretical Foundations of Early Childhood Intervention................ 20Strategies for Early Childhood Intervention............................... 21Strategies for Program Evaluation ......................................... 27Early Childhood Intervention Programs with Rigorous Evaluations and
Strong Evidence to Date............................................. 29Taxonomy of Selected Early Childhood Intervention Programs .......... 41
CHAPTER THREE
What Works in Early Childhood Intervention Programs................ 55Outcomes Improved by Early Childhood Intervention Programs ........ 56
Outcomes During the School-Age Years ............................... 56

vi Early Childhood Interventions: Proven Results, Future Promise
Outcomes in Adulthood ................................................ 61Magnitude of the Effects................................................... 63
Cognitive Outcomes for Younger Children ............................ 65Other Outcomes for School-Age Children ............................. 70Longer-Term Outcomes and Effects for Other Program
Participants........................................................... 74Features Associated with More-Effective Programs........................ 78
Studies of Program Characteristics ..................................... 79Analysis of Model Program Evaluations ................................ 82
CHAPTER FOUR
The Economics of Early Childhood Interventions ....................... 87Potential Economic Benefits of Early Childhood Interventions........... 88
Spillover Benefits and Beneficiaries..................................... 88The Use of Benefit-Cost Analysis....................................... 94
Benefit-Cost Studies of Early Childhood Interventions ................... 97Programs Analyzed and Methods Used................................. 98Results of Benefit-Cost Analyses.......................................108
Other Economic and Noneconomic Benefits of Early ChildhoodInterventions........................................................116
Labor Market Benefits .................................................116Macroeconomic Benefits...............................................117Noneconomic Benefits.................................................118
Strengths and Limitations of Economic Evidence........................119
CHAPTER FIVE
Conclusions...............................................................123
APPENDIX A
Descriptions of Early Childhood Intervention Programs Includedin the Study ..........................................................137

Contents vii
APPENDIX B
Methodology for the Analysis of Cognitive Outcomes inChapter Three .......................................................145
References.................................................................149


ix
Figures
2.1. Examples of Influences on Child Outcomes...................... 322.2. Taxonomy of Early Childhood Intervention Programs........... 503.1. Cognitive Outcome Effect Sizes Near or in Elementary
School............................................................. 66


xi
Tables
S.1. Early Childhood Intervention Programs Included in Study.....xviiiS.2. Measured Outcomes and Program Effects for Early
Childhood Intervention Evaluations—Child Outcomes..........xxS.3. Measured Outcomes and Program Effects for Early
Childhood Intervention Evaluations—Adult Outcomes ........ xxiiS.4. Benefit-Cost Results for Selected Early Childhood
Intervention Programs ...........................................xxvi1.1. Measures of School Readiness at Kindergarten Entry by
Family Characteristics...............................................92.1. Key Dimensions of Early Childhood Intervention Programs .... 242.2. Early Childhood Intervention Programs Included in Study...... 332.3. Features of the Evaluations for Selected Early Childhood
Intervention Programs ............................................ 352.4. Key Dimensions of Selected Early Childhood Intervention
Programs .......................................................... 423.1. Measured Outcomes and Program Effects for Early Childhood
Intervention Evaluations—Child Outcomes ..................... 583.2. Measured Outcomes and Program Effects for Early Childhood
Intervention Evaluations—Adult Outcomes ..................... 623.3. Achievement Test Effect Sizes for the Chicago CPC
Program........................................................... 683.4. Social and Behavioral Outcome Effect Sizes for Early Childhood
Intervention Programs ............................................ 713.5. Special Education Placement and Grade Retention Effect
Sizes for Early Childhood Intervention Programs ................ 73
xii Early Childhood Interventions: Proven Results, Future Promise
3.6. Long-Term Effects for Early Childhood InterventionPrograms .......................................................... 76
3.7. Mean Achievement Test Effect Size for CombinationPrograms and Parent Training Programs ......................... 85
4.1. Potential Spillover Benefits and Costs of Improved Outcomesfrom Early Childhood Intervention Programs.................... 90
4.2. Benefit-Cost Analyses of Early Childhood InterventionPrograms .......................................................... 99
4.3. Benefits (Costs) Included in Selected Benefit-Cost Studies ofEarly Childhood Intervention Programs.........................102
4.4. Benefit-Cost Results of Selected Early Childhood InterventionPrograms .........................................................109
A.1. Descriptions and Citations for Early Childhood InterventionPrograms Included in the Study .................................138
B.1. Data Used in Analysis of Cognitive Outcomes..................148

xiii
Summary
Parents, policymakers, business leaders, and the general public in-creasingly recognize the importance of the first few years in the life ofa child for promoting healthy physical, emotional, social, and intel-lectual development. Nonetheless, many children face deficienciesbetween ages 0 and 5 in terms of emotional support, intellectualstimulation, or access to resources—due to low income or lack ofhealth care, among other factors—that can impede their ability todevelop to their fullest potential. While intervention programs inearly childhood are of natural interest to the public sector, the privatesector is increasingly playing a role in advocating and effecting in-creased investments in early childhood.
The PNC Grow Up Great initiative is an example of the in-volvement of the business sector in early childhood investments. Thisinitiative, launched in September 2003 by The PNC Financial Serv-ices Group, Inc., is a ten-year, $100-million program to improveschool readiness for children from birth to age 5. The PNC initiativeencompasses several components, including investing in direct serv-ices to disadvantaged children, developing and disseminating infor-mation about child development and school readiness through televi-sion and print media, promoting employee volunteerism in programsserving children ages 0 to 5, supporting objective research on thecosts and benefits of early childhood programs, and advocating forincreased access to quality early childhood programs. PNC has part-nered with Sesame Workshop, the producers of Sesame Street, andFamily Communications, Inc., the producers of Mister Rogers’ Neigh-

xiv Early Childhood Interventions: Proven Results, Future Promise
borhood, to develop content for the initiative, and the entire effort isguided by a 12-member advisory council of experts in the early child-hood field. In the first year of the PNC Grow Up Great program,$950,000 in grants has been provided to selected early childhoodprograms, including Head Start centers and other early childhoodeducation organizations, in PNC’s service area (namely Delaware,Indiana, Kentucky, New Jersey, Ohio, and Pennsylvania).
As part of the PNC Grow Up Great initiative, PNC asked theRAND Corporation to prepare a thorough, objective review and syn-thesis of current research that addresses the potential for interventionsof various forms in early childhood to improve outcomes for partici-pating children and their families. In particular, as part of this study,we consider
• the potential consequences of not investing additional resourcesin the lives of children—particularly disadvantaged children—prior to school entry
• the range of early intervention programs, focusing on those thathave been rigorously evaluated
• the demonstrated benefits of interventions with high-qualityevaluations and the features associated with successful programs
• the returns to society associated with investing early in the livesof disadvantaged children.
Our approach to addressing these questions was to survey therelevant literature, identify the evidence that is scientifically sound,and provide an unbiased perspective on early childhood interventionsthat can inform decisionmaking on the part of the private and publicsectors. Our analysis considers a broad range of interventions imple-mented throughout the United States, even beyond the types of pro-grams currently supported by the PNC Grow Up Great initiative. Wehere summarize our conclusions.

Summary xv
The period from birth to age 5 is one of opportunity andvulnerability for healthy physical, emotional, social, andcognitive development.
Human development is the result of a complex interplay between ge-netic endowments and environmental conditions. Both nature andnurture—alone, and in interaction with one another—play key rolesthroughout the life course. Notably, the first few years of life are aparticularly sensitive period in the process of development, laying afoundation for cognitive functioning; behavioral, social, and self-regulatory capacities; and physical health in childhood and beyond.During these early years, a variety of factors are critical to healthy de-velopment. They include the nature of early relationships with care-givers, the extent of cognitive stimulation, and access to adequate nu-trition and health care. Some children will be resilient in the face ofvarious stressors in early childhood, while healthy development willbe compromised for others, with temporary or long-lasting effects.
A sizable fraction of children face risks that may limit theirdevelopment in the years before school entry.
Risks of developmental delay accrue from living in poverty, having asingle parent, and having a mother with less than a high school edu-cation, among other factors. Nearly half of a recent cohort of kinder-garten children in the United States examined as part of the U.S. De-partment of Education’s Early Childhood Longitudinal Study of theKindergarten Class of 1998–1999 (ECLS-K) faced at least one offour such risk factors. Nearly one in six was subject to more than one.Exposure to such risks does not necessarily lead to developmentalproblems. Some children are resilient, but for others, the conse-quences can be considerable.
Variations in early childhood experiences are manifested indisparities in school readiness, and these gaps often persist.
Disadvantages in early childhood have implications for how preparedchildren are when they enter school. School readiness includes notonly cognitive skills but also those associated with socialization, self-regulatory behavior, and learning approaches. Assessments for the

xvi Early Childhood Interventions: Proven Results, Future Promise
ECLS-K cohort indicate that children with more-disadvantagedbackgrounds enter school with lower levels of the knowledge and so-cial competencies that are important for subsequent school success.While these readiness measures indicate that children from more-enriched environments enter school better prepared, longitudinal datademonstrate that these early gaps persist and even widen as childrenprogress through school. Thus, because disadvantaged children donot advance at the same rate at their more advantaged peers,achievement gaps tend to widen over time. Children from disadvan-taged backgrounds also experience higher rates of special educationuse, grade repetition, and dropping out of high school. Lower rates ofschool achievement are in turn associated with unfavorable trajecto-ries in later years. The latter include such outcomes as low rates ofemployment, welfare dependency, and delinquency and crime. Evenif only a portion of these detrimental outcomes in childhood andadulthood can be averted, the benefits may be substantial.
Early childhood interventions are designed to counteract variousstressors in early childhood and promote healthy development.
Early childhood interventions are designed to provide a protectiveinfluence to compensate for the various risk factors that potentiallycompromise healthy child development in the years before school en-try. While they share a common objective, early childhood interven-tions are highly varied in their methods; there is no uniform model.Programs vary in the outcomes they aim to improve and in the riskfactors they consider for eligibility to participate, e.g., low socioeco-nomic status, single parenthood. They differ in whether they targetthe child, the parent, or both, and in the extent of individualized at-tention they provide. Different programs target children of differentages and vary in what kind of services they provide, where they pro-vide them, and for how many hours per week.
Rigorous evaluations of early childhood interventions can help usunderstand what outcomes they may improve.
Although we may expect early childhood programs to produce bene-ficial effects, a scientifically sound evaluation is required to know
Summary xvii
whether they fulfill their promise. The variation in early childhoodintervention approaches suggests that such evaluations are needed forthe full range of program models, ideally with the ability to ascertainthe effects of varying key program features.
The best evaluation designs are those that provide the highestconfidence that effects attributed to the program are indeed the resultof the intervention, rather than some other influential factor or fac-tors. Randomized experiments are ideal, but such designs are notalways feasible, so carefully designed and implemented quasi-experimental methods may suffice as an alternative.
While many early childhood interventions have been imple-mented, and a subset of those have been evaluated in some fashion,only a relatively small subset have been evaluated using scientificallysound methods. After reviewing the literature on studies of earlychildhood interventions that met our criteria for rigorous evaluation,we identified published evaluations for 20 early childhood programswith well-implemented experimental designs or strong quasi-experimental designs (see Table S.1 for a list of the programs groupedaccording to the types of services provided). In selecting these 20, weexcluded some programs because their evaluations did not meetminimum standards for scientific rigor (e.g., a large enough samplesize). Sixteen programs had the strongest evidence base in that theymeasure outcomes at the time of kindergarten entry or beyond. Theremaining four programs are labeled as having a promising evidencebase because, as of the last follow-up, many or all of the children wereas young as age 2 or 3, so there is less information as to the effect ofthe program on outcomes when the children are closer to the age ofschool entry or once the children have entered school.
Scientific research has demonstrated that early childhoodinterventions can improve the lives of participating childrenand families.
We examined the following benefit domains: cognition and academicachievement, behavioral and emotional competencies, educationalprogression and attainment, child maltreatment, health, delinquencyand crime, social welfare program use, and labor market success. For

xviii Early Childhood Interventions: Proven Results, Future Promise
Table S.1Early Childhood Intervention Programs Included in Study
Home Visiting or Parent Education
Nurse-Family Partnership (NFP)
Developmentally Supportive Care: Newborn Individualized Developmental Careand Assessment Program (DSC/NIDCAP)*
Parents as Teachers*
Project CARE (Carolina Approach to Responsive Education)—no early childhoodeducation
HIPPY (Home Instruction Program for Preschool Youngsters) USA
Reach Out and Read*
DARE to be You
Incredible Years
Home Visiting or Parent Education Combined with Early Childhood Education
Early Head Start*
Syracuse Family Development Research Program (FDRP)
Comprehensive Child Development Program (CCDP)
Infant Health and Development Program (IHDP)
Project CARE (Carolina Approach to Responsive Education)—with earlychildhood education
Carolina Abecedarian Project
Houston Parent-Child Development Center (PCDC)
Early Training Project (ETP)
High/Scope Perry Preschool Project
Chicago Child-Parent Centers (CPC)
Head Start
Early Childhood Education Only
Oklahoma Pre-K
NOTES: Programs marked with an asterisk are designated as having a promisingevidence base because a substantial number of children were as young as age 2or 3 at the time of the last follow-up. All other programs are designated as hav-ing a strong evidence base.

Summary xix
each of these domains (with the exception of social welfare programuse), statistically significant benefits were found in at least two-thirdsof the programs we reviewed that measured outcomes in that domain(see Tables S.2 and S.3). In some cases, the improved outcomes inthese domains were demonstrated soon after the program ended,while in other cases the favorable effects were observed through ado-lescence and in the transition to adulthood. In one case, lasting bene-fits were measured 35 years after the intervention ended. Eventhough there is evidence that early benefits in terms of cognition orschool achievement may eventually fade, the evidence indicates thatthere can be longer-lasting gains in educational progress and attain-ment, labor market outcomes, dependency, and pro-social behaviors.A few studies also indicate that the parents of participating childrencan also benefit from early intervention programs, particularly whenthey are specifically targeted by the intervention.
The magnitudes of the favorable effects can often be sizable. Thesize of the effects tend to be more modest for cognitive and behav-ioral measures, and, as noted, the favorable gains in these measuresoften shrink in size over time. The effects are more substantial andlong-lasting for outcomes such as special education placement andgrade retention, as well as some of the other outcomes in adolescenceand adulthood. At the same time, it is important to note that the im-proved outcomes realized by participants in targeted early interven-tion programs are typically not large enough to fully compensate forthe disadvantages those children face. Thus, while early interventionprograms can improve outcomes over what they otherwise wouldhave been, they typically do not fully close the gap between the dis-advantaged children they serve and their more advantaged peers.
While the evidence from the programs we review is compelling,it is important to note that these programs do not represent all earlychildhood programs or even the subset of effective programs. Moreo-ver, evidence of the effectiveness of a given program does not implythat all similar programs will have the same effect or even that

xx Early Childhood Interventions: Proven Results, Future Promise
Table S.2Measured Outcomes and Program Effects for Early Childhood InterventionEvaluations—Child Outcomes
Program
Domain
Cognitive/Achievement
Behavioral/Emotional
Home Visiting or Parent Education
NFP Achievementtest scores
Positivebehaviors
Child abuse Emergencyroom visits
Hospital days
Arrests
DSC/NIDCAPa
Mentalindices
Developmentaldelay
Reflexes
Weight gain
Hospital stays
Parents asTeachersa
Achievementtest scores
Positivebehaviors
Childmaltreatment
Child healthrating
Injuries
Project CARE (no ECE)
HIPPY USA Achievementtest scores
Reach Outand Reada
Vocabulary
DARE to beYou
Developmentallevel
Behaviorproblems
IncredibleYears
Behaviorproblems
Socialcompetence
Home Visiting or Parent Education Combined with Early Childhood Education
Early HeadStarta
Achievementtest scores
Positivebehaviors
Child healthrating
SyracuseFDRP
IQ Positivebehaviors
Grades (girls)
Attendance(girls)
Teacher ratings(girls)
CCDP
IHDP IQ
Achievementtest scores
Behaviorproblems
Project CARE(with ECE)
IQ
Abecedarian IQ
Achievementtest scores
Specialeducation
Graderetention
EducationalChild
Maltreatment
Health,Accidents,
and InjuriesCrime
RAND MG341-T-S.2a

Summary xxi
Table S.2—continued
HoustonPCDC
IQ
Achievementtest scores
Behaviorproblems
ETP IQ
Achievementtest scores
Specialeducation
Teenpregnancy
Specialeducation
Teenpregnancy
PerryPreschool
IQ
Achievementtest scores
Arrests
ChicagoCPC
Achievementtest scores
Socialcompetence
Specialeducation
Graderetention
Child abuse Delinquency
Head Start IQ
Achievementtest scores(mixed)
Graderetention
Immunizations
Otherpositive healthbehaviors
OklahomaPre-K
Achievementtest scores
SOURCE: Table 3.1.NOTES: See Table S.1 for full program names and Table 2.3 for program implementation dates and sample sizes.aAt the last follow-up, these programs measured outcomes for children as young as age 2 or 3.
Program
Domain
Cognitive/Achievement
Behavioral/Emotional
Home Visiting or Parent Education Combined with Early Childhood Education (continued)
EducationalChild
Maltreatment
Health,Accidents,
and InjuriesCrime
RAND MG341-T-S.2b
Early Childhood Education Only
Outcome measured and improvement in the listed indicator was statistically significantat the 0.05 level or better.
Outcome measured but difference was not statistically significant at the 0.05 levelor better.
Outcome not measured.

xxii Early Childhood Interventions: Proven Results, Future Promise
Table S.3Measured Outcomes and Program Effects for Early Childhood InterventionEvaluations—Adult Outcomes
Abecedarian Years of completedschooling
Ever attended four-yearcollege
Skilledemployment
ETP
Employment
EarningsIncome
Use of socialservices
PerryPreschool
High school graduation Arrests
Arrests for violentcrimes
Time in prison/jail
ChicagoCPC
High school graduation
Highest grade completed
Arrests
Arrests for violentcrimes
Head Start High school graduation(whites)
College attendance(whites)
Booked or chargedwith crime (blacks)
SOURCE: Table 3.2.NOTES: See Table S.1 for full program names and Table 2.3 for program implementation dates and sample sizes.
Program
Adult Outcome Domain
EducationalAttainment
Employmentand Earnings
Home Visiting or Parent Education Combined with Early Childhood Education
Social ServicesUse
Crime
RAND MG341-T-S.3
Outcome measured and improvement in the listed indicator was statistically significantat the 0.05 level or better.
Outcome measured but difference was not statistically significant at the 0.05 levelor better.
Outcome not measured.
the same program implemented under different conditions will havethe same effects. Ultimately, program effects may vary because of avariety of factors, including program design, the population served,and the local context in which a program is delivered.

Summary xxiii
A very limited evidence base points to several program features thatmay be associated with better outcomes for children: better-trainedcaregivers, smaller child-to-staff ratios, and greater intensity ofservices.
Based on experimental and quasi-experimental evaluations of pro-gram design features, as well as comparisons of effects across modelprograms, three features appear to be associated with more-effectiveinterventions. First, programs with better-trained caregivers appear tobe more effective. In the context of center-based programs, this maytake the form of a lead teacher with a college degree as opposed to nodegree. In the context of home visiting programs, researchers havefound stronger effects when services are provided by a trained nurseas opposed to a paraprofessional or lay professional home visitor. Sec-ond, in the context of center-based programs, there is evidence tosuggest that programs are more successful when they have smallerchild-to-staff ratios. Third, there is some evidence that more-intensiveprograms are associated with better outcomes, but not enough to in-dicate the optimal number of program hours and how they mightvary with child risk characteristics. One might expect that someminimum level of program hours is required for there to be any bene-fit but that, as hours increase, returns increase at a diminishing rate. Itis noteworthy that the features associated with more-successful pro-grams are costly. Thus, it appears that more money may need to bespent to obtain larger effects—at least up to a point.
The favorable effects of early childhood programs can translate intodollar benefits for the government, participants, and other membersof society..
Early childhood interventions may range in cost from modest to aconsiderable financial investment. It is therefore reasonable to askwhether the costs can be justified in terms of the benefits associatedwith the programs. Many of those benefits can be translated intodollar figures. For example, if school outcomes improve, fewer re-sources may be spent on remedial education services in the form ofrepeated grades or special education classes. If improvements inschool performance lead to higher educational attainment and subse-

xxiv Early Childhood Interventions: Proven Results, Future Promise
quent economic success in adulthood, the government may benefitfrom higher tax revenues and reduced outlays for social welfare pro-grams and the criminal justice system. As a result of improved eco-nomic outcomes, participants themselves benefit from higher lifetimeincomes, while other members of society gain from reduced levels ofdelinquency and crime. It should be kept in mind, however, thatsome of the improved outcomes associated with early childhood in-terventions cannot be readily translated into dollar benefits. That isthe case, for example, for cognitive development and behavioral im-provements.
Economic analyses of several early childhood interventions demon-strate that effective programs can repay the initial investment withsavings to government and benefits to society down the road.
One or more benefit-cost analyses have been conducted for seven ofthe 20 programs we studied. In addition, benefit-cost meta-analyseshave been conducted for home visiting programs serving at-risk chil-dren and for early childhood education programs serving low-incomethree- and four-year-olds. These studies employ accepted methods forbenefit-cost analysis based on the associated rigorous outcome evalua-tions. The results for these benefit-cost studies are summarized in Ta-ble S.4, with columns showing present-value costs and present-valuebenefits to society per child served, along with net benefits per child,and the benefit-cost ratio. In recognition of the differing follow-upperiods (shown in the second column), the results are presented infour panels based on the age of participants at the time of the lastfollow-up: the elementary school years, the secondary school years,early adulthood, and middle adulthood.
Because of differences in methodology—such as which benefitswere measured and monetized, the length of the follow-up period,and the projection of future benefits beyond the last age of follow-up—the benefit-cost results in Table S.4 are not strictly comparableacross early childhood interventions. Thus, while these results cannotidentify which programs have the “biggest bang for the buck,” theycan demonstrate whether, in principle, early childhood interventionprograms can generate benefits that outweigh the program costs.

Summary xxv
One of the seven individual programs evaluated (the Compre-hensive Child Development Program, or CCDP) was not shown tobe effective, so it could not generate net economic benefits. A secondprogram (the Infant Health and Development Program, or IHDP)had favorable effects as of the last follow-up at age 8, but the out-comes assessed could not be translated into dollar savings. For theremaining studies (including the meta-analyses), the estimates of netbenefits per child served range from about $1,400 per child to nearly$240,000 per child (see Table S.4). Viewed another way, the returnsto society for each dollar invested extend from $1.26 to $17.07. Posi-tive net benefits were found for programs that required a large in-vestment (over $40,000 per child), as well as those that cost consid-erably less (under $2,000 per child). Programs with per-child costs inthe middle of this range also generated positive net benefits. The eco-nomic returns were favorable for programs that focused on home vis-iting or parent education, as well as those that combined those serv-ices with early childhood education.
The largest benefit-cost ratios were associated with programswith longer-term follow-up (i.e., moving farther down Table S.4),because they allowed measurement at older ages of outcomes such aseducational attainment, delinquency and crime, earnings, and otheroutcomes that most readily translate into dollar benefits. Not only dothe studies with measured improvements based on long-term follow-up demonstrate that the benefits from early interventions can belong-lasting, they also give more confidence that the savings the pro-grams generate can be substantial. Programs with evaluations thathave followed children only until school entry or a few years beyondtypically do not measure those outcomes that are likely to be associ-ated with the largest dollar benefits, although they may eventuallygenerate large savings as well.
Because not all benefits from the interventions could be trans-lated into dollar values, our benefit-cost estimates for effective pro-grams are likely to be conservative. Moreover, such analyses do notincorporate some of the other benefits from effective early interven-tions. These could include improved labor market performance for

Table S.4Benefit-Cost Results for Selected Early Childhood Intervention Programs
Program TypeAge at LastFollow-Up
ProgramCosts perChild ($)
TotalBenefits toSociety per
Child ($)
NetBenefits toSociety per
Child ($)Benefit-Cost
Ratio
Follow-Up During Elementary School Years
CCDP Combo 5 37,388 –9 –37,397 —
HIPPY USA HV/PE 6 1,681 3,032 1,351 1.80
IHDP Combo 8 49,021 0 –49,021 —
Follow-Up During Secondary School Years
NFP—higher-risk sample HV/PE 15 7,271 41,419 34,148 5.70
NFP—lower-risk sample HV/PE 15 7,271 9,151 1,880 1.26
NFP—full sample HV/PE 15 9,118 26,298 17,180 2.88
HV for at-risk mothers and children(meta-analysis)
HV/PE Varies 4,892 10,969 6,077 2.24
xxvi Sum
mary
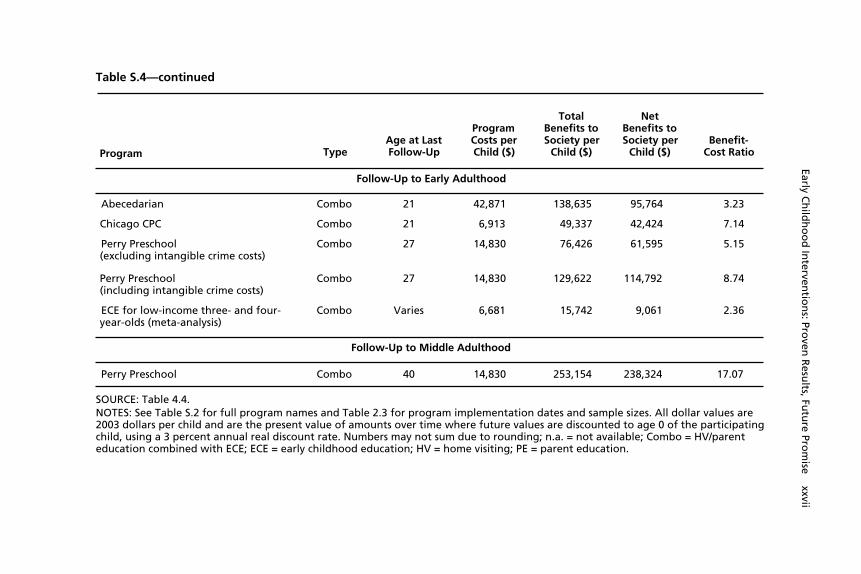
Table S.4—continued
Program TypeAge at LastFollow-Up
ProgramCosts perChild ($)
TotalBenefits toSociety per
Child ($)
NetBenefits toSociety per
Child ($)Benefit-
Cost Ratio
Follow-Up to Early Adulthood
Abecedarian Combo 21 42,871 138,635 95,764 3.23
Chicago CPC Combo 21 6,913 49,337 42,424 7.14
Perry Preschool(excluding intangible crime costs)
Combo 27 14,830 76,426 61,595 5.15
Perry Preschool(including intangible crime costs)
Combo 27 14,830 129,622 114,792 8.74
ECE for low-income three- and four-year-olds (meta-analysis)
Combo Varies 6,681 15,742 9,061 2.36
Follow-Up to Middle Adulthood
Perry Preschool Combo 40 14,830 253,154 238,324 17.07
SOURCE: Table 4.4.NOTES: See Table S.2 for full program names and Table 2.3 for program implementation dates and sample sizes. All dollar values are2003 dollars per child and are the present value of amounts over time where future values are discounted to age 0 of the participatingchild, using a 3 percent annual real discount rate. Numbers may not sum due to rounding; n.a. = not available; Combo = HV/parenteducation combined with ECE; ECE = early childhood education; HV = home visiting; PE = parent education.
Early Ch
ildh
oo
d In
terventio
ns: Pro
ven R
esults, Fu
ture Pro
mise xxvii
xxviii Early Childhood Interventions: Proven Results, Future Promise
the parents of participating children, as well as stronger national eco-nomic competitiveness as a result of improvements in educationalattainment of the future workforce.
The economic benefits of early childhood interventions are likely tobe greater for programs that effectively serve targeted, disadvan-taged children than for programs that serve lower-risk children.
There is some evidence that the economic returns from investing inearly intervention programs are larger when programs are effectivelytargeted. In the Nurse-Family Partnership home visiting program, theeffects were larger for a higher-risk sample of mothers (see Table S.4).Consequently, the return for each dollar invested was $5.70 for thehigher-risk population served but only $1.26 for the lower-riskpopulation. This finding indicates that it is not reasonable to expectthe returns we report for specific programs serving specific disadvan-taged populations to apply when the same program serves a differentpopulation. In particular, we would not expect to see the same re-turns in a universal program, e.g., a state-run preschool program opento all, although net benefits from such universal programs may still bepositive and the associated benefit-cost ratios may still exceed 1.
It is important to acknowledge that our conclusions rest on asolid, but still limited, evidence base. And that evidence base can al-ways be strengthened by further research and evaluation of earlychildhood intervention programs. Nevertheless, for decisionmakersconsidering investments in early childhood interventions, our find-ings indicate that a body of sound research exists that can guide re-source allocation decisions. This evidence base sheds light on thetypes of programs that have been demonstrated to be effective, thefeatures associated with effective programs, and the potential for re-turns to society that exceed the resources invested in program deliv-ery. These proven results signal the future promise of investing earlyin the lives of disadvantaged children.

xxix
Acknowledgments
We wish to thank the sponsors of this research, The PNC FinancialServices Group, Inc. In particular, we thank Eva Blum, SallyMcCrady, and James Rohr, who provided the motivation for this ef-fort and information about the PNC Grow Up Great initiative. Wealso benefited from the feedback provided by members of the PNCGrow Up Great Advisory Council.
Among our RAND colleagues, we are grateful for the researchassistance provided by Florencia Jaureguiberry, Arnab Mukherji, andJennifer Wong. We are indebted to Michael Stoto for generous statis-tical advice, including the use of specialized meta-analysis softwarethat enhanced the quantitative analysis. James Chiesa provided valu-able editorial assistance and wrote the summary, and Miriam Polon’sediting of the manuscript further improved our prose. We also appre-ciate the administrative assistance of Ruth Eagle-Winsick andMechelle Wilkins. The RAND Labor and Population review processemploys anonymous peer reviewers, including at least one reviewerwho is external to the RAND Corporation. In our case, the technicalreviews of the two anonymous reviewers greatly improved the exposi-tion and empirical components of the study.


xxxi
Abbreviations
CARE (Project) Carolina Approach to Responsive Education
CCDP Comprehensive Child Development Program
CED Committee for Economic Development
CPC (Chicago) Child-Parent Centers (program)
CPI-U Consumer Price Index for All Urban Consumers
DSC Developmentally Supportive Care (NIDCAP)
ECE early childhood education
ECLS-K Early Childhood Longitudinal Study—KindergartenClass of 1998–1999
ETP Early Training Project
FDRP (Syracuse) Family Development Research Program
GED General Educational Development test (high schoolequivalency)
HIPPY Home Instruction Program for Preschool Youngsters
HV home visiting
IHDP Infant Health and Development Program
IRR internal rate of return
NAEP National Assessment of Educational Progress
NFP Nurse-Family Partnership (program)
NIDCAP Newborn Individualized Developmental Care andAssessment Program

xxxii Early Childhood Interventions: Proven Results, Future Promise
PCDC (Houston) Parent-Child Development Center
PEIP Prenatal/Early Infancy Project
SES socioeconomic status

1
CHAPTER ONE
Introduction
Parents, policymakers, business leaders, and the general public in-creasingly recognize the importance of the first few years in the life ofa child for promoting healthy physical, emotional, social, and intel-lectual development. Whether the evidence comes from sophisticatedresearch by brain scientists or the simple observation of the develop-mental milestones of an infant, toddler, or preschooler, it is clear thatthe years prior to kindergarten entry represent a foundational periodfor ensuring children’s eventual success in school and beyond. An ex-plosion of recent research contributes to our understanding of thecomplex and dynamic ways that both nature and nurture—geneticsand the environment—operate together to shape the developingbrain and the resulting emotional, social, regulatory, moral, and in-tellectual capacities that emerge (Shonkoff and Phillips, 2000).
Nonetheless, many children face deficiencies between ages 0 and5 in terms of emotional support, intellectual stimulation, or access toresources—because of low income or lack of health care among otherfactors—that can impede their ability to develop to their fullest po-tential. Early childhood interventions—ranging from home visitingprograms in the first few years of life to high-quality center-based pre-school education in the year or two before kindergarten entry—havebeen created to counteract these stressors and provide young childrenand their families with needed supports. The enthusiasm on the partof the public and policymakers for such programs has led many statesand localities to devote increasing resources to early childhood initia-tives, especially those that have a proven record of improving chil-
2 Early Childhood Interventions: Proven Results, Future Promise
dren’s outcomes. These new efforts complement spending by the fed-eral government in support of disadvantaged families with youngchildren through programs that provide direct services, such as EarlyHead Start and Head Start, along with those that provide cash assis-tance and other resources through means-tested social welfare pro-grams.
While intervention programs in early childhood are of naturalinterest to parents and the public sector, the private sector is increas-ingly playing a role in advocating increased investments in earlychildhood. The involvement stems in part from the recognition thatthe quality of the future labor force, as well as the base of future con-sumers, depends upon the success of cohorts that are being born to-day. Businesses recognize the economic investment value of earlychildhood programs. For example, in 2002, the Committee for Eco-nomic Development (CED), an influential group of more than 250leaders in the business and education communities, released an analy-sis that endorsed universal access to high-quality preschool programsfor children ages 3 and 4 (CED, 2002). This support was echoed in areport issued a year later by two other prominent groups of businessleaders—the Business Roundtable and Corporate Voices for WorkingAmerica—which recommended expanding early childhood programsfor children ages 3 and 4 (Business Roundtable and Corporate Voicesfor Working Families, 2003). A number of private foundations alsohave initiatives promoting early childhood programs, including thePreschool for All initiative of the Packard Foundation and the sup-port for preschool education by the Pew Charitable Trusts.1
In other cases, high-profile leaders in the community have ledthe call to invest in early childhood programs. Rob Reiner and his“I Am Your Child” campaign played a key role in the passage ofProposition 10 in California (the California Children and FamiliesAct of 1998), now called the First 5 California initiative.2 The First 5____________1 For descriptions of these initiatives by Packard and Pew, see http://www.packard.org/index.cgi?page=cfc-upe and http://www.pewtrusts.com/ideas/index.cfm?issue=26, respectively.2 See http://www.ccfc.ca.gov.
Introduction 3
program, implemented within California’s 58 counties, provides arange of programs for families with children from birth to school en-try with funding from a dedicated sales tax on cigarettes. In 2002,David Lawrence, Jr., retired publisher of The Miami Herald, was amajor force behind a Florida ballot initiative that approved a consti-tutional amendment requiring the state to provide voluntary, high-quality preschool for all Florida four-year-olds.3
The PNC Grow Up Great initiative is an example of the in-volvement of the business sector in early childhood investments. Thisinitiative, launched in September 2003 by PNC Financial ServicesGroup, Inc., is a ten-year, $100-million program to improve schoolreadiness for children from birth to age 5.4 The PNC initiative en-compasses several components: investing in direct services to disad-vantaged children, developing and disseminating information aboutchild development and school readiness through television and printmedia, promoting employee volunteerism in programs serving chil-dren ages 0–5, supporting objective research on the costs and benefitsof early childhood programs, and advocating for increased access toquality early childhood programs.
In the first year of the PNC Grow Up Great program, $950,000in grants has been provided to selected early childhood programs, in-cluding 11 Head Start centers as well as other early childhood educa-tion organizations, in the bank’s service area (namely Delaware, Indi-ana, Kentucky, New Jersey, Ohio, and Pennsylvania). PNC Grow UpGreat has partnered with Sesame Workshop, the producers of SesameStreet, and Family Communications, Inc., the producers of MisterRogers’ Neighborhood, to underwrite new television programming forpreschoolers and distribute school readiness kits to families withyoung children. Public service announcements, Internet content, andads in print and other outlets highlight the importance of early child-hood opportunities for children, with messages designed to reach par-ents and caregivers, as well as general audiences in the public and pri-____________3 For details on the Florida program, see http://www.upkflorida.org.4 For further information on the initiative, see http://www.pncgrowupgreat.com.

4 Early Childhood Interventions: Proven Results, Future Promise
vate sectors. An online system has been developed to allow PNC’s24,000 employees to identify volunteer opportunities with earlychildhood programs, with the bank providing relevant training andother supports.5 In addition, PNC has supported research and otheroutreach activities to raise awareness of the need for and benefits fromaccess to high-quality early childhood programs and the opportunitiesfor supporting such programs through the public and private sectors.A 12-member advisory council of experts in the field of early child-hood provides critical guidance for the initiative.
As part of the PNC Grow Up Great initiative, PNC asked theRAND Corporation to prepare a thorough, objective review and syn-thesis of current research that addresses the potential for interventionsof various forms in early childhood to improve outcomes for partici-pating children and their families. In particular, as part of this study,we consider
• the potential consequences of not investing additional resourcesin the lives of children—particularly disadvantaged children—prior to school entry
• the range of early intervention programs, focusing on those thathave been rigorously evaluated
• the demonstrated benefits of interventions with high-qualityevaluations and the features associated with successful programs
• the returns to society associated with investing early in the livesof disadvantaged children.
Our approach to addressing these questions is to survey the rele-vant literature, identify the evidence that is scientifically sound, andprovide an unbiased perspective on early childhood interventions thatcan inform decisionmaking on the part of the private and public sec-tors. Our analysis considers a broad range of interventions imple-mented throughout the United States, even beyond the types of pro-grams currently supported by the PNC Grow Up Great initiative.____________5 PNC covers up to 40 hours of paid time off per year for such volunteer activities.

Introduction 5
Our analysis builds on a prior RAND study, Investing in OurChildren: What We Know and Don’t Know About the Costs and Bene-fits of Early Childhood Interventions (Karoly et al., 1998), which pro-vided a synthesis of ten early childhood intervention programs. Inthat study, we focused on the associated benefits for participatingchildren and families that had been demonstrated through rigorousprogram evaluation. For two of the ten programs, we were also ableto compare the costs of the program with the dollar value of the re-sulting benefits. As part of this study, we again draw on the researchliterature to update the list of programs we considered in Investing inOur Children. Based on new research that has emerged since our lastsynthesis, we examine a larger group of programs, both for the syn-thesis of program benefits and for the review of the economic returnsassociated with such programs.
Like RAND’s earlier study, our analysis focuses on early child-hood interventions that provide services to at-risk children and/ortheir families at some time during the period of early childhood—asearly as the prenatal period or as late as the year or two prior to kin-dergarten entry. We limit ourselves to programs that aim to improvechild cognitive or socioemotional development, perhaps as one ofseveral objectives, and that have been implemented and evaluated inthe United States since 1960. We do not cover programs that are de-signed primarily to promote children’s physical health, nor do wecover programs that primarily serve children with special needs.
To motivate our focus on early childhood interventions, in theremainder of this chapter, we call attention to the disparities in op-portunities and outcomes in early childhood and the associated con-sequences for school performance and success in adulthood. This dis-cussion highlights potential opportunities to intervene early in thelives of disadvantaged children to promote healthier physical, social,emotional, and cognitive development. The final section outlines theissues we address in the remaining chapters and provides a road mapfor the rest of the report.
6 Early Childhood Interventions: Proven Results, Future Promise
Disparities in Early Childhood and the AssociatedConsequences
While most children in the years before school entry experience asupportive home and neighborhood environment and have access tosufficient financial and nonfinancial resources to support healthy de-velopment and school readiness, many other children are not so for-tunate. Numerous indicators highlight the substantial differences inearly childhood experiences across children, differences that affecttheir initial school readiness, differences that persist as children age.Recent data from various sources illustrate some of these patterns ofearly disadvantage:
• Low birthweight affects a small but growing fraction of newborns.In 2003, 8 percent of births were classified as low birthweight(less than 2,500 grams), the highest fraction since the early1970s. Black non-Hispanic babies are twice as likely to be lowbirthweight as their white non-Hispanic counterparts (13.5 per-cent versus 7.0 percent). Low-birthweight babies are at risk ofdelayed motor and social development, and poor schoolachievement.6
• Preventive health care does not reach all young children. As of2002, 12 percent of children under age 2 had not had a well-child checkup in the past year. That fraction rises to 16 percentamong children ages 2 to 3 and to 18 percent for children ages 4to 5. Children who do not receive these checkups miss an op-portunity for health care providers to conduct developmentalscreenings and to encourage parental behaviors that promotehealthy child development.7
• Poverty in early childhood affects a sizable share of young children.The latest data from 2003 indicate that 20 percent of children
____________6 Data are from the National Center for Health Statistics as reported in Child Trends(2003).7 Data are from the National Health Interview Survey. See Child Trends and Center forHealth Research (2004), Chart 6-1.
Introduction 7
under age 6 (4.7 million children) live in families with incomebelow the poverty line ($18,660 for a family of four). The pov-erty rate is 53 percent among children under age 6 living in fe-male-headed households, 39 percent for African-American chil-dren, and 32 percent for Latino children. Poverty has beenshown to be particularly detrimental in early childhood in termsof children’s subsequent educational and other life-course out-comes (Haveman and Wolfe, 1995; Mayer, 1997; Duncan andBrooks-Gunn, 1997).8
• Neighborhood environments do not support healthy development formany young children. Data from the 2000 Census reveal that 22percent of children under age 5 lived in neighborhoods where20 percent or more of the population had income below thepoverty line. These neighborhoods of concentrated poverty pro-vide more limited opportunities in terms of social interaction,positive role models, and other resources important for earlychild development (e.g., quality child care, health facilities,parks and playgrounds).9
• Early literacy at home lags for some young children. Within fami-lies of three- to five-year-olds, 16 percent are not read to regu-larly (three or more times a week), and 26 percent are not regu-larly taught letters, words, or numbers. Just under half arefrequently told a story or taught songs or music. The differentialin reading is particularly striking by the level of mother’s educa-tion: 31 percent of children whose mothers have less than a highschool education are not read to regularly compared with 7 per-cent of those whose mothers have a college degree. These are allearly literacy-building activities associated with better schoolperformance in kindergarten and beyond (Snow, Burns, and
____________8 Data are from the 2004 Current Population Survey. See Child Trends and Center forChild Health Research (2004), Charts 9-3 and 9-4.9 See Child Trends and Center for Child Health Research (2004), Chart 7-1.

8 Early Childhood Interventions: Proven Results, Future Promise
Griffin, 1998; Burgess, Hecht, and Lonigan, 2002; U.S. De-partment of Education, 2003).10
These early indicators of disadvantage have implications for howprepared children are when they first enter school at kindergarten.While there is no single definition of school readiness, experts agreethat readiness is a multifaceted concept that goes beyond academicand cognitive skills to include physical, social, and emotional devel-opment, as well as approaches to learning (Vandivere et al., 2004).A series of assessments for a recent kindergarten cohort, examined aspart of the U.S. Department of Education’s nationally representativeEarly Childhood Longitudinal Study of the Kindergarten Class of1998–1999 (ECLS-K), indicate that disadvantaged children enterschool lagging their more advantaged peers in terms of the knowledgeand social competencies that are widely recognized as enabling chil-dren to perform at even the most basic level (West, Denton, andGermino-Hausken, 2000).
Table 1.1 shows the fraction of children with skills at variouslevels in print familiarity, reading, and mathematics at kindergartenentry, in total and for subgroups defined by mother’s education, fam-ily type, welfare receipt (an indicator of poverty status), and the pri-mary language spoken at home. For each measure, disadvantagedchildren—those whose mothers have less education, who live insingle-parent families, whose families have received welfare, and whodo not speak English at home—are less likely to demonstrate the in-dicated skill. For example, whereas 18 percent of children overall arenot familiar with basic conventions of print or writing (e.g., knowingthat English is read from left to right and top to bottom, or where astory ends), that fraction is 32 percent for children whose mothershave less than a high school education but only 8 percent for childrenwhose mothers have a college degree or higher. Similar patterns holdfor the other indicators of at-risk status. Substantial gaps are also evi-____________10 Data are for 2001 and based on the National Household Education Survey. See U.S. De-partment of Education (2003), Table 37-1.

Introduction 9
Table 1.1Measures of School Readiness at Kindergarten Entry by FamilyCharacteristics (percentage)
PrintFamiliarity
ReadingProficiency Level
MathematicsProficiency Level
0 Skillsa Firstb Secondc Secondd Thirde
Total 18 66 29 58 20
Mother’s educationLess than highschool
32 38 9 32 6
High school diplomaor equivalent
23 57 20 50 13
Some college 17 69 30 61 20Bachelor’s degreeor higher
8 86 50 79 37
Family typeSingle mother 26 53 18 44 11Single father 22 58 21 51 16Without parent 16 70 33 63 23
Welfare receiptUtilized AFDC 32 41 11 33 6Never utilized AFDC 17 69 31 61 22
Primary languagespoken at home
Not English 26 49 20 45 13English 18 67 30 59 21
SOURCE: West, Denton, and Germino-Hausken (2000), Tables 5, 6 and 7.NOTES: Estimates are based on first-time kindergarten children assessed in Eng-lish. Approximately 19 percent of Asian children and 30 percent of Hispanicchildren were not assessed.a Print familiarity measures three items: knowing that English is read from leftto right, is read from bottom to top, and where a reading passage ends. Thosewith no skills are not familiar with any of these concepts.b The first reading proficiency level measures recognition of upper and lowercase letters of the alphabet.c The second reading proficiency level measures phonological sensitivity at thesubword level, in this case knowledge of letter and sound relationships at thebeginning of words.d The second mathematics proficiency level measures reading numerals, count-ing beyond 10, sequencing patterns, and using nonstandard units of length tocompare objects.e The third mathematics proficiency level measures number sequence, readingtwo-digit numerals, identification of the ordinal position of an object, and solv-ing a word problem.

10 Early Childhood Interventions: Proven Results, Future Promise
dent in measures of reading and mathematics proficiency.11 On mostof these indicators, one of the sharpest contrasts from least-preparedto most-prepared is for children differentiated by mother’s educationlevel.
The ECLS-K also assessed pro-social behaviors, behavior prob-lems, and readiness to learn at kindergarten entry, based on responsesfrom both parents and teachers. While the majority of children ex-hibit positive behaviors such as forming friendships with classmates,and only a small minority are rated as having behavior problems suchas fighting or arguing with others or getting mad easily, disadvan-taged children are less likely to exhibit the positive behaviors andmore likely to exhibit the problem ones, according to both parentaland teacher reports. Similar patterns are evident for other outcomes,including fine and gross motor skills, measures of physical health, anddevelopmental difficulties (West, Denton, and Germino-Hausken,2000).
These measures of school readiness suggest that children frommore-enriched environments enter school better prepared. The longi-tudinal data from the ECLS-K and other data assessed by Heckmanand Masterov (2004) demonstrate that these early differences expandas children progress through school. In other words, because disad-vantaged children do not progress at the same rate as their more ad-vantaged peers, the achievement gap tends to widen over time. Forthe ECLS-K cohort, children with two or more family risk factors(mother’s education less than high school, single parent, income be-low the poverty line, and primary home language other than English)began with lower reading and mathematics achievement scores atkindergarten entry. By third grade, the at-risk children had gained 73points, on average, in reading achievement compared with 84 pointsfor children with none of the risk factors, thereby expanding the____________11 For mathematics proficiency, Table 1.1 records results starting at the second proficiencylevel because 94 percent of children attain the first proficiency level (measuring reading nu-merals, recognizing shapes, and counting to 10). See West, Denton, and Germino-Hausken(2000), Table 7.
Introduction 11
achievement gap. The differential in math gains was 57 points versus65 points. Using income to measure the level of advantage, Heckmanand Masterov (2004) use longitudinal data from the National Longi-tudinal Survey of Youth to demonstrate that the percentile ranks onmath achievement scores for children from the lowest income quartileand those from the highest income quartile widen between ages 6 and12.12 They also find a more modest growth in the gap across incomequartiles in the percentile rank for an antisocial behavior score.
The achievement gaps are also evident in national educationalassessments of student performance in terms of basic proficiency incore subjects. On average, 26 percent of 8th graders in 2003 scoredbelow the “basic” level of achievement in reading on the NationalAssessment of Educational Progress (NAEP), indicating they do nothave even partial mastery of the knowledge and skills “fundamentalfor proficient work” at that grade level. For children whose parentshave less than a high school education, the fraction scoring below thebasic achievement level was 45 percent, 26 percentage points higherthan that of their peers whose parents have graduated from college(for whom 19 percent score below basic achievement) (U.S. Depart-ment of Education, 2004b).13 The gap in mathematics proficiency atthe same grade level is even higher: Thirty-three percentage pointsseparate the students with the least-educated parents from those withthe most-educated (56 percent below the basic achievement level forstudents whose parents have less than a high school education versus23 percent whose parents are college graduates) (U.S. Department ofEducation, 2004a).14 These gaps are similar when students are com-____________12 Each income quartile captures 25 percent of the income distribution. Heckman and Mas-terov (2004) compute income quartiles based on average family income when the childrenare between ages 6 and 10.13 Parental education is the highest level of education for the most educated parent as re-ported by the student.14 The NAEP tests have been administered since 1990, so the trends in the fraction at thebasic level of proficiency can be tracked over time. These data show that there has been adecline since 1990 in the fraction scoring below basic on the eighth and twelfth grademathematics tests and the eighth grade reading test, but the share below basic has increasedover time for the twelfth grade reading test (Wirt et al., 2004).
12 Early Childhood Interventions: Proven Results, Future Promise
pared by parents’ education level at twelfth grade (Braswell et al.,2001; Grigg et al., 2003). The same pattern also holds when studentsare compared by a measure of the family’s economic status at eithereighth or twelfth grade (U.S. Department of Education, 2004a,2004b; Braswell et al., 2001; Grigg et al., 2003).15
Other manifestations of problems in school achievement includespecial education placement, grade repetition, and dropping out ofschool. In each case, the incidence of these outcomes is higher formore-disadvantaged children. For example, rates of special educationuse fall steadily as income rises, from 18 percent for children in fami-lies with less than $15,000 in annual income to 6 percent for those infamilies making $75,000 or more.16 Likewise, the incidence of everhaving been retained in a grade for young people ages 16 to 24 istwice as high among families with incomes in the bottom 20 percentof the income distribution compared with those in the top 20 percent(18 percent versus 9 percent).17 The chances of dropping out of highschool are also higher for at-risk youth, such as those in single-parentfamilies and those whose parents have less schooling themselves(Haveman and Wolfe, 1994).18
Ultimately, limited skills and low educational attainment in-crease the likelihood of undesirable outcomes in adulthood. Low edu-cational attainment is associated with reduced rates of employment,and with lower earnings when employed (Carneiro and Heckman,2003). Among high school dropouts ages 16 to 24, for example, 44percent are neither in school nor working, compared with 25 percent____________15 The NAEP tabulations also compare student outcomes based on whether or not they areeligible for a free or reduced price school lunch, an indicator of poverty status.16 These figures are for a sample of children ages 6 to 13 receiving special education duringthe 1999–2000 school year as reported in Wagner, Marder, and Blackorby (2002), Exhibit3-10.17 These figures are for 16- to 24-year-olds in 1995. See U.S. Department of Education(1997), Table 24.18 In terms of the overall incidence of dropping out, data from the Current Population Sur-vey in 2002 indicate that 13 percent of 18- to 24-year-olds, or 3.4 million young people, haddropped out of school without a high school diploma or equivalent (e.g., a GED). See U.S.Census Bureau (undated), Table A-5.
Introduction 13
of high school graduates and 9 percent of college graduates at thesame ages.19 While some of these youth are looking for work andsome of the young women are at home caring for children, many areidle. Use of social welfare programs is also higher among those withlow educational attainment, as are crime rates. Among young adultsages 24 to 26, rates of participation in welfare in 2001 were about 1.5times as high for high school dropouts as for high school graduates(7.4 percent versus 4.9 percent) and over 6 times as high for dropoutsas for those who obtained some college education or more (7.4 per-cent versus 1.2 percent).20 Likewise, estimates by Lochner andMoretti (2004) indicate a strong negative relationship between crimeand educational attainment, a relationship that holds after adjustingfor factors that could generate a spurious correlation.
These adverse outcomes during childhood and adulthood haveconsequences that extend beyond the lost potential (near- and long-term) for the affected children. Government outlays are higher as aresult of higher special education costs, greater participation in socialwelfare programs, and higher rates of crime and delinquency. Gov-ernment revenues and economic growth rates are lower as a result oflost employment and earnings potential. These economic costs can besizable, especially when they are considered in the context of the fulllife course. Estimates by Cohen (1988), for instance, indicate that ahigh school dropout costs society $243,000 to $388,000 in present-value dollars over his or her lifetime, while a typical career criminalgenerates $1.3 to $1.5 million in present-value societal costs.21
Data such as those cited above point to a number of identifiabledemographic and socioeconomic factors that put children at risk ofpoor developmental outcomes in early childhood and eventually poor____________19 See Wirt et al. (2004), Table 13-1.20 Based on data from the 2002 Current Population Survey as reported in Brown, Moore,and Bzostek (2003), Table 16. The education differentials are similar for receipt of foodstamps.21 Present-value amounts are the sum of future dollar values where future values are dis-counted to the present at a constant annual rate. Such discounting recognizes that a dollar ofbenefits in the future is worth less than a dollar of benefits today.

14 Early Childhood Interventions: Proven Results, Future Promise
school performance. Among those identified in the literature are liv-ing in poverty or welfare dependency, living in a single-parent house-hold, having a mother with less than a high school education, andhaving parents who speak a language other than English at home (of-ten termed “a linguistically isolated household”) (Snow, Burns, andGriffin, 1998; Zill and West, 2001; Vandivere et al., 2004). Evencontrolling for these factors, some studies indicate that being in a mi-nority race or ethnic group is an independent risk factor, along withbeing younger at the time of school entry (West, Denton, andGermino-Hausken, 2000).
The share of children at risk is not trivial. For the same ECLS-Kcohort referenced above, 31 percent have one of the first four risk fac-tors listed in the preceding paragraph, while an additional 16 percenthave two or more risk factors (Zill and West, 2001). Within largecities (population over 250,000), exposure to multiple risk factorsrises to 26 percent. Multiple risk factors, using the same four factors,are most prevalent among Latino children and African-Americanchildren (33 percent and 27 percent, respectively), compared withAsian (17 percent) or white children (6 percent). Children with mul-tiple risk factors, on average, are most likely to experience develop-mental difficulties in early childhood along with poor educationaloutcomes after they enter school, although there will always be resil-ient children who do well despite various disadvantages.
The Promise of Early Childhood Interventions
The logic of early intervention is to compensate for the various fac-tors that place children at risk of poor outcomes, with additional sup-ports for the parents, children, or family as a unit that can affect achild directly through structured experiences or indirectly by en-hancing the caregiving environment (Shonkoff and Phillips, 2000). Iflearning begets learning, then interventions at younger ages have thepotential to generate cumulative benefits by altering a child’s devel-opmental trajectory (Heckman, 2000; Heckman and Masterov,2004). We can now identify many of the factors that place substantial
Introduction 15
numbers of children at risk of poor performance in school and be-yond, and we know that the consequences for these children whilethey are young and when they reach adulthood are significant forthem and the rest of society. It is thus reasonable to ask whether it ispossible to intervene early in the lives of children to improve theirdevelopmental trajectory and how much early intervention can im-prove outcomes. A related issue is whether the resources devoted toearly childhood interventions are repaid over time through savings ingovernment spending, higher government revenues, or benefits toprogram participants or other members of society.
To identify whether the promise of early childhood interven-tions can be realized, we are interested in answering the followingquestions:
• What is the range of strategies for intervening early in the livesof disadvantaged children?
• For programs that have strong scientific evaluations, what out-comes for participating children and their families are affected?How large are the effects, and what characteristics are associatedwith successful programs?
• Are the dollar costs associated with early childhood programsoutweighed by the dollar value of future benefits?
We address these questions in the remainder of the report.In the next chapter, we turn our attention to the range of strate-
gies early childhood interventions use for counteracting the stressorschildren and families face in the first few years of life. We highlightkey dimensions along which early childhood intervention programsvary and identify a subset of programs that meet our criteria for rig-orous evaluation of program effects. We identify 16 programs withscientifically sound evidence concerning program effects that alsomeasure those effects as of kindergarten entry or beyond. These pro-grams provide the strongest evidence base from which to judge thebenefits of early childhood interventions for school readiness, andwhen follow-up periods are long enough, for later success in schooland in adulthood. Another four programs meet our evaluation crite-

16 Early Childhood Interventions: Proven Results, Future Promise
ria; however, because they have shorter follow-up periods, we catego-rize them as providing a more limited but still promising evidencebase.
We focus on the effects of early childhood interventions in thethird chapter, relying on the research evaluations for the 20 programswith a strong or promising evidence base. We take a closer look at thetypes of outcomes that these programs affect and discuss the relativemagnitudes of these effects. We also review the evidence on what fea-tures of early childhood intervention programs are associated withbetter outcomes and undertake our own meta-analysis to examinewhether program effects vary by intervention features across the pro-grams we review.
In the fourth chapter, we examine the economic case for invest-ing in early childhood programs. For some people, it may be suffi-cient to show that early childhood interventions improve the lives ofparticipating children and families along the lines reviewed in Chap-ter Three. Others may want to be assured that these programs—aform of investment in children—can pay back their program coststhrough the dollar value of future benefits, where those benefits mayaccrue to the participants themselves, the government, or societymore generally. Thus, in Chapter Four we consider the range of spill-over benefits that early childhood programs may generate for variousstakeholders, and review the evidence from benefit-cost studies avail-able for a subset of the programs we examined in Chapters Two andThree. We also highlight some of the other potential economic andnoneconomic benefits from early childhood programs that are typi-cally not captured in benefit-cost analyses.
In the final chapter, we provide a summary of the key findingsfrom our analysis with an enumeration of ten conclusions that pertainto the factors placing children at risk in the early years of life, the ap-proaches to early childhood interventions to counteract those risks,the demonstrated effects of programs with rigorous evaluations, keyfeatures associated with more effective programs, and the economicbenefits associated with programs that work. Important caveats andlimitations of our knowledge base are discussed as well. These find-

Introduction 17
ings provide a guide for decisionmakers considering investments inearly childhood interventions, highlighting both the proven resultsfrom prior efforts and the promise of future investments.


19
CHAPTER TWO
Strategies for Intervention
There is no single, uniform approach for intervening early in the livesof disadvantaged children to compensate for the factors that may im-pede healthy child development in the years before school entry. In-deed, strategies for early childhood intervention are highly variable.In this chapter, we review different approaches for addressing risksfaced in early childhood through services provided to affected chil-dren and their families. We begin by briefly reviewing the theoreticalunderpinnings for interventions with disadvantaged children in theyears prior to school entry. We then highlight various dimensionsalong which early intervention programs vary, dimensions that arecombined to generate a wide array of program models.
Given our interest in understanding the benefits from such pro-grams, we next turn our attention to programs that have been rigor-ously evaluated. We first highlight approaches to program evaluationthat provide the greatest confidence that true program effects havebeen measured, as opposed to the influence of other confounding fac-tors. Within the subset of programs with strong evaluations, we areparticularly interested in programs with solid evidence of programeffects beyond the early childhood period (i.e., at kindergarten entryor beyond). We view these programs—ones with scientifically soundevaluations and longer follow-up—as providing the most solid evi-dence. Based on these two criteria and several others, we identify 16programs with what we refer to as a strong evidence base. Anotherfour programs provide a promising evidence base given shorter-termfollow-up results. We provide a summary of the key features of the 20

20 Early Childhood Interventions: Proven Results, Future Promise
programs. The results from the evaluations of these programs, andinferences about the features of successful programs, are the subject ofChapter Three.
Theoretical Foundations of Early Childhood Intervention
Traditionally, children and their development were relegated to thedomain of the parent and family, without formal outside interference.As American society became increasingly urbanized and industrializedin the nineteenth century, and with the increase in immigrant fami-lies in cities, early childhood interventions began to be seen as oppor-tunities to help children who faced risk factors for typicaldevelopment because of family and home characteristics (Karoly etal., 1998; Meisels and Shonkoff, 2000). Today, early childhood in-tervention focuses primarily on children deemed vulnerable to pooroutcomes later in life.
Child development researchers have theorized about what fac-tors contribute to risk for later problems. To provide greater clarityabout the risks children face, Huffman, Mehlinger, and Kerivan(2001, p. 5) distinguish between three kinds of risk that have importfor child outcomes: fixed markers, variable markers, and causal riskfactors.
A risk factor may be a “fixed marker,” that is, one that cannot bedemonstrated to change. A risk factor may be a “variablemarker,” that is, one that can be demonstrated to change, butwhen changed, does not alter the probability of the outcome.Finally, a risk factor may be a “causal risk factor,” that is onethat can be changed and, when changed, does alter the risk ofthe outcome.
As delineated, fixed and variable markers are not appropriatefoci for targeted interventions, the former because they are not sub-ject to change and the latter because, when changed, they do not alterthe risk of poor individual child outcomes. Huffman, Mehlinger, andKerivan (2001) argue that, although children may be identified as

Strategies for Intervention 21
likely to benefit from intervention by using fixed and variable mark-ers (e.g., low birthweight, family composition, low socioeconomicstatus), the focus of interventions should be to address the causal riskfactors amenable to change (e.g., cognitive deficits, parenting skills,behavior problems) that, when altered, lead to changes in the out-comes of interest.
Evidence suggests that early learning is cumulative and that basicearly childhood skills are a necessary foundation for learning otherskills in school (Whitehurst and Lonigan, 1998; Heckman, 2000;Landry, 2005). If so, providing intervention to at-risk children asearly as possible will help prepare them for school entry and schooldemands, with the potential for subsequent benefits in terms ofschool performance, educational attainment, and adult economicoutcomes. This inference is supported by research on brain develop-ment in young children and the idea of sensitive periods for devel-opmental growth (Shore, 1997; Nelson, 2000; Shonkoff and Phillips,2000; Huffman, Mehlinger, and Kerivan, 2001; Landry, 2005). Evi-dence also shows that early intervention has the potential to generatecost savings by preventing later problems that would otherwise re-quire remediation (Karoly et al., 1998; Barnett, 2000).
Strategies for Early Childhood Intervention
Two types of early childhood intervention strategies—preschool andhome visitation—are perhaps the most commonly known and moststudied to date. Preschool is offered as an educational interventionspecifically to help three- and four-year-old children gain emergentliteracy and pre-math skills necessary for entry into kindergarten. Atthe same time, the preschool classroom serves as a place for childrento form friendships, learn to get along with other children, and regu-late their own behavior so as to develop appropriate socioemotionalbehaviors that will facilitate later learning (Huffman, Mehlinger, andKerivan, 2001). Whereas preschool focuses almost exclusively on thechild, home visitation is viewed as a two-generational approach inwhich professionals work with parents to help them support their in-
22 Early Childhood Interventions: Proven Results, Future Promise
fants, toddlers, and young children (Sweet and Appelbaum, 2004).The home visitation model first implemented in Elmira, New York,now operating across the country as the Nurse-Family Partnership(NFP) program, specifically focuses on the mother as the target forpreventive intervention⎯in her role as a parent and as an individual(Olds, Eckenrode, et al., 1997; Olds, Kitzman, et al., 1997).1
These classic models of intervention are well known, but evenwithin a given model, programs vary in many ways. For instance, pre-school can be public or private, center- or school-based, can enrollchildren at risk for school readiness or have universal enrollment.Home visitation programs include the well-documented “Olds”model that uses professionally trained nurses and a uniform servicedelivery method,2 but they also include programs that use paraprofes-sionals or other lay staff to deliver a mix of services tailored to thespecific community. Gomby, Culross, and Behrman (1999) note thatthousands of diverse home visitation programs are in operation. Fur-thermore, home visitation is often merely one component of a multi-faceted intervention program, such as Early Head Start.3
However, preschool and home visitation are not the only typesof early intervention.4 Our review of such interventions reveals thatearly intervention programs vary on different dimensions, so it is dif-ficult to claim that there are specific strategies. Rather, early interven-tion programs are typically an amalgam of approaches. The key____________1 The NFP program was originally known as the Prenatal/Early Infancy Project (PEIP)when it was first implemented and evaluated in Elmira, New York.2 For additional details on the NFP developed by David Olds and colleagues, see Table A.1in the appendix.3 Information and citations for the Abecedarian program and Early Head Start can be foundin Table A.1.4 For other reviews of early childhood interventions, see Barnett (1995), Yoshikawa (1995),Karoly et al. (1998), Perloff et al. (1998), Gomby, Culross, and Behrman (1999), Shonkoffand Phillips (2000), Brooks-Gunn, Berlin, and Fuligni (2000), Currie (2001), Brown andScott-Little (2003), Nelson, Westhues, and MacLeod (2003), Blau and Currie (2004),Ramey and Ramey (2004), Strickland and Barnett (2004), and Sweet and Appelbaum(2004).
Strategies for Intervention 23
dimensions of variation in early intervention programs, as summa-rized in Table 2.1, include the following:
• Outcomes targeted for improvement. The design of any inter-vention is driven by the outcomes for which improvements aredesired within the targeted group. Child outcomes that pro-grams aim to improve vary from school readiness skills to long-term school or economic success. For parents, they may alsoinclude economic success as well as pregnancy outcomes andchildrearing skills. Depending on the outcomes of interest, theother dimensions of early childhood interventions follow, typi-cally driven by a theory of change (Shonkoff and Phillips,2000).5
• Target person(s). While early childhood programs by definitionaddress the needs of children, not all programs consider thechild as the primary target for services. Some programs targetthe family, specifically the parent, for intervention to improveoutcomes for the child of interest. Often the target is the parent-child dyad: The parent is provided with parenting educationand resources to better understand appropriate child develop-ment and how she or he can foster it.
• Targeting criteria. Different types of children and families maybe identified for intervention services based on composition(e.g., single parent), ethnicity, mother’s age, or other characteris-tics. A common criterion in intervention targeting is low-income or low socioeconomic status (SES) families. Childrenmay be targeted based on an assessment of high risk for devel-opmental difficulties (due to family circumstances or visibleproblems such as behavioral issues, low IQ, or low birthweight).Families may be targeted based on parental problems, such aslow education or substance abuse.
____________5 A theory of change is a theoretical model that links the strategies of intervention with theprogram goals. The theoretical models draw on models of human development such as thetransactional model of Sameroff and Chandler (1975) and the ecological model of Bronfen-brenner (1979), among others (Shonkoff and Phillips, 2000).

24 Early Childhood Interventions: Proven Results, Future Promise
Table 2.1Key Dimensions of Early Childhood Intervention Programs
Dimension Examples
Pregnancy outcomes (parent)
CognitiveSocioemotionalBehavioralHealth
)) “School) readiness”)
Outcomestargeted forimprovement
Economic (parent or child)Parent education (e.g., literacy)Parenting skills
Target person(s) ChildParentChild-parent dyadFamily unit
Targetingcriteria
Child or family characteristics (minority or immigrant status,single-parent family, mother’s age, first-time parents)Low-SES or low-income familiesChild health problems (e.g., low birthweight)Child cognitive problems (e.g., low IQ)Child behavioral problemsChild assessed as high-risk (e.g., for developmental delay)Parental problems (e.g., substance use, low education,psychological, divorce, child abuse or neglect)Relationship or social problems (parent-child, child-peers,child-adults, parent-parent)Universal
Age of focal child Prenatal to age 5, for shorter or longer age spans
Location ofservices
HomeNon-home (center, school, medical setting)
Services offered Educational (e.g., preschool, parenting education)Family supports (e.g., links to social services)Health- or nutrition-relatedJob-relatedTherapeutic
Intensity ofintervention
Starting age to ending ageHours per weekWeeks per year
Individualizedattention
IndividualsSmall or large group
Program reach NationalStatewideCitywideSingle setting

Strategies for Intervention 25
• Age of focal child. Early childhood programs differ widely onthe targeted age for the focal child in an intervention program.Intervention can start before birth (targeting the expectantmother) or as late as the fifth or sixth year of childhood. Someprograms provide services over a span of years within the 0–5age range; others focus service delivery on a narrow time win-dow.
• Location of services. Programs differ in their approaches toreaching children and families who will benefit from services.Home visitation programs by nature serve children and familiesin their home setting. Other programs operate in a non-homesetting such as a child care center, school, or medical facility.Mixed modes are used as well. Some primarily non-home pro-grams also include a home component at some point in theirservice provision.
• Services offered. As mentioned, programs differ in what they of-fer families in the way of specific services, and program design isbased on the outcomes each program is intended to improve.Some are designed solely to provide educational services to pre-pare children for school entry, so they will most likely offer childdevelopment or preschool programs for children. Such programsmay also include other services such as health screening or nutri-tion services to supplement the educational curriculum. Otherprograms are interested in the overall functioning of the family,so they will offer a more holistic range of family support servicesto children and their families. Services for the target group maybe very narrow or quite broad in any program. Moreover, astandard package of services may be offered to all children andparents who receive program intervention, or the set of servicesmay be tailored for each child or family based on individual as-sessment.
• Intensity of intervention. The frequency and duration of serv-ices can vary substantially between early childhood programs.While a preschool program such as Head Start may be opera-tional five days a week for four to eight hours a day over most ofthe year, a home visitation program may offer a one- or two-

26 Early Childhood Interventions: Proven Results, Future Promise
hour visit once a month or so. Considering differences in thestarting and ending ages of participation in the program, the to-tal hours of services delivered can vary significantly. Dependingon the type of outcome desired, differences in intensity of inter-ventions can have an important effect on outcomes.
• Individualized attention. Related to the frequency and intensityof services is the issue of whether children and families receiveindividualized attention or participate in groups. Individualizedattention, such as home visits, requires more program resourcesand is likely to occur with less frequency but with more specifi-cally targeted services. Programs serving groups, such as childcare programs or parenting classes, can offer more hours ofservice with the trade-off of perhaps less individualized atten-tion. In group settings, the number of participants per provider(e.g., child-teacher ratios in center-based settings) also affect theattention each participant receives. Again, the desired programoutcomes dictate which trade-offs are made to achieve the pro-gram’s goals.
• Program reach. Many interventions have been initiated in a sin-gle location based on local circumstances and funding availabil-ity. Several well-studied interventions were implemented in asingle location to control the fidelity of the services to the pro-gram model and to conduct a rigorous evaluation. Other pro-grams either have begun as national demonstration projects andthen continued on a large scale or have started in a localized areaand then been replicated in more locations. In some cases,larger-scale replication has been implemented with high fidelityto the original intervention model; others have been replicatedwith less fidelity and more local autonomy in determiningcommunity service needs, so they are only loosely based on theoriginal model.
Research and practice in early childhood demonstrate that thereis great heterogeneity of programs in existence. Most programs usesome blend of the dimensions shown in Table 2.1 in defining theirapproach, and this often results in wide disparity between any two

Strategies for Intervention 27
locally implemented interventions. Consequently, it is often difficultto claim that because Program A delivers some services similar toProgram B, Program A will have the same outcomes as Program B.Much depends on the exact combination of services, who delivers theservices, and the characteristics of the population served. This is oftena result of unique features of the community in which programs areadministered. A program focused entirely on home visitation for at-risk two-year-olds may be very different from a home visitation com-ponent of a multifaceted family literacy program. Importantly, notevery early intervention program might be effective. The mix of pro-gram dimensions, population served, and outcomes of interest plays acritical role.
Strategies for Program Evaluation
To understand which programs are effective, a rigorous evaluation isnecessary that isolates the effects of the program on child and familyoutcomes from other influential factors.6 For example, a preschoolprogram may produce graduates who are well prepared to enterschool. However, without an evaluation that compares this group ofchildren with similar children who did not receive the same preschoolservices, we cannot tell whether the children who attended preschoolwould have done well even without the program. We do not want toattribute a positive effect to a program without a comparison withwhat would have happened in the absence of the program, holding allother factors constant. Ultimately, we want to be able to answer thequestion “Compared to what?” to determine whether a program iseffective. We are interested in the baseline against which we are com-paring results.
The most rigorous form of evaluation is the randomized ex-periment, which is often referred to as the gold standard. In the con-____________6 For a more detailed discussion of evaluation approaches for causal inference, refer to Shad-ish, Cook, and Campbell (2001), and in relation to preschool programs, Karoly and Bigelow(2005).

28 Early Childhood Interventions: Proven Results, Future Promise
text of early childhood interventions, this type of evaluation takes agroup of children (or parents/families) who are eligible for a specificprogram and randomly assigns individuals to either the intervention(i.e., treatment) group, whose members participate in the program, orthe comparison (i.e., control) group, whose members receive thenormal program or no program at all for the given situation. Thisallows the analyst to isolate the effects of the program by comparingoutcomes for individuals who are similar in all respects except for theintervention. In other words, since we cannot compare outcomeswith and without a program for the same individual, the experimen-tal design allows us to compare average outcomes for a group of indi-viduals who are the same, on average, except that one groupparticipated in the program and the other did not.7
Experimental evaluations are often difficult to conduct becauseof resource constraints or ethical concerns about withholding treat-ment from eligible groups. Therefore, quasi-experimental evaluationscan be used to create comparison groups for evaluation purposes.While less rigorous than experiments, quasi-experiments can often bedesigned with comparison groups that allow for sound findings,sometimes with the addition of statistical techniques. A commonquasi-experimental comparison group consists of children or familieswho are similar to the intervention group but live in an area wherethe program is not available or who are on a waiting list for an over-subscribed program.8 Thus, these people are not being purposefullydenied the intervention because of random assignment. They form agood counterfactual to the intervention because they are likely candi-dates for the intervention but do not receive services, and their inclu-____________7 The validity of an experimental evaluation can be compromised by a number of factors,including errors in the randomization process and nonrandom attrition from the studypopulation. Experiments with small sample sizes have low statistical power to detect smalleffects compared with experiments with larger samples.8 Other quasi-experimental designs have also been used to evaluate early intervention pro-grams. Among the programs we review below, other approaches include using siblings as acomparison group (i.e., one sibling attends preschool and the other does not) or using the“accident” of birth date as a type of natural experiment that determines which children entera program and which do not. See Karoly and Bigelow (2005) for further discussion.

Strategies for Intervention 29
sion or exclusion does not depend on the parents’ actions. (Whereparticipation versus nonparticipation depends on the parents’ choice,the outcome of the intervention may be confounded with the resultof good parenting.) The objective is that the two groups are generallysimilar before the intervention starts (that is, on such observable fac-tors as family income, ethnicity, parental education level, etc., as wellas other unobservable factors, such as parent motivation) or that anydifferences are controlled for in a statistical analysis to the extent pos-sible. If this objective is achieved, a comparison of outcomes for thetwo groups after the program should indicate the effects of the pro-gram compared with no program intervention.
Evaluations that do not use a comparison group suffer fromweaknesses that do not allow confidence that estimated program ef-fects actually capture the effectiveness of the program compared withno program. For example, an early intervention evaluation that meas-ures outcomes for children before and after a program will tell us howfar the children have advanced over that time period, but it does notallow us to claim with certainty that those gains would not have beenmade in the absence of the program. Likewise, comparing children ina given program with national or other averages does not confirmthat those children would not have compared as well (or as poorly)without program intervention.
Early Childhood Intervention Programs with RigorousEvaluations and Strong Evidence to Date
To determine which programs show evidence of effectiveness in pre-paring children for school and improving subsequent outcomes, wescanned the early childhood literature to identify relevant early inter-vention programs that have been implemented and evaluated.9 Weconsidered programs included in prior meta-analyses, narrative syn-____________9 Of course, programs with any form of evaluation represent just a subset of the many pro-grams that have been implemented in various communities around the United States.

30 Early Childhood Interventions: Proven Results, Future Promise
theses, and other reviews.10 In addition, we queried the PNC GrowUp Great Advisory Council. We focused our efforts on interventionprograms that have been implemented and evaluated in the UnitedStates since 1960.11 We identified just under 40 such early childhoodintervention programs, which we subjected to several criteria to iden-tify programs for further analysis.
The criteria we used to select programs for further analysis fallinto three categories: (1) they implement early childhood interven-tions as we have defined them for this study; (2) they focus on out-comes of interest for our study; and (3) they have rigorousevaluations. Criteria falling under (1) were the following:
• The program must intervene sometime during the period fromnine months before birth to age 5.
• The program must include a child development focus in someway.
• The program must not focus primarily on special-needs chil-dren.
The first criterion limits our focus to programs that serve chil-dren in the years before kindergarten entry. The second excludessome early childhood interventions whose primary objective is im-proving outcomes other than child cognitive or socioemotional de-velopment. For example, we did not include programs that aimpurely to promote a child’s physical health. Programs serving childrenwith special needs may differ in important ways, so we also excludethem from our analysis.
Two selection criteria relate to the outcomes studied in the pro-gram evaluation:____________10 These studies included Barnett (1995), Yoshikawa (1995), Karoly et al. (1998), Perloff etal. (1998), Gomby, Culross, and Behrman (1999), Currie (2001), Brown and Scott-Little(2003), Nelson, Westhues, and MacLeod (2003), Aos et al. (2004), Blau and Currie (2004),Strickland and Barnett (2004), and Sweet and Appelbaum (2004).11 Studies implemented outside the United States or before 1960 are less likely to be relevantfor understanding the effects of programs implemented in the United States today and in thefuture.
Strategies for Intervention 31
• The program must focus on at least one child outcome formeasurement, regardless of the target person for services.
• The program evaluation must include follow-up information atapproximately kindergarten entry, age 5 or later (i.e., not just anevaluation of results at age 2, 3, or 4).
The first criterion ensures that the study measured one or more childoutcomes. While we are primarily interested in child outcomes, wealso recognize that there are inputs and intermediary outcomes (orprecursors) for these final child outcomes, consistent with the modelshown in Figure 2.1. For our analysis, we include only programs thatmeasure directly what we refer to in the figure as “final child out-comes” (e.g., age-appropriate literacy skills), not merely inputs (e.g.,parent reads to child) or intermediary outcomes (e.g., emergent liter-acy such as recognizing letters or knowing that text reads from left toright). The second criterion ensures that children are followed longenough to show meaningful effects for school readiness and beyond.Programs that do not have follow-up data at kindergarten entry orbeyond are included in our group of “promising” programs becausethey show early results, but we do not know for certain that these ef-fects translate into school readiness skills as measured at school entryor later.
Finally, three selection criteria are relevant for ensuring a strongevaluation design:
• The program evaluation must use a properly implemented ex-perimental or quasi-experimental design that includes, at aminimum, a well-matched comparison group with appropriatestatistical controls.
• The sample size in both the treatment and comparison groupsmust be at least 20 persons.
• The evaluation must be formally published and publicly avail-able.

32 Early Childhood Interventions: Proven Results, Future Promise
Figure 2.1Examples of Influences on Child Outcomes
InputsWhat parents or
others do
PrecursorsIntermediary outcomes
OutcomesFinal child outcomes
Read to children Emergent literacy Grade-level readingand writing skills
Parenting consistency Child self-regulation Pro-social behaviors
RAND MG341-2.1
Among these methodology-related criteria, the first gives us reason-able confidence that the estimated program effects are true causal ef-fects. The second eliminates studies that have low statistical power todetect significant program effects. In other words, we do not want toerr by concluding that a program is ineffective when it simply did nothave a sufficient sample to detect moderate-sized impacts with rea-sonable chance. The final criterion ensures that the research resultsare readily available for assessing the quality of the research method-ology. For most of the programs we review, the results are publishedin peer-reviewed journals.
Applying these criteria to the original set of evaluations, weidentified 20 programs for consideration in this analysis (see Table2.2). (One intervention, Project CARE [Carolina Approach to Re-sponsive Education], contributes two program models, given the de-sign of the evaluation as discussed below.) Sixteen programs met allour criteria, and four additional programs met all criteria except lon-gitudinal information at age 5 or later. These latter four programsevaluated children as late as ages 2 or 3, and all had at least one statis-

Strategies for Intervention 33
Table 2.2Early Childhood Intervention Programs Included in Study
Programs with a Strong Evidence Base
Carolina Abecedarian Project
Chicago Child-Parent Centers (CPC)
Comprehensive Child Development Program (CCDP)
DARE to be You
Early Training Project (ETP)
Head Start
High/Scope Perry Preschool Project
HIPPY (Home Instruction Program for Preschool Youngsters) USA
Houston Parent-Child Development Center (PCDC)
Incredible Years
Infant Health and Development Program (IHDP)
Nurse-Family Partnership (NFP)
Oklahoma Pre-K
Project CARE (Carolina Approach to Responsive Education) (2 models)
Syracuse Family Development Research Program (FDRP)
Programs with a Promising Evidence Basea
Developmentally Supportive Care: Newborn IndividualizedDevelopmental Care and Assessment Program (DSC/NIDCAP)
Early Head Start
Parents as Teachers
Reach Out and Read
a Programs are classified as “promising” because a substantial numberof children were as young as age 2 or 3 at the time of the last follow-up.

34 Early Childhood Interventions: Proven Results, Future Promise
tically significant result.12 In most cases, programs that we originallyconsidered were excluded from our final analysis because they did notmeet our criteria for a child development focus, at least one child de-velopment measure, and/or a rigorous evaluation design.
We note that, unlike other synthesis studies, we did not requirea minimum effect size or statistically significant results in identifyingthe 16 programs that met all our criteria. Both effective and ineffec-tive programs are included among those that meet the full set of crite-ria above. Effective programs are those that had at least one outcomefinding at the 5-percent significance level. Ineffective programs arethose with a sound evaluation but no statistically significant resultsrelated to child development (i.e., our two criteria for study out-comes). The inclusion of ineffective programs allows us to examinethe possible role of various program characteristics in generatinglarger program effects. In other words, including both ineffective andeffective programs allows us to examine the relationship between pro-gram features and program effects with a wider range than we wouldobserve if we limited our set of programs to only those that are effec-tive.
Table 2.3 summarizes key features of the associated evaluationsfor the 20 programs we examine: the first year of the programevaluation, whether the study used a random assignmentor quasi-experimental design, the initial sample sizes forexperimental/treatment and control/comparison groups, and theages at follow-up. (See Appendix A for a brief summary of each pro-gram and the citations for the program’s evaluation.)
As indicated in Table 2.3, the earliest program evaluations beganin the early 1960s, while the latest took place in the early 2000s. Sev-enteen of the 20 programs use an experimental design for the pro-____________12 The Healthy Steps program is an example of a program we did not include in our study.While this program was rigorously evaluated, it focused on child physical health rather thancognitive or socioemotional outcomes (see Minkovitz et al., 2003, and Zuckerman et al.,2004). The difference between the treatment and comparison group for the one cognitiveoutcome (child language development assessed as of age 2) was not statistically significant.

Strategies for Intervention 35
Table 2.3Features of the Evaluations for Selected Early Childhood InterventionPrograms
Program(Initial EvaluationYear)
StudyDesign
InitialSample
Ages at Follow-Up
Programs with a Strong Evidence Base
Abecedarian(1972)
RA E = 57C = 54
5, 8, 12, 15,21
Chicago CPC(1983)
QE E = 1,150C = 389
6, 9, 10, 11,14, 21
CCDP(1990)
RA E = 2,213C = 2,197
5
DARE to be You(1991)
RA E = 285C = 189
4–6
ETP(1962)
RA E = 44C = 21
5, 6, 7, 8, 10,16–20
Head Start(1967)
RA and QE E* = 87 to 1,553C* = 86 to 6,234
3, 4, 5, 6,10–16, 23,18–30
Perry Preschool(1962)
RA E = 58C = 65
5–11, 14, 15,19, 27, 40
HIPPY USA(1990)
RA Cohort 1: E = 37, C = 32Cohort 2: E = 47, C = 66
5–6
Houston PCDC(1970)
RA E = 90C = 201
3, 4–7, 8–11
Incredible Years(mid-1990s)
RA E* = 47 to 345C* = 48 to 167
4–6
IHDP(1985)
RA E = 377C = 608
3, 5, 8
NFP(1978)
RA E* = 116 to 245C* = 184 to 515
3, 4, 6, 15
Oklahoma Pre-K(2001)
QE EV1: E = 1,112, C = 1,284EV2: E = 1,461, C = 1,567
4 or 5
Project CARE(1978)
RA E1 = 17, E2 = 25C = 23
4 1/2
Syracuse FDRP(1969)
QE E = 108C = 108
5, 6, 15

36 Early Childhood Interventions: Proven Results, Future Promise
Table 2.3—continued
Program(Initial EvaluationYear)
StudyDesign
InitialSample
Ages atFollow-Up
Programs with a Promising Evidence Base
DSC/NIDCAP(1979)
RA and QE EV1: E = 124, C = 131EV2: C = 21, E = 24
2
Early Head Start(1995)
RA E = 1,513 and C = 1,488 1, 2, 3
Parents as Teachers(1991)
RA E* = 60 to 298C* = 60 to 329
2, 3
Reach Out and Read(1996)
RA EV1: E = 65, C = 70EV2: E = 106, C = 99
2–6
SOURCE: Authors’ tabulations based on sources cited in Appendix A.NOTES: See Table 2.2 for full program names. RA = random assignment; QE =quasi-experimental; E = experimental or treatment group; E1/E2 = experimentalgroup 1 or 2 in a multi-arm design; C = control or comparison group; EV1 =evaluation 1; EV2 = evaluation 2.*Indicates three or more studies with range of sample sizes as indicated.
gram evaluation (again counting Project CARE as two programs).13
Although the studies using a quasi-experimental design are among thebest nonexperimental evaluations of early childhood interventions, itis possible that the three studies in this category are subject to poten-tial biases—most likely in the direction of generating more favorableresults—that are less likely for the experimental designs.14 To the ex-____________13 We note that a nationally representative experimental evaluation of the Head Start pro-gram, the Head Start Impact Study, is currently under way (see U.S. Department of Healthand Human Services, 2005).14 The results from quasi-experimental studies would be biased upward (i.e., they wouldgenerate effects that are larger than the true program effects) to the extent that early interven-tion program participants are selected from among those who would be more likely to suc-ceed even in the absence of the intervention. This would be the case, for example, if parentswho are more highly motivated to see their children succeed are more likely to enroll theirchildren in the intervention. The quasi-experimental studies reported in Table 2.3 use themost sophisticated statistical methods designed to control for such selection effects, but someupward bias may still remain.
Strategies for Intervention 37
tent this is an issue in the chapters that follow, we will consider thesensitivity of our inferences to the inclusion or exclusion of findingsfrom these nonexperimental studies.
However, even random assignment studies may suffer fromproblems of implementation that subject them to various biases.Among the evaluations listed in Table 2.3, the Comprehensive ChildDevelopment Program (CCDP) has been criticized for shortcomingsin the implementation of its experimental design and the associatedevaluation (see the discussion in Gilliam et al., 2000). The CCDPstudy utilized random assignment and included very large samplesizes, but, as we discuss in the next chapter, the program evaluationdid not find significant effects on the child outcomes of interest.Critics have suggested that results from this study should not informearly childhood policy because the study evaluated only participantsin the start-up year of the program. There are also questions aboutthe comparability of the treatment and control groups, and there area variety of other possible explanations for the null findings. Despitethese weaknesses in the evaluation, we include the study in our analy-sis because it still ranks among the strongest early childhood evalua-tions. As we discuss in the next chapter, we examine the sensitivity ofour statistical analysis to the inclusion or exclusion of this study giventhese methodological concerns.
In several cases, the intervention programs listed in Table 2.3have been evaluated for more than one cohort of participants in al-ternative settings in order to assess the ability to replicate findings.For example, the NFP program has been evaluated in a sequence ofexperimental studies in Elmira, New York; Memphis, Tennessee; andDenver, Colorado, with variation in the characteristics of populationserved in each site.15 The Carolina Abecedarian Project, ProjectCARE (with the ECE component, discussed further below), and In-fant Health and Development Program (IHDP) implemented aclosely related program model in a total of ten sites, although theyeach used a different targeting approach and the ages at which the____________15For NFP, Table 2.3 shows the range of sample sizes that applies across the three trials.
38 Early Childhood Interventions: Proven Results, Future Promise
intervention ended varied. Favorable effects found in alternative set-tings and with different population groups, as discussed further in thenext chapter, provide greater confidence that the measured effects aregeneralizable.
The table also indicates that ages at follow-up cover a widerange. As noted above, many or all of the children were as young asage 2 or 3 in four of the studies. Of the remaining 16 studies (whereProject CARE contributes two studies), seven follow childrenthrough age 6 at most; another two follow participants a year or twolonger, up to the end of elementary school (age 11). Two more pro-grams followed children to age 15. Four programs have follow-upperiods that extend into young adulthood (early to late 20s); one pro-gram (Perry Preschool) recently completed a follow-up of participantswhen they were age 40.
With two exceptions, the program evaluations listed in Table2.3 assessed the effect of a single program design—a fixed bundle ofservices. In the first case, Project CARE, the experimental design in-cluded two treatment groups, one that received home visits and full-day year-round center-based early childhood education (ECE) and asecond that received home visits only.16 This evaluation design allowsfor a direct comparison of the difference in effects between two pro-gram models (with and without the ECE component in this case), aswell as the effect of either model relative to a control group. In thesecond case, the Denver trial of the NFP program, one experimentalgroup was served by nurse home visitors; the second experimentalgroup was served by paraprofessional home visitors. As we discuss fur-ther in the next chapter, the paucity of studies with this type of de-____________16 The Carolina Abecedarian Project also included a multi-arm treatment design, but it ap-plied after children reached age 5 when they entered kindergarten. At that time, children inthe treatment and control groups were randomly assigned to either a school-age interventionthrough age 8 or a control group. This design allows for a comparison of the impacts of anearly childhood intervention program combined with a school-age intervention versus theearly childhood intervention alone or the school-age intervention alone. Each program vari-ant can also be compared with the control group that received no services over the entire agespan. The Chicago CPC program also provides for continued services past kindergarten en-try, which has been evaluated relative to a preschool-only program. For information on bothevaluations, see the citations in Appendix A.

Strategies for Intervention 39
sign means that we have little experimental evidence on the differen-tial effect of a given program feature or service. Instead, we knowmore about the effect of specific bundles of features and services asthey are combined in a given program model.
There are also differences across programs in the experiences ofchildren in the control or comparison group—the baseline programthe intervention is compared with. Notably, Abecedarian, ProjectCARE, and the IHDP provided a baseline set of health, family, ordevelopmental services to the control group. For example, all childrenin both the control and treatment groups of the IHDP receivedmedical, developmental, and social assessments, with referral to fur-ther care as appropriate (IHDP, 1990). To the extent that the basicservices received by the control group also confer benefits on the chil-dren or their families, the measured program effects will be attenu-ated from what they would have been if the program had beencompared with a baseline that did not include such services. Giventhe differences in baselines in the various programs we review, caremust be taken when interpreting any differences in the magnitudes ofeffects across programs.
An important caveat to this list of programs is that they are notintended to represent the full range of early intervention programs oreven of effective early intervention programs. Rather, they are thosethat have been rigorously evaluated to date and that report, in pub-lished outlets, measures at age 5 or later. Several well-known pro-grams did not meet all our criteria; lack of a rigorous evaluation was aprimary reason. It is noteworthy that many early childhood interven-tion programs have been implemented but not rigorously evaluated,so we are unable to assess their effectiveness compared with an appro-priate counterfactual. This study examines only those programswhose results concerning school readiness and later success in schooland beyond we are confident in appraising. We recognize that it doesnot include the full universe of early childhood interventions.
Moreover, we acknowledge that there may exist a greater pro-pensity to publish studies with positive and significant findings com-pared with studies with no significant differences or negative findings.One might also expect the likelihood of continued follow-up of the
40 Early Childhood Interventions: Proven Results, Future Promise
long-term effects of an early childhood intervention to be higher forthose programs that initially produce favorable results. This potentialfor “publication bias” or even “follow-up bias” would mean that weare not reporting on a representative sample of early childhood inter-vention programs or even early childhood intervention programs withrigorous evaluations. If, indeed, mostly favorable findings are pub-lished, it should not be taken to mean that all early childhood pro-grams will achieve results similar to those we consider in this study.Rather, the results can be viewed as illustrative of the outcomes thatmay be affected and the magnitude of those effects.17
A further issue is that nine of the 20 programs are not currentlyin operation in the same configuration as they were when evaluated.Several of the most rigorously evaluated interventions listed abovewere implemented as one-time interventions with small groups ofchildren 20 or more years ago. At that time, the counterfactual to anearly childhood intervention such as high-quality preschool was nointervention at all. Today, however, many at-risk children are tar-geted for some form of early childhood intervention before age 5.Thus, the counterfactual to any single intervention today is likely tobe some other form of intervention. This complicates the comparisonof effects across programs (such as their magnitude) because the expe-riences of the comparison groups may have changed over time.Moreover, the inability to replicate the exact conditions of programsimplemented and evaluated several decades ago makes it harder toensure that program impacts would be the same today even if theprogram were implemented the same way. In some cases, programeffects might be stronger; in other cases, they might be weaker.____________17 Some might argue that, given enough evaluations, a few will produce significant effects bychance even if early childhood interventions are equivalent to a placebo. However, each ofthe programs we review is based on an underlying theory of change grounded in the theoreti-cal child development literature. The consistency across studies and the robustness of resultsover time for a given study population suggest that the results we report on are unlikely dueto chance factors.
Strategies for Intervention 41
Taxonomy of Selected Early Childhood InterventionPrograms
Table 2.4 lists all 20 programs and describes their key features at thetime they were evaluated, according to the dimensions shown in Ta-ble 2.1. A review of the features of the 20 programs in Table 2.4shows that, despite variation in the dimensions of each individualprogram, they fall into a few distinct patterns. Based on these pat-terns, we have classified our 20 programs into one of three programapproaches as illustrated in Figure 2.2.18 (The time dimension illus-trated in the figure is addressed below.) The three approaches are
• home visiting or parent education• home visiting or parent education combined with early child-
hood education (“combination programs”)• early childhood education only.
The first group consists of eight programs that focus on deliv-ering a set of services to parents and, in some cases, to children aswell, through either home visits or parent education delivered in an-other setting, such as a classroom. The first five programs em-ploy home visits: NFP; Developmentally Supportive Care: NewbornIndividualized Developmental Care and Assessment Program(DSC/NIDCAP); Parents As Teachers; Project CARE (with no ECE)and HIPPY (Home Instruction Program for Preschool Youngsters)USA. The remaining three programs—Reach Out and Read, DAREto be You, and Incredible Years—focus on parent education.
The second group, the largest, contains 11 programs that com-bine home visits or other ways of providing parent education (in ei-ther a center or home setting) with early childhood education servicesdelivered to the children. We refer to these programs as “combinationprograms.” In most of them, the bulk of resources is directed towardproviding the ECE services for children. Home visits and parent edu-____________18 For other classification schemes of early childhood intervention programs, see St. Pierre,Layzer, and Barnes (1995) and Perloff et al. (1998).
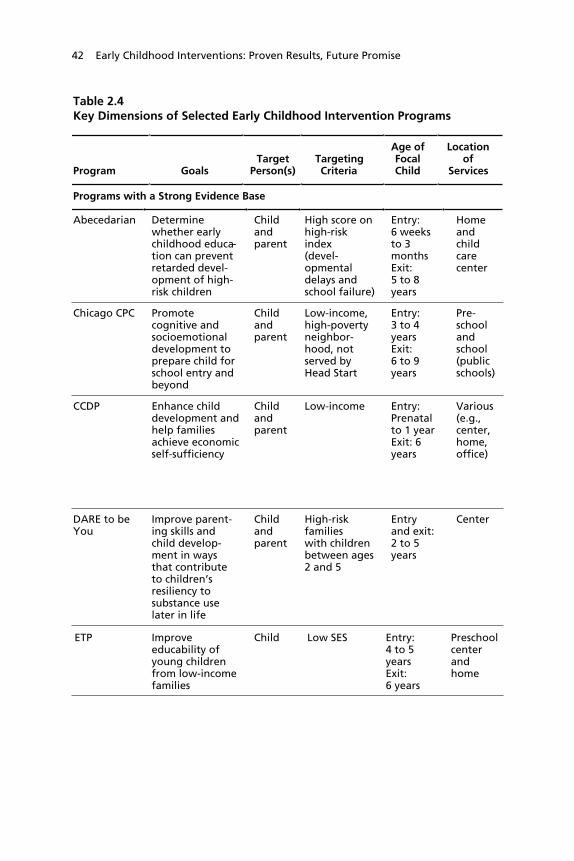
42 Early Childhood Interventions: Proven Results, Future Promise
Table 2.4Key Dimensions of Selected Early Childhood Intervention Programs
Program GoalsTarget
Person(s)TargetingCriteria
Age ofFocalChild
Locationof
Services
Programs with a Strong Evidence Base
Abecedarian Determinewhether earlychildhood educa-tion can preventretarded devel-opment of high-risk children
Childandparent
High score onhigh-riskindex(devel-opmentaldelays andschool failure)
Entry:6 weeksto 3monthsExit:5 to 8years
Homeandchildcarecenter
Chicago CPC Promotecognitive andsocioemotionaldevelopment toprepare child forschool entry andbeyond
Childandparent
Low-income,high-povertyneighbor-hood, notserved byHead Start
Entry:3 to 4yearsExit:6 to 9years
Pre-schoolandschool(publicschools)
CCDP Enhance childdevelopment andhelp familiesachieve economicself-sufficiency
Childandparent
Low-income Entry:Prenatalto 1 yearExit: 6years
Various(e.g.,center,home,office)
DARE to beYou
Improve parent-ing skills andchild develop-ment in waysthat contributeto children’sresiliency tosubstance uselater in life
Childandparent
High-riskfamilieswith childrenbetween ages2 and 5
Entryand exit:2 to 5years
Center
ETP Improveeducability ofyoung childrenfrom low-incomefamilies
Child Low SES Entry:4 to 5yearsExit:6 years
Preschoolcenterandhome

Strategies for Intervention 43
Table 2.4Key Dimensions of Selected Early Childhood Intervention Programs
Services OfferedIntensity ofIntervention
Individual orGroup
AttentionProgram Reach
ProgramCurrently
Operating?
Home visits andeducational childcare
Full-day, daily,year-round childcare; approximatelybiweekly homevisits; school-agecontinuationservices
Individualand group
One site inNorthCarolina
No
Preschool andelementary (K–3)programs, parentresources
Part-day preschool,school year; regularK–3 school day,school year; parentinvolvement inclass half day perweek
Individualand group
Chicago,Illinois
Yes
Multiple services,such as earlychildhood educa-tion and care,intensive casemanagement,counseling, lifeskills training,referrals
Varied acrossfamilies; on aver-age, families par-ticipated for morethan three years
Individualand group
Nationwidedemonstrationprojects
No
Parent-childworkshops withfocus onparenting skillsand developmen-tally appropriatechildren’sactivities
15 to 18 hoursof parent trainingworkshops andsimultaneous chil-dren’s programs,preferably in10–12 weekperiod
Group Westernstates
Yes
Preschool andhome visits
Part-day preschoolin summer;weekly, year-roundhome visits
Individualand group
Murfreesboro,Tennessee
No
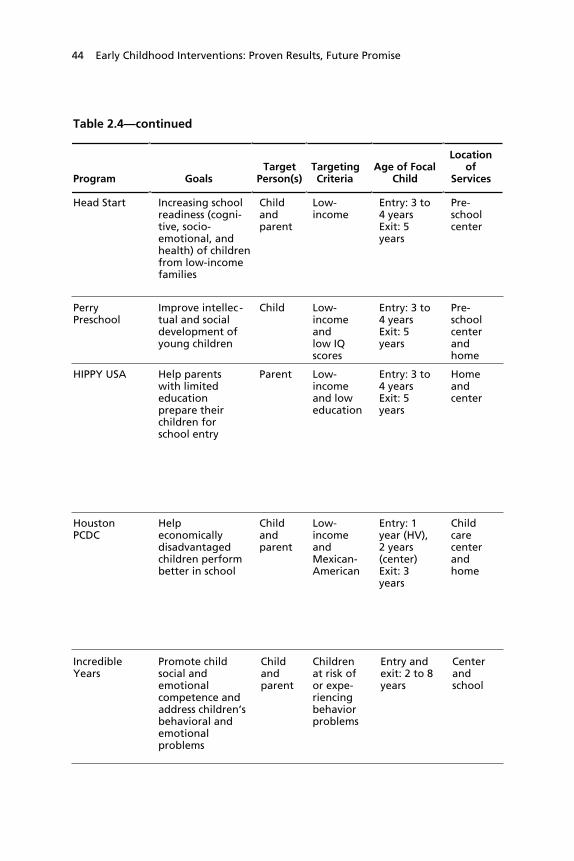
44 Early Childhood Interventions: Proven Results, Future Promise
Table 2.4Table 2.4—continued
Program GoalsTarget
Person(s)TargetingCriteria
Age of FocalChild
Locationof
Services
Head Start Increasing schoolreadiness (cogni-tive, socio-emotional, andhealth) of childrenfrom low-incomefamilies
Childandparent
Low-income
Entry: 3 to4 yearsExit: 5years
Pre-schoolcenter
PerryPreschool
Improve intellec -tual and socialdevelopment ofyoung children
Child Low-incomeandlow IQscores
Entry: 3 to4 yearsExit: 5years
Pre-schoolcenterandhome
HIPPY USA Help parentswith limitededucationprepare theirchildren forschool entry
Parent Low-incomeand loweducation
Entry: 3 to4 yearsExit: 5years
Homeandcenter
HoustonPCDC
Helpeconomicallydisadvantagedchildren performbetter in school
Childandparent
Low-incomeandMexican-American
Entry: 1year (HV),2 years(center)Exit: 3years
Childcarecenterandhome
IncredibleYears
Promote childsocial andemotionalcompetence andaddress children’sbehavioral andemotionalproblems
Childandparent
Childrenat risk ofor expe-riencingbehaviorproblems
Entry andexit: 2 to 8years
Centerandschool
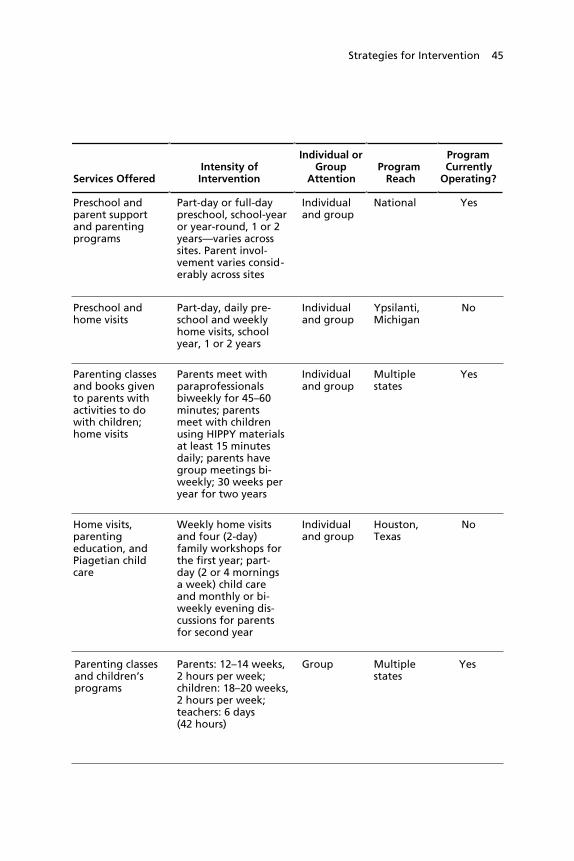
Strategies for Intervention 45
Table 2.4Table 2.4—continued
Services OfferedIntensity ofIntervention
Individual orGroup
AttentionProgram Reach
ProgramCurrently
Operating?
Preschool andparent supportand parentingprograms
Part-day or full-daypreschool, school-yearor year-round, 1 or 2years—varies acrosssites. Parent invol-vement varies consid-erably across sites
Individualand group
National Yes
Preschool andhome visits
Part-day, daily pre-school and weeklyhome visits, schoolyear, 1 or 2 years
Individualand group
Ypsilanti,Michigan
No
Parenting classesand books givento parents withactivities to dowith children;home visits
Parents meet withparaprofessionalsbiweekly for 45–60minutes; parentsmeet with childrenusing HIPPY materialsat least 15 minutesdaily; parents havegroup meetings bi-weekly; 30 weeks peryear for two years
Individualand group
Multiplestates
Yes
Home visits,parentingeducation, andPiagetian childcare
Weekly home visitsand four (2-day)family workshops forthe first year; part-day (2 or 4 morningsa week) child careand monthly or bi-weekly evening dis-cussions for parentsfor second year
Individualand group
Houston,Texas
No
Parenting classesand children’sprograms
Parents: 12–14 weeks,2 hours per week;children: 18–20 weeks,2 hours per week;teachers: 6 days(42 hours)
Group Multiplestates
Yes

46 Early Childhood Interventions: Proven Results, Future Promise
Table 2.4Table 2.4—continued
Program GoalsTarget
Person(s)TargetingCriteria
Age of FocalChild
Locationof
Services
IHDP Reduce de-velopmental,behavioral,and otherhealthproblems
Childandparent
Low-birthweight,prematureinfants
Entry: birth(HV), 1 year(center)Exit: 36months(adjusted forprematurity)
Homeandchildcarecenter
NFP Improve pre-natal healthand birthoutcomes;improve childhealth,development,and safety;improvematernal lifecourse out-comes
Parent Low-income,unmarried,first-timemothers
Entry: up to30th week ofgestationExit: 2 years
Home
OklahomaPre-K
Improve childdevelopmentand schoolreadiness
Child Universal Entry: 4 yearsExit: 5 years
Pre-kinder-gartencenter
ProjectCARE(no ECE)
Improvecognitivedevelopmentfor high-riskchildren
Childandparent
High scoreon high-riskindex (devel-opmentaldelays)
Entry: 4 to 6weeks (HV)Exit: 5 years
Home
ProjectCARE(with ECE)
Improvecognitivedevelopmentfor high-riskchildren
Childandparent
High scoreon high-riskindex (devel-opmentaldelays)
Entry: 4 to 6weeks (HV); 6weeks to 3months(center)Exit: 5 years
Homeandchildcarecenter
SyracuseFDRP
Improve childand familyfunctioningthat sustainsgrowth afterinterventionceases
Childandparent
Low-income,low-education,young mothers
Entry: Lasttrimester (HV);6 months(child care)Exit: 5 years
Homeandfamilychildcaresetting

Strategies for Intervention 47
Table 2.4Table 2.4—continued
Services OfferedIntensity ofIntervention
Individual orGroup
AttentionProgram Reach
ProgramCurrently
Operating?
Early childhooddevelopmentprograms andfamily supportservices
Home visits: weekly inyear 1 and biweeklyin years 2 and 3;child care center:daily, part or full-daystarting at age 1;parent meetings:bimonthly beginningat 12 months
Individualand group
8 sites No
Home visits bytrained nurses (orparaprofessionalsin one experi-mental site)
Home visit schedulefollows develop-mental stages ofpregnancy and earlychildhood (approxi-mately 6–9 visits dur-ing pregnancy and 20from birth to secondbirthday); postnatalvisits average 1 hourand 15 minutes
Individual Multiplestates
Yes
Preschoolprogram
Part-day and full-dayprograms, school year
Group Oklahoma Yes
Home visits(family educationclasses)
Family education:2.5 visits per month(every 10 days)
Individual One site inNorthCarolina
No
Child care andhome visits (familyeducation classes)
Child developmentcenter: Full-day, daily,year-round;family education: 2.5visits per month (every10 days)
Individualand group
One site inNorthCarolina
No
Home visits, parenttraining, and fam-ily child care
Weekly home visits;part-day child care(6–14 months); full-daychild care (15–60months) year-round
Individualand group
Syracuse,New York
No

48 Early Childhood Interventions: Proven Results, Future Promise
Table 2.4Table 2.4—continued
Program GoalsTarget
Person(s)TargetingCriteria
Age of FocalChild
Locationof
Services
Programs with a Promising Evidence Base
DSC/NIDCAP Avoid develop-mental delaysand mental/physical impair-ment
Childandparent
Preterm,low-birth-weightinfants
Entry: birthExit: 2 years
Hospitalandhome
Early HeadStart
Promote healthyprenatal out-comes, enhancedevelopment ofchildren ages 0to 3, and supporthealthy familyfunctioning
Childandparent
Low SES Entry: pre-natal orchild lessthan 1 yearExit: 3 years
Childcarecenterandhome
Parents asTeachers
Empower parentsto give their chil-dren a good startin life, preparechildren forschool entry, andprevent and re-duce child abuse
Childandparent
Universal Entry:prenatal orchild lessthan 8monthsExit: 3 to 6years
Homeandcenter
Reach Outand Read
Encourageparents to readaloud to childrento foster childliteracy
Parent Low SES Entry: 6months to 5yearsExit: 5 years
Pediatricdoctor’soffice
SOURCE: Authors’ tabulations based on sources cited in Appendix A.NOTES: See Table 2.2 for full program names. HV = home visits; SES = socioeconomicstatus; ECE = early childhood education.

Strategies for Intervention 49
Table 2.4Table 2.4—continued
Services OfferedIntensity ofIntervention
Individual orGroup
AttentionProgram Reach
ProgramCurrently
Operating?
Intensive monitoringwhile in NICU, in-cluding neurobehav-ioral observation,and home visitsafterward
NICU: two 25-minute therapysessions dailyHome visits twicemonthly for onehour
Individual National Yes
Home visits, childdevelopmentservices, parentingeducation, childcare, health andmental health care,and family support
Weekly homevisits and at least20 hours perweek of center-based child care,or a combinationof the two
Individualand group
National Yes
Home visits byparent educators;group meetings withparents; develop-mental health,vision, and hearingscreening; and build-ing networks tomeet family needs
Weekly tomonthly homevisits/groupmeetings, 60 to90 minutes
Individualand group
National Yes
Doctors and nursesgive new books toparents at each well-child visit andprovide advice aboutreading aloud withtheir child
Regularlyscheduled well-child visits
Individual National Yes

50 Early Childhood Interventions: Proven Results, Future Promise
Figure 2.2Taxonomy of Early Childhood Intervention Programs
SOURCE: Authors’ tabulations based on sources cited in Appendix A.NOTES: See Table 2.2 for full program names. Programs with an asterisk aredesignated as having a promising evidence base because a substantial number ofchildren were as young as age 2 or 3 at the time of the last follow-up. All otherprograms are designated as having a strong evidence base.RAND MG341-2.2
Variable entry window
Discrete entry agesVariable exit window
Minimum program interval
Maximum program interval within variable entry window
Oklahoma Pre-K
Head Start
Chicago CPC
Perry Preschool
ETP
Houston PCDC
Abecedarian
Project CARE(with ECE)
IHDP
CCDP
Syracuse FRDP
Early Head Start*
Incredible Years
DARE to be You
Reach Outand Read*
HIPPY USA
Project CARE(no ECE)
Parents asTeachers*
DSC/NIDCAP*
NFP
Ho
me
visi
tin
g/p
aren
t ed
uca
tio
nH
om
e vi
siti
ng
/par
ent
edu
cati
on
com
bin
ed w
ith
ear
ly c
hild
ho
od
ed
uca
tio
nEa
rly
child
ho
od
edu
cati
on
–1 0 1 2 3 4 5 6Child age in years

Strategies for Intervention 51
cation are considered to be important components of the program,but these services are typically less resource intensive.
The third group includes one program that focuses on the childonly through early childhood education: Oklahoma Pre-K, whereservices are delivered in preschool classrooms in public schools.
Figure 2.2 also highlights the timing of service delivery acrossthe 20 programs and within the three program approaches. The refer-ence point is the age of the focal child, shown on the bottom axis,which can begin as early as the prenatal period and continue throughage 6.19 Most programs do not have a fixed age range over whichservices are provided. Rather, the ages over which services are pro-vided can vary across individual participants because the entry age,the exit age, or both can vary. Programs with a fixed program interval(both entry and exit age) are shown with a solid horizontal bar thatmarks the entry age and exit age, so the length of the bar indicates thenumber of years services are provided. When the entry window varies,that interval is shown with a diagonal striped pattern in the horizon-tal bar, while a variable exit window is shown with a diagonal striped,black-shaded pattern. In between the variable entry and exit windowsis a light-shaded segment of the bar that represents the minimumprogram interval, i.e., the interval that extends from the last age ofentry to the first age of exit. The maximum program interval thusextends from the earliest entry age to the last exit age, or the length ofthe bar segments combined. In three cases with formal preschool pro-grams (ETP, Perry Preschool, and Chicago CPC), the entry age isdiscrete (i.e., age 3 or 4), designated by a dark-shaded diamond at therelevant ages. Two of the parent education programs (DARE to beYou and Incredible Years) essentially have a three- or four-year entrywindow, but the services provided are limited to a fixed length (12and 20 weeks, respectively). Those programs are marked with a hori-zontal line with black diamond endpoints located in the midpoint ofthe window over which entry can take place.____________19 Several of the programs in Figure 2.2 provided continuation services to children once theyentered kindergarten or elementary school. This feature, which is relevant for the Abecedar-ian program, the Chicago CPC program, and Incredible Years, is not illustrated in the figure.

52 Early Childhood Interventions: Proven Results, Future Promise
Among the eight programs that provide home visiting or parenteducation, the first four—all home visiting programs—begin as earlyas the prenatal period or within a few weeks of birth. For example,the NFP program is available to first-time mothers up to the 30thweek of gestation, and services continue through age 2 of the focalchild. Of the three parent education programs, Reach Out and Readpotentially begins the earliest (at 6 months), with services delivered atdiscrete points during well-child visits at a pediatrician’s office. Theother two parent education programs begin as early as age 2, whilethe HIPPY USA home visiting program begins as early as age 3.
The programs using the middle approach, which combineshome visiting or parent education with ECE, fall into two maingroups. The first seven programs begin at some point up to age 1(three programs as early as the prenatal period) and continue until atleast age 3. Three programs provide services until the child reachesage 5 or 6. The final four programs in this group begin as preschoolprograms at ages 3, 4, or 5—one or two years before kindergartenentry. The one program that uses the ECE-only approach, OklahomaPre-K, is a one-year preschool program.
Beyond the program features highlighted in Figure 2.2, Table2.4 reveals that the majority of programs target both the parent andchild for intervention, and many of the programs utilize both homeand non-home settings for service delivery. Only two of the programsuse the home setting exclusively (NFP and Project CARE with noECE); seven programs are located solely in non-home settings, whichare more likely than not to be education settings. Most programs in-clude an individualized component, although several provide servicesonly in a group setting.
The bulk of the programs we identified target at-risk children orfamilies rather than providing services universally; only Parents asTeachers and Oklahoma Pre-K are universal programs. However, thisfact could be partially attributed to a bias in the types of programsevaluated because universal programs are more difficult to evaluaterigorously. Of the risk factors used to target the population served,low income or low SES is indicated for half of the programs. A sig-
Strategies for Intervention 53
nificant percentage of children in the programs at the time programswere evaluated are from minority groups.
Almost all the programs have a fairly high intensity level and lasta year or longer, with child care and preschool services offered dailyand home visits generally conducted once a month or more. Onlytwo of the programs (Incredible Years and DARE to be You) offer ashort-term intervention of 42 hours or less over two to four months.At the other extreme, Project CARE and the Carolina AbecedarianProject provided year-round, full-time educational day care startingsoon after birth and continuing through age 5. Although the CCDPcovers an even longer age span, it delivers a less intensive set of serv-ices to children.


55
CHAPTER THREE
What Works in Early Childhood InterventionPrograms
Early childhood intervention is now widely recognized as a promisingapproach to both improving the well being of participating childrenand families and reducing the demand for social services across thelife course. Early childhood intervention is described as an “invest-ment,” and decisionmakers have proposed early childhood interven-tion as a prevention policy that pays for itself (Rolnick and Grune-wald, 2003; CED, 2004). Although the logic of early childhoodintervention is compelling, the question is whether there is evidencethat intervention programs can improve the outcomes of participantsand, if so, how much of a difference such programs make. Further-more, as we saw in the previous chapter, early childhood interventioncomes in a variety of shapes and sizes. To the extent that early inter-vention programs work, are there certain features that are associatedwith more-effective programs? We turn to these questions in thischapter, drawing on the evidence gained from the high-qualityevaluations of the 20 programs we identified in Chapter Two.
We begin in the next section by reviewing the range of out-comes that early childhood interventions have been demonstrated toinfluence. These include outcomes both during the school-age yearsand in adulthood. Next we consider the magnitude of the effectsacross a range of outcomes, at younger and older ages. Finally, we as-sess the information available regarding the types of features that en-hance program effectiveness. Our own efforts to make such inferencesfrom the 20 programs we review are limited by the narrow range ofvariation in program features that are likely to matter and the lack of
56 Early Childhood Interventions: Proven Results, Future Promise
consistency across evaluations in the outcomes that are measured.So although this chapter provides a starting point for answering the“What works?” question, much more remains to be done on thisissue.
Outcomes Improved by Early Childhood InterventionPrograms
Early childhood interventions may affect participants’ outcomesduring and immediately after the program, or they may have more-lasting benefits. For participating children, longer-term benefits maybe manifested during the school-age years or even in adulthood. Inthis chapter, we focus on a series of child outcomes that have beenevaluated in the 20 programs described in the previous chapter. Wefirst focus on child outcomes that are observed during the schoolingyears. We then turn to adult outcomes measured at age 18 and be-yond. The latter require an evaluation with long-term follow-up, adistinction shared by just five of the 20 programs we analyze.
Outcomes During the School-Age Years
As discussed in Chapter Two, the aim of most early intervention pro-grams is to enhance child development. As such, barometers of pro-gram success would include whether children in the program performbetter than their control (or comparison) group counterparts onmeasures of early development and whether those gains are main-tained at later ages. Measures of healthy development during theK–12 years include the following domains:
• Cognitive development (includes IQ and achievement testscores)
• Behavioral and emotional development (such as scores on meas-ures of social competence or behavior problems)
• Educational outcomes (special education placement, grade re-tention, grades, attendance, and others)
• Child maltreatment (includes instances of child abuse)

What Works in Early Childhood Intervention Programs 57
• Health (injuries, hospital visits, and others)• Crime (primarily juvenile delinquency and arrests).
In addition to these outcomes, some program evaluations havealso collected information about likely precursors to these outcomes.For example, the Reach Out and Read program evaluations examinedwhether children enjoyed reading and how much parents read totheir children in addition to whether measures of children’s vocabu-lary improved (High, Hopmann, et al., 1998; High, LaGasse, et al.,2000). We focus here on the outcomes rather than such precursors.
It is noteworthy that the outcomes the early childhood interven-tion model stresses—i.e., developmental measures, especially thoserelated to school readiness—are not incorporated into benefit-costanalysis. The first two types of outcomes listed above—cognitivedevelopment and behavioral and emotional development—are ex-ceedingly difficult to monetize. Educational outcomes such as specialeducation placement and grade retention are much easier to assign adollar value to, as are child maltreatment, health, and crime out-comes. Hence, the primary impetus for early childhood interventionis in fact generally outside the scope of the benefit-cost argumentsthat have been cited so often as justifications for public or wide-scaleinvestments in early childhood. We elaborate on this point in Chap-ter Four.
Not all of the programs reviewed in this study measured effectsin all the domains listed above. In Table 3.1, we list the outcomesthat each program measured. A cell with dark shading indicates that aprogram did not measure the outcome; a light-shaded cell indicatesthat the outcome was measured but that there was no statistically sig-nificant difference between the treatment and control/comparisongroups. The remaining cells list the outcomes that were improved bya statistically significant amount compared with a control or compari-son group. (Programs are listed according to the taxonomy developedin Chapter Two.) We list an outcome in this table if a significant ef-fect was found in any program evaluation follow-up. For example, if asignificant effect was observed at age 5 but not at age 9, the outcomeis listed in this table.
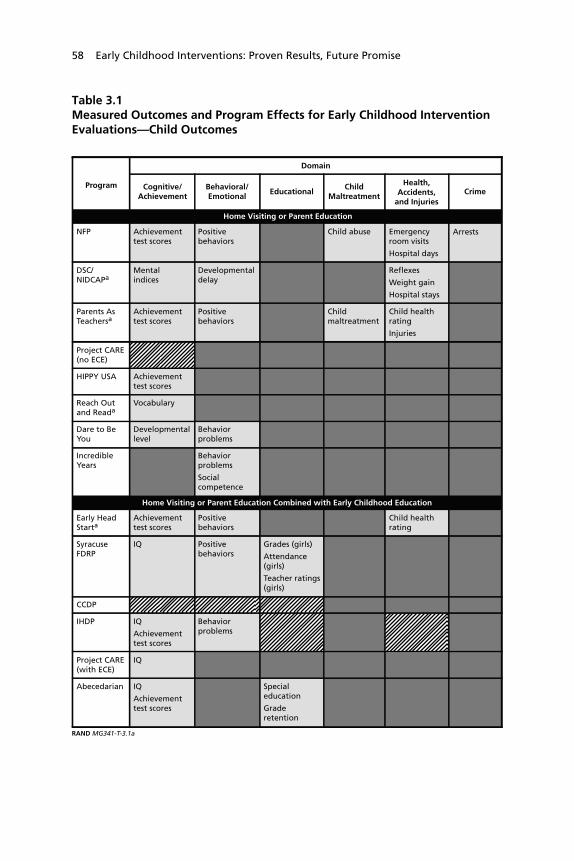
58 Early Childhood Interventions: Proven Results, Future Promise
Table 3.1Measured Outcomes and Program Effects for Early Childhood InterventionEvaluations—Child Outcomes
Program
Domain
Cognitive/Achievement
Behavioral/Emotional
Home Visiting or Parent Education
NFP Achievementtest scores
Positivebehaviors
Child abuse Emergencyroom visits
Hospital days
Arrests
DSC/NIDCAPa
Mentalindices
Developmentaldelay
Reflexes
Weight gain
Hospital stays
Parents AsTeachersa
Achievementtest scores
Positivebehaviors
Childmaltreatment
Child healthrating
Injuries
Project CARE (no ECE)
HIPPY USA Achievementtest scores
Reach Outand Reada
Vocabulary
Dare to BeYou
Developmentallevel
Behaviorproblems
IncredibleYears
Behaviorproblems
Socialcompetence
Home Visiting or Parent Education Combined with Early Childhood Education
Early HeadStarta
Achievementtest scores
Positivebehaviors
Child healthrating
SyracuseFDRP
IQ Positivebehaviors
Grades (girls)
Attendance(girls)
Teacher ratings(girls)
CCDP
IHDP IQ
Achievementtest scores
Behaviorproblems
Project CARE(with ECE)
IQ
Abecedarian IQ
Achievementtest scores
Specialeducation
Graderetention
EducationalChild
Maltreatment
Health,Accidents,
and InjuriesCrime
RAND MG341-T-3.1a

What Works in Early Childhood Intervention Programs 59
Table 3.1—continued
HoustonPCDC
IQ
Achievementtest scores
Behaviorproblems
ETP IQ
Achievementtest scores
Specialeducation
Teenpregnancy
Specialeducation
Teenpregnancy
PerryPreschool
IQ
Achievementtest scores
Arrests
ChicagoCPC
Achievementtest scores
Socialcompetence
Specialeducation
Graderetention
Child abuse Delinquency
Head Start IQ
Achievementtest scores(mixed)
Graderetention
Immunizations
Otherpositive healthbehaviors
OklahomaPre-K
Achievementtest scores
SOURCE: Authors’ tabulations based on sources cited in Appendix A.NOTES: See Table 2.2 for full program names and Table 2.3 for program implementation dates and sample sizes.aAt the last follow-up, these programs measured outcomes for children as young as age 2 or 3.
Program
Domain
Cognitive/Achievement
Behavioral/Emotional
Home Visiting or Parent Education Combined with Early Childhood Education (continued)
EducationalChild
Maltreatment
Health,Accidents,
and InjuriesCrime
RAND MG341-T-3.1b
Early Childhood Education Only
Outcome measured and improvement in the listed indicator was statistically significantat the 0.05 level or better.
Outcome measured but difference was not statistically significant at the 0.05 levelor better.
Outcome not measured.

60 Early Childhood Interventions: Proven Results, Future Promise
Across the programs and outcomes tallied in Table 3.1, whenan outcome was measured, a statistically significant favorable effecton participants was found much more frequently than would beexpected by chance. For example, six out of seven of the homevisiting/parent education programs that measured an outcome in thecognitive and achievement domain found favorable and significanteffects, as did 11 of the 12 combination programs. That is, althoughnot every program has an effect in every outcome area, the programswere shown to be successful at improving child outcomes in an over-whelming majority of cases where a measure was collected. Indeed,across all domains listed in Table 3.1, statistically significant benefitswere found in at least 70 percent of the programs that measured anoutcome in that domain. (Below, we illustrate the same point usingmore-formal statistical analysis for the cognitive and achievementdomain.) It is also worth noting that the consistency in results isbased on evaluations of programs implemented in multiple sites suchas some of the Head Start or Early Head Start studies. The set ofevaluations also includes replications of results for a given program, asis the case for the NFP model (which has been examined in threeseparate studies in different locations) and the interrelated modelevaluated in Abecedarian, Project CARE, and IHDP (which togetherwere studied in 10 locations).
Reflecting the child development objectives of most early inter-vention programs, most of the program evaluations measuredoutcomes in the cognitive development domain, and many alsomeasured outcomes related to behavioral and emotional develop-ment. Many evaluations examined educational outcomes; fewerevaluations considered child maltreatment, health, and crime out-comes.
The overwhelming majority of the evaluations found that theseprograms had a favorable and statistically significant effect on chil-dren’s cognitive development or behavioral and emotional develop-ment. The one exception, CCDP, found favorable effects, thoughwith only marginal statistical significance. Notably, this lack of a sig-nificant finding has been attributed to the methodological concernswith the program evaluation discussed in Chapter Two. Another ex-

What Works in Early Childhood Intervention Programs 61
ception, the Project CARE model with no ECE, found an unfavor-able effect on IQ, although it was not statistically significant. Themost frequently measured outcomes related to development were IQtest scores, achievement test scores, and measures of social compe-tence or behavior problems.
Of those programs that assessed the educational performance ofparticipants, most also observed better outcomes for program partici-pants than for their counterparts in the comparison group. The mostcommon measures of school performance were special educationplacement and grade retention. Finally, when evaluations measuredoutcomes in the other domains, programs were also found to have afavorable effect. An important footnote in terms of “what we know”about the effects of early childhood intervention is that many evalua-tions did not measure outcomes in the domains of health, child mal-treatment and crime.
Outcomes in Adulthood
Five of the 20 programs we examine have followed programparticipants long enough for us to know something about the longer-term effects of early childhood programs. Table 3.2 reports the find-ings from these studies with respect to four domains: educationalattainment, employment and earnings, social services use, and crime.Outcomes in these domains have been measured from age 18 up toage 40. We follow the same approach adopted in Table 3.1 in termsof which favorable outcomes are represented in the table and how thecells are shaded. All five programs use the combination program ap-proach.
For the four outcome domains, we again observe that when pro-grams measured an outcome, they were more likely to find a favor-able and significant effect than one would expect due to chance. Atleast two-thirds of studies measuring an outcome found a significanteffect in all domains except social services use (where only one of twoprograms that measured this outcome found a significant effect). Ofthe five programs, only the ETP failed to find any statistically signifi-cant long-term effects, and it had one of the smallest sample sizes.A consistent finding for the four other studies is that the intervention

62 Early Childhood Interventions: Proven Results, Future Promise
Table 3.2Measured Outcomes and Program Effects for Early Childhood InterventionEvaluations—Adult Outcomes
Abecedarian Years of completedschooling
Ever attended four-yearcollege
Skilledemployment
ETP
Employment
EarningsIncome
Use of socialservices
PerryPreschool
High school graduation Arrests
Arrests for violentcrimes
Time in prison/jail
ChicagoCPC
High school graduation
Highest grade completed
Arrests
Arrests for violentcrimes
Head Start High school graduation(whites)
College attendance(whites)
Booked or chargedwith crime (blacks)
SOURCE: Authors’ tabulations based on sources cited in Appendix A.NOTES: See Table 2.2 for full program names and Table 2.3 for program implementation dates and sample sizes.
Program
Adult Outcome Domain
EducationalAttainment
Employmentand Earnings
Home Visiting or Parent Education Combined with Early Childhood Education
Social ServicesUse
Crime
RAND MG341-T-3.2
Outcome measured and improvement in the listed indicator was statistically significantat the 0.05 level or better.
Outcome measured but difference was not statistically significant at the 0.05 levelor better.
Outcome not measured.
increased rates of high school graduation or years of schooling com-pleted. College attendance has also been favorably affected. Improvedlabor market outcomes include higher employment rates, higher ratesof employment in skilled jobs, and increased earnings. The Perry Pre-school program found a concomitant decrease in reliance on welfareor other social services programs. Finally, three of the four programs

What Works in Early Childhood Intervention Programs 63
that measured contact with the criminal justice system show a favor-able effect.
Magnitude of the Effects
While statistical analysis might designate an effect as “significant” be-cause we can have a high degree of confidence that it is not zero, it isanother matter to assess whether the effect is meaningful in terms ofsize. Evaluations of early childhood interventions necessarily use pre-vailing statistical standards to designate program effects as “signifi-cant” or “insignificant.” In this section, we focus on putting theseprogram effects into context in terms of their magnitude.
To compare the magnitude of different program effects, pro-gram effects are typically converted to a standardized measure calledeffect size .1 For example, how does one compare the size of the reduc-tion in juvenile arrests realized in one program with the increase inscores on an achievement test gained in another program? The effectsize is generally calculated by dividing the program effect measure bythe standard deviation of that effect measure. In an experimentalevaluation, the effect measure would be the difference in the out-comes of the treatment and control groups. This effect measure is di-vided by the standard deviation of the outcome for treatment andcontrol groups combined to get the effect size. In other words, themagnitude of the effect is standardized by a measure of the spread ofthe outcome. An effect size of 0.30 would correspond to a treatmentgroup mean that is 0.30 standard deviations above the control groupmean. In terms of a standard normal distribution, this would implythat the mean treatment group outcome is better than the outcomesof 62 percent of the control group, whereas if there were no effect the____________1 Another way to put program effects into perspective is to compare them with those fromother types of interventions. For example, approaches to improving elementary-age children’sachievement scores might range from enriched preschool programs to reducing class size orraising the minimum kindergarten entry age. Chapter Four discusses in detail another way tocompare program effects—benefit-cost analysis—which expresses outcomes in dollar termsso that they can be aggregated and compared with program costs.

64 Early Childhood Interventions: Proven Results, Future Promise
mean of the treatment group would be only better than 50 percent ofthe control group. We estimate an adjusted effect size, which accountsfor potential biases arising from small sample sizes, as described inmore detail in Appendix B.
While no “industry standard” exists regarding what constitutes ameaningful program effect size, several noted authors have suggestedconventions while acknowledging that the concept of effect size issubjective. For example, Crane (1998) considers an effect size of morethan 0.25 to be large. Cohen (1988) designates an effect size of 0.20as “small,” one of 0.50 as “medium,” and one of 0.80 as “large.”
We note that, given the differences in evaluation methodologiesdiscussed in Chapter Two, the effect sizes we consider in this sectionmay not be strictly comparable. For example, the program effects andthe associated effect sizes from quasi-experimental designs are morelikely to be biased upward if the evaluation design did not fully cor-rect for possible selection bias in the treatment group. On the otherhand, the methodological concerns about the CCDP evaluation havebeen suggested as an explanation for a possible downward bias in thatprogram’s estimated effects and therefore for the associated effectsizes. The differences in the services received by the control group(the baseline services) may also contribute to differences in estimatedeffect sizes. Moreover, it can be problematic to compare effect sizesacross different outcome measures because some outcomes are moreamenable to change, thereby making it easier to generate larger effectsizes for a given intervention.
Despite these caveats, we feel it is instructive to use the esti-mated effect sizes for the 20 programs we identified as a way to assessthe overall magnitude of early intervention program effects, ratherthan as a mechanism for suggesting that some programs are necessar-ily more effective than others because their effect sizes are larger. Inour discussion, we focus on effect sizes within outcome domains formeasures that are as comparable as possible (e.g., achievement testscores or measures of grade repetition). We begin by examining themagnitudes of outcomes for younger children, followed by those forolder children and adults and for other program participants.

What Works in Early Childhood Intervention Programs 65
Cognitive Outcomes for Younger Children
Cognitive outcomes were the most frequently measured among the20 programs we feature in this study. Out of 20 evaluations, 16 re-port an achievement test score, an IQ score, or both, and have suffi-cient information available to calculate the effect size.2 The estimatedeffect sizes for an achievement test score at approximately ages 5 to 6,closest to the age of school entry, are shown in Figure 3.1.3 In onecase, Houston PCDC, the test score is only available at 9.5 years ofage. Because programs in the “promising” category have not followedchildren into the school-age years, we used the achievement test scoreat the oldest age available, which was generally around age 3. Again,the early intervention programs are ordered by the taxonomy devel-oped in Chapter Two.
As seen in Figure 3.1, all but two of the effect sizes are positive,meaning that the program improved cognitive outcomes. The twonegative scores were statistically insignificant. The largest effect sizemeasured was 0.97 (significant at the 0.01 level), which was found forthe Stanford-Binet test administered to the Perry Preschool evalua-tion participants at age 5. The second largest effect size is found forthe Letter-Word Identification Subtest of the Woodcock-JohnsonAchievement Test among participants in the Oklahoma Pre-K pro-____________2 Although the Syracuse FDRP reported the program effect on IQ, the study did not reportsufficient information to calculate the corresponding effect size (Honig and Lally, 1982).Likewise, it was not possible to calculate the corresponding effect size for the achievementtest score effect reported by Currie and Thomas (1995) for Head Start. Two other pro-grams—DSC/NIDCAP and Incredible Years—did not report either an achievement test orIQ score program effect.3 If a general achievement test score was available, we used that (including, for example, theassessment of the level of child development measured in DARE to be You). When onlysubject-specific scores were available, we used the reading score. If no achievement score wasavailable, we used an IQ score. For programs that reported analyses of multiple samples, wepooled the samples. For example, the Houston PCDC study reports results separately forboys and girls, and we pool these (Johnson and Walker, 1991). Similarly, we pool the twocohorts of the HIPPY evaluations. Due to these selection criteria regarding the cognitiveoutcome measure to report in Figure 3.1, the statistical significance of the specific measurerecorded in Figure 3.1 may be different from the result reported in Table 3.1. In otherwords, while the measure reported in Figure 3.1 may be statistically insignificant at the 5-percent level, another test score measure at the same age or another age may have been statis-tically significant at that level. Hence the designation in Table 3.1.

66 Early Childhood Interventions: Proven Results, Future Promise
Figure 3.1Cognitive Outcome Effect Sizes Near or in Elementary School
SOURCE: Authors’ tabulations based on sources cited in Appendix A.NOTES: See Table 2.2 for full program names and Table 2.3 for program evaluation dates. Programs with an dagger are designated as having a promising evidence base. Other programs are designated as having a strong evidence base. The effect size isbased on general achievement test scores when available, or reading achievement scores or IQ results. Numbers in parentheses after program names indicate total sample size (N) and age of measurement (A).+ p < 0.10; * p < 0.05; ** p < 0.01; *** p < 0.001.n.a. = not applicable or not available.RAND MG341-3.1
–0.8 –0.6 –0.4 -0.2 0.0 0.2 0.4 0.6 0.8 1.0 1.2Effect size
Oklahoma Pre-K(N=2484, A=5)
Head Start(N=n.a., A=n.a.)
Chicago CPC(N=1289, A=6)
Perry Preschool(N=109, A=5)
ETP (N=79, A=5)
Houston PCDC(N=115, A=9.5)
Abecedarian(N=90, A=5)
Project CARE (withECE) (N=36, A=4.5)
IHDP (N=311, A=5)
CCDP (N=2824, A=5)
Syracuse FDRP(N=n.a., A=n.a.)
Early Head Start†(N=1403, A=3)
Incredible Years(N=n.a., A=n.a.)
DARE to be You(N=187, A=5.5)
Reach Out and Read†(N=122, A=4)
HIPPY USA(N=182, A=5)
Project CARE (no ECE)(N=47, A=4.5)
Parents as Teachers†(N=320, A=3)
DSC/NIDCAP†(N=n.a., A=n.a.)
NFP (N=615, A=6) 0.18*
n.a.
0.79**
0.35**
0.97**
0.52*
0.60+
0.62*
0.71*
0.02
–0.06
n.a.
0.10*
0.06
–0.49+
0.24
0.69***
0.37**
n.a.
n.a.
Ho
me
visi
tin
g/p
aren
t ed
uca
tio
nH
om
e vi
siti
ng
/par
ent
edu
cati
on
com
bin
ed w
ith
ear
ly c
hild
ho
od
ed
uca
tio
nEa
rly
child
ho
od
edu
cati
on

What Works in Early Childhood Intervention Programs 67
gram. Gormley et al. (forthcoming) report that this is equivalent to again in age-equivalent scores of approximately seven to eight months.
Both of these effect sizes, as well as several others shown in Fig-ure 3.1, would be considered large by the standards of educationalinterventions. Looking across the programs by our taxonomy, the ef-fect sizes for the home visiting and parent education programs rangefrom –0.49 to 0.69, with a mean of 0.17. The negative effect size forthe Project CARE program without ECE and the near-zero effect sizefor Parents as Teachers clearly lower the mean substantially fromwhat it would have been without these two programs. The effect sizesfor the combination programs range from near zero to 0.97, with amean of 0.43. In this case, the mean effect size would be larger ifEarly Head Start, CCDP, and IHDP had been excluded.
We also conducted a more formal meta-analysis of these effectsizes to test whether the mean effect size of these programs was in factdifferent from zero. We estimated the pooled mean effect size forcognitive outcomes across all programs shown in Figure 3.1.4 Thiseffect size estimate, which accounts for differences in the distributionsof the different studies in the sample, is 0.28, and we could reject thehypothesis that this estimate was zero with a high degree of confi-dence (p = 0.000). In other words, the statistical analysis affirms thatthe effect size of about 0.3 is significantly different from zero, indi-cating that these programs on average do have a small-to-moderatepositive effect on cognitive outcomes at about the time of school en-try.5
For achievement test scores, Table 3.3 shows the results fromthe Chicago CPC evaluations as the children in this study grew older.Children who attended the CPC program and comparison childrenwere assessed in reading and math using the Iowa Test of Basic Skillsin grades 3, 5, and 8. CPC children outscored their comparisongroup counterparts in each year, with effect sizes ranging from 0.17____________4 A test of homogeneity of the study distributions was rejected at the p = 0.000 level.5 These findings do not change when we exclude the CCDP results from the analysis be-cause of the potential methodological concerns discussed in Chapter Two.
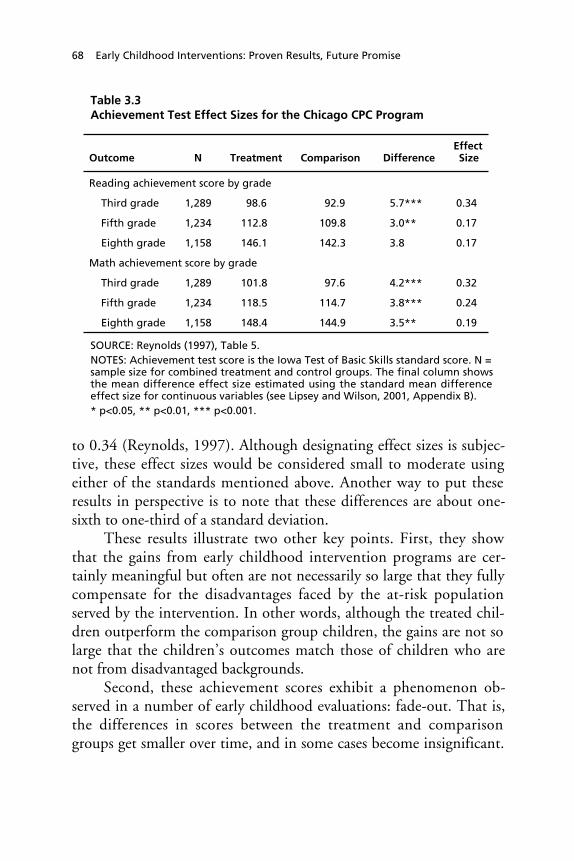
68 Early Childhood Interventions: Proven Results, Future Promise
Table 3.3Achievement Test Effect Sizes for the Chicago CPC Program
Outcome N Treatment Comparison DifferenceEffectSize
Reading achievement score by grade
Third grade 1,289 98.6 92.9 5.7*** 0.34
Fifth grade 1,234 112.8 109.8 3.0** 0.17
Eighth grade 1,158 146.1 142.3 3.8 0.17
Math achievement score by grade
Third grade 1,289 101.8 97.6 4.2*** 0.32
Fifth grade 1,234 118.5 114.7 3.8*** 0.24
Eighth grade 1,158 148.4 144.9 3.5** 0.19
SOURCE: Reynolds (1997), Table 5.NOTES: Achievement test score is the Iowa Test of Basic Skills standard score. N =sample size for combined treatment and control groups. The final column showsthe mean difference effect size estimated using the standard mean differenceeffect size for continuous variables (see Lipsey and Wilson, 2001, Appendix B).* p<0.05, ** p<0.01, *** p<0.001.
to 0.34 (Reynolds, 1997). Although designating effect sizes is subjec-tive, these effect sizes would be considered small to moderate usingeither of the standards mentioned above. Another way to put theseresults in perspective is to note that these differences are about one-sixth to one-third of a standard deviation.
These results illustrate two other key points. First, they showthat the gains from early childhood intervention programs are cer-tainly meaningful but often are not necessarily so large that they fullycompensate for the disadvantages faced by the at-risk populationserved by the intervention. In other words, although the treated chil-dren outperform the comparison group children, the gains are not solarge that the children’s outcomes match those of children who arenot from disadvantaged backgrounds.
Second, these achievement scores exhibit a phenomenon ob-served in a number of early childhood evaluations: fade-out. That is,the differences in scores between the treatment and comparisongroups get smaller over time, and in some cases become insignificant.

What Works in Early Childhood Intervention Programs 69
Using data from 33 early childhood programs, Aos et al. (2004) finda consistent pattern of fade-out in the test score advantage for treatedchildren over time. Similar patterns have been observed in other indi-vidual programs (e.g., Perry Preschool), although the Abecedarianprogram—arguably the most intensive of those we examine—provides one exception: The IQ and achievement test score advantagefor program participants persisted through age 21 (Karoly et al.,1998; Campbell et al., 2002). Nevertheless, as is evident from Tables3.1 and 3.2 and as we discuss further below, while there may be fade-out in the effect of early childhood interventions on IQ or achieve-ment test scores for most programs, there is evidence of lasting bene-fits in other aspects of educational attainment and subsequent eco-nomic outcomes in adulthood.
There is speculation that the gains realized in the programs maynot be maintained as children get older unless some type of interven-tion is maintained over time or unless children continue to receivehigh-quality educational services (see the discussion in Blau and Cur-rie, 2004). Indeed, the continued services offered in the Abecedarianprogram from kindergarten through age 8 and in the Chicago CPCprogram from kindergarten through third grade have been demon-strated to confer added benefits beyond those obtained from the pre-school intervention (Campbell and Ramey, 1995; Reynolds, 2000).Likewise, in their meta-analysis of longitudinal research on preschoolprograms, Nelson, Westhues, and MacLeod (2003) find that pro-grams with a follow-on component in elementary school have largereffects on cognitive outcomes for elementary-age children.
Because designating effect sizes as large or small is subjective, itcan be instructive to compare the effect sizes of one type of interven-tion with effect sizes from another type of intervention. To put theeffect sizes of early intervention programs into perspective, we pro-vide a few examples of the effect sizes found from studies that exam-ined the effect of other interventions on test scores. In an evaluationof a program in which elementary-age students directly teach, super-vise, and evaluate their peers’ performance, Greenwood (1991) foundeffect sizes of 0.37, 0.57, and 0.60 for math, reading, and languageachievement, respectively. Greenwood’s evaluation of Classwide Peer

70 Early Childhood Interventions: Proven Results, Future Promise
Tutoring (CWPT) measured gains on fourth grade achievement testsof low-SES students who had participated in CWPT since first grade.
Another example comes from Project STAR, Tennessee’s class-size reduction experiment. Kindergarten students within the sameschools were randomly assigned to a small class (13–17 students), alarger class (22–26 students), or a larger class with a full-timeteacher’s aide. Nearly 12,000 students were evaluated by the end ofthe third grade (Finn and Achilles, 1999). The effect sizes by thethird grade were 0.25 for a measure of language skills, 0.26 in read-ing, and 0.23 in mathematics.
Other Outcomes for School-Age Children
Fewer programs measured outcomes related to behavioral, emotional,and social outcomes, as shown in Table 3.1. Nevertheless, ten out ofthe twelve programs that measured a behavioral or social outcomehad a statistically significant effect on at least one measure in thisarea. The measures collected in this domain range from assessmentsof behavior problems and aggression to measures of life skills. Assuch, favorable results for these outcomes are sometimes manifestedas a negative effect (i.e., the control group mean exceeds the treat-ment group mean)—such as when the measure captures behaviorproblems—and sometimes as a positive effect.
In terms of the magnitudes of the effects, outcomes in the socialand behavioral domain tend to exhibit effect sizes that are not as largeas those for the cognitive outcomes. In Table 3.4, we list several illus-trative behavioral and social measures assessed at age 5 or older andtheir estimated effect sizes.6 When statistically significant, the effectsizes are in the moderate range (e.g., 0.3), and they can persist toolder ages such as the statistically significant favorable life skills meas-____________6 Again, there may be differences in the statistical significance of measures recorded in Table3.4 and the summary designation in Table 3.1. Table 3.1 reflects whether any measure in thebehavioral/emotional domain was statistically significant for a given program; Table 3.4shows several illustrative measures at age 5 or older, not necessarily those that were statisti-cally significant for the programs shown.

What Works in Early Childhood Intervention Programs 71
Table 3.4Social and Behavioral Outcome Effect Sizes for Early ChildhoodIntervention Programs
Outcome N Treatment Comparison DifferenceEffectSize
Home Visiting or Parent Education
Aggression measure:NFP, age 6, lowpsychologicalresourcemothers
335 98.6 101.1 –2.5* –0.25
Problem behaviormeasure:DARE to be You,ages 9–13
187 16.4 17.9 –1.5 –0.12
Home Visiting or Parent Education Combined with Early Childhood Education
Child behavior check-list (total problems):IHDP, age 5 865 31.9 33.0 –1.1 –0.06
Life skills measure:Chicago CPC,grade 8
115 40.7 37.7 3.0*** 0.28
SOURCE: NFP: Olds, Kitzman, et al. (2004), Table 4; DARE to be You: Miller-Heyl,MacPhee, and Fritz, (1998), Table 4; IHDP: Brooks-Gunn et al. (1994), Table 2; CPC:Reynolds (1997), Table 6.
NOTES: See Table 2.2 for full program names. Life skills measure is the Minimum Profi-ciency Skills Test. Aggression measure is based on McArthur Story Stem Battery. N =sample size for combined treatment and control groups. The final column shows themean difference effect size estimated using the standard mean difference effect sizefor continuous variables (see Lipsey and Wilson, 2001, Appendix B).
* p < 0.05, ** p < 0.01, *** p < 0.001.
ure assessed in eighth grade as part of the Chicago CPC evaluation.In general, the outcomes in this domain do not produce effect sizesthat match some of the larger effects evident for cognitive outcomesseen in Figure 3.1.
Although the magnitude of effects for either the cognitive meas-ures or social and behavioral measures may not seem large, it is notclear how changes in these measures correspond to changes in otheroutcomes. For example, it could be that a small change in problembehavior is associated with greater school attendance as well as im-

72 Early Childhood Interventions: Proven Results, Future Promise
proved attention while in school, resulting in a lower chance of graderepetition. Early intervention programs have larger effects on some ofthe other outcomes, such as those related to educational progress andattainment.
For example, Table 3.5 shows the estimated effect sizes associ-ated with special education placement and grade retention in fourprograms that measured these outcomes (all combination programs).7
These outcomes are typically expressed as the percentage of a groupthat has ever been retained in grade or ever been in special educationclasses during all or most of the K–12 years, although sometimes themeasure is the number of years repeated or in special education. Theeffect sizes for these outcomes, measured at older ages, are generallygreater in magnitude than the effects found for behavioral assess-ments, and they are as large as or larger than those for cognitive out-comes at older ages (when fade-out typically sets in). For instance, theage-15 evaluation of the Carolina Abecedarian Project found that24.5 percent of the program children had been in special educationclasses by that age compared with 47.7 percent of the control groupchildren (Campbell and Ramey, 1995). This difference of 23.2 per-centage points corresponds to an absolute effect size of 0.49. Simi-larly, by age 15, the children in the Abecedarian program were sub-stantially less likely to have been retained in grade than thecomparison group children were, with a nearly equivalent effect size.Two of the effects in Table 3.5 for grade retention are not significant(the one for ETP is in the wrong direction), but the remaining effectsrange from about one-quarter to three-quarters of a standard devia-tion.
Many of the measured effects for the remaining types of out-comes listed in Table 3.1 are also sizable. For example, among higher-
____________7 Grade repetition and use of special education were also measured in the Houston PCDCstudy, but the difference between the treatment and control groups for both outcomes werestatistically insignificant. Currie and Thomas (1995) also examine grade repetition in theirquasi-experimental analysis of Head Start and find significant effects for white children. Theresults from their regression-based analysis do not readily translate into the treatment-controlgroup differences reported in Table 3.5.

What Works in Early Childhood Intervention Programs 73
Table 3.5Special Education Placement and Grade Retention Effect Sizes for EarlyChildhood Intervention Programs
Outcome N Treatment Comparison DifferenceEffectSize
Home Visiting or Parent Education Combined with Early Childhood Education
Grade retention
Abecedarian(by age 15) (%)
92 31.2 54.5 –23.3* –0.48
ETP (by age 18)(%)
62 58.5 52.4 6.2 0.12
Perry Preschool(by age 27) (years)
112 0.5 0.7 –0.2 –0.15
Chicago CPC(by age 15) (%)
1,281 23.0 38.4 –15.4*** –0.34
Special education
Abecedarian(by age 15) (%)
92 24.5 47.7 –23.2* –0.49
ETP (by age 18)(%)
62 4.9 33.3 –28.5*** –0.79
Perry Preschool(by age 19)(% of years)
112 16 28 –12* –0.29
Chicago CPC(by age 18) (%)
1,281 14.4 24.6 –10.2*** –0.26
SOURCE: Chicago CPC Program: Reynolds et al. (2002), Table 4 and authors’ calcula-tions (for effect sizes); ETP: Gray, Ramsey, and Klaus (1983), Table 2.4, and authors’calculations (for effect sizes); Perry Preschool: Berrueta-Clement et al. (1984), Table6, and Schweinhart, Barnes, and Weikart (1993), Table 10, and authors’ calculations(for effect sizes); Carolina Abecedarian: Campbell and Ramey (1995), in text, andauthors’ calculations (for effect sizes).NOTES: See Table 2.2 for full program names. N is sample size for combined treat-ment and control groups. The final column shows the mean difference effect sizeestimated using the arcsine transformation of the difference between two propor-tions for dichotomous outcomes and as the standard mean difference effect size forcontinuous variables (see Lipsey and Wilson, 2001, Appendix B).* p < 0.05, ** p < 0.01, *** p < 0.001.
risk families in the Elmira, New York trial, the NFP program found areduction in emergency room visits between 25 and 50 months of agefor about one-third of participants compared with the control group

74 Early Childhood Interventions: Proven Results, Future Promise
(Olds, Henderson, and Kitzman, 1994) and a reduction of more thanone-half in the number of arrests by age 15 for participants comparedwith the control group (Olds, Eckenrode, et al., 1997). It is interest-ing to note that in a recent follow-up study of the NFP, the authorscalculated effect sizes for a large set of differences in mean child out-comes for the children receiving the program compared with the con-trol group. These effect sizes range in magnitude from 0.02 to 0.34(Olds, Kitzman, et al., 2004, Table 4.).
Longer-Term Outcomes and Effects for Other Program Participants
The magnitudes associated with the favorable effects of earlychildhood interventions on adult outcomes can also be sizable. Table3.6 features these findings, again for the subset of programs withlong-term evaluations (all of them combination programs).8 The ab-solute effect sizes for the statistically significant outcomes range fromabout 0.2 to 0.5, similar to the range noted for grade repetition andspecial education use.9 These figures for the longer-term effects ofearly childhood programs, as well as the evidence for educationalmeasures seen in Table 3.5, point to the potential of early childhood____________8 We do not report results for Head Start because the quasi-experimental results reported byGarces, Thomas, and Currie (2002) do not readily translate into treatment-control groupdifferences and effect sizes. For the Perry Preschool program, we report effects and effect sizesbased on results as of the age-27 follow-up (Schweinhart, Barnes, and Weikart, 1993) as wellas the age-40 follow-up (Schweinhart et al., 2005). Although the measures of high schoolcompletion, crime, and earnings were significant at both ages for Perry Preschool, the meas-ure of employment was significant only at age 40 and the measure of social services use wassignificant only at age 27.9 In some cases, consistent with the results reported in Table 3.2, the outcomes reported inTable 3.6 are not significant. For example, Abecedarian did not find a significant effect onhigh school graduation rates by age 21. However, program participants had more years ofcompleted schooling (12.2 years for the treatment group compared with 11.6 years for thecontrol group, p < 0.05) and were more likely to have attended a four-year college (36 per-cent for the treatment group compared with 14 percent for the control group, p < 0.01)(Campbell et al., 2002). Although the employment rate was not statistically significant inAbecedarian, there was a significant difference in the fraction with a skilled job as measuredby the Hollingshead scale. None of the crime outcomes measured in Abecedarian was statis-tically significant. Results for felony convictions are shown in Table 3.6, but there was alsono effect for misdemeanor convictions or incarcerations. ETP did not find a significant effectfor high school graduation rates, the only long-term outcome it measured in the domainsshown in Table 3.2.
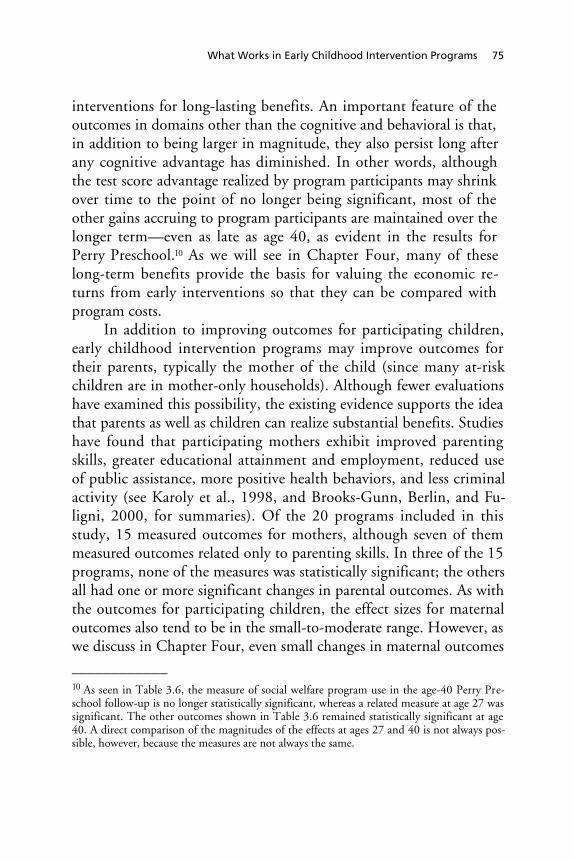
What Works in Early Childhood Intervention Programs 75
interventions for long-lasting benefits. An important feature of theoutcomes in domains other than the cognitive and behavioral is that,in addition to being larger in magnitude, they also persist long afterany cognitive advantage has diminished. In other words, althoughthe test score advantage realized by program participants may shrinkover time to the point of no longer being significant, most of theother gains accruing to program participants are maintained over thelonger term—even as late as age 40, as evident in the results forPerry Preschool.10 As we will see in Chapter Four, many of theselong-term benefits provide the basis for valuing the economic re-turns from early interventions so that they can be compared withprogram costs.
In addition to improving outcomes for participating children,early childhood intervention programs may improve outcomes fortheir parents, typically the mother of the child (since many at-riskchildren are in mother-only households). Although fewer evaluationshave examined this possibility, the existing evidence supports the ideathat parents as well as children can realize substantial benefits. Studieshave found that participating mothers exhibit improved parentingskills, greater educational attainment and employment, reduced useof public assistance, more positive health behaviors, and less criminalactivity (see Karoly et al., 1998, and Brooks-Gunn, Berlin, and Fu-ligni, 2000, for summaries). Of the 20 programs included in thisstudy, 15 measured outcomes for mothers, although seven of themmeasured outcomes related only to parenting skills. In three of the 15programs, none of the measures was statistically significant; the othersall had one or more significant changes in parental outcomes. As withthe outcomes for participating children, the effect sizes for maternaloutcomes also tend to be in the small-to-moderate range. However, aswe discuss in Chapter Four, even small changes in maternal outcomes____________10 As seen in Table 3.6, the measure of social welfare program use in the age-40 Perry Pre-school follow-up is no longer statistically significant, whereas a related measure at age 27 wassignificant. The other outcomes shown in Table 3.6 remained statistically significant at age40. A direct comparison of the magnitudes of the effects at ages 27 and 40 is not always pos-sible, however, because the measures are not always the same.
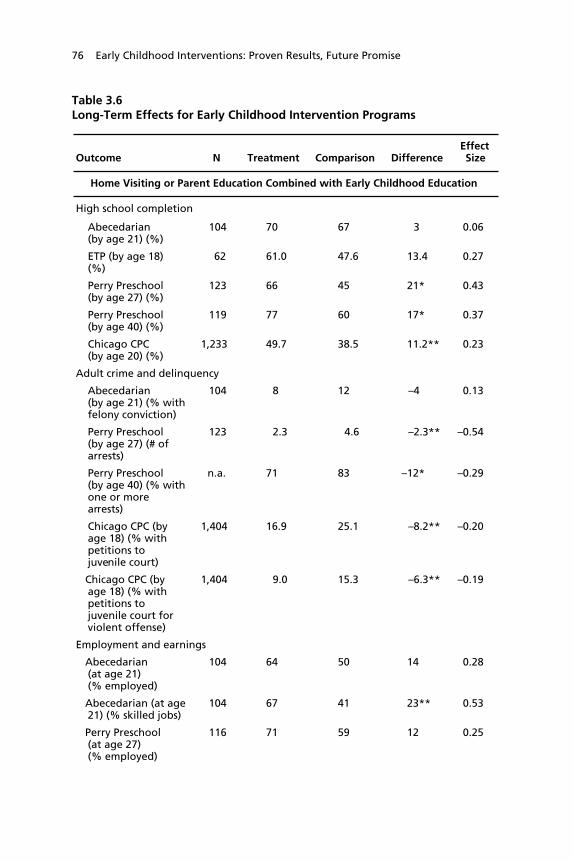
76 Early Childhood Interventions: Proven Results, Future Promise
Table 3.6Long-Term Effects for Early Childhood Intervention Programs
Outcome N Treatment Comparison DifferenceEffectSize
Home Visiting or Parent Education Combined with Early Childhood Education
High school completion
Abecedarian(by age 21) (%)
104 70 67 3 0.06
ETP (by age 18)(%)
62 61.0 47.6 13.4 0.27
Perry Preschool(by age 27) (%)
123 66 45 21* 0.43
Perry Preschool(by age 40) (%)
119 77 60 17* 0.37
Chicago CPC(by age 20) (%)
1,233 49.7 38.5 11.2** 0.23
Adult crime and delinquency
Abecedarian(by age 21) (% withfelony conviction)
104 8 12 –4 0.13
Perry Preschool(by age 27) (# ofarrests)
123 2.3 4.6 –2.3** –0.54
Perry Preschool(by age 40) (% withone or morearrests)
n.a. 71 83 –12* –0.29
Chicago CPC (byage 18) (% withpetitions tojuvenile court)
1,404 16.9 25.1 –8.2** –0.20
Chicago CPC (byage 18) (% withpetitions tojuvenile court forviolent offense)
1,404 9.0 15.3 –6.3** –0.19
Employment and earnings
Abecedarian(at age 21)(% employed)
104 64 50 14 0.28
Abecedarian (at age21) (% skilled jobs)
104 67 41 23** 0.53
Perry Preschool(at age 27)(% employed)
116 71 59 12 0.25
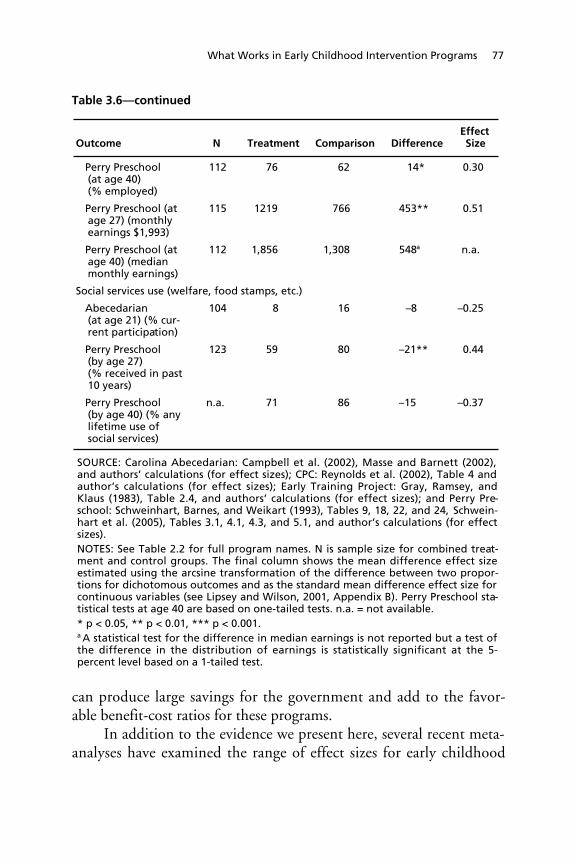
What Works in Early Childhood Intervention Programs 77
Table 3.6—continued
Outcome N Treatment Comparison DifferenceEffectSize
Perry Preschool(at age 40)(% employed)
112 76 62 14* 0.30
Perry Preschool (atage 27) (monthlyearnings $1,993)
115 1219 766 453** 0.51
Perry Preschool (atage 40) (medianmonthly earnings)
112 1,856 1,308 548a n.a.
Social services use (welfare, food stamps, etc.)
Abecedarian(at age 21) (% cur-rent participation)
104 8 16 –8 –0.25
Perry Preschool(by age 27)(% received in past10 years)
123 59 80 –21** 0.44
Perry Preschool(by age 40) (% anylifetime use ofsocial services)
n.a. 71 86 –15 –0.37
SOURCE: Carolina Abecedarian: Campbell et al. (2002), Masse and Barnett (2002),and authors’ calculations (for effect sizes); CPC: Reynolds et al. (2002), Table 4 andauthor’s calculations (for effect sizes); Early Training Project: Gray, Ramsey, andKlaus (1983), Table 2.4, and authors’ calculations (for effect sizes); and Perry Pre-school: Schweinhart, Barnes, and Weikart (1993), Tables 9, 18, 22, and 24, Schwein-hart et al. (2005), Tables 3.1, 4.1, 4.3, and 5.1, and author’s calculations (for effectsizes).NOTES: See Table 2.2 for full program names. N is sample size for combined treat-ment and control groups. The final column shows the mean difference effect sizeestimated using the arcsine transformation of the difference between two propor-tions for dichotomous outcomes and as the standard mean difference effect size forcontinuous variables (see Lipsey and Wilson, 2001, Appendix B). Perry Preschool sta-tistical tests at age 40 are based on one-tailed tests. n.a. = not available.* p < 0.05, ** p < 0.01, *** p < 0.001.a A statistical test for the difference in median earnings is not reported but a test ofthe difference in the distribution of earnings is statistically significant at the 5-percent level based on a 1-tailed test.
can produce large savings for the government and add to the favor-able benefit-cost ratios for these programs.
In addition to the evidence we present here, several recent meta-analyses have examined the range of effect sizes for early childhood

78 Early Childhood Interventions: Proven Results, Future Promise
programs. In a review of home visiting programs, Sweet and Appel-baum (2004) found effect sizes ranging from –0.043 to 0.318. Theyalso found that home visiting programs consistently improved six often mother and child outcomes. Also consistent with the summary ofeffect sizes above, Aos et al. (2004) found effect sizes ranging from0.13 to 0.18 for outcomes before the end of high school based on ameta-analysis of early childhood education and home visiting pro-grams serving primarily disadvantaged children. Finally, Nelson,Westhues, and MacLeod (2003) conducted a meta-analysis of 34 pre-school prevention programs for disadvantaged children using inclu-sion criteria different from those we use in this study. The primarydifferences are that Nelson et al. admitted studies with smaller samplesizes and those with nonrandom assignment to the treatment groups.They measured a mean effect size of 0.30 for cognitive outcomesfrom kindergarten through eighth grade, with similar effect sizes forsocioemotional outcomes and parent-family wellness outcomes.
In sum, the early childhood intervention programs reviewed inthis study demonstrate that such programs can have a statistically sig-nificant effect on a range of outcomes, both early in children’s educa-tional careers and later into adolescence and adulthood. The size ofthese effects for cognitive and behavioral measures is relatively mod-est, and these gains may fade as children age. However, the magni-tude can be substantial for some of the other outcomes, such as spe-cial education placement, grade retention, and criminal activity.Moreover, there is evidence that the advantage realized by programparticipants in these areas can be maintained over the longer term aschildren transition to adulthood. As we will see in Chapter Four, thelatter outcomes are also those that are most easily monetized as partof a benefit-cost analysis.
Features Associated with More-Effective Programs
Our summary of what contributes to the effectiveness of early child-hood programs draws on two sources of information. First, numerousresearch studies have had as their central research question the issue of

What Works in Early Childhood Intervention Programs 79
what aspects of these programs improve children’s outcomes. For ex-ample, David Olds and his colleagues have explored whether out-comes from home visiting programs are better when nurses or socialworkers provide the services. Second, we review prior studies andconduct original analysis to determine whether program intensity andtype appear to be associated with greater program effectiveness.
Studies of Program Characteristics
Research that has tried to get “inside the black box” to examine whatfeatures of early childhood intervention programs are associated withgreater effectiveness has examined two types of characteristics. Thefirst is structural characteristics—those that can be counted or quanti-fied in a relatively straightforward way. They include such features asstaff education or child-to-staff ratios. The second type is “process”characteristics. These are less tangible features, such as the nature ofcaregiver interactions with children (see Love, Schochet, and Meck-stroth, 1996, and Hayes, Palmer, and Zaslow, 1990, for discussionsof structural and process quality for child care). Examples of the typesof caregiver interactions examined include the warmth of caregivers,responsiveness of caregivers, and the level of involvement of the care-givers.
A number of expert panel reports and review articles have maderecommendations regarding the quality standards and characteristicsthat early childhood programs should maintain (for example,Behrman, Gomby, and Culross, 1999; Brooks-Gunn, Berlin, andFuligni, 2000; and Board on Children, Youth, and Families, 2001).There are fewer evidence-based references that provide guidance onthese issues. None of the studies of process quality meet the criteriafor rigorous research methodology employed by this study to selectprograms for inclusion in the analysis and in-depth discussion. Spe-cifically, the majority of these studies used relatively weak nonex-perimental study designs that do not convincingly control for poten-tial differences between treatment and comparison groups.11
____________11 We do not discuss this research here, but readers can find more information about studiesof process quality in Blau and Currie (2004) and Vandell and Wolfe (2000).

80 Early Childhood Interventions: Proven Results, Future Promise
The overwhelming majority of studies of structural quality arealso fraught with methodological shortcomings. However, severalstudies stand out because the researchers were able to conduct ex-perimental evaluations of measures of structural quality. The Na-tional Day Care Study (Ruopp et al., 1979) randomly assigned three-and four-year-old children to 29 child care settings that varied intheir caregiver education and child-to-staff ratios. They compared thegains in outcomes of children over a nine-month period on a range ofoutcomes and examined three caregiver education levels—bachelor’sdegree or greater, associate’s degree, or less than an associate’sdegree—and two child-to-staff ratios—7:1 and 4:1. Although thegains of children with more-educated providers and smaller classesdid not outpace other children on every outcome measure, there wasevidence that “better” quality was associated with gains for a numberof outcomes. Children in smaller classes outperformed their peers onmeasures of gains in cooperative behavior, hostility and conflict, ver-bal initiation, receptive language, and general knowledge. Childrenwith more-educated caregivers also made greater gains in the area ofcooperative behavior, as well as task persistence and a measure ofschool readiness.
A second study of structural quality that employed an experi-mental design also focused on differences in staff education. Twoevaluations of the NFP program compared maternal and child out-comes when the program was implemented by paraprofessionals ver-sus nurses to assess whether the type of professional training of thehome visitor affected the outcomes. The first evaluation (Olds et al.,2002) compared the maternal and child outcomes up to two yearsafter the intervention for the two types of visitors with a controlgroup. They found that the outcomes for the control group and thegroup visited by paraprofessionals were not statistically different for awide range of outcomes assessed. There was one exception: Mother-child pairs in which the mother had low psychological resources andwere visited by paraprofessionals interacted with each other more re-sponsively. In contrast, the nurse-visited mother-child pairs realizedsignificantly better outcomes than the control group on maternaloutcomes and child outcomes, including fewer language delays and

What Works in Early Childhood Intervention Programs 81
superior mental development at 24 months. A subsequent follow-upwhen the children were four years old (Olds, Robinson, et al., 2004)found that women visited by paraprofessionals had experienced betteroutcomes than their control counterparts by this time, but their chil-dren were not different from the control children. The nurse-visitedmothers and children continued to benefit from the program relativeto the control group, with the children scoring better on measures ofearly learning, language development, executive functioning, and be-havioral adaptation. In sum, these evaluations indicate that this homevisiting program yielded better outcomes for children when nursesdelivered the services.
In a study using quasi-experimental econometric analysis, Currieand Neidell (forthcoming) find evidence from data on Head Startparticipants consistent with these studies. For children older than 60months, the results indicate that greater spending on Head Start isassociated with higher subsequent reading scores and lower grade re-tention. Holding per capita expenditures constant, Currie and Nei-dell find that children in programs with higher teacher-pupil ratiosoutscore other children, while the fraction of qualified teachers,teachers’ salaries, teacher degrees and experience, and characteristicsof the directors are not related to children’s outcomes.
In addition to program staff characteristics and staff-child ratios,other studies consider the effect of specific program services or theintensity of services. The Project CARE evaluation compared the effi-cacy of intensive child-care center attendance coupled with home-based parent training (which we categorize in the combination pro-gram group) to parent training alone (which we call Project CAREwith no ECE) and to a control group that received neither of thosetreatments (Ramey et al., 1985; Wasik et al., 1990). At assessmentsconducted as the study children aged from 6 to 54 months, theevaluation found that the group that received early education plusparent training outscored the other two groups on cognitive meas-ures, but there was no significant difference between the group thatreceived parent training only and the control group.
Researchers have also used differences in intensity of participa-tion among participants in the IHDP to examine the possibility that

82 Early Childhood Interventions: Proven Results, Future Promise
higher levels of participation produce better outcomes. Hill, Brooks-Gunn, and Waldfogel (2003) combine experimental and nonexperi-mental methods to compare outcomes for infants who attended morethan 400 days of the program to those who attended less than 400days. At age 8, the higher-intensity respondents scored between sevenand ten points higher on a cognitive test with a mean of about 90,indicating that effects were larger for higher treatment intensity butalso were sustained to older ages.
Analysis of Model Program Evaluations
A second approach to identifying which characteristics improve pro-gram effectiveness is to pool the information on well-evaluated pro-grams and examine their characteristics. A recent meta-analysis sum-marized the evidence related to home visiting (Sweet and Appelbaum,2004). This study included data from 60 home visiting programs.Their inclusion criteria were designed to include the widest range ofinformation on home visiting programs rather than being limited tothose with the most rigorous evaluations. This study found that homevisiting programs consistently improved six of ten mother and childoutcomes. For each of these ten outcomes, Sweet and Appelbaumexplored the relationship between program characteristics and pro-gram effect. The program characteristics they examined included de-sign features, such as home visitor staff type and child age at interven-tion, population targeted, and primary goal. They found noconsistent pattern across outcome groups in terms of which programcharacteristics were associated with greater success. This study waslimited, however, by the fact that there is little variation in some ofthe characteristics across programs. For example, most home visitingprograms begin the intervention at about the same age of the childand have similar program goals.
In analysis similar to our analysis presented below, Nelson et al.(2003) also aim to identify program characteristics associated withprogram success in their meta-analysis of preschool prevention pro-grams. They find a larger average effect size on cognitive outcomes inelementary-age children for early intervention programs with an edu-cational component compared with programs not having one (0.30
What Works in Early Childhood Intervention Programs 83
versus 0.22), but the difference is not statistically significant. How-ever, they do report a larger average statistically significant effect sizeon cognitive outcomes measured in the preschool period for earlychildhood programs with an educational component compared withthose not having one (0.53 compared to 0.09). They find greater K–8socioemotional outcomes for programs with an intervention lengthgreater than one year, but this result does not hold true for K–8 cog-nitive outcomes. Similarly, for K–8 parent-family outcomes, they re-port better outcomes for programs consisting of more than 300 ses-sions, but again they do not find this result for cognitive outcomes.
Drawing on results from the 20 programs included in this study,we examine the relationship between program characteristics and themost commonly reported outcome: scores on cognitive assessments asshown in Figure 3.1. We could not analyze other outcomes becausenot enough studies measured the outcomes and there was not enoughvariation in the characteristics of programs evaluated in the studiesthat reported these outcomes. For example, we considered examiningwhether a program focused on the mother or child. However, wecould not distinguish among programs on this dimension simultane-ously with the program type because early childhood education pro-grams typically focus on the child, whereas home visiting or parenttraining programs typically focus on the parent.
Our analysis focuses on comparing the mean effect sizes for the19 programs included in two of the approaches used in the taxonomyintroduced in Chapter Two: home visiting or parent education, andcombination programs that incorporate ECE with home visiting orparent education. The former group includes programs that did notoffer early education and generally provide home visiting or parenttraining in some other setting; the latter group includes programs thatoffer early childhood education in tandem with home visiting, parenttraining, or other services. An important difference between the twoapproaches is that the combination programs generally offered moreservices—in terms both of the number of contact hours with childrenand family members and the diversity in the types of treatment.
In terms of the taxonomy of program approaches, our full set of20 programs includes one program that was exclusively an early edu-

84 Early Childhood Interventions: Proven Results, Future Promise
cation program (Oklahoma Pre-K), so we did not include this pro-gram in the analysis. For Project CARE, we included both programmodels, one in each program approach. Eliminating the four pro-grams without a cognitive measure (see Figure 3.1) gives us 15 pro-grams that measured cognitive outcomes for treated and control chil-dren. Six of these were home visiting/parent education programs, andnine were combination programs.
Because the program evaluations followed participants for vary-ing lengths of time, one issue is at what age to measure the outcomes.Given the emphasis of these programs on school readiness and thefact that most evaluations included some measures at the time ofschool entry, we follow the same selection criteria as in Figure 3.1 anduse the first measure available closest to ages 5 or 6. Again, for pro-grams that did not follow children to age 6, we use a measure at ap-proximately age 3. See Appendix B for more details on the methodsfor this analysis.As reported in Table 3.7, we find that the combination programsyield better achievement test outcomes on average, but the advantageof the combination programs is not statistically significant at conven-tional levels. The mean pooled effect size for the combination pro-grams, based on random-effects meta-analysis, was 0.325 comparedwith a mean pooled effect size of 0.212 for the parent training-onlyprograms—a difference that is not statistically significant. This resultis unchanged when we undertake several sensitivity analyses. For in-stance, the results are not sensitive to excluding from the sample ei-ther the CCDP program (because of concerns about the evaluationmethodology) or the CPC program (because it is the only quasi-experimental evaluation). Results are also similar when we drop eitherthe Reach Out and Read or DARE to be You programs because theiroutcome measures (and hence their effect sizes) are least comparableto the other programs. Finally, we find comparable results when weexclude the Houston PCDC program, because it measures outcomesat the oldest age, or when we explicitly control for age in the regres-sion model to account for the possibility of bias resulting from fade-out of cognitive benefits. In all cases, there is a measured advantage

What Works in Early Childhood Intervention Programs 85
Table 3.7Mean Achievement Test Effect Size for Combination Programs andParent Training Programs
Type of ProgramPooledEffectSize
Asymptoticp-Value
Numberof
Programs
Combination (home visiting/parent education and ECE)
0.325 0.001 9
Home visiting/parent educationonly
0.212 0.041 6
Meta-analysis regressioncoefficient for difference
0.149 0.398
SOURCE: Authors’ calculations using random-effects meta-analysis.NOTES: Tests of homogeneity of distributions for combination programsrejected at the p = 0.000 level and for parent training only programs re-jected at the p = 0.012 level. See Appendix B for more details.
for the combination programs, but the difference is never statisticallysignificant.
Given the small amount of data available for this inquiry, thislack of statistical significance for the difference in the mean effectsizes is not surprising. It is also consistent with the results notedabove for the Nelson, Westhues, and MacLeod (2003) meta-analysis.At this point, we can conclude from these results that both programapproaches improve outcomes but that there is some indication thatcombination programs are likely to boost cognitive outcomes morethan parenting programs alone. This is not an unexpected result: It istantamount to saying that when more services are provided, we aremore likely to see greater improvement.
Because of the limited data available, we are unable to draw spe-cific conclusions from these results regarding minimum amounts ofprogram intensity or optimal program intensity. However, it is likelya minimum amount of home visits or early childhood education isrequired to elicit an effect on children’s outcomes. At the same time,there is also likely to be a point at which there are diminishing returnsto additional service provision. The findings from the Hill, Brooks-Gunn, and Waldfogel (2003) analysis of the IHDP indicate thatmore intensive services, measured on a low-high dichotomy, pro-

86 Early Childhood Interventions: Proven Results, Future Promise
duced stronger results. Evaluations of the CPC program, however,have found that attending CPC preschools in the first year provides abig boost to children’s outcomes and that participation in the secondyear still improves outcomes, but not as much as in the first year(Reynolds, 1995, 1997). Similarly, children in the Perry Preschoolprogram who participated for two years realized larger gains thanchildren who participated for one year, but the gains from two yearswere less than twice the gain from one year of attendance (Berrueta-Clement et al., 1984). These relationships between program intensityand outcomes may not be found in all such intervention programs orfor other subgroups of at-risk children. The results do suggest, how-ever, that we need to better understand the relationship between theintensity and duration of program services and program effects forvarious outcomes.
Both the evidence from the existing literature and our analysis ofcharacteristics that contribute to program effectiveness must be con-sidered preliminary, primarily because we lack enough data to drawfirm conclusions. The thin evidence that is available suggests thatmore is better: Programs with better-trained and more-educated staffand those that provide more services and higher-intensity servicesproduce better outcomes, at least up to a point. However, this doesnot imply that only the most comprehensive high-intensity programsshould be implemented. The question is whether the additional bene-fits that better programs provide are worth the additional costs or,where resources are constrained, whether some benefits could beachieved by an intervention of modest cost. Although we do not haveadequate information to answer such questions, we can address otherquestions related to the relative costs and benefits of these programs.We turn to these issues in the next chapter.

87
CHAPTER FOUR
The Economics of Early Childhood Interventions
When considering investing early in the lives of children, particularlythose at risk of poor outcomes later in childhood or during the transi-tion to adulthood, it may be enough for some decisionmakers thatprograms have been demonstrated to generate significant improve-ments in outcomes in the short term or long term. For them, the evi-dence presented in Chapter Three provides sufficient justification fordevoting significant resources to early childhood intervention pro-grams. Others, however, may believe that constraints on available re-sources require that programs be justified on economic grounds. Forexample, will a dollar invested today generate savings down the roadto the government or society as a whole that can pay back that initialinvestment? Are there other economic benefits from early childhoodinvestments that may not easily translate into dollar terms but may besignificant nonetheless?
In this chapter, we consider the economic case for investing inearly childhood interventions. First, we provide an overview of howearly childhood interventions can generate dollar benefits in the nearterm or longer term—benefits that can be totaled and compared withprogram costs. Benefit-cost analysis is one approach for comparingthe dollar streams of benefits and costs across a range of early invest-ment strategies. Second, we review the evidence from existing benefit-costs studies of early childhood interventions to determine the rangeof economic returns that have been demonstrated for model pro-grams as well as larger-scale programs. Third, we consider some of theother economic, and even noneconomic, benefits that may accrue

88 Early Childhood Interventions: Proven Results, Future Promise
from such programs but that typically are not captured in benefit-coststudies. We conclude the chapter by assessing the strengths and limi-tations of this body of evidence.
Potential Economic Benefits of Early ChildhoodInterventions
As discussed in Chapter Three, early childhood intervention pro-grams have been demonstrated to produce a range of benefits, in theshort term and longer term, both for participating children and, insome cases, for other family members as well. These benefits may ac-crue in such domains as cognition and academic achievement, be-havioral and emotional outcomes, educational progression andattainment, economic success, criminal behavior, health-related be-haviors and outcomes, and child maltreatment.
In the remainder of this section, we first focus on the range ofspillover benefits that may accrue from the favorable effects of earlychildhood interventions on the lives of participants. We then discussthe use of benefit-cost analysis as a way of quantifying the total dollarvalue of these benefits as compared with program costs.
Spillover Benefits and Beneficiaries
Most often, evaluations of early childhood interventions focus onoutcomes for participating children. But, as noted in Chapter Three,some of them also assess outcomes for parents. Although most studiesdo not consider ways other family members benefit, it is plausiblethat programs may improve outcomes for descendents (e.g., childrenand grandchildren) of participants (Belfield, 2005). Many of theseoutcomes affected by early childhood intervention programs can gen-erate spillover benefits (in some cases, costs as well) that can often bequantified in dollar terms. Some of these spillovers may generatepublic benefits—in other words, savings to the government in theform of reduced outlays for costly programs or services, or additionalsources of revenue (e.g., through higher taxes paid). In other cases,the benefits may accrue to private individuals, either the program par-

The Economics of Early Childhood Interventions 89
ticipants themselves or other members of society who did not partici-pate in the program.
Table 4.1 illustrates the range of potential spillover benefits as-sociated with early childhood intervention programs. In particular, itsummarizes key outcomes that may be affected by early childhoodprograms and the associated spillover benefit (or cost) that can bevalued in dollar terms. On the left side of the table, a series of col-umns indicate whose outcome changes—the participating child orthe parent(s) or descendent(s) of the participating child. On the rightside of the table, a series of columns denotes the beneficiaries of thespillover benefits—the government, program participants, or the restof society (i.e., nonparticipants).
For example, when an early childhood intervention program(such as home visits offering parenting education) leads to a reduc-tion in child maltreatment (second row of Table 4.1), it generateslower costs for the child welfare system (e.g., foster home care andcase management expenses) and lowers the tangible and intangiblecosts to victims of abuse.1 The savings to the child welfare systembenefit the government (i.e., taxpayers), and program participantswho experience less child abuse receive the gains from lower victimcosts. Improved outcomes for participating children mean that whenthey reach adulthood and become parents, they may be less likely tomaltreat their own children. Hence, there is a potential for intergen-erational benefits as well (Wolfe and Haveman, 2002).
Table 4.1 shows 13 outcomes that generate such spillover bene-fits and that are quantifiable in dollar terms. The first outcome, thevalue of child care received, is primarily relevant for center-basedearly childhood education programs. The time children spend inthese programs is of private value to the parents of the participatingchild as a form of child care. The next five outcomes are relevant toparticipating children during their childhood and include child
____________1 Tangible victim costs include those associated with medical care, lost work time, and othersuch costs. Intangible victim costs include pain and suffering and other aspects that affect thevictim’s quality of life.
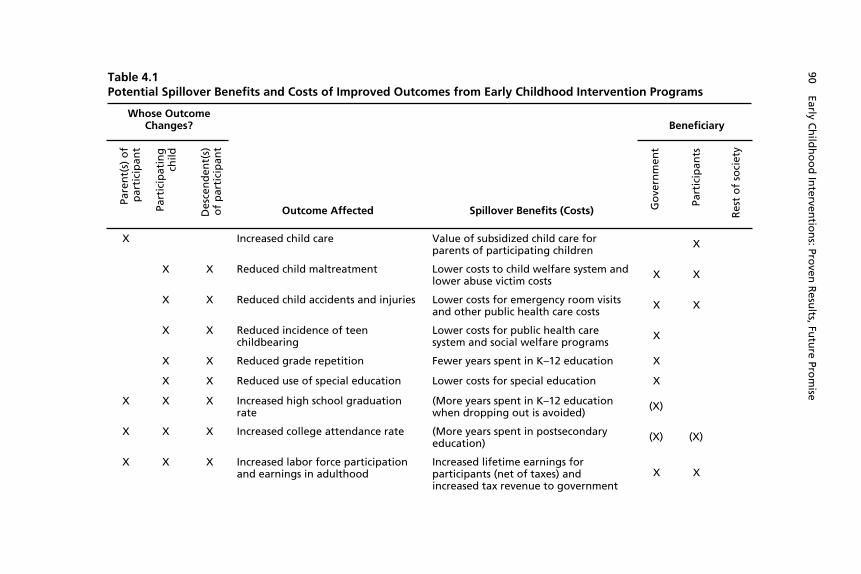
Table 4.1Potential Spillover Benefits and Costs of Improved Outcomes from Early Childhood Intervention Programs
Whose OutcomeChanges? Beneficiary
Pare
nt(
s) o
fp
arti
cip
ant
Part
icip
atin
gch
ild
Des
cen
den
t(s)
of
par
tici
pan
tOutcome Affected Spillover Benefits (Costs) G
ove
rnm
ent
Part
icip
ants
Res
t o
f so
ciet
y
X Increased child care Value of subsidized child care forparents of participating children
X
X X Reduced child maltreatment Lower costs to child welfare system andlower abuse victim costs
X X
X X Reduced child accidents and injuries Lower costs for emergency room visitsand other public health care costs
X X
X X Reduced incidence of teenchildbearing
Lower costs for public health caresystem and social welfare programs
X
X X Reduced grade repetition Fewer years spent in K–12 education X
X X Reduced use of special education Lower costs for special education X
X X X Increased high school graduationrate
(More years spent in K–12 educationwhen dropping out is avoided)
(X)
X X X Increased college attendance rate (More years spent in postsecondaryeducation)
(X) (X)
X X X Increased labor force participationand earnings in adulthood
Increased lifetime earnings forparticipants (net of taxes) andincreased tax revenue to government
X X
90 Early Ch
ildh
oo
d In
terventio
ns: Pro
ven R
esults, Fu
ture Pro
mise
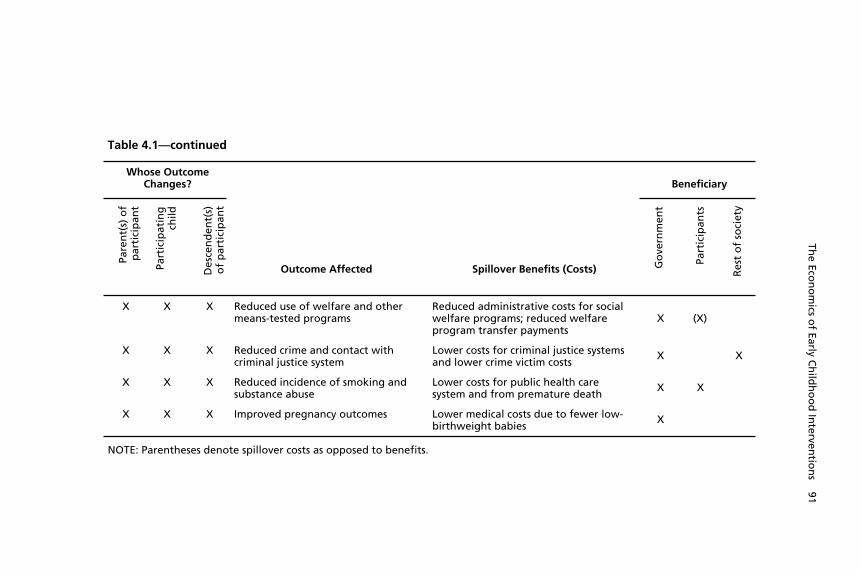
Table 4.1—continued
Whose OutcomeChanges? Beneficiary
Pare
nt(
s) o
fp
arti
cip
ant
Part
icip
atin
gch
ild
Des
cen
den
t(s)
of
par
tici
pan
t
Outcome Affected Spillover Benefits (Costs) Go
vern
men
t
Part
icip
ants
Res
t o
f so
ciet
y
X X X Reduced use of welfare and othermeans-tested programs
Reduced administrative costs for socialwelfare programs; reduced welfareprogram transfer payments
X (X)
X X X Reduced crime and contact withcriminal justice system
Lower costs for criminal justice systemsand lower crime victim costs
X X
X X X Reduced incidence of smoking andsubstance abuse
Lower costs for public health caresystem and from premature death
X X
X X X Improved pregnancy outcomes Lower medical costs due to fewer low-birthweight babies
X
NOTE: Parentheses denote spillover costs as opposed to benefits.
The Eco
no
mics o
f Early Ch
ildh
oo
d In
terventio
ns 91
92 Early Childhood Interventions: Proven Results, Future Promise
maltreatment, accidents and injuries, teen childbearing, and schoolperformance (i.e., grade repetition and special education use). Im-provements in each of these outcomes benefit the government; thefirst two also benefit participants. Since these outcomes occur atyounger ages, we do not expect most of them to improve for parentsof participating children. However, these same outcomes could alsoimprove for future generations.
The remaining seven outcomes all pertain to adulthood. Theyinclude educational attendance and attainment (both high school andcollege), labor force behavior, use of social welfare programs, crimi-nality, smoking and substance abuse, and childbearing. As with theprevious outcomes in childhood, early childhood interventions maygenerate improvements in these outcomes for both participating chil-dren and their descendents. However, parents may also demonstrateimprovements in these outcomes as a result of an early childhoodprogram. They too may obtain more human capital; experience im-proved labor market, health, and pregnancy outcomes; and imposelower costs on society from crime and welfare use.
Two of these outcomes—improvements in high school gradua-tion and college attendance rates—differ from the others in that theyare associated with spillover costs.2 Whether the parents of partici-pating children or the children themselves obtain a high school di-ploma or attend college, the additional educational attainment resultsin added public education costs, as well as private education costs(e.g., for college tuition). These costs are offset by the gains to theindividuals from higher earnings associated with more human capital(net of taxes paid) and to the public sector from the higher taxes paidon the increased earnings (shown elsewhere in the table).
Reductions in welfare use and the use of other means-testedprograms produce offsetting benefits and costs. Taxpayers gain fromthe reduced outlays for such programs and the savings in administra-____________2 These two outcomes may also lead to indirect spillover benefits such as higher employmentrates, earnings, and so on. These outcomes, related to improved educational attainment, areshown elsewhere in the table. So the direct effect is the costs associated with attaining thehigher levels of schooling.

The Economics of Early Childhood Interventions 93
tive costs. However, program participants, who rely less on these pro-grams as a result of an early childhood intervention, no longer havethat source of income or in-kind benefit. Thus, the reduction in thepure transfer payment (or in-kind benefit) is a benefit for taxpayersbut an equal and offsetting cost for participants. Since taxpayers alsogain from the reduction in administrative costs, there is an overallbenefit in the form of administrative cost savings, when viewed fromthe perspective of society as a whole. This will generally be smallerthan the transfer payment itself.3
The primary way that nonparticipants benefit from early child-hood interventions—ways that can be quantified in dollar terms atleast—is through reduction in crime. For the potential crime victims(“rest of society” column), the crimes averted generate both tangiblebenefits (e.g., less property loss, lost work time, and medical care) andintangible benefits (e.g., less pain and suffering).
It is worth noting that the range of outcomes enumerated inTable 4.1 that may generate monetary benefits to taxpayers, partici-pants, or the rest of the society is more limited than many of the out-comes typically measured in evaluations of early childhood interven-tion programs (see the discussion in Chapter Three). Although earlychildhood interventions may generate improvements in children’scognitive functioning or behavior and other socioemotional out-comes, these improvements do not readily translate into dollar gainsfor the stakeholders listed in Table 4.1. Moreover, almost all the out-comes in Table 4.1 that pertain to participating children are not seenuntil the children grow older, including many that are not observeduntil they reach adulthood. (This is less so for the parental outcomes,which may improve even when the children are very young.) Conse-____________3 A similar point can be made about taxes, but in reverse. Any increase in tax payments togovernment is simply a transfer away from individuals. Thus, any earnings gains for partici-pants should be measured net of taxes paid. Economists point out that taxes may also gener-ate deadweight losses (comparable to the administrative costs of transfer payments). Thedeadweight losses arise from the costs of collecting taxes and the distortionary effects of taxeson behavior (e.g., higher taxes are expected to reduce work effort). The administrative costsof tax collection are typically not accounted for in benefit-cost studies of early childhoodprograms. Any distortionary effects should be captured in the estimates of program effects(e.g., on earnings).

94 Early Childhood Interventions: Proven Results, Future Promise
quently, efforts to assess the full range of spillover benefits in Table4.1 require either long-term follow-up of participants in early child-hood programs or the ability to make predictions about improve-ments in these longer-term outcomes based on improvements in out-comes at younger ages.
The Use of Benefit-Cost Analysis
The range of potential spillover benefits (and in some cases costs) as-sociated with early childhood interventions that can be expressed inmonetary terms suggests that it is possible to compare the total costsof implementing an early childhood program with total benefits.Benefit-cost analysis is designed to allow such comparisons. In par-ticular, it is a tool that can be used to compare, for a given stake-holder, the total value of the benefits of a particular policy, relative toa given baseline, with the costs of the policy, again relative to thebaseline. Dollars provide a common unit of measurement for tallyingall costs and benefits, and all values are adjusted for inflation. Thedollar benefits of a program associated with a given outcome are de-rived from the effect of the program on that outcome (as assessed, forexample, in a randomized experiment where program effects aremeasured relative to a control group, the baseline) and the dollarvalue associated with a change in the outcome.
Given that program costs and benefits can occur at differentpoints in time (e.g., upfront costs with benefits that accrue into thefuture), all dollar figures are discounted at a constant annual rate to acommon point in time (e.g., the age of the child at the start of theprogram). This discounting converts all dollar figures into present-value terms. In other words, since receiving a dollar in the future isnot as attractive as receiving a dollar today, future dollars are worthless than today’s dollars. The farther into the future a dollar is re-ceived, the less it is worth in today’s dollars. Discount rates of 3 to 6percent per year are typically used in benefit-cost analyses of socialpolicy programs (Karoly et al., 2001), where higher discount ratesimply that future dollars are worth even less than would be the casewith a lower discount rate.

The Economics of Early Childhood Interventions 95
In addition to comparing the total present value of benefits andcosts, other summary measures from benefit-cost studies include netbenefits (the difference between present-value benefits and present-value costs, also known as net present value), and the benefit-cost ra-tio.4 A benefit-cost ratio that exceeds 1 is equivalent to net benefitsbeing greater than zero.
A simple example can be used to illustrate how the benefit-costcalculation is made. Consider an early childhood intervention pro-gram with a rigorous evaluation (e.g., a randomized experiment)showing that participation in the program for one year at age 4 re-duces years of special education used between ages 6 and 15 by 0.5years on average (i.e., special education usage is lower by half a yearfor the treatment group compared with the control group). If a yearof special education in 2003 dollars costs $10,000 more per childthan a year in a regular classroom, the half-year reduction in specialeducation use produces a savings of $5,000 per child served. The$5,000 savings needs to be applied at the specific age or ages that thesavings occurs. In this example, we use the midpoint of the age inter-val over which the effect is measured (in this case age 10). The valueof $5,000 accrued at age 10 would be discounted at a fixed rate (say 3percent per year) from age 10 to age 4 of the child, so it can be com-pared with the upfront program costs incurred at age 4. In this case,the present value of the savings in special education costs is $4,065per child in 2003 dollars, discounting to age 4 using a 3-percent discount rate. If the cost of the one-year program is $2,000,then the program generates net benefits of $2,065 per child and abenefit-cost ratio of 2.03, or a return of $2.03 for every dollar in-vested. In this example, just one source of spillover benefits is in-cluded (i.e., special education use). Other benefit (or cost) streamscan be included as well, each based on the estimated program effect,the estimated dollar benefit (or costs) associated with that effect, and____________4 Another summary measure that is sometimes calculated is the internal rate of return (IRR)(see, for example, Rolnick and Grunewald, 2003). The IRR is the discount rate at which thenet present value (present-value benefits minus present-value costs) equals zero. The IRR willexceed the discount rate when net benefits are greater than zero.

96 Early Childhood Interventions: Proven Results, Future Promise
the associated discounting, depending on the time path over whichthe dollar benefits (or costs) accrue.
The comparison of benefits and costs, and the summary meas-ures, can be calculated for society as a whole or for different stake-holders, such as the government (e.g., public sector) or the privatesector (e.g., program participants and nonparticipants). As noted inTable 4.1, some of the effects of early childhood programs may gen-erate little benefit to society overall because there are offsetting bene-fits to different segments of society, such as the government and par-ticipants (welfare benefits were the example noted earlier). Thus, thedistribution of benefits and costs across stakeholders may be of inter-est.
In the context of early childhood intervention programs,benefit-cost analyses are limited by the range of benefits that can bemonetized (Karoly et al., 2001). Although costs may be easy to meas-ure, the benefits—especially those that accrue far in the future—maynot be readily available, especially if there has been no long-termfollow-up. If early childhood programs are evaluated when the par-ticipants are still young and long-term outcomes have not been ob-served and cannot be reasonably predicted, measures of their present-value benefits are often incomplete and hence very low. Even whenthere is long-term follow-up, evaluations may focus on outcomes forparticipating children, with less information about potential benefitsto parents or descendents. In addition, the monetary value of somebenefits can be controversial. For example, reductions in crime areassociated with tangible benefits to potential crime victims (e.g., re-duction in injury, lost work time), but there may be intangible bene-fits as well (e.g., reduction in pain and suffering). The latter type ofbenefit is harder to value and therefore is sometimes omitted frombenefit-cost studies (Karoly et al., 1998).
Benefit-cost analysis has other limitations more generally thatshould be kept in mind as well. While the analysis may look at bene-fits and costs from the standpoint of different stakeholders, the ap-proach generally places equal weight on benefits, regardless of whogains. Thus, distributional concerns of decisionmakers are generallynot accounted for. Indeed, benefit-cost analysis is typically conducted
The Economics of Early Childhood Interventions 97
from the perspective of a hypothetical “social planner,” where theweights attached to the benefits and costs that accrue to differentstakeholders are assumed to be those of this benevolent decision-maker.
The notion of a social planner also abstracts from the real-worldproblems that arise when the costs of an early childhood program areborne by one stakeholder and the benefits accrue to another. For ex-ample, program costs may be covered by the public sector, whereasthe benefits are realized by private individuals, either participants ornonparticipants. In other cases, all the benefits and costs may accruewithin the public sector but are distributed across different publicagencies. Program costs may come out of the health and humanservices department’s budgets, but the downstream savings are real-ized by the education and public safety departments. This misalign-ment in costs and benefits across the various stovepipes of the publicsector, or between the public and private sectors, makes it difficult tofind the support among all the needed parties for investing in an earlychildhood intervention.
Benefit-cost analysis also typically does not consider the possiblerole of altruism in the valuation of program benefits. Some membersof society may value the benefits of an early childhood program thataccrue to participants even if they do not directly experience any per-sonal gain (e.g., through reduced crime rates). Such valuations aredifficult to measure, and there is little empirical basis for making es-timates in the early childhood field. Evidence from other areas of so-cial policy suggest that altruistic valuations may be at least as large asthe private valuations typically accounted for (Viscusi, Magat, andForrest, 1988).
Benefit-Cost Studies of Early Childhood Interventions
Benefit-cost analyses have been conducted for a subset of the 20 pro-grams discussed in earlier chapters.5 In this section, we review the re-____________5 Benefit-cost analyses have also been conducted for potential early childhood programs,such as a universal preschool program in California (Karoly and Bigelow, 2005), New York
98 Early Childhood Interventions: Proven Results, Future Promise
sults from those analyses to determine the extent to which earlychildhood intervention programs can be justified on economicgrounds. Before presenting results for these studies, standardized tomake them as comparable as possible, we first highlight some meth-odological differences that can affect the ability to make valid com-parisons across studies.
Programs Analyzed and Methods Used
Table 4.2 summarizes the early childhood interventions that have as-sociated benefit-cost studies, noting the age at last follow-up of theparticipants, the age to which benefits and costs are discounted, thediscount rate, and the year in which dollar values are denominated.Among the programs that provide home visiting or parent education,Aos et al. (2004) conduct a benefit-cost analysis for the HIPPY USAprogram and for the full sample of the NFP program, and Karolyet al. (1998) present results for higher-risk and lower-risk samplesparticipating in the NFP program.6 Aos et al. (2004) also includebenefit-cost estimates for home visiting programs for at-risk mothersand children more generally, based on a meta-analysis of 13 suchprograms. Among programs that combine home visiting or parenteducation with ECE, benefit-cost analyses have been conducted forthe CCDP and IHDP by Aos et al. (2004), the Carolina Abecedarianprogram by Masse and Barnett (2002), and the Chicago CPC byReynolds et al. (2002). Benefit-cost studies of the Perry Preschoolprogram include analyses based on the age-27 follow-up data byKaroly et al. (1998), Barnett (1993), and Schweinhart, Barnes, andWeikart (1993) and based on the age-40 follow-up data by Barnett,Belfield, and Nores (2005). Aos et al. (2004) also include a meta-analysis of 48 early childhood education programs for three- and______________________________________________________(Belfield, 2004a), and Ohio (Belfield, 2004b). These analyses typically draw on the programeffects from one or more of the programs reviewed in Chapter 3.6 The Karoly et al. (1998) benefit-cost analysis was based on the Elmira trial of the NFP,referenced as the Elmira PEIP. The evaluation of the Elmira PEIP provided separate resultsfor a sample of higher-risk first-time mothers (those who were unmarried and had low SES)and a lower-risk sample (all other sample members, generally those who were either single orhad low SES).
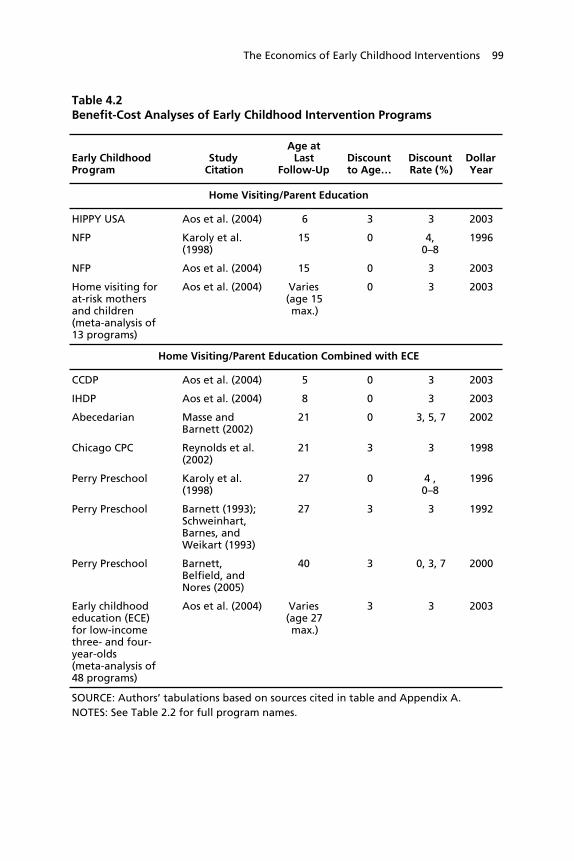
The Economics of Early Childhood Interventions 99
Table 4.2Benefit-Cost Analyses of Early Childhood Intervention Programs
Early ChildhoodProgram
StudyCitation
Age atLast
Follow-UpDiscountto Age…
DiscountRate (%)
DollarYear
Home Visiting/Parent Education
HIPPY USA Aos et al. (2004) 6 3 3 2003
NFP Karoly et al.(1998)
15 0 4,0–8
1996
NFP Aos et al. (2004) 15 0 3 2003
Home visiting forat-risk mothersand children(meta-analysis of13 programs)
Aos et al. (2004) Varies(age 15max.)
0 3 2003
Home Visiting/Parent Education Combined with ECE
CCDP Aos et al. (2004) 5 0 3 2003
IHDP Aos et al. (2004) 8 0 3 2003
Abecedarian Masse andBarnett (2002)
21 0 3, 5, 7 2002
Chicago CPC Reynolds et al.(2002)
21 3 3 1998
Perry Preschool Karoly et al.(1998)
27 0 4 ,0–8
1996
Perry Preschool Barnett (1993);Schweinhart,Barnes, andWeikart (1993)
27 3 3 1992
Perry Preschool Barnett,Belfield, andNores (2005)
40 3 0, 3, 7 2000
Early childhoodeducation (ECE)for low-incomethree- and four-year-olds(meta-analysis of48 programs)
Aos et al. (2004) Varies(age 27max.)
3 3 2003
SOURCE: Authors’ tabulations based on sources cited in table and Appendix A.NOTES: See Table 2.2 for full program names.
100 Early Childhood Interventions: Proven Results, Future Promise
four-year olds, from which they generate a benefit-cost estimate forthis generic program model.
When comparing outcomes from these analyses (ten studies forseven specific programs and two for generic program types), it is im-portant to keep in mind key differences in the information availablefor each program and methods used, differences that may affect esti-mates of net program benefits and benefit-cost ratios. First, there arethe underlying differences in the evaluation methodologies discussedin Chapters Two and Three. For example, of the specific programslisted in Table 4.2, the CPC evaluation uses a quasi-experimental de-sign, and problems with the execution of the experimental design forthe CCDP program have been identified. The estimates of outcomeeffects for the meta-analysis of home visiting programs and of earlychildhood education programs by Aos et al. (2004) are based on pro-gram evaluations of varying quality. Another evaluation difference isthe variation in baseline services offered. As noted in Chapter Two,Abecedarian, Project CARE, and IHDP provided some health, devel-opmental, or family services to the control group, so the programcosts and benefits are relative to a baseline that includes some reme-dial services. This would tend to lower the program effects and there-fore the dollar benefits compared with a baseline in other programevaluations where such services are not offered.7
Second, Table 4.2 shows that the follow-up periods available forthe benefit-cost analyses range from as short as to age 5 in the CCDPanalysis to as long as to age 27 or 40 in the Perry Preschool study.Longer follow-ups are also available for the NFP (age 15), Abecedar-ian (age 21), and Chicago CPC (age 21). Those studies with longer-term follow-up are more likely to be able to measure many of theoutcomes included in Table 4.1 that generate economic benefits tovarious stakeholders. Studies with only short-term follow-up may in-clude only outcomes that cannot be readily translated into dollar val-____________7 Because program costs should be measured relative to the baseline, they should also belower compared with an intervention that includes the baseline services for the treatmentgroup only. The effect on net benefits will depend on the value of the marginal benefit of thebaseline services versus the costs of those services.

The Economics of Early Childhood Interventions 101
ues. Therefore, net benefits and benefit-cost ratios are likely to belower for studies with shorter follow-up periods.
Third, the studies use different methods for discounting dollarsin terms of the reference age, discount rate, and year for which dollarsare valued. Studies typically discount benefits and costs to the yearchildren begin participating in a program. Thus, as seen in Table 4.2,those programs that start at birth—most of the home visiting/parenteducation programs and the CCDP, IHDP, and Abecedarian pro-grams—discount to age 0. With the exception of the Karoly et al.(1998) study of the Perry Preschool program, the other studies inTable 4.2—all ECE programs that start a year or two before kinder-garten entry—discount to age 3. In terms of discount rates, moststudies report results for one rate, typically 3 or 4 percent; a few pre-sent estimates for discount rates that range between 0 and 8 percent.Finally, results are reported in 1992 dollars up to 2003 dollars. In thecomparison of results that we present below, we adjust for thesemethodological differences across studies by discounting all benefitsand costs to age 0 using a 3 percent discount rate with all dollar val-ues converted to 2003 dollars.8
Fourth, while all studies have access to comprehensive measuresof program costs, the studies vary in the benefits that are valued andthe extent to which benefits are based on observed outcomes and/orprojected beyond the follow-up period. Table 4.3 summarizes thespillover benefits (and costs, in some cases) that are measured in the12 studies. The categories in the table mirror those included in Table4.1, with the exception of reduced teen childbearing and improvedpregnancy outcomes, neither of which was valued in dollar terms inany of the studies (primarily because they were not measured in theprogram evaluations). For each outcome included in Table 4.3, thecell entries indicate whether the study valued benefits based on____________8 The Karoly et al. (1998) study is the only one that does not report results for a 3-percentdiscount rate, although results were presented for discount rates range from 0 to 8 percent(see Figures 3.7 and 3.8 in that study). To convert all dollars to 2003 values, we use theConsumer Price Index for All Urban Consumers (CPI-U) (see U.S. Department of Labor,undated).

Table 4.3Benefits (Costs) Included in Selected Benefit-Cost Studies of Early Childhood Intervention Programs
Home Visiting/Parent Education Home Visiting/Parent Education Combined with ECE
Benefits (costs)
HIPPYUSA
(age 6)NFPa
(age 15)NFPb
(age 15)
HV(meta)(varies)
CCDP(age 5)
IHDP(age 8)
Abece-darian
(age 21)
ChicagoCPC
(age 21)
PerryPreschoolc
(age 27)
PerryPreschoold
(age 27/40)
ECE(meta)(varies)
Child careValue of childcare
C C C C
Child maltreatment
Child welfaresystemsavings
C* C* C C*
Savings tovictims ofchildmaltreatment
C* C* C C*
Child accidents and injuries
Emergencyroom visitssavings
C
Other publichealth caresavings
102 Early Ch
ildh
oo
d In
terventio
ns: Pro
ven R
esults, Fu
ture Pro
mise

Table 4.3—continued
Home Visiting/Parent Education Home Visiting/Parent Education Combined with ECE
Benefits (costs)
HIPPYUSA
(age 6)NFPa
(age 15)NFPb
(age 15)
HV(meta)(varies)
CCDP(age 5)
IHDP(age 8)
Abece-darian
(age 21)
ChicagoCPC
(age 21)
PerryPreschoolc
(age 27)
PerryPreschoold
(age 27/40)
ECE(meta)(varies)
Education
K–12educationsavings
C C C C C
Specialeducationsavings
C C C C C
(Post-secondaryeducationcosts)
C C* C* C*
Employment
After-taxearnings
C** P P* P* C**, P*,D**
C** C* C* C*
Taxes onearnings
C** P P* P* C**, P*,D**
C** C* C* C*
The Eco
no
mics o
f Early Ch
ildh
oo
d In
terventio
ns 103
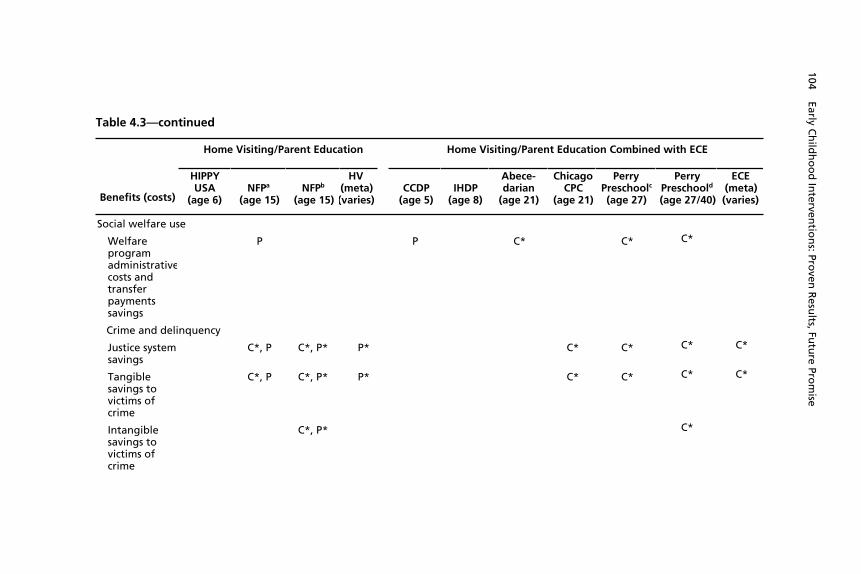
Table 4.3—continued
Home Visiting/Parent Education Home Visiting/Parent Education Combined with ECE
Benefits (costs)
HIPPYUSA
(age 6)NFPa
(age 15)NFPb
(age 15)
HV(meta)(varies)
CCDP(age 5)
IHDP(age 8)
Abece-darian
(age 21)
ChicagoCPC
(age 21)
PerryPreschoolc
(age 27)
PerryPreschoold
(age 27/40)
ECE(meta)(varies)
Social welfare use
Welfareprogramadministrativecosts andtransferpaymentssavings
P P C* C* C*
Crime and delinquency
Justice systemsavings
C*, P C*, P* P* C* C* C* C*
Tangiblesavings tovictims ofcrime
C*, P C*, P* P* C* C* C* C*
Intangiblesavings tovictims ofcrime
C*, P* C*
104 Early Ch
ildh
oo
d In
terventio
ns: Pro
ven R
esults, Fu
ture Pro
mise

Table 4.3—continued
Home Visiting/Parent Education Home Visiting/Parent Education Combined with ECE
Benefits (costs)
HIPPYUSA
(age 6)NFPa
(age 15)NFPb
(age 15)
HV(meta)(varies)
CCDP(age 5)
IHDP(age 8)
Abece-darian
(age 21)
ChicagoCPC
(age 21)
PerryPreschoolc
(age 27)
PerryPreschoold
(age 27/40)
ECE(meta)(varies)
Smoking and substance abuse
Public healthcare savings
P C
Savings ofprivate costsof prematuredeath
P C
SOURCE: Authors’ tabulations based on sources cited in Table 4.2.NOTES: See Table 2.2 for full program names. Cell symbols indicate the benefit (cost) for this outcome is monetized for theparticipating child (C), and/or the participating child’s parent(s) (P) and/or descendents (D). In the Abecedarian program, descendentsare projected for generations two through four.* Benefit (cost) based both on observed outcomes as of the age of last follow-up and a projection beyond the age the individual waslast observed.**Benefit (cost) based only on a projection beyond the age the individual was last observed.a Karoly et al. (1998).bAos et al. (2004).cKaroly et al. (1998).d Barnett (1993), Schweinhart, Barnes, and Weikart (1993); Barnett, Belfield, and Nores (2005).
The Eco
no
mics o
f Early Ch
ildh
oo
d In
terventio
ns 105

106 Early Childhood Interventions: Proven Results, Future Promise
changes in the outcome for the participating child (C), and/or thechild’s parents (P) or descendents (D). A single asterisk indicates thatbenefits were based on both observed outcomes and projections be-yond the age at last follow-up; a double asterisk, that only projectedbenefits were measured. (No asterisk means the benefits were basedon observed outcomes only.) For example, earnings may be observedup to a certain age and then projected beyond the last age observed,based on observed or expected education levels and other individualcharacteristics.
As illustrated in the table, most benefits are valued based onchanges in outcomes for participating children, and the range ofbenefits measured is more comprehensive for studies with longer-term follow-up. For example, benefits in adulthood, such as employ-ment outcomes and social welfare program use, are limited to studieswith follow-up to early or middle adulthood. Fewer studies valuebenefits for parents, typically because parental outcomes are notmeasured. Only the Abecedarian benefit-cost study includes a projec-tion of benefits for descendents of participating children, based onestimates from studies of the intergenerational transmission of earn-ings. Benefits projected beyond the age at last follow-up are mostcommonly the earnings of the participating child or the child’s par-ents and the savings to the criminal justice system and victims ofcrime and, less commonly, to the child welfare system and victims ofchild maltreatment.9 When victim costs are considered, several stud-ies are conservative in measuring only the value of averting the tangi-____________9 When such projections are made, they are generally calculated with conservative assump-tions, and sensitivity analyses are done to see whether results change substantially when al-ternative assumptions are used. Moreover, since the projected benefits are so far in the fu-ture, they are heavily discounted and therefore not a very large part of the estimated totalbenefits. For example, the results for the Perry Preschool program based on the age-40follow-up data demonstrate that the actual benefits realized between ages 27 and 40 weremuch larger than researchers had projected based on the observed outcomes through age 27(see Barnett, 1993; Schweinhart, Barnes, and Weikart, 1993; and Barnett, Belfield, andNores, 2005).

The Economics of Early Childhood Interventions 107
ble victim costs, although others include intangible victim costs aswell.10
Fifth, other aspects of the benefit-cost methodologies vary acrossthe studies as well. Notably, the programs analyzed by Aos et al.(2004) were assessed in the context of benefits for Washington statepolicymakers. Hence, estimates of benefits were typically based onsavings to government and other benefits based on dollar figures forthe state of Washington. Likewise, many of the savings estimates forthe Chicago CPC program by Reynolds et al. (2002) used cost datarelevant for Illinois. In addition, in the Aos et al. (2004) methodol-ogy, the program effects reported for each study, converted to effectsizes, are adjusted to account for the quality of the evaluation designand whether the program effects are measured in real-world settings(i.e., effect sizes are scaled back for weaker study designs and small-scale model programs that are conducted in highly controlled researchsettings). For some programs, the estimated program effects are ad-justed to equal zero given the weak evaluation design or the possibil-ity that results might be weaker when the program is implemented ona larger scale. Effect sizes based on meta-analyses of multiple pro-grams also use these adjusted effect sizes. Thus, the estimated benefitsbased on these effects are arguably more conservative than those esti-mated in the other studies shown in Table 4.2.
These methodological differences are particularly relevant forthree of the programs studied. The benefit-cost analysis of the IHDPconducted by Aos et al. (2004) does not estimate values for any of thebenefits shown in Table 4.3. In that case, the only outcome thatcould potentially generate dollar savings, given the short follow-upperiod (to age 8), is test scores, and the adjusted effect size is zero.The benefit-cost analyses, also by Aos et al. (2004), of the two otherstudies with short-term follow-up—CCDP and HIPPY (to ages 5and 6, respectively)—include just one category of benefits each. The____________10 Estimates of the intangible benefits of crime reduction can be much larger than the tangi-ble benefits (for estimates, see Miller, Cohen and Wiersema, 1996).

108 Early Childhood Interventions: Proven Results, Future Promise
CCDP includes only the value of a change in welfare use among par-ents; the estimated effect indicates that welfare usage increased,thereby raising the cost to government. Because the effect for the soleoutcome of this program involves higher costs for society as a whole(as a result of the administrative costs of greater welfare payments),the program cannot possibly break even. In the case of the HIPPYUSA program, the benefit-cost analysis estimates values for the pro-jected lifetime earnings gain based on the program’s effect on testscores at an early age.11 Barring a large change in the single outcomeconsidered, coupled with considerable savings from the change, thisprogram would be expected to have smaller estimated benefits thanthe other studies in Table 4.2, which measure multiple sources ofbenefits.
Results of Benefit-Cost Analyses
Given these differences in methodology, we must be cautious incomparing the results of benefit-cost analyses for the programs citedin Table 4.2. The studies measure considerably different sets of out-comes and therefore do not evaluate a consistent set of benefits, mostoften due to data limitations. Other methodological differences limitthe comparability of the findings as well. So the results should not beused to determine which program or type of program is likely to gen-erate the “biggest bang for the buck.” With longer-term follow-upand more-comprehensive assessments of outcomes affected, programsthat have low benefit-cost ratios based on information available todaycould have more favorable results with a more complete accounting.The results can be used, however, to demonstrate whether, in princi-ple, early childhood intervention programs can generate benefits thatoutweigh the program costs.
Table 4.4 presents the results of the benefit-cost analyses forseven individual programs and two generic program types. The table____________11 The CCDP evaluation also measured children’s test scores and the HIPPY study meas-ured the effect of the program on special education use. In both cases, however, the adjustedeffect sizes calculated by Aos et al. (2004) for these outcomes were zero, so they made nocontribution to the value of program benefits.

Table 4.4Benefit-Cost Results of Selected Early Childhood Intervention Programs
Distribution of Benefits per Child ($)
Program Type
Age atLast
Follow-Up
ProgramCosts
per Child($) Participants
Savings to
Government
Restof
Society
TotalBenefits
to Societyper Child
($)
NetBenefits
toSociety
per Child($)
Benefit-CostRatio
Follow-Up During Elementary School Years
CCDP Combo 5 37,388 91 –101 0 –9 –37,397 ––
HIPPY USA HV/PE 6 1,681 1,940 485 607 3,032 1,351 1.80
IHDP Combo 8 49,021 0 0 0 0 –49,021 ––
Follow-Up During Secondary School Years
NFP—higher-risksample
HV/PE 15 7,271 1,277 32,447 7,695 41,419 34,148 5.70
NFP—lower-risksample
HV/PE 15 7,271 2,051 5,095 2,005 9,151 1,880 1.26
NFP—full sample HV/ PE 15 9,118 2,674 9,548 14,075 26,298 17,180 2.88
HV for at-riskmothers andchildren(meta-analysis)
HV/PE Varies 4,892 6,194 1,815 2,960 10,969 6,077 2.24
The Eco
no
mics o
f Early Ch
ildh
oo
d In
terventio
ns 109

Table 4.4—continued
Distribution of Benefits per Child ($)
Program Type
Age atLast
Follow-Up
ProgramCosts perChild ($) Participants
Savings to
Government
Restof
Society
TotalBenefits
to Societyper Child
($)
NetBenefits
to Societyper Child
($)
Benefit-CostRatio
Follow-Up to Early Adulthood
Abecedarian Combo 21 42,871 n.a. n.a. n.a. 138,635 95,764 3.23
Chicago CPC Combo 21 6,913 22,715 19,985 6,637 49,337 42,424 7.14
Perry Preschool(excludingintangible crimecosts)
Combo 27 14,830 22,599 37,724 16,104 76,426 61,595 5.15
Perry Preschool(includingintangiblecrime costs)
Combo 27 14,830 23,486 106,136 129,622 114,792 8.74
ECE for low-income three-and four-year-olds(meta-analysis)
Combo Varies 6,681 6,036 4,329 5,377 15,742 9,061 2.36
110 Early Ch
ildh
oo
d In
terventio
ns: Pro
ven R
esults, Fu
ture Pro
mise

Table 4.4—continued
Distribution of Benefits per Child ($)
Program Type
Age atLast
Follow-Up
ProgramCosts
per Child($) Participants
Savings to
Government
Restof
Society
TotalBenefits
to Societyper Child
($)
NetBenefits
to Societyper Child
($)
Benefit-Cost
Ratio
Follow-Up to Middle Adulthood
Perry Preschool Combo 40 14,830 61,866 191,288 253,154 238,324 17.07
SOURCE: Author’s calculations based on Karoly et al. (1998), Table 3.7 (NFP high- and low-risk and Perry Preschool excludingintangible crime costs); Masse and Barnett (2002), Table 8.2 (Abecedarian); Reynolds et al. (2002), Table 5 (Chicago CPC); Barnett(1993), Table 3 (Perry Preschool age 21 follow-up including intangible crime costs); Barnett, Belfield, and Nores (2005), Table 7.8(Perry Preschool age 40 follow-up); and Aos et al. (2004), Table 1 and Appendix (all other programs).
NOTES: See Table 2.2 for full program names. All dollar values are 2003 dollars per child and are the present value of amounts overtime where future values are discounted to age 0 of the participating child, using a 3 percent annual real discount rate. Numbersmay not sum due to rounding. n.a. = not available; Combo = HV/parent education combined with ECE; ECE = early childhoodeducation; HV = home visiting; PE = parent education.
The Eco
no
mics o
f Early Ch
ildh
oo
d In
terventio
ns 111

112 Early Childhood Interventions: Proven Results, Future Promise
first records the program type according to our taxonomy and the ageat last follow-up. The remaining columns show the estimated presentvalue of the costs of each program (or type of program) per child andthe present value of total program benefits per child for society as awhole, all in 2003 dollars discounted to age 0 using a 3 percent realdiscount rate. The distribution of total benefits to society is alsoshown, accounting for the amount of present-value benefits per childthat accrue to participants, to government, and to the rest of society(i.e., nonparticipants). Net benefits per child are shown as well (basedon the total benefits to society), along with the benefit-cost ratio. Inrecognition of the differing follow-up periods, the results are pre-sented in four panels based on the age of participants at the time ofthe last follow-up: the elementary school years, the secondary schoolyears, early adulthood, and middle adulthood.12
As seen in the third column of the table, the programs vary con-siderably in terms of present-value cost, from less than $2,000 perchild for the HIPPY program to nearly $50,000 per child for theIHDP. These cost differences reflect, in part, the differential intensityof resources used based on the length of time over which services weredelivered (e.g., up to five years from birth to school entry or forshorter periods of time) and the hours of services delivered duringthose ages. Likewise, measured present value total benefits to societyalso vary across programs, from –$9 and $0 per child, respectively, forthe CCDP and IHDP (noted above for the shorter follow-up periods,limited outcomes measured, and lack of favorable effects in the caseof CCDP) to over $250,000 per child for the Perry Preschool pro-gram based on the age-40 results (the program with the longestfollow-up period). Consequently, net benefits range from negativenumbers (for CCDP and IHDP) to large positive numbers (notablyfor Perry Preschool). Eliminating the two programs for which thebenefit-cost ratio is not applicable (because of zero or negative bene-fits), the ratio ranges from 1.80 for HIPPY to 17.07 for Perry Pre-school.____________12 For the results based on the meta-analysis, the age at last follow-up varies, so we rely onthe oldest age among the studies included.

The Economics of Early Childhood Interventions 113
The distribution of present-value benefits between differentstakeholders is available for all but the Abecedarian program. (In thecase of the Perry Preschool results at age 27—when intangible crimecosts are included—and at age 40, the savings to government arecombined with benefits to the rest of society.) Excluding CCDP andIHDP, all programs generate positive benefits to participants, gov-ernment, and the rest of society. Where they are disaggregated, thebenefits to participants are substantial in the case of Perry Preschool(regardless of the study) and Chicago CPC (from about $23,000 to$62,000 per child). The savings to government, while positive (asidefrom the two exceptions), are not always large enough to cover thecosts of the program. This is the case for the NFP lower-risk sample,the HIPPY USA program, and the generic home visit and ECE pro-grams based on the Aos et al. (2004) meta-analysis. In these cases,although total benefits to society exceed the program costs, the meas-ured savings to government would not be enough to pay for the costof the program.
It is important to emphasize again the underlying differences inmethodology used to generate the results in Table 4.4. Notably, pro-grams with longer follow-up periods tend to have higher estimates oftotal benefits, net benefits, and benefit-cost ratio. As noted earlier,programs such as Abecedarian, Chicago CPC, and Perry Preschoolcan measure outcomes at older ages that are more readily translatedinto dollar benefits, with possibly substantial savings to all stake-holders. These include such favorable outcomes as higher earningsthrough early adulthood or middle adulthood (a benefit to partici-pants and taxpayers resulting from higher tax payments), reduced re-liance on social welfare programs (a benefit to taxpayers), and reducedcontact with the criminal justice system (a benefit to both taxpayersand other members of society). A comparison of the results for thePerry Preschool program at ages 27 and 40 clearly illustrates the bene-fit of long-term follow-up. With longer follow-up, the net benefitsand benefit-cost ratio for Perry Preschool more than double: from$115,000 to $238,000 in net benefits per participant and from $8.74to $17.07 in benefits for every dollar invested. This is because the ac-tual earnings gains and reduced criminal activity measured between

114 Early Childhood Interventions: Proven Results, Future Promise
ages 27 and 40 were even larger than researchers had predicted, basedon outcomes observed at age 27. The choice of which benefits tovalue can also make a difference. Based on the age-27 follow-up, theestimated benefit-cost ratio for the Perry Preschool program rangesfrom 5.15 to 8.74, where the intangible crime savings are excludedfrom the former figure but included in the latter.
Despite these differences in methodology and the resultingvariation in the estimated net benefits and benefit-cost ratios, the re-sults demonstrate several key findings with respect to the economicsof early childhood investments. First, it is possible in principle forearly childhood interventions to generate short-term and longer-termsbenefits that can more than offset program costs. Two of the threeindividual home visiting/parent education programs analyzed havegenerated positive net benefits. When results are combined acrossmultiple evaluations of home visiting programs and even when con-servative assumptions about average program effects are used, as inthe Aos et al. (2004) meta-analysis, home visiting programs are esti-mated to generate about $6,000 in net benefits per child, or $2.24 forevery dollar invested. Likewise, three of the four specific programsthat combined home visiting/parent education and ECE were shownto generate positive net benefits. Again, the Aos et al. (2004) meta-analysis of early childhood education programs for disadvantagedthree- and four-year olds conservatively estimates a return of nearly$16,000 in net benefits per child, or $2.36 for every dollar invested.Those programs without favorable net benefits or benefit-cost ratiosare either ineffective (e.g., CCDP) or limited in the outcomes avail-able to express in monetary terms (e.g., IHDP).
Second, the favorable economic returns from early childhood in-tervention programs are not limited to smaller-scale demonstrationprograms. It is true that the largest estimated return is for the rela-tively small-scale Perry Preschool program as of the age-40 follow-up(nearly $240,000 in net benefits per child, or a return of just over$17 for every dollar invested). This program has the longest follow-up period, and the benefit-cost ratio increases as it moves from esti-mates based on follow-up data through age 27 to data based on theage-40 follow-up. However, the larger-scale Chicago CPC program is
The Economics of Early Childhood Interventions 115
estimated to generate over $42,000 in net benefits per child, or $7.14for every dollar invested. The CPC, implemented in the Chicagopublic school system, demonstrates that economic benefits can accruefor programs that operate in multiple sites under public auspices.
Third, favorable benefit-cost ratios are achieved for both higher-cost, more-intensive programs and lower-cost, less-intensive pro-grams. The Abecedarian program is one of the most intensiveprograms among those with benefit-cost analyses, with full-time year-round center-based care provided from soon after birth up throughkindergarten entry. Despite the high cost of that intensive set ofservices, the program generates benefits to society that are over threetimes its costs—equal to nearly $96,000 in net benefits per child. Incontrast, the HIPPY program is the lowest-cost intervention with abenefit-cost analysis, yet it too is estimated to generate benefits to so-ciety of nearly $2 for every dollar invested, although net benefits perchild are just about $1,400.
Fourth, there is some evidence in Table 4.4 that effectively tar-geting program services generates more-favorable economic out-comes. The benefit-cost analysis of the NFP program conducted byKaroly et al. (1998) estimated results separately for both a higher-risksample of mothers and children served and a lower-risk sample. Be-cause the categories of benefits estimated for those two subsampleswere the same, a comparison of the benefit-cost results can be madewithout concern for differences in methodology. As seen in Table4.4, the net benefits per child were about 18 times as great for thehigher-risk sample ($34,148 versus $1,880), and the benefit-cost ra-tios were 5.70 and 1.26 for the higher-risk and lower-risk samples,respectively. These differences in results are due solely to the differen-tial effect of the early childhood program on the higher-risk versusthe lower-risk populations.
Other evidence of the relevance of targeting comes from studiesthat project the economic returns from universal programs. For ex-ample, the analyses by Karoly and Bigelow (2005) and Belfield(2004b) suggest that the returns from a universal preschool programwould be less than those measured for programs that serve a more-disadvantaged population. Nonetheless, the net benefits for society as

116 Early Childhood Interventions: Proven Results, Future Promise
a whole in both universal preschool studies are still estimated to bepositive, and the corresponding benefit-cost ratios exceed 1.
Finally, we note that the discussion in Chapter Three of the po-tential for declining returns associated with increased program inten-sity is also relevant for benefit-cost calculations. For example, thebenefit-cost ratio of 7.14 for the Chicago CPC program presented inTable 4.4 is based on a sample of children who, on average, had at-tended 1.5 years of preschool. Estimates provided by Reynolds et al.(2002) indicate that the benefit-cost ratio for the CPC program par-ticipants who attended for just one year was 12.02, compared with5.02 when children were in the program for two years.
Other Economic and Noneconomic Benefits of EarlyChildhood Interventions
Benefit-cost analysis can be extremely useful in demonstrating theeconomic returns from investing in early childhood interventions. Asnoted in the previous section, such estimates may be conservativebecause data limitations often preclude measuring the economicbenefits associated with all the potential benefits from changes inoutcomes for participants, their parents, and their descendents. Bene-fit-cost analyses typically do not account for other economic andnoneconomic benefits of early childhood interventions. In this sec-tion, we focus on potential labor market and macroeconomic bene-fits, as well as broader social benefits.
Labor Market Benefits
Early childhood programs that provide full-time care for childrenprior to kindergarten entry have the potential to increase the size ofthe workforce and improve labor market performance for workerswith young children—benefits to the parents of children who partici-pate in early childhood programs as well as to their employers (seeKaroly and Bigelow, 2005, for a recent review of the literature). Full-day preschool programs and the Abecedarian program, which pro-vided full-time care soon after birth until kindergarten entry, are both

The Economics of Early Childhood Interventions 117
relevant examples. Research indicates that women’s labor force par-ticipation rates increase as child care costs decline—more so for singlemothers and for low-wage women (see Blau, 2001, and Anderson andLevine, 2000, for reviews). The stability and quality of child care op-tions can also affect the decision to work or not, as well as perform-ance on the job. For example, a limited research base suggests that jobturnover and absenteeism may improve for workers who have accessto more formal, dependable sources of child care (Karoly and Bige-low, 2005).
The research evidence is too limited to calculate the potentialsize of the effect of early childhood programs on labor force participa-tion rates or worker performance. However, we would expect themagnitude of such effects on the labor market to depend upon thesize of the implicit child care subsidy (e.g., the subsidy would be 100percent for full-time programs made available to families withoutcharge) and the share of the population of workers with young chil-dren covered by the subsidy. In other words, a program that requiredfamilies to pay more of the costs, one that provided only part-timecare, or one that served a more targeted population would have asmaller effect than one with the opposite characteristics.
Macroeconomic Benefits
In addition to providing potential benefits for current workers withyoung children and for their employers, early childhood interventionsrepresent an investment in the future workforce. The benefit-costsanalyses reviewed in the previous section generally accounted for theprivate returns from this investment in the form of higher earnings inadulthood because of the expected increase in educational attainment.Some of the public returns associated with improved educational lev-els, such as higher taxes paid and lower levels of crime and welfareuse, were also evaluated in the benefit-cost studies. However, a moreeducated future workforce also has the potential to generate improvedmacroeconomic outcomes as well. Notably, a sizable research basequantifies the link between the level and growth of an economy’shuman capital (often measured by education levels) and the rate ofeconomic growth (see Krueger and Lindahl, 2001, for a recent re-
118 Early Childhood Interventions: Proven Results, Future Promise
view). Other evidence suggests that it is not just years of schoolingthat affect economic growth but the quality of school as well, asmeasured, for example, by math and science test scores (Hanushekand Kimko, 2000). Although economists have competing theories toexplain this relationship and empirical estimates vary, quantitativestudies suggest that education can have a large effect on economicgrowth (DeLong, Goldin, and Katz, 2003).
A related benefit is that a more educated, more skilled workforcecan strengthen the competitive position of the U.S. economy in anincreasingly competitive global marketplace. Technological change,coupled with globalization, has placed an increasing premium onmore-educated workers, and the ability of the U.S. economy to re-main competitive rests with the human capital of the workforce(Karoly and Panis, 2004). The future knowledge-based economy willvalue such skills as abstract reasoning, problem solving, communica-tion, and collaboration. Investments in early childhood interventions,to the extent that they raise eventual educational attainment andother measures of skills that are valued in the workplace, can helpraise the overall skill level in the economy and contribute to the eco-nomic success of the United States.
Noneconomic Benefits
To the extent that early childhood intervention programs generatethe longer-term benefits documented in studies reviewed in this andearlier chapters, they may also generate broader benefits to society.Notably, economic and social inequalities have been increasing in re-cent decades. Economic disparities have been manifested in a widen-ing gap between lower- and higher-wage workers and in the growthin income and wealth disparities for families (Burtless and Jencks,2003). Such disparities are also evident in the gaps in outcomes acrossrace and ethnic groups or across families defined by the educationlevel of the family head. Rising economic inequality has implicationsfor social disparities in such areas as family functioning, neighbor-hood quality, education, health, crime, and political participation(Neckerman, 2004). The strong relationship between these economicand social outcomes and education levels suggests that programs that
The Economics of Early Childhood Interventions 119
narrow educational gaps will have collateral benefits in terms of re-ducing economic and social disparities, both overall and among vari-ous demographic subgroups.
Strengths and Limitations of Economic Evidence
Early childhood interventions have the potential to generate spilloverbenefits to the government and the rest of society that can be ex-pressed in dollar terms and summed across various categories of bene-fits. Such benefits can then be compared with program costs to de-termine whether investments in early childhood programs can pay offin terms of shorter-term or longer-term benefits to various stake-holders. The review of evidence from benefit-cost studies presented inthis chapter indicates that it is possible, in practice, for early child-hood interventions to generate benefit streams that exceed the initialprogram costs.
This evidence is based on rigorous evaluations of a subset ofearly childhood programs and the associated studies that employ ac-cepted methods of benefit-cost analysis for social programs. Earlychildhood interventions with favorable estimates of net benefits andbenefit-cost ratios include home visiting/parent education programsand center-based ECE programs, including those that also includehome visiting or parent education. Such favorable economic returnshave been shown not only for smaller-scale demonstration programsbut also for larger scale, real-world programs. The evidence of theeconomic returns from investing in early childhood interventions isparticularly strong for programs that have long-term follow-up ofprogram participants, measure a broad array of outcomes, and serve amore targeted population. The estimated benefits, even when theyexceed program costs, can generally be viewed as conservative givenlimitations in the information available to predict benefits across thefull range of potential favorable outcomes, especially in studies withshort-term follow-up. The results of the studies reviewed here are alsoconservative in that they do not account for the other potential eco-nomic and noneconomic benefits typically not captured in benefit-

120 Early Childhood Interventions: Proven Results, Future Promise
cost studies, such as economy-wide benefits to the labor force and themacroeconomy.
The strength of the empirical evidence on the economic returnsfrom early childhood investments has led some economists and othersto frame such programs in the context of economic development(Rolnick and Grunewald, 2003; CED, 2004; Schweke, 2004). Tradi-tional vehicles for state and local economic development funds in-clude investments in infrastructure, business assistance, and work-force education and training. However, there is little empirical evi-dence to suggest that many of these activities generate positive neteconomic benefits for society as a whole. In some cases, jobs are ex-ported from one community to another, so the total gain is zero. Inother cases, jobs would have increased even without state and localeconomic development assistance, or the expected economic effectfails to materialize (Peters and Fisher, 2002; CED, 2004). In contrast,the favorable economic returns from early childhood interventionssuggest they can be a worthwhile public-sector investment with apositive payoff to society as a whole.
Although the evidence of the economic benefits from earlychildhood interventions is compelling, it is important to recognizethe limitations of the evidence base. Our analysis of the benefits andcosts of early childhood programs in this chapter is based on a smallnumber of programs with high-quality evaluations. While the resultsdemonstrate that an economic payoff is possible, they do not suggestthat such a payoff will exist for all early childhood interventions. Insome cases, the favorable effects found for small-scale model pro-grams may be attenuated when programs operate on a larger scale.The economic payoff may also be smaller when programs serve abroader population that does not stand to benefit to the same extentas more disadvantaged children served in targeted programs. In addi-tion, new program models that have not been evaluated may, in fact,be ineffective. For example, programs that invest too few resources orthat use resources in an ineffective manner may generate little in the
The Economics of Early Childhood Interventions 121
way of improvement for participating children and their families.13
Consequently, any economic benefit would be small or nonexistent.Thus, it is important to continue to assess early childhood programsin terms of their effects on the short- and long-term outcomes ofparticipating children and their families and to translate those im-provements into economic benefits that can be compared with pro-gram costs.____________13 For example, the CCDP proved ineffective, at least based on follow-up to age 5.

123
CHAPTER FIVE
Conclusions
The preceding chapters have addressed a range of issues related to in-vesting in the lives of children prior to school entry, particularly forchildren at risk of adverse developmental outcomes. In this conclud-ing chapter, we distill our synthesis of the research literature into aseries of key results about early childhood interventions. In high-lighting these results, we also point to important caveats and limits ofour knowledge base.
The period from birth to age 5 is one of opportunity andvulnerability for healthy physical, emotional, social, andcognitive development.
Human development is the result of the complex interplay amonggenetic endowments and environmental conditions. Both nature andnurture play key roles—alone, and in interaction with one another—throughout the life course. The first few years of life, however, repre-sent a particularly sensitive period in the process of development, aperiod of tremendous opportunity as well as vulnerability. Starting inthe prenatal period and continuing until kindergarten entry, childrenprogress through various developmental milestones associated withhealthy development that have implications for cognitive functioning;behavioral, social, and self-regulatory capacities; and physical health.Subsequent development builds upon these early capacities, so theyprovide an important foundation for future success in school andbeyond.

124 Early Childhood Interventions: Proven Results, Future Promise
A variety of factors can provide critical support of healthy childdevelopment during these early years, or they may compromise thedesired outcomes. They include the nature of early relationships withparents and other caregivers, the extent of cognitive stimulation, andaccess to adequate nutrition, health care, and other resources such as asafe home and neighborhood environment. Some children will beresilient in the face of various stressors in early childhood, whilehealthy development will be compromised for others, whether tem-porarily or more long-lasting.
A sizable fraction of children face risks that have the potential tolimit their development in the years prior to school entry.
A number of factors have been associated with risks of developmentaldelay and longer-term adverse outcomes. Living in poverty is onesuch factor that affects 20 percent of children under age 6, or 4.7million children overall: more than 50 percent of children living in afemale-headed household, 40 percent of African-American children,and 33 percent of Latino children.1 Independent of poverty status,children in single-parent families are at greater risk, along with thosewhose mothers have less than a high school education. Smaller, butstill sizable, numbers of children are potentially at risk due to lowbirthweight, limited use of preventive health care, and living in high-risk neighborhoods and linguistically isolated households. Almost 50percent of U.S. kindergarten children in a recent cohort examined aspart of the ECLS-K faced at least one of four risk factors (mother is ahigh school dropout, family receives welfare or food stamps, single-parent household, and parents whose primary language is not Eng-lish). Sixteen percent had two or more risk factors.
Exposure to these various sources of risk does not lead, with cer-tainty, to adverse outcomes in early childhood and beyond. For somechildren, various protective factors will provide them with the resil-ience to advance along a positive trajectory despite facing one or morerisks that may challenge healthy development. Other children ex-____________1 Welfare receipt is a related indicator of low family income.
Conclusions 125
posed to risk factors will not be as resilient, and the consequencesduring later periods of childhood and beyond can be considerable.
Variations in early childhood experiences are manifested indisparities in school readiness measures, and these gapsoften persist as children age.
Disadvantages in early childhood have implications for how preparedchildren are when they enter school. School readiness is a multi-dimensional concept that captures not only cognitive skills but alsothose associated with socialization, self-regulatory behavior, andlearning approaches. For the ECLS-K cohort, various assessments in-dicate that children with more disadvantaged backgrounds enterschool with lower levels of the knowledge and social competenciesthat are important for subsequent school success. When entering kin-dergartners are assessed in terms of their pre-reading and numeracyskills, pro-social behaviors, behavior problems, and readiness to learn,one of the sharpest contrasts that emerges is between children differ-entiated by mother’s education level. While these readiness measuresindicate that children from more-enriched environments enter schoolbetter prepared, longitudinal data demonstrate that these early gapspersist and even widen as children progress through school. Thus,disadvantaged children do not advance at the same rate as their more-advantaged peers, so that achievement gaps tend to widen over time.
These achievement gaps are also manifested in the high propor-tion of disadvantaged children who do not meet basic proficiencystandards in core subjects as they move through school. About 1 in 28th graders whose parents have less than a high school education donot demonstrate even partial mastery of fundamental reading ormathematics skills. By comparison, for students the same age whoseparents have a college education, the fraction is about 1 in 20. Theincidence of other undesirable outcomes, such as special educationuse, grade repetition, and dropping out of high school, is also higherfor more-disadvantaged children. Low rates of school achievement arethen associated with higher rates of undesirable outcomes in adult-hood, such as being disconnected from school or work; welfare de-pendency; and delinquency, crime, and imprisonment. Although
126 Early Childhood Interventions: Proven Results, Future Promise
there is not a perfect causal link among early childhood experiences,the extent of school readiness, and unfavorable outcomes in the tran-sition to adulthood, the risk factors that can compromise early devel-opment often lead to poor school performance and in turn to theadverse outcomes cited above. Even if only a portion of these detri-mental outcomes in childhood and adulthood can be averted, thebenefits may be substantial.
Early childhood intervention programs are designed to counteractvarious stressors in early childhood and promote healthydevelopment.
Early childhood interventions are designed to provide a protectiveinfluence to compensate for the risk factors that potentially compro-mise healthy child development in the years before school entry. Theprotective influence may take the form of additional supports for theparents, children, or family as a unit that can affect a child directlythrough structured experiences or indirectly by enhancing the care-giving environment. While they share a common objective, earlychildhood interventions are extremely varied in their methods andthere is no uniform model or approach. Key dimensions along whichprograms vary include
• the goals of the program in terms of outcomes the program aimsto improve
• whether the child, the parent, or the parent-child dyad is thetarget of intervention
• the criteria defining the target population, e.g., low socioeco-nomic status, single parenthood
• the time span from the prenatal period to age 5 over which theintervention occurs; the types of services included, where theyare provided, and the intensity with which they are delivered
• the extent of individualized attention• the program’s geographic reach.

Conclusions 127
Many of the program dimensions are dictated by the program goalsand the underlying theory of how child and family behaviors can bechanged by various environmental influences.
Rigorous evaluations of early childhood interventions can informour understanding of the array of outcomes at school entry andbeyond that programs may improve.
Although we may expect early childhood programs to produce bene-ficial effects based on underlying theories and knowledge of the com-plexities of early child development, a scientifically sound evaluationis required to know whether that promise holds in reality. The rangeof outcomes affected and the magnitudes of the effects are both ofinterest. The variation in early childhood intervention approachessuggests that such evaluations are needed for the full range of pro-gram models, ideally with the ability to ascertain the effects of varyingkey program features.
The best evaluation designs are those that provide the highestconfidence that effects attributed to the program are indeed the resultof the intervention, rather than some other influential factor or fac-tors. A randomized experiment, when implemented properly, is con-sidered the gold standard for investigating the causal effect of anintervention on the participants. Such designs are not always feasible,so researchers may apply quasi-experimental methods as an alternativeto an experimental design. In the absence of experimental conditions,such approaches may have weaknesses that compromise the ability todraw inferences about the true causal effect of a given intervention.
While many early childhood interventions have been imple-mented, and a subset of those have been evaluated in some fashion,only a relatively small subset have been evaluated using scientificallysound methods. Our review of the literature identified publishedevaluations for 20 early childhood programs with well-implementedexperimental designs or strong quasi-experimental designs. Theseprograms all serve children or their families from the prenatal periodto age 5, with a child development focus and assessment of programimpacts for child-specific outcomes. We excluded programs imple-mented outside the United States or before 1960, as well as those de-

128 Early Childhood Interventions: Proven Results, Future Promise
signed to primarily serve children with special needs. Some programswere excluded because their evaluations did not meet a set of mini-mum standards for scientific rigor (e.g., large enough sample size).Sixteen of the 20 programs have the strongest evidence base becausethey identify effects at the time of school entry or beyond. This groupincluded both effective and ineffective programs based on the statisti-cal significance of estimated program effects. The remaining fourprograms have a promising evidence base and evidence of favorableeffects, although they rely on measures of outcomes for children asyoung as 2 or 3.
Rigorous scientific research has demonstrated that early childhoodinterventions can improve the lives of participating children andfamilies in both the short run and longer run.
We examined the following benefit domains: cognition and academicachievement, behavioral and emotional competencies, educationalprogression and attainment, child maltreatment, health, delinquencyand crime, social welfare program use, and labor market success. Foreach of these domains (with the exception of social welfare programuse), statistically significant benefits were found in at least two out ofevery three programs we reviewed that measured outcomes in thatdomain.2 In some cases, the improved outcomes in these domainswere demonstrated soon after the program ended; in other cases, thefavorable effects were observed through adolescence and in the transi-tion to adulthood. In one case, lasting benefits were measured 35years after the intervention ended. Even though there is evidence thatearly benefits in terms of cognition or school achievement may even-tually fade, the evidence indicates that there can be longer-lastinggains in educational progress and attainment, labor market outcomes,dependency, and pro-social behaviors. In addition, a few studies indi-cate that the parents of participating children can also benefit from____________2 In the case of social services use in adulthood, this outcome was measured in only two ofthe five programs that measured effects in adulthood. The outcome was significant in onlyone of the two programs with this measure.

Conclusions 129
early intervention programs, particularly when they are specificallytargeted by the intervention.
The magnitudes of the favorable effects can often be sizable. Thesize of the effects tend to be more modest for cognitive and behav-ioral measures, and, as noted, the favorable gains in these measuresoften shrink in size over time. The effects are more substantial andlong-lasting for such outcomes as special education placement andgrade retention, as well as some of the other outcomes in adolescenceand adulthood. At the same time, it is important to note that the im-proved outcomes realized by participants in targeted early interven-tion programs are typically not large enough to fully compensate forthe disadvantages they face. For example, IQ and educationalachievement scores, prevalence of grade repetition, use of special edu-cation, high school graduation rates, and contacts with the criminaljustice system are all less favorable for intervention participants, evenafter the intervention, than they are for more-advantaged, nonpartici-pating children of similar age. Thus, while early intervention pro-grams can improve outcomes over what they otherwise would havebeen, they typically do not fully close the gap between the disadvan-taged children they serve and their more-advantaged peers.
Although the evaluations of these 20 programs can demonstratetheir effectiveness in terms of improving outcomes for participatingchildren and their families, they do not represent all early childhoodprograms, or even the subset of effective programs. Moreover, evi-dence of the effectiveness of a given program does not imply that allsimilar programs will have the same effect or that even the same pro-gram implemented under different conditions will have the same ef-fects. Ultimately, program effects may vary due to a variety of factors,including program design, the population served, and the local con-text in which a program is delivered.

130 Early Childhood Interventions: Proven Results, Future Promise
A very limited evidence base points to several program features thatmay be associated with better outcomes for children: better-trainedcaregivers, smaller child-to-staff ratios, and greater intensity ofservices.
The early intervention research literature has rarely formally evaluatedthe differential effect of varying key program features. While there area few exceptions, our inferences about what makes for successful in-terventions are drawn from experimental and quasi-experimentalevaluations of program design features, as well as comparisons of ef-fects across model programs based on variation in program features.As part of this study, we undertook one such analysis that consideredvariation in outcomes associated with program type. Such an analysisis limited, however, by the small amount of variation across programmodels with rigorous evaluations. Nevertheless, the evidence fromthis analysis, combined with what we know from formal evaluationsof variation in program features and other meta-analyses, suggeststhree features in particular that may be associated with more effectiveprograms.
First, programs with better-trained caregivers appear to be moreeffective. In center-based programs, this may take the form of a leadteacher with a college degree as opposed to no degree. In home visit-ing programs, researchers have found stronger effects when servicesare delivered by trained nurses as opposed to paraprofessional or layprofessional home visitors. Second, for center-based programs, thereis evidence to suggest that programs are more successful when theyhave smaller child-to-staff ratios. Third, there is some evidence thatmore-intensive programs are associated with better outcomes, al-though we are not able to definitively indicate, for example, the op-timal number of program hours and how they vary by childcharacteristics. It is likely that some minimum level of program hoursis required to improve outcomes, but that at some point the benefitsfrom additional hours may be less than what is gained from the initiallevel.
It is noteworthy that the features associated with more successfulprograms are costly. Thus, it appears that more money may need tobe spent to obtain larger effects. At the same time, there may be

Conclusions 131
thresholds after which diminishing marginal returns set in. The op-timal intensity of early childhood interventions and the timing ofthose interventions for different subgroups of children defined byvarious risk levels remain to be determined by further research.
The favorable effects of early childhood programs can translate intodollar benefits for the government, participants, and other membersof society..
Depending on the range and intensity of services delivered, earlychildhood interventions may range in cost from modest to a consid-erable financial investment. It is therefore reasonable to ask whetherthe costs can be justified in terms of the benefits associated with therange of favorable effects demonstrated by such programs. Indeed,many of the outcomes that early childhood programs improve maygenerate benefits that can be translated into dollar figures, aggregatedacross benefit categories, and compared with program costs.
For example, if school outcomes improve, there may be fewerresources spent on remedial education services in the form of repeatedgrades or special education classes. If improvements in school per-formance lead to higher educational attainment and subsequent eco-nomic success in adulthood, the government may benefit from highertax revenues and reduced outlays for social welfare programs and thecriminal justice system. As a result of improved economic outcomes,participants themselves benefit from higher lifetime incomes, andother members of society gain from reduced levels of delinquency andcrime. If early childhood interventions also lead to improvements inparental outcomes such as parents’ own educational attainment, laborforce outcomes, use of social welfare programs, or criminal activity,additional dollar benefits will flow to the government, participants,and other members of society.
Although a subset of the improved outcomes associated withearly childhood interventions cannot be readily translated into dollarbenefits (this is the case, for example, with measures of cognitive de-velopment, pro-social behaviors, or behavior problems), benefit-costanalysis can be used to aggregate the dollar benefits associated withthose outcomes that can be expressed in monetary terms and then to

132 Early Childhood Interventions: Proven Results, Future Promise
compare total benefits with total costs. Such comparisons are madetaking account of the time path of costs and benefits (i.e., an upfrontcost associated with the program followed by benefits that may accruein the near term or farther into the future). Benefits and costs can alsobe viewed from the perspective of various stakeholders, such as thepublic sector (i.e., the government or collectively members of societyas taxpayers) and components of the private sector, namely the pro-gram participants themselves or other members of society who werenot program participants.
Economic analyses of several early childhood interventionsdemonstrate that effective programs can repay the initialinvestment with savings to government and benefits tosociety down the road.
When early childhood programs are effective—in other words, whenthey have significant and meaningful effects on outcomes for partici-pating children and families—our analysis in Chapter Four showsthat it is possible for the dollar benefits associated with the favorableeffects to exceed program costs. Evidence that early childhood inter-ventions can be justified on economic terms comes from a sub-set of the 20 interventions we reviewed. In particular, one or morebenefit-cost analyses have been conducted for seven of the 20 pro-grams, while another study provides two other benefit-cost analysesbased on a meta-analysis of home visiting programs for at-risk chil-dren and a meta-analysis of early childhood education programs forlow-income three- and four-year olds. These benefit-cost studies relyon the results of the rigorous outcome evaluations of these programsand accepted methods for benefit-cost analysis. Although resultsacross programs are not strictly comparable because of differences inmethodology, they can demonstrate whether, in principle, earlychildhood interventions can generate benefits that outweigh the pro-gram costs.
The benefit-cost studies showed that two programs (CCDP andIHDP) were unable to exhibit positive net benefits to society as awhole. In one case, the program was not effective, so there were nosubstantial improvements that could lead to dollar savings. In the

Conclusions 133
other case, while the program had significant and favorable effects asof the last follow-up at age 8, none of the outcomes assessed could betranslated into dollar savings. For the remaining studies with positivenet benefits, the estimates of net benefits per child served range fromabout $1,400 to nearly $240,000. Viewed another way, the returns tosociety for each dollar invested extend from $1.26 to $17.07.
Positive net benefits were found for programs that required alarge investment (e.g., the Abecedarian program with intensive serv-ices over five years that cost over $40,000 per child), as well as thosethat cost considerably less (e.g., HIPPY, which costs less than $2,000per child). Programs with per-child costs within this range also gener-ated positive net benefits. The economic returns were favorable forprograms that focused on home visiting or parent education, as wellas those that combined those services with early childhood education.The largest benefit-cost ratios were associated with programs havinglonger-term follow-up because they allowed measurement at olderages of such outcomes as educational attainment, delinquency andcrime, earnings, and others that most readily translate into dollarbenefits. Not only do the studies with measured improvements basedon long-term follow-up demonstrate that the benefits from early in-terventions can be long-lasting, they also give more confidence thatthe savings the programs generate can be substantial. Programs withevaluations that have followed children only until school entry or afew years beyond typically do not measure those outcomes that arelikely to be associated with the largest dollar benefits, although theymay eventually generate large savings as well.
Limitations in translating the full range of benefits from earlychildhood interventions into dollar values means that most benefit-cost calculations of effective programs are likely to understate thedollar benefits, and hence estimates of net benefits and the benefit-cost ratio will be underestimated as well. Moreover, such analysesdo not incorporate some of the other potential economic and non-economic benefits that may flow from effective early interventions.These include improved labor market performance for the parents ofparticipating children and their employers, as well as stronger eco-nomic growth and competitiveness as a result of improvements in

134 Early Childhood Interventions: Proven Results, Future Promise
educational attainment and skills of the future workforce. Effectiveinterventions may also produce a lessening of economic and socialdisparities, which may be valued by society as well.
The economic benefits of early childhood interventions are likelyto be greatest for programs that effectively serve targeted,disadvantaged children compared with universal programsor programs that serve more-advantaged children.
From the benefit-cost analyses reviewed in Chapter Four, there issome evidence that the economic returns from investing in early in-tervention programs are larger when programs are effectively targeted.The strongest evidence in support of this conclusion comes from thebenefit-cost analysis of the NFP home visiting program. In thatstudy, the effects of the program were larger for a higher-risk sampleof mothers. Consequently, the return for each dollar invested was$5.70 for the higher-risk population served compared with $1.26 forthe lower-risk population. It is possible that another interventionprogram for the lower-risk population—one that is designed to pro-vide a mix of services that would be most effective in meeting theneeds of that group—would have a benefit-cost ratio equivalent tothat found for the higher-risk group. This finding indicates that it isnot reasonable to expect the returns reported in Chapter Four forspecific programs serving specific disadvantaged populations to applywhen the same program serves a different population.
While many early childhood interventions are designed to servea targeted, disadvantaged population, others aim to provide servicesuniversally. The Oklahoma Pre-K program is one such example inour group of 20 programs. It has not yet been subject to a benefit-cost analysis. However, the findings presented here suggest that wewould not expect to see the same returns measured for the Perry Pre-school program or Chicago CPC program in a universal program.Hence, the benefit-cost ratio would be lower than what is measuredfor the targeted programs. The ratio for a universal program may stillexceed 1, but it will indicate a lower return per dollar invested com-pared with a targeted program. However, a universal program may bejustified on other grounds. For example, it may be less costly to ad-
Conclusions 135
minister because there is no requirement to determine eligibility(Barnett, Brown, and Shore, 2004). Universal programs also avoidthe potential stigma associated with targeted programs and may re-ceive broader support for public-sector funding.
In distilling our synthesis of the literature into these ten keyfindings, it is important to acknowledge that our conclusions rest ona solid, but still limited, evidence base. Although that evidence basecan always be strengthened by further research and evaluation of earlychildhood intervention programs, our findings nevertheless indicatethat a body of sound research exists to guide decisionmakers in mak-ing resource allocations. This research base helps to identify thosechildren at greatest risk, the range of early intervention programs thathave high-quality evaluations, the demonstrated benefits associatedwith programs that have been carefully studied, some of the key fea-tures associated with successful programs, and the economic benefitsthat can flow from devoting resources to effective programs. Theseproven results therefore signal the future promise of investing early inthe lives of disadvantaged children.


137
APPENDIX A
Descriptions of Early Childhood InterventionPrograms Included in the Study
Table A.1 provides a brief summary of the program features for eachof the 20 early childhood intervention programs we study (ProjectCARE is counted as two program models), first for the 16 programswith a strong evidence base and then for the four programs with apromising evidence base. We also include the URL for those pro-grams with Web sites that provide additional program information.Relevant citations that we relied on for the results presented in thestudy are listed as well.
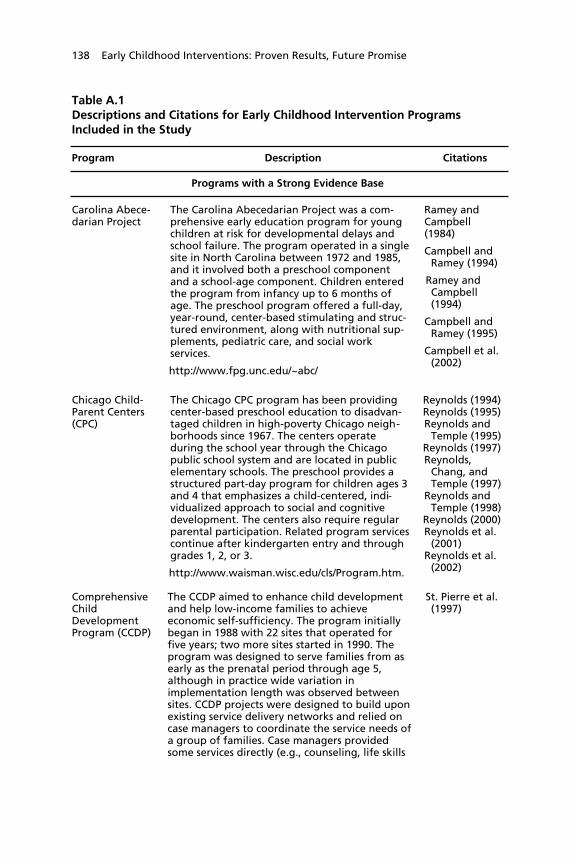
138 Early Childhood Interventions: Proven Results, Future Promise
Table A.1Descriptions and Citations for Early Childhood Intervention ProgramsIncluded in the Study
Program Description Citations
Programs with a Strong Evidence Base
Carolina Abece-darian Project
The Carolina Abecedarian Project was a com-prehensive early education program for youngchildren at risk for developmental delays andschool failure. The program operated in a singlesite in North Carolina between 1972 and 1985,and it involved both a preschool componentand a school-age component. Children enteredthe program from infancy up to 6 months ofage. The preschool program offered a full-day,year-round, center-based stimulating and struc-tured environment, along with nutritional sup-plements, pediatric care, and social workservices.
http://www.fpg.unc.edu/~abc/
Ramey andCampbell(1984)
Campbell andRamey (1994)
Ramey andCampbell(1994)
Campbell andRamey (1995)
Campbell et al.(2002)
Chicago Child-Parent Centers(CPC)
The Chicago CPC program has been providingcenter-based preschool education to disadvan-taged children in high-poverty Chicago neigh-borhoods since 1967. The centers operateduring the school year through the Chicagopublic school system and are located in publicelementary schools. The preschool provides astructured part-day program for children ages 3and 4 that emphasizes a child-centered, indi-vidualized approach to social and cognitivedevelopment. The centers also require regularparental participation. Related program servicescontinue after kindergarten entry and throughgrades 1, 2, or 3.
http://www.waisman.wisc.edu/cls/Program.htm.
Reynolds (1994)Reynolds (1995)Reynolds and
Temple (1995)Reynolds (1997)Reynolds,
Chang, andTemple (1997)
Reynolds andTemple (1998)
Reynolds (2000)Reynolds et al.
(2001)Reynolds et al.
(2002)
ComprehensiveChildDevelopmentProgram (CCDP)
The CCDP aimed to enhance child developmentand help low-income families to achieveeconomic self-sufficiency. The program initiallybegan in 1988 with 22 sites that operated forfive years; two more sites started in 1990. Theprogram was designed to serve families from asearly as the prenatal period through age 5,although in practice wide variation inimplementation length was observed betweensites. CCDP projects were designed to build uponexisting service delivery networks and relied oncase managers to coordinate the service needs ofa group of families. Case managers providedsome services directly (e.g., counseling, life skills
St. Pierre et al.(1997)

Descriptions of Early Childhood Intervention Programs Included in the Study 139
Table A.1—continued
Program Description Citations
training), and provided access to other servicessuch as immunizations, childcare, and prenatalcare through referrals and brokered arrange-ments.
DARE to be You DARE to be You is a multilevel prevention program,operating in several sites in Colorado, that targetsparents of two- to five-year-olds in high-riskfamilies. The center-based program focuses onparenting skills, and the aspects that contribute toyouth’s resiliency to substance abuse later in life,such as parents’ self efficacy, effective child rearing,social support, problem-solving skills, and children’sdevelopmental attainments. The program offers15 to 18 hours of parent training workshops andconcurrent children’s programs, preferably in a10- to 12-week period. Other program elementsinclude training for child care providers andtraining for social service agencyworkers who work with families.
http://www.coopext.colostate.edu/DTBY/index.html
Miller-Heyl,MacPhee,and Fritz(1998)
Early TrainingProject (ETP)
The ETP was a demonstration project that serveda cohort of children born in 1958. The program,implemented in Murfreesboro, Tennessee, wasdesigned to improve the educability of youngchildren from low-income homes. The programconsisted of a ten-week summer preschool pro-gram for the two or three summers prior to firstgrade, and weekly home visits during theremainder of the year.
Gray andKlaus (1970)
Gray andRamsey(1982)
Gray, Ramsey,and Klaus(1982)
Lazar andDarlington(1982)
Head Start Head Start is a federally funded community-basedpreschool program initiated in the 1960s with anoverall goal of increasing the school readiness ofeligible young children ages 3 to 5 in low-incomefamilies. Head Start preschools, operating eitherpart- or full-day, provide a range of services,including early childhood education, nutritionand health services, and parent education andinvolvement. There is no single Head Start pro-gram model and programs exist in all 50 states.
http://www2.acf.dhhs.gov/programs/hsb/
Currie andThomas(1995)
Currie andThomas(1999)
Aughinbaugh(2001)
Garces, Tho-mas, andCurrie (2002)
Abbott-Shim,Lambert, andMcCarty(2003)

140 Early Childhood Interventions: Proven Results, Future Promise
Table A.1—continued
Program Description Citations
High/ScopePerry PreschoolProject
The High/Scope Perry Preschool Project was a center-based early childhood education program designedto promote children’s intellectual, social, and emo-tional learning and development. The program wasconducted from 1962 to 1967 in Ypsilanti, Michigan,and targeted three- and four-year-old African-American children who were living in poverty andhad low IQ scores. The school-year program empha-sized learning through active and direct child-initiated experiences rather than through directedteaching. Teachers conducted part-day, daily class-room sessions for children and weekly home visits.
http://www.highscope.org
Weikart,Bond, andMcNeil(1978)
Schweinhartand Weikart(1980)
Berrueta-Clement etal. (1984)
Schweinhart,Barnes, andWeikart(1993)
Schweinhart(2004)
Schweinhartet al. (2005)
HIPPY (HomeInstructionProgram forPreschoolYoungsters)USA
HIPPY is a two-year parent involvement programthat offers home-based early childhood educationfor three-, four-, and five-year-old children. Theprogram targets parents with limited formal educa-tion from economically disadvantaged families.HIPPY helps parents enhance their children’s schoolreadiness, through the use of a structured curricu-lum and books and materials designed tostrengthen children’s cognitive skills, early literacyskills, social/emotional development, and physicaldevelopment. The program is designed so thatmothers deliver the HIPPY lessons to their childrendaily, with support in the form of biweekly homevisits from a paraprofessional and biweekly groupmeetings with paraprofessionals and other parents.HIPPY is an international program that started inIsrael in 1969 and has been in operation in the U.S.since 1984 with programs in 26 states.
http://www.hippyusa.org
Baker,Piotrkowski,Brook-Gunn,(1998)
HoustonParent-ChildDevelopmentCenter (PCDC)
The Houston PCDC was a two-year parent-childeducation program for children ages 1 to 3, whosegoal was preventing behavior problems in youngchildren. The program was implemented from 1970to 1972 and targeted low-income Mexican Americanfamilies that lived in Houston barrios. The first yearof the program involved biweekly home visits to themother and child by paraprofessional educators,
Johnson et al.(1974)
Johnson andBreckenridge(1982)
Johnson andWalker (1991)

Descriptions of Early Childhood Intervention Programs Included in the Study 141
Table A.1—continued
Program Description Citations
several weekend sessions for entire families, Eng-lish language classes for the mothers, a medicalexamination of the child, and referrals to commu-nity resources. In the second year, mothers andchildren attended PCDC activities for up to fourmornings a week, along with evening sessions thatincluded fathers, and a continuation of languageclasses and community services.
IncredibleYears
The Incredible Years series is a set of comprehen-sive curricula for children ages 2 to 8 and theirparents and teachers. It targets high-risk childrenor children displaying behavior problems. The cur-ricula are designed to work jointly to promoteemotional and social competence and to prevent,reduce, and treat children’s behavioral and emo-tional problems. The Incredible Years parent-training involves 12 to 14 weekly sessions, empha-sizing such parenting skills as how to set limits,how to play with children, and how to handle mis-behavior, and incorporates videotaped scenes toencourage group discussion and problem solving.The child-training program uses a small-group cur-riculum for children exhibiting conduct problems,and is offered in weekly sessions for 18 to 20weeks. The Incredible Years has been in operationsince 1980 in multiple sites in the U.S.,as well as sites in Canada, the UK, and Sweden.
http://www.incredibleyears.com/
Webster-Stratton,Kolpacoff,and Hollin-sowth (1988)
Webster-Stratton(1998)
Webster-Stratton,Reid, andHammond(2001)
Infant Healthand Devel-opmentProgram(IHDP)
The IHDP was a comprehensive intervention con-sisting of early child development programs andfamily support services tailored to reduce theprevalence of health and developmental problemsamong low-birthweight, premature infants. Tar-geting infants upon discharge from the neonatalnursery until 36 months of age, the program pro-vided home visiting, parent group meetings, and acenter-based child development program for chil-dren. The program operated in eight medical insti-tutions throughout the U.S. from 1985 to 1988.
IHDP (1990)McCormick et
al. (1991)Ramey et al.
(1992)McCormick et
al. (1993)Brooks-Gunn,
McCarton, etal. (1994)
Brooks-Gunn,McCormick,et al. (1994)
McCarton et al.(1997)
Hill, Brooks-Gunn, andWaldfogel(2003)

142 Early Childhood Interventions: Proven Results, Future Promise
Table A.1—continued
Program Description Citations
Nurse-FamilyPartnership(NFP) Program
The NFP (formerly Prenatal/Early Infancy HomeVisitation by Nurses) provides intensive and compre-hensive home visitation by public health nurses tolow-income first-time pregnant womenand mothers of any age. The visits begin duringpregnancy and continue through the child’s secondbirthday and are intended to help women improvetheir prenatal health and the outcomes ofpregnancy; improve the care provided to infantsand toddlers; and improve women’s own personaldevelopment. The NFP program has been evaluatedin trials in Elmira, New York; Memphis, Tennessee;and Denver, Colorado. More recently, the programhas been replicated in 23 states across the U.S.
http://www.nccfc.org/nurseFamilyPartnership.cfm
Olds,Henderson,Chamberlin,et al. (1986)
Olds,Henderson,Tatelbaum,et al. (1986)
Olds et al.(1988)
Olds,Henderson,and Kitzman(1994)
Olds (1996)Olds,Eckenrode, etal. (1997)
Olds, Kitzman,et al. (1997)
Olds et al.(2002)
Olds, Kitzman,et al. (2004)
Olds, Robinson,et al. (2004)
OklahomaPre-K
Since 1998, the state of Oklahoma has offered avoluntary, one-year free pre-kindergarten programto all four-year-old students in participating schooldistricts. Pre-K teachers are required to hold abachelor’s degree as well as early childhood certifi-cation. The program also imposes restrictions onclass size (20 students) and child-teacher ratios (10to 1).
http://www.sde.state.ok.us
Gormley andGayer (forth-coming)
Gormley etal. (forth-coming)
Project CARE(CarolinaApproach toResponsiveEducation)—two models
Project CARE was a longitudinal early interventionstudy that targeted families whose infants were atelevated risk for delayed development. Participantswere subject to either of two interventions or acontrol group. The interventions consisted of eithera family-focused home visiting program that pro-vided general family support, or home visits inaddition to child attendance at an educationaldevelopment center that utilized a structured cur-riculum. Home visits began in the month after thechild’s birth, and children assigned to the
Ramey et al.(1985)
Wasik et al.(1990)
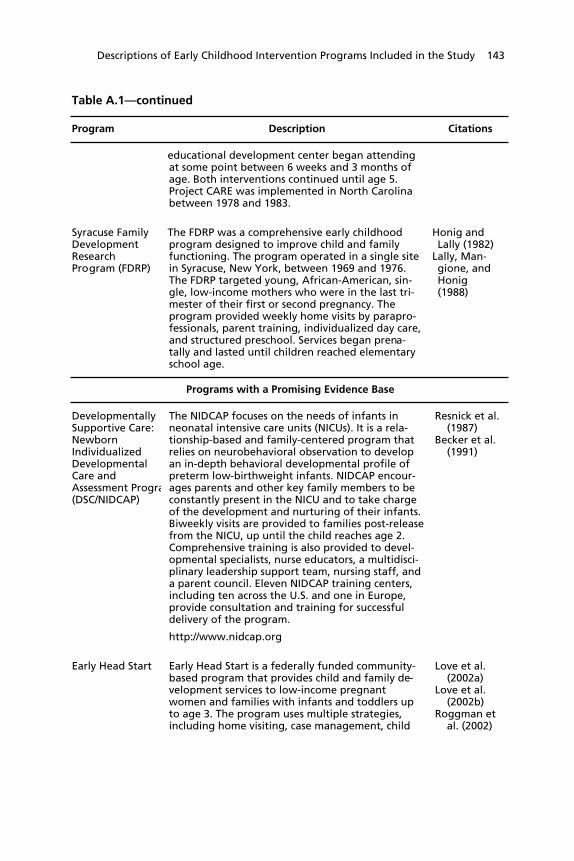
Descriptions of Early Childhood Intervention Programs Included in the Study 143
Table A.1—continued
Program Description Citations
educational development center began attendingat some point between 6 weeks and 3 months ofage. Both interventions continued until age 5.Project CARE was implemented in North Carolinabetween 1978 and 1983.
Syracuse FamilyDevelopmentResearchProgram (FDRP)
The FDRP was a comprehensive early childhoodprogram designed to improve child and familyfunctioning. The program operated in a single sitein Syracuse, New York, between 1969 and 1976.The FDRP targeted young, African-American, sin-gle, low-income mothers who were in the last tri-mester of their first or second pregnancy. Theprogram provided weekly home visits by parapro-fessionals, parent training, individualized day care,and structured preschool. Services began prena-tally and lasted until children reached elementaryschool age.
Honig andLally (1982)
Lally, Man-gione, andHonig(1988)
Programs with a Promising Evidence Base
DevelopmentallySupportive Care:NewbornIndividualizedDevelopmentalCare andAssessment Progra(DSC/NIDCAP)
The NIDCAP focuses on the needs of infants inneonatal intensive care units (NICUs). It is a rela-tionship-based and family-centered program thatrelies on neurobehavioral observation to developan in-depth behavioral developmental profile ofpreterm low-birthweight infants. NIDCAP encour-ages parents and other key family members to beconstantly present in the NICU and to take chargeof the development and nurturing of their infants.Biweekly visits are provided to families post-releasefrom the NICU, up until the child reaches age 2.Comprehensive training is also provided to devel-opmental specialists, nurse educators, a multidisci-plinary leadership support team, nursing staff, anda parent council. Eleven NIDCAP training centers,including ten across the U.S. and one in Europe,provide consultation and training for successfuldelivery of the program.
http://www.nidcap.org
Resnick et al.(1987)
Becker et al.(1991)
Early Head Start Early Head Start is a federally funded community-based program that provides child and family de-velopment services to low-income pregnantwomen and families with infants and toddlers upto age 3. The program uses multiple strategies,including home visiting, case management, child
Love et al.(2002a)
Love et al.(2002b)
Roggman etal. (2002)

144 Early Childhood Interventions: Proven Results, Future Promise
Table A.1—continued
Program Description Citations
development, parenting education, nutrition edu-cation, child care, health care and referrals, andfamily support. Early Head Start was firstimplemented in1994 and has been operated inhundreds of sites across the U.S. No single programmodel exists, and each site selects delivery optionsthat will best meet the needs of the families andcommunities it serves.
http://www.acf.hhs.gov/programs/hsb/programs/ehs/ehs2.htm
Parents AsTeachers
Parents as Teachers is a voluntary early childhoodparent education and family support program thatbegins at or before the birth of the child and con-tinues until kindergarten entry. Program servicesinclude home visits to families, developmentalscreenings of children, parent group meetings, anda resource network that links families with neededcommunity resources. The Parents as Teachers pro-gram was created in 1981 and is a universal accessmodel adaptable for families from all types ofcommunities.
http://www.patnc.org
Wagner,Cameto,andGerlach-Downie(1996)
Wagner etal. (1999)
Wagner andClayton(1999)
Wagner, Iidaet al. (2001)
Wagner,Spiker, etal. (2001)
Reach Out andRead
Reach Out and Read is a national program thatpromotes reading aloud to young at-risk childrenby using the pediatric office as a site for educationand intervention. Doctors and nurses give newbooks to children at each well-child visit from 6months of age to 5 years and accompany thesebooks with developmentally appropriate advice toparents about reading aloud with their child. Firstimplemented in 1989, Reach Out and Read is avail-able in all 50 states, the District of Columbia,Puerto Rico, and Guam.
http://www.reachoutandread.org
Golova et al.(1999)
High et al.(2000)

145
APPENDIX B
Methodology for the Analysis of CognitiveOutcomes in Chapter Three
This appendix describes the methods used to estimate the results pre-sented in Table 3.7. The goal of the analysis was to determinewhether programs that offered only home visiting/parent educationobtained systematically different child outcomes from programs thatoffered a combination of home visiting/parent education and ECEservices. Note that the latter type of program generally offered more-intensive services in terms of the total number of hours of treatmentthe family would receive while participating.
Due to data limitations, we could undertake this exercise onlyfor cognitive outcomes. As shown in Table 3.1, very few programsmeasured results in the crime, health, and child maltreatment do-mains. More programs measured outcomes related to education andbehavioral and social well-being, but still not enough to enable a use-ful statistical comparison between the two types of programs.
The analysis used the first achievement or IQ test result availablefor each program at approximately age 5 or 6. We selected this agebecause we wanted to focus on the school readiness aspects of theprogram effects. When results for an overall achievement measurewere available, we used that. When only subject-specific achievementmeasures were available, we used the reading score. For the programsdesignated as having a promising evidence base because they did notfollow study children to school-entry or beyond, we used theachievement test score at the oldest age available, which was generallyaround age 3.

146 Early Childhood Interventions: Proven Results, Future Promise
We collected 15 IQ or achievement scores from the 20 programsincluded in this study, and then converted these results into a stan-dardized effect size, so that the results from different studies could bedirectly compared. When the means for the control and treatmentgroups were reported, we computed the effect size by dividing thedifference between the means for the treatment and control groups bythe pooled standard deviation of that mean. Specifically, we calcu-lated Cohen’s d as:
d =Yt −Yc
s p
,
where
s p =
st + sc
2 .
In this formulation, Yt and Yc equal the treatment and controlgroup means, respectively, and sp is the pooled standard deviationcalculated from the treatment and control group standard deviations,st and sc , respectively.
Furthermore, we adjusted these effect sizes to account for possi-ble biases inherent in small samples as recommended by Hedges(1981) (see Lipsey and Wilson, 2001, pp. 48–49). In some caseswhen the mean was not available, we computed the effect size usinginformation such as the mean difference and the p-value of a test thatthe two means were different (see Lipsey and Wilson, 2001, for in-formation about these methods).
After converting results from each program into a standardizedeffect size, we sorted the programs into one of two approaches usingthe taxonomy we developed in Chapter Two: home visiting/parenteducation only and “combination” programs that provide homevisiting/parent education combined with ECE. One program in ourset of 20 did not fall into either of these approaches (see Figure 2.2).
Methodology for the Analysis of Cognitive Outcomes in Chapter Three 147
The Oklahoma Pre-K program is strictly an early childhood educa-tion program, so we did not include results from this program in theanalysis.
The raw data used in the analysis are reported in Table B.1 (seealso Figure 3.1), including the four programs with missing data. Asthis table shows, among the programs with data, six are in the homevisiting/parent education approach and the other nine programs arein the “combination” approach.1
We estimated a pooled effect size obtained from random-effectmeta-analysis for the two program approaches. The estimated effectsize for the home visiting/parent education programs is 0.212, 0.113lower than the estimated effect size of 0.325 for the combinationprograms. A meta-analysis regression test of the difference in effectsize between the combination and other programs was statisticallysignificant at only the 0.40 level, indicating no difference between theestimated effect size of these two program approaches.
We performed a number of sensitivity analyses. We estimatedthe meta-analysis regression excluding the CCDP results as a way toaddress the concerns that have been raised regarding the implementa-tion and evaluation of that program. We also estimated the regressionexcluding the only quasi-experimental evaluation among the 15studies—the CPC program. In addition, the model was estimatedexcluding Read Out and Read and DARE to be You because theircognitive score measures were least similar to those of the other pro-grams; hence, it is possible that the effect sizes are less comparable aswell. The Houston PCDC program also stands out for the late age oftest measurement (age 9.5), so we tested the sensitivity of the resultsto the exclusion of that program as well. In each case, the mean effectsize for “combination” programs did not change substantively withthe exclusion of these programs, and the regression coefficient testingthe difference in program approaches was not significant when these____________1 Note that some of the programs that had statistically significant findings for cognitive out-comes in Table 3.1 may not have a statistically significant outcome in Table B.1 because ofthe way outcomes were selected for inclusion in the meta-analysis.

148 Early Childhood Interventions: Proven Results, Future Promise
four evaluations were separately omitted from the sample or when ageof score measurement was controlled for in the model.
Table B.1Data Used in Analysis of Cognitive Outcomes
Program
Mean AdjustedEffect Size
(Cognitive Outcome)
Home Visiting/Parent Education
NFP 0.18*
DSC/NIDCAP a__
Parents as Teachers 0.06
Project CARE (no ECE) –0.49+
HIPPY USA 0.24
Reach Out and Read 0.69***
DARE to be You 0.37**
Incredible Years a__
“Combination” (Home Visiting/Parent Education andEarly Childhood Education)
Early Head Start 0.10*
Syracuse FDRP a__
CCDP –0.06
IHDP 0.02
Project CARE (with ECE) 0.71*
Abecedarian 0.62*
Houston PCDC 0.52*
ETP 0.60+
Perry Preschool 0.97**
Chicago CPC 0.35**
Head Start a__
SOURCE: Authors calculations based on sources cited inAppendix A.NOTES: See Table 2.2 for full program names.+ p < 0.10; * p < 0.05; ** p < 0.01; *** p < 0.001. a No cognitive measure available.

149
References
Abbott-Shim, Martha, Richard Lambert, and Frances McCarty, “AComparison of School Readiness Outcomes for Children RandomlyAssigned to a Head Start Program and the Program’s Wait List,” Journalof Education for Students Placed at Risk, Vol. 8, No. 2, 2003, pp.191–214.
Anderson, Patricia M., and Philip B. Levine, “Child Care and Mothers’Employment Decisions,” in Rebecca M. Blank and David Card, eds.,Finding Jobs: Work and Welfare Reform, New York, N.Y.: Russell SageFoundation, 2000.
Aos, Steve, Roxanne Lieb, Jim Mayfield, Marna Miller, and AnniePennucci, Benefits and Costs of Prevention and Early Intervention Programsfor Youth, Olympia: Washington State Institute for Public Policy,September 17, 2004. Online at http://www.wsipp.wa.gov/rptfiles/04-07-3901.pdf and http://www.wsipp.wa.gov/rptfiles/04-07-3901a.pdf(as of July 8, 2005).
Aughinbaugh, Alison, “Does Head Start Yield Long-Term Benefits?”Journal of Human Resources, Vol. 36, No. 4, Autumn 2001, pp.641–665.
Baker, Amy J. L., Chaya S. Piotrkowski, and Jeanne Brook-Gunn, “TheEffects of the Home Instruction Program for Preschool Youngsters onChildren’s School Performance at the End of the Program and One YearLater,” Early Childhood Research Quarterly , Vol. 13, No. 4, 1998, pp.571–586.
Barnett, W. Steven, “Benefit-Cost Analysis of Preschool Education:Findings from a 25-Year Follow-Up,” American Journal ofOrthopsychiatry, Vol. 63, No. 4, 1993, pp. 500–508.
150 Early Childhood Interventions: Proven Results, Future Promise
———, “Long-Term Effects of Early Childhood Programs on Cognitiveand School Outcomes,” The Future of Children, Vol. 5, 1995, pp. 25–50.
———, “Economics of Early Childhood Intervention,” in Jack P. Shonkoffand Samuel J. Meisels, eds., Handbook of Early Childhood Intervention,2nd edition, New York, N.Y.: Cambridge University Press, 2000.
Barnett, W. Steven, Clive R. Belfield, and Milgros Nores, “Lifetime Cost-Benefit Analysis,” in Lawrence J. Schweinhart, Jeanne Montie, ZongpingXiang, W. Steven Barnett, Clive R. Belfield, and Milagros Nores, eds.,Lifetime Effects: The High/Scope Perry Preschool Study Through Age 40,Monographs of the High/Scope Educational Research Foundation, 14,Ypsilanti, Mich.: High/Scope Press, 2005, pp. 130–157.
Barnett, W. Steven, Kirsty Brown, and Rima Shore, “The Universal vs.Targeted Debate: Should the United States Have Preschool for All?”NIEER Preschool Policy Matters, Issue 6, April 2004. Online athttp://nieer.org/resources/policybriefs/6.pdf (as of July 8, 2005).
Becker, Patricia T., Patricia C. Grunwald, J. Randall Moorman, and SherryStuhr, “Outcomes of Developmentally Supportive Nursing Care forVery Low Birthweight Infants,” Nursing Research, Vol. 40, No. 3, 1991,pp. 150–155.
Behrman, Richard E., Deanna S. Gomby, and Patti L. Culross, “HomeVisiting: Recent Program Evaluations,” The Future of Children, Vol. 9,No. 1, 1999.
Belfield, Clive R., Early Childhood Education: How Important Are the Cost-Savings to the School System? Center for Early Care and Education,February 2004a. Online at http://www.winningbeginningny.org/databank/documents/belfield_report_000.pdf (as of July 8, 2005).
———, Investing in Early Childhood Education in Ohio: An EconomicAppraisal, Report prepared for Renewing Our Schools, Securing Our Future:A National Task Force on Public Education, Washington, D.C.,August 2004b. Online at http://www.americanprogress.org/site/pp.asp?c=biJRJ8OVF&b=172214 (as of July 8, 2005).
———, “Intergenerational Impacts of Early Childhood Education,”unpublished manuscript, 2005.
Berrueta-Clement, John R., Lawrence J. Schweinhart, W. Steven Barnett, etal., Changed Lives: The Effects of the Perry Preschool Program on Youths

References 151
Through Age 19, Monographs of the High/Scope Educational ResearchFoundation, 8, Ypsilanti, Mich.: High/Scope Press, 1984.
Blau, David M., The Child Care Problem: An Economic Analysis, New York,N.Y.: Russell Sage Foundation, 2001.
Blau, David M., and Janet Currie, “Preschool, Day Care, and AfterschoolCare: Who’s Minding the Kids?” University of North Carolina at ChapelHill—Department of Economics and University of California, LosAngeles—Department of Economics, 2004. Online at http://papers.ssrn.com/sol3/papers.cfm?abstract_id=579207 (as of July 8, 2005).
Board on Children, Youth and Families, Getting to Positive Outcomes forChildren in Child Care—A Summary of Two Workshops, Washington,D.C.: National Research Council and Institute of Medicine, 2001.
Braswell, James S., Anthony D. Lutkus, Wendy S. Grigg, Shari L.Santapau, Brenda S. Tay-Lim, and Matthew S. Johnson, The Nation’sReport Card: Mathematics 2000, NCES 2001-517, Washington, D.C.:National Center for Education Statistics, U.S. Department of Education,2001.
Brofenbrenner, Urie, The Ecology of Human Development, Cambridge,Mass.: Harvard University Press, 1979.
Brooks-Gunn, Jeanne, Lisa Berlin, and Allison Fuligni, “Early ChildhoodIntervention Programs: What About the Family?” in Jack P. Shonkoffand Samuel J. Meisels, eds., Handbook of Early Childhood Intervention,2nd edition, New York, N.Y.: Cambridge University Press, 2000.
Brooks-Gunn, Jeanne, Cecilia M. McCarton, Patrick H. Casey, Marie C.McCormick, Charles R. Bauer, Judy C. Bernbaum, Jon Tyson, MarkSwanson, Forrest C. Bennett, David T. Scott, James Tonascia, andCurtis L. Meinert, “Early Intervention in Low-Birth-Weight PrematureInfants: Results Through Age 5 Years from the Infant Health andDevelopment Program,” Journal of the American Medical Association,Vol. 272, No. 16, 1994, pp. 1257–1262.
Brooks-Gunn, Jeanne, Marie C. McCormick, Sam Shapiro, April AnnBenasich, and George W. Black, “The Effects of Early EducationIntervention on Maternal Employment, Public Assistance, and HealthInsurance: The Infant Health and Development Program,” AmericanJournal of Public Health, Vol. 84, No. 6, 1994, pp. 924–931.

152 Early Childhood Interventions: Proven Results, Future Promise
Brown, Brett, Kristin Moore, and Sharon Bzostek, A Portrait of Well-Being in Early Adulthood: A Report to the William and FloraHewlett Foundation, October 2003. Online at http://www. hewlett.org/NR/rdonlyres/B0DB0AF1-02A4-455A-849A-AD582B767AF3AD582B767AF3/0/FINALCOMPLETEPDFz.pdf (as of July 8, 2005).
Brown, Elizabeth G., and Catherine Scott-Little, Evaluations of SchoolReadiness Initiatives: What Are We Learning? Greensboro, NorthCarolina: SERVE, March 2003. Online at http://www.serve.org/_downloads/REL/ELO/SchoolReadiness.pdf (as of July 12,2005).
Burgess, Stephan R., Steven A. Hecht, and Christopher J. Lonigan,“Relationship of the Home Literacy Environment (HLE) to theDevelopment of Reading-Related Abilities: A One-Year LongitudinalStudy,” Reading Research Quarterly, Vol. 37, No. 4, 2002, pp. 408–426.
Burtless, Gary, and Christopher Jencks, “American Inequality and ItsConsequences,” in Henry J. Aaron, James M. Lindsay and Pietro S.Nivola, eds., Agenda for the Nation, Washington, D.C.: BrookingsInstitution Press, 2003, pp. 61–108.
Business Roundtable and Corporate Voices for Working Families, EarlyChildhood Education: A Call to Action from the Business Community,Washington, D.C.: Business Roundtable, May 2003. Online at http://www.brtable.org/pdf/901.pdf (as of February 22, 2005).
Campbell, Frances A., and Craig T. Ramey, “Effects of Early Interventionon Intellectual and Academic Achievement: A Follow-Up Study ofChildren from Low-Income Families,” Child Development, Vol. 65, No.2, 1994, pp. 684–698.
———, “Cognitive and School Outcomes for High-Risk African-AmericanStudents at Middle Adolescence: Positive Effects for Early Intervention,”American Educational Research Journal, Vol. 32, No. 4, 1995, pp.743–772.
Campbell, Frances A., Craig T. Ramey, Elizabeth Pungello, JosephSparling, and Shari Miller-Johnson, “Early Childhood Education: YoungAdult Outcomes from the Abecedarian Project,” Applied DevelopmentalScience, Vol. 6, No. 1, 2002, pp. 42–57.
Carneiro, Pedro, and James J. Heckman, “Human Capital Policy,” in JamesJ. Heckman and Alan B. Krueger, eds., Inequality in America: What Role
References 153
for Human Capital Policies? Cambridge, Mass.: MIT Press, 2003, pp.77–239.
Child Trends, “Low and Very Low Birthweight Infants,” Child TrendsDataBank , Washington, D.C.: Child Trends, 2003. Online athttp://www.childtrendsdatabank.org/indicators/57LowBirthweight.cfm(as of July 8, 2005).
Child Trends and Center for Child Health Research, Early ChildDevelopment in Social Context: A Chartbook, Publication No. 778, NewYork, N.Y.: The Commonwealth Fund, September 2004.
Cohen, Jacob, Statistical Power Analysis for the Behavioral Sciences, 2ndedition, Hillsdale, N.J.: Lawrence Erlbaum Associates, 1988.
Committee for Economic Development (CED), Preschool for All: Investingin a Productive and Just Society, New York, N.Y.: Committee forEconomic Development, 2002. Online at http://www.ced.org/docs/report/report_preschool.pdf (as of July 8, 2005).
———, “Developmental Education: The Value of High Quality PreschoolInvestments as Economic Tools,” CED Working Paper, September2004. Online at http://www.ced.org/docs/report/report_preschool_2004_developmental.pdf (as of July 8, 2005).
Crane, Jonathan, Social Programs That Work, New York, N.Y.: Russell SageFoundation, 1998.
Currie, Janet, “Early Childhood Education Programs,” Journal of EconomicPerspectives, Vol. 15, No. 2, 2001, pp. 213–238.
Currie, Janet and Matthew Neidell, “Getting Inside the ‘Black Box’ ofHead Start Quality: What Matters and What Doesn’t?” Economics ofEducation Review, forthcoming.
Currie, Janet, and Duncan Thomas, “Does Head Start Make a Difference?”American Economic Review, Vol. 85, No. 3, 1995, pp. 235–262.
———, “Does Head Start Help Hispanic Children?” Journal of PublicEconomics, Vol. 74, No. 2, 1999, pp. 235–262.
DeLong, J. Bradford, Claudia Goldin, and Lawrence F. Katz, “SustainingU.S. Economic Growth,” in Henry J. Aaron, James M. Lindsay, andPietro S. Nivola, eds., Agenda for the Nation, Washington, D.C.:Brookings Institution Press, 2003, pp. 17–60.

154 Early Childhood Interventions: Proven Results, Future Promise
Duncan, Greg J., and Jeanne Brooks-Gunn, eds., Consequences of GrowingUp Poor, New York, N.Y.: Russell Sage Foundation, 1997.
Finn, Jeremy D., and Charles M. Achilles, “Tennessee’s Class Size Study:Findings, Implications, Misconceptions,” Educational Evaluation andPolicy Analysis, Vol. 21, No. 2, 1999, pp. 97–110.
Garces, Eliana, Duncan Thomas, and Janet Currie, “Longer-Term Effectsof Head Start,” American Economic Review, Vol. 92, No. 4, 2002, pp.999–1012.
Gilliam, Walter S., Carol H. Ripple, Edward F. Zigler, and Valerie Leiter,“Evaluating Child and Family Demonstration Initiatives: Lessons fromthe Comprehensive Child Development Program,” Early ChildhoodResearch Quarterly, Vol. 15, No. 1, 2000, pp. 41–59.
Golova, Natalia, Anthony J. Alario, Patrick M. Viver, Margarita Rodriguez,and Pamela C. High, “Literacy Promotion for Hispanic Families in aPrimary Care Setting: A Randomized, Controlled Trial,” Pediatrics, Vol.103, No. 5, 1999, pp. 993–997.
Gomby, Deanna S., Patti L. Culross, and Richard E. Behrman, “HomeVisiting: Recent Program Evaluations—Analysis and Recom-mendations,” The Future of Children, Vol. 9, No. 1, 1999, pp. 4–26.Online at http://www.futureofchildren.org/usr_doc/vol9no1Art1.pdf (asof July 8, 2005).
Gormley, William T., and Ted Gayer, “Promoting School Readiness inOklahoma: An Evaluation of Tulsa’s Pre-K program,” Journal of HumanResources, forthcoming.
Gormley, William T., Ted Gayer, Deborah Phillips, and Brittany Dawson,“The Effects of Universal Pre-K on Cognitive Development,”Developmental Psychology, forthcoming.
Gray, Susan W., and Rupert A. Klaus, “The Early Training Project:A Seventh-Year Report,” Child Development, Vol. 41, No. 4, 1970, pp.909–924.
Gray, Susan W., and Barbara K. Ramsey, “The Early Training Project:A Life-Span View,” Human Development, Vol. 25, No. 1, 1982, pp.48–57.
Gray, Susan W., Barbara K. Ramsey, and Rupert A. Klaus, From 3 to 20:The Early Training Project, Baltimore, Md.: University Park Press, 1982.
References 155
———, “The Early Training Project: 1962–1980,” in As the Twig Is Bent:Lasting Effects of Preschool Programs, The Consortium for LongitudinalStudies, Hillsdale, N.J.: Lawrence Erlbaum Associates, 1983, pp. 33–69.
Greenwood, Charles R., “Classwide Peer Tutoring: Longitudinal Effects onthe Reading, Language, and Mathematics Achievement of At-RiskStudents,” Journal of Reading, Writing and Learning Disabilities, Vol. 7,No. 2, 1991, pp. 105–123.
Grigg, Wendy S., Mary C. Daane, Ying Jin, and Jay R. Campbell, TheNation’s Report Card: Reading 2002, NCES 2003-521, Washington,D.C.: National Center for Education Statistics, U.S. Department ofEducation, 2003.
Hanushek, Eric A., and Dennis D. Kimko, “Schooling, Labor ForceQuality, and the Growth of Nations,” American Economic Review, Vol.90, No. 5, 2000, pp. 1184–1208.
Haveman, Robert, and Barbara Wolfe, Succeeding Generations: On theEffects of Investments in Children, New York, N.Y.: Russell SageFoundation, 1994.
———, “The Determinants of Children’s Attainments: A Review ofMethods and Findings,” Journal of Economic Literature, Vol. XXXIII,1995, pp. 1829–1878.
Hayes, Cheryl, John Palmer, and Martha Zaslow, Who Cares for America’sChildren? Child Care Policy for the 1990s, Washington, D.C.: TheNational Academy of Sciences Press, 1990.
Heckman, James J., “Policies to Foster Human Capital,” Research inEconomics, Vol. 54, No. 1, 2000, pp. 3–56.
Heckman, James J., and Dimitriy V. Masterov, “The ProductivityArgument for Investing in Young Children,” Working Paper 5, Invest inKids Working Group, Washington, D.C.: Committee for EconomicDevelopment, October 2004.
Hedges, Larry V., “Distribution Theory for Glass’s Estimator of Effect Sizeand Related Estimator,” Journal of Educational Statistics, Vol. 6, 1981,pp. 107–128.
High, Pamela, Marita Hopmann, Linda LaGasse, and Holly Linn,“Evaluation of a Clinic-Based Program to Promote Book Sharing andBedtime Routines Among Low-Income Urban Families with Young
156 Early Childhood Interventions: Proven Results, Future Promise
Children,” Archives of Pediatrics and Adolescent Medicine, Vol. 152, No.5, 1998, pp. 459–465.
High, Pamela C., Linda LaGasse, Samuel Becker, Ingrid Ahlgren, andAdrian Gardner, “Literacy Promotion in Primary Care Pediatrics: CanWe Make a Difference?” Pediatrics, Vol. 105, No. 4, 2000, pp. 927–934.
Hill, Jennifer L., Jeanne Brooks-Gunn, and Jane Waldfogel, “SustainedEffects of High Participation in an Early Intervention for Low-Birth-Weight Premature Infants,” Developmental Psychology, Vol. 39, No. 4,2003, pp. 730–744.
Honig, Alice Sterling, and J. Ronald Lally, “The Family DevelopmentResearch Program: Retrospective Review,” Early Child Development andCare, Vol. 10, 1982, pp. 41–62.
Huffman, Lynne C., Sarah L. Mehlinger, and Amy S. Kerivan, “RiskFactors for Academic and Behavioral Problems at the Beginning ofSchool,” in L. C. Huffman et al., Off to a Good Start: Research on the RiskFactors for Early School Problems and Selected Federal Policies AffectingChildren’s Social and Emotional Development and Their Readiness forSchool, Chapel Hill, N.C.: University of North Carolina, FPG ChildDevelopment Institute, 2001.
Infant Health and Development Project (IHDP), “Enhancing theOutcomes of Low-Birth-Weight, Premature Infants: A Multisite,Randomized Trial,” Journal of the American Medical Association , Vol.263, No. 22, 1990, p. 3035.
Johnson, Dale L., and James N. Breckenridge, “The Houston Parent-ChildDevelopment Center and the Primary Prevention of Behavior Problemsin Young Children,” American Journal of Community Psychology, Vol. 10,No. 3, 1982, pp. 305–316.
Johnson, Dale L., Hazel Leler, Laurel Rios, Larry Brandt, Alfred J. Kahn,Edward Mazeika, Martha Frede, and Billie Bisett, “The Houston Parent-Child Development Center: A Parent Education Program for Mexican-American Families,” American Journal of Orthopsychiatry, Vol. 44, No. 1,1974, pp. 121–128.
Johnson, Dale L., and Todd Walker, “A Follow-Up Evaluation of theHouston Parent-Child Development Center: School Performance,”Journal of Early Intervention, Vol. 15, 1991, pp. 226–236.
References 157
Karoly, Lynn A., and James H. Bigelow, The Economics of Investing inUniversal Preschool Education in California, Santa Monica, Calif.: TheRAND Corporation, MG-349-PF, 2005.
Karoly, Lynn A., Peter W. Greenwood, Susan S. Everingham, Jill Houbé,M. Rebecca Kilburn, C. Peter Rydell, Matthew Sanders, and JamesChiesa, Investing in Our Children: What We Know and Don’t Know Aboutthe Costs and Benefits of Early Childhood Interventions, Santa Monica,Calif.: RAND Corporation, MR-898-TCWF, 1998.
Karoly, Lynn A., M. Rebecca Kilburn, James H. Bigelow, Jonathan P.Caulkins, and Jill Cannon, Assessing Costs and Benefits of Early ChildhoodIntervention Programs: Overview and Application to the Starting EarlyStarting Smart Program, Santa Monica, Calif.: RAND Corporation, MR-1336-CFP, 2001.
Karoly, Lynn A., and Constantijn W.A. Panis, The 21st Century at Work:Forces Shaping the Future Workforce and Workplace in the United States,Santa Monica, Calif.: RAND Corporation, MG-164-DOL, 2004.
Krueger, Alan B., and Mikael Lindahl, “Education for Growth: Why andfor Whom?” Journal of Economic Literature, Vol. 39, No. 4, 2001, pp.1101–1136.
Lally, J. Ronald, Peter L. Mangione, and Alice S. Honig, “The SyracuseUniversity Family Development Research Program: Long-Range Impactof an Early Intervention with Low-Income Children and TheirFamilies,” in Parent Educaton as Early Childhood Intervention: EmergingDirections in Theory, Research and Practice, D. R. Powell and I. E. Sigel,eds., Norwood, N.J.: Ablex Publishing Corporation, 1988.
Landry, Susan H., Effective Early Childhood Programs: Turning Knowledgeinto Action, Houston, Texas: University of Texas Health Science Centerat Houston, 2005.
Lazar, Irving, and Richard Darlington, “Lasting Effects of Early Education:A Report from the Consortium for Longitudinal Studies,” Monographs ofthe Society for Research in Child Development, Vol. 47(2–4), Serial No.195, 1982.
Lipsey, Mark W., and David Wilson, Practical Meta-Analysis, ThousandOaks, Calif.: Sage Publications, 2001.

158 Early Childhood Interventions: Proven Results, Future Promise
Lochner, Lance, and Enrico Moretti, “The Effect of Education on Crime:Evidence from Prison Inmates, Arrests, and Self-Reports,” AmericanEconomic Review, Vol. 94, No. 1, January 2004, pp. 155–189.
Love, John M., Ellen E. Kisker, Christine M. Ross, Peter Z. Schochet,Jeanne Brooks-Gunn, Diane Paulsell, Kimberly Boller, Jill Constantine,Cheri Vogel, Allison Sidle Fuligni, and Christy Brady-Smith, Making aDifference in the Lives of Infants and Toddlers and Their Families: TheImpacts of Early Head Start. Executive Summary, Washington, D.C.:Administration on Children, Youth, and Families, U.S. Department ofHealth and Human Services, 2002a.
———, Making a Difference in the Lives of Infants and Toddlers and TheirFamilies: The Impacts of Early Head Start, Vol. I, Final Technical Report,Washington, D.C.: Administration on Children, Youth, and Families,U.S. Department of Health and Human Services, 2002b.
Love, John M., Peter Z. Schochet, and Alicia L. Meckstroth, Are They inAny Real Danger? What Research Does—and Doesn’t—Tell Us AboutChild Care Quality and Children’s Well-Being, Princeton, N.J.:Mathematica Policy Research, Inc., May 1996.
Masse, Leonard N., and W. Steven Barnett, “A Benefit-Cost Analysis of theAbecedarian Early Childhood Intervention,” in Henry M. Levin andPatrick J. McEwan, eds., Cost-Effectiveness and Educational Policy,Larchmont, N.Y.: Eye on Education, Inc., 2002, pp. 157–173.
Mayer, Susan E., What Money Can’t Buy: Family Income and Children’s LifeChances, Cambridge, Mass.: Harvard University Press, 1997.
McCarton, Cecelia M., Jeanne Brooks-Gunn, Ina F. Wallace, Charles R.Bauer, Forrest C. Bennett, Judy C. Bernbaum, Sue Broyles, Patrick H.Casey, Marie C. McCormick, David T. Scott, Jon Tyson, JamesTonascia, and Curtis L. Meinert, “Results at Age 8 Years of EarlyIntervention for Low-Birth-Weight Premature Infants,” Journal of theAmerican Medical Association, Vol. 277, No. 2, 1997, pp. 126–132.
McCormick, Marie C., Jeanne Brooks-Gunn, Sam Shapiro, April A.Benasich, George Black, and Ruth T. Gross, “Health Care Use AmongYoung Children in Day Care: Results in a Randomized Trial of EarlyIntervention,” Journal of the American Medical Association , Vol. 265, No.17, 1991, pp. 2212–2217.

References 159
McCormick, Marie C., Cecelia M. McCarton, James Tonascia, and JeanneBrooks-Gunn, “Early Educational Intervention for Very Low BirthWeight Infants: Results from the Infant Health and DevelopmentProgram,” Journal of Pediatrics, Vol. 123, 1993, pp. 527–533.
Meisels, Samuel J., and Jack P. Shonkoff, “Early Childhood Intervention: AContinuing Evolution,” in Jack P. Shonkoff and Samuel J. Meisels, eds.,Handbook of Early Childhood Intervention, 2nd edition, New York, N.Y.:Cambridge University Press, 2000, pp. 3–31.
Miller, Ted R., Mark A. Cohen, and Brian Wiersema, Victim Costs andConsequences: A New Look, Washington, D.C.: National Institute ofJustice, January 1996.
Miller-Heyl, Jan, David MacPhee, and Janet J. Fritz, “DARE to be You:A Family-Support, Early Prevention Program,” Journal of PrimaryPrevention, Vol. 18, No. 3, 1998, pp. 257–285.
Minkovitz, Cynthia S., Nancy Hughart, Donna Strobino, Dan Scharfstein,Holly Grason, William Hou, Tess Miller, David Bishai, MarilynAugustyn, Kathryn Taaffe McLearn, and Bernard Guyer, “A Practice-Based Intervention to Enhance the Quality of Care in the First 3 Years ofLife,” Journal of the American Medical Association, Vol. 290, 2003, pp.3081–3091.
Neckerman, Kathryn M., Social Inequality, New York: Russell SageFoundation, 2004.
Nelson, Charles A., “The Neurobiological Bases of Early Intervention,” inJack P. Shonkoff and Samuel J. Meisels, eds., Handbook of EarlyChildhood Intervention, 2nd edition, New York: Cambridge UniversityPress, 2000, pp. 41–59.
Nelson, Geoffrey, Anne Westhues, and Jennifer MacLeod, “A Meta-Analysis of Longitudinal Research on Preschool Prevention Programs forChildren,” Prevention & Treatment, Vol. 6, Article 31, December 18,2003. Online at http://journals.apa.org/prevention/volume6/pre0060031a.html (as of July 8, 2005).
Olds, David L., Reducing Risks for Childhood-Onset Conduct Disorder withPrenatal and Early Childhood Home Visitation, American Public HealthAssociation Pre-Conference Workshop, New York, N.Y., 1996.
Olds, David L., John Eckenrode, Charles R. Henderson, Jr., HarrietKitzman, Jane Powers, Robert Cole, Kimberly Sidora, Pamela Morris,

160 Early Childhood Interventions: Proven Results, Future Promise
Lisa M. Pettitt, and Dennis Luckey, “Long-Term Effects of HomeVisitation on Maternal Life Course and Child Abuse and Neglect:Fifteen-Year Follow-Up of a Randomized Trial,” Journal of the AmericanMedical Association, Vol. 278, No. 8, 1997, pp. 637–643.
Olds, David L., Charles R. Henderson, Jr., Robert Chamberlin, and RobertTatelbaum, “Preventing Child Abuse and Neglect: A Randomized Trialof Nurse Home Visitation,” Pediatrics, Vol. 78, No. 1, 1986, pp. 65–78.
Olds, David L., Charles R. Henderson, Jr., and Harriet Kitzman, “DoesPrenatal and Infancy Nurse Home Visitation Have Enduring Effects onQualities of Parental Caregiving and Child Health at 25 to 50 Months ofLife?” Pediatrics, Vol. 93, No. 1, 1994, pp. 82–88.
Olds, David L., Charles R. Henderson, Jr., Robert Tatelbaum, and RobertChamberlin, “Improving the Delivery of Prenatal Care and Outcomes ofPregnancy: A Randomized Trial of Nurse Home Visitation,” Pediatrics,Vol. 77, No. 1, 1986, pp. 16–28.
———, “Improving the Life-Course Development of SociallyDisadvantaged Mothers: A Randomized Trial of Nurse HomeVisitation,” American Journal of Public Health, Vol. 78, No. 11, 1988,pp. 1436–1445.
Olds, David, Harriet Kitzman, Robert Cole, and JoAnn Robinson,“Theoretical Foundations of a Program of Home Visitation for PregnantWomen and Parents of Young Children,” Journal of CommunityPsychology, Vol. 25, No. 1, 1997, pp. 9–25.
Olds, David L., Harriet Kitzman, Robert Cole, JoAnn Robinson, KimberlySidora, Dennis W. Luckey, Charles R. Henderson, Jr., Carole Hanks,Jessica Bondy, and John Holmberg, “Effects of Nurse Home-Visiting onMaternal Life Course and Child Development: Age 6 Follow-Up Resultsof a Randomized Trial,” Pediatrics, Vol. 114, No. 6, 2004, pp.1550–1559.
Olds, David L., JoAnn Robinson, Ruth O’Brien, Dennis W. Luckey, LisaM. Pettit, Charles R. Henderson, Jr., Rosanna K. Ng, Karen L. Sheff,Jon Korfmacher, Susan Hiatt, and Ayelet Tahmi, “Home Visiting byParaprofessionals and by Nurses: A Randomized, Controlled Trial,”Pediatrics, Vol. 110, No. 3, 2002, pp. 486–496.
Olds, David L., JoAnn Robinson, Lisa Pettitt, Dennis W. Luckey, JohnHolmberg, Rosanna K. Ng, Kathy Isacks, Karen Sheff, and Charles R.

References 161
Henderson, Jr., “Effects of Home Visits by Paraprofessionals and byNurses: Age 4 Follow-Up Results of a Randomized Trial,” Pediatrics,Vol. 114, No. 6, 2004, pp. 1560–1568.
Perloff, Linda, Pamela Butler, Carolyn Berry, and Peter Budetti, “LiteratureReview of Outcomes of Early Intervention Programs,” Evanston, Ill.:Institute for Health Services Research and Policy Studies, NorthwesternUniversity, August 1998. Online at http://www.northwestern.edu/ihsrps/research/review.PDF (as of July 8, 2005)
Peters, Alan H., and Peter S. Fisher, State Enterprise Zone Programs: HaveThey Worked? Kalamazoo, Mich.: The W. E. Upjohn Institute forEmployment Research, 2002.
Ramey, Craig T., Donna M. Bryant, Joseph J. Sparling, and Barbara H.Wasik, “Project CARE: A Comparison of Two Early InterventionStrategies to Prevent Retarded Development,” Topics in Early ChildhoodSpecial Education, Vol. 5, No. 2, 1985, pp. 12–25.
Ramey, Craig T., Donna M. Bryant, Barbara H. Wasik, Joseph J. Sparling,Kaye H. Fendt, and Lisa M. La Vange, “Infant Health and DevelopmentProgram for Low Birth Weight, Premature Infants: Program Elements,Family Participation, and Child Intelligence,” Pediatrics, Vol. 89, No. 3,1992, pp. 454–465.
Ramey, Craig T., and Frances A. Campbell, “Preventive Education forHigh-Risk Children: Cognitive Consequences of the CarolinaAbecedarian Project,” American Journal of Mental Deficiency, Vol. 88,No. 5, 1984, pp. 515–523.
———, “Poverty, Early Childhood Education, and Academic Competence:The Abecedarian Experiment,” in Aletha Huston, ed., Children Reared inPoverty, New York, N.Y.: Cambridge University Press, 1994, pp.190–221.
Ramey, Craig T., and Sharon L. Ramey, “Early Learning and SchoolReadiness: Can Early Intervention Make a Difference?” Merrill-PalmerQuarterly, Vol. 50, No. 4, 2004, pp. 471–491.
Rathburn, Amy, Jerry West, and Elvira Germino-Hausken, FromKindergarten Through Third Grade: Children’s Beginning SchoolExperiences, NCES 2004-007, Washington, D.C.: U.S. GovernmentPrinting Office, 2004.
162 Early Childhood Interventions: Proven Results, Future Promise
Resnick, Michael B., Fonda D. Eyler, Robert M. Nelson, Donald V.Eitzman, and Richard L. Buciarelli, “Developmental Intervention forLow Birth Weight Infants: Improved Early Developmental Outcome,”Pediatrics, Vol. 80, No. 1, 1987, pp. 68–74.
Reynolds, Arthur J., “Effects of a Preschool Plus Follow-On Interventionfor Children at Risk,” Developmental Psychology, Vol. 30, No. 6, 1994,pp. 787–804.
———, “One Year of Preschool Intervention or Two: Does It Matter?”Early Childhood Research Quarterly, Vol. 10, 1995, pp. 1–31.
———, The Chicago Child-Parent Centers: A Longitudinal Study of ExtendedEarly Childhood Intervention, Madison, Wisc.: University of Wisconsin–Madison, March 1997.
———, Success in Early Intervention: The Chicago Child-Parent Centers,Lincoln, Neb.: University of Nebraska Press, 2000.
Reynolds, Arthur J., H. Chang, and Judy A. Temple, Early EducationalIntervention and Juvenile Delinquency: Findings from the ChicagoLongitudinal Studies , paper presented at the SRCD Seminar on EarlyIntervention Effects on Delinquency and Crime, Washington, D.C.,April 1997.
Reynolds, Arthur J., and Judy A. Temple, “Quasi-Experimental Estimatesof the Effects of a Preschool Intervention,” Evaluation Review, Vol. 19,No. 4, 1995, pp. 347–373.
———, “Extended Early Childhood Intervention and SchoolAchievement: Age Thirteen Findings from the Chicago LongitudinalStudy,” Child Development, Vol. 69, 1998, pp. 231–246.
Reynolds, Arthur J., Judy A. Temple, Dylan L. Robertson, and Emily A.Mann, “Long-Term Effects of an Early Childhood Intervention onEducational Achievement and Juvenile Arrest: A 15-Year Follow-Up ofLow-Income Children in Public Schools,” Journal of the AmericanMedical Association, Vol. 285, No. 18, May 9, 2001, pp. 2339–2346.
———, “Age 21 Cost-Benefit Analysis of the Title I Chicago Child-ParentCenters,” Educational Evaluation and Policy Analysis, Vol. 24, No. 4,Winter 2002, pp. 267–303.
Roggman, Lori A., Lisa K. Boyce, Gina A. Cook, and Andrea D. Hart,Making a Difference in the Lives of Infants and Toddlers and Their
References 163
Families: The Impacts of Early Head Start, Volume III: LocalContributions to Understanding the Programs and Their Impacts,Washington, D.C.: Administration on Children, Youth, and Families,U.S. Department of Health and Human Services, 2002. Online atwww.mathinc.com/publications/PDFs/ehsfinalvol3.pdf (as of July 12,2005).
Rolnick, Art, and Rob Grunewald, “Early Childhood Development:Economic Development with a High Public Return,” fedgazette, March2003. Online at http://minneapolisfed.org/pubs/fedgaz/03-03/earlychild.cfm (as of July 8, 2005).
Ruopp, Richard, Jeffrey Travers, Frederic Glantz, and C. Coelen, Childrenat the Center: Final Report of the National Day Care Study, Cambridge,Mass.: Abt Associates, ED 168 733, 1979.
St. Pierre, Robert G., Jean. I. Layzer, and Helen V. Barnes, “Two-Generation Programs: Design, Cost, and Short-Term Effectiveness,” TheFuture of Children, Vol. 5, Winter 1995, pp. 76–93.
St. Pierre, Robert G., Jean I. Layzer, Barbara D. Goodson, and Lawrence S.Bernstein, National Impact Evaluation of the Comprehensive ChildDevelopment Program, Cambridge, Mass.: Abt Associates, 1997. Onlineat http://www.abtassoc.com/reports/D19970050.pdf (as of July 8,2005).
Sameroff, Arnold J., and Michael J. Chandler, “Reproductive Risk and theContinuum of Caretaking Causalty,” in Frances D. Horowitz et al., eds.,Review of Child Development Research, Volume 4, Chicago, Ill.:University of Chicago Press, 1975.
Sanders, Lee M., Tamar D. Gershon, Lynne C. Huffman, and Fernando S.Mendoza, “Prescribing Books for Immigrant Children,”Archives ofPediatrics and Adolescent Medicine, Vol. 154, No. 8, 2000, pp. 771–777.
Schweinhart, Lawrence J., The High/Scope Perry Preschool Study Through Age40: Summary, Conclusions, and Frequently Asked Questions, Ypsilanti,Mich.: High/Scope Educational Research Foundation, 2004.
Schweinhart, Lawrence J., Helen V. Barnes, and David P. Weikart,Significant Benefits: The High/Scope Perry Preschool Study Through Age 27,Monographs of the High/Scope Educational Research Foundation, 10,Ypsilanti, Mich.: High/Scope Press, 1993.
164 Early Childhood Interventions: Proven Results, Future Promise
Schweinhart, Lawrence J., Jeanne Montie, Zongping Xiang, W. StevenBarnett, Clive R. Belfield, and Milagros Nores, Lifetime Effects: TheHigh/Scope Perry Preschool Study Through Age 40, Monographs of theHigh/Scope Educational Research Foundation, 14, Ypsilanti, Mich.:High/Scope Press, 2005.
Schweinhart, Lawrence J., and David P. Weikart, Young Children Grow Up:The Effects of the Perry Preschool Program on Youths Through Age 15,Monographs of the High/Scope Educational Research Foundation, 7,Ypsilanti, Mich.: High/Scope Press, 1980.
Schweke, William, Smart Money: Education and Economic Development,Washington, D.C.: Economic Policy Institute, 2004.
Shadish, William R., Thomas D. Cook, and Donald T. Campbell,Experimental and Quasi-Experimental Designs for Generalized CausalInference, Boston, Mass.: Houghton Mifflin Company, 2001.
Shonkoff, Jack P., and Deborah A. Phillips, eds., From Neurons toNeighborhoods: The Science of Early Child Development, Washington,D.C.: National Academy Press, 2000.
Shore, Rima, Rethinking the Brain: New Insights into Early Development,New York: Families and Work Institute, 1997.
Snow, Catherine E., M. Susan Burns, and Peg Griffin, eds., PreventingReading Difficulties in Young Children, Washington, D.C.: NationalAcademy Press, 1998.
Strickland, Dorothy S., and W. Steven Barnett, “Literacy Interventions forPreschool Children Considered At Risk: Implications for Curriculum,Professional Development, and Parent Involvement,” in Colleen M.Fairbanks, Jo Worthy, Beth Maloch, James V. Hoffman, and Diane L.Schallert, eds., 52nd Yearbook of the National Reading Conference, OakCreek, Wisc.: National Reading Conference, Inc., 2004, pp. 104–116.
Sweet, Monica A., and Mark I. Appelbaum, “Is Home Visiting an EffectiveStrategy? A Meta-Analytic Review of Home Visiting Programs forFamilies with Young Children,” Child Development, Vol. 75, No. 5,September/October 2004, pp. 1435–1456.
U.S. Census Bureau, School Enrollment—Social and Economic Characteristicsof Students, Washington, D.C.: U.S. Census Bureau, undated. Onlineat http://www.census.gov/population/www/socdemo/school.html (as ofFebruary 22, 2005).

References 165
U.S. Department of Education, National Center for Education Statistics,Dropout Rates in the United States: 1995, NCES 97-473, Washington,D.C.: U.S. Department of Education, July 1997.
U.S. Department of Education, National Center for Education Statistics,The Condition of Education 2003, NCES 2003-067, Washington, D.C.:U.S. Government Printing Office, 2003.
U.S. Department of Education, National Center for Education Statistics,The Nation’s Report Card: Mathematics Highlights 2003, NCES 2004-451, Washington, D.C.: U.S. Department of Education, 2004a.
U.S. Department of Education, National Center for Education Statistics,The Nation’s Report Card: Reading Highlights 2003, NCES 2004-452,Washington, D.C.: U.S. Department of Education, 2004b.
U.S. Department of Health and Human Services, Administration forChildren and Families, Head Start Impact Study, 2000–2006,Washington, D.C.: Administration for Children and Families, lastupdated April 19, 2005. Online at http://www.acf.hhs.gov/programs/opre/hs/impact_study/index.html (as of July 8, 2005).
U.S. Department of Labor, Bureau of Labor Statistics, Consumer PriceIndex—All Urban Consumers (CPI-U), Washington, D.C.: U.S.Department of Labor, undated. Online at http://data.bls.gov/cgi-bin/surveymost?cu (as of January 14, 2005).
Vandell, Deborah Lowe, and Barbara Wolfe, Child Care Quality: Does ItMatter and Does It Need to Be Improved? Washington, D.C.: U.S.Department of Health and Human Services, May 2000. Online athttp://aspe.hhs.gov/hsp/ccquality00/index.htm (as of July 8, 2005).
Vandivere, Sharon, Lindsay Pitzer, Tamara G. Halle, and Elizabeth C.Hair, “Indicators of Early School Success and Child Well-Being,”Cross Currents, Issue 3, October 2004. Online at http://www.childtrendsdatabank.org (as of July 8, 2005).
Viscusi, W. Kip, Wesley A. Magat, and Anne Forrest, “Altruistic andPrivate Valuations of Risk Reduction,” Journal of Policy Analysis andManagement, Vol. 7, No. 2, Winter 1988, pp. 227–245.
Wagner, Mary M., Renee Cameto, and Suzanne Gerlach-Downie,Intervention in Support of Adolescent Parents and Their Children: A FinalReport on the Teen Parents as Teachers Demonstration, Menlo Park, Calif.:SRI International, 1996.
166 Early Childhood Interventions: Proven Results, Future Promise
Wagner, Mary M., and Serena L. Clayton, “The Parents as TeachersProgram: Results from Two Demonstrations,” The Future of theChildren, Vol. 9, No. 1, 1999, pp. 91–115.
Wagner, Mary, Serena Clayton, Suzanne Gerlach-Downie, and MarkMcElroy. An Evaluation of the Northern California Parents as TeachersDemonstration, Menlo Park, Calif.: SRI International, 1999.
Wagner, Mary, Elizabeth Iida, Donna Spiker, Frances Hernandez, and JuliaSong, The Multisite Evaluation of the Parents as Teachers Home VisitingProgram: Three-Year Findings from One Community, Menlo Park, Calif.:SRI International, 2001.
Wagner, Mary, Camille Marder, and Jose Blackorby, The Children WeServe: The Demographic Characteristics of Elementary and Middle SchoolStudents with Disabilities and Their Households, Menlo Park, Calif.: SRIInternational, September 2002.
Wagner, Mary, Donna Spiker, Frances Hernandez, Julia Song, and SuzanneGerlach-Downie, Multisite Parents as Teachers Evaluation: Experiencesand Outcomes for Children and Families, Menlo Park, Calif.: SRIInternational, 2001.
Wasik, Barbara Hanna, Craig T. Ramey, Donna M. Bryant, and Joseph J.Sparling, “A Longitudinal Study of Two Early Intervention Strategies:Project CARE,” Child Development, Vol. 61, No. 6, 1990, pp.1682–1696.
Webster-Stratton, Carolyn, “Preventing Conduct Problems in Head StartChildren: Strengthening Parent Competencies,” Journal of Consultingand Clinical Psychology, Vol. 66, No. 5, 1998, pp. 715–730.
Webster-Stratton, Carolyn, Mary Kolpacoff, and Terri Hollinsowth, “Self-Administered Videotape Therapy for Families with Conduct-ProblemChildren: Comparison with Two Cost-Effective Treatments and aControl Group,” Journal of Consulting and Clinical Psychology, Vol. 56,No. 4, 1988, pp. 558–566.
Webster-Stratton, Carolyn, Jamila Reid, and Mary Hammond, “PreventingConduct Problems in Head Start Children: A Parent and TeacherTraining Partnership in Head Start,” Journal of Clinical Child Psychology,Vol. 30, No. 3, 2001, pp. 283–302.
Weikart, David P., J. T. Bond, and J. T. McNeil, The Ypsilanti PerryPreschool Project: Preschool Years and Longitudinal Results Through

References 167
Fourth Grade, Monographs of the High/Scope Educational ResearchFoundation, 3, Ypsilanti, Mich.: High/Scope Press, 1978.
West, Jerry, Kristin Denton, and Elvira Germino-Hausken, America’sKindergartners, NCES 2000-070, Washington, D.C.: U.S. GovernmentPrinting Office, 2000.
Whitehurst, Grover J., and Christopher J. Lonigan, “Child Developmentand Emergent Literacy,” Child Development, Vol. 69, No. 3, 1998, pp.848–872.
Wirt, John, Susan Choy, Patrick Rooney, Stephen Provasnik, Anindita Sen,and Richard Tobin, The Condition of Education 2004, NCES 2004-077,Washington, D.C.: U.S. Government Printing Office, 2004.
Wolfe, Barbara L., and Robert H. Haveman, “Social and NonmarketBenefits form Education in an Advanced Economy,” in Yolanda K.Kodrzycki, ed., Education in the 21st Century: Meeting the Challenges of aChanging World, Conference Series No. 47, Boston, Mass.: FederalReserve Bank of Boston, 2002, pp. 97–131.
Yoshikawa, Hirokazu, “Long-Term Effects of Early Childhood Programson Social Outcomes and Delinquency,” The Future of Children , Vol. 5,1995, pp. 51–75.
Zill, Nicholas, and Jerry West, Entering Kindergarten: A Portrait of AmericanChildren When They Begin School, NCES 2001-035, Washington, D.C.:U.S. Government Printing Office, 2001.
Zuckerman, Barry, Steven Parker, Margot Kaplan-Sanoff, MarilynAugustyn, and Michael C. Barth, “Healthy Steps: A Case Study ofInnovation in Pediatric Practice,” Pediatrics, Vol. 114, 2004, pp.820–826.