SAMPLE COSTS TO PRODUCE FRESH MARKET …coststudyfiles.ucdavis.edu/.../raspberrycc05.pdfSAMPLE COSTS...
20
RB-CC-05 UNIVERSITY OF CALIFORNIA COOPERATIVE EXTENSION 2005 SAMPLE COSTS TO PRODUCE FRESH MARKET RASPBERRIES Central Coast Region Santa Cruz and Monterey Counties Mark Bolda Farm Advisor, UC Cooperative Extension, Santa Cruz County. Laura Tourte Farm Advisor, UC Cooperative Extension, Santa Cruz County. Karen M. Klonsky UC Cooperative Extension Specialist, Department of Agricultural and Resource Economics, UC Davis. Richard L. De Moura Staff Research Associate, Department of Agricultural and Resource Economics, UC Davis.
-
Upload
nguyendieu -
Category
Documents
-
view
224 -
download
3
Transcript of SAMPLE COSTS TO PRODUCE FRESH MARKET …coststudyfiles.ucdavis.edu/.../raspberrycc05.pdfSAMPLE COSTS...

RB-CC-05
UNIVERSITY OF CALIFORNIA COOPERATIVE EXTENSION
2005
SAMPLE COSTS TO PRODUCE FRESH MARKET
RASPBERRIES
Central Coast Region Santa Cruz and Monterey Counties
Mark Bolda Farm Advisor, UC Cooperative Extension, Santa Cruz County. Laura Tourte Farm Advisor, UC Cooperative Extension, Santa Cruz County. Karen M. Klonsky UC Cooperative Extension Specialist, Department of Agricultural and Resource
Economics, UC Davis. Richard L. De Moura Staff Research Associate, Department of Agricultural and Resource Economics,
UC Davis.

2005 Raspberries Costs and Returns Study Central Coast UC Cooperative Extension 2
UNIVERSITY OF CALIFORNIA COOPERATIVE EXTENSION
SAMPLE COSTS TO PRODUCE FRESH MARKET RASPBERRIES Central Coast Region – Santa Cruz & Monterey Counties 2005
CONTENTS
INTRODUCTION ........................................................................................................................................2 ASUMPTIONS ............................................................................................................................................3 Establishment Cultural Practices and Material Inputs. ...................................................................................3 Production Cultural Practices and Material Inputs .........................................................................................4 Labor, Equipment, and Interest Costs ...........................................................................................................6 Cash Overhead Costs.....................................................................................................................................7 Non-Cash Overhead Costs ............................................................................................................................7 REFERENCES ............................................................................................................................................10 Table 1. Sample Costs per Acre to Establish Raspberries .............................................................................11 Table 2. Material Costs per Acre to Establish Raspberries ...........................................................................12 Table 3. Costs per Acre to Produce Raspberries ...........................................................................................13 Table 4. Costs and Returns per Acre to Produce Raspberries .......................................................................14 Table 5. Monthly Cash Costs to Produce Raspberries ..................................................................................15 Table 6. Range Analysis ..............................................................................................................................16 Table 7. Whole Farm Annual Equipment, Investment and Business Overhead..............................................17 Table 8. Hourly Equipment Costs.................................................................................................................17 Table 9. Costs and Returns Per Acre Two Year Summary ...........................................................................18 Table 10. Operations with Equipment – Establishment and Production..........................................................19
INTRODUCTION
The sample costs to produce raspberries in Santa Cruz and Monterey Counties are presented in this study. The study is intended as a guide only, and can be used to make production decisions, determine potential returns, prepare budgets and evaluate production loans. The practices described are based on production procedures considered typical for this crop and area, and may not apply to every farm. Sample costs for labor, materials, equipment and custom services are based on current figures. A blank column, "Your Cost", is provided to enter your actual costs on Tables 1 and 3.
The hypothetical farm operation, production practices, overhead, and calculations are described under assumptions. For additional information or explanation of calculations used in the study call the Department of Agricultural and Resource Economics, University of California, Davis, (530) 752-3589 or the UC Cooperative Extension office in your county.
Sample Cost of Production studies for many commodities from 1931 to the present are available and can be requested through the Department of Agricultural and Resource Economics, UC Davis, (530) 752-4424. Current studies may also be downloaded from the department Web site http://coststudies.ucdavis.edu or obtained from selected county UC Cooperative Extension offices.

2005 Raspberries Costs and Returns Study Central Coast UC Cooperative Extension 3
ASSUMPTIONS
The following assumptions refer to calculations in Tables 1 to 10 beginning on page 11 and pertain to sample costs to establish and produce raspberries in the Central Coast Region - Santa Cruz and Monterey Counties. Practices described represent methods considered typical for raspberry production in the region. The costs, practices, and materials will not be applicable to all situations every production year. Cultural practices, materials, and raspberry production costs vary by grower and region, and differences can be significant. The practices and inputs used in the cost study serve as a guide only. The use of trade names and cultural practices in this report does not constitute an endorsement or recommendation by the University of California nor is any criticism implied by omission of other similar products or cultural practices. Farm. The farm consists of 30 contiguous acres of land. Raspberries are planted on 15 acres. Other berries are planted on 12 acres; roads, the irrigation system and farmstead account for three acres. In this area, a few operations will rotate berry crops with vegetables and other row crops. The grower rents the land for $2,000 per acre per year, and owns the equipment and machinery.
Establishment Cultural Practices and Material Inputs Tables 1, 2, 10
Raspberries are a perennial crop that, when well managed, can produce for up to 20 years. However, in California, raspberries are managed as a biennial crop, the intent of which is to keep production and economic returns high. In this study we consider costs and returns associated with the establishment of a raspberry crop along with costs and returns for two production cycles. The establishment costs comprise the seven months from August in one calendar year to February of the following calendar year. That is, from land preparation to the installation of the trellis and drip irrigation systems. The production cycle is from March to October for each of the two years. Land Preparation. Land is prepared for planting by first subsoiling in August, followed by disking three times and rototilling once. Six tons of well composted manure is applied and incorporated into the soil at the same time as the disking operations. Beds are then listed and shaped. Fertilizer is applied prior to planting. During the growing season, the grower applies additional fertilizer through the drip irrigation system as shown below. Fertilization. To decide upon the fertilizer and rate to be applied, a soil sample is taken for soil analysis in the spring before starting land preparation. Composted manure at six tons per acre is applied during land preparation. Four hundred pounds of 15-15-15 is band applied before planting. Additional fertilizer may be applied during the growing season. Pest Management. The pesticides and rates mentioned in this cost study as well as other materials available are listed in UC Integrated Pest Management Guidelines, Caneberries. Pesticides mentioned in the study are commonly used, but are not recommendations.
Soil Fumigation. The soil is fumigated with a combination of Telone and chloropicrin to manage pests, which can include diseases, arthropods and weed seeds. This operation is done after the ground has been subsoiled, disked and rototilled, and approximately three weeks prior to planting. A custom operator fumigates the field using a rate of 14 gallons per acre of Telone and 200 pounds per acre of chloropicrin. The cost of the application in this study is $1,650 per acre.

2005 Raspberries Costs and Returns Study Central Coast UC Cooperative Extension 4
Planting. Several raspberry varieties are planted in the region, however, no specific variety is assumed in this study. The price depends on the variety selected and on a possible storage charge; for this study the cost per plant is $0.48. Planting is done by hand, and takes about 12 man-hours per acre to plant at an approximate cost of $124 per acre. Raspberries are generally transplanted from late November through March on 10-foot rows with a between plant spacing of 18-inches for a total plant density of 2,900 plants per acre. Leader buds and root suckers, which grow from the crown and roots, will fill in the spaces in between plants during the growing season. Raspberries are classified as floricane (summer bearing) and primocane (fall bearing) varieties. Floricane-bearing raspberries grow vegetatively during the first season, and bear fruit during the second season. After harvest, canes that produced fruit should be removed leaving the new canes that will produce fruit to be harvested in the following year. Because of the cost and effort of maintaining the floricane-bearing varieties vegetatively for the first season, many growers opt for primocane varieties, which produce fruit bearing canes every year starting from the fall of the first growing year. This study assumes that the grower uses primocane-bearing varieties. Irrigation. After transplanting, a temporary overhead sprinkler irrigation system is set-up to irrigate the crop for three weeks and then removed. Overhead irrigation on established plants may increase the incidence of fruit rot and other diseases as the crop matures. During the winter, crop growth is generally dependent on seasonal rains, but later in the season a drip irrigation system is installed and used to irrigate the crop. The drip line is tied to the lower wire of the trellis with emitters placed every 18-inches. The drip line is discarded after the second harvest, when the trellis is removed. Trellising. Based on a square acre basis (200 ft x 218 ft), the berries will have 20 rows per acre. The trellis system consists of at least four wires; two located 20-inches from the ground, and another two at 54-inches from the ground. Two-inch posts separated 15 feet and four-inch end posts that anchor them, support the wires. Per row cost of materials is as follows: fourteen two-inch by eight-foot pressure treated posts at $6.25 each; two four-inch by seven-foot pressure treated end posts at $7.25 each; 16 gauge trellising wire at $7.91 per 1,000 feet; four line post clips at $0.06 per post. The total cost (materials plus labor) of installing the trellis was estimated at $2,200 per acre. Because trellis materials can be used for six years, this cost is included in non-cash or investment overhead. However, labor cost is considered part of the establishment cost. Total labor was estimated at 41 hours per acre. Shade. A shade structure is set up in the spring to provide shade for the labor and for a sorting and packing area at harvest. The costs include the setup labor and miscellaneous expenses for materials. The shade structure may also be used for future crops.
Production Cultural Practices and Material Inputs Tables 3 – 10
Irrigation. Depending on effective rainfall and available soil moisture, plants are irrigated from March through September using between one-half and one-inch of water per week during the growing season. Total irrigation water during the season is approximately two acre-feet. The cost of water includes pumping costs of $90 per acre foot or $7.50 per acre inch plus labor. Growers producing within the Pajaro Valley Water Management Agency (PVWMA) district are charged an additional $160 per acre foot or $13.33 per acre inch augmentation fee for all pumped (well-drawn) water.

2005 Raspberries Costs and Returns Study Central Coast UC Cooperative Extension 5
Fertilization. In season fertilizers are applied through the drip system. Leaf analysis is done around mid-season (May) to determine the nutritional needs of the plants. It is recommended that plants receive liquid fertilizer via the irrigation system through the growing season roughly every 14 days. A common liquid fertilizer is 15-10-30, although a variety of formulations are commercially available. Pest Management. The pesticides and rates mentioned in this cost study are listed in UC Integrated Pest Management Guidelines, Caneberries. For information on other pesticides available, pest identification, monitoring, and management visit the UC IPM website at www.ipm.ucdavis.edu or contact your local UCCE farm advisor. Information and pesticide use permits are available through the local county agricultural commissioner's office. Pesticides mentioned in this study are used to calculate rates and costs. Although growers commonly use the pesticides mentioned, other pesticides are available. Spray adjuvants are recommended for use with many pesticides, but are not accounted for in this study. Pesticide costs vary by location, brand, and grower volume. Pesticide costs in this study are from a single dealer and shown as full retail.
Pest Control Adviser (PCA). The PCA monitors the field for agronomic problems including pests, diseases, and nutritional status. Growers may hire private consultants on a per acre basis or receive the service as part of an agreement with an agricultural chemical and fertilizer company. Costs of $100 per acre for a private PCA are included in this study.
Diseases. Fungicides are applied in the spring to control diseases such as yellow rust (copper sulfate, 5 pounds per acre) and Botrytis (Elevate, 1.5 pounds per acre) In this study, Elevate is applied three times – twice in April and once in June; Copper (Kocide) is applied twice in May.
Insects (Arthropods). Savey is applied for the control of two-spotted spider mite, once in April at 6 ounces per acre.
Weeds. For this study, weed control is done by hand (hoeing) in May and June, and is assumed to take
nine man-hours per month. Alternately, a grower may chose to use a disk harrow during spring and summer. The use of a disk harrow to cultivate weeds between rows is a delicate operation because of the risk posed to injuring the raspberries' shallow root system. Spacing within rows is important so that vegetative growth covers the ground to help shade out weeds. Pollination. Bees are needed for pollination, at a rate of two hives per acre. Bee hives are set up by a contractor in the winter and removed by the end of that season. The cost is $30 per hive. Harvest. Harvest season starts in August and extends through October, and may be longer if the crop is grown using protective tunnels. Raspberries are harvested by hand every few days at an average seasonal piece rate cost of $4.00 per flat. Early season (lower yields), the piece rate cost is usually higher. Crew size and number of crews may vary through the season depending upon the yield. Picking rate per picker ranges from one to three flats per hour, with the lesser rate occurring early and late in the season. For this study, it assumed that an average picking rate for the season is 2.5 flats per hour. The fruit is picked using one gallon buckets; then field sorted and packed into a flat containing 12 one-half pint plastic clam shells. Each full flat weighs 7 pounds. The area under the shade structure, constructed during the establishment period, is used for packing and sorting. Harvesting consist of one crew of 25 that hand picks the berries, a crew supervisor and a checker-loader who records the flats picked by each crewmember and who also loads the flats on the pallets on the truck. The truck holds up to two pallets with 144 flats and takes one hour round trip to deliver the fruit to the cooler. To prevent the fruit from heating up, the truck should make deliveries to the cooler with less than full loads. The fruit is then transported by the grower to a cooler, where the grower pays $0.85 per flat for cooling services.

2005 Raspberries Costs and Returns Study Central Coast UC Cooperative Extension 6
Yields and Returns. This study assumes an average marketable yield of 3,000 seven-pound flats per acre,
which is equivalent to approximately 10 tons per acre. The expected unit price is $12 per flat based on Santa Cruz County Agricultural Commissioner’s Crop Reports and the USDA Agricultural Marketing Service shipping point prices from Salinas/Watsonville area. Estimated returns for a range of yields and prices are shown in Table 6. Post harvest pruning/clean up. After the first harvest, the dead canes or those that have fruited are pruned out by hand, at 30 hours per acre. Part of the pruning operation will include adjustment of the primocanes in the trellis for the following year if the field is left in place. Canes left on the ground are then disked shallowly and incorporated into the soil. By the end of the second year the crop is completely removed, as well as the drip tape and the trellis system. The trellis may be reusable, but the drip tape is discarded. Trellis and drip tape removal are done by hand. The canes are disked to prepare the land for a subsequent crop: raspberries, another berry crop, or a vegetable crop depending on a grower’s rotation scheme. The postharvest clean up operation takes approximately 18 hours per acre to be completed. For simplicity purposes the cost of pruning after the first harvest (30 hours) and the cost of the final clean up operation (18 hours) are averaged over the two production years.
Labor, Equipment, and Interest Costs
Pickup/ATV. It is assumed that the pickup is used for business and personal use. The grower uses the ATV for collecting the soil and leaf samples and is included in those costs. The ATV is also used to check the field, monitor the irrigation, and other miscellaneous use. The time and mileage use for the pickup and ATV operations are estimated and not taken from any specific data. Labor. The basic hourly wage for equipment operators is $11.50 per hour and for general labor is $7.50 per hour. At harvest, the pickers receive piece rate pay of $4.00 per flat. This is an average seasonal piece rate cost. At the beginning of the season due to lower yields, the piece rate is higher ($4.50 to $5.00) than during the peak season. Adding payroll overhead of 38% to the hourly wage gives labor rates of $15.87 for equipment operators and $10.35 per hour for general labor. The overhead includes the employers’ share of federal and California state payroll taxes, workers' compensation insurance for truck crops (code 0172), and a percentage for other possible benefits. Workers’ compensation insurance costs will vary among growers, but for this study the cost is based upon the average industry final rate as of January 1, 2005 (California Department of Insurance). Labor for operations involving machinery are 20% higher than the operation time given in Table 3 to account for the extra labor involved in equipment set up, moving, maintenance, work breaks, and field repair. Equipment Operating Costs. Repair costs are based on purchase price, annual hours of use, total hours of life, and repair coefficients formulated by American Society of Agricultural Engineers (ASAE). Fuel and lubrication costs are also determined by ASAE equations based on maximum power takeoff (PTO) horsepower, and fuel type. Prices for on-farm delivery of diesel and gasoline are $2.00 and $2.25 per gallon, respectively. The price is based on the growers May, 2005 delivery invoice. The cost may include a 2% local sales tax on diesel fuel and 8% sales tax on gasoline. Gasoline also includes federal and state excise tax, which are refundable for on-farm use when filing your income tax. The fuel, lube, and repair cost per acre for each operation in Table 3 is determined by multiplying the total hourly operating cost in Table 8 for each piece of equipment used for the selected operation by the hours per acre. Tractor time is 10% higher than implement time for a given operation to account for setup, travel and down time.

2005 Raspberries Costs and Returns Study Central Coast UC Cooperative Extension 7
Interest On Operating Capital. Interest on operating capital is based on cash operating costs and is calculated monthly until harvest at a nominal rate of 7.65% per year. A nominal interest rate is the typical market cost of borrowed funds. The interest cost of post harvest operations is discounted back to the last harvest month using a negative interest charge. Risk. The risks associated with producing and marketing raspberries are considered high. While this study makes every effort to model a production system based on typical, real world practices, it cannot fully represent financial, agronomic and market risks that affect the profitability and economic viability.
Cash Overhead Cash overhead consists of various cash expenses paid out during the year that are assigned to the whole farm and not to a particular operation. These costs include property taxes, interest on operating capital, office expense, liability and property insurance, sanitation services, equipment repairs, and management. Property Taxes. Counties charge a base property tax rate of 1% on the assessed value of the property. In some counties special assessment districts exist and charge additional taxes on property including equipment, buildings, and improvements. For this study, county taxes are calculated as 1% of the average value of the property. Average value equals new cost plus salvage value divided by 2 on a per acre basis. Insurance. Insurance for farm investments vary depending on the assets included and the amount of coverage. Property insurance provides coverage for property loss and is charged at 0.690% of the average value of the assets over their useful life. Liability insurance covers accidents on the farm and costs $529 for the entire farm. Office Expense. Office and business expenses are estimated at $300 per producing acre. These expenses include office supplies, telephones, bookkeeping, accounting, legal fees, road maintenance, utilities, and miscellaneous expenses. Land Rent. The grower pays $2,000 per acre per year for the 30-acres or $2,222 per acre per producing acre (27 acres). Sanitation Services. Sanitation services provide a double portable toilet and single toilet with washing equipment and cost the farm $3,080 annually. Food Safety Program. Many growers of fresh market commodities such as raspberries now incorporate and participate in food safety programs for their operations. Part of a food safety program is participation in third party (independent) audits, that are done to accommodate buyer requests and to enhance marketability of the crop. Costs will vary depending upon farm or inspection circumstances. For this study, costs for the farm are estimated at $750 per year.
Non-Cash Overhead
Non-cash overhead, shown on an annual per acre basis, is calculated as the capital recovery cost for equipment and other farm investments. Capital Recovery Costs. Capital recovery cost is the annual depreciation and interest costs for a capital investment. It is the amount of money required each year to recover the difference between the purchase price and salvage value (unrecovered capital). It is equivalent to the annual payment on a loan for the investment with the down payment equal to the discounted salvage value. This is a more complex method of calculating

2005 Raspberries Costs and Returns Study Central Coast UC Cooperative Extension 8
ownership costs than straight-line depreciation and opportunity costs, but more accurately represents the annual costs of ownership because it takes the time value of money into account (Boehlje and Eidman). The formula for the calculation of the annual capital recovery costs is ((Purchase Price – Salvage Value) x Capital Recovery Factor) + (Salvage Value x Interest Rate). Salvage Value. Salvage value is an estimate of the remaining value of an investment at the end of its useful life. For farm machinery (tractors and implements) the remaining value is a percentage of the new cost of the investment (Boehlje and Eidman). The percent remaining value is calculated from equations developed by the American Society of Agricultural Engineers (ASAE) based on equipment type and years of life. The life in years is estimated by dividing the wear out life, as given by ASAE by the annual hours of use in this operation. For other investments including irrigation systems, buildings, and miscellaneous equipment, the value at the end of its useful life is zero. The salvage value for land is the purchase price because land does not depreciate. The purchase price and salvage value for equipment and investments are shown in Table 7. Capital Recovery Factor. Capital recovery factor is the amortization factor or annual payment whose present value at compound interest is 1. The amortization factor is a table value that corresponds to the interest rate used and the life of the machine. Interest Rate. The interest rate of 6.01% used to calculate capital recovery cost is the USDA-ERSs ten-year average of California’s agricultural sector long-run rate of return to production assets from current income. It is used to reflect the long-term realized rate of return to these specialized resources used effectively in the agricultural sector. Buildings. The 1,400 square feet of metal buildings may be a shop, overheads, shade structures or storage. Trellis. The trellis is installed in the establishment year soon after planting. The trellis system has a life of six years and is removed at the end of the growing season and used on other plantings. The cost includes the materials whereas the labor is charged to the years affected by the installation and removal. Shop/Field Tools. Shop, hand, and various small field tools are included in these costs. Tools vary considerably from farm to farm and the cost does not represent any specific inventory. Irrigation Pump & Well. This study assumes that the grower refurbished the 40 HP electric pump and well that services the farm. In general, growers in the region are responsible for the portion above the ground such as the pump, and the landowner is responsible for what is below ground such as the well running dry. Irrigation System. The irrigation system includes the filtration system and laterals that connect to the drip line. Water is pumped through the filtration station into the main lines. Reusable telescoping lateral lines are buried at the edge of the raspberry field and are connected to the main and drip lines. The drip lines are included in the establishment costs because they will be replaced at the end of the two year period when the berry canes are removed. Sprinkler Pipe. The sprinkler system is an estimated cost by a local dealer for enough sprinkler pipe, sprinklers and main line to make five acre sets. The pipe is hand movable and may be used on all farm crops. Establishment Cost. Costs to establish the berry canes are used to determine capital recovery expenses, depreciation, and interest on investment for the production years. Establishment cost is the sum of the costs for land preparation, trellis system labor, drip tape, planting, plants, cash overhead and expenses for establishing the

2005 Raspberries Costs and Returns Study Central Coast UC Cooperative Extension 9
canes. The costs cover a seven month period from August to February. The Total Cash Cost on Table 1 represents the establishment cost. For this study the cost is $5,868 per acre or $88,028 for the 15-acre field. The establishment cost is spread over the two crop production years. Equipment Costs. Farm equipment is purchased new or used, but the study shows the current purchase price for new equipment. The new purchase price is adjusted to 60% to indicate a mix of new and used equipment. Annual ownership costs for equipment and other investments are in the Whole Farm Equipment, Investment and Business Overhead Tables. Equipment costs are composed of three parts: non-cash overhead, cash overhead, and operating costs. Both of the overhead factors have been discussed in previous sections. The operating costs consist of repairs, fuel, and lubrication and are discussed under operating costs. Table Values. Due to rounding, the totals may be slightly different from the sum of the components.
.

2005 Raspberries Costs and Returns Study Central Coast UC Cooperative Extension 10
REFERENCES American Society of Agricultural Engineers. 1994. American Society of Agricultural Engineers Standards
Yearbook. Russell H.Hahn and Evelyn E. Rosentreter (Eds.). St. Joseph, MO, 41st. edition. Bervejillo, Jose E., Mark Bolda, Laura Tourte, and Karen Klonsky. 2003. Sample Cost to Produce Fresh
Market Raspberries, Central Coast. University of California Cooperative Extension, Davis, CA. Boehlje, Michael D., and Vernon R. Eidman. 1984. Farm Management. John Wiley and Sons. New York, NY. California State Department of Food and Agriculture. 2000-2004. Final Grape Crush Report. California
Department of Food and Agriculture. Sacramento, CA. Santa Cruz County Agricultural Commissioner. 2004. Santa Cruz County Annual Crop and Livestock Report,
Fruits. Santa Cruz County, Watsonville, CA. http://agdept.com University of California Statewide IPM Project. 2003. UC Pest Management Guidelines, Caneberries.
University of California, Davis, CA. http://www.ipm.ucdavis.edu United States Department of Agriculture, Agricultural Marketing Service. http://www.ams.usda.gov United States Department of Agriculture-Economic Reporting Service. Farm Financial Ratios Indicating
Solvency and Profitability 1960 – 2002, California. 2005. Internet; accessed January 4, 2005. www.ers.usda.gov/data/farmbalancesheet/fbsdmu.htm

2005 Raspberries Costs and Returns Study Central Coast UC Cooperative Extension 11
UC COOPERATIVE EXTENSION
Table 1. COSTS PER ACRE to ESTABLISH RASPBERRIES CENTRAL COAST REGION - Santa Cruz and Monterey Counties 2005
Operation Field Cash and Labor Cost per acre Time Labor Labor Fuel,Lube Material Custom/ Total Your Operation (Hrs/A) Cost & Repairs Cost Rent Cost Cost Fertilize: Soil Sample (1) 0.07 0.00 1 0 0 2 4 Land Prep: Subsoil 0.39 0.00 7 5 0 0 12 Land Prep: Disk 3X 0.52 0.00 10 6 0 0 16 Land Prep: Rototill 0.65 0.00 12 8 0 0 20 Fertilize: (composted manure) 0.34 0.00 6 5 138 0 149 Disease: Fumigate (Telone, Chloropricrin) 0.00 0.00 0 0 0 1,650 1,650 Land Prep: List and Shape Beds 0.46 0.00 9 5 0 0 14 Fertilize: Band (15-15-15) 0.34 0.00 6 4 77 0 88 Plant: 0.00 12.00 124 0 1,392 0 1,516 Irrigate: Sprinkler setup/remove 2.00 2.00 59 17 0 0 76 Irrigate: Sprinkle 0.00 1.00 10 0 62 0 73 Trellis: Install (labor only) 1.00 40.00 433 9 0 0 442 Irrigate: Install (tape & labor) 0.52 2.00 31 5 44 0 79 Harvest: Shades (setup) 0.45 0.45 5 0 25 0 30 ATV 0.38 0.00 7 1 0 0 8 Pickup 2.33 0.00 44 13 0 0 58 TOTAL CULTURAL COSTS 9.00 57.45 766 79 1,739 1,652 4,235 Interest on operating capital @ 7.65% 126 TOTAL OPERATING COSTS/ACRE 766 79 1,739 1,652 4,361 Cash Overhead: * Liability Insurance 12 Office Expense 176 Sanitation Fee 67 Land Rent 1,176 Food Safety Audit 0 Property Taxes 16 Property Insurance 11 Investment Repairs 49 TOTAL CASH OVERHEAD 1,507 TOTAL CASH COSTS/ACRE 0.0 766 79 1,739 1,652 5,868 *Costs are for 7 months (Aug to Feb)

2005 Raspberries Costs and Returns Study Central Coast UC Cooperative Extension 12
UC COOPERATIVE EXTENSION
Table 2. MATERIAL COSTS PER ACRE to ESTABLISH RASPBERRIES CENTRAL COAST REGION - Santa Cruz and Monterey Counties 2005
Quantity/ Price or Value or Your Acre Unit Cost/Unit Cost/Acre Cost OPERATING COSTS Custom: Soil Analysis 0.07 each 35.00 2 Fumigate (Telone, Chloropicrin) 1.00 acre 1,650.00 1,650 Fertilizer: Manure (Composted) 6.00 ton 23.00 138 15-15-15 400.00 lb 0.19 77 Plants: Raspberries 2,900.00 each 0.48 1,392 Water: Water-Pumped 3.00 acin 7.50 23 Water-PVWMA fee 3.00 acin 13.33 40 Drip Tape 4,400.00 foot 0.01 44 Miscellaneous: Shade Materials 1.00 acre 25.00 25 Labor - machine 10.78 hrs 15.87 171 Labor - non-machine 57.45 hrs 10.35 595 Fuel - Gas 0.30 gal 2.25 1 Fuel - Diesel 25.63 gal 2.00 51 Lube 8 Machinery Repair 19 Interest on Operating Capital @ 7.65% 126 TOTAL OPERATING COSTS/ACRE 4,361 CASH OVERHEAD COSTS* Liability Insurance 12 Office Expense 176 Sanitation Fee 67 Land Rent 1,176 Property Taxes 16 Property Insurance 11 Investment Repairs 49 TOTAL CASH OVERHEAD 1,507 TOTAL CASH COSTS/ACRE 5,868 *Costs are for 7 months (Aug to Feb)

2005 Raspberries Costs and Returns Study Central Coast UC Cooperative Extension 13
UC COOPERATIVE EXTENSION
Table 3. COSTS PER ACRE to PRODUCE RASPBERRIES CENTRAL COAST REGION - Santa Cruz and Monterey Counties 2005
Operation Field Cash and Labor Cost per acre Time Labor Labor Fuel,Lube Material Custom/ Total Your Operation (Hrs/A) Cost & Repairs Cost Rent Cost Cost Cultural: Pollinate: (2 hives) 0.00 0.00 0 0 0 60 60 Irrigate: (water & labor) 0.00 10.00 104 0 500 0 603 Fertilize: (15-10-30) through drip line 0.00 0.00 0 0 348 0 348 Disease: Botrytis (Elevate) 3X 1.37 0.00 26 13 161 0 201 Insect: Mites (Savey) 0.46 0.00 9 4 124 0 137 Weed: Hand Weed 0.00 18.00 186 0 0 0 186 Fertilize: Leaf Sample 0.07 0.00 1 0 0 5 7 Disease: Rust (Copper) 0.92 0.00 17 9 33 0 59 Field Clean Up (1/2 cost) 0.34 24.00 255 4 0 0 259 PCA 0.00 0.00 0 0 0 100 100 ATV Use 0.75 0.00 14 2 0 0 16 Pickup Use 5.00 0.00 95 29 0 0 124 TOTAL CULTURAL COSTS 8.91 52.00 708 61 1,167 165 2,100 Harvest: Hand Pick (includes foreman & checker) *Piece Rate 96.00 994 0 5,215 *12,000 18,209 Haul 21.00 0.00 400 219 0 0 619 Cool 0.00 0.00 0 0 2,550 0 2,550 TOTAL HARVEST COSTS 21.00 96.00 1,394 219 7,765 12,000 21,378 Interest on operating capital @ 7.65% 351 TOTAL OPERATING COSTS/ACRE 2,101 280 8,932 12,165 23,829 Cash Overhead: Liability Insurance 20 Office Expense 300 Sanitation Fees 114 Land Rent (per producing acre) 2,222 Food Safety Audit 28 Property Taxes 41 Property Insurance 48 Investment Repairs 95 TOTAL CASH OVERHEAD COSTS 2,868 TOTAL CASH COSTS/ACRE 26,697 Non-cash Overhead: Per producing Annual Cost Acre Capital Recovery Buildings 1,821 132 132 Trellis 147 30 30 Shop/Hand Tools 467 46 46 Sprinkler Pipe (5 acre sets) 222 30 30 Irrigation System (filtration) 1,000 78 78 Pump & Well 1,108 87 87 Raspberry Establishment 5,868 3,201 3,201 Equipment 2,240 317 317 TOTAL NON-CASH OVERHEAD COSTS 12,873 3,922 3,922 TOTAL COSTS/ACRE 30,618 *Piece rate = $4.00 per flat

2005 Raspberries Costs and Returns Study Central Coast UC Cooperative Extension 14
UC COOPERATIVE EXTENSION
Table 4. COSTS and RETURNS PER ACRE to PRODUCE RASPBERRIES CENTRAL COAST REGION - Santa Cruz and Monterey Counties 2005
Quantity/ Price or Value or Your Acre Unit Cost/Unit Cost/Acre Cost GROSS RETURNS Raspberries 3,000.00 *flat 12.00 36,000 OPERATING COSTS Custom: Bee Hives 2.00 each 30.00 60 Leaf Analysis 0.07 each 75.00 5 Pest Control Adviser (PCA)/Consultant 1.00 acre 100.00 100 Water: Water - Pumped 24.00 acin 7.50 180 Water - PVWMA fee 24.00 acin 13.33 320 Fertilizer: 15-10-30 600.00 lb 0.58 348 Fungicide: Elevate 50 WDG 4.50 lb 35.86 161 Kocide DF (copper sulfate) 10.00 lb 3.31 33 Insecticide: Savey 50WP 6.00 oz 20.69 124 Harvest: Labor - Picking (piece rate) 3,000.00 flat 4.00 12,000 Flat with 12 one-half pint clamshells (7 lbs.) 3,000.00 each 1.73 5,190 Buckets for picking 10.00 each 2.50 25 Cooling 3,000.00 each 0.85 2,550 Labor (machine) 35.89 hrs 15.87 570 Labor (non-machine) 148.00 hrs 10.35 1,532 Fuel - Gas 63.54 gal 2.25 143 Fuel - Diesel 19.56 gal 2.00 39 Lube 27 Machinery repair 71 Interest on operating capital @ 7.65% 351 TOTAL OPERATING COSTS/ACRE 23,829 NET RETURNS ABOVE OPERATING COSTS 12,171 CASH OVERHEAD COSTS: Liability Insurance 20 Office Expense 300 Sanitation Fees 114 Land Rent (per producing acre) 2,222 Food Safety Audit 28 Property Taxes 41 Property Insurance 48 Investment Repairs 95 TOTAL CASH OVERHEAD COSTS/ACRE 2,868 TOTAL CASH COSTS/ACRE 26,697 NON-CASH OVERHEAD COSTS (Capital Recovery) Buildings 132 Trellis 30 Shop/Hand Tools 46 Sprinkler Pipe 30 Irrigation System (filtration) 78 Pump & Well 87 Raspberry Establishment 3,201 Equipment 317 TOTAL NON-CASH OVERHEAD COSTS/ACRE 3,922 TOTAL COSTS/ACRE 30,618 NET RETURNS ABOVE TOTAL COSTS 5,382 *Flat = 7 lbs.

2005 Raspberries Costs and Returns Study Central Coast UC Cooperative Extension 15
UC COOPERATIVE EXTENSION
Table 5. MONTHLY COSTS PER ACRE to PRODUCE RASPBERRIES CENTRAL COAST REGION - Santa Cruz and Monterey Counties 2005
Beginning JAN 05 JAN FEB MAR APR MAY JUN JUL AUG SEP OCT NOV DEC TOTAL Ending DEC 05 05 05 05 05 05 05 05 05 05 05 05 05 Cultural: Pollinate: (2 hives) 60 60 Irrigate: (water & labor) 75 75 75 101 101 101 75 603 Fertilize: (15-10-30) through drip line 50 50 50 50 50 50 50 348 Disease: Botrytis (Elevate) 3X 134 67 201 Insect: Mites (Savey) 137 137 Weed: Hand Weed 93 93 186 Fertilize: Leaf Sample 7 7 Disease: Rust (Copper) 59 59 Field Clean Up (1/2 cost) 259 259 PCA 13 13 13 13 13 13 13 13 100 ATV Use 2 2 2 2 2 2 2 2 16 Pickup Use 10 10 10 10 10 10 10 10 10 10 10 10 124 TOTAL CULTURAL COSTS 10 10 210 421 309 335 175 175 150 284 10 10 2,100 Harvest: Hand Pick 5,455 9,100 3,653 18,209 Haul 184 310 125 619 Cool 765 1,275 510 2,550 TOTAL HARVEST COSTS 0 0 0 0 0 0 0 6,404 10,685 4,289 0 0 21,378 Interest on operating capital 0 0 1 4 6 8 9 51 120 150 0 0 351 TOTAL OPERATING COSTS/ACRE 10 10 211 425 315 343 185 6,631 10,955 4,722 10 10 23,829 Cash Overhead: Liability Insurance 20 20 Office Expense 25 25 25 25 25 25 25 25 25 25 25 25 300 Sanitation Fees 14 14 14 14 14 14 14 14 114 Land Rent (per producing acre) 185 185 185 185 185 185 185 185 185 185 185 185 2,222 Food Safety Audit 28 28 Property Taxes 20 20 41 Property Insurance 48 48 Investment Repairs 8 8 8 8 8 8 8 8 8 8 8 8 95 TOTAL CASH OVERHEAD COSTS 286 218 232 253 232 232 260 232 232 232 218 239 2,868 TOTAL CASH COSTS/ACRE 297 229 444 678 548 576 445 6,863 11,187 4,954 228 249 26,697
2005 Raspberries Costs and Returns Study Central Coast UC Cooperative Extension 16
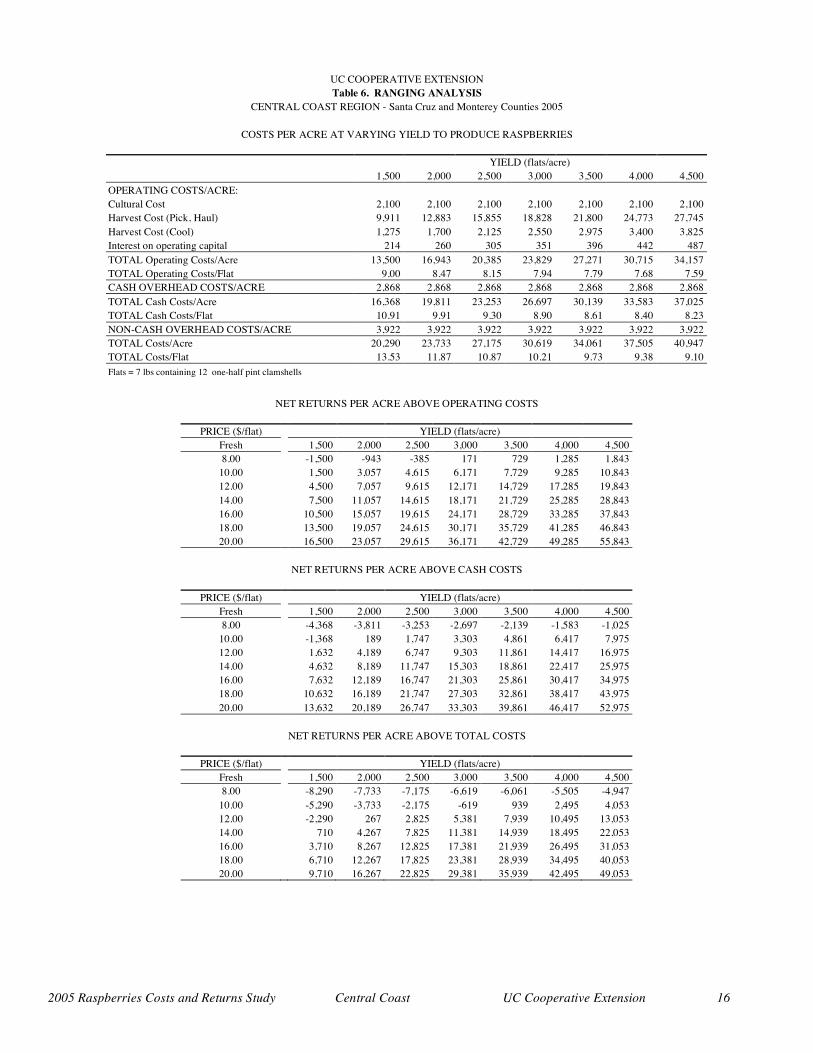
UC COOPERATIVE EXTENSION Table 6. RANGING ANALYSIS
CENTRAL COAST REGION - Santa Cruz and Monterey Counties 2005
COSTS PER ACRE AT VARYING YIELD TO PRODUCE RASPBERRIES YIELD (flats/acre)
1,500 2,000 2,500 3,000 3,500 4,000 4,500 OPERATING COSTS/ACRE: Cultural Cost 2,100 2,100 2,100 2,100 2,100 2,100 2,100 Harvest Cost (Pick, Haul) 9,911 12,883 15,855 18,828 21,800 24,773 27,745 Harvest Cost (Cool) 1,275 1,700 2,125 2,550 2,975 3,400 3,825 Interest on operating capital 214 260 305 351 396 442 487 TOTAL Operating Costs/Acre 13,500 16,943 20,385 23,829 27,271 30,715 34,157 TOTAL Operating Costs/Flat 9.00 8.47 8.15 7.94 7.79 7.68 7.59 CASH OVERHEAD COSTS/ACRE 2,868 2,868 2,868 2,868 2,868 2,868 2,868 TOTAL Cash Costs/Acre 16,368 19,811 23,253 26,697 30,139 33,583 37,025 TOTAL Cash Costs/Flat 10.91 9.91 9.30 8.90 8.61 8.40 8.23 NON-CASH OVERHEAD COSTS/ACRE 3,922 3,922 3,922 3,922 3,922 3,922 3,922 TOTAL Costs/Acre 20,290 23,733 27,175 30,619 34,061 37,505 40,947 TOTAL Costs/Flat 13.53 11.87 10.87 10.21 9.73 9.38 9.10 Flats = 7 lbs containing 12 one-half pint clamshells
NET RETURNS PER ACRE ABOVE OPERATING COSTS
PRICE ($/flat) YIELD (flats/acre)
Fresh 1,500 2,000 2,500 3,000 3,500 4,000 4,500 8.00 -1,500 -943 -385 171 729 1,285 1,843
10.00 1,500 3,057 4,615 6,171 7,729 9,285 10,843 12.00 4,500 7,057 9,615 12,171 14,729 17,285 19,843 14.00 7,500 11,057 14,615 18,171 21,729 25,285 28,843 16.00 10,500 15,057 19,615 24,171 28,729 33,285 37,843 18.00 13,500 19,057 24,615 30,171 35,729 41,285 46,843 20.00 16,500 23,057 29,615 36,171 42,729 49,285 55,843
NET RETURNS PER ACRE ABOVE CASH COSTS
PRICE ($/flat) YIELD (flats/acre)
Fresh 1,500 2,000 2,500 3,000 3,500 4,000 4,500 8.00 -4,368 -3,811 -3,253 -2,697 -2,139 -1,583 -1,025
10.00 -1,368 189 1,747 3,303 4,861 6,417 7,975 12.00 1,632 4,189 6,747 9,303 11,861 14,417 16,975 14.00 4,632 8,189 11,747 15,303 18,861 22,417 25,975 16.00 7,632 12,189 16,747 21,303 25,861 30,417 34,975 18.00 10,632 16,189 21,747 27,303 32,861 38,417 43,975 20.00 13,632 20,189 26,747 33,303 39,861 46,417 52,975
NET RETURNS PER ACRE ABOVE TOTAL COSTS
PRICE ($/flat) YIELD (flats/acre)
Fresh 1,500 2,000 2,500 3,000 3,500 4,000 4,500 8.00 -8,290 -7,733 -7,175 -6,619 -6,061 -5,505 -4,947
10.00 -5,290 -3,733 -2,175 -619 939 2,495 4,053 12.00 -2,290 267 2,825 5,381 7,939 10,495 13,053 14.00 710 4,267 7,825 11,381 14,939 18,495 22,053 16.00 3,710 8,267 12,825 17,381 21,939 26,495 31,053 18.00 6,710 12,267 17,825 23,381 28,939 34,495 40,053 20.00 9,710 16,267 22,825 29,381 35,939 42,495 49,053

2005 Raspberries Costs and Returns Study Central Coast UC Cooperative Extension 17
UC COOPERATIVE EXTENSION
Table 7. WHOLE FARM ANNUAL EQUIPMENT, INVESTMENT, and BUSINESS OVERHEAD CENTRAL COAST REGION - Santa Cruz and Monterey Counties 2005
ANNUAL EQUIPMENT COSTS
Cash Overhead Yrs Salvage Capital Insur- Yr Description Price Life Value Recovery ance Taxes Total 05 55 HP 2WD Tractor 32,269 12 8,068 3,373 139 202 3,714 05 75 HP 2WD Tractor 37,000 15 7,203 3,503 153 221 3,876 05 ATV 4WD 7,430 7 2,818 996 35 51 1,082 05 Disk - Harrow 5' 1,878 15 180 186 7 10 203 05 Pickup 1/2 ton 24,500 5 10,980 3,870 122 177 4,170 05 Truck 1-ton 36,000 5 20,000 5,001 193 280 5,475 05 Sprayer 300 gal 8,000 10 1,415 980 32 47 1,060 TOTAL 147,077 50,664 17,909 682 989 19,580 60% of New Cost * 88,246 30,398 10,746 409 593 11,748 *Used to reflect a mix of new and used equipment
ANNUAL INVESTMENT COSTS
Cash Overhead
Yrs Salvage Capital Insur- Description Price Life Value Recovery ance Taxes Repairs Total
Buildings 49,162 30 3,575 170 246 983 4,974 Raspberry Establishment (15 acres) 88,020 2 48,016 304 0 0 48,320 Irrigation (filtration system, 15 acres) 15,000 25 1,175 52 75 300 1,601 Irrigation Pump & Well 29,920 25 2,343 103 150 598 3,194 Sprinkler Pipe (for 5 acre sets) 6,000 10 816 21 30 120 986 Shop / Field Tools 12,600 15 1,260 1,244 48 69 252 1,613 Trellis (15 acres) 2,200 6 448 8 11 44 510
TOTAL INVESTMENT 202,902 1,260 57,616 704 581 2,297 61,198
ANNUAL BUSINESS OVERHEAD COSTS
Units/ Price/ Total Description Farm Unit Unit Cost Food Safety Audit 27 acre 27.78 750 Land Rent (30 acres) 30 acre 2,000.00 60,000 Liability Insurance 27 acre 19.59 529 Office Expense 27 acre 300.00 8,100 Sanitation Fees 27 acre 114.00 3,078
UC COOPERATIVE EXTENSION
Table 8. HOURLY EQUIPMENT COSTS CENTRAL COAST REGION - Santa Cruz and Monterey Counties 2005
COSTS PER HOUR Actual Cash Overhead Operating Hours Capital Insur- Fuel & Total Total Yr Description Used Recovery ance Taxes Repairs Lube Oper. Costs/Hr. 05 55 HP 2WD Tractor 939 2.15 0.09 0.13 1.44 6.21 7.65 10.02 05 75 HP 2WD Tractor 803 2.62 0.11 0.17 1.60 8.47 10.07 12.97 05 ATV 4WD 286 2.09 0.07 0.11 0.55 1.73 2.28 4.55 05 Disk - Harrow 5' 133 0.84 0.03 0.05 0.29 0.00 0.29 1.21 05 Pickup 1/2 ton 130 17.86 0.56 0.82 1.17 4.60 5.77 25.01 05 Truck 1-ton 315 9.53 0.37 0.53 2.68 7.76 10.44 20.87 05 Sprayer 300 gal 86 6.82 0.23 0.33 1.10 0.00 1.10 8.48

2005 Raspberries Costs and Returns Study Central Coast UC Cooperative Extension 18
UC COOPERATIVE EXTENSION
Table 9. COSTS AND RETURNS PER ACRE TWO YEAR SUMMARY CENTRAL COAST - Santa Cruz and Monterey Counties 2005
Establish Year 1 Year 2 TOTAL INCOME 36,000 36,000 72,000 Land Prep: Subsoil, Disk, Rototill 49 0 49 Fertilization 241 355 355 950 Fumigation 1,650 0 1,650 Shape Beds 14 0 14 Plant 1,516 0 1,516 Sprinklers Setup/Remove 76 0 76 Irrigation 73 603 603 1,280 Trellis Setup (labor only) 442 0 442 Drip System Setup 79 0 79 Shades Setup 30 0 30 Pollination 60 60 120 Weed Control 186 186 373 Insect Control 137 137 274 Disease Control 260 260 520 Pruning/Cleanup 259 259 518 PCA 100 100 200 ATV 8 16 16 40 Pickup 58 124 124 306 TOTAL CULTURAL 4,235 2,100 2,100 8,436 Harvest (piece rate) 18,209 18,209 36,417 Harvest: Haul Fruit 619 619 1,238 Harvest: Cool Fruit 2,550 2,550 5,100 TOTAL HARVEST COSTS 0 21,378 21,378 42,756 Interest on Operating Costs @ 7.65% 126 351 351 827 TOTAL OPERATING COSTS 4,361 23,829 23,829 52,019 NET RETURNS ABOVE OPERATING COSTS -4,361 12,171 12,171 19,981 Cash Overhead: Liability Insurance 12 20 20 51 Office Expenses 176 300 300 776 Sanitation Facilities 67 114 114 295 Land Rent 1,176 2,222 2,222 5,620 Food Safety Audit 0 28 28 56 Property Taxes 16 41 41 97 Property Insurance 11 48 48 108 Investment Repairs 49 95 95 240 TOTAL CASH OVERHEAD 1,507 2,868 2,868 7,242 TOTAL CASH COST PER ACRE 5,868 26,697 26,697 59,261 NET RETURNS ABOVE CASH COSTS -5,868 9,303 9,303 12,739 Non-Cash Overhead: Buildings 78 132 132 343 Trellis 0 30 30 60 Shop/Hand Tools 27 46 46 119 Sprinkler Pipe (5 acre sets) 18 30 30 78 Irrigation System (filtration) 26 78 78 182 Pump & Well 51 87 87 224 Equipment 67 317 317 701 TOTAL NON-CASH OVERHEAD COSTS 266 721 721 1,707 TOTAL COST PER ACRE 6,134 27,417 27,417 60,968 NET RETURNS ABOVE TOTAL COSTS -6,134 8,583 8,583 11,032

2005 Raspberries Costs and Returns Study Central Coast UC Cooperative Extension 19
UC COOPERATIVE EXTENSION
Table 10. OPERATIONS WITH EQUIPMENT - ESTABLISHMENT AND PRODUCTION CENTRAL COAST - Santa Cruz & Monterey Counties 2005
Operation Field Labor Material Broadcast Operation Month Tractor Implement Hr/Acre Rate/acre Unit Establishment: Fertilize: Soil Sample August ATV Soil Analysis 0.07 acre Land Prep: Subsoil August 75HP 2WD Chisel Land Prep: Disk 3X August 75HP 2WD Disk Offset 10' September 75HP 2WD Disk Offset 10' September 75HP 2WD Disk Offset 10' Land Prep: Rototill August 75HP 2WD Rototiller 5' Fertilize: Manure August 75HP 2WD Fertilizer Spreader Manure 6.00 ton Fertilize; 15-15-15 October 55HP 2WD Fertilizer Spreader 15-15-15 400.00 lb Disease: Fumigate September Custom Land Prep: List & Shape Beds October 75HP 2WD Disk Border 5' Plant: November 12.00 Raspberries 2,900.00 each Irrigate: Sprinkler Setup/Remove November 55HP 2WD Trailer 1.00 Setup December 55HP 2WD Trailer 1.00 Remove Irrigate: Sprinkle November 1.00 Water 3.00 acin Trellis: Install March 55HP 2WD Trailer 40.00 Irrigate: Hang Drip Tape March 55HP 2WD Trailer 2.00 Drip Tape 4,400.00 ft Shades: Set up March 0.50 Shade Material Production: Pollinate March Custom Hives 2.00 acre Irrigate March 1.25 Water 3.00 acin April 1.25 Water 3.00 acin May 1.25 Water 3.00 acin June 1.66 Water 4.00 acin July 1.67 Water 4.00 acin August 1.67 Water 4.00 acin September 1.25 Water 3.00 acin Fertilize: through drip March 15-10-30 85.72 lb April 15-10-30 85.72 lb May 15-10-30 85.72 lb June 15-10-30 85.71 lb July 15-10-30 85.71 lb August 15-10-30 85.71 lb September 15-10-30 85.71 lb Fertilize: Leaf Sample May ATV Analysis 0.07 each Disease: Botrytis April 55HP 2WD Sprayer Elevate 1.50 lb April 55HP 2WD Sprayer Elevate 1.50 lb June 55HP 2WD Sprayer Elevate 1.50 lb Disease: Powdery Mildew April 55HP 2WD Sprayer Sulfur 10.00 lb May 55HP 2WD Sprayer Sulfur 10.00 lb May 55HP 2WD Sprayer Sulfur 10.00 lb June 55HP 2WD Sprayer Sulfur 10.00 lb Disease: Rust May 55HP 2WD Sprayer Copper 5.00 lb June 55HP 2WD Sprayer Copper 5.00 lb Insect: Mites May 55HP 2WD Sprayer Savy 6.00 oz Weed: Hand May 9.00 June 9.00
2005 Raspberries Costs and Returns Study Central Coast UC Cooperative Extension 20
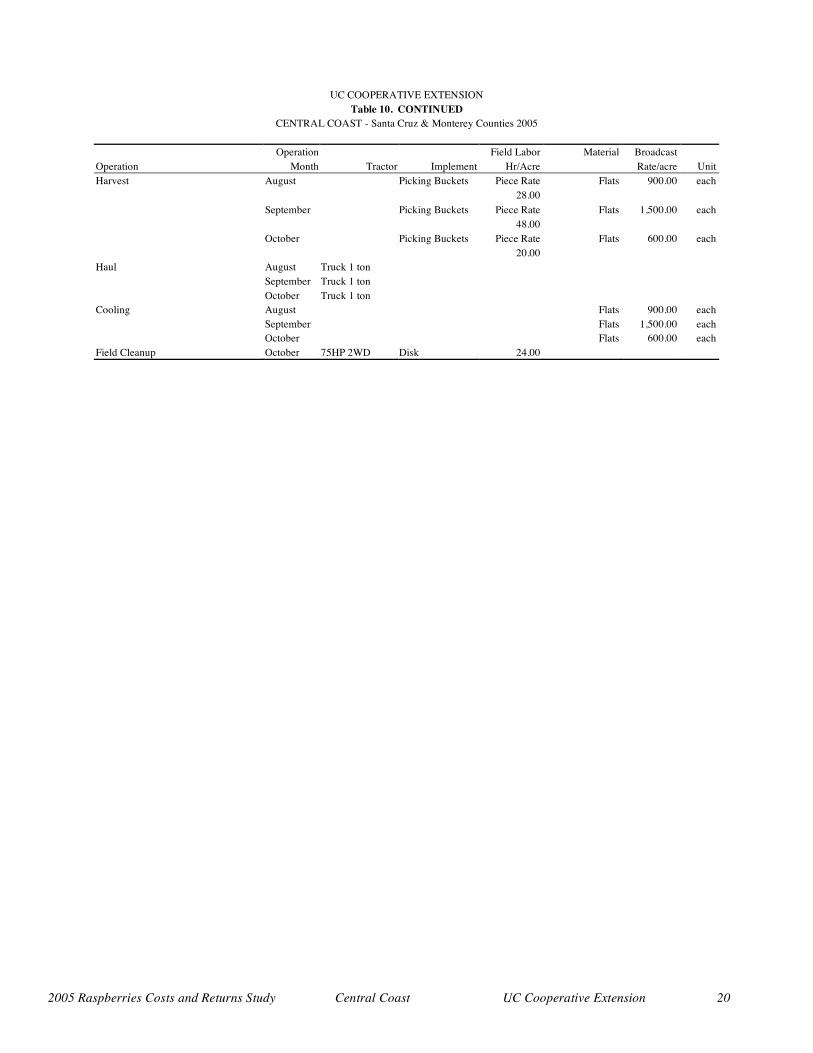
UC COOPERATIVE EXTENSION
Table 10. CONTINUED CENTRAL COAST - Santa Cruz & Monterey Counties 2005
Operation Field Labor Material Broadcast Operation Month Tractor Implement Hr/Acre Rate/acre Unit Harvest August Picking Buckets Piece Rate Flats 900.00 each 28.00 September Picking Buckets Piece Rate Flats 1,500.00 each 48.00 October Picking Buckets Piece Rate Flats 600.00 each 20.00 Haul August Truck 1 ton September Truck 1 ton October Truck 1 ton Cooling August Flats 900.00 each September Flats 1,500.00 each October Flats 600.00 each Field Cleanup October 75HP 2WD Disk 24.00